the Creative Commons Attribution 4.0 License.
the Creative Commons Attribution 4.0 License.
 | 08 Nov 2021
Nighttime and daytime dark oxidation chemistry in wildfire plumes: an observation and model analysis of FIREX-AQ aircraft data
Zachary C. J. Decker
Michael A. Robinson
Kelley C. Barsanti
Ilann Bourgeois
Matthew M. Coggon
Joshua P. DiGangi
Glenn S. Diskin
Frank M. Flocke
Alessandro Franchin
Carley D. Fredrickson
Georgios I. Gkatzelis
Samuel R. Hall
Hannah Halliday
Christopher D. Holmes
L. Gregory Huey
Young Ro Lee
Jakob Lindaas
Ann M. Middlebrook
Denise D. Montzka
Richard Moore
J. Andrew Neuman
John B. Nowak
Brett B. Palm
Jeff Peischl
Felix Piel
Pamela S. Rickly
Andrew W. Rollins
Thomas B. Ryerson
Rebecca H. Schwantes
Kanako Sekimoto
Lee Thornhill
Joel A. Thornton
Geoffrey S. Tyndall
Kirk Ullmann
Paul Van Rooy
Patrick R. Veres
Carsten Warneke
Rebecca A. Washenfelder
Andrew J. Weinheimer
Elizabeth Wiggins
Edward Winstead
Armin Wisthaler
Caroline Womack
Wildfires are increasing in size across the western US, leading to increases in human smoke exposure and associated negative health impacts. The impact of biomass burning (BB) smoke, including wildfires, on regional air quality depends on emissions, transport, and chemistry, including oxidation of emitted BB volatile organic compounds (BBVOCs) by the hydroxyl radical (OH), nitrate radical (NO3), and ozone (O3). During the daytime, when light penetrates the plumes, BBVOCs are oxidized mainly by O3 and OH. In contrast, at night or in optically dense plumes, BBVOCs are oxidized mainly by O3 and NO3. This work focuses on the transition between daytime and nighttime oxidation, which has significant implications for the formation of secondary pollutants and loss of nitrogen oxides () and has been understudied. We present wildfire plume observations made during FIREX-AQ (Fire Influence on Regional to Global Environments and Air Quality), a field campaign involving multiple aircraft, ground, satellite, and mobile platforms that took place in the United States in the summer of 2019 to study both wildfire and agricultural burning emissions and atmospheric chemistry. We use observations from two research aircraft, the NASA DC-8 and the NOAA Twin Otter, with a detailed chemical box model, including updated phenolic mechanisms, to analyze smoke sampled during midday, sunset, and nighttime. Aircraft observations suggest a range of NO3 production rates (0.1–1.5 ppbv h−1) in plumes transported during both midday and after dark. Modeled initial instantaneous reactivity toward BBVOCs for NO3, OH, and O3 is 80.1 %, 87.7 %, and 99.6 %, respectively. Initial NO3 reactivity is 10–104 times greater than typical values in forested or urban environments, and reactions with BBVOCs account for >97 % of NO3 loss in sunlit plumes (jNO2 up to ), while conventional photochemical NO3 loss through reaction with NO and photolysis are minor pathways. Alkenes and furans are mostly oxidized by OH and O3 (11 %–43 %, 54 %–88 % for alkenes; 18 %–55 %, 39 %–76 %, for furans, respectively), but phenolic oxidation is split between NO3, O3, and OH (26 %–52 %, 22 %–43 %, 16 %–33 %, respectively). Nitrate radical oxidation accounts for 26 %–52 % of phenolic chemical loss in sunset plumes and in an optically thick plume. Nitrocatechol yields varied between 33 % and 45 %, and NO3 chemistry in BB plumes emitted late in the day is responsible for 72 %–92 % (84 % in an optically thick midday plume) of nitrocatechol formation and controls nitrophenolic formation overall. As a result, overnight nitrophenolic formation pathways account for 56 %±2 % of NOx loss by sunrise the following day. In all but one overnight plume we modeled, there was remaining NOx (13 %–57 %) and BBVOCs (8 %–72 %) at sunrise.
- Article
(5143 KB) - Full-text XML
-
Supplement
(2624 KB) - BibTeX
- EndNote


It is well known that biomass burning (BB), including wildfires, can have large impacts on air quality at local, regional, and global scales (Jaffe et al., 2020). The relative impact and importance of wildfire smoke on air quality in the western US is increasing with decreasing anthropogenic volatile organic compound (VOC) and nitrogen oxide () emissions (Bishop and Haugen, 2018; Silvern et al., 2019; Warneke et al., 2012; Xing et al., 2015). This increase is compounded by growing wildfire emissions caused by anthropogenic influences such as human-caused climate change and past wildland management practices. Twentieth century suppression of western US wildfires has led to increased fuel loadings and thus fire potential (Higuera et al., 2015; Marlon et al., 2012; Parks et al., 2015). A warmer and drier climate in the western US resulting from human-caused climate change has exacerbated fire potential and has resulted in an increase in the frequency of large wildfires since the 1980s (Abatzoglou and Williams, 2016; Balch et al., 2017; Barbero et al., 2015; Dennison et al., 2014; Marlon et al., 2012; Westerling et al., 2006; Westerling, 2016; Williams et al., 2019).
Wildfires emit NOx, nitrous acid (HONO), biomass burning VOCs (BBVOCs), and particulate matter (PM) that evolve chemically on a range of timescales, from seconds to weeks downwind (Akagi et al., 2011; Andreae and Merlet, 2001; Decker et al., 2019; Hatch et al., 2015, 2017, 2018; Koss et al., 2018; Palm et al., 2020). These emissions and their chemical products influence air quality through ozone (O3) production, emitted PM, and secondary organic aerosol (SOA) formation (Brey et al., 2018; Jaffe et al., 2020; Jaffe and Wigder, 2012; Lu et al., 2016; Palm et al., 2020; Phuleria et al., 2005). However, the evolution of the smoke downwind is influenced by several variables such as fuel type, burn conditions, moisture content, nitrogen content, meteorology, and time of day.
Like most atmospheric oxidation processes, the oxidation of BBVOCs is influenced by three key atmospheric oxidants: O3, the hydroxyl radical (OH), and the nitrate radical (NO3). The amount of each oxidant present in a plume is influenced by emissions of NOx, plume mixing with background air, and the amount of sunlight that penetrates a plume. Photolysis of HONO can be an important source of HOx () in the first 3 h of aging for wildfires sampled in the western US (Peng et al., 2020). Further, atmospheric background levels of O3, as well as photochemical O3 production within a smoke plume, can provide O3 for plume oxidation (Jaffe and Wigder, 2012). However, there is limited understanding of the role of NO3 oxidation in biomass burning plumes.
During daytime, NO3 is rapidly destroyed by photolysis (Reaction R1), and in urban plumes it is destroyed even more rapidly by reaction with NO (Reaction R2, τ<10 s) (Brown and Stutz, 2012; Wayne et al., 1991).
Therefore, although the role of NO3 in nighttime BBVOC oxidation has been considered previously, the role of NO3 as a daytime oxidant has been neglected (Decker et al., 2019; Keywood et al., 2015; Kodros et al., 2020; Palm et al., 2020).
Despite the potential for rapid loss of NO3 with sunlight and NO, wildfire plumes provide a unique environment which promotes NO3 chemistry. NO3 is produced within a smoke plume by the gas-phase reaction of O3 and NO2 (Reaction R3) and is a precursor for N2O5 (Reaction R4), a NOx reservoir (Brown and Stutz, 2012). N2O5 may undergo heterogeneous uptake to form ClNO2 and HNO3 according to the branching ratio ϕ (Reaction R5) (Chang et al., 2011; McDuffie et al., 2018). NO3 can also be directly taken up by aerosol (Reaction R6) or react with BBVOCs (Reaction R7).
Modeled NO3 reactivity was found to be mostly (>99 %) from reactions with BBVOCs (Reaction R7) as opposed to heterogeneous reactions with aerosol particles (Reactions R5–R6) in an agricultural burning plume sampled after sunset (Decker et al., 2019). This is the result of elevated concentrations of several highly reactive BBVOCs within the plume. Specifically, directly emitted aromatic alcohols (phenolics, i.e., six-membered aromatic rings with an alcohol functional group, which are distinct from the broader class of oxygenated aromatics that also includes furans, furfuals, etc.) react with NO3 at near the gas-kinetic limit to form nitrophenolics, a subset of nitroaromatics, and secondary organic aerosol (Akherati et al., 2020; Finewax et al., 2018; Lauraguais et al., 2014; Liu et al., 2019; Xie et al., 2017). Nitrophenolics absorb strongly in the ultraviolet and visible regions of the solar spectrum and are expected to significantly contribute to brown carbon (BrC) absorption (Palm et al., 2020; Selimovic et al., 2020). Phenolic reactions with OH in the presence of NOx also form nitrophenolics but at one-third the yield (Finewax et al., 2018).
Wildfire emissions typically peak in the midafternoon to evening and continue to emit smoke into the night (Giglio, 2007; Li et al., 2019). Furthermore, large smoke plumes can be optically thick, with little photolysis at their center. This means that most smoke plumes will be oxidized in the dark during some, if not all, of their transport. Yet, the vast majority of in situ field investigations of biomass burning smoke has been conducted under sunlight, and most analyses of daytime smoke plumes have so far focused on plume oxidation by OH and O3 only (Coggon et al., 2019; Keywood et al., 2015; Liu et al., 2016; Palm et al., 2020).
In the summer of 2019, both the NOAA Twin Otter and the NASA DC-8 aircraft executed a series of research flights sampling smoke plumes as part of the Fire Influence on Regional to Global Environments and Air Quality (FIREX-AQ) campaign. Here, we present a detailed analysis of smoke plumes from three fires using observations from FIREX-AQ to constrain a detailed zero-dimensional (0-D) chemical box model. We investigate one optically thick plume emitted midday, three smoke plumes emitted near or at sunset, and one theoretical plume emitted after sunset. We discuss the reactivity and competitive oxidation for all oxidants, NO3, O3, and OH, toward a suite of BBVOCs. Further, we detail the oxidation pathways of phenolics, discuss the variables that affect the yield of nitrophenolics, and describe how nitrophenolics have a significant impact on NOx loss and fate.
2.1 Aircraft measurements
FIREX-AQ was a large-scale multi-platform campaign that took place during the summer of 2019 in the United States to study both wildfire and agricultural burning smoke. Both the NOAA Twin Otter and the NASA DC-8 aircraft executed a series of research flights sampling smoke plumes as part of this campaign. A main science goal of the NOAA Twin Otter was to investigate nighttime plume chemistry. However, due to a less active fire season in 2019 (NIFC, 2019) and to the decreasing smoke injection height with time of day for the sampled fires, smoke emitted after dark proved difficult to sample reliably within the altitude range of the NOAA Twin Otter. While the NOAA Twin Otter sampled over a dozen plumes after sunset, plume age estimates (described below) suggest that these plumes were emitted before or at sunset. The NASA DC-8 aircraft sampled large, optically thick, plumes both midday and near sunset. In the following sections we briefly describe the instrumentation used for this analysis, which are listed in Table S1 in the Supplement. More information and data can be found at https://csl.noaa.gov/projects/firex-aq/twinotterCHEM/ (last access: 24 October 2021), https://espo.nasa.gov/firex-aq (last access: 24 October 2021), and https://www-air.larc.nasa.gov/missions/firex-aq/index.html (last access: 24 October 2021).
2.1.1 NOAA Twin Otter instrument descriptions
The NOAA Twin Otter sampled nine wildfires with 39 flights between 3 August and 5 September 2019 in the western US. The aircraft was based mainly in Boise, ID, and briefly in Cedar City, UT. The NOAA Twin Otter payload limited flight duration to 3.0 h or less, and the aircraft typically flew 2–3 times in a day to achieve plume sampling from midafternoon into the night. Aircraft speed was (average ), which yields a horizontal resolution of ∼70 m for the in situ 1 s measurements. Attempts to probe the same air mass downwind, known as Lagrangian sampling, proved difficult to achieve due to complex plume structure, terrain, and airspace. Therefore, we define the sampling strategy as semi-Lagrangian. Even so, estimated emission times (calculated from estimated plume ages) suggest that smoke sampled on successive intercepts at the Castle fire and 204 Cow fire (simply referred to as Castle and Cow, respectively, from here on) plume centers was emitted within 3 and 10 min time periods, respectively. However, plume age uncertainties for the Cow plume are large (Table S2 in the Supplement).
This analysis uses NOAA Twin Otter observations of BBVOCs and HONO from a University of Washington iodide high-resolution time-of-flight chemical ionization mass spectrometer (UW I− HR ToF CIMS, 2 Hz; Lee et al., 2014) as well as a Tenax cartridge sampler with subsequent GC×GC analysis for speciated BBVOCs (intermittent transect integrations; Hatch et al., 2015; Mondello et al., 2008), which we use to support mass assignments from the UW I− HR ToF CIMS for some phenolic compounds (see the Supplement).
We use data from a commercial cavity ring-down spectrometer (Picarro G2401m) for measurements of CO, CO2, and CH4 (0.5 Hz; Crosson, 2008). We use measurements from a custom chemiluminescence instrument (CL, 1 Hz) for NO, NO2, and O3 (Sparks et al., 2019). Aerosol surface area measurements were collected by an ultrahigh-sensitivity aerosol spectrometer (UHSAS, 1 Hz; Kupc et al., 2018). The UHSAS data were corrected for coincidence up to a factor to 1.4, following the method described in Kupc et al. (2018). The sample for the UHSAS was diluted up to a factor of 2.9 for part of the flights to increase accuracy at higher concentrations. The aircraft had a standard meteorological probe (Aventech ARIM 200) for temperature, pressure, relative humidity, wind speed, and direction. We use NO2 photolysis rates (jNO2) collected by upward- and downward-facing jNO2 filter radiometers (Metcon GmbH, 1 Hz; Kupc et al., 2018; Warneke et al., 2016).
2.1.2 NASA DC-8 instrument descriptions
The NASA DC-8 aircraft sampled 14 wildfires in the western US while based in Boise, ID, as well as about 90 prescribed agricultural southeastern US fires while based in Salina, KS, between 22 July and 5 September 2019. Aircraft speed was , which yields a horizontal resolution of ∼167 m for the in situ 1 s measurements. Similar to the NOAA Twin Otter, sampling was semi-Lagrangian. However, smoke emission times for the plume centers of Williams Flats fires 1 and 2 (referred to as WF1 and WF2 from here on) covered a larger time period (∼30–60 min) compared to the NOAA Twin Otter (Table S2 in the Supplement).
In this analysis we use measurements of CO from a tunable diode laser spectrometer (1 Hz; Sachse et al., 1991) when available and from a cavity enhanced spectrometer (CES, 1 Hz; Eilerman et al., 2016) when unavailable. In the fires investigated here, both instruments agree well within <1 %. Measurements of NO2, NOy, and O3 are provided by a NOAA chemiluminescence (1 Hz; Pollack et al., 2010; Ridley et al., 1992; Stedman et al., 1972) instrument. When measurements of NO2 by the NOAA CL instrument are unavailable, we use measurements by a NOAA CES (1 Hz; Min et al., 2016). These two measurement methods of NO2 agree within 12 % for the fires we investigate. We use measurements of NO by a laser-induced fluorescence instrument (1 Hz; Rollins et al., 2020). Measurements of BBVOCs and HONO are taken from the NOAA I− ToF CIMS (1 Hz; Neuman et al., 2016; Veres et al., 2020) as well as the University of Innsbruck proton transfer reaction time-of-flight mass spectrometer (UIBK PTR ToF MS; Müller et al., 2014). Peroxyacetyl nitrate measurements were performed by a thermal dissociation CIMS (1 Hz, Ro Lee et al., 2020). Aerosol surface area measurements are taken from a scanning mobility particle sizer and laser aerosol spectrometer (SMPS and LAS, 1 Hz, LAS, 2021; Moore et al., 2021; SMPS, 2021). Spectrally resolved actinic flux was measured with separate upward- and downward-facing actinic flux optics (CAFS, 1 Hz; Shetter and Müller, 1999). These fluxes were used to calculate photolysis rates using the photochemistry routine contained in the NCAR TUV model (v5.3.2, https://www2.acom.ucar.edu/modeling/tropospheric-ultraviolet-and-visible-tuv-radiation-model, last access: 24 October 2021).
2.1.3 Plume age determination
Plume age estimates are made by air parcel trajectories computed in the HYSPLIT (HYbrid Single-Particle Lagrangian Integrated Trajectory) model with multiple high-resolution meteorological datasets (HRRR 3 km, NAM CONUS nest 3 km, and GFS 0.25∘). These estimates account for buoyant plume rise as well as horizontal advection. Uncertainties in plume age are determined from spread between the meteorological datasets, mismatch between observed and archived winds, and trajectory spatial error in missing the known fire source. Typical uncertainties are 25 % of the estimated age (Holmes et al., 2020).

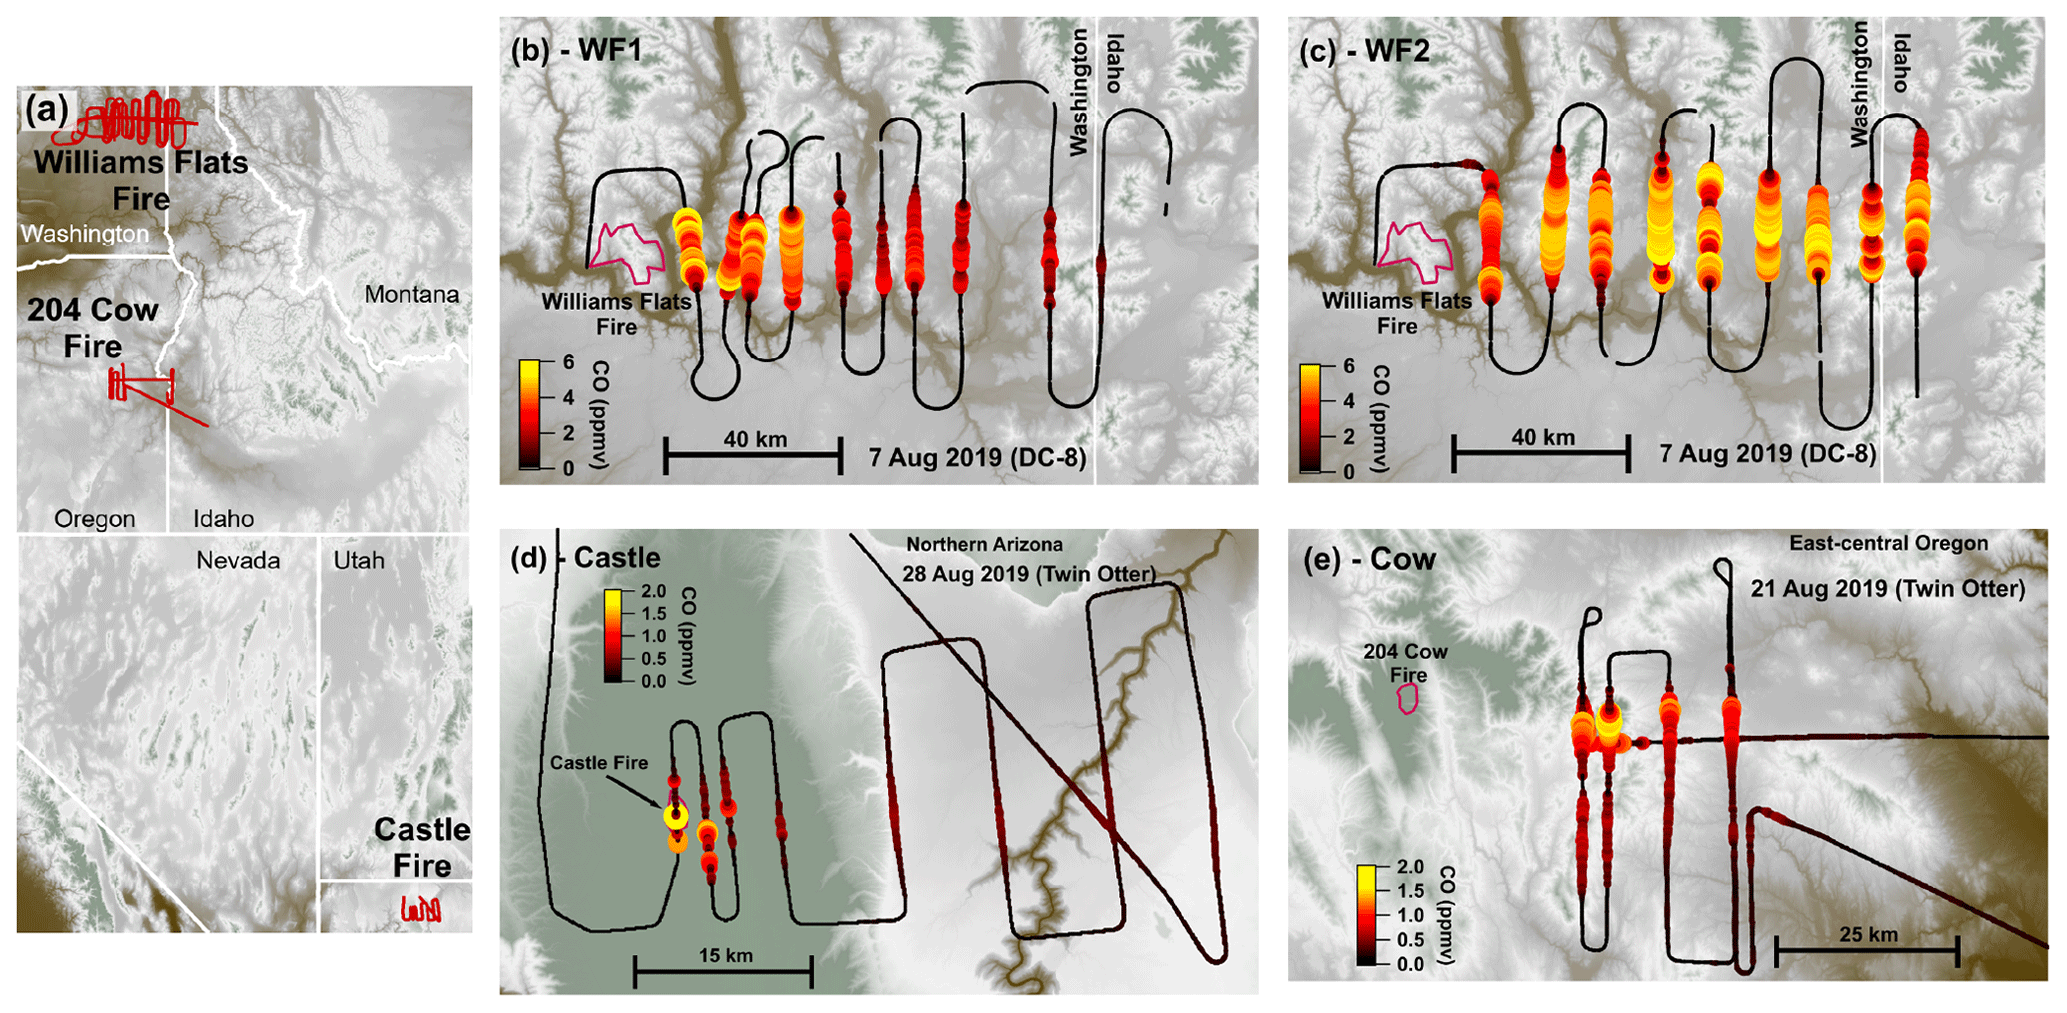
Figure 1Flight maps colored by elevation. Overview map (a) showing flight tracks (red) with detailed flight maps of the WF1 transects (b), WF2 transects (c), Castle transects (d), and 204 Cow transects (e). Panels (b)–(e) are colored and sized by CO. Fire boundaries are approximate and indicated by red outlines. The flight path is shown in black and sized by CO.
2.2 Fire descriptions
This analysis focuses on four semi-Lagrangian experiments from three separate fire complexes: the Castle fire plume in northern Arizona, the 204 Cow fire plume in central Oregon, and two from the Williams Flats fire plume in eastern Washington. Table 1 summarizes fire locations, sampling platform, sampling times, and fuel types (Inciweb, 2019a, b, c). Figure 1 displays flight paths. We select the above plume samplings among others because of their data coverage, potential for active chemistry, and sunset-like conditions defined as the following: (1) sampled by semi-Lagrangian transects roughly perpendicular to the prevailing wind direction; (2) had available measurements of CO, NOx, HONO, O3, photolysis rates, and aerosol surface area; (3) contained either reduced plume-center photolysis () or plume ages <3 h by sunset; and (4) sampled a plume age range >1 h.
The WF fire started on 2 August 2019 and grew to a total of 179.9 km2 before it was contained on 25 August 2019. The fuel was mostly short grass (∼0.3 m tall) as well as ponderosa and mixed conifer timber (Inciweb, 2019c). The DC-8 aircraft performed three semi-Lagrangian smoke transect patterns on 7 August 2019 when the fire had burned about 101.2 km2. This study focuses on the first two sampling patterns: the WF1 (Fig. 1b) and WF2 (Fig. 1c). WF1 contained smoke emitted from about 14:00–16:00 PDT (local time) or the early to late afternoon, while the second pattern sampled smoke emitted near sunset. The sampled smoke varied in age from 36 min–4 h.
The Castle fire began on 12 July 2019 and was allowed to burn the mixed conifer fuel in a defined area that eventually reached 78.4 km2, and it burned out on 15 October 2019 (Inciweb, 2019b). The Twin Otter aircraft performed one semi-Lagrangian transect pattern during sunset on 21 August 2019 when small pockets of remaining fuel types were burning (Fig. 1d). The sampled smoke varied in age from approximately 2 min–1.5 h. The Castle fire had a neighboring fire named Ikes. Smoke from the Ikes fire visually mixed (Fig. S1 in the Supplement) with the Castle fire plume after the fourth transect downwind of the Castle fire (Fig. 1d). For that reason, this analysis focuses on the first four transects only.
The Cow fire started on 9 August 2019 and was allowed to burn eventually reaching 39.1 km2 by 15 September 2019. The fuel was mainly lodgepole pine at lower elevations and mixed conifer at higher elevations with abundant downed timber. The Twin Otter aircraft performed three semi-Lagrangian transect patterns on 28 August 2019, by which time the fire had burned 13.9 km2 (Inciweb, 2019a). This study focuses on the third semi-Lagrangian transect pattern, which was conducted after sunset (Fig. 1e). The sampled smoke in this analysis had aged approximately 2–3 h.
2.3 Box model description
We modeled smoke plumes from three fires (Castle, Cow, and WF). We present four model cases (Castle, Cow, WF1, WF2) constrained by aircraft observations and one case (denoted Dark) identical to the WF2 case except all modeled photolysis frequencies are set to zero. We consider the Dark model run only for the WF2 case and not the others since it is a hypothetical exercise intended to illustrate the evolution of smoke emitted after dark, a case for which there were no available observations from the 2019 campaign. The Dark case is used to understand the effect of photolysis on the WF2 model run.
There were sufficient emissions for the WF1, WF2, Dark, and Cow model runs such that there were emissions remaining above background levels after 12 h of model time. The Cow, WF2, and Dark cases are run from emission until sunrise the following day (about 12 h). The Castle case is run for 2.6 h until all BB emissions are near (≪1 %) background levels. We run the WF1 case until the age of the oldest sampled smoke (∼4 h), because we do not have any observations of photolysis rates with which to constrain the model past that point.
Box modeling was performed using the Framework for 0-D Atmospheric Modeling (F0AM) (Wolfe et al., 2016) with chemistry and emissions described in the following section. We start the model at the emission time (age=0) of the earliest smoke transect (the youngest sampled smoke), which occurred between 2 min and 2 h before the first plume transect, depending on the plume. In most cases, we use an iterative method constrained to a subset of observations (described in Sect. 2.3.3) to estimate emissions.
While all plumes were sampled by aircraft following a semi-Lagrangian strategy, we model each plume as if it were Lagrangian – i.e., it is assumed that the emissions and fire conditions were constant over the course of sampling. Further, we constrain our model to plume-center observations, because we model only the plume center and represent mixing through a dilution term. Consequently, the model does not represent differences in chemical regimes that may occur between the center and edge of a plume. Components of our model have been used for other applications (Decker et al., 2019; McDuffie et al., 2018; Robinson et al., 2021; Wagner et al., 2013). However, the combination of the components is specific to only this work.
2.3.1 Chemistry and emissions
Our model uses the Master Chemical Mechanism (MCM, v3.3.1 via http://mcm.york.ac.uk, last access: 23 September 2021), in conjunction with a NOAA biomass burning mechanism included in F0AM v4.0 (Bloss et al., 2005; Coggon et al., 2019; Decker et al., 2019; Jenkin et al., 1997, 2003, 2012, 2015) and updates to OH- and NO3-initiated oxidation of phenolic compounds (Bolzacchini et al., 2001; Calvert et al., 2011; Finewax et al., 2018; Nakao et al., 2011; Olariu et al., 2002, 2013; Schwantes et al., 2017). Briefly, we update the phenolic oxidation product yields of catechol, methylcatechol, and three dimethylcatechols reacting with NO3 and OH. Further, we expand the phenolic oxidation pathways in the MCM from 50 to 140 reactions by extrapolating analogous branching ratios, rate coefficients and products from studies of phenol and cresol oxidation (see the Supplement).
We initiate the model, as discussed in Sect. 2.3.3, using an emissions inventory of 302 BBVOCs in the form of emission ratios (ERs).
Note that an ER is used to describe an emission (when smoke age=0) and is different than a normalized excess mixing ratio (defined in Sect. 2.4.1) used to describe observations when smoke age>0. The ER inventory is described in detail in Decker et al. (2019) and uses an average of BBVOC emission ratios of ponderosa pine fuel from the Fire Lab at Missoula Experiment (FLAME-4) (Hatch et al., 2017) and the Fire Influence on Regional and Global Environments Experiment (FIREX lab) (Koss et al., 2018) with rate coefficients taken from literature when available or estimated when unavailable. Approximately 250 BBVOCs in the inventory are not included in the MCM and do not have published mechanisms. Therefore, reactions of those compounds with NO3, OH, and O3 lead to a generic product.
The model includes heterogeneous NO3 and N2O5 uptake onto aerosol, calculated for NO3 heterogeneous reactivity, as
where is a first-order rate coefficient, Keq is the equilibrium rate constant for Reaction (R4), and is a first-order rate coefficient for uptake expressed below. Note, however, that the following equation applies for small uptake coefficients and small aerosol diameters where gas-phase diffusion does not limit uptake. For large particle diameters or large uptake coefficients, the simplified heterogeneous uptake equation requires a correction for gas-phase diffusion (Fuchs and Sutugin, 1970; Kolb et al., 2010). For accumulation mode particles on the order of 100 nm and uptake coefficients on the order of 0.01, this correction is not important.
Here γ is the aerosol uptake coefficient, is the mean molecular speed, and SA is the measured aerosol surface area at plume center. We use and (McDuffie et al., 2018).
2.3.2 Model constraints
Our model is constrained to plume-center and background measurements of aerosol surface area, photolysis rates, O3, CO, NOx, HONO, and total oxidized nitrogen (NOy). Measurements of NOy are only available from the DC-8 measurements. We also constrain our models to the meteorological conditions pressure, temperature, and relative humidity. Fire emissions and photolysis conditions can change rapidly; therefore, we constrain the model to a subset of plume transects. We chose transects that showed a monotonic decrease in CO with distance from the fire, cover an age range of at least 1 h, and have similar emission times as shown in Figs. S2–S3 and Table S2.
All model runs included a constant first-order plume dilution rate coefficient (kdil) determined by applying an exponential fit to observed CO as a function of plume age (Fig. S3 in the Supplement). We fit only points used to constrain the model and fixed the exponential fit offset to the observed CO background. We applied kdil to all species in the model. We find values of kdil that range between 1.6– (Table S3 in the Supplement), equivalent to a lifetime () of 0.6–17.3 h.
Plume-center observations were determined using a “top 5 %” method as described by Peng et al. (2020). Briefly, within a transect we determine the location of the greatest 5 % of observations for CO and use that location of the plume for analysis of other compounds. This method obtains an average observation for the center, or most concentrated, parts of the plume. Reported uncertainties are the 1−σ variability of the top 5 % region and instrument uncertainties added in quadrature.
Particulate matter in BB plumes attenuates sunlight, thus photolysis rates, in a process we refer to as plume darkening. In WF plumes we use plume-center observations of 20 photolysis rates (listed in Table S4 in the Supplement), but for the Castle and Cow plumes only jNO2 is available due to the limited instrument payload on the NOAA Twin Otter. Average attenuation of jNO2 within the WF1 and WF2 plumes was 96 % (meaning jNO2 at plume center was 4 % of jNO2 outside of the plume). Plume-center attenuation of jNO2 was 29 % for the Castle plume. We sample the Cow plume after sunset and therefore do not have observation of jNO2 while the smoke was under sunlight (0–2 h). We estimate that plume-center jNO2 attenuation was 34 %. This estimate was made by comparing jNO2 attenuation to plume size (by CO) in the WF and Castle model runs and is consistent with jNO2 attenuation in plumes emitted from the Cow fire sampled on other days. All other photolysis rates were estimated using a ratio of the observed jNO2 to calculated photolysis rates using an MCM trigonometric solar zenith angle (SZA) function below.
where l,m, and n are derived from least squares fits to j values from a radiative transfer model and literature cross sections and quantum yields. This calculation is a standard photolysis value method in F0AM and is described by Jenkin et al. (1997). However, this method does not account for overhead O3 column, surface albedo, aerosol, or other effects.
In all of the plumes studied here, observed jNO2 rates are below excluding the first few minutes of the Castle plume (see Fig. 2). Values of jNO2 in the WF2 plume remained low, near during the sampling time. In contrast, the WF1 plume exhibits increasing jNO2 rates, which eventually reach . Differences in the photolysis rates between the first and second pass are likely due to the setting sun. Finally, observations of photolysis rates are negligible in the Cow plume as it was sampled after sunset.

Figure 2Observations (closed circles) and model output (lines) for all model runs. The Dark run is shown as a dashed line in the WF2 column. The time of sunset (defined as when the solar zenith angle reaches 90∘) is indicated by a vertical dashed line. Observation errors (y error: variability in the observation at plume center and instrument uncertainty added in quadrature; x error: uncertainty in plume age determination) are shown as shaded xy boxes.
2.3.3 Model initiation
In all plumes except the Castle plume, our first transect sampled smoke 36 min–2 h old; therefore, we implemented an iterative method (McDuffie et al., 2018; Wagner et al., 2013) to estimate initial emissions (at age=0). We began with best-guess estimates of CO, NO, NO2, HONO, O3, and all BBVOCs (determined by CO and our emissions inventory by Eq. 1) and then systematically changed these initial conditions to minimize the differences between model output and observations downwind. Initial conditions in the Castle run were taken directly from observations of NO, NO2, O3, CO, HONO, phenol, catechol, cresol, and methylcatechol in the first transect where the plume age was 3±1 min and therefore was close to age=0. We initiated the remaining 298 BBVOCs by using CO and Eq. (1). Initial conditions for all cases are shown in Table S5 in the Supplement. In all cases, backgrounds of NO, NO2, O3, CO, and HONO were taken as an average outside of the plume, and BBVOC backgrounds were assumed to be zero. Background mixing ratios used in all cases are shown in Table S3.
We determined best-guess estimates of CO and HONO directly from observations of the first transect. To determine a best-guess estimate for NOx, we used the sum of observed NO and NO2 for the Cow run or NOy minus HONO (as NOy will contain HONO) for the WF runs. Best-guess estimates of O3 were determined using an average of background O3 observations from a flight leg upwind of the fire and outside of the plume transects, which can vary (Table S6 in the Supplement).
We began iteration with CO and kdil by increasing best-guess estimates of CO and varying kdil within the fit errors until we minimized the differences between observed and modeled CO. This, in turn, determines the emissions of BBVOCs by Eq. (1). Next, we iterated NOx, HONO, and the ratio such that the sum of NOx and HONO did not exceed the observed NOy, and the initial ratio remained between 0.6–1 (Roberts et al., 2020). Lastly, we iterated the initial and background O3. As explained in Sect. 2.4, we were required to iterate on background O3 in some model runs in order to achieve agreement between model and observations. We repeated the above process to minimize the differences between model and observations. In an attempt to avoid finding a local solution, as opposed to the “best” solution, we reversed the order of iterating O3, NOx, and HONO when repeating the above process.
2.4 Observations and model comparison
Accurately modeling the first-order loss of CO is critical as it determines the overall plume dilution rate coefficient and initial BBVOC mixing ratios. Median differences in modeled and observed CO range from 39.7–307.4 ppbv with a median difference of 2.8 %–11.7 % across all model runs. Percentage and absolute differences between the model runs and observations are detailed in Table S7 in the Supplement and Fig. 2. Median differences of NO2 and HONO are 5.1 %–32.2 % and 6.6 %–53.3 %, respectively. There are greater percentage differences in NO2 and HONO that arise due to lower mixing ratio observations mostly in the WF1 and Castle plumes, with a range of absolute median differences of NO2 and HONO between 0.4–2.0 ppbv and 0.3–3.4 ppbv, respectively.
Ozone median differences vary from 0.3–6.3 ppbv with a median difference of 0.8 %–27.2 % across all runs. For the WF1 and WF2 plumes, we found that a significant increase (38.5±0.4 and 35.3±7.5 ppbv, Tables S3 and S6) in model background O3 compared to the upwind leg was required to capture the observed plume-center O3. This is due to photochemical O3 production at the plume edges, where O3 was as much as a factor of ∼2 greater than the background O3. The increased plume edge O3 is not captured in our plume-center model and thus requires an increase in model background O3.
Additional model and observation comparisons of BBVOCs, including phenolics (discussed in detail below), are included in Figs. S5–S12 in the Supplement. In most cases, the comparisons show that the model and observations agree within a factor of ∼2 if not within observation errors.
2.4.1 Comparisons of constrained compounds
The WF fire emissions were significantly greater than the Castle and Cow fire emissions as is seen in the observed CO data (Fig. 2). Initial plume-center CO was 8.26 and 8.33 ppmv in WF1 and WF2, respectively, but 2.62 and 1.95 ppmv for Cow and Castle, respectively.
We report our observations for each species (X) relative to CO in the form of normalized excess missing ratios (NEMRs) following Yokelson et al. (2013) and shown in Fig. S4.
Ozone depression and negative NEMRs at the plume center were observed in all of the sunset, nighttime, or darkened fire plumes analyzed here. Observations of (where Δ indicates background-corrected) in the Castle plume remains at just below background levels of O3 in all observations likely due to the small plume size and large O3 background (82.5±2.1 ppbv). Generally, increases with plume age due to photochemical O3 production and mixing with background O3. Ozone in the midday WF1 plume reaches of CO or 67.4 ppbv above background after 3.8±0.5 h of transport.
Referring to Fig. S4, we find that observed , , and have variable trends in all plumes. Observations of are near-zero (≤0.1 ppbv ppmv−1) in the Castle and WF1 plumes and elevated in the WF2 and Cow plumes (0.21±0.02–1.21±0.13 ppbv ppmv−1). Observed in the WF2 plume changes sharply between the first four and last five transects, suggesting changes in fire emissions or photolysis near emission. In order to avoid these changes, we use only observations from the latter to constrain our model, as discussed in Sect. 2.3.2.
There is a general decrease in and over 4 h of aging. Observations of in the WF1 plume decrease at a faster rate than those in the WF2 plume; however, both plumes exhibit about 8.6 ppbv ppmv−1 in the youngest smoke (35±8 min old).
2.4.2 Comparisons of P(NO3)
Emissions of NOx from biomass burning plumes provide a source of NO3 that is suggested to be a major oxidant for BBVOCs (Kodros et al., 2020). The instantaneous NO3 production rate, P(NO3), is a common metric of the potential for NO3 chemistry (Brown and Stutz, 2012).
At the center of the plumes presented in this study, NO3 production rates were between 0.1 and 1.5 ppbv h−1 as seen in Fig. 2. These NO3 production rates are consistent with those found in a nighttime agricultural smoke plume measured above a rural area at the border of Missouri and Tennessee during the Southeast Nexus campaign (SENEX), which varied between 0.2 and 1.2 ppbv h−1 (Decker et al., 2019). These values of P(NO3) are also similar to those found in urban plumes and forested areas. Production rates of NO3 in urban plumes typically range within 0–3 ppbv h−1 at night but can be larger. In forested regions, P(NO3) is typically below 1 ppbv h−1 at night (Brown and Stutz, 2012).
Agreement between the modeled P(NO3) and observed P(NO3) reflects agreement between observed and modeled NO2 and O3. The WF1 model run slightly overpredicts NO2 after 3 h of aging and therefore overpredicts P(NO3). Similarly, the Cow model run slightly underpredicts NO2 compared to observations; therefore, the trend in P(NO3) is slightly underpredicted.
2.4.3 Comparison of phenolics
Our work focuses on the role of phenolics in BB plumes and includes updated and expanded phenolic oxidation mechanisms as described in the “Expansion of Phenolic Mechanism Description” section in the Supplement. Therefore, capturing the phenolic evolution in our models is critical to understanding the importance of phenolics in BB. In the Castle case, which is initiated with observations of phenolics, we find excellent agreement for catechol, methylcatechol, phenol, and cresol (Figs. S5 and S9). Further, we find that the model run lies on the upper edges of nitrocatechol errors and the lower edge of nitrophenol errors. The model run underpredicts nitrocresol by a factor of 60. Note that we do not have available calibrations for nitromethylcatechol but do provide observations in arbitrary units for the purpose of comparing the time evolution of this compound.
Overall the model recreates the relative time evolution of nitrophenolics well. Disagreement between the model and observed compounds could be caused by many factors including, but not limited to, interfering isomers measured by the UW I− HR ToF CIMS or the NOAA I− ToF CIMS, variable fire ERs, and loss or production of nitrophenolics not captured by our mechanism. The MCM includes several gas-phase loss processes of nitrophenolics but no gas to particle partitioning. Nitrophenolics readily partition to the aerosol phase (Finewax et al., 2018). Further, the MCM does not include photolytic loss of nitrophenolics, despite some evidence to the contrary (Sangwan and Zhu, 2016, 2018). Omitting the aerosol loss pathway may be the cause for these discrepancies. However, precisely how these differences affect the model and observation comparison is uncertain. Therefore, when analyzing gas-phase nitrophenolic evolution, we only consider integrated formation, as discussed in Sect. 3.3.2.
All other model runs were not initiated to observations of phenolics due to the older age of smoke during the first transect. Even so, in the Cow model run (Figs. S6 and S10) we find agreement with catechol and methylcatechol within observation errors. Modeled phenol is about a factor of 3 (Δ 1.4–2.0 ppbv) greater than the observations. Modeled cresol is about a factor of 10 greater than observations, while its oxidation product, nitrocresol, is 7 times less than the observations. Models are thus able to reproduce some, but not all, phenolic observations in the Cow plume.
Observations of phenolics in the WF plumes are limited to uncalibrated catechol and nitrocatechol observations from the NOAA I− ToF CIMS (Figs. S7–S8 and S11–S12). In the WF1 model run, catechol and nitrocatechol appear to deplete faster than the model would suggest. The time evolution of nitrocatechol in the WF2 plume agrees well with the model, and in the WF1 model run the model matches the rough timing of the observed maximum signal.
3.1 Reactivity
Instantaneous reactivity, Eq. (7) referred to simply as reactivity from here on, is used as a simplified metric to predict the competition of reactions between oxidant and BBVOC
where kX+BBVOC is a bimolecular rate coefficient for the reaction of X+BBVOC (where X is O3, NO3, or OH), and kX is an instantaneous first-order rate coefficient. Here, we calculate and detail the reactivity for O3, NO3 and OH oxidation of BBVOCs to understand their predicted competition. We also discuss how reactivity of the BB plumes studied here compare to other environments.
At emission, BBVOCs account for the majority of total reactivity for OH (87.7 %), NO3 (80.1 %), and O3 (99.6 %) as seen by the bars in Fig. 3. HCHO and CO account for 5.1 % and 5.3 % of OH reactivity, respectively, while NO2 accounts for a small (0.3 %) fraction. In this analysis we do not specify an aldehyde group and therefore separate HCHO from the general BBVOC groupings. We exclude O3 reactivity to NO in Fig. 3, because during the daytime this reaction is in a rapid cycle with NO2 photolysis and regeneration of O3 in which odd oxygen, , is conserved. Further reactions of O3 and NO2 can lead to loss of Ox. This analysis includes BBVOC oxidation by O3 but not a detailed budget for Ox.
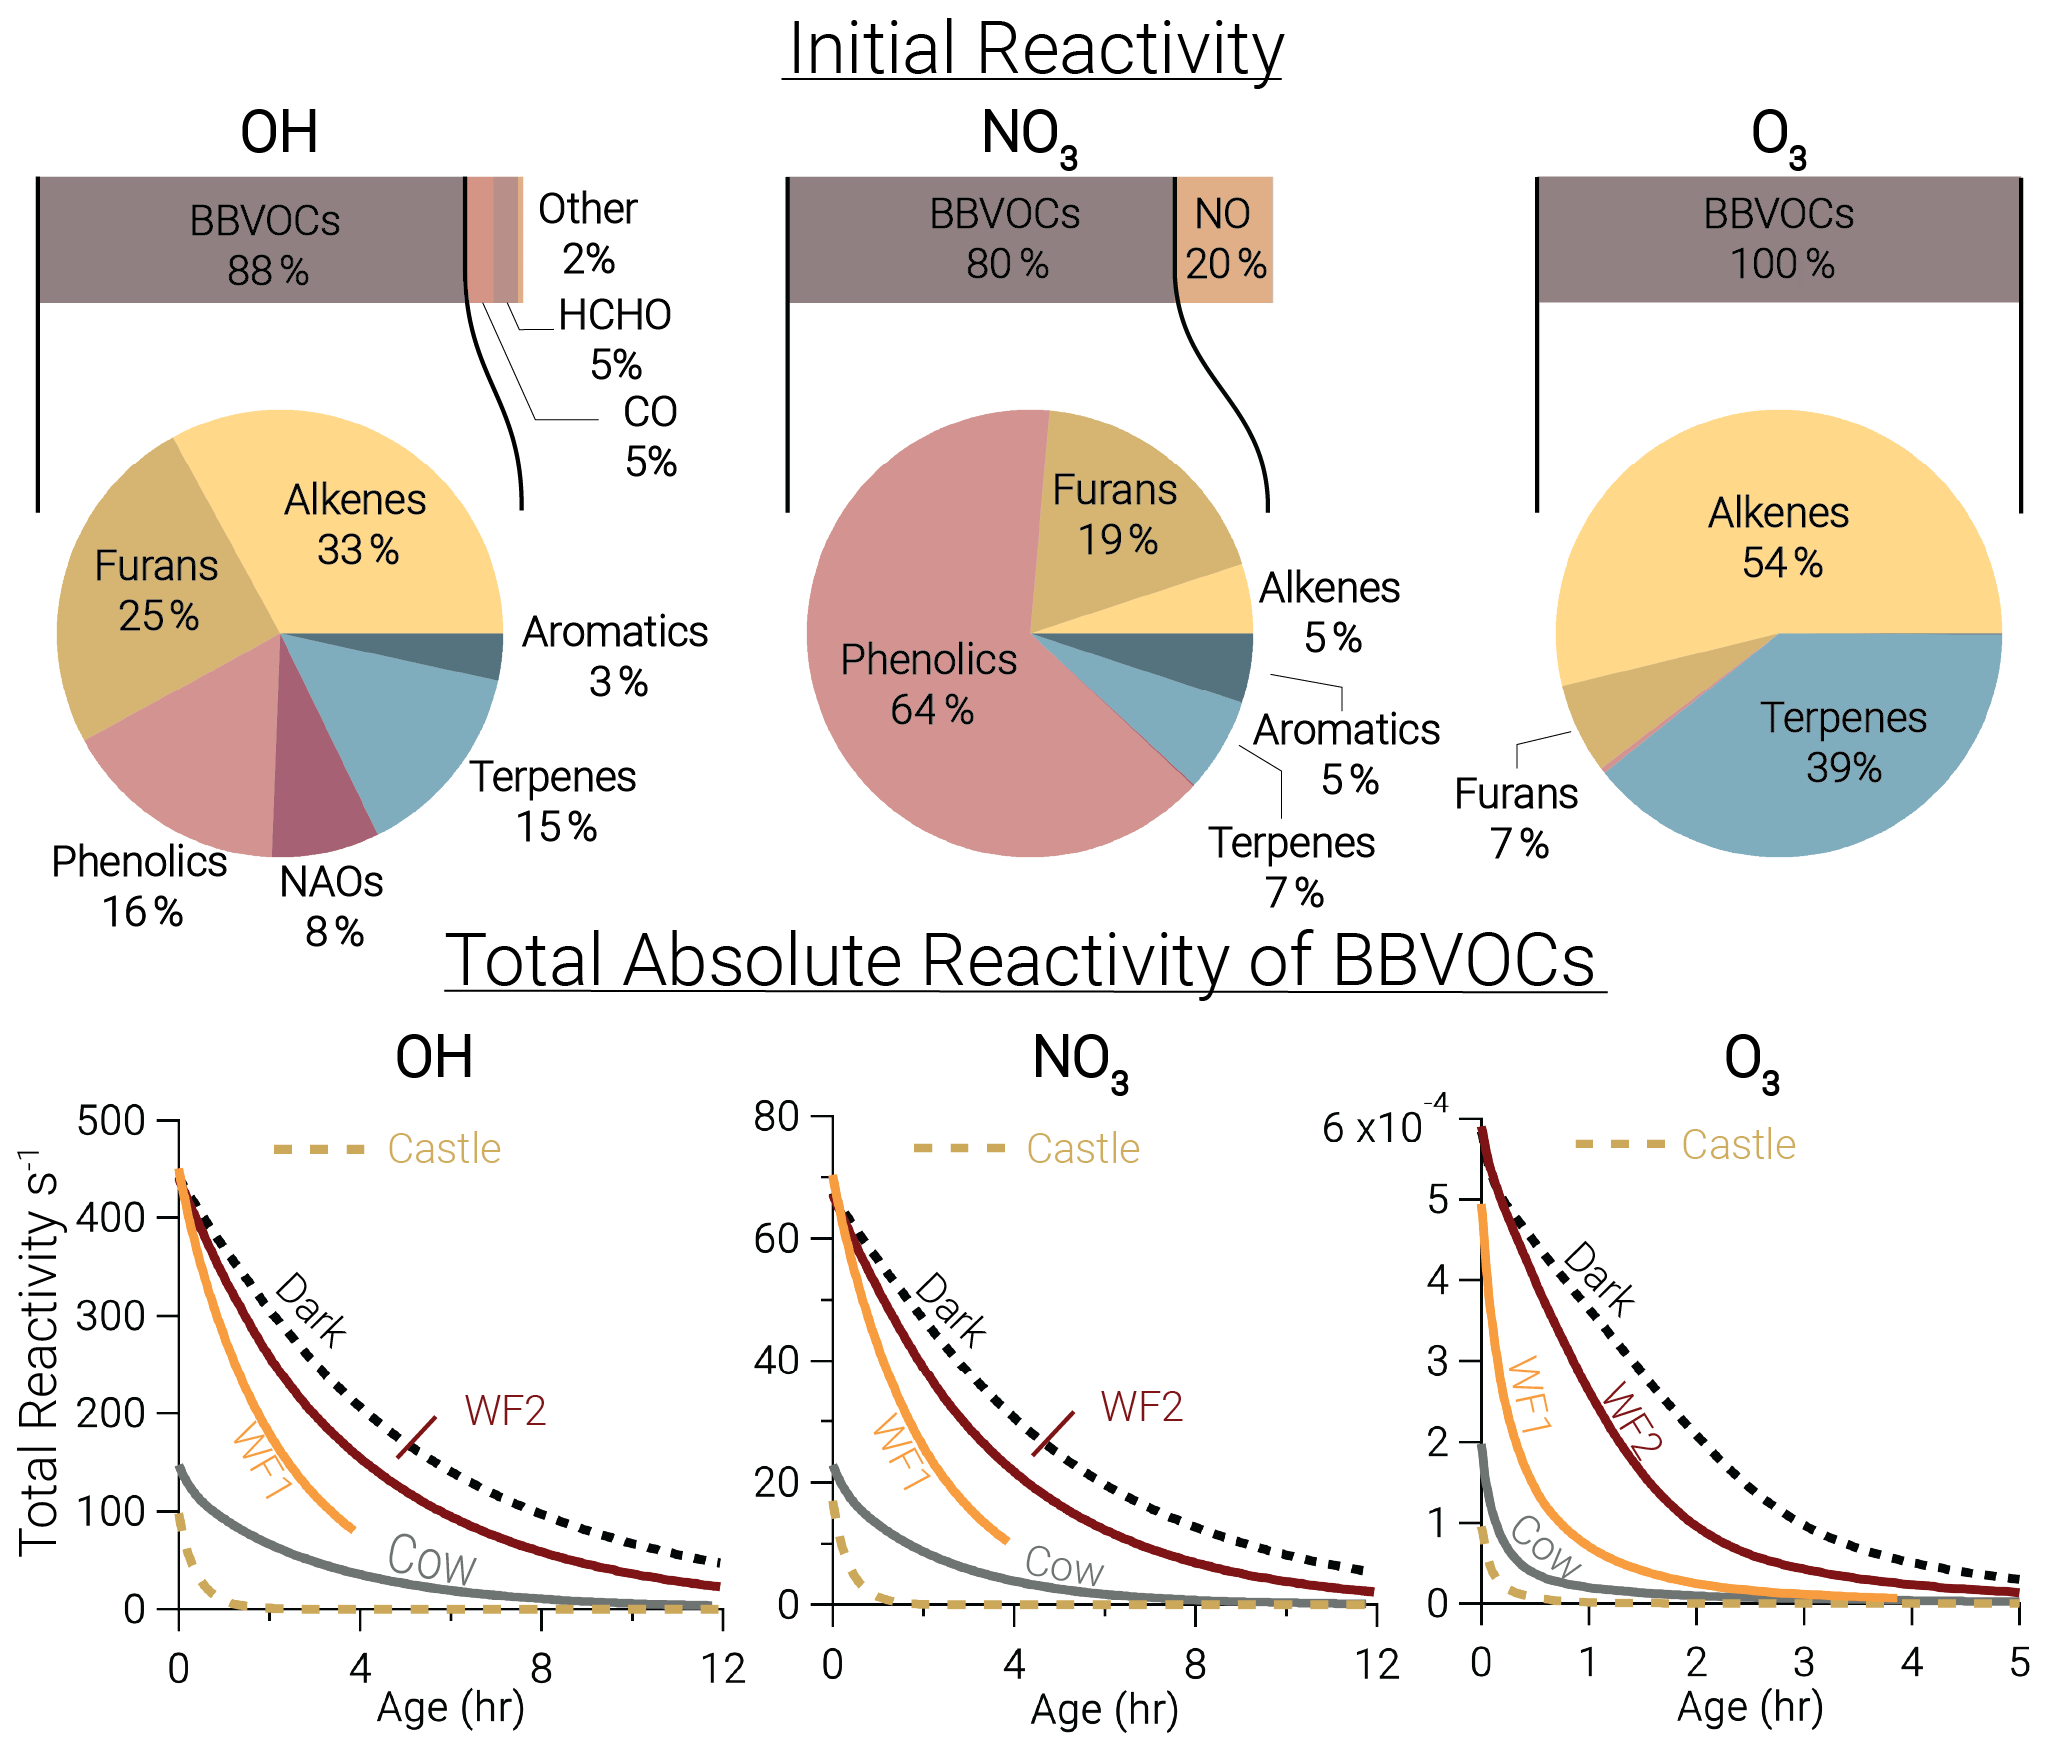
Figure 3Bars: average (of all five model runs) initial relative instantaneous reactivity for all compounds in our model, showing that initial reactivity of BBVOCs outweighs all other compounds for all oxidants. Pie charts: initial relative reactivity of BBVOCs, showing that OH reactivity is controlled by many BBVOC groups, NO3 reactivity by phenolics, and O3 reactivity by alkenes and terpenes. Time series: absolute reactivity of for all model runs, showing that reactivity decays at different rates for each model run and that OH and NO3 reactivity decay is similar.
Underneath each reactivity bar in Fig. 3, we show the partitioning of the initial BBVOC reactivity. Almost three-quarters of OH reactivity is from alkenes (33.0 %), furans (25.0 %) and phenolics (16.4 %). The reactivity of NO3, by contrast, is controlled by phenolics (64.4 %), and O3 reactivity is controlled by alkenes (53.8 %) and terpenes (39.2 %). Nitrate radical reactivity toward a smaller fraction of VOCs is consistent with other reactivity analyses of OH, NO3, and O3 in forest air (Palm et al., 2017).
Below each pie chart in Fig. 3, we show reactivity for OH, NO3, and O3 toward BBVOCs on an absolute scale. As BBVOCs are oxidized and the plume dilutes, the plume reactivity is reduced. Decay of OH and NO3 reactivity is nearly identical, while that of O3 is different (e.g., WF2 and Dark). As a result, fewer BBVOCs, specifically alkenes, are oxidized in the Dark model run, keeping reactivity greater when compared to the WF2 model run.
Total initial OH reactivity toward BBVOCs ranges from 98.3–450.0 s−1. Since the modeled total reactivity is proportional to the plume's initial emission of CO, the largest plumes, WF and Dark, have the greatest total initial total reactivity. Typical OH reactivities range between 7–130 s−1 for urban plumes or 1–70 s−1 in forests (Yang et al., 2016), demonstrating that wildfire plumes can be similar to urban plumes or significantly more reactive.
Total initial O3 reactivity toward BBVOCs ranges between and . A recent study of a suburban site in China found O3 reactivities toward non-methane VOCs between – (Yang et al., 2020). Reactivity in wildfire plumes exceeds that in urban plumes by a factor of 80–3000.
Total initial NO3 reactivity toward BBVOCs ranges from 17.1–70.3 s−1. Reactivity of NO3 is typically reported as a lifetime (), which is the NO3 concentration over the NO3 production rate under the assumption of a steady state in both NO3 and N2O5 (Brown et al., 2003). Since NO3 and N2O5 readily interconvert (Reaction R4), the sum of and are reported.
Using Eq. (8), modeled steady-state lifetimes are predicted to be between 0.5–1.2 s. Typical values in urban plumes range from tens of seconds to tens of minutes, and values in forested regions have been reported between 20 s–15 min (Brown and Stutz, 2012). The reactivity of NO3 in wildfire plumes sampled during FIREX-AQ is 10–104 times greater than typical values in forested or urban environments. The increased reactivity of NO3 to BBVOCs within wildfire plumes is greater than the increased reactivity for OH and O3, highlighting that BB plumes have large overall reactivity that is more pronounced for NO3 than other oxidants. The increased reactivity of NO3 is due to the specific emissions from biomass burning, such as phenolics and furans that have substantial reactivity toward NO3. The compounds greatly increase NO3 reactivity compared to urban VOC profiles but do not increase OH reactivity to the same degree.
In addition to a large suite of reactive BBVOCs that increase NO3 reactivity, smoke contains concentrations of aerosol and aerosol surface area that are far greater than normally found in urban areas (Decker et al., 2019). When considering NO3 reactivity, we must also consider aerosols, since aerosols present a loss pathway for NO3 and its equilibrium product N2O5 (Brown and Stutz, 2012; Goldberger et al., 2019; Tereszchuk et al., 2011). As explained in Sect. 2.3.1, we calculate the NO3 heterogeneous reactivity to understand the competition between NO3 loss to BBVOCs and heterogeneous loss to reaction with aerosol.
As shown in Fig. S13 in the Supplement, heterogeneous losses of NO3 and N2O5 are ≲2.5 % of total NO3 reactivity in all model runs. Further, we find that >90 % of aerosol loss is through N2O5 rather than NO3 uptake. Therefore heterogeneous losses of NO3 and N2O5 do not appreciably compete with gas-phase BBVOC oxidation, consistent with a similar analysis of nighttime smoke plumes (Decker et al., 2019).
While our analysis finds that the reactivity in a BB plume is far greater than other environments, it is important to note that our calculations use a large suite of the most reactive VOCs that may not be included in other reactivity studies. Further, our reactivity calculations are based on our BBVOC ER and kinetic database as described by Decker et al., 2019. While this database includes rate coefficients for the most reactive BBVOCs, it does not include rate coefficients for all 302 BBVOCs with all oxidants. Therefore, our reactivity estimates may be a lower estimate. Our VOC profile does not include alkanes, since FIREX lab studies (Hatch et al., 2015; Koss et al., 2018) and an OH reactivity analysis of FIREX lab emissions found that OH reactivity toward alkanes accounted for 0 %–1 % of total BBVOC reactivity across all fuel types (Gilman et al., 2015). Therefore, we expect the absent alkane reactivity in this study to be negligible.
3.2 Oxidation rates
While reactivity is a useful metric to predict the competition between reactions, it does not account for oxidant concentration, which can vary widely depending on photolysis rates, emissions, and competing oxidants. In the following sections we discuss the BBVOC oxidation rate, which is related to reactivity through the oxidant concentration as shown below
where RX is the BBVOC oxidation rate; kX is the biomolecular rate coefficient between X and BBVOC; and X is OH, NO3, or O3. In the following sections we compare and contrast reactivity and oxidation budgets and discuss how the initial reactivity changes with plume age for different BBVOC groups. Finally, we discuss the oxidant competition between NO3, OH, and O3 for three main groups of BBVOCs: phenolics, furans/furfurals, and alkenes/terpenes.
3.2.1 Oxidation of BBVOCs
The integrated oxidation rate or the oxidation budget (Fig. 4) is similar to initial reactivity shown in Fig. 3 for OH oxidation, suggesting initial reactivity may be a good indicator for integrated reactivity. However, this does not hold true for NO3 or O3.
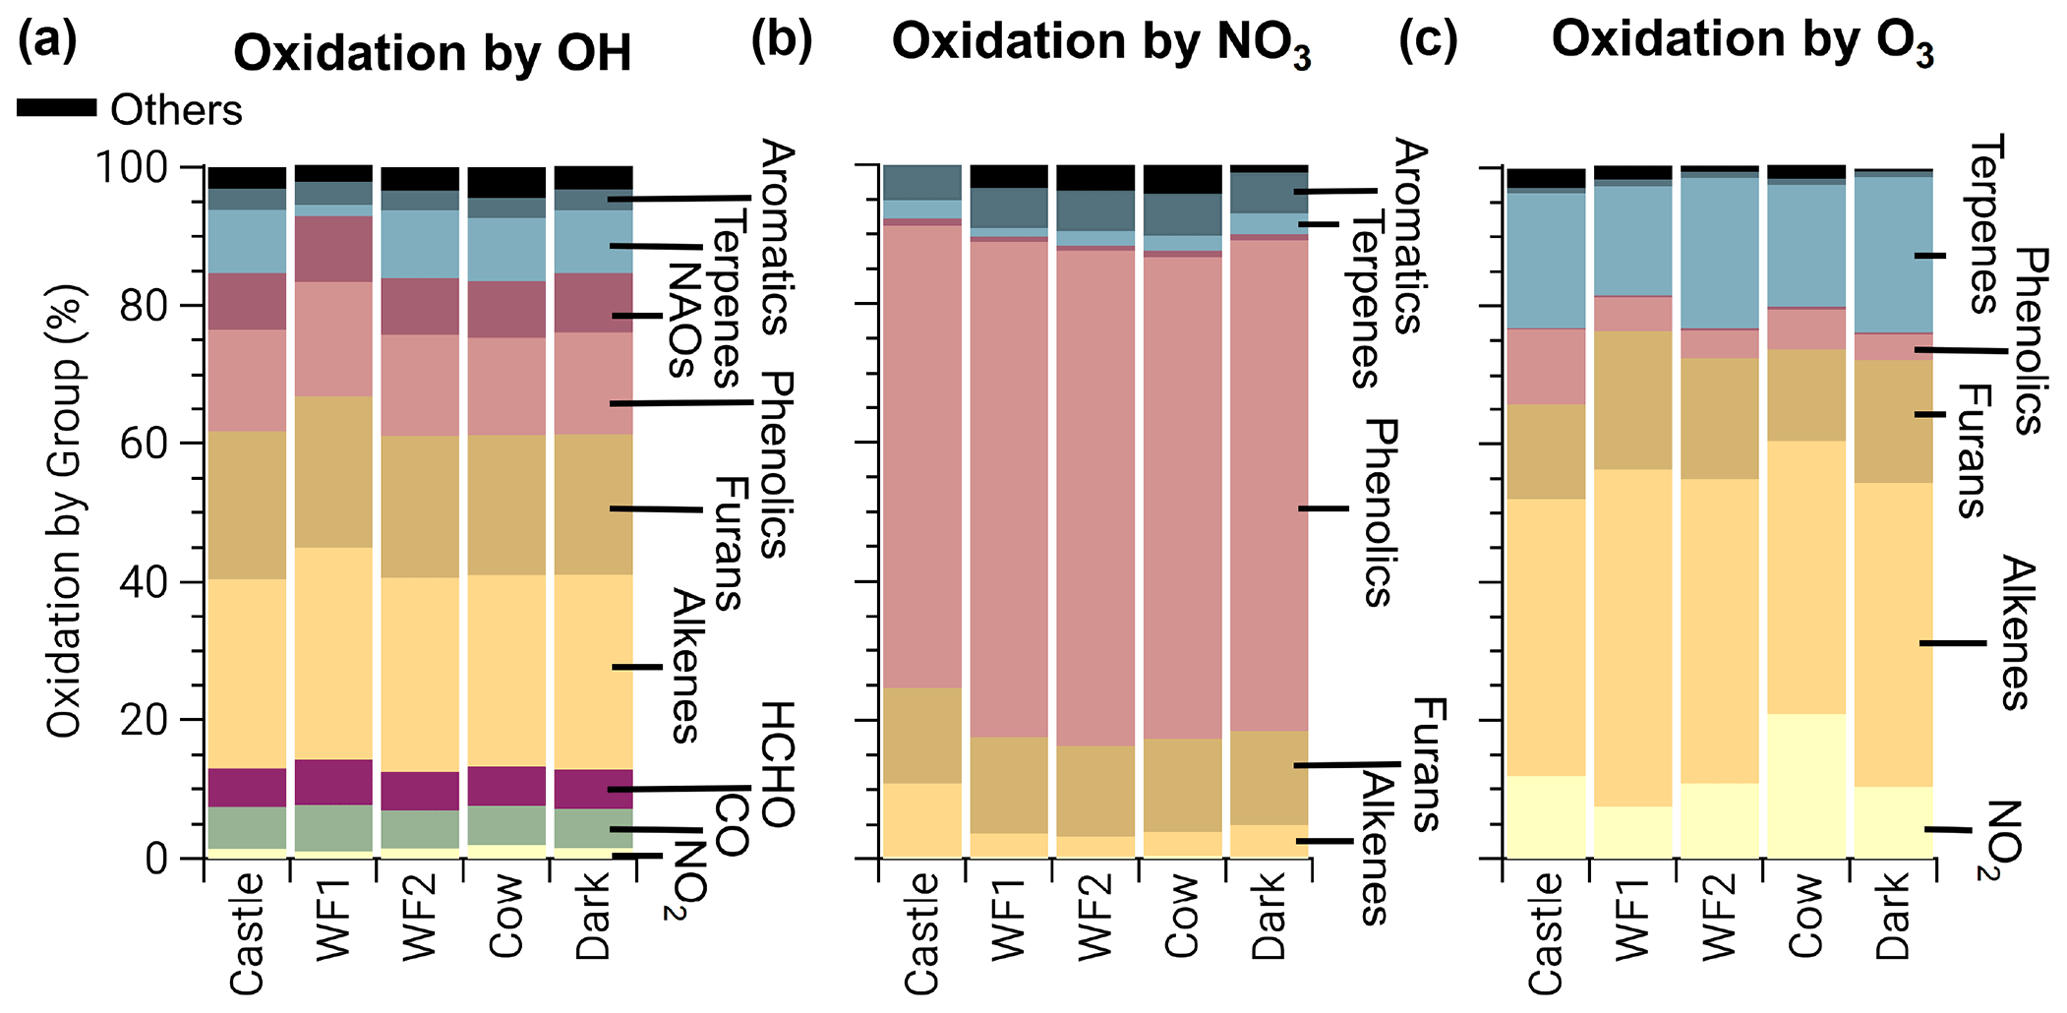
Figure 4Integrated oxidation rate or oxidation budgets of BBVOCs by OH (a), NO3 (b), and O3 (c) on a relative scale for all five model runs. Oxidation by OH is spread across many BBVOC groups (where NAOs are non-aromatic oxygenates), similar to initial reactivity but also HCHO, CO, and NO2. Oxidation by NO3 is dominated by phenolics but by a greater fraction than initial reactivity suggests. Oxidation by O3 is shown without NO and is dominated by alkenes and terpenes as expected from initial reactivity, but unlike initial reactivity it includes large contributions from phenolics and NO2 (resulting in NO3 production).
The initial NO3 reactivity differs substantially from the oxidation budget. For example, 20 % of initial NO3 reactivity is due to NO, but NO accounts for ≤1 % of integrated NO3 loss. Further, photolysis of NO3 accounts for <1 % of NO3 loss in all model runs and is greatest in the Castle plume (0.6 %) where measured jNO2 and calculated jNO3 reached maximum values of and 0.14 s−1, respectively. Although daytime NO3 oxidation of reactive VOCs has been found for heavily polluted urban air (Brown et al., 2005; Geyer et al., 2003; Osthoff et al., 2006), the dominant NO3 loss processes in urban plumes is NO reaction and photolysis (Brown and Stutz, 2012; Wayne et al., 1991). The different controlling NO3 loss pathway here highlights the unique and highly reactive environment of BB plumes. Further, 67 %–70 % of integrated NO3 reaction is due to phenolics, which is larger than initial total NO3 reactivity (56 %). Integrated alkene, terpene, and furan oxidation by NO3 are all lower than their initial reactivities.
The production of NO3, by Reaction (R3), and subsequent loss to BBVOCs is a significant (8 %–21 %) loss of O3 and much greater than the initial O3 reactivity to NO2 of 0.4 %. Similarly, integrated loss of O3 to alkenes (40 %–49 %) and terpenes (16 %–23 %) is much less than initial reactivity would suggest (54 % and 39 %, respectively). Conversely, phenolics and furans account for 4 %–11 % and 13 %–20 % of O3 loss, respectively, even though their relative initial reactivity is <1 % and 7 %, respectively. Overall, the differences between initial reactivity and integrated oxidation rate are explained by changing reactivity as BBVOC are oxidized with plume age.
An example is seen in Fig. 5 for O3 in the Castle model run, which has a large O3 background (72±1–82±2 ppbv), is a relatively small plume, and is sunlit at emission. As a result, alkenes and terpenes are depleted quickly through oxidation by O3 and OH. The combined O3 reactivity of alkenes and terpenes reduces from 82 % to 44 % after 2 h, during which time phenolic reactivity increases from <1 % to ∼40 %. In other words, as BBVOCs are depleted, the reactivity profile of each oxidant will change and can result in significant differences between the initial reactivity and oxidant budget.
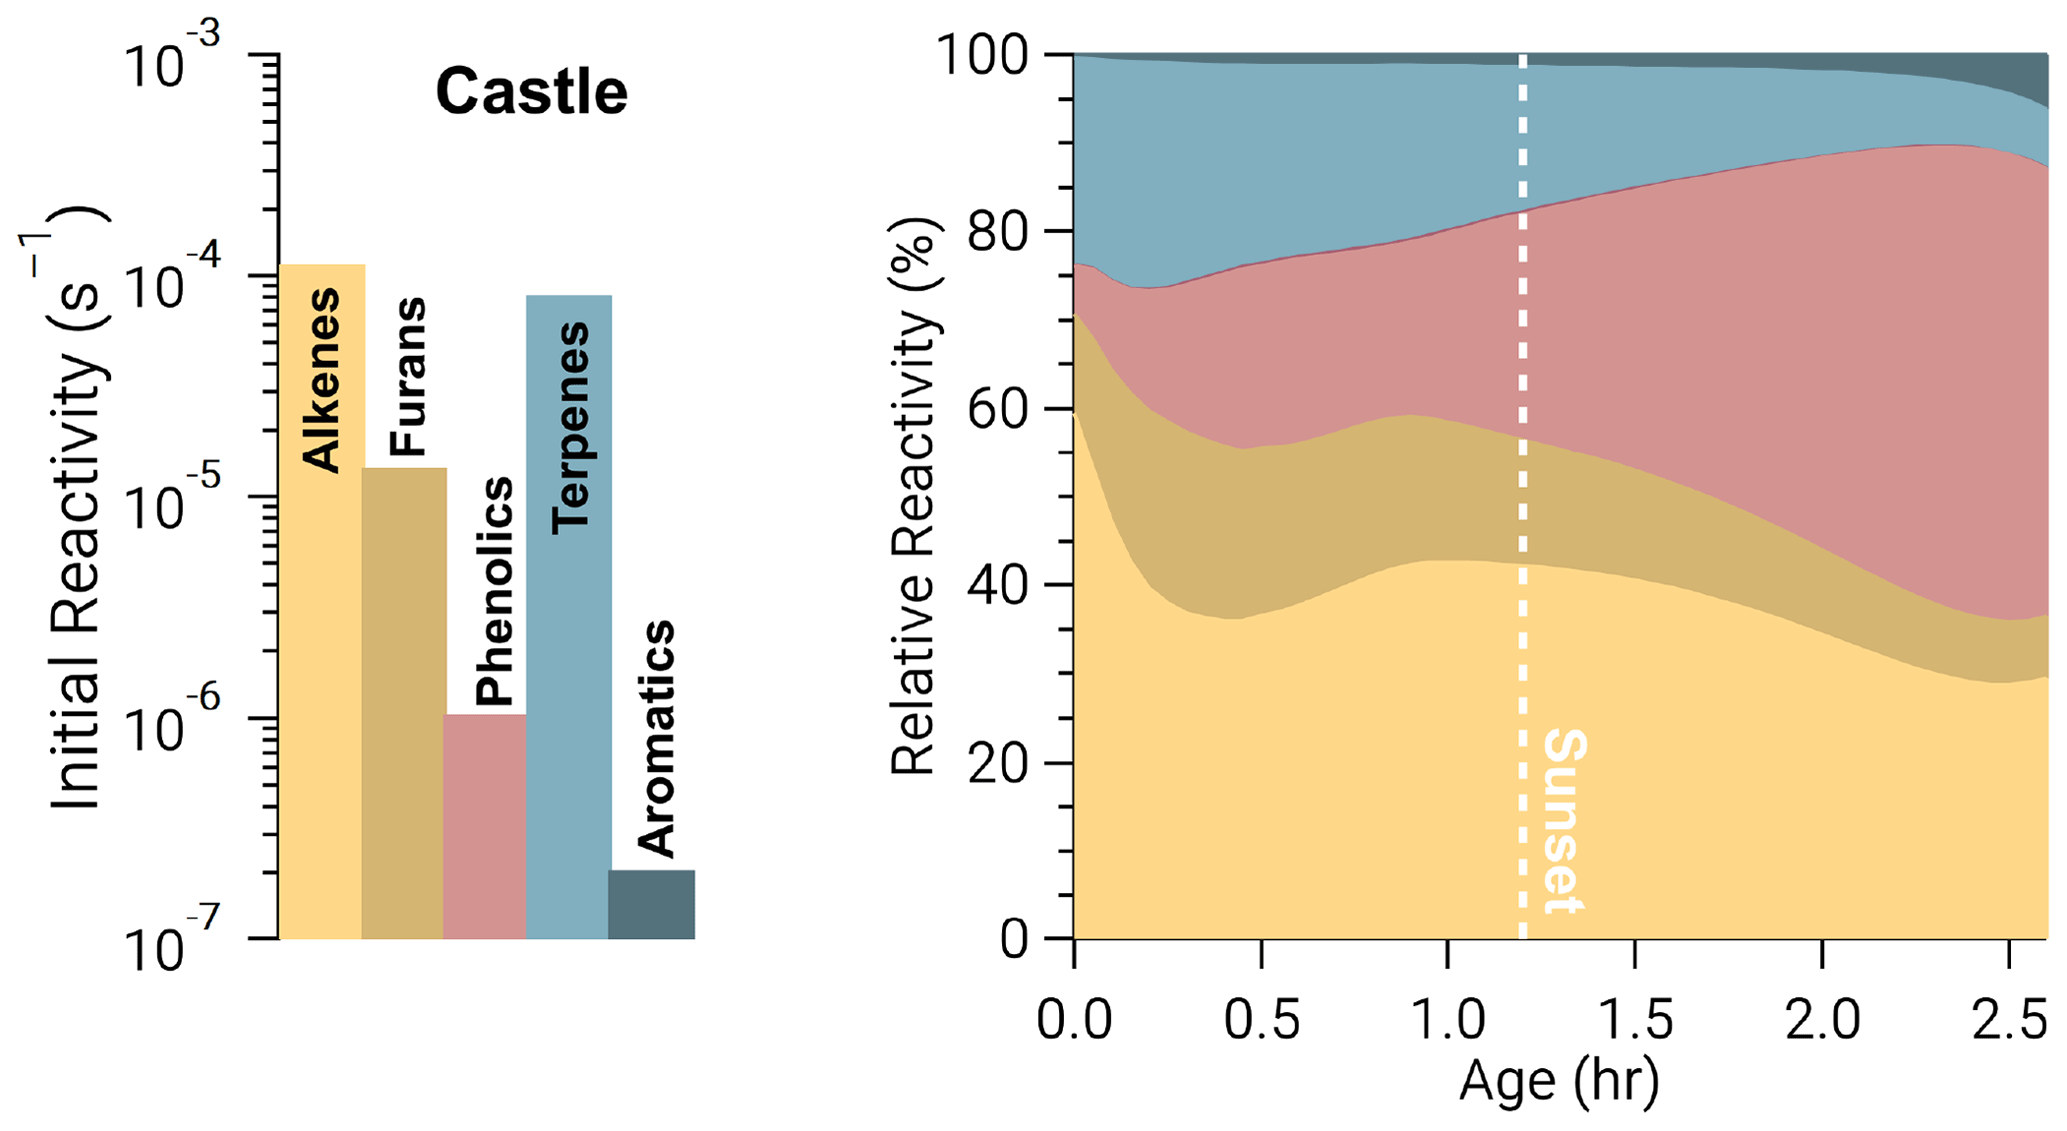
Figure 5Ozone reactivity from the Castle model run in the form of absolute initial reactivity (bars, log scale) and relative BBVOC reactivity as a function of plume age (stacked, linear scale). As the plume ages, O3 reactivity toward each BBVOC group changes significantly.
In contrast to NO3 and O3, loss of OH by each BBVOC group is within 1 % of that predicted by the initial reactivity, except for terpenes. Initial reactivity of terpenes is about 13 %, while actual destruction of OH by terpenes averaged to 8 %. While terpene oxidation by OH is lower than its reactivity in all model runs, it is especially low (2 %) in the WF1 model run, which is likely due to the large concentration of O3 from photochemical production.
Losses of OH are not only due to highly reactive BBVOCs. HCHO, CO, and NO2 are responsible for 12 %–14 % of OH destruction. This is consistent with an OH reactivity analysis from North American fuel types burned during the FIREX laboratory study, which found 13 %±1 % of OH reactivity was due to HCHO, CO, and NO2 (Gilman et al., 2015). The fraction of OH reactivity toward CO and NO2 are similar to those found in a tropical rainforest (Fuchs et al., 2017) but much smaller than the fraction of OH reactivity toward CO (7 %) and NO2 (18 %) found at an urban site (Gilman et al., 2009) and the fraction of OH reactivity toward CO (20 %–25 %) and NOx (12 %–22 %) at a rural site (Edwards et al., 2013).
3.2.2 Oxidant competition
To study the competition between all oxidants, we focus on three main BBVOC groups: phenolics, furans/furfurals, and alkenes/terpenes. Generally, furans/furfurals and alkenes/terpenes groups are mainly oxidized by OH and O3, while NO3 plays a small role (Fig. 6). Oxidation of furans/furfurals and alkenes/terpenes by OH (18 %–55 %, 11 %–43 %, respectively) and O3 (39 %–76 %, 54 %–88 %, respectively) can vary widely depending on the plume. We find this is due to the variability of actinic flux. In model runs with less photolysis at emission, OH oxidation is low compared to model runs that are more optically thin. This reduction of oxidation by OH appears to be replaced by O3 rather than NO3. For example, relative furan/furfural oxidation by OH in the WF1 model run (relatively large integrated jNO2) is 31 % less than that in the Cow model run (comparatively lower integrated jNO2), yet O3 oxidation is 32 % greater.

Figure 6Integrated loss of phenolics (a), furans and furfurals (b), and alkenes and terpenes (c) reacting with NO3 (blue), OH (yellow), and O3 (orange). The model runs are ordered from left to right by decreasing integrated jNO2. Generally, furan/furfurals and alkenes/terpenes are oxidized primarily by O3 and OH. In contrast, phenolic oxidation is split across all oxidants.
This relationship does not hold for phenolics, which are subject to significant NO3 oxidation (26 %–52 %) (Fig. 6). Phenolic oxidation by OH (22 %–43 %) and O3 (16 %–33 %) are slightly less than NO3. As a result, phenolic oxidation by NO3 dominates in the WF1 and Dark model runs, while OH dominates in the Castle model run. In the WF2 and Cow model runs, NO3 and OH oxidation is roughly equal.
Generally, NO3 oxidation of phenolics increases with O3 availability and decreases with available actinic flux, but these relationships are coupled and complex. One example is seen in the WF2 model run, which has the second lowest integrated jNO2 value, and large emissions of NO that keep O3 low during sunlit hours. Therefore, P(NO3) is reduced, NO3 is present at lower mixing ratios within the first hour of oxidation, and phenolics are less subject to NO3 oxidation when compared to the other model runs.
As actinic flux increases so does OH and O3 production, and therefore oxidant competition. One example is shown by the Castle model run where OH leads phenolic oxidation (41 %) with O3 second (33 %). The Castle model run demonstrates the greatest observed background O3 (90 ppbv). Further, the Castle model run has significantly smaller total emissions (based on CO) than the other model runs and the greatest integrated jNO2. Due to the increased background O3 and photochemical production of OH, NO3 plays a smaller role in the oxidation of phenolics.
3.3 Phenolic oxidation and nitrophenolic production
The importance of phenolic oxidation for BB is evidenced by the rapidly growing literature (Bertrand et al., 2018; Chen et al., 2019; Coggon et al., 2019; Decker et al., 2019; Finewax et al., 2018; Gaston et al., 2016; Hartikainen et al., 2018; Iinuma et al., 2010; Lauraguais et al., 2014; Lin et al., 2015; Liu et al., 2019; Meng et al., 2020; Mohr et al., 2013; Palm et al., 2020; Selimovic et al., 2020; Wang and Li, 2021; Xie et al., 2017). Both OH and NO3 oxidation of phenolics leads to nitrophenolics, which have been shown to significantly contribute to SOA production (Palm et al., 2020). However, not all nitrophenolics are created equal. Understanding the competition between phenolic oxidation by NO3 and OH is critical, because their oxidation pathways have significantly different implications for nitrogen budgets and total nitrophenolic yield. Nitrophenolics formed by OH requires one NO2 molecule with a nitrophenolic yield between 27 %–33 %. In contrast nitrophenolics formed by NO3 require two molecules of NO2, have a yield of 85 %–97 % and produce HNO3 as a byproduct (see Fig. S14 in the Supplement and Finewax et al., 2018).
Yet, current phenolic mechanisms are extremely limited. For example, in the MCM nitrophenolics are the only oxidation products of phenolics + NO3 or OH, and the yields are assumed to be 100 %. Phenolic oxidation studies are typically limited to final products without detailed examination of intermediates. Phenol and cresol reactions are well studied in comparison to catechol, methylcatechol, and higher order phenolics. For that reason, we use studies of phenol and cresol oxidation to extrapolate analogous branching ratios, rate coefficients, and products for catechol, methylcatechol, and three isomers of dimethylcatechol. All of these compounds are included in the MCM, but for the purpose of the following analysis we have expanded the phenolic reaction pathways in our model as explained in the Supplement and shown in Fig. S14.
In the remaining sections, we detail how the competition for phenolic oxidation changes as the plume evolves over time. We then discuss the factors that cause differences in nitrophenolic production rate as well as how differences in OH and NO3 phenolic oxidation lead to substantial differences in nitrocatechol yield. Finally, in the following section, we explore how nitrophenolics significantly impact the nitrogen budget.
3.3.1 Evolution of phenolic oxidation
Generally, the modeled total phenolic oxidation rate varies between 1–10 ppbv h−1 at emission (Fig. 7a–d), but the change in oxidation rate is not constant and trends with available actinic flux. Model runs with active initial photochemistry (Castle, WF2, and Cow) exhibit decreasing total oxidation rates, while model runs with little to no photolysis (WF1 and Dark) reach a local maximum rate after ∼2 and ∼5 h, respectively. These increases in oxidation rate are due to increases in O3 and NO3 oxidation once NO is depleted. Generally, the phenolic lifetime increases with decreasing actinic flux. The contrast between day and night phenolic oxidation is best seen by comparing the WF2 and Dark model runs. Phenolic lifetimes in the Dark model run are, on average, a factor of ∼2 greater than phenolic lifetime in the WF2 model run.
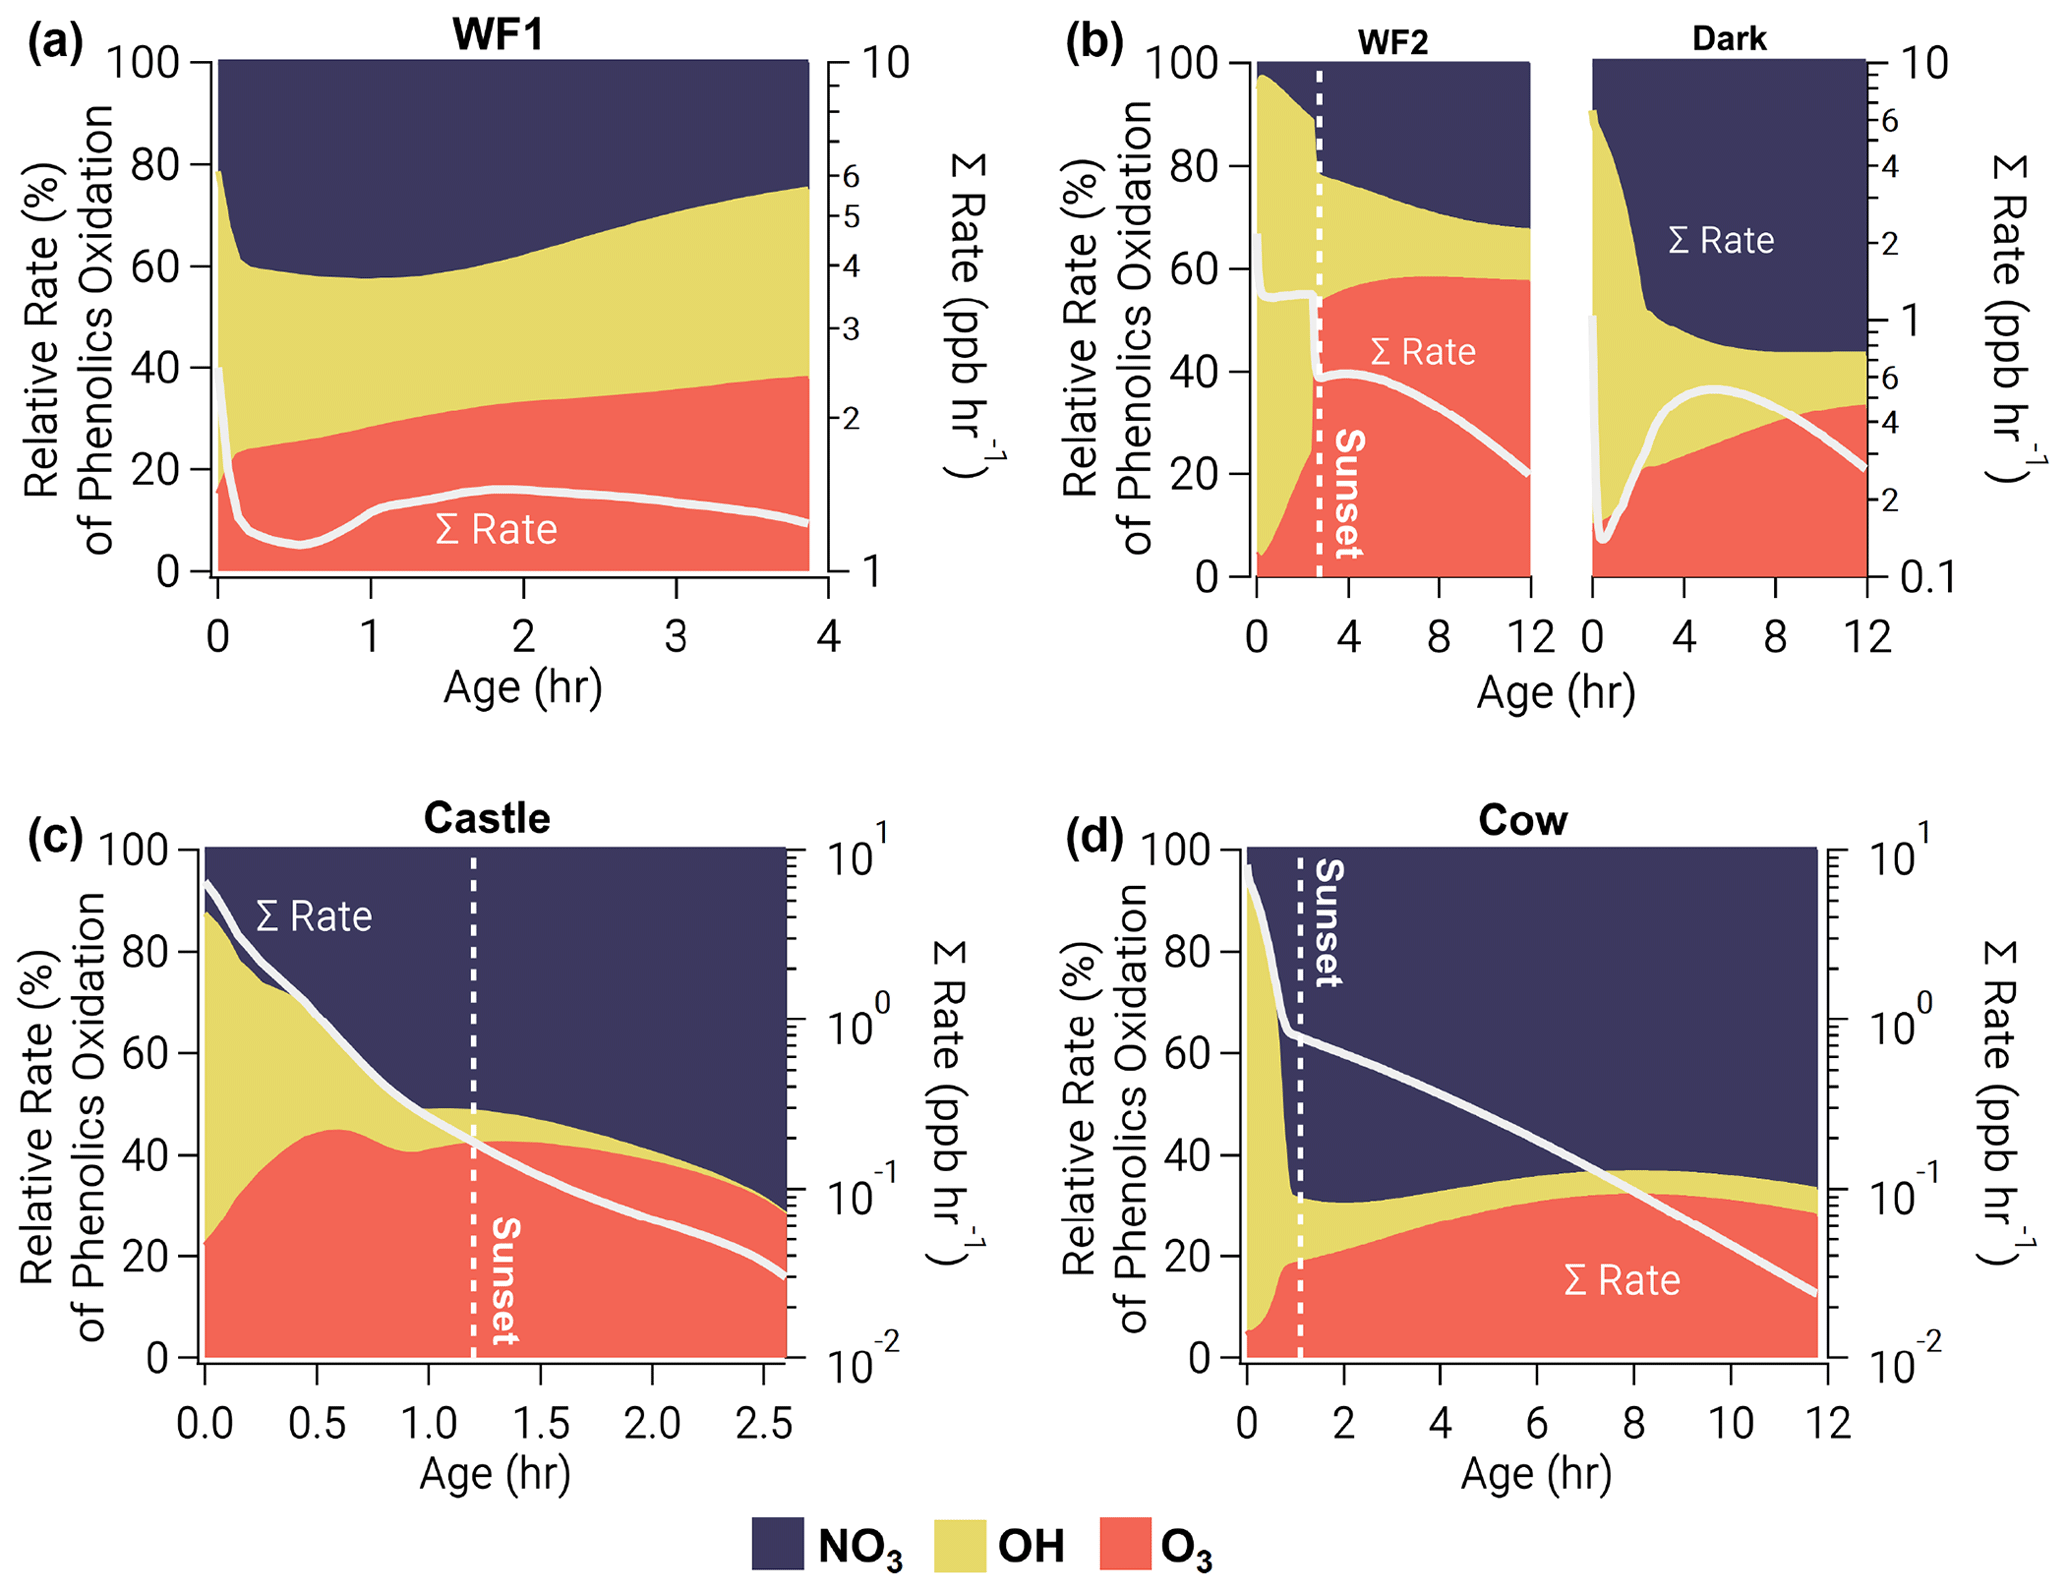
Figure 7Relative oxidation rate (left axis) of phenolics by NO3 (blue, top), OH (yellow, middle), and O3 (orange, bottom) for all model runs as a function of plume age. Right axis shows absolute total reactivity (white line) on a log scale. Phenolic oxidation is controlled by OH at emission but eventually transitions to NO3 oxidation before sunset in the WF1, Castle, and Cow model runs or after sunset in the WF2 model run. Even without photolysis, OH oxidation dominates phenolic oxidation early in the Dark model run.
Before sunset and in early stages of plume oxidation, the major channel of phenolic oxidation is via OH. However, in the WF1 model run NO3 oxidation dominates after only 12 min (Fig. 7a). As the WF1 model run dilutes, photolysis rates increase and O3 is entrained promoting O3 and NO3 production. This increase in oxidant concentration keeps phenolic oxidation >1 ppbv h−1 for at least 4 h before the end of the model (see Sect. 2.3), unlike other model runs that drop below 1 ppbv h−1 of total phenolic oxidation within 0.5–3 h. After 2.6 h, in the WF1 model run, all oxidants contribute equally to phenolic oxidation; thereafter, OH and O3 equally split oxidation, while the influence of NO3 decreases. At the end of the WF1 model run, 69 % of initial phenolics remain unoxidized (Fig. S15 in the Supplement).
As the sun sets in our sunset model runs (WF2, Castle, and Cow), a transition from OH-controlled to a mixture of NO3- and O3-controlled oxidation occurs when OH production and total oxidation rate decrease rapidly. Interestingly, OH dominates phenolic oxidation in the Dark model run (initiated after sunset) for the first 1.8 h before NO3 oxidation takes over. During this time, OH is produced by decomposition of Criegee intermediates formed through ozonolysis of unsaturated hydrocarbons, primarily catechol (Fig. S14), methylcatechol and limonene. In other sunset model runs, OH plays a smaller role after sunset. Even so, this suggests that all BBVOC oxidation after sunset is driven by O3 chemistry, either through direct oxidation by O3, NO2+O3 to form NO3, or by formation and decomposition of Criegee intermediates to form OH.
The WF2, Dark, and Cow model runs all contain unreacted phenolic emissions at sunrise the following day (48 %, 61 %, and 8 %, respectively, Fig. S15). The WF2 and Dark model runs have significantly more phenolics that remain at sunrise because of their larger (∼3 times) emissions compared to the Cow model run. Further, the WF2 and Dark model run conditions differ only by the presence of photolysis; therefore, the difference in remaining phenolics between the WF2 and Dark is due to the time of day the smoke was emitted. In contrast to these three model runs, the emissions in Castle are depleted within 2.6 h due to its small size.
3.3.2 Total nitrophenolic formation
Nitrophenolic formation increases with O3 and photolysis, which promotes formation of NO3 and OH. For example, the Castle and Cow model runs have relatively large O3 and jNO2 at emission and therefore form nitrophenolics rapidly (0.6–1.4 ppbv h−1 within the first 15 min). In contrast, the WF and Dark model runs have near zero O3 due to large emissions of NO and relatively low or zero jNO2 and therefore form nitrophenolics more slowly (<0.1–0.7 ppbv h−1 within the first 15 min).
Despite the rapid formation of nitrophenolics in the Castle model run, it has the least (excluding WF1) total nitrophenolic formation relative to total emissions as seen in Fig. 8. Figure 8 shows integrated nitrophenolic formation per emitted ppmv of CO, which allows us to compare total nitrophenolic formation across varying plume sizes. In contrast to the Castle model run, the Cow model run has the greatest nitrophenolic formation. These differences are the result of differing phenolic oxidation pathways. The Castle model run has a large (90 ppbv) O3 background, which results in O3 accounting for ∼40 % of phenolic oxidation between 30 min–2 h of age (Fig. 7c). At the end of the Castle model run (2.6 h), O3 oxidation accounts for 33 % of total phenolic loss, the largest of any model run (Fig. 6). This is markedly different than the Cow model run where OH and NO3 chemistry control phenolic oxidation before sunset and NO3 after. While O3 accounts for only 16 % of phenolic loss at the end of the model run (∼12 h). In our model, the reaction of O3 + phenolics forms a ring-opening product (Fig. S14), but the rate coefficients and mechanisms are largely uncertain as discussed in the following section.
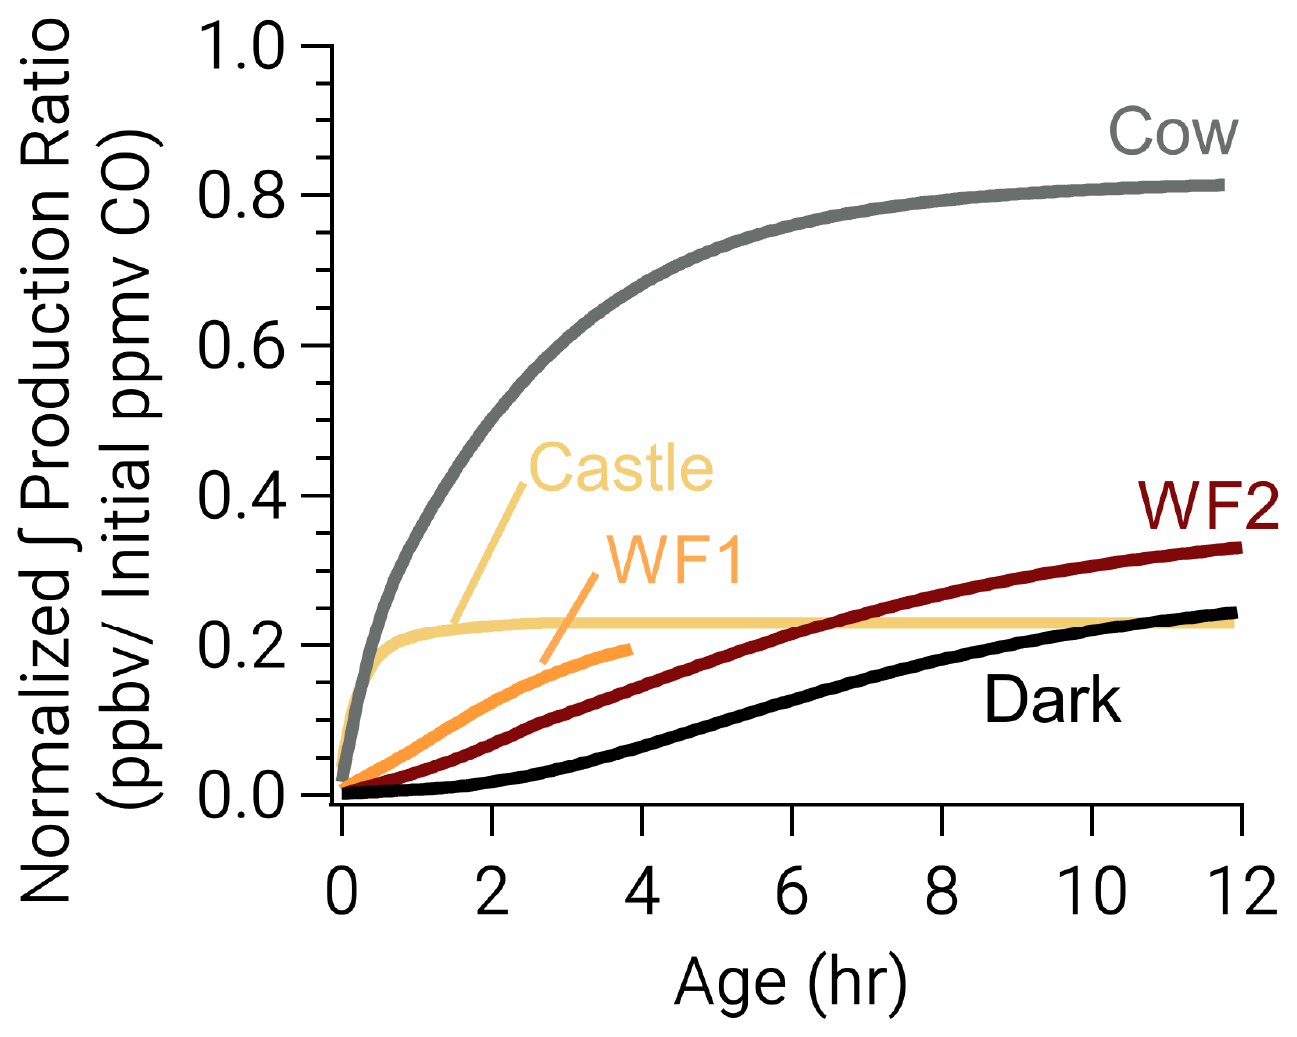
Figure 8Integrated nitrophenolic production normalized to initial CO to compare nitrophenolic production across varying amounts of initial emissions. The simulated Castle and Cow plumes form nitrophenolics quickly. Even so, the Castle plume forms less nitrophenolics than other runs.
We include 157 phenolics in our above analysis, but only a few phenolics account for large fractions of nitrophenolic formation. At the end of our model runs, catechol and methylguaiacol account for the largest fraction of phenolic oxidation. Both compounds are mostly oxidized by NO3. Catechol + NO3 alone accounts for 10 %–16 % of total phenolic oxidation rate or 30 %–32 % of NO3 + phenolic oxidation. Similarly, methylguaiacol accounts for 22 %–26 % of NO3 + phenolic rates and is the largest fraction of phenolic oxidation by OH (17 %–18 % of OH + phenolic rates). However, to our knowledge, oxidation products of methylguaiacol by OH and NO3 are unknown but likely lead to nitrophenolics; therefore, our nitrophenolic formation rates are likely underestimated.
3.3.3 Nitrocatechol yield
The reaction of OH and NO3 with catechol to form nitrocatechol accounts for the largest fraction (32 %–33 %) of total nitrophenolic formation. Therefore, here, we focus on nitrocatechol and detail the nitrocatechol yield from NO3 and OH + catechol. Understanding nitrocatechol yield and its sensitivities is important to understanding the fate of NOx and NOx lifetime discussed in the final sections. However, the nitrocatechol yield depends on many variables such as the concentrations of NOx, BBVOC, O3, and the NOxBBVOC ratio as well as the certainty in our chemical mechanisms. Therefore, we discuss the sensitivity of all of these factors on nitrocatechol yield below.
Yields of nitrocatechol vary between 33 %–45 % depending on the model run, where NO3 is responsible for 72 %–92 % of nitrocatechol (Fig. 9a). Figure 9 explores factors that govern nitrocatechol yield, defined as the molar ratio of nitrocatechol production to catechol destruction. Yields of nitrocatechol from OH are low relative to NO3 yield due to the formation of trihydroxybenzene and benzoquinones (Fig. S14), which account for 10 %–32 % and 4 %–5 % of total catechol loss, respectively.

Figure 9(a) Nitrocatechol yield for all model runs colored by the fraction of nitrocatechol formed from NO3 and OH oxidation of catechol. Panels (b)–(e) are shown for the Cow model run, which is representative of all other runs. (b) Two overlaid contour plots of VOCNOx ratio (white lines and white text) and nitrocatechol yield (color scale), with black cross sections that intersect at the observed Cow conditions. (c) A cross section of (b) for nitrocatechol yield as a function of NOx (horizontal black line). (d) A cross section of (b) for nitrocatechol yield as a function of BBVOC factor, a multiple of the initial VOC emissions (vertical black line). (e) Nitrocatechol yield as a function of initial O3. Green dots in (c–e) indicate observed conditions used for the model run. Nitrocatechol is primarily formed from NO3, and the yield increases with increasing NOx but decreases with increasing BBVOC and BBVOCNOx ratio. Ozone has little effect on nitrocatechol yield.
The largest yield (45 %) is from the Dark model run, where NO3 oxidation accounts for more than 52 % of phenolic oxidation. In contrast, the lowest yield of nitrocatechol is from the Castle model run (33 %), which has the lowest emissions of NOx compared to the other model runs. A similar yield (34 %) is found in the WF1 model run; however, this model ends after only 4 h when 69 % of phenolics still remain. In short, nitrocatechol yield increases with increasing fraction of phenolic oxidation by NO3.
To understand the dependence of nitrocatechol formation on O3, NOx, total BBVOC emissions (defined by the sum of ERs in our BBVOC inventory), and BBVOCNOx, we ran a sensitivity analysis on the nitrocatechol yield (Fig. 9b–e). Based on emitted NOx and CO, BBVOCNOx ratios in plumes we sampled range from 11–35. However, due to fire variability, BBVOC emissions can vary by at least a factor of 2 and for many BBVOCs by more than a factor of 10 from our emission ratios (Decker et al., 2019). Furthermore, we only account for BBVOCs that are most reactive to O3, OH, and NO3, which is smaller than total emitted BBVOCs.
The nitrocatechol yield generally decreases with increasing BBVOCNOx (color scale and white lines in Fig. 9b). As expected, nitrocatechol yields increase with increasing NOx (Fig. 9c). Across all model runs, the nitrocatechol yield increases to 43 %–57 % over a NOx range of 4.2–91.2 ppbv. Further, the nitrocatechol yield changes to 27 %–50 % (Fig. 9d) when varying total BBVOC emissions by a factor from 4 to 0.5. Finally, we investigate the sensitivity of nitrocatechol yield to initial O3 and find that all model runs have little sensitivity to O3 (Fig. 9e) with an absolute change in nitrocatechol yield <3 % for all model runs when varying initial O3 over a range of 0–113 ppbv.
The low sensitivity of nitrocatechol yield to O3 may be partially explained by competition between O3 and NO3 + phenolic reactions after sunset. To explore this, we use a framework developed by Edwards et al. (2017). Briefly, as stated in Sect. 3.2.1, BBVOCs are the main sink for NO3; therefore, the NO3 loss rate is controlled by the NO3 formation rate. As a result, NO3 can be considered to be in approximate steady state between production by NO2 + O3 and loss by NO3 + BBVOC. Further, according to Fig. 4, the majority of NO3 is lost to phenolics. As a result, the rate of phenolic oxidation after sunset (when OH oxidation of phenolics is minimized) can be approximated as
which shows that the dominant oxidant is determined by the ratio of NO2 and phenolics. We find that the ratio of phenolics to NO2 at which NO3 and O3 oxidation is equal to be ∼10 (at 298 K, using an ER-weighted average ) with NO3 oxidation more important below this ratio and O3 oxidation more important above it. Modeled phenolicsNO2 ratios at sunset range between 0.7–1.2, and in all model runs, except the Castle model run, the ratio decreases with age. This suggests that in all model runs NO3 oxidation is expected to control phenolic oxidation after sunset.
The phenolic oxidation analysis above relies on phenolic mechanisms and rate coefficients that are highly uncertain. For example, the above-calculated ratio could be much lower in cold lofted plumes, but knowledge of temperature-dependent O3 + phenolic rate coefficients () are unavailable. Using temperatures observed in the WF2 plume (∼268 K) for (but using at 298 K), the phenolics to NO2 ratio at which NO3 and O3 oxidation is equal would be ∼4.
The rate coefficient and products for the reaction of catechol + O3 that we use are generated using the MCM methodology (Jenkin et al., 2003; Saunders et al., 2003). An experimental study on the gas-phase reaction of catechol + O3 finds an RH-dependent rate coefficient that decreases nonlinearly from to with increasing RH (El Zein et al., 2015). The MCM uses a rate coefficient of . Further, to our knowledge there are no experimental kinetic or mechanistic studies of phenol + O3. In the plumes we investigate, RH varied between roughly 20 %–60 %. Using an RH-dependent rate coefficient for O3 + catechol, we find that the nitrocatechol yields range between 31 %–58 % with little change in yield for the Castle model run (−2 %) and larger change for the Dark model run (+13 %).
3.4 Fate of NOx in dark BB plumes
Fire emissions are concentrated sources of NOx, but as a result of photochemistry and oxidation the loss processes and lifetime of plume NOx are variable. Photochemical NOx loss pathways include reaction with OH (Reaction R8), net formation of peroxyacyl nitrates (PANs) (Reaction R9), and formation of organic nitrates (Reaction R10).
The NOx rate consumption is further influenced by the formation and the subsequent fate of NO3 (Reactions R1–R4, R6–R7). Heterogeneous uptake of N2O5 (Reaction R5) and production of nitrophenolics double the NOx consumption rate since in both cases subsequent chemistry consumes one additional NO2 molecule, with the rate-limiting step being Reaction (R3). Below, we focus on the products of NOx oxidation, determined as .
Results are similar for all model runs, and we discuss the WF2 model run as a case study. While a complete NOz budget analysis constrained to observations is beyond the scope of this work, we compare our model results of peroxyacetyl nitrate (a component of PANs) to observations (Figs. S8 and S12). Peroxyacetyl nitrate accounts for ∼65 % of PANs, and PANs account for the largest fraction of NOz in our model runs during sunlit hours. Our model reproduces peroxyacetyl nitrate well in one transect but underpredicts peroxyacetyl nitrate by a factor of ∼2.5 in others. Similar to O3 (Sect. 2.3.2), peroxyacetyl nitrate is enhanced on plume edges and the enhancement likely mixes into the center, which is not captured by our model runs. Therefore, we constrain our model to peroxyacetyl nitrate observations, present an average result (Fig. 10), and consider our model unconstrained to peroxyacetyl nitrate to be a lower-bound peroxyacetyl nitrate estimate and our model constrained to peroxyacetyl nitrate to be an upper-bound peroxyacetyl nitrate estimate.
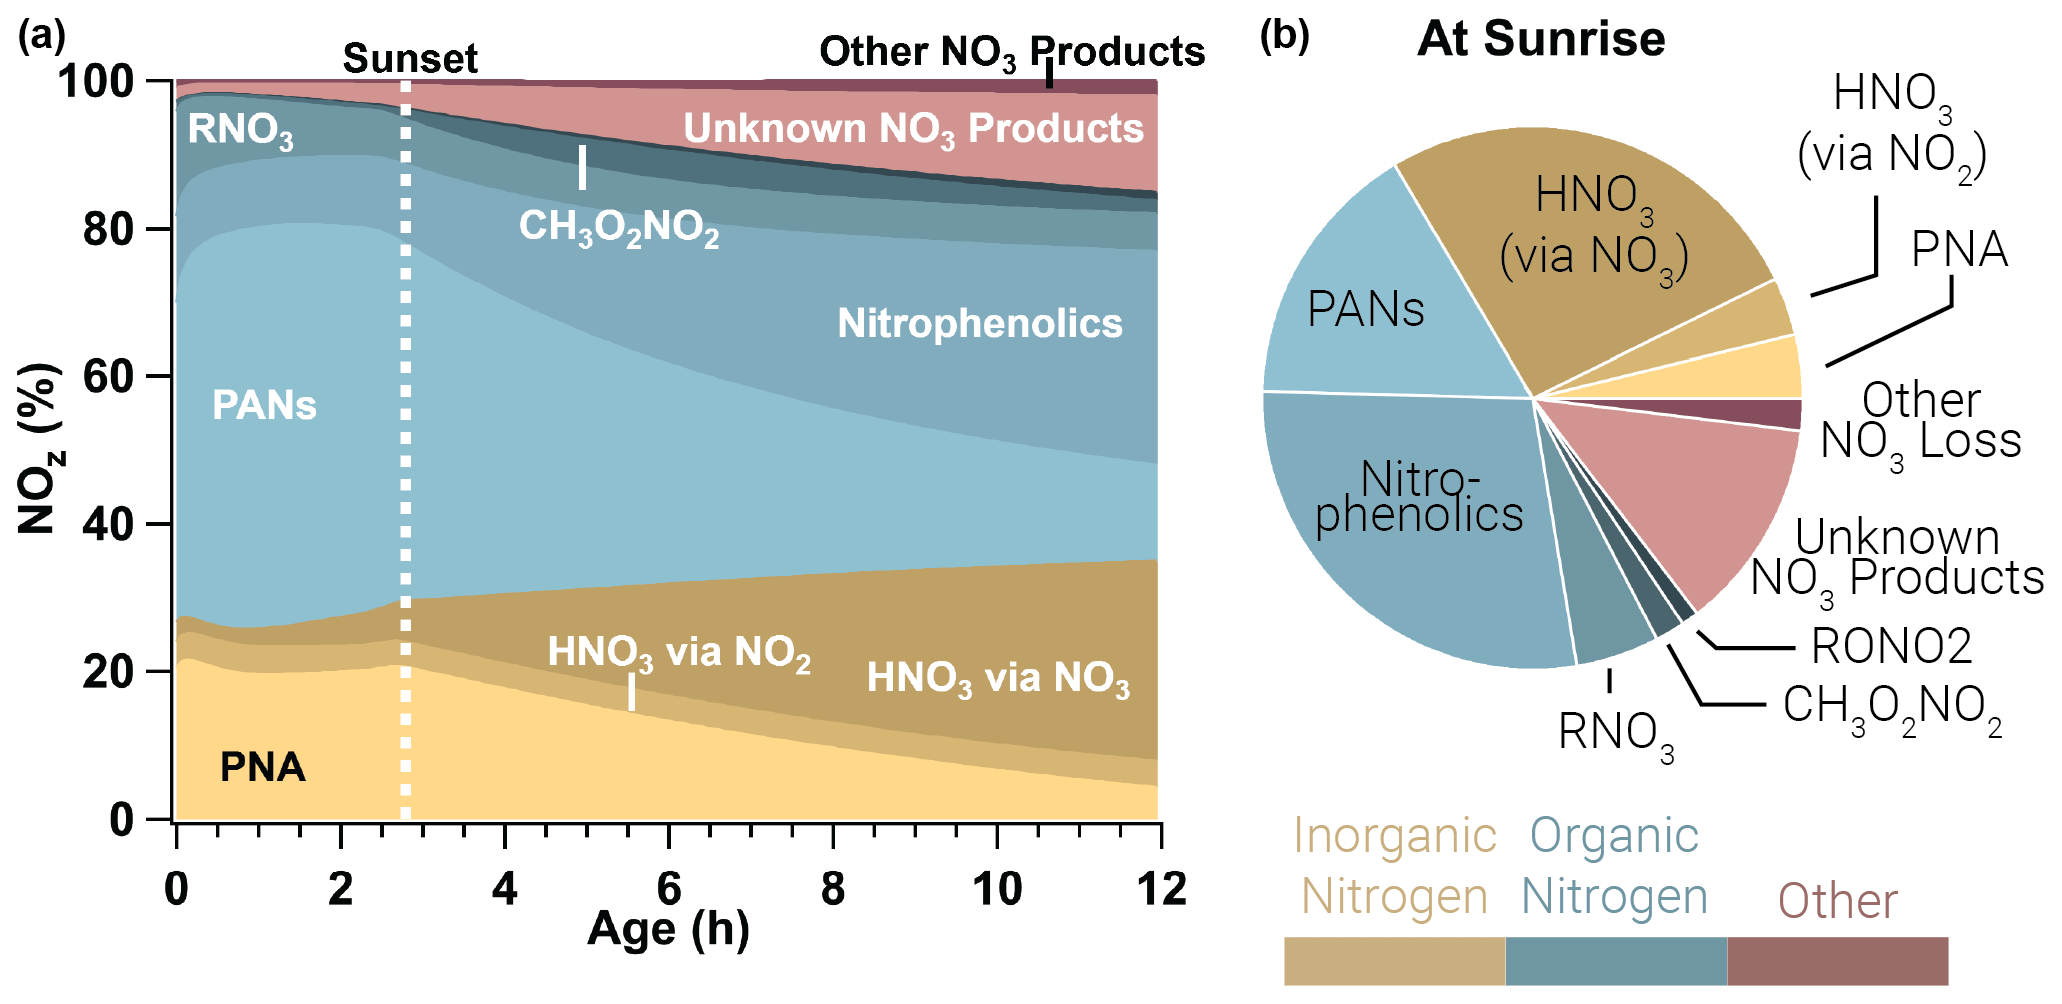
Figure 10Relative integrated NOx reservoirs and sinks for the WF2 model run as a function of plume age (a) and at sunrise (b). This result is the average between a WF2 model run constrained and unconstrained to peroxyacetyl nitrate observations as explained in the main text. Gold colors indicate inorganic nitrogen, blue colors indicate organic nitrogen, and red colors indicate other forms of NOz. In this analysis we consider HONO to be a member of NOx rather than NOz. PANs and PNA dominate NOz during the daytime, but after sunset these decompose to provide NO2 that is subsequently lost to nitrophenolics and other NO3 products overnight.
3.4.1 NOz budgets
The evening emitted plumes modeled in this paper exhibit photochemical loss of NOx initially. In the period prior to sunset, PANs and PNA (peroxynitric acid, HO2NO2) dominate NOz, and PANs alone account for 51 %±6 % of NOz by sunset. The WF2 plume is lofted and therefore cold (∼267 K), which results in a long peroxyacetyl nitrate and PNA lifetime (∼150 h, and ∼0.4 h, respectively, calculated from the model directly; Atkinson et al., 2006). Even so, as these plumes continue to age, PANs and PNA decompose slowly (Fig. 10) to provide NO2 that promotes nitrophenolic formation and increases nitrophenolic yield (see Sect. 3.3.3). The increase in NO2 after sunset promotes methyl peroxynitrate (CH3O2NO2) as well as NO3 chemistry products, which grow steadily overnight. The contribution of PANs and PNA to NOz decreases from 71 %±6 % at sunset to 17 %±2 % at sunrise. Relative NOx loss to PANs and PNA is mostly replaced by the formation of nitrophenolics (Δ 19 %±1 %), HNO3 by NO3 chemistry (Δ 22 %), and other or unknown NO3 products (Δ 11 %) overnight.
After sunset NO3 chemistry takes over, and by sunrise NO3 chemistry products lead the (66 %±2 %) NOz budget. Nitrophenolic formation accounts for 56 %±2 % of NOz in the form of HNO3 and nitrophenolics where nitrophenolics alone account for 29 %±1 % of NOz. Total HNO3 formation accounts for 31 %±1 % of NOz; however, most (88 %) of the HNO3 results from NO3 chemistry. Despite accounting for only 9 % (by mole) of initial emissions in our model runs, phenolics have a large and disproportionate effect on NOx loss at night.
A similar example is seen in the Dark model run (Fig. S18 in the Supplement), where PANs and PNA dominate NOz budget for 2.3 h until NO is depleted. At this time, PNA and PANs steadily decrease, while NO3 products steadily increase throughout the night. By sunrise the next day, NO3 chemistry products (including unknown products) account for 80 % of NOz. In all model runs there is a significant (12 %–16 %) NOz formed through NO3 chemistry that leads to unknown products. These unknown products are primarily the result of NO3 + heterocycles such as furans and pyrroles, which have published rate coefficients but little mechanistic work in the literature.
Our NOz budget generally agrees with the NOy budget of western US wildfire smoke sampled during the 2018 Western wildfire Experiment for cloud Chemistry, Aerosol absorption and Nitrogen (WE-CAN) presented by Juncosa Calahorrano et al. (2020). Generally, the maximum fraction of PANs in our budget (∼50 %) agrees with Juncosa Calahorrano et al. (∼40 %) within our model uncertainties. Comparisons of particulate nitrate and organic nitrogen (gas or particulate) between our model run and the analysis of Juncosa Calahorrano et al. (2020) are uncertain since our model does not account for gas–particle partitioning of nitrophenolics. Our model begins to deviate from the NOy budget trend seen by Juncosa Calahorrano et al. (2020) once the sun sets, as expected.
3.4.2 NOx lifetime
The availability of O3 and sunlight at emission strongly affects NOx lifetime (, Fig. 11) defined below
where ki is a unimolecular rate coefficient for Reactions (R3) and (R8)–(R10). Model runs with relatively large photolysis and O3 at emission (Castle, Cow, and WF1) have near-emission values that range from 1–3 h (Fig. 11), which are accompanied by larger total oxidation rates for all BBVOCs (Figs. S15–S17). These model runs also exhibit the fastest nitrophenolic formation rates (Sect. 3.3.2 and Fig. 8). In contrast model runs with low or zero photolysis and near-zero O3 (WF2 and Dark) exhibit near-emission values of –16 h and –150 h, respectively. The absence of photolysis in the Dark model run explains the large difference in between the WF2 and Dark model runs as the WF2 model run has greater O3 and P(NO3) that promotes NO3 chemistry as well as OH radical that promotes PANs formation. In short, we find that “daytime” conditions have shorter NOx lifetimes, greater rates of BBVOC oxidation, and greater rates of nitrophenolic formation when compared to “nighttime” conditions.
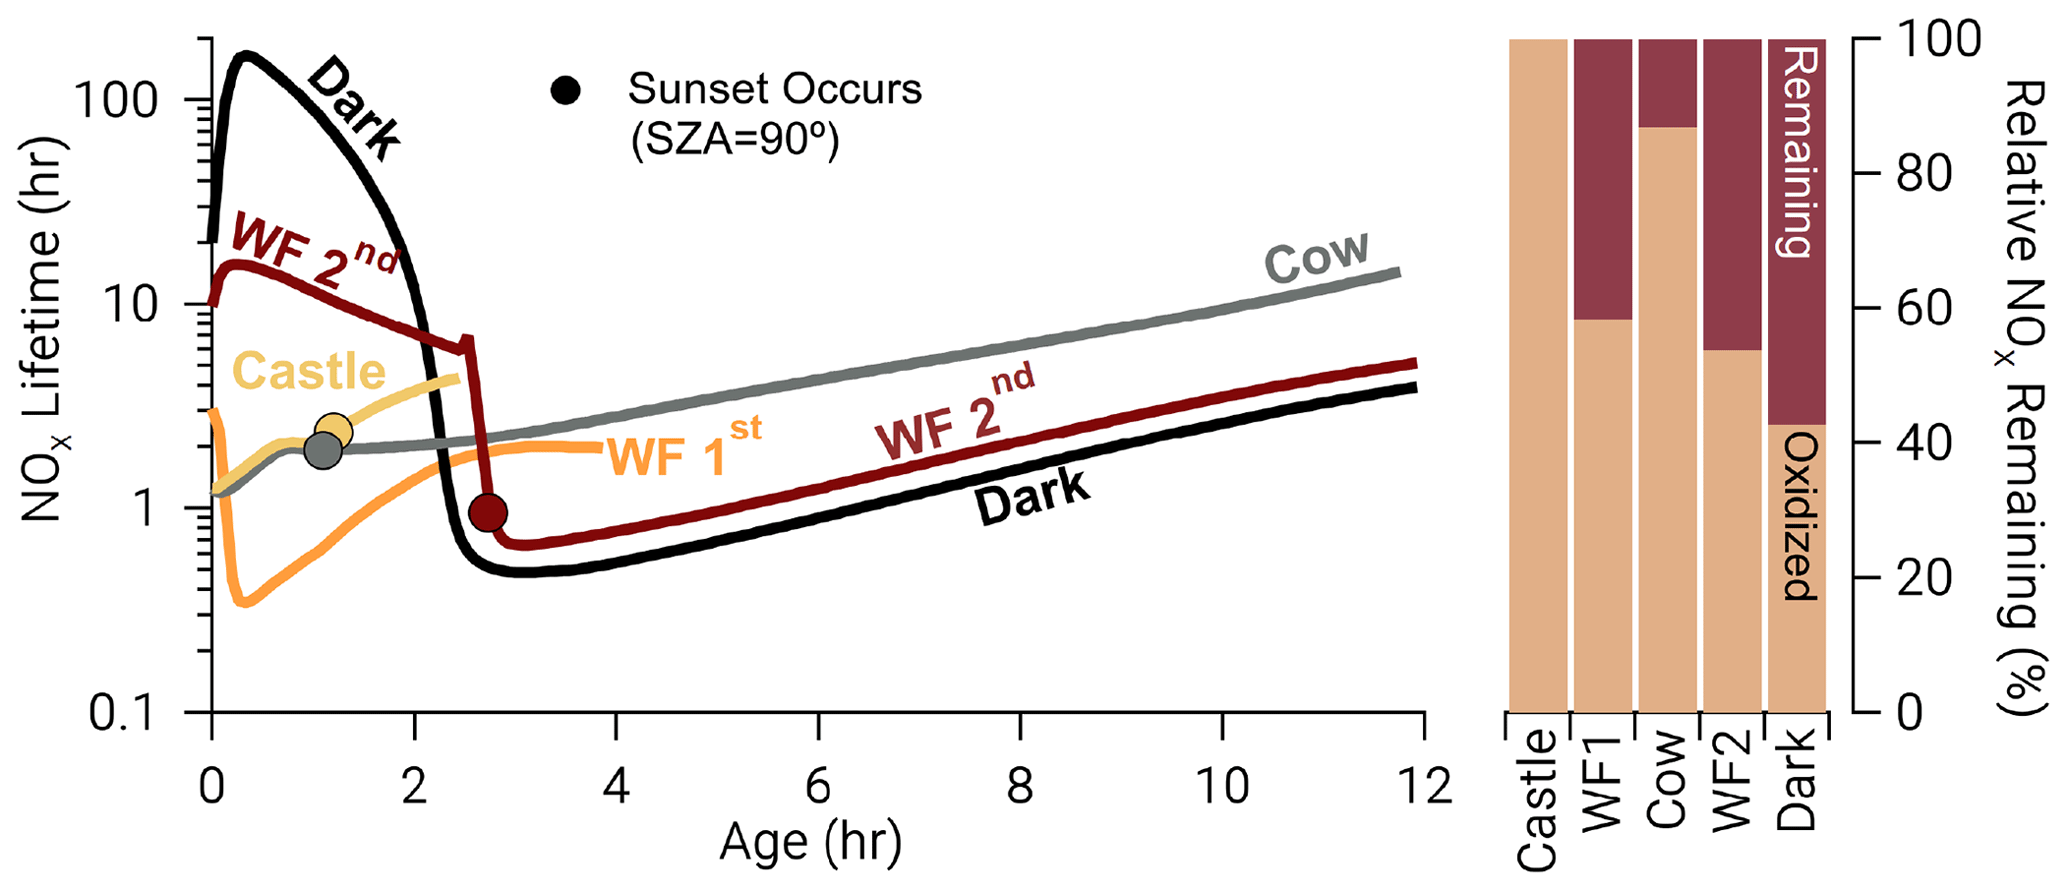
Figure 11Time series: NOx lifetime in hours on a log scale for all model runs where closed circles indicate the time of sunset (solar zenith angle = 90∘). Bars: the relative NOx remaining calculated as the fraction of NOx remaining at the end of our model divided by the amount of NOx that was reacted, excluding dilution. After the depletion of NO, NOx chemistry changes dramatically in the WF2 and Dark model runs, reducing NOx lifetime rapidly. A significant amount of NOx remains in the WF2 and Dark model runs at sunrise, providing potential for significant morning chemistry to occur.
Once NO is depleted in both model runs, NOx chemistry changes. The BBVOC oxidation rate rapidly increases (Figs. S15–S17), and NOx loss switches from primarily PANs and PNA to nitrophenolic production as the sun sets (Fig. 10), and O3 is entrained from the background. As such, decreases markedly to ∼0.5 h.
Due to their reduced oxidation rates at emission, the WF2 and Dark model runs retain about half (46 % and 57 %, respectively) of the emitted NOx by sunrise the next day. Here, we calculate remaining NOx as the fraction of NOx remaining at the end of our model divided by the amount of NOx that was reacted, excluding dilution. This is about a ratio of ∼4 ppbv ppmv−1 at sunrise, which is similar to the initial emissions of Castle (∼6 ppbv ppmv−1) and WF1 (∼5 ppbv ppmv−1). Further, at sunrise, we expect the WF2 and Dark plumes to be more optically transparent and free of NO and thus oxidation rates to increase rapidly as they both still contain NOx. An increase in oxidation at sunrise will likely be more important for the Dark model run, as it retains 61 % of the emitted phenolics as opposed to 48 % in the WF2 model run. Plumes emitted after sunset have slower oxidation rates compared to daytime plumes (Sect. 3.2) but undergo additional oxidation from evening to morning. However, outside of the plume center, where O3 is less effected by reaction with NO and is more likely to be generated by photochemical production, NOx loss rates may be much larger. Therefore, NOx away from the plume center will likely be depleted more rapidly.
This study details the competitive oxidation of BBVOCs in four near-sunset or low-photolysis smoke plumes sampled by NOAA Twin Otter or NASA DC-8 aircraft during the FIREX-AQ 2019 field campaign. We model these plumes, as well as a theoretical dark plume, using an observationally constrained 0-D chemical box model.
Our key findings and arguments are summarized below.
-
Sect. 2.4: Observations and model comparison
-
Our model achieves agreement with observed CO and O3 typically within a difference of 10 %. However, strong O3 gradients between plume center and edge can cause larger differences, specifically in the WF2 model run.
-
Absolute differences between the model and observations of NOx and HONO are generally <1 ppbv but can be as large as 3.4 ppbv.
-
In most cases, BBVOC comparisons show that the model and observations agree within a factor of ∼ 2 if not within observation errors.
-
Model and observation agreement for phenolics and nitrophenolics is only available for two model runs (Castle and Cow); most comparisons agree within observation errors, but some disagree by as much as a factor of 60.
-
-
Sect. 3.1: Reactivity
-
Our model suggests that OH is reactive to most BBVOCs, while NO3 is most reactive to phenolics and O3 to alkenes and terpenes.
-
Unlike urban plumes, NO3 loss to NO, photolysis and heterogeneous uptake are negligible loss pathways. Most (≥97 %) of the NO3 loss occurs through BBVOC oxidation.
-
Reactivity of OH and O3 is similar to or greater than urban plumes, but NO3 reactivity is a factor of 10–104 greater than typical urban plume reactivity.
-
-
Sect. 3.2: Oxidation rates
-
Initial reactivity is a good indicator for subsequent oxidation by OH but not for NO3 and O3.
-
Phenolics are the only BBVOC group for which oxidation by NO3, OH, and O3 is competitive.
-
The nitrate radical is responsible for 26 %–52 % of phenolic loss and leads (36 %) phenolic oxidation in an optically thick midday plume.
-
-
Sect. 3.3: Phenolic oxidation and nitrophenolic production
-
All phenolic oxidation after sunset is dependent on O3, whether through direct oxidation by O3, production of NO3 by NO2 + O3, or ozonolysis of unsaturated hydrocarbons and subsequent decomposition to OH radicals.
-
Yields of nitrocatechol vary between 33 %–45 %.
-
Nitrate radical chemistry is responsible for 72 %–92 % (84 % in an optically thick midday plume) of nitrocatechol formation and controls nitrophenolic formation overall.
-
-
Sect. 3.4: Fate of NOx in dark BB plumes
-
Formation of nitrophenolics by NO3, as opposed to OH, is the largest NOx sink and accounts for most of the inorganic and organic nitrogen at the end of the night.
-
Nitrophenolic formation pathways account for 58 %–66 % of NOx loss by sunrise the following day.
-
While both PANs and PNA account for most of the NOx loss shortly after emission, they decompose overnight, providing a NOx source for nitrophenolic formation, and increase nitrocatechol yield.
-
In short, NO3 chemistry should be considered, even during the daytime, when investigating BB plume oxidation as we find it is the main source of nitrophenolic formation in plumes studied here and thus may be a dominant pathway to SOA formation.
Box modeling was performed using the Framework for 0-D Atmospheric Modeling (F0AM). Details on downloading F0AM can be found at Wolfe et al. (2016; https://github.com/AirChem/F0AM).
Field data used can be downloaded from https://www-air.larc.nasa.gov/missions/firex-aq/index.html (NASA, 2021). Emission ratio data can be found in the supplement of Decker et al. (2019).
The supplement related to this article is available online at: https://doi.org/10.5194/acp-21-16293-2021-supplement.
FIREX-AQ data were measured and processed by the following people: UW I− HR ToF CIMS (ZCJD, CDF, BBP, JAT); Tenax (KCB, PVR); Picarro G2401m (MAR, SSB); NCAR CL (FMF, DDM, GST, AJW); UHSAS (AF, AMM); jNO2 on the Twin Otter (MAR); CO by diode laser (JPD, GSD, HH, JBW); CO by CES (JP); NOAA CL (IB, JP, TBR); ACES (SSB, MAR, JL, RAW, CW); NOAA LIF (PSR, AWR); NOAA I− ToF CIMS (JAN, PRV); peroxyacetyl nitrate (LGH, YRL); UIBK PTR ToF MS (FP, AW, GIG, KS, CS, MMC); SMPS/LAS (RHM, LT, El. Wi, Ed Wi); CAFS (SH, KU); and smoke ages (CDH). Updates to the phenolic mechanism were performed by MMC, ZCJD, MAR, RHS. Model runs were conducted by ZCJD. Preparation of the article was done by ZCJD with contributions from coauthors.
The authors declare that they have no conflict of interest.
Publisher's note: Copernicus Publications remains neutral with regard to jurisdictional claims in published maps and institutional affiliations.
Support for the UIBK PTR ToF MS came from Ionicon Analytik; Tomas Mikoviny provided technical assistance. Laura Tomsche and John Nowak supported the UIBK PTR ToF MS team as well. Thank you to Alan Fried, Dirk Richter, Jim Walega, and Petter Weibring for use of their HCHO measurements. A big thank you to all of those who helped organize and participated in the 2019 FIREX-AQ field campaign, specifically the NOAA Aircraft Operations team, including Francisco Fuenmayor, Joe Greene, Conor Maginn, Rob Miletic, Joshua Rannenberg, and David Reymore.
Kelley C. Barsanti and Paul Van Rooy were supported by the NOAA OAR Climate Program Office (AC4 award number NA16OAR4310103). Carley D. Fredrickson, Brett B. Palm, and Joel A. Thornton were supported by the NOAA OAR Climate Program Office (award number NA17OAR4310012). The UIBK PTR-ToF-MS instrument was partly funded by the Austrian Federal Ministry for Transport, Innovation and Technology (bmvit) through the Austrian Space Applications Programme (ASAP) of the Austrian Research Promotion Agency (FFG). Felix Piel received funding from the European Union's Horizon 2020 research and innovation program under grant agreement no. 674911 (IMPACT EU ITN). Zachary Decker received funding through a graduate research award from the Cooperative Institute for Research of Environmental Sciences.
This paper was edited by Manabu Shiraiwa and reviewed by two anonymous referees.
Abatzoglou, J. T. and Williams, A. P.: Impact of anthropogenic climate change on wildfire across western US forests, P. Natl. Acad. Sci. USA, 113, 11770–11775, https://doi.org/10.1073/pnas.1607171113, 2016.
Akagi, S. K., Yokelson, R. J., Wiedinmyer, C., Alvarado, M. J., Reid, J. S., Karl, T., Crounse, J. D., and Wennberg, P. O.: Emission factors for open and domestic biomass burning for use in atmospheric models, Atmos. Chem. Phys., 11, 4039–4072, https://doi.org/10.5194/acp-11-4039-2011, 2011.
Akherati, A., He, Y., Coggon, M. M., Koss, A. R., Hodshire, A. L., Sekimoto, K., Warneke, C., De Gouw, J., Yee, L., Seinfeld, J. H., Onasch, T. B., Herndon, S. C., Knighton, W. B., Cappa, C. D., Kleeman, M. J., Lim, C. Y., Kroll, J. H., Pierce, J. R., and Jathar, S. H.: Oxygenated Aromatic Compounds are Important Precursors of Secondary Organic Aerosol in Biomass-Burning Emissions, Environ. Sci. Technol., 54, 8568–8579, https://doi.org/10.1021/acs.est.0c01345, 2020.
Andreae, M. O. and Merlet, P.: Emissions of trace gases and aerosols from biomass burning, Biogeochemistry, 15, 955–966, 2001.
Atkinson, R., Baulch, D. L., Cox, R. A., Crowley, J. N., Hampson, R. F., Hynes, R. G., Jenkin, M. E., Rossi, M. J., Troe, J., and IUPAC Subcommittee: Evaluated kinetic and photochemical data for atmospheric chemistry: Volume II–gas phase reactions of organic species, Atmos. Chem. Phys., 6, 3625–4055, https://doi.org/10.5194/acp-6-3625-2006, 2006.
Balch, J. K., Bradley, B. A., Abatzoglou, J. T., Chelsea Nagy, R., Fusco, E. J., and Mahood, A. L.: Human-started wildfires expand the fire niche across the United States, P. Natl. Acad. Sci. USA, 114, 2946–2951, https://doi.org/10.1073/pnas.1617394114, 2017.
Barbero, R., Abatzoglou, J. T., Larkin, N. K., Kolden, C. A., and Stocks, B.: Climate change presents increased potential for very large fires in the contiguous United States, Int. J. Wildland Fire, 24, 892–899, https://doi.org/10.1071/WF15083, 2015.
Bertrand, A., Stefenelli, G., Jen, C. N., Pieber, S. M., Bruns, E. A., Ni, H., Temime-Roussel, B., Slowik, J. G., Goldstein, A. H., El Haddad, I., Baltensperger, U., Prévôt, A. S. H., Wortham, H., and Marchand, N.: Evolution of the chemical fingerprint of biomass burning organic aerosol during aging, Atmos. Chem. Phys., 18, 7607–7624, https://doi.org/10.5194/acp-18-7607-2018, 2018.
Bishop, G. A. and Haugen, M. J.: The Story of Ever Diminishing Vehicle Tailpipe Emissions as Observed in the Chicago, Illinois Area, Environ. Sci. Technol., 52, 7587–7593, https://doi.org/10.1021/acs.est.8b00926, 2018.
Bloss, C., Wagner, V., Jenkin, M. E., Volkamer, R., Bloss, W. J., Lee, J. D., Heard, D. E., Wirtz, K., Martin-Reviejo, M., Rea, G., Wenger, J. C., and Pilling, M. J.: Development of a detailed chemical mechanism (MCMv3.1) for the atmospheric oxidation of aromatic hydrocarbons, Atmos. Chem. Phys., 5, 641–664, https://doi.org/10.5194/acp-5-641-2005, 2005.
Bolzacchini, E., Bruschi, M., Hjorth, J., Meinardi, S., Orlandi, M., Rindone, B., and Rosenbohm, E.: Gas-Phase Reaction of Phenol with NO3, Environ. Sci. Technol., 35, 1791–1797, 2001.
Brey, S. J., Barnes, E. A., Pierce, J. R., Wiedinmyer, C., and Fischer, E. V.: Environmental Conditions, Ignition Type, and Air Quality Impacts of Wildfires in the Southeastern and Western United States, Earths Future, 6, 1442–1456, https://doi.org/10.1029/2018EF000972, 2018.
Brown, S. S. and Stutz, J.: Nighttime radical observations and chemistry, Chem. Soc. Rev., 41, 6405–6447, https://doi.org/10.1039/c2cs35181a, 2012.
Brown, S. S., Stark, H., and Ravishankara, A. R.: Applicability of the steady state approximation to the interpretation of atmospheric observations of NO3 and N2O5, J. Geophys. Res., 108, 4539, https://doi.org/10.1029/2003JD003407, 2003.
Brown, S. S., Osthoff, H. D., Stark, H., Dubé, W. P., Ryerson, T. B., Warneke, C., de Gouw, J. A., Wollny, A. G., Parrish, D. D., Fehsenfeld, F. C., and Ravishankara, A. R.: Aircraft observations of daytime NO3 and N2 O5 and their implications for tropospheric chemistry, J. Photoch. Photobio. A, 176, 270–278, https://doi.org/10.1016/j.jphotochem.2005.10.004, 2005.
Calvert, J. G., Mellouki, A., Orlando, J. J., Pilling, M. J., and Wallington, T. J.: Mechanisms of Atmospheric Oxidation of the Oxygenate, Oxford University Press, New York, 2011.
Chang, W. L., Bhave, P. V., Brown, S. S., Riemer, N., Stutz, J., and Dabdub, D.: Heterogeneous atmospheric chemistry, ambient measurements, and model calculations of N2O5: A review, Aerosol Sci. Tech., 45, 655–685, https://doi.org/10.1080/02786826.2010.551672, 2011.
Chen, X., Sun, Y., Qi, Y., Liu, L., Xu, F., and Zhao, Y.: Mechanistic and kinetic investigations on the ozonolysis of biomass burning products: Guaiacol, syringol and creosol, Int. J. Mol. Sci., 20, 4492, https://doi.org/10.3390/ijms20184492, 2019.
Coggon, M. M., Lim, C. Y., Koss, A. R., Sekimoto, K., Yuan, B., Gilman, J. B., Hagan, D. H., Selimovic, V., Zarzana, K. J., Brown, S. S., Roberts, J. M., Müller, M., Yokelson, R., Wisthaler, A., Krechmer, J. E., Jimenez, J. L., Cappa, C., Kroll, J. H., de Gouw, J., and Warneke, C.: OH chemistry of non-methane organic gases (NMOGs) emitted from laboratory and ambient biomass burning smoke: evaluating the influence of furans and oxygenated aromatics on ozone and secondary NMOG formation, Atmos. Chem. Phys., 19, 14875–14899, https://doi.org/10.5194/acp-19-14875-2019, 2019.
Crosson, E. R.: A cavity ring-down analyzer for measuring atmospheric levels of methane, carbon dioxide, and water vapor, Appl. Phys. B-Lasers O., 92, 403–408, https://doi.org/10.1007/s00340-008-3135-y, 2008.
Decker, Z. C. J., Zarzana, K. J., Coggon, M., Min, K.-E., Pollack, I., Ryerson, T. B., Peischl, J., Edwards, P., Dubé, W. P., Markovic, M. Z., Roberts, J. M., Veres, P. R., Graus, M., Warneke, C., de Gouw, J., Hatch, L. E., Barsanti, K. C., and Brown, S. S.: Nighttime Chemical Transformation in Biomass Burning Plumes: A Box Model Analysis Initialized with Aircraft Observations, Environ. Sci. Technol., 53, 2529–2538, https://doi.org/10.1021/acs.est.8b05359, 2019.
Dennison, P. E., Brewer, S. C., Arnold, J. D., and Moritz, M. A.: Large wildfire trends in the western United States, 1984–2011, Geophys. Res. Lett., 41, 2014GL059576, https://doi.org/10.1002/2014gl059576, 2014.
Edwards, P. M., Evans, M. J., Furneaux, K. L., Hopkins, J., Ingham, T., Jones, C., Lee, J. D., Lewis, A. C., Moller, S. J., Stone, D., Whalley, L. K., and Heard, D. E.: OH reactivity in a South East Asian tropical rainforest during the Oxidant and Particle Photochemical Processes (OP3) project, Atmos. Chem. Phys., 13, 9497–9514, https://doi.org/10.5194/acp-13-9497-2013, 2013.
Edwards, P. M., Aikin, K. C., Dube, W. P., Fry, J. L., Gilman, J. B., De Gouw, J. A., Graus, M. G., Hanisco, T. F., Holloway, J., Hübler, G., Kaiser, J., Keutsch, F. N., Lerner, B. M., Neuman, J. A., Parrish, D. D., Peischl, J., Pollack, I. B., Ravishankara, A. R., Roberts, J. M., Ryerson, T. B., Trainer, M., Veres, P. R., Wolfe, G. M., and Warneke, C.: Transition from high- to low-NOx control of night-time oxidation in the southeastern US, Nat. Geosci., 10, 490–495, https://doi.org/10.1038/ngeo2976, 2017.
Eilerman, S. J., Peischl, J., Neuman, J. A., Ryerson, T. B., Aikin, K. C., Holloway, M. W., Zondlo, M. A., Golston, L. M., Pan, D., Floerchinger, C., and Herndon, S.: Characterization of Ammonia, Methane, and Nitrous Oxide Emissions from Concentrated Animal Feeding Operations in Northeastern Colorado, Environ. Sci. Technol., 50, 10885–10893, https://doi.org/10.1021/acs.est.6b02851, 2016.
El Zein, A., Coeur, C., Obeid, E., Lauraguais, A., and Fagniez, T.: Reaction Kinetics of Catechol (1,2-Benzenediol) and Guaiacol (2-Methoxyphenol) with Ozone, J. Phys. Chem. A, 119, 6759–6765, https://doi.org/10.1021/acs.jpca.5b00174, 2015.
Finewax, Z., De Gouw, J. A., and Ziemann, P. J.: Identification and Quantification of 4-Nitrocatechol Formed from OH and NO3 Radical-Initiated Reactions of Catechol in Air in the Presence of NOx: Implications for Secondary Organic Aerosol Formation from Biomass Burning, Environ. Sci. Technol., 52, 1981–1989, https://doi.org/10.1021/acs.est.7b05864, 2018.
Fuchs, H., Tan, Z., Lu, K., Bohn, B., Broch, S., Brown, S. S., Dong, H., Gomm, S., Häseler, R., He, L., Hofzumahaus, A., Holland, F., Li, X., Liu, Y., Lu, S., Min, K.-E., Rohrer, F., Shao, M., Wang, B., Wang, M., Wu, Y., Zeng, L., Zhang, Y., Wahner, A., and Zhang, Y.: OH reactivity at a rural site (Wangdu) in the North China Plain: contributions from OH reactants and experimental OH budget, Atmos. Chem. Phys., 17, 645–661, https://doi.org/10.5194/acp-17-645-2017, 2017.
Fuchs, N. A. and Sutugin, A. G.: Highly Dispersed Aerosols, Ann Arbor Science Publishers, Inc, Ann Arbor, 1970.
Gaston, C. J., Lopez-Hilfiker, F. D., Whybrew, L. E., Hadley, O., McNair, F., Gao, H., Jaffe, D. A., and Thornton, J. A.: Online molecular characterization of fine particulate matter in Port Angeles, WA: Evidence for a major impact from residential wood smoke, Atmos. Environ., 138, 99–107, https://doi.org/10.1016/j.atmosenv.2016.05.013, 2016.
Geyer, A., Alicke, B., Ackermann, R., Martinez, M., Harder, H., Brune, W., Di Carlo, P., Williams, E., Jobson, T., Hall, S., Shetter, R., and Stutz, J.: Direct observations of daytime NO3: Implications for urban boundary layer chemistry, J. Geophys. Res.-Atmos., 108, 1–11, https://doi.org/10.1029/2002jd002967, 2003.
Giglio, L.: Characterization of the tropical diurnal fire cycle using VIRS and MODIS observations, Remote Sens. Environ., 108, 407–421, https://doi.org/10.1016/j.rse.2006.11.018, 2007.
Gilman, J. B., Kuster, W. C., Goldan, P. D., Herndon, S. C., Zahniser, M. S., Tucker, S. C., Brewer, W. A., Lerner, B. M., Williams, E. J., Harley, R. A., Fehsenfeld, F. C., Warneke, C., and De Gouw, J. A.: Measurements of volatile organic compounds during the 2006 TexAQS/GoMACCS campaign: Industrial influences, regional characteristics, and diurnal dependencies of the OH reactivity, J. Geophys. Res.-Atmos., 114, 1–17, https://doi.org/10.1029/2008JD011525, 2009.
Gilman, J. B., Lerner, B. M., Kuster, W. C., Goldan, P. D., Warneke, C., Veres, P. R., Roberts, J. M., de Gouw, J. A., Burling, I. R., and Yokelson, R. J.: Biomass burning emissions and potential air quality impacts of volatile organic compounds and other trace gases from fuels common in the US, Atmos. Chem. Phys., 15, 13915–13938, https://doi.org/10.5194/acp-15-13915-2015, 2015.
Goldberger, L. A., Jahl, L. G., Thornton, J. A., and Sullivan, R. C.: N2O5 reactive uptake kinetics and chlorine activation on authentic biomass-burning aerosol, Environ. Sci.-Proc. Imp., 21, 1684–1698, https://doi.org/10.1039/c9em00330d, 2019.
Hartikainen, A., Yli-Pirilä, P., Tiitta, P., Leskinen, A., Kortelainen, M., Orasche, J., Schnelle-Kreis, J., Lehtinen, K., Zimmermann, R., Jokiniemi, J., and Sippula, O.: Volatile organic compounds from logwood combustion: Emissions and transformation under dark and photochemical aging conditions in a smog chamber, Environ. Sci. Technol., 52, acs.est.7b06269, https://doi.org/10.1021/acs.est.7b06269, 2018.
Hatch, L. E., Luo, W., Pankow, J. F., Yokelson, R. J., Stockwell, C. E., and Barsanti, K. C.: Identification and quantification of gaseous organic compounds emitted from biomass burning using two-dimensional gas chromatography–time-of-flight mass spectrometry, Atmos. Chem. Phys., 15, 1865–1899, https://doi.org/10.5194/acp-15-1865-2015, 2015.
Hatch, L. E., Yokelson, R. J., Stockwell, C. E., Veres, P. R., Simpson, I. J., Blake, D. R., Orlando, J. J., and Barsanti, K. C.: Multi-instrument comparison and compilation of non-methane organic gas emissions from biomass burning and implications for smoke-derived secondary organic aerosol precursors, Atmos. Chem. Phys., 17, 1471–1489, https://doi.org/10.5194/acp-17-1471-2017, 2017.
Hatch, L. E., Rivas-Ubach, A., Jen, C. N., Lipton, M., Goldstein, A. H., and Barsanti, K. C.: Measurements of I/SVOCs in biomass-burning smoke using solid-phase extraction disks and two-dimensional gas chromatography, Atmos. Chem. Phys., 18, 17801–17817, https://doi.org/10.5194/acp-18-17801-2018, 2018.
Higuera, P. E., Abatzoglou, J. T., Littell, J. S., and Morgan, P.: The changing strength and nature of fire-climate relationships in the northern Rocky Mountains, USA, 1902–2008, PLoS One, 10, 1–21, https://doi.org/10.1371/journal.pone.0127563, 2015.
Holmes, C. D., Fite, C. H., Agastra, A., Schwarz, Joshua, P., Yokelson, R. J., Bui, T. P., Kondragunta, S., and Peterson, D. A.: Critical evaluation of smoke age inferred from different methods during FIREX-AQ, in: AGU Fall Meeting 2020, 16 December 2020, A225-0010, 2020.
Iinuma, Y., Boge, O., Grade, R., and Herrmann, H.: Methyl-Nitrocatechols: Atmospheric Tracer Compounds for Biomass Burning Secondary Organic Aerosols, Environ. Sci. Technol., 44, 8453–8459, 2010.
Inciweb: 204 Cow Fire – InciWeb the Incident Information System, available at: https://inciweb.nwcg.gov/incident/maps/6526/ (last access: 27 December 2020), 2019a.
Inciweb: Castle Fire – InciWeb the Incident Information System, available at: https://inciweb.nwcg.gov/incident/article/7048/53693/ (last access: 27 December 2020), 2019b.
Inciweb: Williams Flats Fire – InciWeb the Incident Information System, available at: https://inciweb.nwcg.gov/incident/6493/ (last access: 27 December 2020), 2019c.
Jaffe, D. A. and Wigder, N. L.: Ozone production from wildfires: A critical review, Atmos. Environ., 51, 1–10, https://doi.org/10.1016/j.atmosenv.2011.11.063, 2012.
Jaffe, D. A., O'Neill, S. M., Larkin, N. K., Holder, A. L., Peterson, D. L., Halofsky, J. E., and Rappold, A. G.: Wildfire and prescribed burning impacts on air quality in the United States, J. Air Waste Manage., 70, 583–615, https://doi.org/10.1080/10962247.2020.1749731, 2020.
Jenkin, M. E., Saunders, S. M., and Pilling, M. J.: The tropospheric degradation of volatile organic compounds: a protocol for mechanism development, Atmos. Environ., 31, 81–104, https://doi.org/10.1016/S1352-2310(96)00105-7, 1997.
Jenkin, M. E., Saunders, S. M., Wagner, V., and Pilling, M. J.: Protocol for the development of the Master Chemical Mechanism, MCM v3 (Part B): tropospheric degradation of aromatic volatile organic compounds, Atmos. Chem. Phys., 3, 181–193, https://doi.org/10.5194/acp-3-181-2003, 2003.
Jenkin, M. E., Wyche, K. P., Evans, C. J., Carr, T., Monks, P. S., Alfarra, M. R., Barley, M. H., McFiggans, G. B., Young, J. C., and Rickard, A. R.: Development and chamber evaluation of the MCM v3.2 degradation scheme for β-caryophyllene, Atmos. Chem. Phys., 12, 5275–5308, https://doi.org/10.5194/acp-12-5275-2012, 2012.
Jenkin, M. E., Young, J. C., and Rickard, A. R.: The MCM v3.3.1 degradation scheme for isoprene, Atmos. Chem. Phys., 15, 11433–11459, https://doi.org/10.5194/acp-15-11433-2015, 2015.
Juncosa Calahorrano, J. F., Lindaas, J., O'Dell, K., Palm, B. P., Peng, Q., Flocke, F., Pollack, I. B., Garofalo, L. A., Farmer, D. K., Pierce, J. R., Collett Jr, J. L., Weinheimer, A., Campos, T., Hornbrook, R. S., Hall, S. R., Ullmann, K., Pothier, M. A., Apel, E. C., Permar, W., Hu, L., Hills, A. J., Montzka, D., Tyndall, G., Thornton, J. A., and Fischer, E. V.: Daytime Oxidized Reactive Nitrogen Partitioning in Western U. S. Wildfire Smoke Plumes, J. Geophys. Res.-Atmos., 126, 1–47, https://doi.org/10.1029/2020JD033484, 2020.
Keywood, M., Cope, M., Meyer, C. P. P. M., Iinuma, Y., and Emmerson, K.: When smoke comes to town: The impact of biomass burning smoke on air quality, Atmos. Environ., 121, 13–21, https://doi.org/10.1016/j.atmosenv.2015.03.050, 2015.
Kodros, J., Papanastasiou, D., Paglione, M., Masiol, M., Squizzato, S., Florou, K., Skyllakou, K., Kaltsonoudis, C., Nenes, A., and Pandis, S. N.: The oxidizing power of the dark side: Rapid nocturnal aging of biomass burning as an overlooked source of oxidized organic aerosol, P. Natl. Acad. Sci. USA, 117, 33028–33033, https://doi.org/10.1073/pnas.2010365117, 2020.
Kolb, C. E., Cox, R. A., Abbatt, J. P. D., Ammann, M., Davis, E. J., Donaldson, D. J., Garrett, B. C., George, C., Griffiths, P. T., Hanson, D. R., Kulmala, M., McFiggans, G., Pöschl, U., Riipinen, I., Rossi, M. J., Rudich, Y., Wagner, P. E., Winkler, P. M., Worsnop, D. R., and O'Dowd, C. D.: An overview of current issues in the uptake of atmospheric trace gases by aerosols and clouds, Atmos. Chem. Phys., 10, 10561–10605, https://doi.org/10.5194/acp-10-10561-2010, 2010.
Koss, A. R., Sekimoto, K., Gilman, J. B., Selimovic, V., Coggon, M. M., Zarzana, K. J., Yuan, B., Lerner, B. M., Brown, S. S., Jimenez, J. L., Krechmer, J., Roberts, J. M., Warneke, C., Yokelson, R. J., and de Gouw, J.: Non-methane organic gas emissions from biomass burning: identification, quantification, and emission factors from PTR-ToF during the FIREX 2016 laboratory experiment, Atmos. Chem. Phys., 18, 3299–3319, https://doi.org/10.5194/acp-18-3299-2018, 2018.
Kupc, A., Williamson, C., Wagner, N. L., Richardson, M., and Brock, C. A.: Modification, calibration, and performance of the Ultra-High Sensitivity Aerosol Spectrometer for particle size distribution and volatility measurements during the Atmospheric Tomography Mission (ATom) airborne campaign, Atmos. Meas. Tech., 11, 369–383, https://doi.org/10.5194/amt-11-369-2018, 2018.
LAS: Laser Aerosol Spectrometer 3340A, available at: https://www.tsi.com/products/particle-sizers/particle-size-spectrometers/laser-aerosol-spectrometer-3340a/, last access: 18 March 2021.
Lauraguais, A., Coeur-Tourneur, C., Cassez, A., Deboudt, K., Fourmentin, M., and Choël, M.: Atmospheric reactivity of hydroxyl radicals with guaiacol (2-methoxyphenol), a biomass burning emitted compound: Secondary organic aerosol formation and gas-phase oxidation products, Atmos. Environ., 86, 155–163, https://doi.org/10.1016/j.atmosenv.2013.11.074, 2014.
Lee, B. H., Lopez-Hilfiker, F. D., Mohr, C., Kurtén, T., Worsnop, D. R., and Thornton, J. A.: An iodide-adduct high-resolution time-of-flight chemical-ionization mass spectrometer: Application to atmospheric inorganic and organic compounds, Environ. Sci. Technol., 48, 6309–6317, https://doi.org/10.1021/es500362a, 2014.
Li, F., Zhang, X., Roy, D. P., and Kondragunta, S.: Estimation of biomass-burning emissions by fusing the fire radiative power retrievals from polar-orbiting and geostationary satellites across the conterminous United States, Atmos. Environ., 211, 274–287, https://doi.org/10.1016/j.atmosenv.2019.05.017, 2019.
Lin, P., Liu, J., Shilling, J. E., Kathmann, S. M., Laskin, J., and Laskin, A.: Molecular characterization of brown carbon (BrC) chromophores in secondary organic aerosol generated from photo-oxidation of toluene, Phys. Chem. Chem. Phys., 17, 23312–23325, https://doi.org/10.1039/C5CP02563J, 2015.
Liu, C., Liu, J., Liu, Y., Chen, T., and He, H.: Secondary organic aerosol formation from the OH-initiated oxidation of guaiacol under different experimental conditions, Atmos. Environ., 207, 30–37, https://doi.org/10.1016/j.atmosenv.2019.03.021, 2019.
Liu, X., Zhang, Y., Huey, L. G., Yokelson, R. J., Wang, Y., Jimenez, J. L., Campuzano-Jost, P., Beyersdorf, A. J., Blake, D. R., Choi, Y., St. Clair, J. M., Crounse, J. D., Day, D. A., Diskin, G. S., Fried, A., Hall, S. R., Hanisco, T. F., King, L. E., Meinardi, S., Mikoviny, T., Palm, B. B., Peischl, J., Perring, A. E., Pollack, I. B., Ryerson, T. B., Sachse, G., Schwarz, J. P., Simpson, I. J., Tanner, D. J., Thornhill, K. L., Ullmann, K., Weber, R. J., Wennberg, P. O., Wisthaler, A., Wolfe, G. M., and Ziemba, L. D.: Agricultural fires in the southeastern U. S. during SEAC4RS: Emissions of trace gases and particles and evolution of ozone, reactive nitrogen, and organic aerosol, J. Geophys. Res.-Atmos., 121, 7383–7414, https://doi.org/10.1002/2016JD025040, 2016.
Lu, X., Zhang, L., Yue, X., Zhang, J., Jaffe, D. A., Stohl, A., Zhao, Y., and Shao, J.: Wildfire influences on the variability and trend of summer surface ozone in the mountainous western United States, Atmos. Chem. Phys., 16, 14687–14702, https://doi.org/10.5194/acp-16-14687-2016, 2016.
Marlon, J. R., Bartlein, P. J., Gavin, D. G., Long, C. J., Anderson, R. S., Briles, C. E., Brown, K. J., Colombaroli, D., Hallett, D. J., Power, M. J., Scharf, E. A., and Walsh, M. K.: Long-term perspective on wildfires in the western USA, P. Natl. Acad. Sci. USA, 109, 535–543, https://doi.org/10.1073/pnas.1112839109, 2012.
McDuffie, E. E., Fibiger, D. L., Dubé, W. P., Lopez-Hilfiker, F., Lee, B. H., Thornton, J. A., Shah, V., Jaeglé, L., Guo, H., Weber, R. J., Michael Reeves, J., Weinheimer, A. J., Schroder, J. C., Campuzano-Jost, P., Jimenez, J. L., Dibb, J. E., Veres, P., Ebben, C., Sparks, T. L., Wooldridge, P. J., Cohen, R. C., Hornbrook, R. S., Apel, E. C., Campos, T., Hall, S. R., Ullmann, K., and Brown, S. S.: Heterogeneous N2O5 Uptake During Winter: Aircraft Measurements During the 2015 WINTER Campaign and Critical Evaluation of Current Parameterizations, J. Geophys. Res.-Atmos., 123, 4345–4372, https://doi.org/10.1002/2018JD028336, 2018.
Meng, L., Coeur, C., Fayad, L., Houzel, N., Genevray, P., Bouzidi, H., Tomas, A., and Chen, W.: Secondary organic aerosol formation from the gas-phase reaction of guaiacol (2-methoxyphenol) with NO3 radicals, Atmos. Environ., 240, 117740, https://doi.org/10.1016/j.atmosenv.2020.117740, 2020.
Min, K.-E., Washenfelder, R. A., Dubé, W. P., Langford, A. O., Edwards, P. M., Zarzana, K. J., Stutz, J., Lu, K., Rohrer, F., Zhang, Y., and Brown, S. S.: A broadband cavity enhanced absorption spectrometer for aircraft measurements of glyoxal, methylglyoxal, nitrous acid, nitrogen dioxide, and water vapor, Atmos. Meas. Tech., 9, 423–440, https://doi.org/10.5194/amt-9-423-2016, 2016.
Mohr, C., Lopez-Hilfiker, F. D., Zotter, P., Prévoît, A. S. H., Xu, L., Ng, N. L., Herndon, S. C., Williams, L. R., Franklin, J. P., Zahniser, M. S., Worsnop, D. R., Knighton, W. B., Aiken, A. C., Gorkowski, K. J., Dubey, M. K., Allan, J. D., and Thornton, J. A.: Contribution of Nitrated Phenols to Wood Burning Brown Carbon Light Absorption in Detling, United Kingdom During Winter Time, Environ. Sci. Technol., 47, 6316–6324, https://doi.org/10.1021/es400683v, 2013.
Mondello, L., Tranchida, P. Q., Dugo, P., and Dugo, G.: Comprehensive two-dimensional gas chromatography-mass spectrometry: A review, Mass Spectrom. Rev., 27, 101–124, https://doi.org/10.1002/mas.20158, 2008.
Moore, R. H., Wiggins, E. B., Ahern, A. T., Zimmerman, S., Montgomery, L., Campuzano Jost, P., Robinson, C. E., Ziemba, L. D., Winstead, E. L., Anderson, B. E., Brock, C. A., Brown, M. D., Chen, G., Crosbie, E. C., Guo, H., Jimenez, J. L., Jordan, C. E., Lyu, M., Nault, B. A., Rothfuss, N. E., Sanchez, K. J., Schueneman, M., Shingler, T. J., Shook, M. A., Thornhill, K. L., Wagner, N. L., and Wang, J.: Sizing response of the Ultra-High Sensitivity Aerosol Spectrometer (UHSAS) and Laser Aerosol Spectrometer (LAS) to changes in submicron aerosol composition and refractive index, Atmos. Meas. Tech., 14, 4517–4542, https://doi.org/10.5194/amt-14-4517-2021, 2021.
Müller, M., Mikoviny, T., Feil, S., Haidacher, S., Hanel, G., Hartungen, E., Jordan, A., Märk, L., Mutschlechner, P., Schottkowsky, R., Sulzer, P., Crawford, J. H., and Wisthaler, A.: A compact PTR-ToF-MS instrument for airborne measurements of volatile organic compounds at high spatiotemporal resolution, Atmos. Meas. Tech., 7, 3763–3772, https://doi.org/10.5194/amt-7-3763-2014, 2014.
Nakao, S., Clark, C., Tang, P., Sato, K., and Cocker III, D.: Secondary organic aerosol formation from phenolic compounds in the absence of NOx, Atmos. Chem. Phys., 11, 10649–10660, https://doi.org/10.5194/acp-11-10649-2011, 2011.
NASA: FIREX-AQ, NASA [data set], available at: https://www-air.larc.nasa.gov/missions/firex-aq/index.html, last access: 24 October 2021.
Neuman, J. A., Trainer, M., Brown, S. S., Min, K. E., Nowak, J. B., Parrish, D. D., Peischl, J., Pollack, I. B., Roberts, J. M., Ryerson, T. B., and Veres, P. R.: HONO emission and production determined from airborne measurements over the Southeast U. S., J. Geophys. Res., 121, 9237–9250, https://doi.org/10.1002/2016JD025197, 2016.
NIFC: NIFC 2019 Statistics and Summary, available at: https://www.predictiveservices.nifc.gov/intelligence/2019_statssumm/2019Stats&Summ.html (last access: 8 January 2021), 2019.
Olariu, R., Klotz, B., Barnes, I., Becker, K., and Mocanu, R.: FT–IR study of the ring-retaining products from the reaction of OH radicals with phenol, o-, m-, and p-cresol, Atmos. Environ., 36, 3685–3697, https://doi.org/10.1016/S1352-2310(02)00202-9, 2002.
Olariu, R. I., Barnes, I., Bejan, I., Arsene, C., Vione, D., Klotz, B., and Becker, K. H.: FT-IR Product Study of the Reactions of NO3 Radicals With ortho-, meta-, and para-Cresol, Environ. Sci. Technol., 47, 7729–7738, https://doi.org/10.1021/es401096w, 2013.
Osthoff, H. D., Sommariva, R., Baynard, T., Pettersson, A., Williams, E. J., Lerner, B. M., Roberts, J. M., Stark, H., Goldan, P. D., Kuster, W. C., Bates, T. S., Coffman, D., Ravishankara, A. R., and Brown, S. S.: Observation of daytime N2O5 in the marine boundary layer during New England Air Quality Study – Intercontinental Transport and Chemical Transformation 2004, J. Geophys. Res.-Atmos., 111, D23S14, https://doi.org/10.1029/2006JD007593, 2006.
Palm, B. B., Campuzano-Jost, P., Day, D. A., Ortega, A. M., Fry, J. L., Brown, S. S., Zarzana, K. J., Dube, W., Wagner, N. L., Draper, D. C., Kaser, L., Jud, W., Karl, T., Hansel, A., Gutiérrez-Montes, C., and Jimenez, J. L.: Secondary organic aerosol formation from in situ OH, O3, and NO3 oxidation of ambient forest air in an oxidation flow reactor, Atmos. Chem. Phys., 17, 5331–5354, https://doi.org/10.5194/acp-17-5331-2017, 2017.
Palm, B. B., Peng, Q., Fredrickson, C. D., Lee, B. H., Garofalo, L. A., Pothier, M. A., Kreidenweis, S. M., Farmer, D. K., Pokhrel, R. P., Shen, Y., Murphy, S. M., Permar, W., Hu, L., Campos, T. L., Hall, S. R., Ullmann, K., Zhang, X., Flocke, F., Fischer, E. V., and Thornton, J. A.: Quantification of organic aerosol and brown carbon evolution in fresh wildfire plumes, P. Natl. Acad. Sci. USA, 117, 29469–29477, https://doi.org/10.1073/pnas.2012218117, 2020.
Parks, S. A., Miller, C., Parisien, M. A., Holsinger, L. M., Dobrowski, S. Z., and Abatzoglou, J.: Wildland fire deficit and surplus in the western United States, 1984–2012, Ecosphere, 6, 1–13, https://doi.org/10.1890/ES15-00294.1, 2015.
Peng, Q., Palm, B. B., Melander, K. E., Lee, B. H., Hall, S. R., Ullmann, K., Campos, T., Weinheimer, A. J., Apel, E. C., Hornbrook, R. S., Hills, A. J., Montzka, D. D., Flocke, F., Hu, L., Permar, W., Wielgasz, C., Lindaas, J., Pollack, I. B., Fischer, E. V., Bertram, T. H., and Thornton, J. A.: HONO Emissions from Western U. S. Wildfires Provide Dominant Radical Source in Fresh Wildfire Smoke, Environ. Sci. Technol., 54, 5954–5963, https://doi.org/10.1021/acs.est.0c00126, 2020.
Phuleria, H. C., Fine, P. M., Zhu, Y., and Sioutas, C.: Air quality impacts of the October 2003 Southern California wildfires, J. Geophys. Res.-Atmos., 110, 1–11, https://doi.org/10.1029/2004JD004626, 2005.
Pollack, I. B., Lerner, B. M., and Ryerson, T. B.: Evaluation of ultraviolet light-emitting diodes for detection of atmospheric NO2 by photolysis – Chemiluminescence, J. Atmos. Chem., 65, 111–125, https://doi.org/10.1007/s10874-011-9184-3, 2010.
Ridley, B. A., Grahek, F. E., and Walega, J. G.: A Small High-Sensitivity, Medium-Response Ozone Detector Suitable for Measurements from Light Aircraft, J. Atmos. Ocean. Tech., 9, 142–148, https://doi.org/10.1175/1520-0426(1992)009<0142:ASHSMR>2.0.CO;2, 1992.
Ro Lee, Y., Ji, Y., Tanner, D. J., and Huey, L. G.: A low-activity ion source for measurement of atmospheric gases by chemical ionization mass spectrometry, Atmos. Meas. Tech., 13, 2473–2480, https://doi.org/10.5194/amt-13-2473-2020, 2020.
Roberts, J. M., Stockwell, C. E., Yokelson, R. J., de Gouw, J., Liu, Y., Selimovic, V., Koss, A. R., Sekimoto, K., Coggon, M. M., Yuan, B., Zarzana, K. J., Brown, S. S., Santin, C., Doerr, S. H., and Warneke, C.: The nitrogen budget of laboratory-simulated western US wildfires during the FIREX 2016 Fire Lab study, Atmos. Chem. Phys., 20, 8807–8826, https://doi.org/10.5194/acp-20-8807-2020, 2020.
Robinson, M. A., Decker, Z. C. J., Barsanti, K. C., Coggon, M. M., Flocke, F. M., Franchin, A., Fredrickson, C. D., Gilman, J. B., Gkatzelis, G. I., Holmes, C. D., Lamplugh, A., Lavi, A., Middlebrook, A. M., Montzka, D. M., Palm, B. B., Peischl, J., Pierce, B., Schwantes, R. H., Sekimoto, K., Selimovic, V., Tyndall, G. S., Thornton, J. A., Rooy, P. Van, Warneke, C., Weinheimer, A. J., and Brown, S. S.: Variability and Time of Day Dependence of Ozone Photochemistry in Western Wildfire Plumes, Environ. Sci. Technol., 55, 10280–10290, https://doi.org/10.1021/ACS.EST.1C01963, 2021.
Rollins, A. W., Rickly, P. S., Gao, R.-S., Ryerson, T. B., Brown, S. S., Peischl, J., and Bourgeois, I.: Single-photon laser-induced fluorescence detection of nitric oxide at sub-parts-per-trillion mixing ratios, Atmos. Meas. Tech., 13, 2425–2439, https://doi.org/10.5194/amt-13-2425-2020, 2020.
Sachse, G. W., Collins Jr, J. E., Hill, G. F., Wade, L. O., Lewis, B. G., and Ritter, J. A.: Airborne tunable diode laser sensor for high-precision concentration and flux measurements of carbon monoxide and methane, Proc. SPIE, 1433, 157–166, https://doi.org/10.1117/12.46162, 1991.
Sangwan, M. and Zhu, L.: Absorption cross sections of 2-Nitrophenol in the 295–400 nm region and photolysis of 2-Nitrophenol at 308 and 351 nm, J. Phys. Chem. A, 120, 9958–9967, https://doi.org/10.1021/acs.jpca.6b08961, 2016.
Sangwan, M. and Zhu, L.: Role of Methyl-2-nitrophenol Photolysis as a Potential Source of OH Radicals in the Polluted Atmosphere: Implications from Laboratory Investigation, J. Phys. Chem. A, 122, 1861–1872, https://doi.org/10.1021/acs.jpca.7b11235, 2018.
Saunders, S. M., Pascoe, S., Johnson, A. P., Pilling, M. J., and Jenkin, M. E.: Development and preliminary test results of an expert system for the automatic generation of tropospheric VOC degradation mechanisms, Atmos. Environ., 37, 1723–1735, https://doi.org/10.1016/S1352-2310(03)00072-4, 2003.
Schwantes, R. H., Schilling, K. A., McVay, R. C., Lignell, H., Coggon, M. M., Zhang, X., Wennberg, P. O., and Seinfeld, J. H.: Formation of highly oxygenated low-volatility products from cresol oxidation, Atmos. Chem. Phys., 17, 3453–3474, https://doi.org/10.5194/acp-17-3453-2017, 2017.
Selimovic, V., Yokelson, R. J., McMeeking, G. R., and Coefield, S.: Aerosol Mass and Optical Properties, Smoke Influence on O3, and High NO3 Production Rates in a Western U. S. City Impacted by Wildfires, J. Geophys. Res.-Atmos., 125, 1–22, https://doi.org/10.1029/2020JD032791, 2020.
Shetter, R. E. and Müller, M.: Photolysis frequency measurements using actinic flux spectroradiometry during the PEM-Tropics mission: Instrumentation description and some results, J. Geophys. Res.-Atmos., 104, 5647–5661, https://doi.org/10.1029/98JD01381, 1999.
Silvern, R. F., Jacob, D. J., Mickley, L. J., Sulprizio, M. P., Travis, K. R., Marais, E. A., Cohen, R. C., Laughner, J. L., Choi, S., Joiner, J., and Lamsal, L. N.: Using satellite observations of tropospheric NO2 columns to infer long-term trends in US NOx emissions: the importance of accounting for the free tropospheric NO2 background, Atmos. Chem. Phys., 19, 8863–8878, https://doi.org/10.5194/acp-19-8863-2019, 2019.
SMPS: Scanning Mobility Particle Sizer Spectrometer 3936, available at: https://tsi.com/discontinued-products/scanning-mobility-particle-sizer-spectrometer-3936/, last access: 18 March 2021.
Sparks, T. L., Ebben, C. J., Wooldridge, P. J., Lopez-Hilfiker, F. D., Lee, B. H., Thornton, J. A., McDuffie, E. E., Fibiger, D. L., Brown, S. S., Montzka, D. D., Weinheimer, A. J., Schroder, J. C., Campuzano-Jost, P., Jimenez, J. L., and Cohen, R. C.: Comparison of Airborne Reactive Nitrogen Measurements During WINTER, J. Geophys. Res.-Atmos., 124, 10483–10502, https://doi.org/10.1029/2019JD030700, 2019.
Stedman, D. H., Daby, E. E., Stuhl, F., and Niki, H.: Analysis of ozone and nitric oxide by a chemiluminescent method in laboratory and atmospheric studies of photochemical smog, JAPCA J. Air Waste Ma., 22, 260–263, https://doi.org/10.1080/00022470.1972.10469635, 1972.
Tereszchuk, K. A., González Abad, G., Clerbaux, C., Hurtmans, D., Coheur, P.-F., and Bernath, P. F.: ACE-FTS measurements of trace species in the characterization of biomass burning plumes, Atmos. Chem. Phys., 11, 12169–12179, https://doi.org/10.5194/acp-11-12169-2011, 2011.
Veres, P. R., Andrew Neuman, J., Bertram, T. H., Assaf, E., Wolfe, G. M., Williamson, C. J., Weinzierl, B., Tilmes, S., Thompson, C. R., Thames, A. B., Schroder, J. C., Saiz-Lopez, A., Rollins, A. W., Roberts, J. M., Price, D., Peischl, J., Nault, B. A., Møller, K. H., Miller, D. O., Meinardi, S., Li, Q., Lamarque, J. F., Kupc, A., Kjaergaard, H. G., Kinnison, D., Jimenez, J. L., Jernigan, C. M., Hornbrook, R. S., Hills, A., Dollner, M., Day, D. A., Cuevas, C. A., Campuzano-Jost, P., Burkholder, J., Paul Bui, T., Brune, W. H., Brown, S. S., Brock, C. A., Bourgeois, I., Blake, D. R., Apel, E. C., and Ryerson, T. B.: Global airborne sampling reveals a previously unobserved dimethyl sulfide oxidation mechanism in the marine atmosphere, P. Natl. Acad. Sci. USA, 117, 4505–4510, https://doi.org/10.1073/pnas.1919344117, 2020.
Wagner, N. L., Riedel, T. P., Young, C. J., Bahreini, R., Brock, C. A., Dubé, W. P., Kim, S., Middlebrook, A. M., Öztürk, F., Roberts, J. M., Russo, R., Sive, B., Swarthout, R., Thornton, J. A., VandenBoer, T. C., Zhou, Y., and Brown, S. S.: N2O5 uptake coefficients and nocturnal NO2 removal rates determined from ambient wintertime measurements, J. Geophys. Res.-Atmos., 118, 9331–9350, https://doi.org/10.1002/jgrd.50653, 2013.
Wang, S. and Li, H.: NO3•-Initiated Gas-Phase Formation of Nitrated Phenolic Compounds in Polluted Atmosphere, Environ. Sci. Technol., 55, 2899–2907, https://doi.org/10.1021/acs.est.0c08041, 2021.
Warneke, C., De Gouw, J. A., Holloway, J. S., Peischl, J., Ryerson, T. B., Atlas, E., Blake, D., Trainer, M., and Parrish, D. D.: Multiyear trends in volatile organic compounds in Los Angeles, California: Five decades of decreasing emissions, J. Geophys. Res.-Atmos., 117, 1–10, https://doi.org/10.1029/2012JD017899, 2012.
Warneke, C., Trainer, M., de Gouw, J. A., Parrish, D. D., Fahey, D. W., Ravishankara, A. R., Middlebrook, A. M., Brock, C. A., Roberts, J. M., Brown, S. S., Neuman, J. A., Lerner, B. M., Lack, D., Law, D., Hübler, G., Pollack, I., Sjostedt, S., Ryerson, T. B., Gilman, J. B., Liao, J., Holloway, J., Peischl, J., Nowak, J. B., Aikin, K. C., Min, K.-E., Washenfelder, R. A., Graus, M. G., Richardson, M., Markovic, M. Z., Wagner, N. L., Welti, A., Veres, P. R., Edwards, P., Schwarz, J. P., Gordon, T., Dube, W. P., McKeen, S. A., Brioude, J., Ahmadov, R., Bougiatioti, A., Lin, J. J., Nenes, A., Wolfe, G. M., Hanisco, T. F., Lee, B. H., Lopez-Hilfiker, F. D., Thornton, J. A., Keutsch, F. N., Kaiser, J., Mao, J., and Hatch, C. D.: Instrumentation and measurement strategy for the NOAA SENEX aircraft campaign as part of the Southeast Atmosphere Study 2013, Atmos. Meas. Tech., 9, 3063–3093, https://doi.org/10.5194/amt-9-3063-2016, 2016.
Wayne, R. P., Barnes, I., Biggs, P., Burrows, J. P., Canosa-Mas, C. E., Hjorth, J., Le Bras, G., Moortgat, G. K., Perner, D., Poulet, G., Restelli, G., and Sidebottom, H.: The nitrate radical: Physics, chemistry, and the atmosphere, Atmos. Environ. A-Gen., 25, 1–203, https://doi.org/10.1016/0960-1686(91)90192-A, 1991.
Westerling, A. L., Hidalgo, H. G., Cayan, D. R., and Swetnam, T. W.: Warming and Earlier Spring Increase Western U. S. Forest Wildfire Activity, Science, 313, 940–943, 2006.
Westerling, A. L. R.: Increasing western US forest wildfire activity: Sensitivity to changes in the timing of spring, Philos. T. R. Soc. B, 371, https://doi.org/10.1098/rstb.2015.0178, 2016.
Williams, A. P., Abatzoglou, J. T., Gershunov, A., Guzman-Morales, J., Bishop, D. A., Balch, J. K., and Lettenmaier, D. P.: Observed Impacts of Anthropogenic Climate Change on Wildfire in California, Earths Future, 7, 892–910, https://doi.org/10.1029/2019EF001210, 2019.
Wolfe, G. M., Marvin, M. R., Roberts, S. J., Travis, K. R., and Liao, J.: The Framework for 0-D Atmospheric Modeling (F0AM) v3.1, Geosci. Model Dev., 9, 3309–3319, https://doi.org/10.5194/gmd-9-3309-2016, 2016 (code available at: https://github.com/AirChem/F0AM, last access: 26 October 2021).
Xie, M., Chen, X., Hays, M. D., Lewandowski, M., Offenberg, J., Kleindienst, T. E., and Holder, A. L.: Light Absorption of Secondary Organic Aerosol: Composition and Contribution of Nitroaromatic Compounds, Environ. Sci. Technol., 51, 11607–11616, https://doi.org/10.1021/acs.est.7b03263, 2017.
Xing, J., Mathur, R., Pleim, J., Hogrefe, C., Gan, C.-M., Wong, D. C., Wei, C., Gilliam, R., and Pouliot, G.: Observations and modeling of air quality trends over 1990–2010 across the Northern Hemisphere: China, the United States and Europe, Atmos. Chem. Phys., 15, 2723–2747, https://doi.org/10.5194/acp-15-2723-2015, 2015.
Yang, Y., Shao, M., Wang, X., Nölscher, A. C., Kessel, S., Guenther, A., and Williams, J.: Towards a quantitative understanding of total OH reactivity: A review, Atmos. Environ., 134, 147–161, https://doi.org/10.1016/j.atmosenv.2016.03.010, 2016.
Yang, Y., Wang, Y., Zhou, P., Yao, D., Ji, D., Sun, J., Wang, Y., Zhao, S., Huang, W., Yang, S., Chen, D., Gao, W., Liu, Z., Hu, B., Zhang, R., Zeng, L., Ge, M., Petäjä, T., Kerminen, V.-M., Kulmala, M., and Wang, Y.: Atmospheric reactivity and oxidation capacity during summer at a suburban site between Beijing and Tianjin, Atmos. Chem. Phys., 20, 8181–8200, https://doi.org/10.5194/acp-20-8181-2020, 2020.
Yokelson, R. J., Andreae, M. O., and Akagi, S. K.: Pitfalls with the use of enhancement ratios or normalized excess mixing ratios measured in plumes to characterize pollution sources and aging, Atmos. Meas. Tech., 6, 2155–2158, https://doi.org/10.5194/amt-6-2155-2013, 2013.
nighttimechemistry thrives and controls the fate of key smoke plume chemical processes.