the Creative Commons Attribution 4.0 License.
the Creative Commons Attribution 4.0 License.
 | 03 Nov 2021
Physical and chemical properties of black carbon and organic matter from different combustion and photochemical sources using aerodynamic aerosol classification
Dawei Hu
M. Rami Alfarra
Kate Szpek
Justin M. Langridge
Michael I. Cotterell
Claire Belcher
Ian Rule
Zixia Liu
Chenjie Yu
Yunqi Shao
Aristeidis Voliotis
Brett Smith
Greg Smallwood
Prem Lobo
Dantong Liu
Jim M. Haywood
James D. Allan
The physical and chemical properties of black carbon (BC) and organic aerosols are important for predicting their radiative forcing in the atmosphere. During the Soot Aerodynamic Size Selection for Optical properties (SASSO) project and a EUROCHAMP-2020 transnational access project, different types of light-absorbing carbon were studied, including BC from catalytically stripped diesel exhaust, an inverted flame burner, a colloidal graphite standard (Aquadag) and controlled flaming wood combustion. Brown carbon (BrC) was also investigated in the form of organic aerosol emissions from wood burning (pyrolysis and smouldering) and from the nitration of secondary organic aerosol (SOA) proxies produced in a photochemical reaction chamber. Here we present insights into the physical and chemical properties of the aerosols, with optical properties presented in subsequent publications. The dynamic shape factor (χ) of BC particles and material density (ρm) of organic aerosols was investigated by coupling a charging-free Aerodynamic Aerosol Classifier (AAC) with a Centrifugal Particle Mass Analyzer (CPMA) and a Scanning Mobility Particle Sizer (SMPS). The morphology of BC particles was captured by transmission electron microscopy (TEM). For BC particles from the diesel engine and flame burner emissions, the primary spherule sizes were similar, around 20 nm. With increasing particle size, BC particles adopted more collapsed/compacted morphologies for the former source but tended to show more aggregated morphologies for the latter source. For particles emitted from the combustion of dry wood samples, the χ of BC particles and the ρm of organic aerosols were observed in the ranges 1.8–2.17 and 1.22–1.32 g cm−3, respectively. Similarly, for wet wood samples, the χ and ρm ranges were 1.2–1.85 and 1.44–1.60 g cm−3, respectively. Aerosol mass spectrometry measurements show no clear difference in mass spectra of the organic aerosols in individual burn phases (pyrolysis or smouldering phase) with the moisture content of the wood samples. This suggests that the effect moisture has on the organic chemical profile of wood burning emissions is through changing the durations of the different phases of the burn cycle, not through the chemical modification of the individual phases. In this study, the incandescence signal of a Single Particle Soot Photometer (SP2) was calibrated with three different types of BC particles and compared with that from an Aquadag standard that is commonly used to calibrate SP2 incandescence to a BC mass. A correction factor is defined as the ratio of the incandescence signal from an alternative BC source to that from the Aquadag standard and took values of 0.821 ± 0.002 (or 0.794 ± 0.005), 0.879 ± 0.003 and 0.843 ± 0.028 to 0.913 ± 0.009 for the BC particles emitted from the diesel engine running under hot (or cold idle) conditions, the flame burner and wood combustion, respectively. These correction factors account for differences in instrument response to BC from different sources compared to the standardised Aquadag calibration and are more appropriate than the common value of 0.75 recommended by Laborde et al. (2012b) when deriving the mass concentration of BC emitted from diesel engines. Quantifying the correction factor for many types of BC particles found commonly in the atmosphere may enable better constraints to be placed on this factor depending on the BC source being sampled and thus improve the accuracy of future SP2 measurements of BC mass concentrations.
- Article
(4030 KB) - Full-text XML
-
Supplement
(309 KB) - BibTeX
- EndNote


Black carbon (BC) and brown carbon (BrC) aerosols are widely investigated components of atmospheric aerosol because they can absorb solar radiation and heat the atmosphere, causing a positive radiative forcing of climate (Bond and Bergstrom, 2006; D. Liu et al., 2020; Bond et al., 2013; Haywood and Shine, 1995). BC is emitted by incomplete combustion processes, including from anthropogenic (e.g. diesel engines) and natural (e.g. flaming combustion in wildfires) sources. BrC aerosols are organic aerosols that absorb light in the visible and near-UV regions and are emitted directly from biomass burning, biofuel combustion and biogenic processes (Ramanathan et al., 2007; Bond, 2001; Andreae and Crutzen, 1997) or formed through the chemical reaction processes in the atmosphere, including the nitration of aromatic compounds (Zhang et al., 2013; Lu et al., 2011; Harrison et al., 2005; Lin et al., 2015), formation of higher molecular-weight oligomers by acid-catalysed aldol-condensation reactions (Shapiro et al., 2009; Bones et al., 2010; Noziere and Esteve, 2007) and reactions of ammonium-containing species with (di)carbonyl species (Maxut et al., 2015; Powelson et al., 2014; De Haan et al., 2017). Typically, the light absorption coefficient for BC and BrC is wavelength-dependent over the visible spectrum, with BrC exhibiting a stronger wavelength dependence characterised by increasing absorption at progressively shorter visible wavelengths (Kirchstetter et al., 2004; Corbin et al., 2019; Voliotis et al., 2017).
Although BC and BrC are very important for climate, they are poorly represented in atmospheric models (Zuidema et al., 2016). This is in part due to the complex microphysical properties of BC and the lack of accurate refractive index (RI) descriptions for both BC and BrC (F. Liu et al., 2020). Fresh soot particles often exist in the form of aggregates composed of primary spherules with an irregular and highly fractal geometry (Xiong and Friedlander, 2001; Wentzel et al., 2003). The morphology of these aggregates changes markedly during the atmospheric ageing process, influencing the corresponding particle size and optical properties (Zeng et al., 2019; Zhang et al., 2008). For example, after condensation of gaseous species such as sulfuric acid or water (under high-relative-humidity (RH) environments) on soot particles, or coagulation with the pre-existing particles, soot particles can experience restructuring, and the shape of the soot particles becomes more similar to a spherical particle (Zhang et al., 2008). The morphology of BC particles can be measured directly by using scanning electron microscopy (SEM) or transmission electron microscopy (TEM) (Fu et al., 2006; Chen et al., 2018; Ellis et al., 2016). However, the SEM/TEM approach only provides particle shape information in two dimensions and does not provide real-time characterisation. Alternatively, the particle morphology can be determined by measuring its size and mass with different techniques (Chen et al., 2018; Decarlo et al., 2004). A conventional approach is to classify particles (generally using a differential mobility analyser, DMA, to select monodisperse particles on their mobility size) and then measure particle mass using a particle mass analyser (Zhang et al., 2008; Park et al., 2003, 2004a, b; Chen et al., 2018; Wu et al., 2019). From the resulting information about particle mass for different particle mobility sizes, the dynamic shape factor (χ, defined as the ratio of the drag force on the particle divided by the drag force on the particle's volume equivalent sphere) and fractal dimensions (Df) can be retrieved (DeCarlo et al., 2004). Mobility-mass fractal dimension (Dfm) has been reported over a wide range of 2.2–2.8 for diesel exhaust particles (Park et al., 2004a). Dfm has been reported as higher than the Df, – defined as the scaling exponents between the radius of gyration of an aggregate and the radius of primary spherules composing the aggregate – but the two are not always directly equivalent, particularly in the transition regime (Sorensen, 2011).
In recent decades, the RI of BC or BrC was derived by measuring the optical properties for particles of controlled size, with studies commonly utilising the DMA to classify charged aerosols on their electrical mobility diameter (Cotterell et al., 2020). However, the DMA approach suffers from transmitting a highly polydisperse and multi-modal distribution in terms of physical size. Since this technique relies on the selection of particles according to their electrical mobility from an aerosol ensemble with a distribution of charges, transmitting particles with a single electrical mobility can be achieved for multiple combinations of particle charge and size. Thus, in addition to singly charged particles of the desired size, larger particles with charge states greater than unity are selected which can impact optical measurements significantly. Careful consideration of the impacts of multiply charged particles on subsequent RI derivations can go some way to reducing uncertainty in the resultant RI, but this nevertheless remains a significant contributor to uncertainty (Cotterell et al., 2020; Zarzana et al., 2014; Miles et al., 2011). Thus, the classification of particles without relying on electrical charge should reduce the uncertainty in refractive index retrievals from measured aerosol optical properties. Important additional considerations in the retrieval of refractive indices from optical spectroscopy data are the aerosol morphology (described above) and mixing state. The mixing state can be probed using the Single Particle Soot Photometer (SP2), which can measure the refractory BC (rBC) mass content and optical size of individual particles. However, the SP2 needs an empirical calibration to retrieve the rBC mass from the incandescence signal (Laborde et al., 2012a). The conventional method to calibrate the incandescence channel of SP2 is using size-selected Aquadag standards (Acheson Inc. USA) and then correcting to a calibration representative of ambient rBC by a constant factor of 0.75 (Laborde et al., 2012b). However, few experiments since have independently verified this across various soot types.
To address the issues mentioned above, the Soot Aerodynamic Size Selection for Optical properties (SASSO) project utilised the Aerodynamic Aerosol Classifier (AAC) to classify particles according to aerodynamic diameter for size and mass distribution measurements and optical evaluation (Tavakoli et al., 2014). Specifically, SASSO has used the AAC size selection of emissions from wood burning, diesel combustion and secondary organic aerosol (SOA) formation, prior to optical measurements using cavity ring-down and photoacoustic spectroscopy with the EXtinction, SCattering and Absorption of Light for AirBorne Aerosol Research (EXSCALABAR) instrumentation, custom-built by the Met Office (Cotterell et al., 2020, 2019a; Davies et al., 2018).
The purpose of this paper is to determine the physical and chemical properties of BC and organic aerosols from different combustion sources representing the combustion of gas (methane), liquid (diesel) and solid (wood) and to examine the variation in calibration SP2 constants for BC particles generated by these combustion sources to enable accurate characterisation of BC mass concentrations and mixing state in future studies. The key objectives of this work are as follows:
-
to develop reliable and repeatable methods of generating isolated BC and BrC using controlled combustion sources and a smog chamber
-
to derive the dynamic shape factor of BC particles and material density for organic aerosols
-
to determine mass spectral profiles of organic aerosols produced from wood combustion from an aerosol mass spectrometer (AMS)
-
to explore the restructuring of BC particles in response to the controlled coating and humidification of aerosol samples
-
to investigate the response of the SP2 incandescence signal to different types of the BC particles.
The optical data presented in this paper are limited to the qualitative characterisation of the materials under investigation for the sake of achieving objective (1). The quantitative parameterisation of the optical properties of the particles and associated development and application of ambient optical property models will be the subject of future publications.
Figure 1 shows our instrument configuration during SASSO. We used the AAC to classify aerosols based on their aerodynamic size prior to characterising the particle size distribution, chemical composition, aerosol mixing state and optical properties for the AAC-selected aerosols. The Centrifugal Particle Mass Analyzer (CPMA) and Scanning Mobility Particle Sizer (SMPS) sampled aerosols downstream of the AAC to measure the mass and mobility size distributions of the AAC-selected particles. A Nafion humidifier and a custom-designed thermal denuder (TD) were used for the BC restructuring test.

Figure 1Schematic diagram of the experimental configuration for (a) wood combustion; (b) SP2 incandescence signal calibration and BC morphology investigation; (c) brown carbon formation and restructuring of BC. The combinations of instruments described in (1), (2), (3) and (4) represent different measurement configurations used to enable characterisation of specific aerosol physiochemical parameters, as described in the main text. The instrument set (1) was used for measurements of aerosol optical properties (and thereby to enable the retrieval of refractive index for BC/BrC aerosols, subject of a future publication) and organic chemical measurement for wood combustion (setup a) and chamber (setup c) experiments; instrument set (2) was used for dynamic shape factor measurements for BC and material density measurement for organic aerosols (setup a and b); instrument set (3) was used for SP2 incandescence signal calibration (setup b); instrument set (4) was used for BC restructuring experiments (setup c).
The right panel in Fig. 1 shows the various instrument configurations used in this study to target different measurements: instrument set (1) was used for measurements of aerosol optical properties (and thereby to enable the retrieval of refractive index for BC/BrC aerosols, subject of a future publication) and organic chemical measurement for wood combustion (setup a) and chamber (setup c) experiments. Instrument set (2) was used for dynamic shape factor measurements for BC and material density measurement for organic aerosols (setup a and b). Instrument set (3) was used for SP2 incandescence signal calibration (setup b). Instrument set (4) was used for BC restructuring experiments (setup c).
2.1 Instrumentation
2.1.1 Aerodynamic Aerosol Classifier (AAC)
The AAC (Cambustion Ltd, Cambridge, UK) is used to select aerosols within a narrow range of aerodynamic diameters and does not suffer from the issue of multiple charges that affects selection using instruments such as the CPMA and DMA. The AAC uses a centrifugal force and sheath flow between two concentric rotating cylinders to produce an aerosol classified by aerodynamic diameter. The detailed information regarding the principle of AAC can be found in Tavakoli et al. (2014).
2.1.2 EXtinction, SCattering and Absorption of Light for AirBorne Aerosol Research (EXSCALABAR)
The EXSCALABAR instrument used in this work was developed by the Met Office (Exeter, UK), which can be operated in both the laboratory and from the UK atmospheric research aircraft (FAAM BAe-146). The operating principle of EXSCALABAR has been described in detail in previous papers (Davies et al., 2018; Cotterell et al., 2020, 2019a, b). In brief, the instrument uses cavity ring-down spectroscopy (CRDS) to measure the dry aerosol extinction at wavelengths of 405 and 658 nm and photoacoustic spectroscopy (PAS) to measure the dry aerosol absorption coefficient at wavelengths of 405, 514 and 658 nm. For deployment during SASSO, all cells shared common sample conditioning; the aerosol sample relative humidity was reduced to <10 % by passing through a Nafion dryer (Perma Pure LLC), and ozone and NOx were removed by an activated charcoal “honeycomb” scrubber (custom-built in-house). The sample passed through an impactor (Brechtel Manufacturing Inc., custom-built for an 8 L min−1 volumetric flow rate) with aerodynamic cut-off (D50) of 1.3 µm before being drawn through a series of flow splitters that evenly distributed the aerosol-laden air samples to the various optical spectrometers, each operating at 1 L min−1. For both the 405 and 658 nm wavelengths, the PAS cells were mounted downstream of the CRDS cells (CRDS-PAS); i.e. the sample passed through the CRDS cell before entering the PAS cell of the same wavelength. All other cells operated in a parallel flow configuration. During the wood combustion experiments, a condensation particle counter (CPC) (Model 3776, TSI, USA) was put in series after the 405 nm CRDS-PAS to measure the number concentration of particles contributing to the extinction and absorption signal. For an additional 405 nm CRDS spectrometer, the aerosol sample passed through a HEPA filter prior to sampling to provide a continuous measurement of the baseline and highlight the presence of any gaseous absorbers affecting measurements at that wavelength. CRDS and PAS measurements rely on characterisation of the aerosol-free background. Before and after each wood combustion experiment (run), sample flow was routed through a HEPA filter immediately after EXSCALABAR's common sample inlet section to provide baseline measurements of empty-cavity ring-down time and background photoacoustic response for all CRDS and PAS spectrometers, respectively. During the Manchester chamber experiments, the CPC was fitted in parallel with the sample lines, and automated baseline measurements were made every 10 min. PAS cells with improved sensitivity – as described by Cotterell et al. (2019b) – were gradually implemented during 2019; only the 405 nm dry absorption measurement used the new cells during the Wildfire lab wood combustion experiments, but all cells were upgraded by the start of the Manchester aerosol chamber experiments. The PAS cells were calibrated using ozone before and after each set of experiments as well as at least every working week during the experimental periods, as described by Davies et al. (2018) and discussed further by Cotterell et al. (2019a).
2.1.3 Single Particle Soot Photometer (SP2)
The refractory black carbon (rBC) mass concentration was measured by a SP2 (Droplet Measurement Technologies, Colorado, USA). The SP2 uses the laser-induced incandescence to measure the rBC mass and optical size of individual BC particles with an intra-cavity Nd:YAG laser operating at 1064 nm. The particle size can be determined by detecting the laser signal scattered by particles, with the scattering intensity maximum related to the optical particle diameter through a calibration using polystyrene latex spheres. The optical size of BC-containing particles is determined by matching the measured scattering signal with calculations from light scattering calculations assuming a core–shell structure (core–shell Mie theory) (Moteki and Kondo, 2007). Because the scattering signal of the absorbing particle will be distorted during its transit through the laser beam due to the mass loss by laser heating, the leading edge scattering signal before the onset of volatilisation is extrapolated to reconstruct the scattering signal of the absorbing particles (Gao et al., 2007; Liu et al., 2014). This calibration was performed at the start of the measurement campaign. For those particles which contain absorbing materials such as the refractory BC, they will absorb 1064 nm light and then heat up and emit visible thermal radiation (incandesce). This incandescence signal is directly proportional to the mass of rBC as determined by a calibration (Liu et al., 2010) with generated BC aerosols of known or independently measured mass. In the atmosphere, besides BC, other materials (e.g. some metals and minerals) can incandesce at 1064 nm as well. However, as boiling-point temperatures of these materials are rather different to that of black carbon, it is easy to distinguish them in measurements made using the SP2 equipped with an additional narrowband incandescence detector, such as the one used here (Liu et al., 2018). Recently, Sedlacek et al. (2018) demonstrated that charring of light-absorbing organic particles at 1064 nm can produce the refractory black carbon and then overestimate the rBC mass concentration; however this does not affect pure BC particles, and we saw no evidence for an incandescence signal associated with the pure organic particles measured in this study. We investigated the effectiveness of this calibration from different types of BC particles in this study and report the outcomes of these investigations in Sect. 3.3.
2.1.4 High-resolution aerosol mass spectrometer (HR-AMS)
Non-refractory aerosol chemical compositions including sulfate, nitrate, ammonium, chloride, and organics were measured by a HR-AMS in real time. The HR-AMS was operated in fast mode to capture the fast transition of the combustion phase during the wood combustion experiment (Kimmel et al., 2011). The instrument operation and data analysis of HR-AMS have been described in detail elsewhere (Alfarra et al., 2006; Allan et al., 2003, 2004; DeCarlo et al., 2006). The ionisation efficiency of the AMS was calibrated using monodisperse ammonium nitrate particles according to the method described by Jayne et al. (2000) at various times during the experimental periods.
2.1.5 Centrifugal Particle Mass Analyzer (CPMA)
The CPMA (Cambustion Ltd., Cambridge, UK) uses opposing electrical and centrifugal fields to classify particles according to their mass-to-charge ratio. The ability to vary the electrical field and rotation speed enables particle selection based on their mass. The principles and operation of the CPMA have been described elsewhere (Olfert and Collings, 2005; Olfert et al., 2006). Combining the CPMA with a CPC (Model 3776, TSI, USA) and scanning across the mass range of interest provides the bulk aerosol mass size distribution. As the CPMA uses an electrical classification method to select particles, it also suffers from an issue of multiple charging similar to a DMA, and it has problems associated with a fraction of the uncharged particles that are also transmitted, particularly at the lower rotation speeds. In this study, an electrical ioniser (MSP Corp., USA) was used for wood combustion experiments, and a 90Sr radioactive ioniser was used for chamber experiments to neutralise particles before they were sampled by the CPMA.
2.1.6 Scanning Mobility Particle Sizer (SMPS)
Aerosol size distributions in the diameter range from 14.9 to 673.2 nm were measured by a commercial SMPS (TSI, USA, employing a model 3082 classifier unit, 3081 DMA and 3786 CPC) with sheath and sample flow rates of 3 L min−1 and 0.3 L min−1, respectively. The DMA was operated in scanning mode, with a scan time of 60 s and a retrace time of 4 s. The particle size distribution was corrected for multiple charge effects and diffusion loss using the standard inversion algorithm in the SMPS software (AIM version 10). Before the experiment, the SMPS was calibrated using NIST-certified polystyrene latex spheres (PSLs, Thermo Fisher Inc.).
2.1.7 Transmission electron microscopy (TEM) sampling and analysis
To investigate morphological properties, BC particles were collected on carbon-coated copper grids using an electrostatic sampler (ESPnano, DASH Inc., USA) (Miller et al., 2010) for transmission electron microscopy (TEM) analysis. The grids were analysed using a FEI Titan operated at 300 kV. Several areas of the grid were imaged to provide representative images for each sample since both the grid film and particles contained carbon.
2.1.8 Thermal denuder (TD)
We explored the impacts of the partitioning of coating materials on the structure of BC. For this BC restructuring experiment, a thermal denuder was utilised to remove the coating materials on coated BC particles. The home-built TD consisted of a stainless steel tube in a temperature-controlled furnace (Voliotis et al., 2021). The TD had a length of 0.97 m and an internal diameter (i.d.) of 0.15 m. Aerosols entered and exited the TD unit via a cylindrical 0.12 m long and 0.037 m i.d. stainless steel compartment. The temperature in the heating section (0.51 m × 0.15 m i.d.) was controlled by four PID controllers (Watlow EZ-ZONE) with additional temperature sensors on the outside of the tube. It is necessary to ensure flow through the TD whenever it is heated, even when bypassed, to allow for measurements of the unheated sample. A vacuum line maintained 2.0–2.5 L min−1 through whichever of the bypass or TD line was not in use. The residence time of the air sample in the heating section was 216–270 s. The TD was given 30 min for its temperature to stabilise before sampling. The temperature of the TD was calibrated by measuring the temperature at the axial centre of the denuder's heating zone. In this study, the purpose of the TD is to remove as much of the organic coatings from the combustion-generated particles as possible, rather than probing the volatility properties of the coating. Therefore, all heating zones of the TD were set to their maximum temperature of 180 ∘C. This upper temperature is lower than that achieved by other commercial TD units and minimises the risks of charring.
2.1.9 Nafion humidifier
The multi-tube Nafion humidifier in the Manchester home-made Hygroscopicity Tandem Differential Mobility Analyzer (HTDMA) system was used for the BC restructuring experiment. The principle and configuration of the HTDMA system including the Nafion humidifier flow system can be found in Good et al. (2010). The RH in the Nafion humidifier was controlled by adjusting the relative mixing ratio of dry air from a compressed air source with humidified air generated by bubbling compressed air through a water-filled glass bulb.
2.1.10 The Manchester Aerosol Chamber
The Manchester Aerosol Chamber comprises an 18 m3 collapsible Fluorinated ethylene propylene Teflon bag (3 m (H) × 3 m (L) × 2 m (W)). It was used by Alfarra et al. (2012) to investigate the effect of photochemical ageing and initial precursor concentration on the composition and hygroscopic properties of secondary organic aerosol. The chamber was run as a batch reactor in which the composition of the gaseous precursors, oxidising environment, primary emissions or seed particles, relative humidity and temperature were controlled. Air was supplied to the chamber by a blower at a flow of 3 m3 min−1. The air was dried and filtered for gaseous impurities and particles using a series of Purafil (Purafil Inc., USA), charcoal and HEPA filters (Donaldson Filtration, USA) prior to humidification with ultrapure deionised water. Halogen bulbs and two 6 kW Xenon arc lamps were mounted on the inside of the enclosure housing the bag, which was coated with a reflective space blanket (mylar) to maximise the irradiance in the bag and to ensure even illumination. The Xenon arc lamps were mounted on two opposite sides of the enclosure at different heights. The combination of illumination was tuned and evaluated to mimic the atmospheric actinic spectrum over the wavelength range 290–800 nm and had a maximum total actinic flux of 1.4 × 10¹⁴ (photon s−1 m−2 nm−1) over the region 460–600 nm. The calculated j(O1D) value during the reported experiments was 1.23 × 10⁻⁵ s−1 (290–340 nm), and j(NO2) was 1.5 × 10⁻³ s−1 (290–422 nm). The relatively large volume of the chamber allows the dilute sample to be held for several hours without significant aerosol removal from wall losses, allowing for the study of particles introduced directly or formed within the chamber over a period of several hours. The mean number and mass wall loss rates of particles inside the chamber were estimated as 9.17 ± 1.3 and 8.16 ± 1.5 × 10⁻⁵ s−1, respectively (Shao et al., 2021). Further details on the chamber are given by Alfarra et al. (2012).
2.1.11 Diesel engine
The engine used in this study was a Volkswagen 1.9 L SDI light-duty diesel engine (EURO 4 car equivalent), mounted on a test rig (CM12; Armfield Ltd., Hampshire, UK) and coupled to an eddy current dynamometer. This setup was used for investigating the light absorption properties of black carbon aerosol by Liu et al. (2017) previously. The engine throttle and the load on the dynamometer were controlled with dedicated software. The engine exhaust was passed through an oxidising catalytic converter (a retrofitted diesel oxidation catalyst consisting of a mixture of platinum and rhodium) followed by a standard Volkswagen silencer then a computer operated pneumatic valve connected to the chamber, with 2 in. i.d. stainless steel tubing between each component. The whole length of the exhaust line was 4 m. The fuel used was standard UK low-sulfur diesel, obtained from a local fuel station.
For each run, the engine was started and warmed up at 2000 rpm with 30 % load. Once the engine reached a steady temperature (after ∼ 10 min), a controlled amount of the exhaust was injected into the Manchester Aerosol Chamber by switching the valve for a set time (this condition is denoted as “hot engine”). For the cold-start runs (in which no throttle or load was applied, denoted as “cold idle”), the exhaust sample was injected within a minute of the engine starting.
2.1.12 Inverted flame burner
A miniature inverted soot generator (MISG; Argonaut Scientific) operated with propane was used to generate black carbon aerosol. The design, operation and performance of the MISG have been previously reported (Kazemimanesh et al., 2019; Moallemi et al., 2019). The MISG was operated under two conditions: with the flow rate of propane and air at 0.0625 and 10 L min−1 respectively (Condition 1) and 0.0625 and 7.5 L min−1 respectively (Condition 2). Under these two conditions, the MISG produces black carbon with average elemental carbon total carbon of 95 %, determined via thermal-optical analysis.
2.2 Derivation of aerosol dynamic shape factor and material density
In this study, the SMPS and CPMA were arranged downstream of the AAC to measure the mobility diameter (Dm) and mass (Mp) of the particles within a narrow size range selected by the AAC based on their aerodynamic diameter (Da). These parameters enabled the dynamic shape factor (χ) of the BC particles to be derived by using Eq. (1) under the assumption that the density (ρp) of pure BC is 1.8 g cm−3 DeCarlo et al., 2004),
in which C(D) is the Cunningham slip correction factor for a particle of diameter D using the parameters specified by Kim et al. (2005), and Dve is the volume equivalent diameter, which can be calculated from Mp using Eq. (2).
χ can also be determined by using the specified Da in combination with the SMPS-measured Dm. Specifically, we can calculate Dve from Da for an initial value of χtrial using Eq . (3):
in which ρ0 is the reference density (1 g cm−3). This value Dve is then substituted into Eq. (1) to calculate χ. We then iterate through a range of χtrial until χ and χtrial converge. The equations were solved iteratively using Brent's standard method solver (“findroots” command, Igor Pro version 6.36, Wavemetrics).
In addition, the material density (ρm) of organic aerosols can be calculated from Eqs. (4) and (5) by assuming the organic particles are spherical (i.e. χ=1) (Adachi et al., 2019).
2.3 Experimental methods
2.3.1 Wood combustion experiment
Our wood combustion experiments were designed to expand on the studies reported by Haslett et al. (2018) to produce repeatable combustion events with discernible transitions between the three burning phases of pyrolysis, flaming and smouldering combustion. Haslett et al. (2018) used the FM Global Fire Propagation Apparatus (FPA) (FTT, East Grinstead, UK) as their controlled ignition source, while we used the iCone Calorimeter (Fire Testing Technology, FTT, East Grinstead, UK), located in the wildFIRE laboratory at the University of Exeter (Fig. 1a). The main difference between the FPA and iCone approaches is that the there is a forced flow of air from beneath the sample in the FPA, whereas in the iCone the sample sits in ambient air conditions. Otherwise, both approaches rely on oxygen consumption calorimetry to measure the heat release rate from a burning object.
The aim of the wood combustion experiments was to produce different phases of combustion that were as well separated as possible, rather than under natural burning conditions. This allowed the aerosol emissions from different burn phases, pyrolysis, flaming and smouldering, to be analysed separately. Three core wood types were selected for all the experiments which we hypothesised would produce different burn conditions, i.e. different durations of pyrolysis, flaming and smouldering. These wood types were Sequioadendron giganteum (Giant Redwood), Pinus sylvestris (Scots pine) and Populus nigra (poplar), with bulk densities of 0.45, 0.51 and 0.4 × 10³ kg m−3 respectively. The Giant Redwood and Scots pine are gymnosperm “softwoods”, with the former considered to have low density and the latter a high density, while the poplar is a low-density angiosperm “hardwood” species. In addition, we also sampled combustion emissions from Thuja plicata (Western red cedar) with a bulk density of 0.38 × 10³ kg m−3. Both Scots pine and Western red cedar are resin-rich, while the Giant Redwood contains less resin, and the poplar contains barely any resinous compounds. Hence, all should be capable of producing different volumes and types of aerosol particles. There are many factors that can influence composition and properties of generated aerosols during combustion, such as the wood resin content and moisture content, which would result in a highly extensive variable set. In the work presented here, we only focus on the influence of water content of wood samples on the physical and chemical properties of the particles from wood combustion. We assessed wood of two different levels of fuel moisture: fully oven-dried samples and moist samples with ∼ 25 % moisture content.
During the experiment, a wood sample ( (mm): ) was first placed into a custom-made stainless steel basket and then exposed to a radiant heat flux of 40 kW m−2 using the iCone Calorimeter. This radiant heating thermally decomposes the wood sample and generates volatile gases (pyrolysate) as the wood begins to pyrolyse. A continuously operated spark igniter that was positioned in the released stream of pyrolysate acted as a source of ignition. Immediately following the initial placement of the wood sample under the radiant heat source, pyrolysate was continuously released, and the pyrolysate concentration immediately above the wood sample and in the vicinity of the spark igniter increased also. The sample ignited once this pyrolysate reached sufficient concentrations and was well mixed with the surrounding air, at which point the igniter was switched off and removed from the air flow. Measurements were taken as soon as a sample was exposed to the radiant heat flux. Each sample was allowed to flame for 5 min and the aerosols captured from this phase, and then the flames were snuffed out manually leaving the fuel smouldering so that separate measurements of the smouldering phase could be taken alone for a further 5 min.
Throughout the experiment, the exhaust emissions from combustion were collected in a hood and entered into an exhaust duct. The concentration of oxygen, carbon dioxide and carbon monoxide in the exhaust gas was measured by gas analysers integrated into the iCone system and used to calculate the heat release rate from the burning fuel. We installed an outshoot on this duct to allow part of the exhaust to be carried to a separate sampling system that allowed for the measurement of the aerosol properties in the exhaust. Thus monitoring could occur in real time by the instruments (described above and shown in Fig. 1), after the exhaust was diluted with the compressed air through a set of Dekati DI-1000 ejector diluters.
2.3.2 SP2 incandescence signal calibration and BC morphology investigation experiment
For the purposes of SP2 incandescence signal calibration and morphology investigation of BC particles, three types of the BC particles other than those emitted from wood combustion were investigated through chamber experiments (Fig. 1b). For the BC particles generated by the MISG, BC particles were introduced into the chamber through a Dekati DI-1000 ejector diluter. For the BC particles from the Aquadag standards, the Aquadag standard was first generated by an aerosol atomiser (Topas ATM 226) and then passed through a diffusion dryer (using silica desiccant) prior to entering the chamber. For the BC particles emitted from the engine, a hot engine running condition (2000 r.p.m., 30 % load and 10 min warm-up) and a cold idle condition were investigated. After the BC mass concentration had accumulated to adequate levels in the chamber, a catalytic stripper (operated at 350 ∘C, Model CS10, Catalytic Instruments, Germany) was used to remove the coatings on the BC particles before they were sampled by the instruments.
2.3.3 SOA formation through chamber experiments
For the purpose of testing models of BC and SOA mixing during the SASSO project, two procedures for generating SOA were used: one that yielded non-absorbing SOA and one that produced brown carbon. Experiments were conducted in the photochemical aerosol reaction chamber at the University of Manchester. During the experiment, NO2 (10 % , with a balance gas of high-purity N2 (BOC, UK)) was injected directly into the bag from a custom-made gas cylinder via stainless steel tubing, and its concentration was measured using a chemiluminescence gas analyser (Model 42i, Thermo Scientific, MA, USA). After the NOx concentration in the bag reached the desired value, the precursor volatile organic compound (VOC) was injected into a heated glass bulb (80 ∘C) and flushed into the bag with high-purity nitrogen. Subsequently, chamber lights were turned on to trigger SOA formation. The EXSCALABAR system was used to determine the light absorption properties of the formed SOA particles in real time throughout the experiment.
In this study, 50 ppb NOx and 250 ppb α-pinene (Sigma-Aldrich) was used to form non-absorbing SOA; this route to forming non-absorbing SOA is well characterised and has been reported previously (Nakayama et al., 2010). Here, we only focus on the methodology used to produce the brown carbon SOA. Previous work has reported “brown” SOA formation through oxidation of aromatic precursors under high-NOx conditions (Laskin et al., 2015). In this study, we injected ∼ 400 ppb cresol (Sigma-Aldrich) and ∼ 15 ppb NO2 (∼ 60 ppb NOx in the chamber) into the chamber and removed the UV filter from one of the Xenon arc lamps to increase photochemistry and accelerate and enhance the “brown” SOA formation.
2.3.4 BC restructuring experiment
For the purpose of testing the influence of organic coatings and relative humidity on the structure of the BC particles, a series of experiments were conducted in this study. First, bare BC particles with minimal accompanying VOCs were injected into the chamber by using an oxidising catalytic converter, heated ejector dilutors, a catalytic stripper, Purafil, and activated charcoal denuders between the exhaust line of the engine and the chamber inlet. After the BC reached the desired concentration, BC injection was stopped. The particle size distribution of the dried bare BC particles was scanned by the AAC. In addition, the particle size distribution of the dried bare BC particles following “humidity cycling”, i.e. exposure to 90 % RH for around 10 s and then dehydration to 10 % RH, was measured by AAC for comparison. Afterwards, we injected 50 ppb NOx and 250 ppb α-pinene into the chamber. Photochemical reaction was initiated by turning the chamber lights on, and organic materials condensed onto the BC particles. After the condensed organics equilibrate with the surrounding VOCs and the particles stabilised at a certain size (295 nm in aerodynamic size), the aerodynamic particle size distribution of the dried organic-coated BC particles, and that of the dried organic-coated BC particles experienced the humidity cycling, was measured by AAC. Hereafter, a thermal denuder operated at 180 ∘C was added, and the organic coatings of the coated BC particles, that had either experienced the humidity cycling process or not, were removed by the TD, and then the size distribution of the BC core was measured by the AAC and SMPS.
3.1 Evolution of BC and organics through wood combustion process
Figure 2 shows an example time series of the rBC and organic aerosol (OA) emitted during combustion for a representative wood sample. Throughout the wood combustion experiment, noticeable changes in BC and OA concentrations in the exhaust gases were observed. Following exposure of a wood sample to the heat flux of the iCone and prior to ignition, a clear signal corresponding to the production of organic aerosols was observed. For these pyrolysis-phase aerosols, the ratio of the OA mass (MOA, measured by the AMS) to the sum of masses attributed to OA and rBC (MrBC, measured by SP2, ) was ∼ 1.0, implying that aerosols produced during the pyrolysis phase of combustion were composed dominantly of organic species. This organic material must be due to the early stages of pyrolysis where compounds of cellulose and hemicellulose within the wood are being broken down during its thermal decomposition and the surface of the wood begins to char. We suggest that these pyrolysis-phase aerosols are formed from the condensation of volatile gases into the condensed phase as the aerosol plume lofts upwards away from the heat source of the iCone and into the cooler environment of the exhaust system.
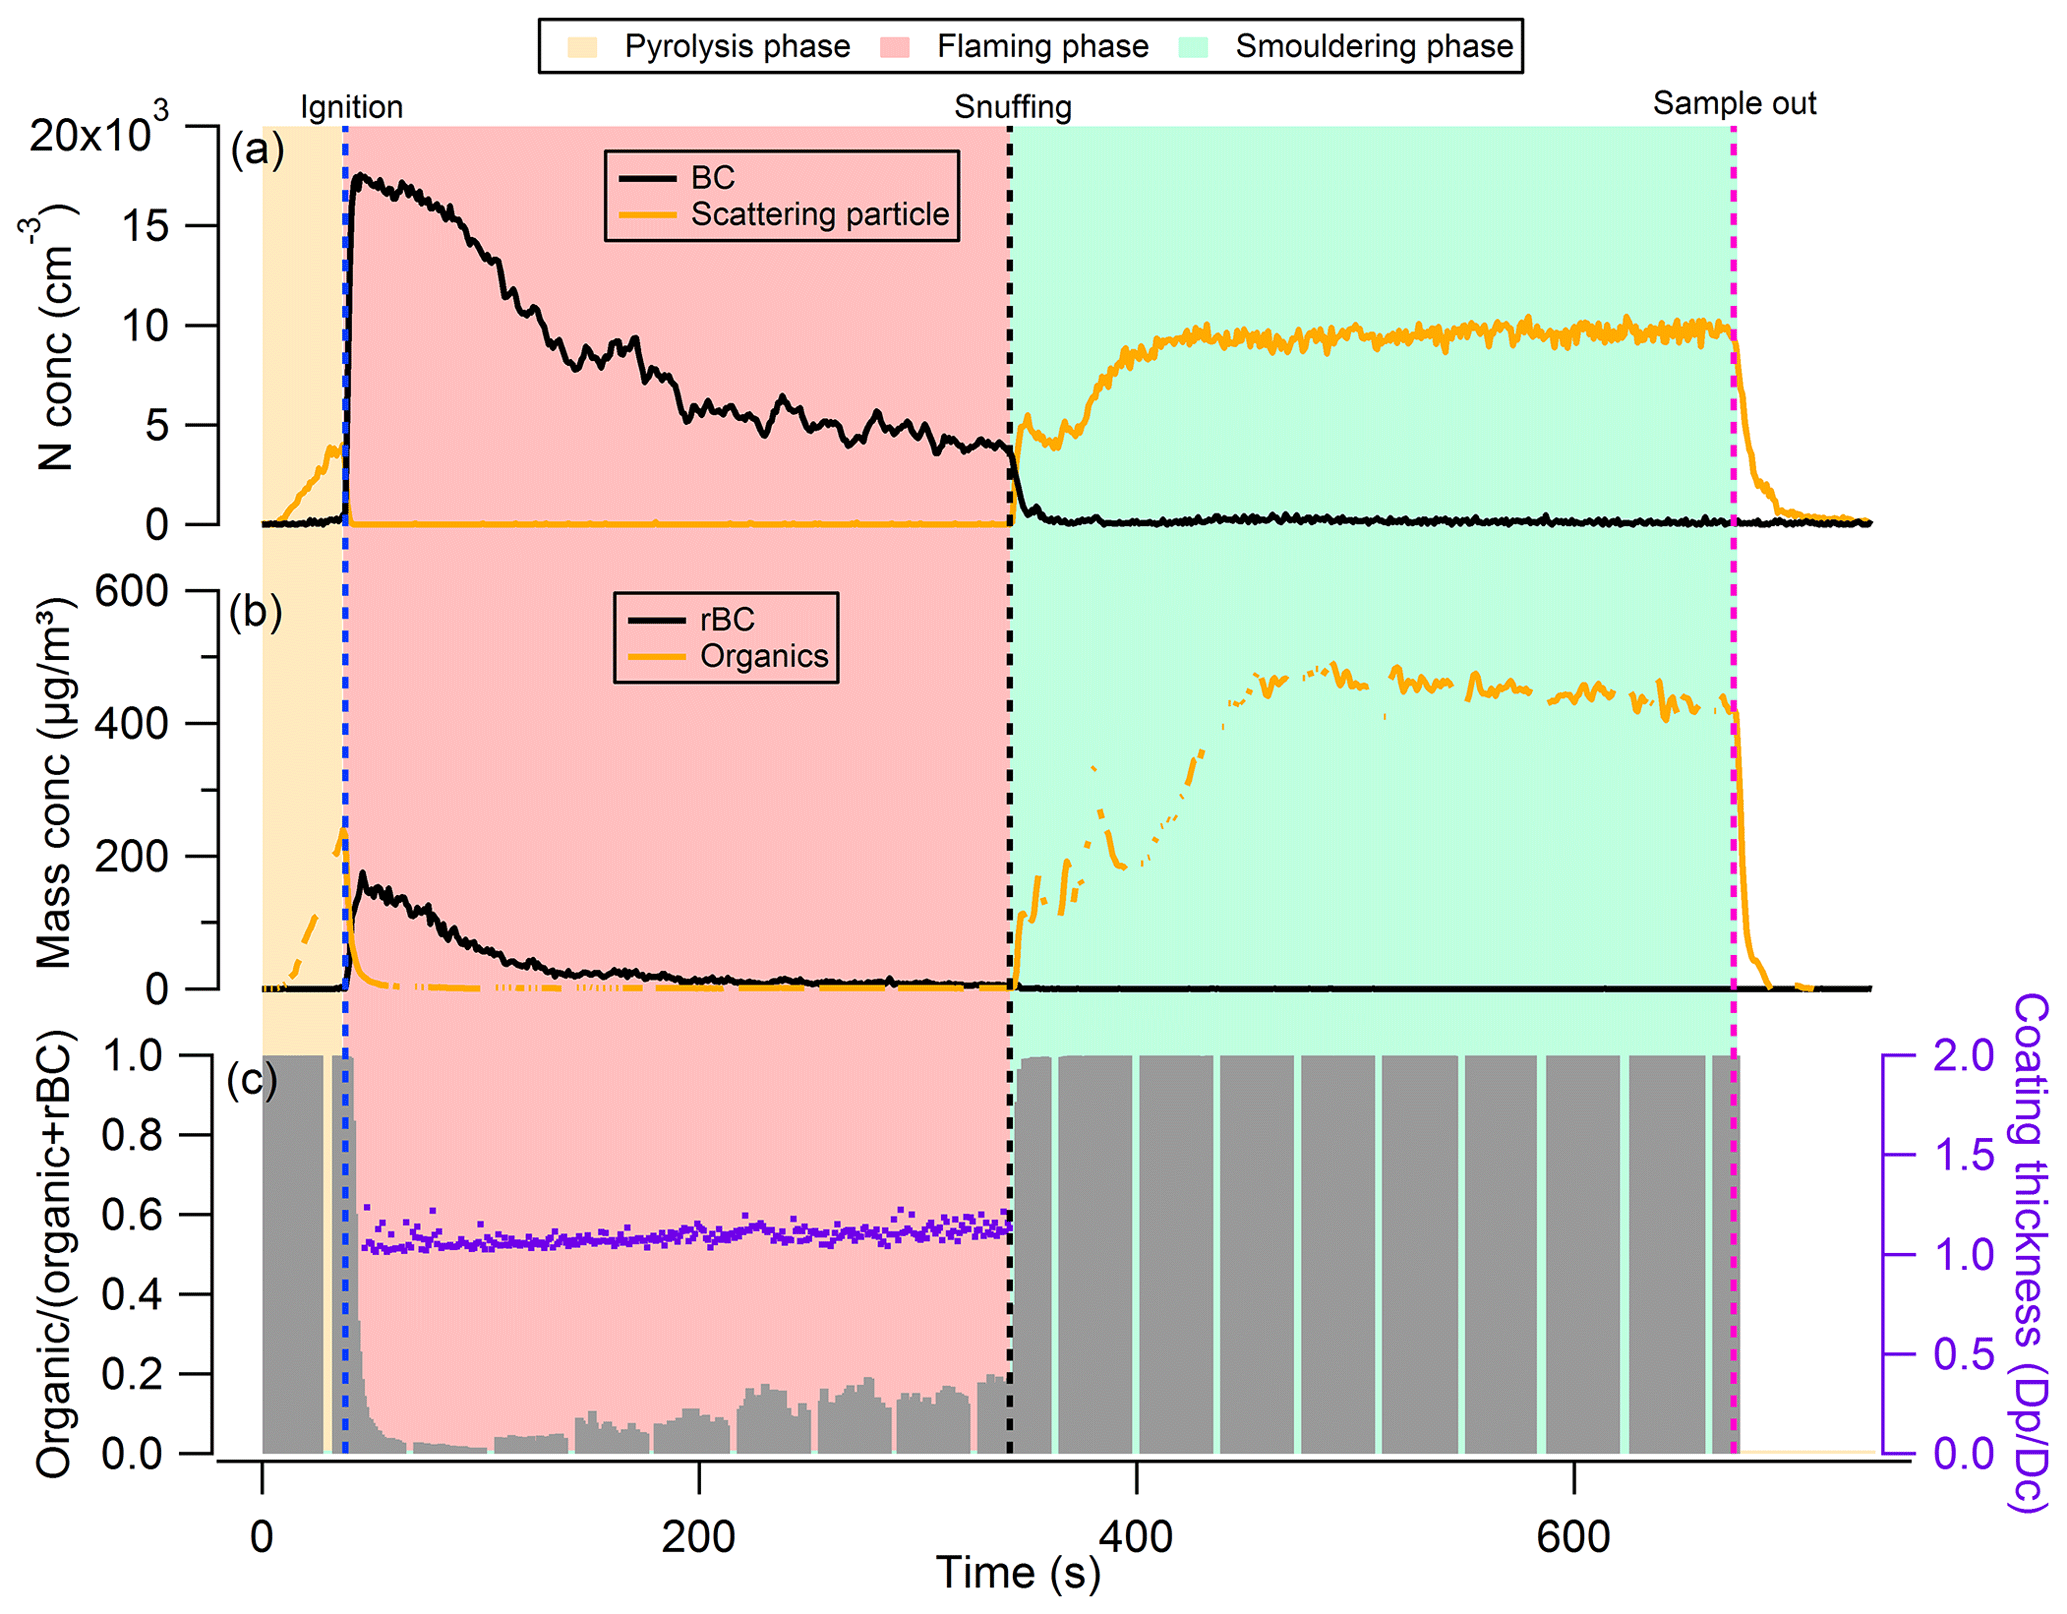
Figure 2Example of the phase transitions between different burn phases of dry Giant Redwood: (a) number concentration of black carbon and the scattering particles detected from SP2; (b) mass concentration of rBC and organics measured by SP2 and AMS, respectively; and (c) mass ratio of organic aerosol to total aerosol.
Immediately after ignition, the number (and mass) concentration of the OA decreased abruptly, while the rBC mass concentration increased sharply to 150 µg m−3 (Fig. 2). We refer to this combustion phase following ignition as the flaming phase. The rOA at the onset of flaming combustion (the first 90 s after ignition) is less than 0.05, indicating that most of the emitted aerosols during this period are BC. As flaming combustion progressed, the extent and depth of charring increased, and as the flammable gas flux slows, the flame begins to diminish. Char is a strong insulator, and hence the char layer forms an obstacle to the conduction of heat into the lower uncharred layers of wood, reducing the production rate of the flammable gases and decreasing the rate of heat release from combustion. As flaming subsides, the number (and mass) concentration of BC particles decreases (Fig. 2), and the rOA increased to around 0.2 after 300 s after the ignition.
After ∼ 300 s (5 min) from the time of ignition, the flames were snuffed manually to force the combustion from the flaming to the smouldering phase, thus transitioning the oxidation reaction from that on gas-phase species to direct oxidation of the solid fuel. Figure 2 shows that the number (and mass) concentration of rBC in the smouldering phase decreased abruptly as flaming combustion ceased, and the OA concentration increased sharply. The rOA was 1.0 during this period, indicating that almost all the emitted aerosols are composed of organic species only.
3.2 Brown carbon formation
As shown in Fig. 3, after the precursors (∼ 400 ppb cresol and ∼ 60 ppb NOx) were introduced into the chamber and the lights were switched on, the SOA started to form, and the particle size increased to ∼ 200 nm after 40 min. Over this same time period, we measured increasing aerosol absorption and extinction coefficients; the single scattering albedo (SSA) was observed to increase sharply at the onset of the SOA formation and then stabilised at around 0.81 (at 405 nm) eventually. Most of the evolution in SSA (i.e. increasing over time) is expected to be caused by the increase in particle size over a size range where SSA is very sensitive to particle size. We emphasise that we did not inject any primary ozone in this experiment, and the abrupt increase in apparent ozone concentration around the time of VOC injection is likely caused by the cresol (as an aromatic compound) causing optical interference in the ozone instrument.

Figure 3Formation and evolution of the brown carbon with the precursor of cresol and NOx in the chamber.
3.2.1 SP2 incandescence signal calibration with different types of BC particles
The most common way to calibrate the incandescence channel of SP2 is using monodisperse Aquadag standards (Acheson Inc. USA), which are then corrected for ambient rBC by applying a constant factor of 0.75 based on a previous laboratory comparison (Laborde et al., 2012b). As the incandescence signal is not independent for the different types of BC particles, using a constant factor of 0.75 may represent an uncertainty in the retrieved BC mass concentration. Thus, quantifying the correction factor for many types of BC particles found commonly in the atmosphere may enable better constraints to be placed on this factor depending on the BC source being sampled, thus improving the accuracy of future SP2 measurements of rBC mass concentrations. The broad range of BC aerosols generated in this study from different combustion sources served as an ideal platform to assess the variation in this correction factor to SP2-derived rBC mass.
In this study, the incandescence signal of the SP2 was measured for BC particles from catalytically stripped diesel engine exhaust emissions, an inverted flame burner and controlled flaming wood combustion, respectively, and compared with that measured from an Aquadag standard. The uncertainties here refer to precision of the fitted parameters reported by the Igor Pro fitting algorithm, based on analysis of residual data. As shown in Fig. 4, for the BC particles emitted from the diesel engine under hot engine and cold idle conditions (Fig. 4a), the slopes of the incandescence signal with BC mass are 0.821 ± 0.002 and 0.794 ± 0.005 times of that measured from the Aquadag standard, respectively. Note that while some deviation from a perfect linear response is noted, this is small compared to the variation in slopes, so it represents a minor source of uncertainty in comparison. These correction factors are 9.4 % and 5.6 % different, with the common value of 0.75 (with the uncertainty less than 5 %) recommended by Laborde et al. (2012b) when deriving the mass concentration of BC emitted from diesel engines. For the BC particles generated from the flame burner (Fig. 4b), the correction factor is 0.879 ± 0.003. Meanwhile, for the BC particles emitted from the flaming phase during the combustion of Scots pine, poplar, Giant Redwood or Western red cedar, the correction factors are 0.913 ± 0.009, 0.906 ± 0.014, 0.889 ± 0.027 or 0.843 ± 0.028, respectively. We stress that, for the SP2 calibrations here from wood combustion emissions, the BC particles were not treated with a catalytic stripper before sampling by the SP2. While coating materials may char under 1064 nm to produce refractory black carbon and therefore cause overestimates in the incandescence signal (Sedlacek et al., 2018), as shown in Fig. 2c, the BC particles generated at the beginning of the flaming phase contained almost no organic species, with rOA values less than 0.05. Even if this organic carbon (OC) were to be converted to elemental carbon (EC) with 100 % efficiency (which we consider to be highly unlikely), this would represent a very small error.

Figure 4The incandescence signal of the SP2 as a function of the rBC mass. BC particles were selected by the CPMA from (a) engine emission, (b) burner emission or (c) wood combustion emission.
The differences in the correction factors derived in this study with the default value of 0.75 are 9.4 % (5.6 %), 17.2 % and 12.4 %–21.7 % for the BC particles emitted from an engine with hot engine (or cold idle) condition, a flame burner and wood combustion, respectively. We recommend that future studies utilising the SP2 for rBC mass concentration measurements use SP2 calibrations with the same type of BC as that to be studied.
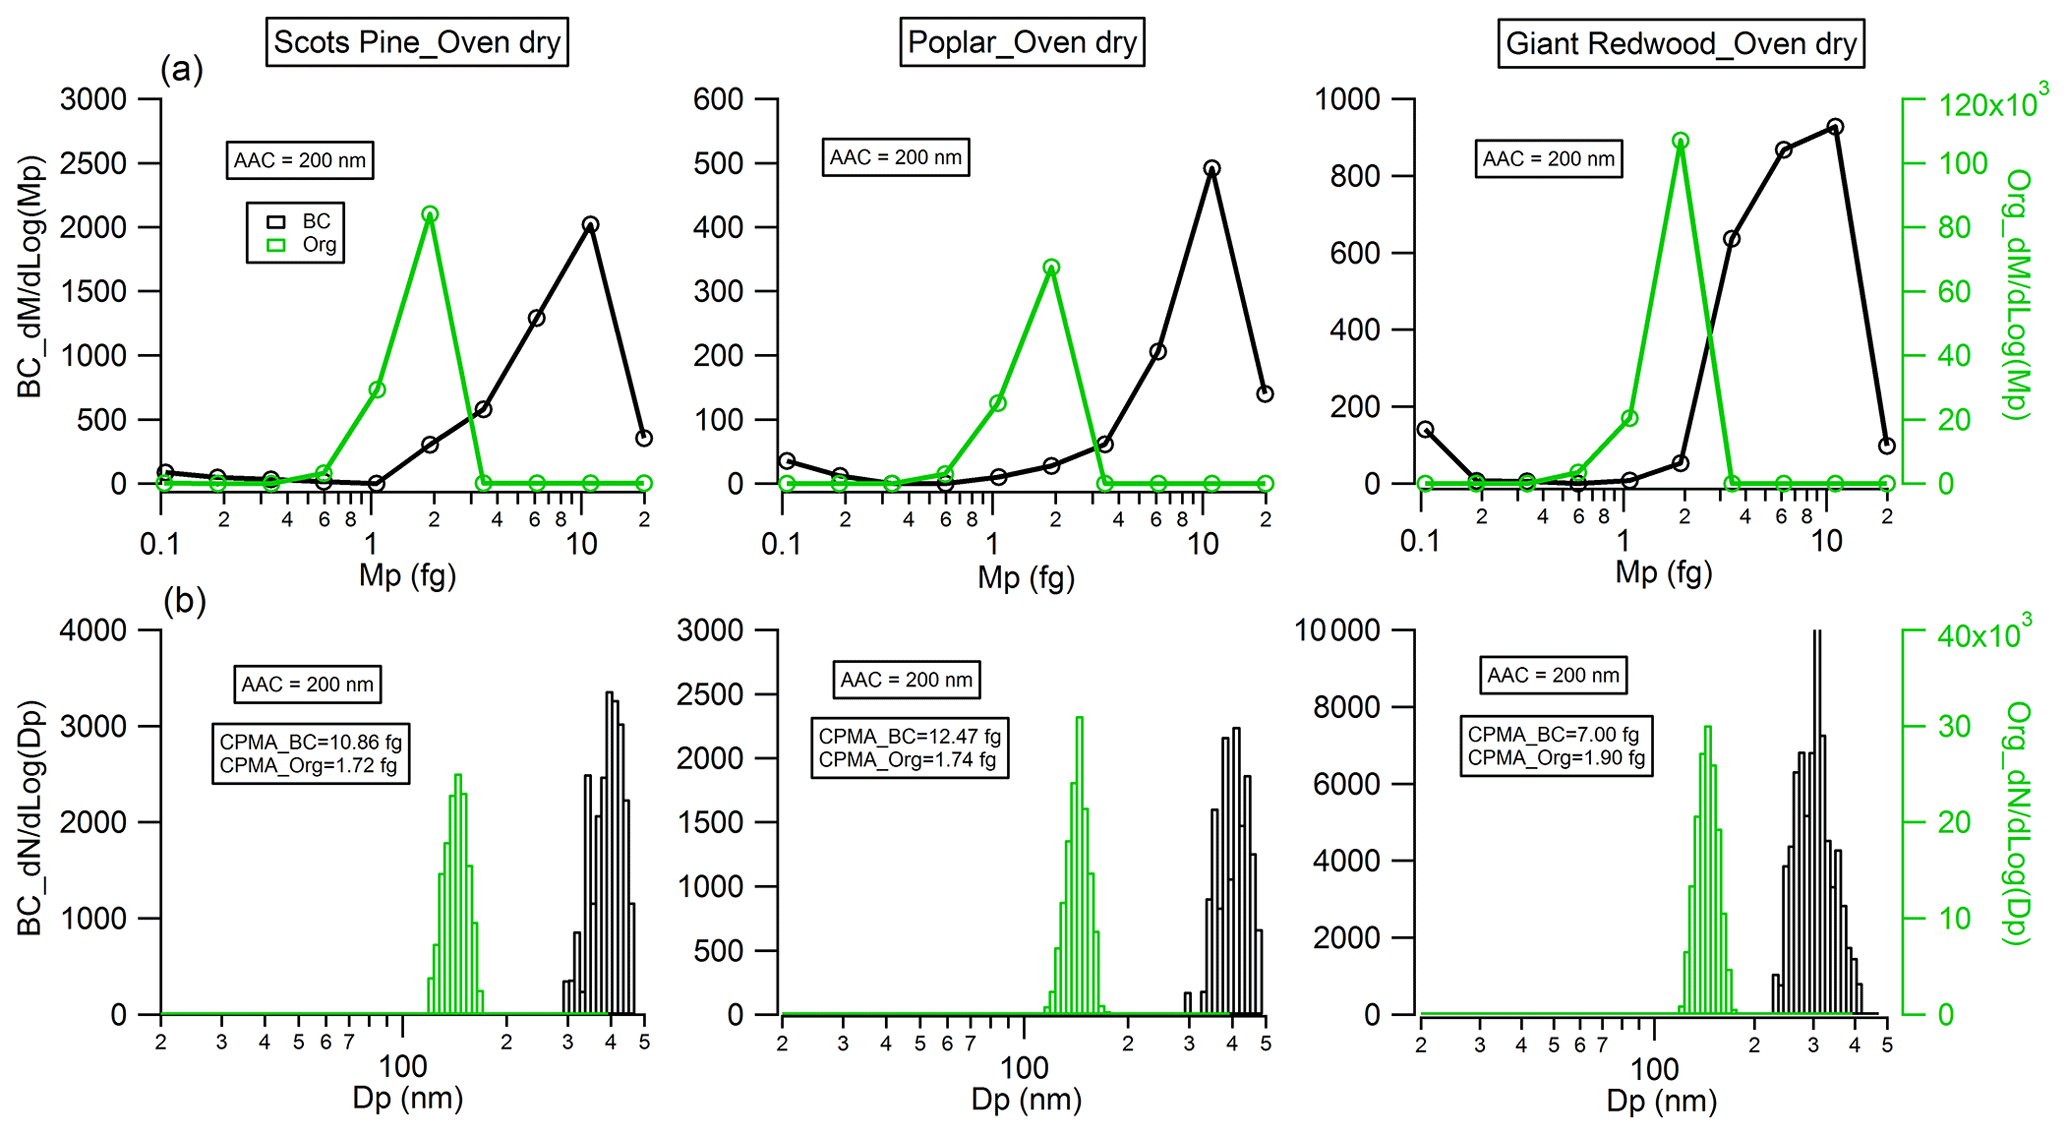
Figure 5Physical properties of monodisperse (Da=200 nm) black carbon (flaming phase) and organic particles (smouldering phase) emitted from wood combustion: (a) mass distribution measured by CPMA; (b) particle number distribution measured by the SMPS after the CPMA selected particles at the mass peak of the Da=200 nm particle mass distribution presented in (a).
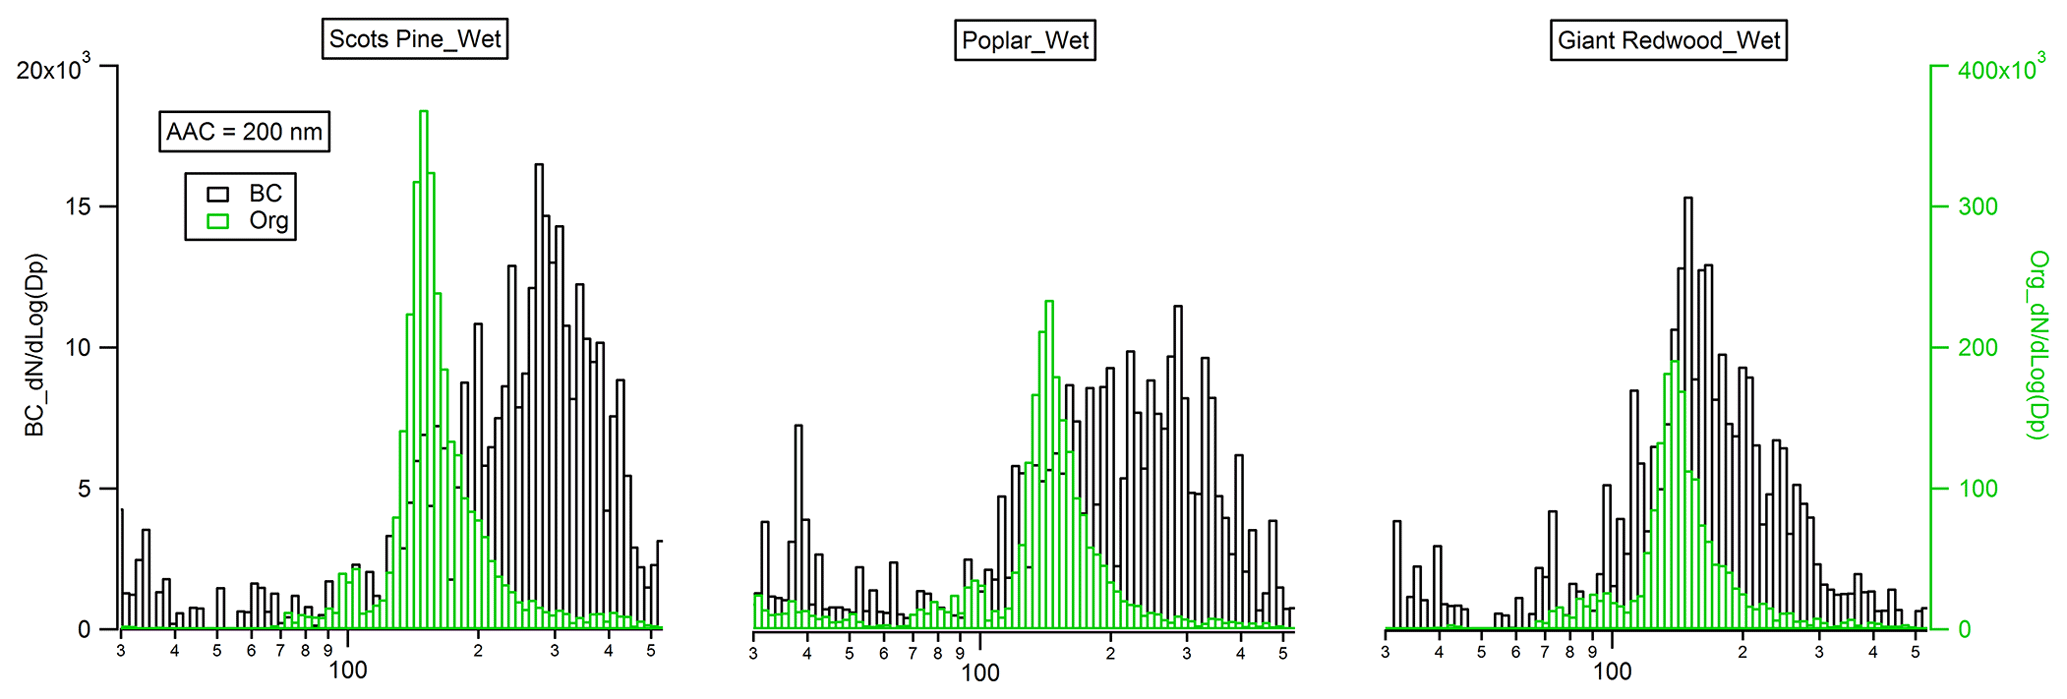
Figure 6Mobility size distribution of monodisperse (Da=200 nm) black carbon (flaming phase) and organic particles (smouldering phase) emitted from the combustion of the wet wood samples.
Table 1Effective density and dynamic shape factor of organic and black carbon aerosols from wood combustion.

a The BC density of 1.8 g cm−3 was applied. b Assuming organic aerosol is spherical with the shape factor of 1.00.
3.3 Physical properties of black carbon and organic aerosols
The morphology of BC particles changes markedly during atmospheric ageing, with associated impacts on the particle size and optical properties (Zeng et al., 2019; Zhang et al., 2008; Teoh et al., 2019). In this study, the dynamic shape factor of BC particles and the material density of organic aerosols were derived by measuring the mass and/or mobility diameter of AAC-selected particles. For biomass burning aerosols generated through our controlled combustion of dry wood samples, the AAC was set to pass aerosols with an aerodynamic diameter Da=200 nm, and we sampled BC or organic aerosols produced from the flaming or smouldering phases, respectively. Number concentration measurements from the CPC were recorded as the CPMA was scanned to determine the aerosol mass distribution. Figure 5a shows that there are considerable differences in the mass distributions for the produced BC (during the flaming phase) and organic aerosols (during the smouldering phase). The peak mass of BC particles produced from the wood samples of the Scots pine, poplar and Giant Redwood is 10.86, 12.47 and 7.00 fg, respectively. Meanwhile, the corresponding peak mass for the organic aerosols is 1.72, 1.74 and 1.90 fg, respectively. This difference is likely due to the difference in density and morphology for BC and organic aerosols. BC normally has a large density and a more irregular morphology than organic aerosols. After the peak masses for the AAC-selected aerosols were ascertained, the CPMA was set to these values to further select the AAC-selected aerosols (Da=200 nm) by their peak mass for a subsequent mobility size measurement using our SMPS. Figure 5b shows that the corresponding peak mobility size of the BC and organic particles after selection according to their peak mass is 394, 405 and 292 nm and 139, 139 and 140 nm for Scots pine, poplar and Giant Redwood, respectively. From these aforementioned peak mobility diameters and aerosol masses, the χ of the BC particles and the ρm of the organics can be calculated from the methods described in Sect. 2.2. We highlight the discussion in Sect. 2.2 that stated that χ could be calculated using either the aerodynamic or volume-equivalent diameter; as organic species may evaporate during the AAC selection (due to the high sheath flow rate) and thus bias the Da, only the mass and mobility size distributions were used in these calculations. Table 1 summarises the χ values inferred for the Da=200 nm BC particles, with values of 2.17 ± 0.04, 2.10 ± 0.08 and 1.80 ± 0.12 ascertained for oven-dried samples of Scots pine, poplar and Giant Redwood, respectively. The ρm of the organics is 1.22 ± 0.01, 1.23 ± 0.01 and 1.32 ± 0.03 g cm−3 for oven-dried samples of Scots pine, poplar and Giant Redwood, respectively. For combustion experiments using wet wood samples (with moisture contents around 25 %), the CPMA instrument was unavailable. Instead, the mobility size distributions for the AAC-selected Da=200 nm BC particles or organic particles were measured by the SMPS immediately after AAC selection. As shown in Fig. 6, the peak mobility size of the BC and organic particles is 296, 256 and 161 nm and 149, 142 and 137 nm for Scots pine, poplar and Giant Redwood, respectively. Based on their aerodynamic and mobility size, the χ of the BC particles and the ρm of the organics were calculated and are summarised in Table 1. The χ of the Da=200 nm BC particles is 1.85 ± 0.03, 1.67 ± 0.03 and 1.20 ± 0.02 for Scots pine, poplar and Giant Redwood, respectively, lower than that of the dry wood samples. The ρm of the organics is 1.44 ± 0.02, 1.52 ± 0.01 and 1.60 ± 0.01 g cm−3 for Scots pine, poplar and Giant Redwood, respectively, higher than that of the dry wood samples. This result implies that the water contents of wood samples are important in determining the physical properties of emitted particles from their combustion, in addition to any influence on the pre-ignition pyrolysis phase. The densities of organic aerosols reported/used in previous studies vary significantly, from 0.6 to 1.4 g cm−3 (Turpin and Lim, 2001; Nakao et al., 2013; Li et al., 2016). For the biomass burning aerosols, Zhai et al. (2017) reported the effective density ranged from 1.35 to 1.51 g cm−3 for the carbonaceous aerosol produced from the agricultural residue burning. Our results would expand the available data on the variation densities for organic aerosols from the wood combustion.
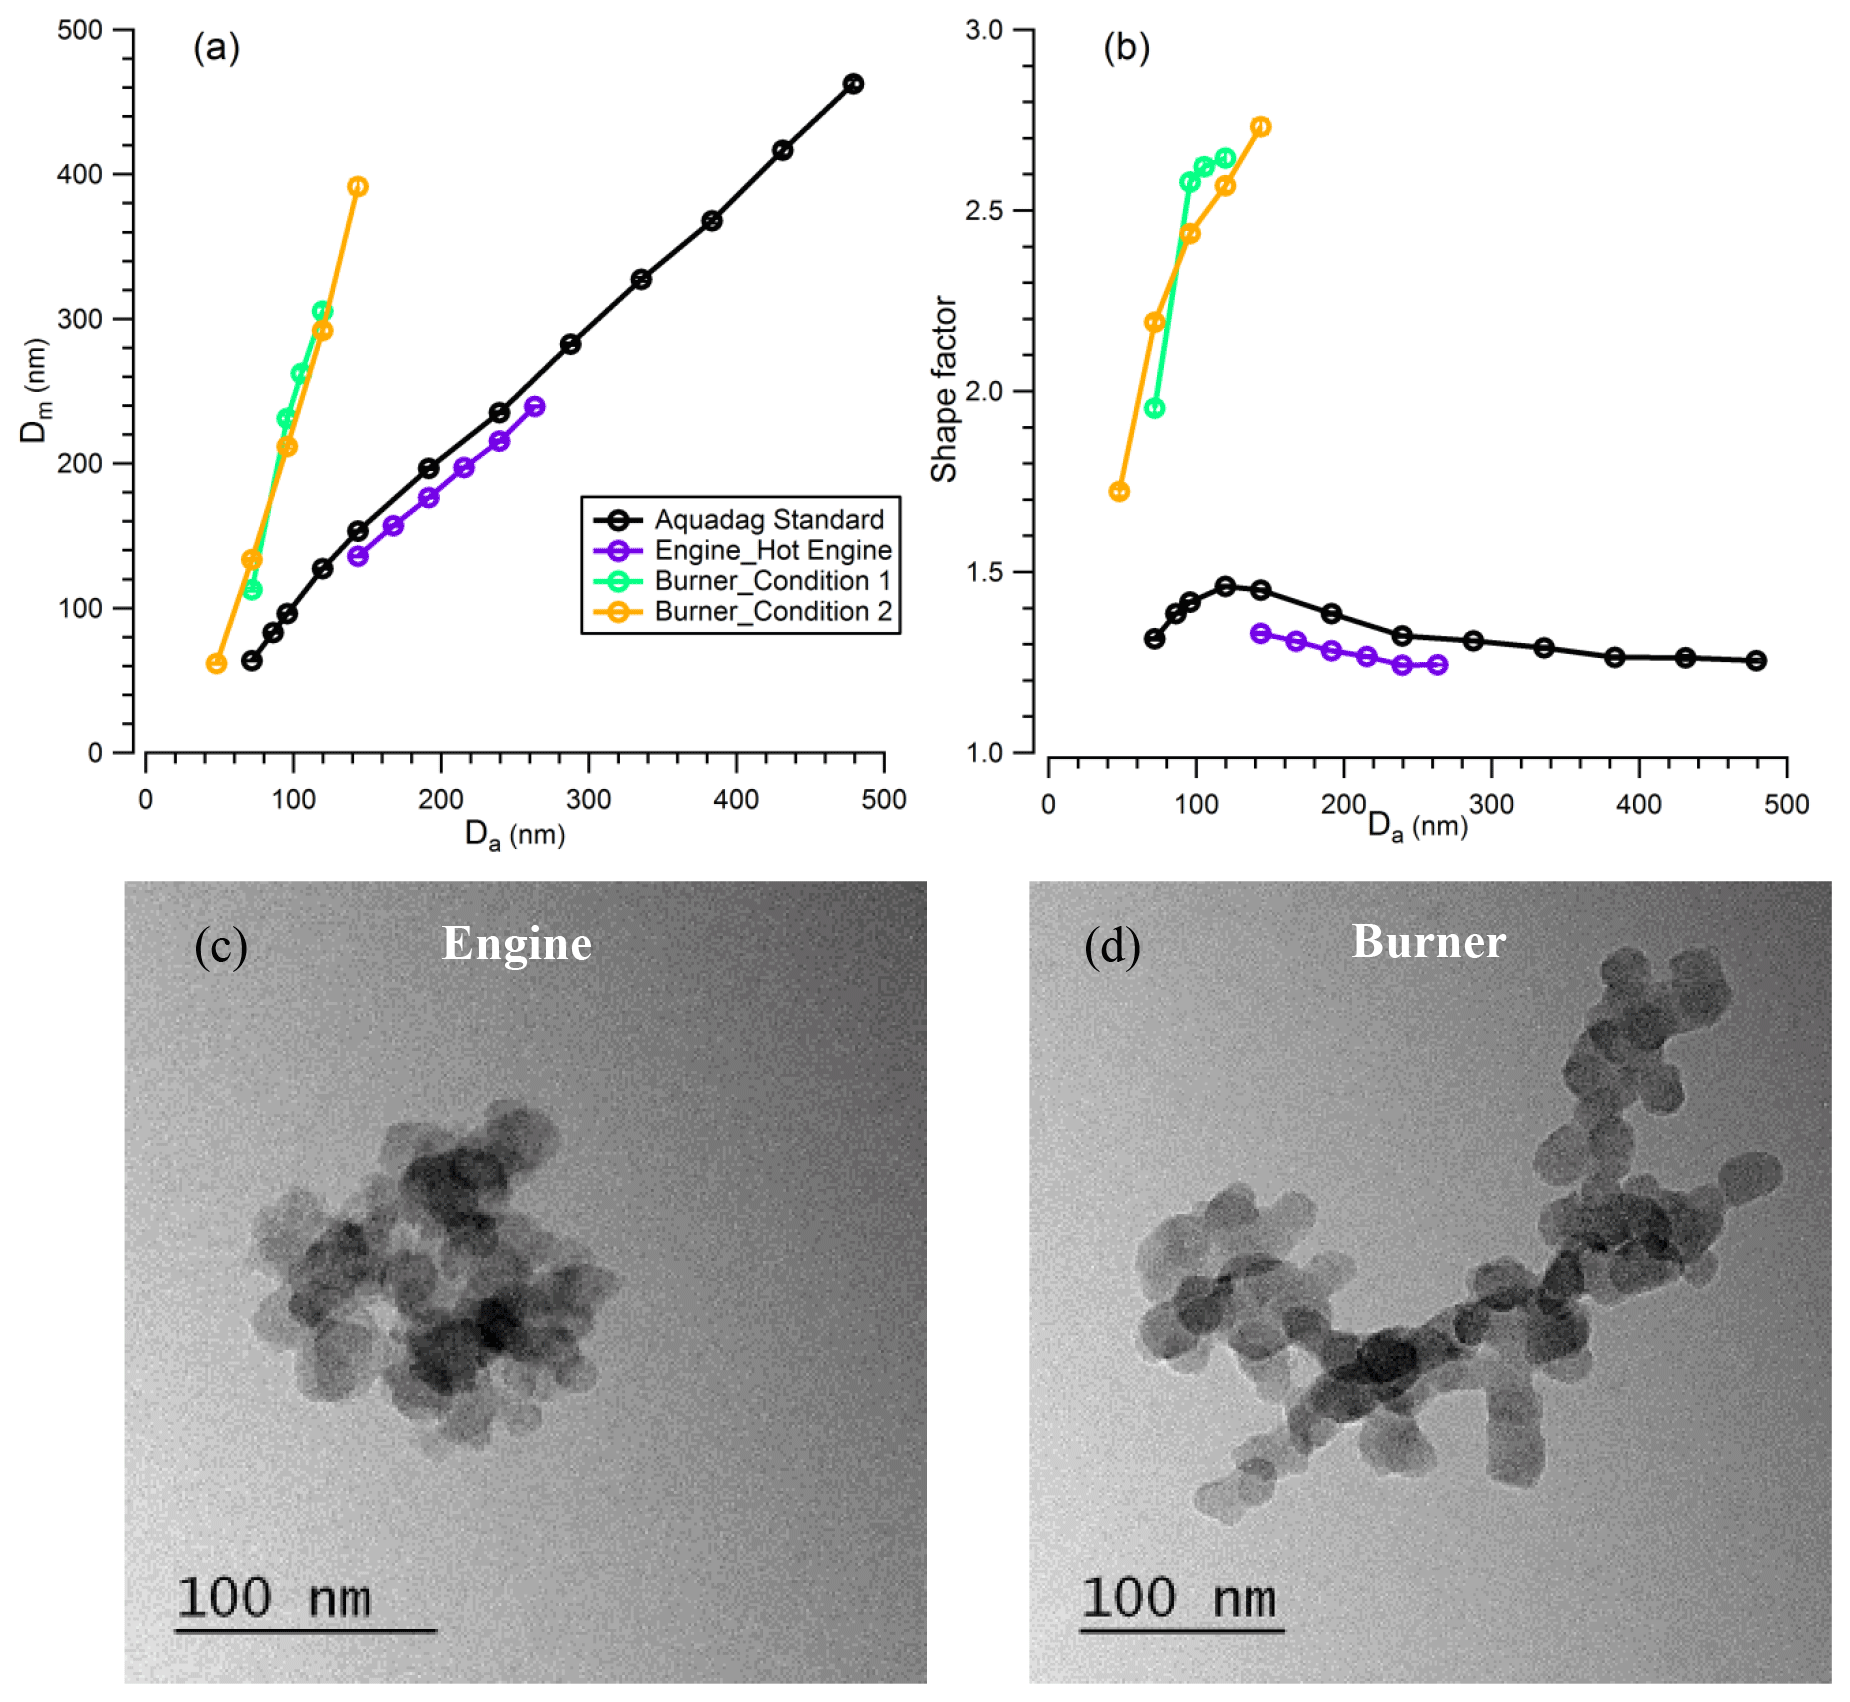
Figure 7Relationship of (a) mobility size with aerodynamic size and (b) shape factor with aerodynamic size, of BC particles from Aquadag standard atomisation, diesel engine and flame burner emission; TEM images of BC particles emitted from (c) a diesel engine (hot engine condition) and (d) a flame burner (condition 1). The error bar in (a) and (b) is too small to see clearly.
For the BC particles from the catalytically stripped Aquadag standard, diesel engine exhaust and an inverted flame burner, particles were first selected by the AAC prior to mobility size distribution measurements using the SMPS. The χ of the BC particles was derived from the controlled aerodynamic size and the measured peak mobility diameter. Figure 7a shows that the particle mobility diameter increases with the selected aerodynamic size for all three types of BC particles, while Fig. 7b shows the corresponding variations in χ. These figures demonstrate clearly that the dynamic shape factor varies with both the aerosol aerodynamic size and with the BC source. For the BC particles generated from the Aquadag standard, the χ increased sharply from 1.315 ± 0.004 to 1.460 ± 0.003 as Da increased from 75 to 125 nm but then decreased with further increases in Da to a value of 1.255 ± 0.005 at Da=500 nm. This result implies that the formed BC particles are more irregular as Da increases initially, but particles adopt more collapsed morphologies as Da increases further. These trends in χ likely arise from the coagulation of the primary BC particles, which drives the fractal-like morphology for small BC particles and relative compact shape for large particles. For BC particles generated from the diesel engine, the χ exhibits a monotonically decreasing trend with particle size over the reduced size range probed for this BC source, with χ decreasing from 1.329 ± 0.003 at Da=150 nm to 1.243±0.002 at Da=275 nm. The TEM images (Fig. 7c) show that the primary spherules generated directly from the diesel engine are around 20 nm. As the BC particles selected in the experiment are much larger than the primary spherules, the coagulation process drives the large particles towards more compacted morphologies than the small particles, and this leads to the decreasing trend of χ with particle size. For the BC particles generated from the flame burner, the χ increases with particle size for both operating conditions, and a maximum value was reached of 2.731 ± 0.021 for Da=150 nm. The same increasing trend was reported by Slowik et al. (2004) previously, who reported an increase in χ from ∼ 1.3 to ∼ 3.0 when the mobility size increased from 100 to 300 nm for the BC particles generated with a lower propane O2 ratio compared to the measurements we report here. The TEM images (Fig. 7d) show that, similar to the BC particles emitted from diesel engine, the primary spherules generated from the flame burner are also around 20 nm. As our experiments on BC particles from the flame burner selected particles at small sizes (Da in the range ∼ 50–150 nm), the increase of the dynamic shape factor with Da is probably due to the coagulation of primary generated particles. In addition, by comparing Fig. 7c and d (more images are shown in Fig. S1), it is clear that the large BC particles generated from the flame burner tend towards aggregate morphology, in contrast to the compact morphology of the large BC particles emitted from the diesel engine (Fig. 9c). This leads to the flame-burner-generated BC particles exhibiting larger χ than those from the diesel engine.
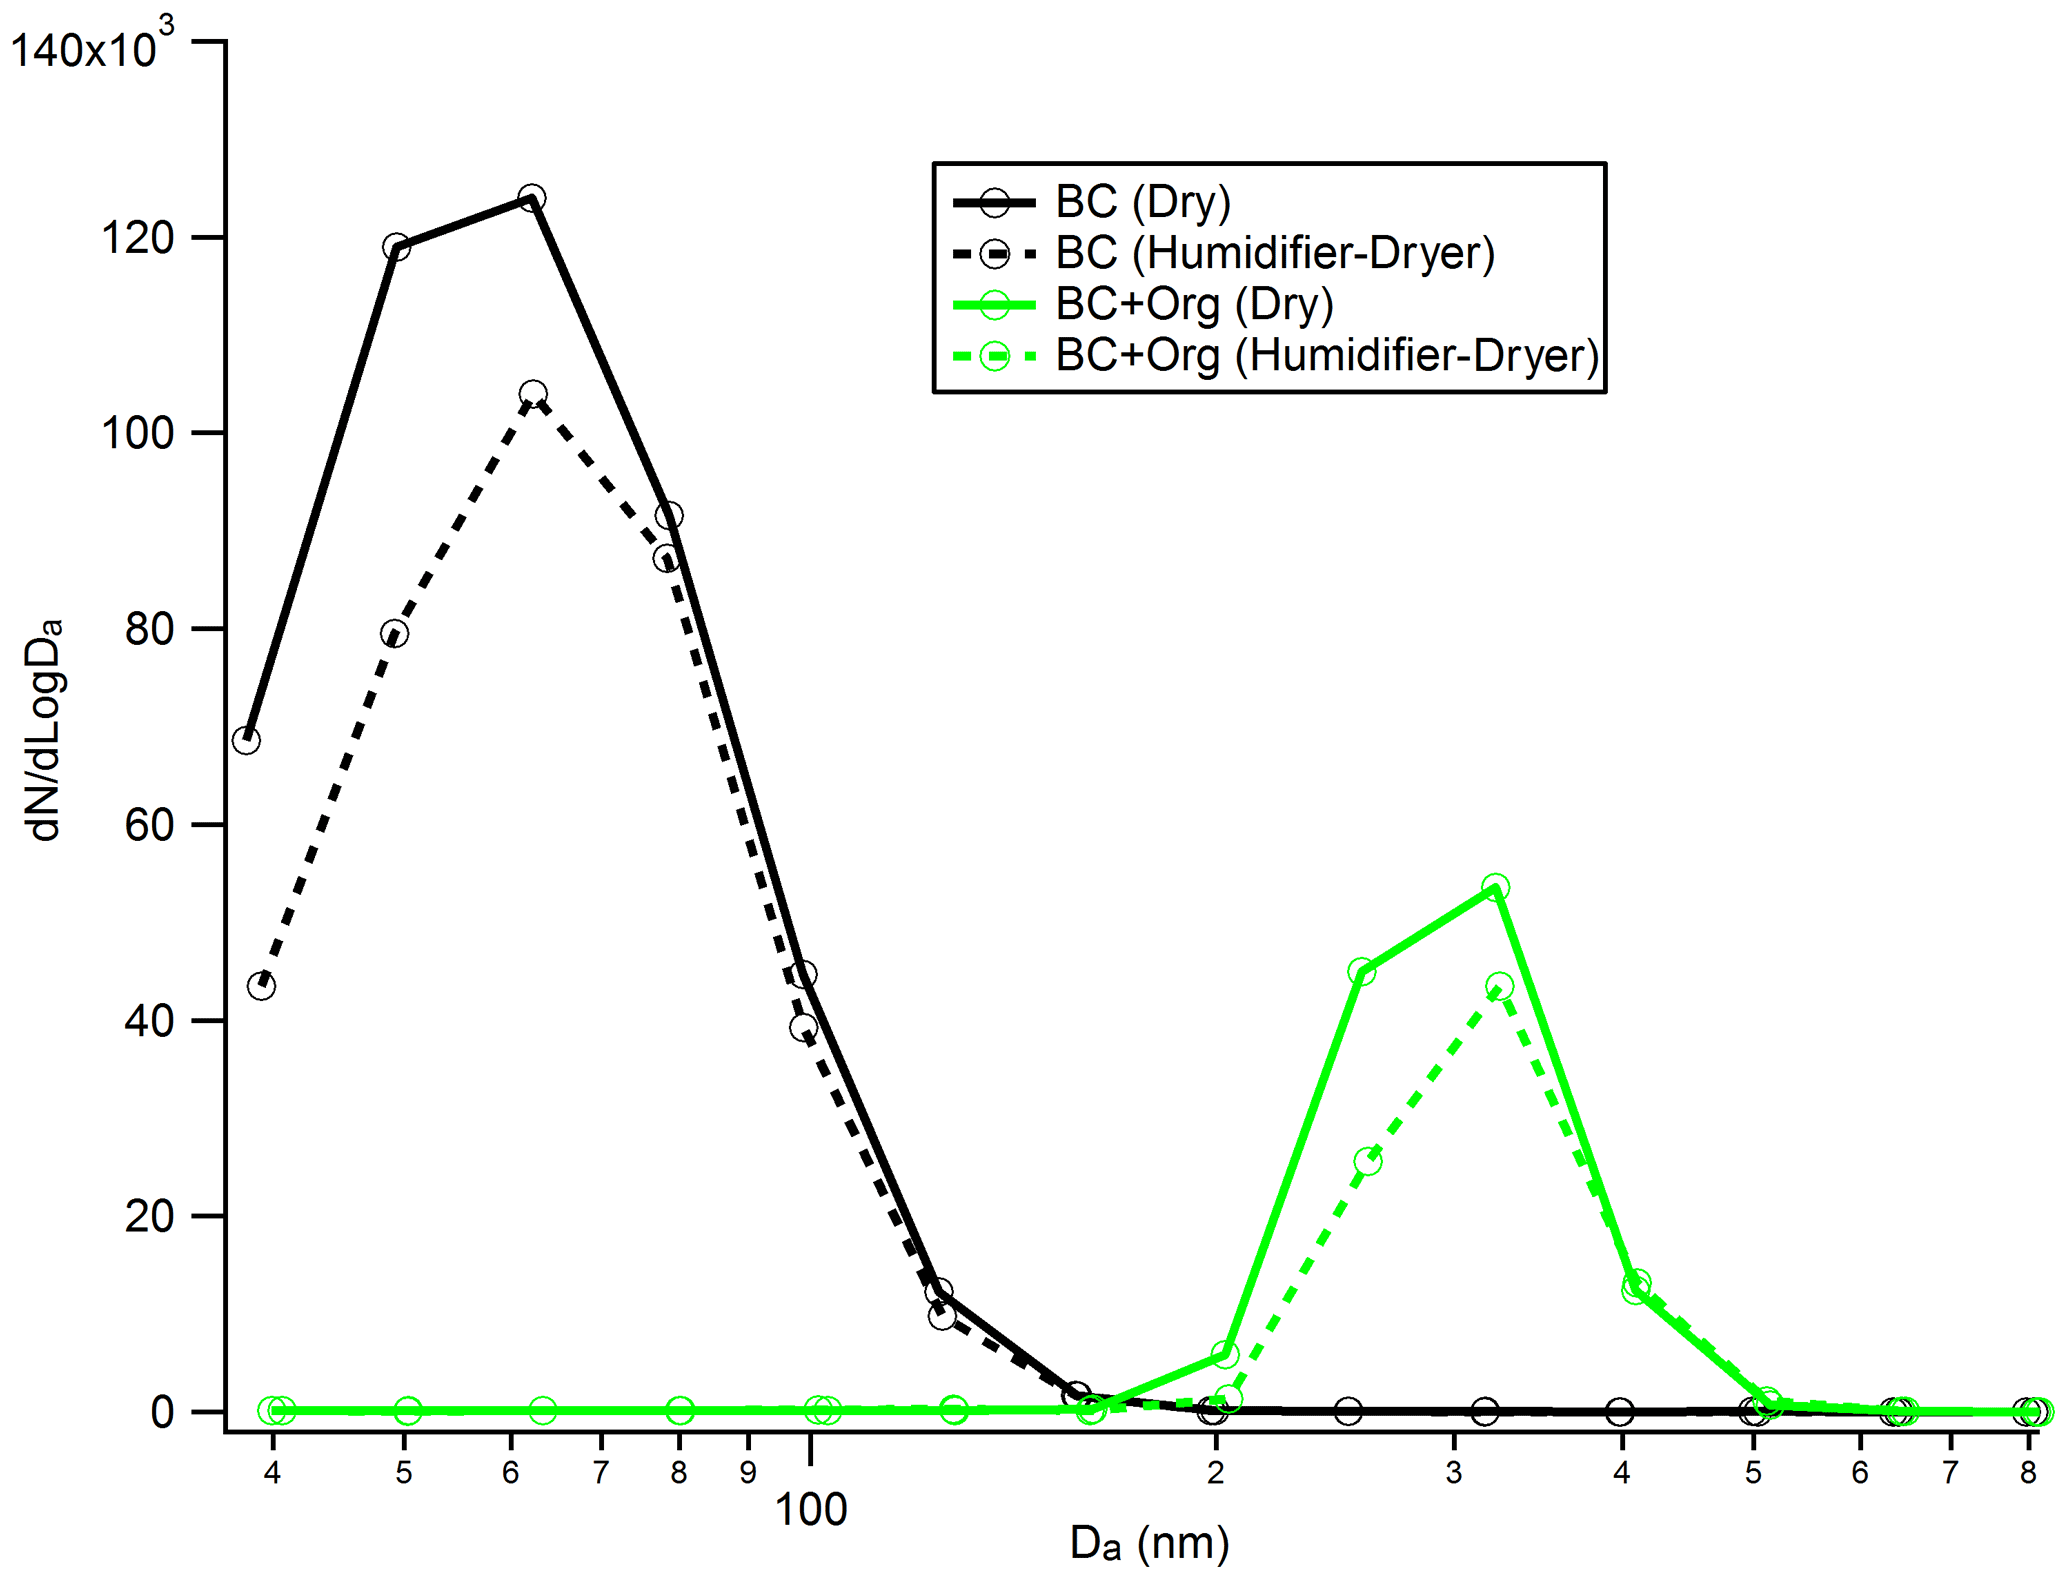
Figure 8Number size distribution of the bare BC (black line) and organic-coated BC particles (green line) before and after they experience “humidity cycling” (i.e. exposed to 90 % RH around 10 s and then dehydrated to 10 % RH) process. Da is the aerodynamic diameter.
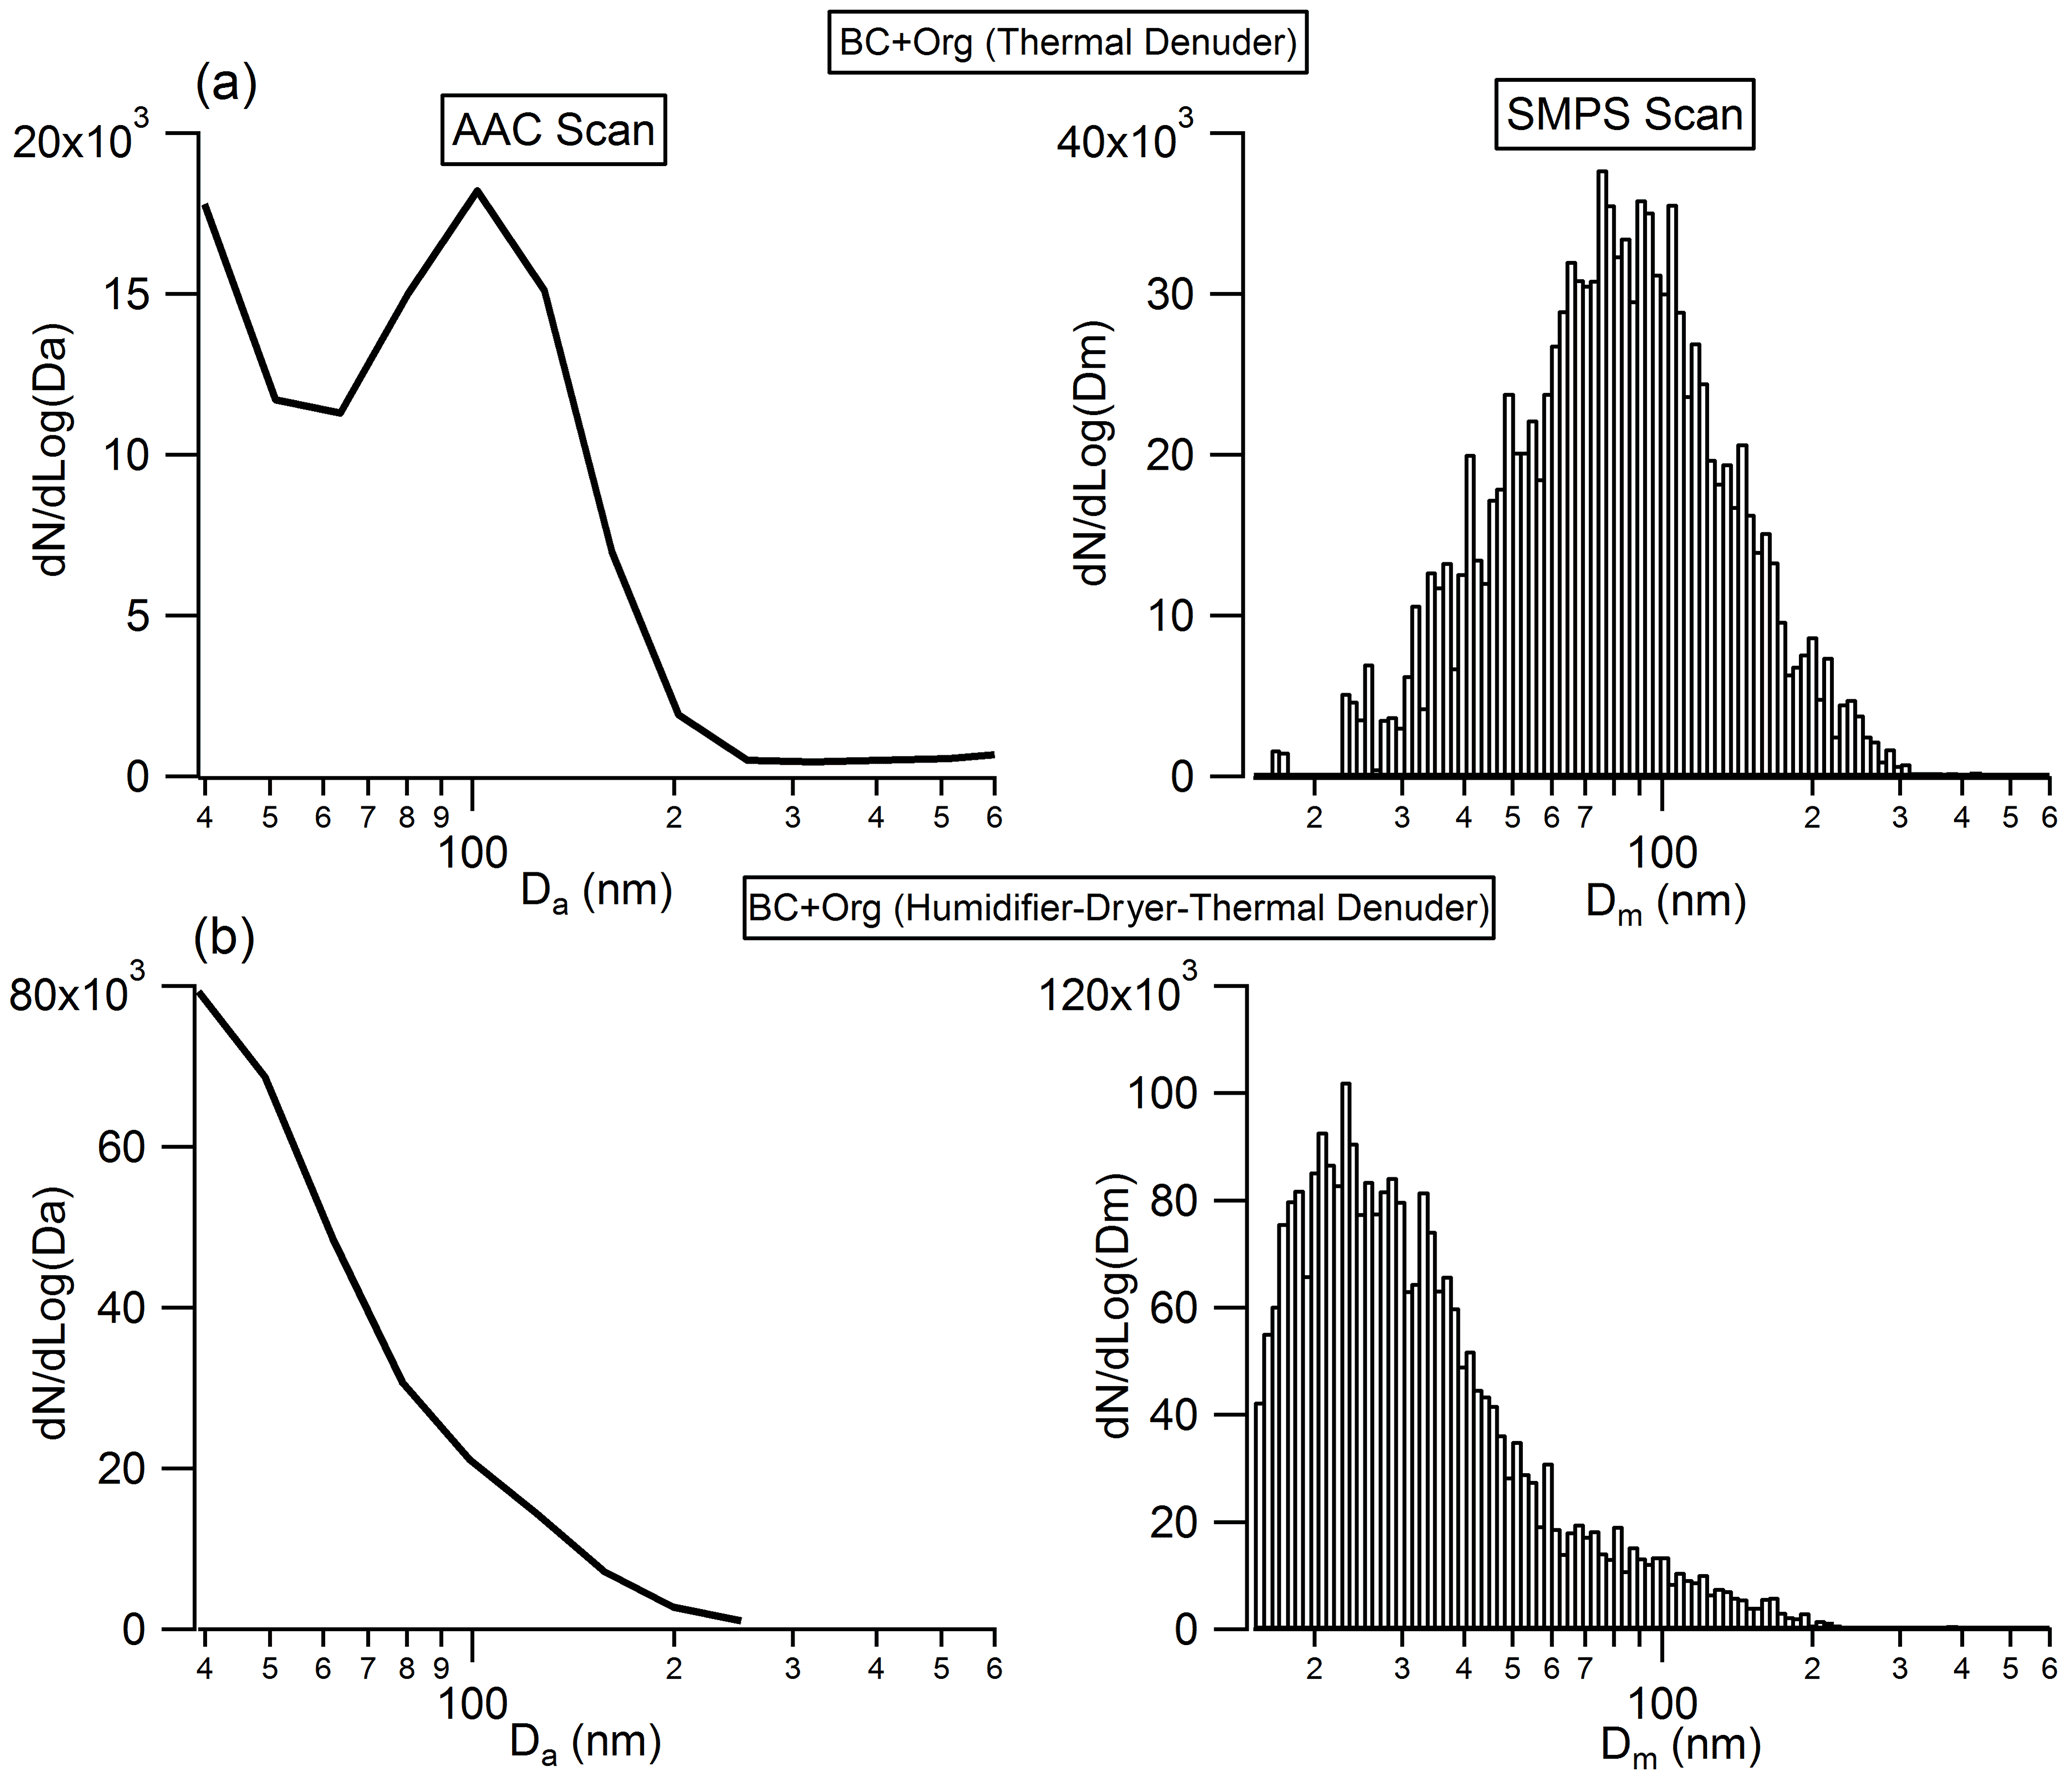
Figure 9Number size distribution of the (a) organic-coated BC after passing through the thermal denuder to remove coatings and (b) organic-coated BC after experiencing the “humidity cycling” process and then passing through the thermal denuder to remove coatings.
3.4 BC restructuring
Recent work has shown that soot particles maintain their structure after coating with SOA and subsequent thermal denuding (Bhandari et al., 2017) but will restructure in response to humidification (Leung et al., 2017). We performed a series of experiments to better understand this restructuring. As shown in Fig. 8, there is no clear change in the measured particle aerodynamic diameter for the bare BC after they experience the humidity cycling process, implying that the bare BC particles retain their structure, even after they experience very large perturbations in RH; this result is similar to that reported by Bhandari et al. (2019). In addition, no size change of the organic-coated BC particles was observed after they experienced the humidity cycling process either. Based on these results, we cannot form conclusions on whether the BC core was restructured during the humidity cycling process. There are two possibilities: (1) the BC cores retained their structure throughout the humidity cycling process; or (2) as shown in Fig. 8, the coatings on BC particles are very thick and therefore dominate the particle, rendering our size measurement approach insensitive to any changes in BC core size from restructuring. The size of the bare BC particles is around 68 nm, but after coating by SOA, the size of the coated BC particles reaches up to around 300 nm. Due to the very large coating thicknesses of the coated BC particles, even if the BC cores were restructured during the humidity cycling process, any changes were not reflected in the overall particle size as this was dominated by the contribution from the coating organics. To further examine these possibilities, the organic coatings of the coated BC particles, that had either experienced the humidity cycling process or not, were removed by the TD, and then the size distribution of the BC core was measured by the AAC and SMPS. As shown in Fig. 9, a clear difference in BC core size was observed between the organic-coated BC particles that had passed immediately through the TD (Fig. 9a) and those that had first experienced the humidity cycling process (Fig. 9b). The mobility diameter of the BC core size peaked at 79.3 nm for the former case but peaked at 23.6 nm for the latter one, implying that the BC core was restructured (becomes more compact) after coating with organics and then experiencing the high-humidity environment.
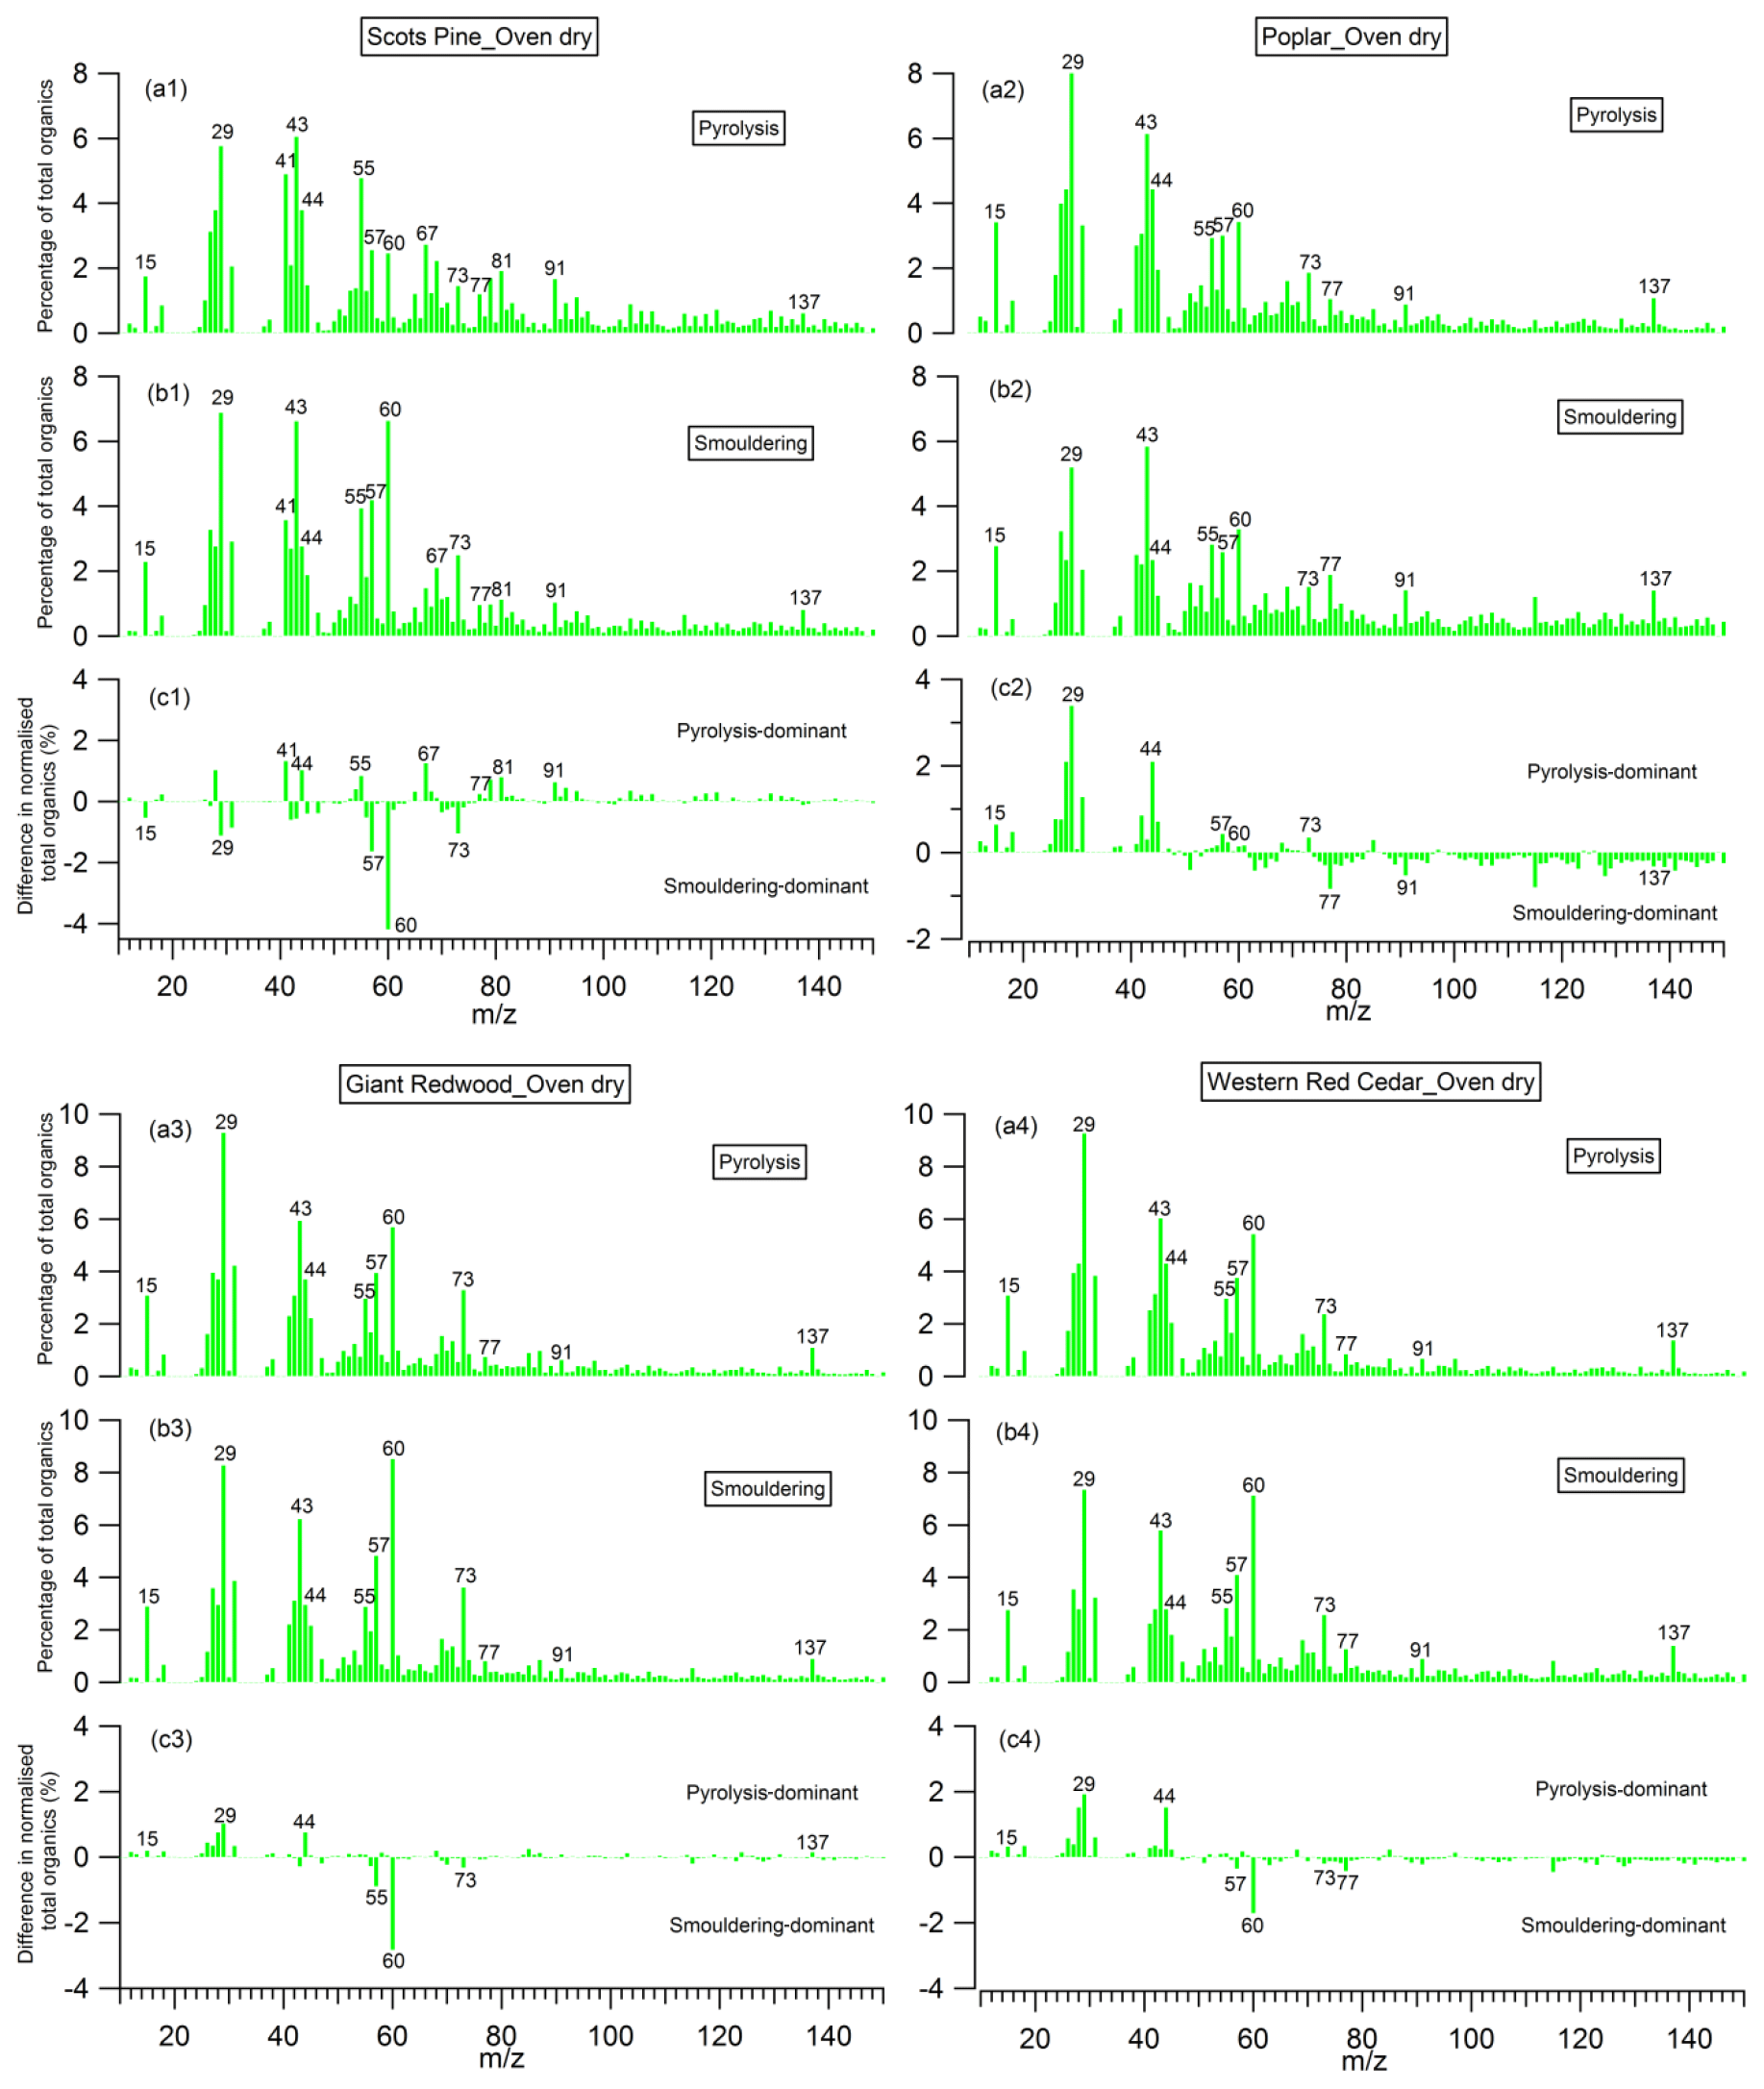
Figure 10Mass spectra of organic aerosols (OA) presented as a percentage of total OA produced during (a) the pyrolysis phase and (b) the smouldering phase; and (c) the difference between them, for the dry wood samples.
3.5 AMS mass spectra of organic aerosols
Owing to the complex nature of biomass combustion in the natural environment, and the high sensitivity to the combustion environment, the organic mass spectral signatures from previous AMS experiments vary considerably. This variability makes it difficult to estimate the contribution of biomass burning aerosol (BBA) to total PM through positive matrix factorisation (PMF) methods (Paglione et al., 2020). The mass spectra for the BBA generated from our repeatable and controlled laboratory experiments have the potential to tighten constraints on the AMS spectral signature(s) for BBA. Highly controlled and reproducible measurements of aerosol emissions from combustion of a common African biofuel source have been achieved and reported by Haslett et al. (2018) previously. Here, we expand detail of the mass spectra observations reported by Haslett et al. (2018) by providing data sets on the combustion for different types of biomass to that studied in previous work.
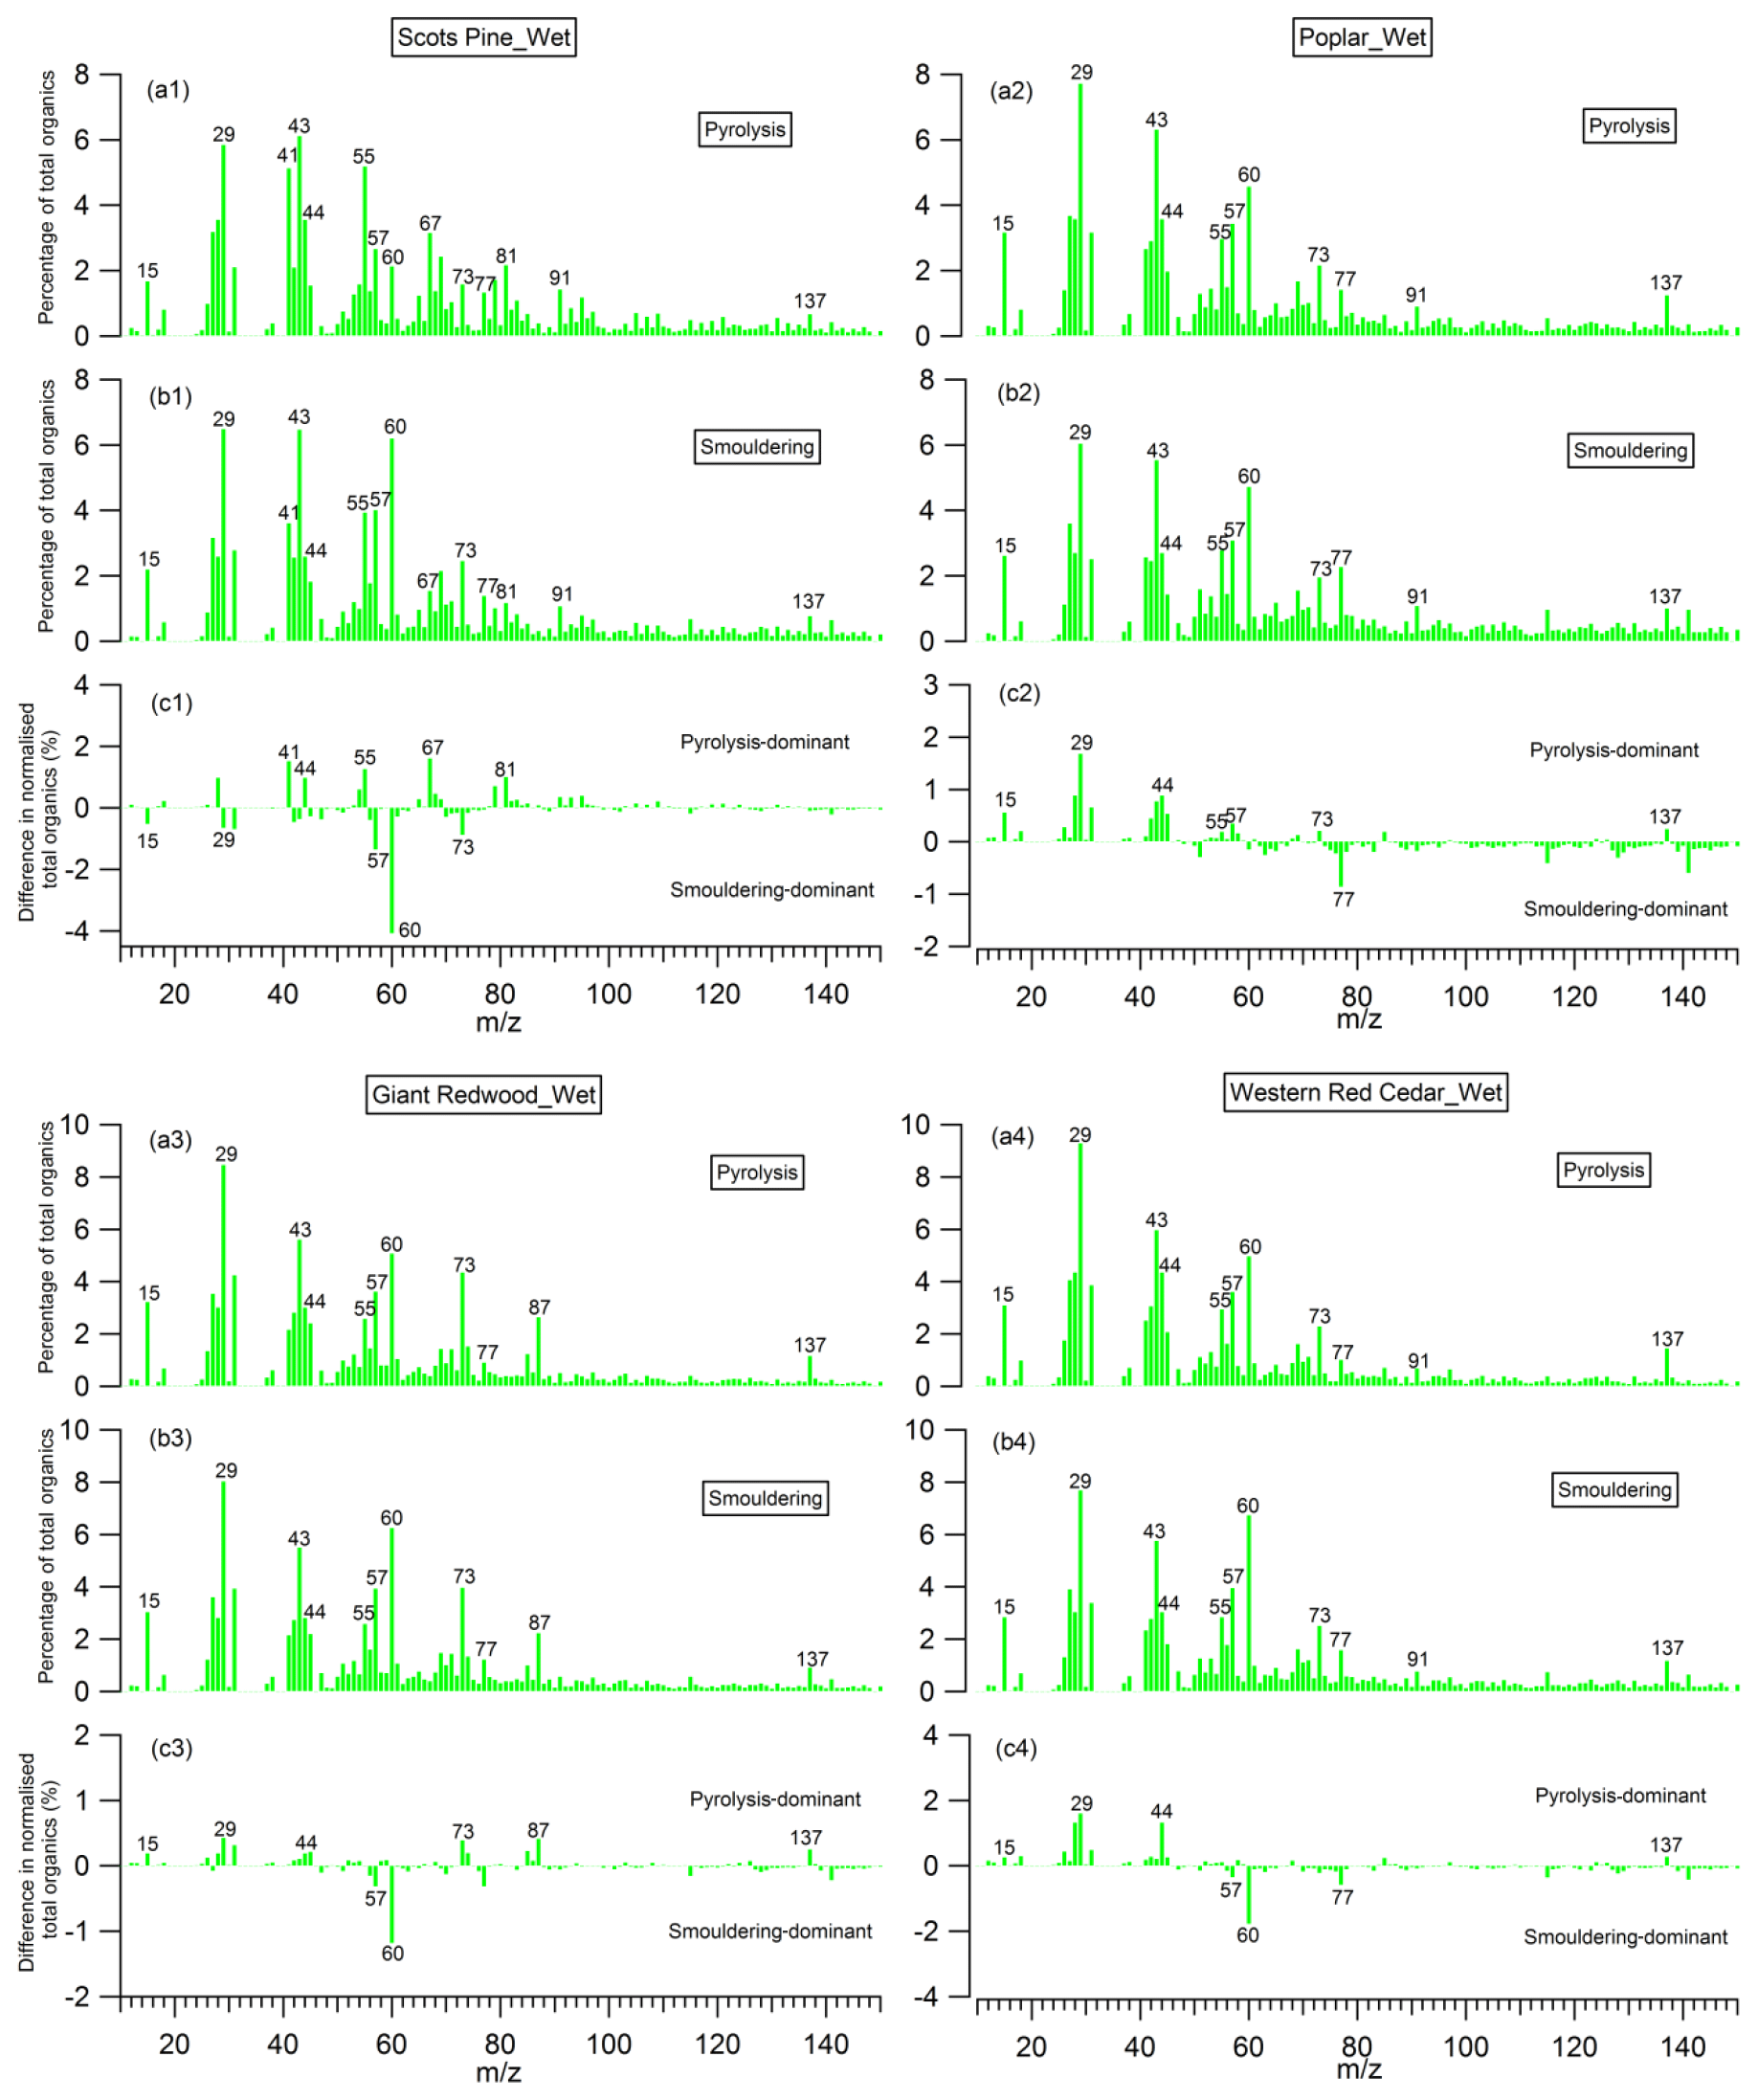
Figure 11Mass spectra of organic aerosols (OA) presented as a percentage of total OA produced during (a) the pyrolysis phase and (b) the smouldering phase; and (c) the difference between them, for the wet wood samples.
The mass spectra of organic aerosols generated from the pyrolysis and smouldering phases (noise to signal ratio is less than 0.005), and the difference mass spectra between these two phases, are shown in Figs. 10 and 11 for the combustion of dry and wet wood samples, respectively. For all experiments, irrespective of the wood type and moisture content, the spectra for the pyrolysis and smouldering phases are dominated by hydrocarbon ion fragments, including CnH2n−1 (, 55), CnH2n+1 (, 43, 57), CnH2n−3 () and C5+nH5+2n (, 91). These peaks are associated with fragments of saturated alkenes, alkanes, cycloalkanes and aromatic compounds, respectively. Our results are similar to the mass spectra reported by Haslett et al. (2018) for the controlled combustion of biomass in the laboratory. By comparing Figs. 10 and 11, no clear difference in mass spectra of the organic aerosols in individual burn phases (pyrolysis or smouldering phase) with the moisture content of the wood samples is observed. This implies that the effect moisture has on the organic chemical profile of wood burning emissions is through changing the durations of the different phases of the burn cycle, not through the chemical modification of the individual phases. This is in stark contrast to the dominant role of the wood water content in determining the morphological parameters and densities of generated biomass burning aerosols shown in Sect. 3.2.
The peaks at 57, 60 and 73 are seen together in both combustion phases; these peaks are often used as markers for biomass burning organic aerosols (Alfarra et al., 2007), as very few other aerosol sources in the natural environment can contribute to these peaks. Interestingly, for the wood samples of Scots pine, Giant Redwood and Western red cedar, these peaks at 57, 60 and 73 were more dominant in the smouldering phase. This is a similar observation to that reported by Haslett et al. (2018). However, for the poplar wood sample, the peaks are most dominant in the pyrolysis phase. This is particularly interesting because it suggests that the combustion of angiosperm wood (poplar) and gymnosperm wood (Scots pine, Giant Redwood and Western red cedar) will emit different chemical species depending on the combustion phase. This difference may be due to the resin content and composition (which is related to chemical volatility) within the wood. Future work should consider the impact of the burning of different wood types and their respective relationship to combustion phase.
For all wood samples, the peak at 44, which is mainly attributed to the CO fragment with a possible contribution from C2H4O+, is more prominent in the pyrolysis phase than the smouldering phase, which is in contrast with the results from Haslett et al. (2018). This could be a result of the different wood types. We note that the study of Haslett et al. (2018) used rubber wood (Hevea brasiliensis), that produces latex sap. This hard tropical wood also has a bulk density much higher than the woods tested here (0.63×10³ kg m−3) and likely a higher lignin content, where lignin is one the last compounds to be broken down by the combustion process.
During the Soot Aerodynamic Size Selection for Optical properties (SASSO) project and a EUROCHAMP transnational access project, the physical and chemical properties of black carbon and organic matter from different combustion sources were investigated. For BC particles from the diesel engine and flame burner emissions, the TEM images show that the primary spherules size are similar, around 20 nm. As particle size increases, BC particles adopted more collapsed/compacted morphologies from the diesel engine but tend to more aggregated morphologies from the flame burner source. For the particles emitted from the wood combustion, the χ of BC particles and the ρm of organics were observed to range from 1.8–2.17 and 1.22–1.32 g cm−3 for dry wood samples and 1.2–1.85 and 1.44–1.60 g cm−3 for wet wood samples. No clear difference in the AMS mass spectra of the organic aerosols in individual burn phases (pyrolysis or smouldering phase) with the moisture content of the wood samples was observed. This implies that the effect moisture has on the organic chemical profile of wood burning emissions is through changing the durations of the different phases of the burn cycle, not through the chemical modification of the individual phases. In addition, the incandescence signal of SP2 was calibrated with the different types of BC particles generated in our study and compared with the Aquadag standard. The correction factor, which is used for converting the incandescence signal from the Aquadag standard to the investigated BC, was measured as 0.821 ± 0.002 (or 0.794 ± 0.005), 0.879 ± 0.003 and 0.843 ± 0.028 to 0.913 ± 0.009 for the BC particles emitted from engine under the hot running (or cold idle) condition, flame burner and wood combustion, respectively. These values are 9.4 % (5.6 %), 17.2 % and 12.4 %–21.7 % different, with the default value of 0.75 used recently. Quantifying the correction factor for many types of BC particles found commonly in the atmosphere may enable better constraints to be placed on this factor depending on the BC source being sampled and thus improve the accuracy of future SP2 measurements of rBC mass concentrations.
Processed data are available at https://doi.org/10.6084/m9.figshare.15172572.v1 (Hu, 2021). Raw data are archived at the University of Manchester and are available on request.
The supplement related to this article is available online at: https://doi.org/10.5194/acp-21-16161-2021-supplement.
JDA, DH, MRA, DL, JMH and HC designed research; DH, CY, MRA, KS, JML, MIC, CB, IR and ZL performed wood combustion experiments; DH, MRA, YS, MD and AV performed Manchester aerosol chamber experiments; BS, PL and GS performed the burner experiments. DH conducted the data analysis and wrote the manuscript with inputs from all co-authors.
Some authors are members of the editorial board of Atmospheric Chemistry and Physics. The peer-review process was guided by an independent editor, and the authors have also no other competing interests to declare.
Publisher’s note: Copernicus Publications remains neutral with regard to jurisdictional claims in published maps and institutional affiliations.
This article is part of the special issue “Simulation chambers as tools in atmospheric research (AMT/ACP/GMD inter-journal SI)”. It is not associated with a conference.
Thanks are expressed to Catalytic Instruments for the loan of the catalytic stripper CS10 and to Xiaomei Du at National Research Council Canada for the TEM images.
This work was supported by the UK Natural Environment Research Council (NERC) (grant no. NE/S00212X/1) and the Met Office and received transnational activity funding from the European Union's Horizon 2020 research and innovation programme through the EUROCHAMP-2020 Infrastructure Activity (grant no. 730997). Prem Lobo was supported by the UK National Centre for Atmospheric Science (NCAS) Visiting Scientist Programme.
This paper was edited by Stefania Gilardoni and reviewed by two anonymous referees.
Adachi, K., Sedlacek, A. J., Kleinman, L., Springston, S. R., Wang, J., Chand, D., Hubbe, J. M., Shilling, J. E., Onasch, T. B., Kinase, T., Sakata, K., Takahashi, Y., and Buseck, P. R.: Spherical tarball particles form through rapid chemical and physical changes of organic matter in biomass-burning smoke, P. Natl. Acad. Sci. USA, 116, 19336–19341, https://doi.org/10.1073/pnas.1900129116, 2019.
Alfarra, M. R., Paulsen, D., Gysel, M., Garforth, A. A., Dommen, J., Prévôt, A. S. H., Worsnop, D. R., Baltensperger, U., and Coe, H.: A mass spectrometric study of secondary organic aerosols formed from the photooxidation of anthropogenic and biogenic precursors in a reaction chamber, Atmos. Chem. Phys., 6, 5279–5293, https://doi.org/10.5194/acp-6-5279-2006, 2006.
Alfarra, M. R., Prevot, A. S. H., Szidat, S., Sandradewi, J., Weimer, S., Lanz, V. A., Schreiber, D., Mohr, M., and Baltensperger, U.: Identification of the Mass Spectral Signature of Organic Aerosols from Wood Burning Emissions, Environ. Sci. Technol., 41, 5770–5777, https://doi.org/10.1021/es062289b, 2007.
Alfarra, M. R., Hamilton, J. F., Wyche, K. P., Good, N., Ward, M. W., Carr, T., Barley, M. H., Monks, P. S., Jenkin, M. E., Lewis, A. C., and McFiggans, G. B.: The effect of photochemical ageing and initial precursor concentration on the composition and hygroscopic properties of β-caryophyllene secondary organic aerosol, Atmos. Chem. Phys., 12, 6417–6436, https://doi.org/10.5194/acp-12-6417-2012, 2012.
Allan, J. D., Jimenez, J. L., Williams, P. I., Alfarra, M. R., Bower, K. N., Jayne, J. T., Coe, H., and Worsnop, D. R.: Quantitative sampling using an Aerodyne aerosol mass spectrometer – 1. Techniques of data interpretation and error analysis, J. Geophys. Res., 108, https://doi.org/10.1029/2002jd002358, 2003.
Allan, J. D., Delia, A. E., Coe, H., Bower, K. N., Alfarra, M. R., Jimenez, J. L., Middlebrook, A. M., Drewnick, F., Onasch, T. B., Canagaratna, M. R., Jayne, J. T., and Worsnop, D. R.: A generalised method for the extraction of chemically resolved mass spectra from aerodyne aerosol mass spectrometer data, J. Aerosol Sci., 35, 909–922, https://doi.org/10.1016/j.jaerosci.2004.02.007, 2004.
Andreae, M. O. and Crutzen, P. J.: Atmospheric Aerosols: Biogeochemical Sources and Role in Atmospheric Chemistry, Science, 276, 1052–1058, https://doi.org/10.1126/science.276.5315.1052, 1997.
Bhandari, J., China, S., Onasch, T., Wolff, L., Lambe, A., Davidovits, P., Cross, E., Ahern, A., Olfert, J., Dubey, M., and Mazzoleni, C.: Effect of Thermodenuding on the Structure of Nascent Flame Soot Aggregates, Atmosphere, 8, 166, https://doi.org/10.3390/atmos8090166, 2017.
Bhandari, J., China, S., Chandrakar, K. K., Kinney, G., Cantrell, W., Shaw, R. A., Mazzoleni, L. R., Girotto, G., Sharma, N., Gorkowski, K., Gilardoni, S., Decesari, S., Facchini, M. C., Zanca, N., Pavese, G., Esposito, F., Dubey, M. K., Aiken, A. C., Chakrabarty, R. K., Moosmüller, H., Onasch, T. B., Zaveri, R. A., Scarnato, B. V., Fialho, P., and Mazzoleni, C.: Extensive Soot Compaction by Cloud Processing from Laboratory and Field Observations, Sci. Rep.-UK, 9, 11824, https://doi.org/10.1038/s41598-019-48143-y, 2019.
Bond, T. C.: Spectral dependence of visible light absorption by carbonaceous particles emitted from coal combustion, Geophys. Res. Lett., 28, 4075–4078, https://doi.org/10.1029/2001gl013652, 2001.
Bond, T. C. and Bergstrom, R. W.: Light absorption by carbonaceous particles: An investigative review, Aerosol Sci. Tech., 40, 27–67, https://doi.org/10.1080/02786820500421521, 2006.
Bond, T. C., Doherty, S. J., Fahey, D. W., Forster, P. M., Berntsen, T., DeAngelo, B. J., Flanner, M. G., Ghan, S., Kärcher, B., Koch, D., Kinne, S., Kondo, Y., Quinn, P. K., Sarofim, M. C., Schultz, M. G., Schulz, M., Venkataraman, C., Zhang, H., Zhang, S., Bellouin, N., Guttikunda, S. K., Hopke, P. K., Jacobson, M. Z., Kaiser, J. W., Klimont, Z., Lohmann, U., Schwarz, J. P., Shindell, D., Storelvmo, T., Warren, S. G., and Zender, C. S.: Bounding the role of black carbon in the climate system: A scientific assessment, J. Geophys. Res.-Atmos., 118, 5380–5552, https://doi.org/10.1002/jgrd.50171, 2013.
Bones, D. L., Henricksen, D. K., Mang, S. A., Gonsior, M., Bateman, A. P., Nguyen, T. B., Cooper, W. J., and Nizkorodov, S. A.: Appearance of strong absorbers and fluorophores in limonene-O3 secondary organic aerosol due to NH4+-mediated chemical aging over long time scales, J. Geophys. Res.-Atmos., 115, D05203, https://doi.org/10.1029/2009jd012864, 2010.
Chen, C., Enekwizu, O. Y., Fan, X., Dobrzanski, C. D., Ivanova, E. V., Ma, Y., Gor, G. Y., and Khalizov, A. F.: Single Parameter for Predicting the Morphology of Atmospheric Black Carbon, Environ. Sci. Technol., 52, 14169–14179, https://doi.org/10.1021/acs.est.8b04201, 2018.
Corbin, J. C., Czech, H., Massabò, D., de Mongeot, F. B., Jakobi, G., Liu, F., Lobo, P., Mennucci, C., Mensah, A. A., Orasche, J., Pieber, S. M., Prévôt, A. S. H., Stengel, B., Tay, L. L., Zanatta, M., Zimmermann, R., El Haddad, I., and Gysel, M.: Infrared-absorbing carbonaceous tar can dominate light absorption by marine-engine exhaust, npj Clim. Atmos. Sci., 2, 12, https://doi.org/10.1038/s41612-019-0069-5, 2019.
Cotterell, M. I., Orr-Ewing, A. J., Szpek, K., Haywood, J. M., and Langridge, J. M.: The impact of bath gas composition on the calibration of photoacoustic spectrometers with ozone at discrete visible wavelengths spanning the Chappuis band, Atmos. Meas. Tech., 12, 2371–2385, https://doi.org/10.5194/amt-12-2371-2019, 2019a.
Cotterell, M. I., Ward, G. P., Hibbins, A. P., Wilson, A., Haywood, J. M., and Langridge, J. M.: Optimizing the performance of aerosol photoacoustic cells using a finite element model. Part 2: Application to a two-resonator cell, Aerosol Sci. Tech., 53, 1128–1148, https://doi.org/10.1080/02786826.2019.1648749, 2019b.
Cotterell, M. I., Szpek, K., Haywood, J. M., and Langridge, J. M.: Sensitivity and accuracy of refractive index retrievals from measured extinction and absorption cross sections for mobility-selected internally mixed light absorbing aerosols, Aerosol Sci. Tech., 54, 1034–1057, https://doi.org/10.1080/02786826.2020.1757034, 2020.
Davies, N. W., Cotterell, M. I., Fox, C., Szpek, K., Haywood, J. M., and Langridge, J. M.: On the accuracy of aerosol photoacoustic spectrometer calibrations using absorption by ozone, Atmos. Meas. Tech., 11, 2313–2324, https://doi.org/10.5194/amt-11-2313-2018, 2018.
DeCarlo, P. F., Kimmel, J. R., Trimborn, A., Northway, M. J., Jayne, J. T., Aiken, A. C., Gonin, M., Fuhrer, K., Horvath, T., Docherty, K. S., Worsnop, D. R., and Jimenez, J. L.: Field-deployable, high-resolution, time-of-flight aerosol mass spectrometer, Anal. Chem., 78, 8281–8289, https://doi.org/10.1021/ac061249n, 2006.
De Haan, D. O., Hawkins, L. N., Welsh, H. G., Pednekar, R., Casar, J. R., Pennington, E. A., de Loera, A., Jimenez, N. G., Symons, M. A., Zauscher, M., Pajunoja, A., Caponi, L., Cazaunau, M., Formenti, P., Gratien, A., Pangui, E., and Doussin, J.-F.: Brown Carbon Production in Ammonium- or Amine-Containing Aerosol Particles by Reactive Uptake of Methylglyoxal and Photolytic Cloud Cycling, Environ. Sci. Technol., 51, 7458–7466, https://doi.org/10.1021/acs.est.7b00159, 2017.
DeCarlo, P. F., Slowik, J. G., Worsnop, D. R., Davidovits, P., and Jimenez, J. L.: Particle Morphology and Density Characterization by Combined Mobility and Aerodynamic Diameter Measurements. Part 1: Theory, Aerosol Sci. Tech., 38, 1185–1205, https://doi.org/10.1080/027868290903907, 2004.
Ellis, A., Edwards, R., Saunders, M., Chakrabarty, R. K., Subramanian, R., Timms, N. E., van Riessen, A., Smith, A. M., Lambrinidis, D., Nunes, L. J., Vallelonga, P., Goodwin, I. D., Moy, A. D., Curran, M. A. J., and van Ommen, T. D.: Individual particle morphology, coatings, and impurities of black carbon aerosols in Antarctic ice and tropical rainfall, Geophys. Res. Lett., 43, 11875–11883, https://doi.org/10.1002/2016gl071042, 2016.
Fu, F., Xu, L., Ye, W., Chen, Y., Jiang, M., and Xu, X.: Morphology of black carbon aerosols and ubiquity of 50-nanometer black carbon aerosols in the atmosphere, China Part., 4, 323–326, https://doi.org/10.1016/S1672-2515(07)60283-8, 2006.
Gao, R. S., Schwarz, J. P., Kelly, K. K., Fahey, D. W., Watts, L. A., Thompson, T. L., Spackman, J. R., Slowik, J. G., Cross, E. S., Han, J. H., Davidovits, P., Onasch, T. B., and Worsnop, D. R.: A Novel Method for Estimating Light-Scattering Properties of Soot Aerosols Using a Modified Single-Particle Soot Photometer, Aerosol Sci. Tech., 41, 125–135, https://doi.org/10.1080/02786820601118398, 2007.
Good, N., Coe, H., and McFiggans, G.: Instrumentational operation and analytical methodology for the reconciliation of aerosol water uptake under sub- and supersaturated conditions, Atmos. Meas. Tech., 3, 1241–1254, https://doi.org/10.5194/amt-3-1241-2010, 2010.
Harrison, M. A. J., Barra, S., Borghesi, D., Vione, D., Arsene, C., and Iulian Olariu, R.: Nitrated phenols in the atmosphere: a review, Atmos. Environ., 39, 231–248, https://doi.org/10.1016/j.atmosenv.2004.09.044, 2005.
Haslett, S. L., Thomas, J. C., Morgan, W. T., Hadden, R., Liu, D., Allan, J. D., Williams, P. I., Keita, S., Liousse, C., and Coe, H.: Highly controlled, reproducible measurements of aerosol emissions from combustion of a common African biofuel source, Atmos. Chem. Phys., 18, 385–403, https://doi.org/10.5194/acp-18-385-2018, 2018.
Haywood, J. M. and Shine, K. P.: The effect of anthropogenic sulfate and soot aerosol on the clear sky planetary radiation budget, Geophys. Res. Lett., 22, 603–606, https://doi.org/10.1029/95GL00075, 1995.
Hu, D.: Figures of the manuscript of “Physical and chemical properties of black carbon and organic matter from different combustion and photochemical sources using aerodynamic aerosol classification”, figshare [Figures], https://doi.org/10.6084/m9.figshare.15172572.v1, 2021.
Jayne, J. T., Leard, D. C., Zhang, X., Davidovits, P., Smith, K. A., Kolb, C. E., and Worsnop, D. R.: Development of an Aerosol Mass Spectrometer for Size and Composition Analysis of Submicron Particles, Aerosol Sci. Tech., 33, 49–70, https://doi.org/10.1080/027868200410840, 2000.
Kazemimanesh, M., Moallemi, A., Thomson, K., Smallwood, G., Lobo, P., and Olfert, J. S.: A novel miniature inverted-flame burner for the generation of soot nanoparticles, Aerosol Sci. Tech., 53, 184–195, https://doi.org/10.1080/02786826.2018.1556774, 2019.
Kim, J. H., Mulholland, G. W., Kukuck, S. R., and Pui, D. Y.: Slip Correction Measurements of Certified PSL Nanoparticles Using a Nanometer Differential Mobility Analyzer (Nano-DMA) for Knudsen Number From 0.5 to 83, J. Res. Natl. Inst. Stan., 110, 31–54, https://doi.org/10.6028/jres.110.005, 2005.
Kimmel, J. R., Farmer, D. K., Cubison, M. J., Sueper, D., Tanner, C., Nemitz, E., Worsnop, D. R., Gonin, M., and Jimenez, J. L.: Real-time aerosol mass spectrometry with millisecond resolution, Int. J. Mass Spectrom., 303, 15–26, https://doi.org/10.1016/j.ijms.2010.12.004, 2011.
Kirchstetter, T. W., Novakov, T., and Hobbs, P. V.: Evidence that the spectral dependence of light absorption by aerosols is affected by organic carbon, J. Geophys. Res.-Atmos., 109, D21208, https://doi.org/10.1029/2004jd004999, 2004.
Laborde, M., Mertes, P., Zieger, P., Dommen, J., Baltensperger, U., and Gysel, M.: Sensitivity of the Single Particle Soot Photometer to different black carbon types, Atmos. Meas. Tech., 5, 1031–1043, https://doi.org/10.5194/amt-5-1031-2012, 2012a.
Laborde, M., Schnaiter, M., Linke, C., Saathoff, H., Naumann, K.-H., Möhler, O., Berlenz, S., Wagner, U., Taylor, J. W., Liu, D., Flynn, M., Allan, J. D., Coe, H., Heimerl, K., Dahlkötter, F., Weinzierl, B., Wollny, A. G., Zanatta, M., Cozic, J., Laj, P., Hitzenberger, R., Schwarz, J. P., and Gysel, M.: Single Particle Soot Photometer intercomparison at the AIDA chamber, Atmos. Meas. Tech., 5, 3077–3097, https://doi.org/10.5194/amt-5-3077-2012, 2012b.
Laskin, A., Laskin, J., and Nizkorodov, S. A.: Chemistry of Atmospheric Brown Carbon, Chem. Rev., 115, 4335–4382, https://doi.org/10.1021/cr5006167, 2015.
Leung, K. K., Schnitzler, E. G., Jäger, W., and Olfert, J. S.: Relative Humidity Dependence of Soot Aggregate Restructuring Induced by Secondary Organic Aerosol: Effects of Water on Coating Viscosity and Surface Tension, Environ. Sci. Technol., 4, 386–390, https://doi.org/10.1021/acs.estlett.7b00298, 2017.
Li, C., Hu, Y., Chen, J., Ma, Z., Ye, X., Yang, X., Wang, L., Wang, X., and Mellouki, A.: Physiochemical properties of carbonaceous aerosol from agricultural residue burning: Density, volatility, and hygroscopicity, Atmos. Environ., 140, 94–105, https://doi.org/10.1016/j.atmosenv.2016.05.052, 2016.
Lin, P., Liu, J., Shilling, J. E., Kathmann, S. M., Laskin, J., and Laskin, A.: Molecular characterization of brown carbon (BrC) chromophores in secondary organic aerosol generated from photo-oxidation of toluene, Phys. Chem. Chem. Phys., 17, 23312–23325, https://doi.org/10.1039/C5CP02563J, 2015.
Liu, D., Flynn, M., Gysel, M., Targino, A., Crawford, I., Bower, K., Choularton, T., Jurányi, Z., Steinbacher, M., Hüglin, C., Curtius, J., Kampus, M., Petzold, A., Weingartner, E., Baltensperger, U., and Coe, H.: Single particle characterization of black carbon aerosols at a tropospheric alpine site in Switzerland, Atmos. Chem. Phys., 10, 7389–7407, https://doi.org/10.5194/acp-10-7389-2010, 2010.
Liu, D., Allan, J. D., Young, D. E., Coe, H., Beddows, D., Fleming, Z. L., Flynn, M. J., Gallagher, M. W., Harrison, R. M., Lee, J., Prevot, A. S. H., Taylor, J. W., Yin, J., Williams, P. I., and Zotter, P.: Size distribution, mixing state and source apportionment of black carbon aerosol in London during wintertime, Atmos. Chem. Phys., 14, 10061–10084, https://doi.org/10.5194/acp-14-10061-2014, 2014.
Liu, D., Whitehead, J., Alfarra, M. R., Reyes-Villegas, E., Spracklen, D. V., Reddington, C. L., Kong, S., Williams, P. I., Ting, Y.-C., Haslett, S., Taylor, J. W., Flynn, M. J., Morgan, W. T., McFiggans, G., Coe, H., and Allan, J. D.: Black-carbon absorption enhancement in the atmosphere determined by particle mixing state, Nat. Geosci., 10, 184–188, https://doi.org/10.1038/ngeo2901, 2017.
Liu, D., Taylor, J. W., Crosier, J., Marsden, N., Bower, K. N., Lloyd, G., Ryder, C. L., Brooke, J. K., Cotton, R., Marenco, F., Blyth, A., Cui, Z., Estelles, V., Gallagher, M., Coe, H., and Choularton, T. W.: Aircraft and ground measurements of dust aerosols over the west African coast in summer 2015 during ICE-D and AER-D, Atmos. Chem. Phys., 18, 3817–3838, https://doi.org/10.5194/acp-18-3817-2018, 2018.
Liu, D., He, C., Schwarz, J. P., and Wang, X.: Lifecycle of light-absorbing carbonaceous aerosols in the atmosphere, npj Clim. Atmos. Sci., 3, 40, https://doi.org/10.1038/s41612-020-00145-8, 2020.
Liu, F., Yon, J., Fuentes, A., Lobo, P., Smallwood, G. J., and Corbin, J. C.: Review of recent literature on the light absorption properties of black carbon: Refractive index, mass absorption cross section, and absorption function, Aerosol Sci. Tech., 54, 33–51, https://doi.org/10.1080/02786826.2019.1676878, 2020.
Lu, J. W., Flores, J. M., Lavi, A., Abo-Riziq, A., and Rudich, Y.: Changes in the optical properties of benzo[a]pyrene-coated aerosols upon heterogeneous reactions with NO2 and NO3, Phys. Chem. Chem. Phys., 13, 6484–6492, https://doi.org/10.1039/C0CP02114H, 2011.
Maxut, A., Nozière, B., Fenet, B., and Mechakra, H.: Formation mechanisms and yields of small imidazoles from reactions of glyoxal with NH in water at neutral pH, Phys. Chem. Chem. Phys., 17, 20416–20424, https://doi.org/10.1039/C5CP03113C, 2015.
Miles, R. E. H., Rudić, S., Orr-Ewing, A. J., and Reid, J. P.: Sources of Error and Uncertainty in the Use of Cavity Ring Down Spectroscopy to Measure Aerosol Optical Properties, Aerosol Sci. Tech., 45, 1360–1375, https://doi.org/10.1080/02786826.2011.596170, 2011.
Miller, A., Frey, G., King, G., and Sunderman, C.: A Handheld Electrostatic Precipitator for Sampling Airborne Particles and Nanoparticles, Aerosol Sci. Tech., 44, 417–427, https://doi.org/10.1080/02786821003692063, 2010.
Moallemi, A., Kazemimanesh, M., Corbin, J. C., Thomson, K., Smallwood, G., Olfert, J. S., and Lobo, P.: Characterization of black carbon particles generated by a propane-fueled miniature inverted soot generator, J. Aerosol Sci., 135, 46–57, https://doi.org/10.1016/j.jaerosci.2019.05.004, 2019.
Moteki, N. and Kondo, Y.: Effects of Mixing State on Black Carbon Measurements by Laser-Induced Incandescence, Aerosol Sci. Tech., 41, 398–417, https://doi.org/10.1080/02786820701199728, 2007.
Nakao, S., Tang, P., Tang, X., Clark, C. H., Qi, L., Seo, E., Asa-Awuku, A., and Cocker, D.: Density and elemental ratios of secondary organic aerosol: Application of a density prediction method, Atmos. Environ., 68, 273–277, https://doi.org/10.1016/j.atmosenv.2012.11.006, 2013.
Nakayama, T., Matsumi, Y., Sato, K., Imamura, T., Yamazaki, A., and Uchiyama, A.: Laboratory studies on optical properties of secondary organic aerosols generated during the photooxidation of toluene and the ozonolysis of α-pinene, J. Geophys. Res.-Atmos., 115, https://doi.org/10.1029/2010jd014387, 2010.
Noziere, B. and Esteve, W.: Light-absorbing aldol condensation products in acidic aerosols: Spectra, kinetics, and contribution to the absorption index, Atmos. Environ., 41, 1150–1163, https://doi.org/10.1016/j.atmosenv.2006.10.001, 2007.
Olfert, J. S. and Collings, N.: New method for particle mass classification – the Couette centrifugal particle mass analyzer, J. Aerosol Sci., 36, 1338–1352, https://doi.org/10.1016/j.jaerosci.2005.03.006, 2005.
Olfert, J. S., Reavell, K. S., Rushton, M. G., and Collings, N.: The experimental transfer function of the Couette centrifugal particle mass analyzer, J. Aerosol Sci., 37, 1840–1852, https://doi.org/10.1016/j.jaerosci.2006.07.007, 2006.
Paglione, M., Gilardoni, S., Rinaldi, M., Decesari, S., Zanca, N., Sandrini, S., Giulianelli, L., Bacco, D., Ferrari, S., Poluzzi, V., Scotto, F., Trentini, A., Poulain, L., Herrmann, H., Wiedensohler, A., Canonaco, F., Prévôt, A. S. H., Massoli, P., Carbone, C., Facchini, M. C., and Fuzzi, S.: The impact of biomass burning and aqueous-phase processing on air quality: a multi-year source apportionment study in the Po Valley, Italy, Atmos. Chem. Phys., 20, 1233–1254, https://doi.org/10.5194/acp-20-1233-2020, 2020.
Park, K., Cao, F., Kittelson, D. B., and McMurry, P. H.: Relationship between Particle Mass and Mobility for Diesel Exhaust Particles, Environ. Sci. Technol., 37, 577–583, https://doi.org/10.1021/es025960v, 2003.
Park, K., Kittelson, D. B., and McMurry, P. H.: Structural Properties of Diesel Exhaust Particles Measured by Transmission Electron Microscopy (TEM): Relationships to Particle Mass and Mobility, Aerosol Sci. Tech., 38, 881–889, https://doi.org/10.1080/027868290505189, 2004a.
Park, K., Kittelson, D., Zachariah, M., and McMurry, P.: Measurement of Inherent Material Density of Nanoparticle Agglomerates, J. Nanoparticle Res., 6, 267–272, https://doi.org/10.1023/B:NANO.0000034657.71309.e6, 2004b.
Powelson, M. H., Espelien, B. M., Hawkins, L. N., Galloway, M. M., and De Haan, D. O.: Brown Carbon Formation by Aqueous-Phase Carbonyl Compound Reactions with Amines and Ammonium Sulfate, Environ. Sci. Technol., 48, 985–993, https://doi.org/10.1021/es4038325, 2014.
Ramanathan, V., Li, F., Ramana, M. V., Praveen, P. S., Kim, D., Corrigan, C. E., Nguyen, H., Stone, E. A., Schauer, J. J., Carmichael, G. R., Adhikary, B., and Yoon, S. C.: Atmospheric brown clouds: Hemispherical and regional variations in long-range transport, absorption, and radiative forcing, J. Geophys. Res.-Atmos., 112, D22S21, https://doi.org/10.1029/2006jd008124, 2007.
Sedlacek, A. J., Onasch, T. B., Nichman, L., Lewis, E. R., Davidovits, P., Freedman, A., and Williams, L.: Formation of refractory black carbon by SP2-induced charring of organic aerosol, Aerosol Sci. Tech., 52, 1345–1350, https://doi.org/10.1080/02786826.2018.1531107, 2018.
Shao, Y., Wang, Y., Du, M., Voliotis, A., Alfarra, M. R., Turner, S. F., and McFiggans, G.: Characterisation of the Manchester Aerosol Chamber facility, Atmos. Meas. Tech. Discuss. [preprint], https://doi.org/10.5194/amt-2021-147, in review, 2021.
Shapiro, E. L., Szprengiel, J., Sareen, N., Jen, C. N., Giordano, M. R., and McNeill, V. F.: Light-absorbing secondary organic material formed by glyoxal in aqueous aerosol mimics, Atmos. Chem. Phys., 9, 2289–2300, https://doi.org/10.5194/acp-9-2289-2009, 2009.
Slowik, J. G., Stainken, K., Davidovits, P., Williams, L. R., Jayne, J. T., Kolb, C. E., Worsnop, D. R., Rudich, Y., DeCarlo, P. F., and Jimenez, J. L.: Particle Morphology and Density Characterization by Combined Mobility and Aerodynamic Diameter Measurements. Part 2: Application to Combustion-Generated Soot Aerosols as a Function of Fuel Equivalence Ratio, Aerosol Sci. Tech., 38, 1206–1222, https://doi.org/10.1080/027868290903916, 2004.
Sorensen, C. M.: The Mobility of Fractal Aggregates: A Review, Aerosol Sci. Tech., 45, 765–779, https://doi.org/10.1080/02786826.2011.560909, 2011.
Tavakoli, F., Symonds, J. P. R., and Olfert, J. S.: Generation of a Monodisperse Size-Classified Aerosol Independent of Particle Charge, Aerosol Sci. Tech., 48, i–iv, https://doi.org/10.1080/02786826.2013.877121, 2014.
Teoh, R., Stettler, M. E. J., Majumdar, A., Schumann, U., Graves, B., and Boies, A. M.: A methodology to relate black carbon particle number and mass emissions, J. Aerosol Sci., 132, 44–59, https://doi.org/10.1016/j.jaerosci.2019.03.006, 2019.
Turpin, B. J. and Lim, H.-J.: Species Contributions to PM2.5 Mass Concentrations: Revisiting Common Assumptions for Estimating Organic Mass, Aerosol Sci. Tech., 35, 602–610, https://doi.org/10.1080/02786820119445, 2001.
Voliotis, A., Prokeš, R., Lammel, G., and Samara, C.: New insights on humic-like substances associated with wintertime urban aerosols from central and southern Europe: Size-resolved chemical characterization and optical properties, Atmos. Environ., 166, 286–299, https://doi.org/10.1016/j.atmosenv.2017.07.024, 2017.
Voliotis, A., Wang, Y., Shao, Y., Du, M., Bannan, T. J., Percival, C. J., Pandis, S. N., Alfarra, M. R., and McFiggans, G.: Exploring the composition and volatility of secondary organic aerosols in mixed anthropogenic and biogenic precursor systems, Atmos. Chem. Phys., 21, 14251–14273, https://doi.org/10.5194/acp-21-14251-2021, 2021.
Wentzel, M., Gorzawski, H., Naumann, K. H., Saathoff, H., and Weinbruch, S.: Transmission electron microscopical and aerosol dynamical characterization of soot aerosols, J. Aerosol Sci., 34, 1347–1370, https://doi.org/10.1016/S0021-8502(03)00360-4, 2003.
Wu, Y., Xia, Y., Huang, R., Deng, Z., Tian, P., Xia, X., and Zhang, R.: A study of the morphology and effective density of externally mixed black carbon aerosols in ambient air using a size-resolved single-particle soot photometer (SP2), Atmos. Meas. Tech., 12, 4347–4359, https://doi.org/10.5194/amt-12-4347-2019, 2019.
Xiong, C. and Friedlander, S. K.: Morphological properties of atmospheric aerosol aggregates, P. Natl. Acad. Sci. USA, 98, 11851–11856, https://doi.org/10.1073/pnas.211376098, 2001.
Zarzana, K. J., Cappa, C. D., and Tolbert, M. A.: Sensitivity of Aerosol Refractive Index Retrievals Using Optical Spectroscopy, Aerosol Sci. Tech., 48, 1133–1144, https://doi.org/10.1080/02786826.2014.963498, 2014.
Zeng, C., Liu, C., Li, J., Zhu, B., Yin, Y., and Wang, Y.: Optical Properties and Radiative Forcing of Aged BC due to Hygroscopic Growth: Effects of the Aggregate Structure, J. Geophys. Res.-Atmos., 124, 4620–4633, https://doi.org/10.1029/2018jd029809, 2019.
Zhai, J., Lu, X., Li, L., Zhang, Q., Zhang, C., Chen, H., Yang, X., and Chen, J.: Size-resolved chemical composition, effective density, and optical properties of biomass burning particles, Atmos. Chem. Phys., 17, 7481–7493, https://doi.org/10.5194/acp-17-7481-2017, 2017.
Zhang, R., Khalizov, A. F., Pagels, J., Zhang, D., Xue, H., and McMurry, P. H.: Variability in morphology, hygroscopicity, and optical properties of soot aerosols during atmospheric processing, P. Natl. Acad. Sci. USA, 105, 10291, https://doi.org/10.1073/pnas.0804860105, 2008.
Zhang, X., Lin, Y.-H., Surratt, J. D., and Weber, R. J.: Sources, Composition and Absorption Ångström Exponent of Light-absorbing Organic Components in Aerosol Extracts from the Los Angeles Basin, Environ. Sci. Technol., 47, 3685–3693, https://doi.org/10.1021/es305047b, 2013.
Zuidema, P., Redemann, J., Haywood, J., Wood, R., Piketh, S., Hipondoka, M., and Formenti, P.: Smoke and Clouds above the Southeast Atlantic: Upcoming Field Campaigns Probe Absorbing Aerosol's Impact on Climate, B. Am. Meteorol. Soc., 97, 1131–1135, https://doi.org/10.1175/bams-d-15-00082.1, 2016.