the Creative Commons Attribution 4.0 License.
the Creative Commons Attribution 4.0 License.
 | 29 Oct 2021
Impacts of emission changes in China from 2010 to 2017 on domestic and intercontinental air quality and health effect
Drew Shindell
Karl Seltzer
Lu Shen
Jean-Francois Lamarque
Qiang Zhang
Jia Xing
Zhe Jiang
Lei Zhang
China has experienced dramatic changes in emissions since 2010, which accelerated following the implementation of the Clean Air Action program in 2013. These changes have resulted in significant air quality improvements that are reflected in observations from both surface networks and satellite observations. Air pollutants, such as PM2.5, surface ozone, and their precursors, have long enough lifetimes in the troposphere to be easily transported downwind. Emission changes in China will thus not only change the domestic air quality but will also affect the air quality in other regions. In this study, we use a global chemistry transport model (CAM-chem) to simulate the influence of Chinese emission changes from 2010 to 2017 on both domestic and foreign air quality. We then quantify the changes in air-pollution-associated (including both PM2.5 and O3) premature mortality burdens at regional and global scales. Within our simulation period, the population-weighted annual PM2.5 concentration in China peaks in 2011 (94.1 µg m−3) and decreases to 69.8 µg m−3 by 2017. These estimated national PM2.5 concentration changes in China are comparable with previous studies using fine-resolution regional models, though our model tends to overestimate PM2.5 from 2013 to 2017 when evaluated with surface observations. Relative to 2010, emission changes in China increased the global PM2.5-associated premature mortality burdens through 2013, among which a majority of the changes (∼ 93 %) occurred in China. The sharp emission decreases after 2013 generated significant benefits for human health. By 2017, emission changes in China reduced premature deaths associated with PM2.5 by 108 800 (92 800–124 800) deaths per year globally, relative to 2010, among which 92 % were realized in China. In contrast, the population-weighted, annually averaged maximum daily 8 h ozone concentration peaked in 2014 and did not reach 2010 levels by 2017. As such, O3 generated nearly 8500 (6500–9900) more premature deaths per year in 2017 compared to 2010. Downwind regions, such as South Korea, Japan, and the United States, generally experienced O3 improvements following 2013 due to the decreased export of ozone and its precursors. Overall, we conclude that the sharp emission reductions in China over the past decade have generated substantial benefits for air quality that have reduced premature deaths associated with air pollution at a global scale.
- Article
(2805 KB) - Full-text XML
-
Supplement
(1953 KB) - BibTeX
- EndNote


Fine particulate matter with an aerodynamic diameter of less than 2.5 µm (PM2.5) is of acute interest to the atmospheric chemistry research community due to its environmental impacts, such as visibility impairment and material damages (Hand et al., 2013, 2014; Wu and Zhang, 2018), and effects on human health (e.g., Pope et al., 2002; Krewski et al., 2009). Associations between short-term and long-term PM2.5 exposure and various deleterious human health impacts have been widely and consistently reported (Krewski et al., 2009; Burnett et al., 2014; Liu et al., 2019), including premature mortality via several endpoints (e.g., cardiopulmonary and respiratory disease). Exposure to ozone (O3) also impacts human health, with studies reporting an association between short-term O3 exposure and hospital admissions, emergency room visits for respiratory causes, and school absences (Katsouyanni et al., 2009) and long-term O3 exposure with premature mortality from respiratory disease (Jerrett et al., 2009; Turner et al., 2016).
PM2.5 and its precursors can travel long distances, affecting air quality and health in other receptor regions (Ewing et al. 2010; Pfister et al., 2011; Anenberg et al., 2014) despite its relatively short lifetime in the atmosphere (days to weeks). Tropospheric ozone features a longer lifetime, with a global average of ∼ 23 d (Young et al., 2013), and the research community has expressed particular interest in studying its intercontinental transport (e.g., Zhang et al., 2008, 2014; Cooper et al., 2015; Lin et al., 2012, 2017; Parrish et al., 2014). Numerous studies have investigated the source–reception relationship on air quality and associated premature mortality burden from emission changes in one source region on others (West et al., 2009a, b; Fry et al., 2014; Crippa et al., 2019). Liang et al. (2018) used the ensemble model outputs from the Task Force on Hemispheric Transport of Air Pollution (TF HTAP; Janssens-Maenhout et al., 2015) and estimated the source–receptor relationship between air quality and avoided premature mortality from a 20 % reduction in anthropogenic emissions in East Asia. They estimated that 96 600 premature mortalities from long-term PM2.5 exposure could be avoided globally due to these emission reductions, with 6 % (5500 deaths) occurring in downwind regions. For long-term O3 exposure, these emission reductions could lead to 1400 fewer premature mortalities globally, with 15 % (1700 deaths) occurring downwind.
To tackle the severe air pollution problem in China, the Chinese government has implemented strict clean air policies in recent years (State Council of the People's Republic of China, 2013). Before 2013, the clean air control policies mainly focused on the emission standards of the industry and power sectors. After 2013, eight more stringent control measures were developed and aimed to further reduce PM2.5 pollution (see Fig. 1 in Zheng et al., 2018b). As a result, significant emission reductions have occurred in China, and the air quality has substantially improved since 2013 (Zheng et al., 2017; Zhang et al., 2019; UN Environment, 2019; Zheng et al., 2018a, b). The relative change in China's anthropogenic emissions for specific air pollutants during the 2010–2017 period include −35 % for primary PM2.5, −62 % for SO2, −27 % for BC (black carbon), −35 % for OC (organic carbon), −17 % for NOx, and −27 % for CO (Zheng et al., 2018b). Surface monitors indicate that these reductions have resulted in significant decreases in ambient PM2.5 concentrations, which are further reflected in observations from satellites and results from model simulations (e.g., Song et al., 2017; Huang et al., 2018; Li et al., 2015; Lin et al., 2018; Zheng et al., 2017; Zhang et al., 2019). The rapid reductions of major air pollutants in China are also confirmed using a long-term, robust observational record at Fukue Island, Japan (Kanaya et al., 2020). A recent study using a high-resolution regional air quality model showed that the estimated national population-weighted annual mean PM2.5 concentrations decreased from 61.8 to 42.0 µg m−3 from 2013 to 2017 (Q. Zhang et al. 2019). Meanwhile, summertime daily maximum 8 h average (MDA8) O3 in China has shown an increasing trend since 2013 (X. Lu et al., 2018, 2020). The increasing trend in surface O3 may be partially explained by the slowing down of the aerosol sink of hydroperoxyl radicals (K. Li et al., 2019), though this chemical pathway remains disputed (Tan et al., 2020).
Previous studies have evaluated the benefits of China's Air Pollution Prevention and Control Action Plan (APPCAP) on improved air quality, including both PM2.5 and O3 pollution, and avoided premature mortalities (e.g., Huang et al., 2018; Zhang et al., 2019; X. Lu et al., 2020). However, limited studies have investigated the benefits of these actions on global air quality and the air-pollution-related premature mortality burden. In this study, we use a global chemical transport model to simulate the global air quality changes from 2010 to 2017 that result from the historical emission changes in China. We then estimate the air-pollution-related premature mortality burden both within China and elsewhere. This time period was selected because emissions in China slightly increased from 2010 to 2013 and substantially decreased thereafter, which allows for a comparison of different emission trends in China on global air quality and health impacts.
Table 1Model simulation performed for this study.
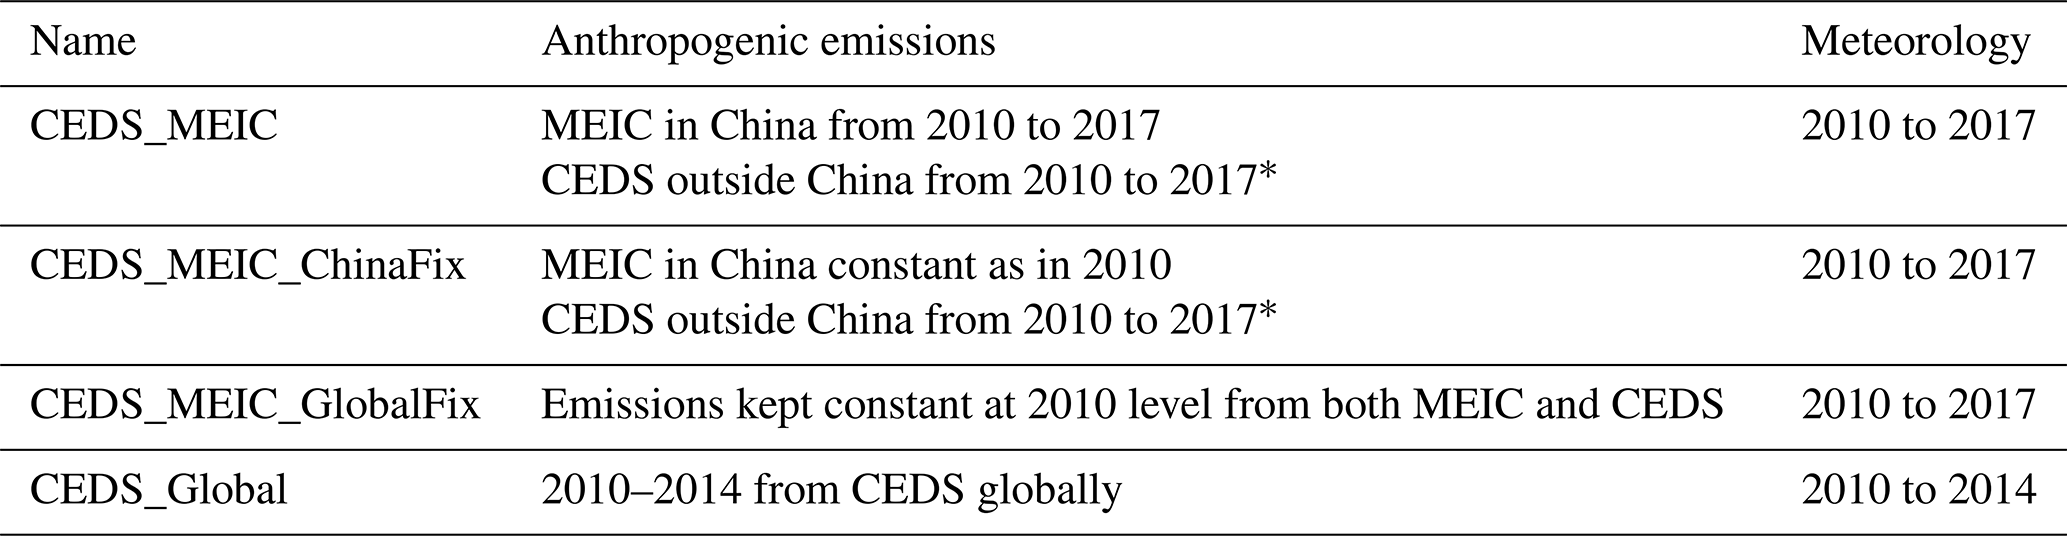
∗ The global emissions other than in China after 2014 stay constant as in the year 2014 since the global anthropogenic emissions after 2014 were not available when we carried out study.
2.1 Model simulation using the CAM-chem model
Global air quality is simulated from 2010 to 2017 using the Community Atmosphere Model with Chemistry (CAM-chem) model (version 4; Lamarque et al., 2012) at a horizontal resolution of 1.9∘ (latitude) × 2.5∘ (longitude), using 56 vertical levels that span the surface to 4 hPa (≈ 40 km), and driven by NASA GEOS5 Global Atmosphere Forcing Data (Tilmes 2016, http://rda.ucar.edu/datasets/ds313.0/, last Accessed 20 April 2020). Additional modeling configurations, including the lower boundary conditions for long-lived species such as CO2 and CH4, the online biogenic emission inventory, and other natural emissions, are described in Zhang et al. (2016) and Tilmes et al. (2016). In this version of CAM-chem, the bulk aerosol model was applied based on the work of Tie et al. (2001, 2005), in which the sulfate aerosol is formed by the oxidation of SO2 in both the gas and aqueous phases (Lamarque et al., 2012; Tilmes et al., 2016). Ammonium nitrate formation is dependent on the amount of sulfate present in the air mass, following the parameterization of gas and aerosol partitioning by Metzger et al. (2002). Secondary organic aerosols (SOAs) are derived using the two-product model approach, with laboratory-derived yields for monoterpenes, isoprene, and aromatic photooxidation (Heald et al., 2008; Times et al., 2016). Recent research has suggested that anthropogenic SOA may be a dominant contributor of health impacts globally (Nault et al., 2021). As our simulations lack representation of important anthropogenic SOA precursors, such as intermediate-volatility organic compounds (IVOCs; Zhao et al., 2014; Q. Lu et al., 2020; Pennington et al., 2021), our simulated PM2.5 concentrations may be low biased. PM2.5 is calculated as the sum of SO4 + NO3 + NH4 + OC + BC + SOA + 0.2 ⋅ Dust + Sea salt (West et al., 2013; Silva et al., 2016). For dust and sea salt, only the size fractions relevant for PM2.5 (size bins 1–3) are used. Dust in desert regions was found to be too high in the model, so global dust concentrations were multiplied by 0.2 to achieve rough consistency with the PM2.5 concentrations estimated with Brauer et al. (2012). A comprehensive evaluation of model performance in simulating temporal and spatial distribution of global ozone and aerosols was carried out in previous studies (Tilmes et al., 2015, 2016; Zhang et al., 2016). Here, we evaluate the model using surface ozone and PM2.5 concentrations in China from 2013 to 2017. The lowest modeled grid cell (∼ 58 m above sea level) is taken to indicate ground-level concentrations.
Our base case simulation (CEDS_MEIC in Table 1) spans 2010 to 2017, with a 1-year spin-up in 2009, and used a time-varying global anthropogenic emission inventory. The base inventory utilized the Community Emissions Data System (CEDS, v2017-05-18; Hoesly et al., 2018), with Chinese emissions supplemented by the Multi-resolution Emission Inventory (MEIC; http://www.meicmodel.org/, last access: 20 April 2020). Since the version of the CEDS inventory used here stops after 2014, global anthropogenic emissions for all other regions outside China repeat 2014 for 2015–2017. McDuffie et al. (2020) updated the global CEDS anthropogenic emissions through 2017 with continued updates into 2019 (https://github.com/JGCRI/CEDS, last access: 6 May 2021). However, this would have a negligible effect on our conclusions since our focus is the emission changes from China, which do feature year-specific emissions for 2015–2017, and on the influence of domestic and international air pollution. We then performed a sensitivity simulation from 2010 to 2017 (CEDS_MEIC_ChinaFix) that kept Chinese emissions constant at 2010 levels. The differences between the base case simulation and this sensitivity simulation represent the influence of anthropogenic emission changes in China on global air quality and human health (Table 1). Finally, we performed a sensitivity simulation with global anthropogenic emissions frozen at 2010 levels (CEDS_MEIC_GlobalFix, Table 1). This simulation isolates the influence of meteorological changes on PM2.5 and O3 changes.
It has been reported that the CEDS emissions inventory used here is high biased for the magnitude of the Chinese emissions and underestimates the decreasing emissions trend in China since 2013 (Zheng et al., 2018b; Paulot et al., 2018). Indeed, we see that in 2014 (Fig. S1 in the Supplement) the emissions in the CEDS inventory are at least 20 % higher than the emissions from the MEIC inventory for most air pollutants. More specifically, the SO2, OC, and BC emissions in CEDS are 84 %, 81 %, and 58 % higher, respectively, in 2014 than those reported in the MEIC inventory. In addition, the CEDS inventory estimated a continued increasing trend for several pollutants, whereas the MEIC inventory often peaked prior to 2012 for pollutants (Liu et al., 2016; Zheng et al., 2018b). We also find emissions in the CEDS inventory to be higher in the western and southern parts of China when compared to the MEIC inventory and lower in eastern China (Fig. S2). To test the influence of these differences in Chinese emissions, we performed another sensitivity simulation from 2010 to 2014 that applied the CEDS inventory globally (CEDS_Global). This enables an evaluation into the model's performance when using a variable inventory and allows for a discussion on the relative air quality changes when applying a different emission inventory in China.
2.2 Surface observation for PM2.5 and O3 in China
Hourly surface observations for PM2.5 and O3 were retrieved from the China National Environmental Monitoring Center (CNEMC) network (http://106.37.208.233:20035/) from 2013 to 2017. Data prior to 2013 are not available. We then evaluated the model's performance in simulating annual PM2.5 and the annual average maximum daily 8 h average (MDA8) O3 as these two metrics have been reported to be associated with the health impacts in epidemiological analyses.
2.3 Health impact assessment for surface PM2.5 and O3
To calculate health impacts, we applied the relative risk associated with long-term air pollution exposure from various epidemiological studies, baseline mortality rates, population, and modeled exposure concentrations as follows:
where ΔMort is mortality burden attributed to long-term PM2.5 and O3 exposure, Y0 is the baseline mortality rates for cause of specific disease, AF is the attribution fraction of mortality associated with air pollution exposure, which is calculated as (RR signifies relative risk), and Pop is the exposed population with ages greater than 25 years old. The RR for long-term PM2.5 exposure is calculated using the integrated exposure response model (IER; Burnett et al., 2014) from the Global Burden of Disease 2017 (GBD2017) study (Stanaway et al., 2018). The RR for long-term O3 exposure is retrieved from Turner et al., (2016), which reports a RR of 1.12 (95 % confidence interval (CI): 1.08, 1.16) for respiratory disease. Country age-specific baseline mortality rates (Y0) in 2010 were retrieved from the GBD2017 project (Stanaway et al., 2018) and remapped to match the 10th International Statistical Classification of Diseases and Related Health Problems codes used in the cohort study (Turner et al., 2016; Seltzer et al., 2020). The theoretical minimum risk exposure level for PM2.5 exposure assessment is drawn from a uniform distribution with a lower bound of 5.8 µg m−3 and an upper bound of 8.8 µg m−3, and for O3 exposure it is 26.7 ppbv. Previous studies have shown that coarse-resolution global CTMs (chemical transport models), e.g., 1.9∘ × 2.5∘ , likely generate low biases in estimating health effects, especially in urban areas (Li et al., 2016; Punger and West, 2013; Silva et al., 2013, 2016). However, less is known of how these underestimates would affect the relative contributions of downwind transportation (Liang et al., 2018). Jin et al. (2019) concluded that the uncertainties in estimating the ambient PM2.5-related mortality burden is dominated by the uncertainties in the underlying exposure response function and less influenced by the uncertainties associated with the PM2.5 concentration estimates.
Table 2Model performance for the annual PM2.5 concentration compared with surface observation in China from 2013 to 2017, with mean bias (MB, µg m−3), normalized mean bias (NMB, %), normalized mean error (NME, %), and root-mean-square error (RMSE, µg m−3).
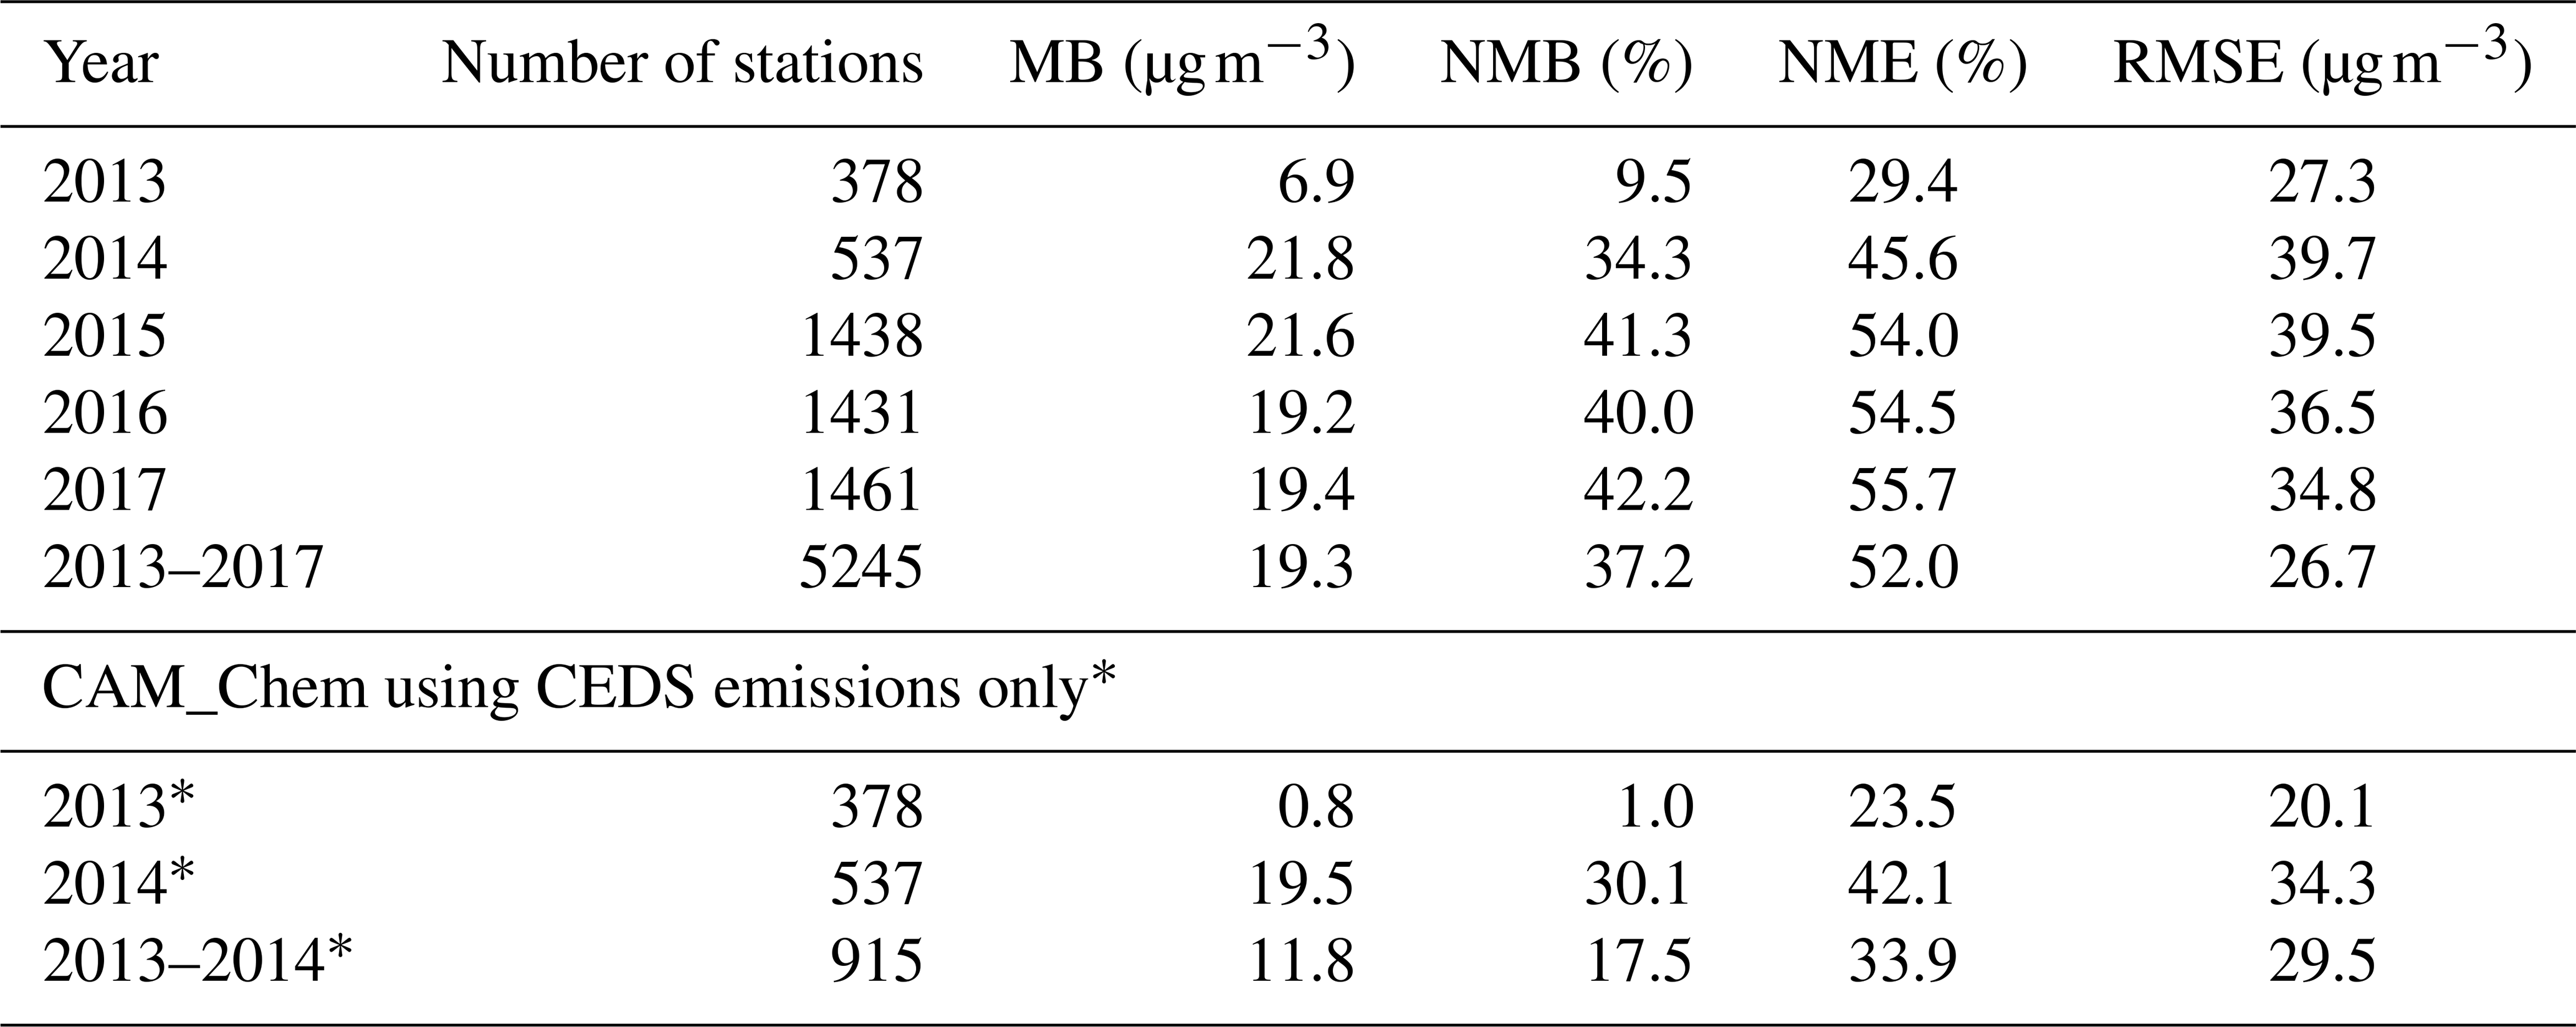
∗ The CAM-chem simulations applying global CEDS emissions only, which only has been run from 2010 to 2014.
Table 3As Table 2 but for annual MDA8 O3, with mean bias (MB, ppbv), normalized mean bias (NMB, %), normalized mean error (NME, %), and root-mean-square error (RMSE, ppbv).
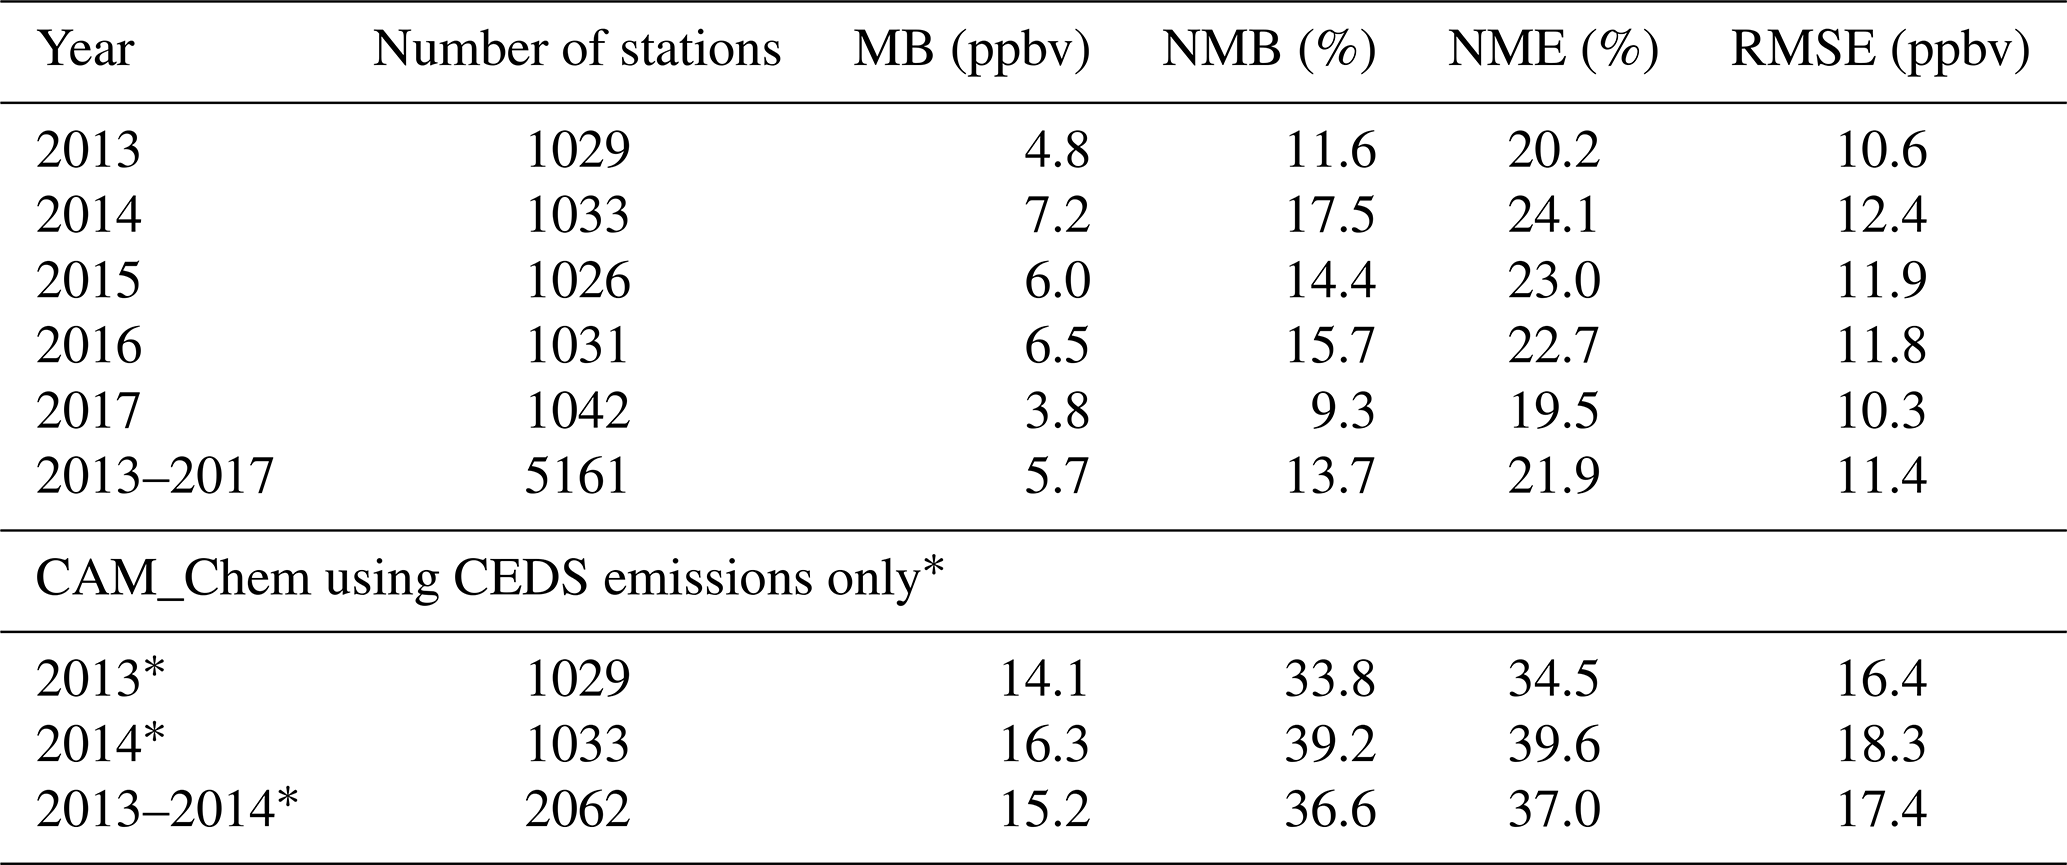
∗ The CAM-chem simulations applying global CEDS emissions only, which only has been run from 2010 to 2014.
3.1 Model evaluation with surface observation in China
In the base CAM-chem simulation (CEDS_MEIC scenario), predicted annual PM2.5 concentrations in China are overestimated, with a mean bias (MB) of 19.3 µg m−3 and normalized mean bias (NMB) of 37.2 %. The MB fluctuates around 20 µg m−3 from 2014 to 2017 and is lowest in 2013 (MB of 7.6 µg m−3). The lower MB and NMB in 2013 could be due to the fact that there are much less data available in 2013. The consistent positive NMBs indicate that the overestimates are systematic. This should not affect our main conclusions since we focus on the changes among years. The high modeling bias for CAM-chem-predicted surface PM2.5 has also been reported in other studies (e.g., He and Zhang, 2014). These studies attribute CAM-chem modeling bias in surface PM2.5 to predictions of , , and organic aerosols, as well as missing major inorganic aerosol species such as nitrate and chloride (He and Zhang, 2014; Tilmes et al., 2016). By including advanced inorganic aerosol treatments, such as condensation of volatile species, explicit inorganic aerosol thermodynamics for sulfate, ammonium, nitrate, sodium, and chloride (He and Zhang, 2014) and more comprehensively representing secondary organic aerosol formation (e.g., using the volatility basis set scheme; Times et al., 2019; Liu et al., 2020), modeling performance could significantly improve. We also find that the bias metrics exhibit small interannual variability, with NMB generally around 40 % and NME around 50 %. Exceptions include the years 2013 and 2014, which have smaller NMB values due to the limited number of the observations (Table 2). CAM-chem can generally reproduce the spatial patterns of the annual PM2.5 distributions, with a correlation coefficient (R) greater than 0.7. Notably, simulations using only CEDS emissions (i.e., the CEDS_Global scenario) generate better performance in both 2013 and 2014. Part of the reason is that we have less available data in these 2 years. However, we suspect the main reason for this variable bias is due to spatial changes in emissions between the inventories. While total emissions in China are higher in the CEDS inventory than in the MEIC inventory, CEDS tends to allocate more emissions in western and central China (Fig. S2). As such, predictions of annual PM2.5 concentrations using the CEDS inventory are lower in eastern China and higher in western and northwestern China (Fig. S3). CAM-chem NMB in simulating the annual MDA8 O3 is lower than 20 % for all evaluated years (Table 3). From Table 3, we can also see that CAM-chem overestimates the annual MDA8 O3 in China, which means our estimates for the O3-related mortality burden will likely be biased high, too. A high bias of about 10 ppb can be attributed to the coarse model resolution, which leads to an overestimate of ozone production due to diluted emissions of ozone precursors (Tilmes et al, 2015). In contrast to the PM2.5 performance, the CEDS simulation (CEDS_Global scenario) generates poorer model performance for MDA8 O3. For both PM2.5 and ozone, we also find that the NMBs are lower in eastern China compared with other inland regions (Figs. S5 and S6).
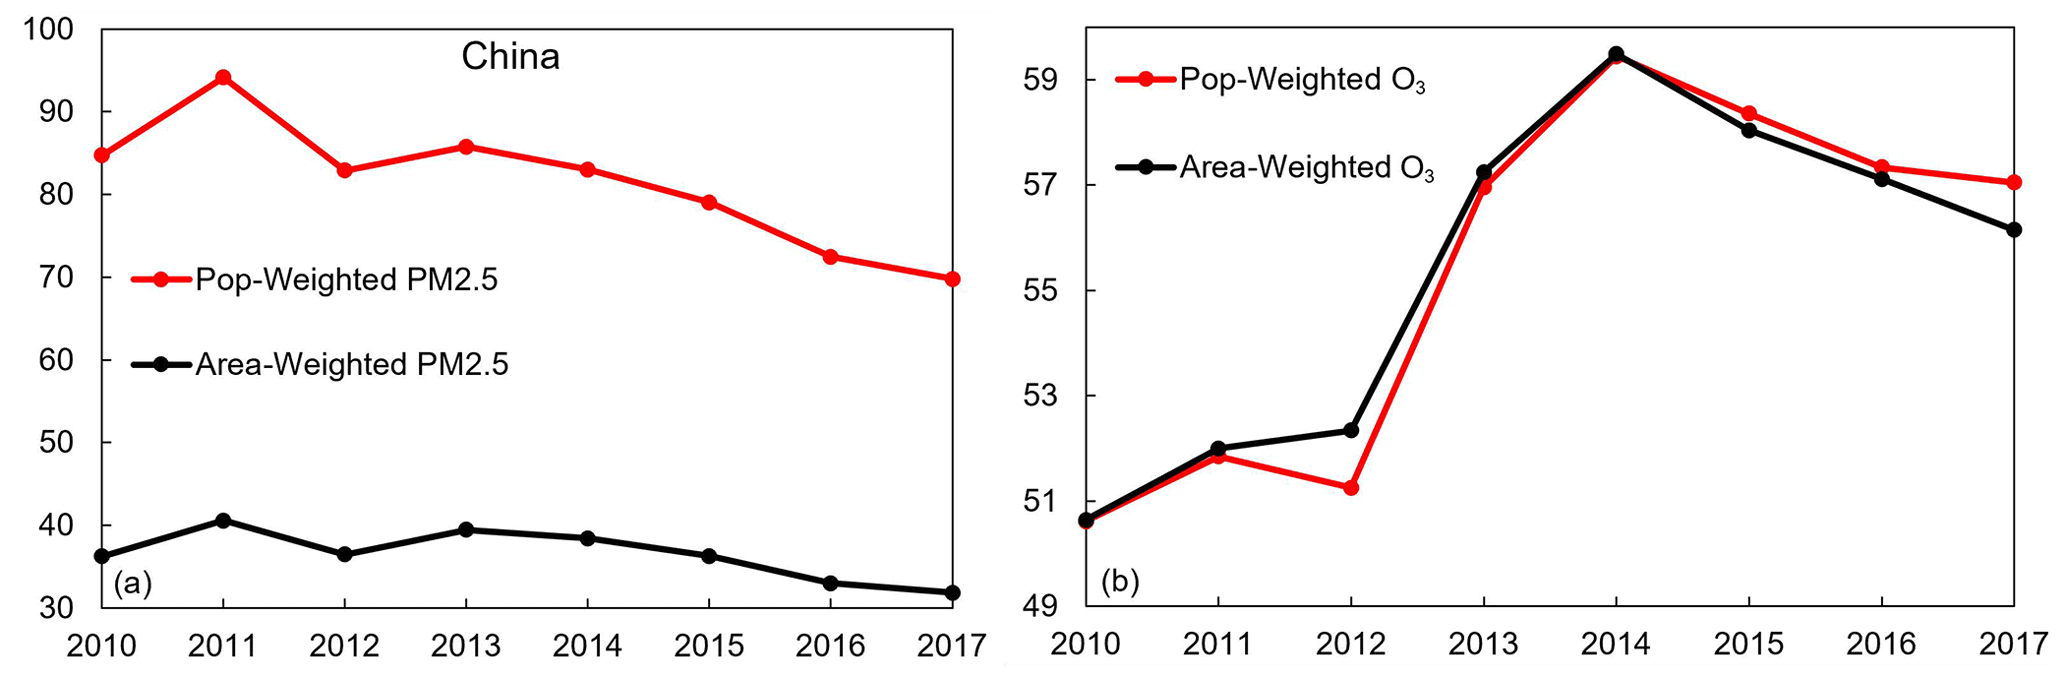
Figure 1National population-weighted (pop-weighted) and area-weighted annual PM2.5 (a) and MDA8 O3 (b) from 2010 to 2017 from our base model simulation (CEDS_MEIC). The units are micrograms per cubic meter (µg m−3) for PM2.5 and parts per billion volume (ppbv) for ozone.
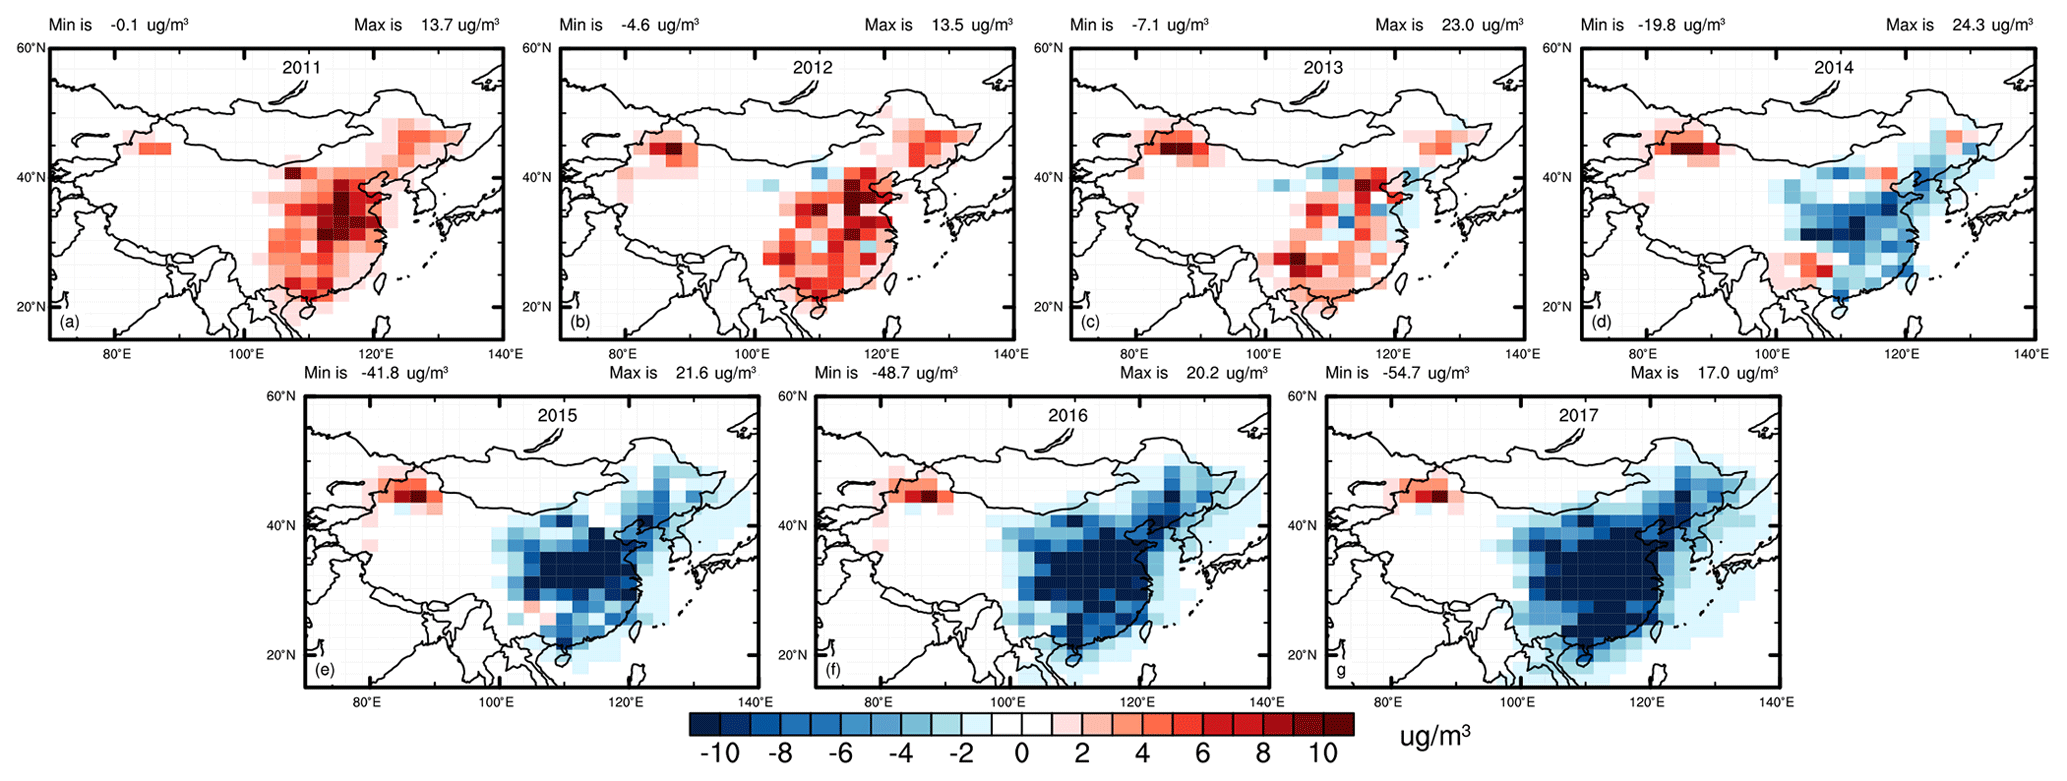
Figure 2Annual PM2.5 changes (unit of µg m−3) from 2011 to 2017 due to anthropogenic emission changes in China only. The results are calculated as the differences between CEDS_MEIC and CEDS_MEIC_ChinaFix for each year.
3.2 Air quality changes in China from 2010 to 2017
Annual, population-weighted (pop-weighted) PM2.5 concentrations decreased by 17.6 % between 2010 and 2017 (84.7 µg m−3 in 2010 to 69.8 µg m−3 in 2017; Fig. 1). The pop-weighted PM2.5 concentration was highest in 2011 (annual average of 94.1 µg m−3) and subsequently decreased through 2017 (69.8 µg m−3). Between 2013 and 2017, the national annual pop-weighted PM2.5 concentration decreased by 15.9 µg m−3, which is comparable to the reductions (19.8 µg m−3) reported by Q. Zhang et al. (2019), who used a high-resolution regional air quality model. At the national scale, the pop-weighted PM2.5 concentration features a similar trend as the area-weighted average trend but is notably higher (Fig. 1a), indicating that higher PM2.5 concentrations happen in regions with higher population density. The annual average of area-weighted PM2.5 concentration decreased by 7.6 µg m−3 between 2010 and 2017, which is consistent with the estimates reported by Ding et al. (2019a) at 9.0 µg m−3. The surface PM2.5 changes in China due to emission changes usually peak in the fall and winter (Fig. S7a). Spatially, we see that significant PM2.5 changes (increases before 2013 and decreases thereafter) occur in eastern China (Fig. 2), which was the focus region for China in the APPCAP (Ding et al., 2019a, b). We also find that the annual PM2.5 decreases in China are mainly dominated by the changes in emissions and not due to meteorology, which is consistent with prior studies (Dang and Liao, 2019; Ding et al., 2019a; Zhai et al., 2019; Q. Zhang et al., 2019). Relative to 2010, interannual meteorology led to annual PM2.5 decreases as high as 4.4 µg m−3 in 2011 and increases as high as 3.1 µg m−3 in 2015. Meanwhile, the emission changes led to annual PM2.5 decreases as high as 16.7 µg m−3 in 2017 and increases as high as 4.9 µg m−3 in 2015 (Fig. 4a). There were also isolated increases in PM2.5 in northwest China from 2010 to 2013, which were mainly caused by the dust storms (Meng et al., 2019; Luo et al., 2020; Zhao et al., 2020).

Figure 3Same as Fig. 2 but for annual MDA8 O3 changes.
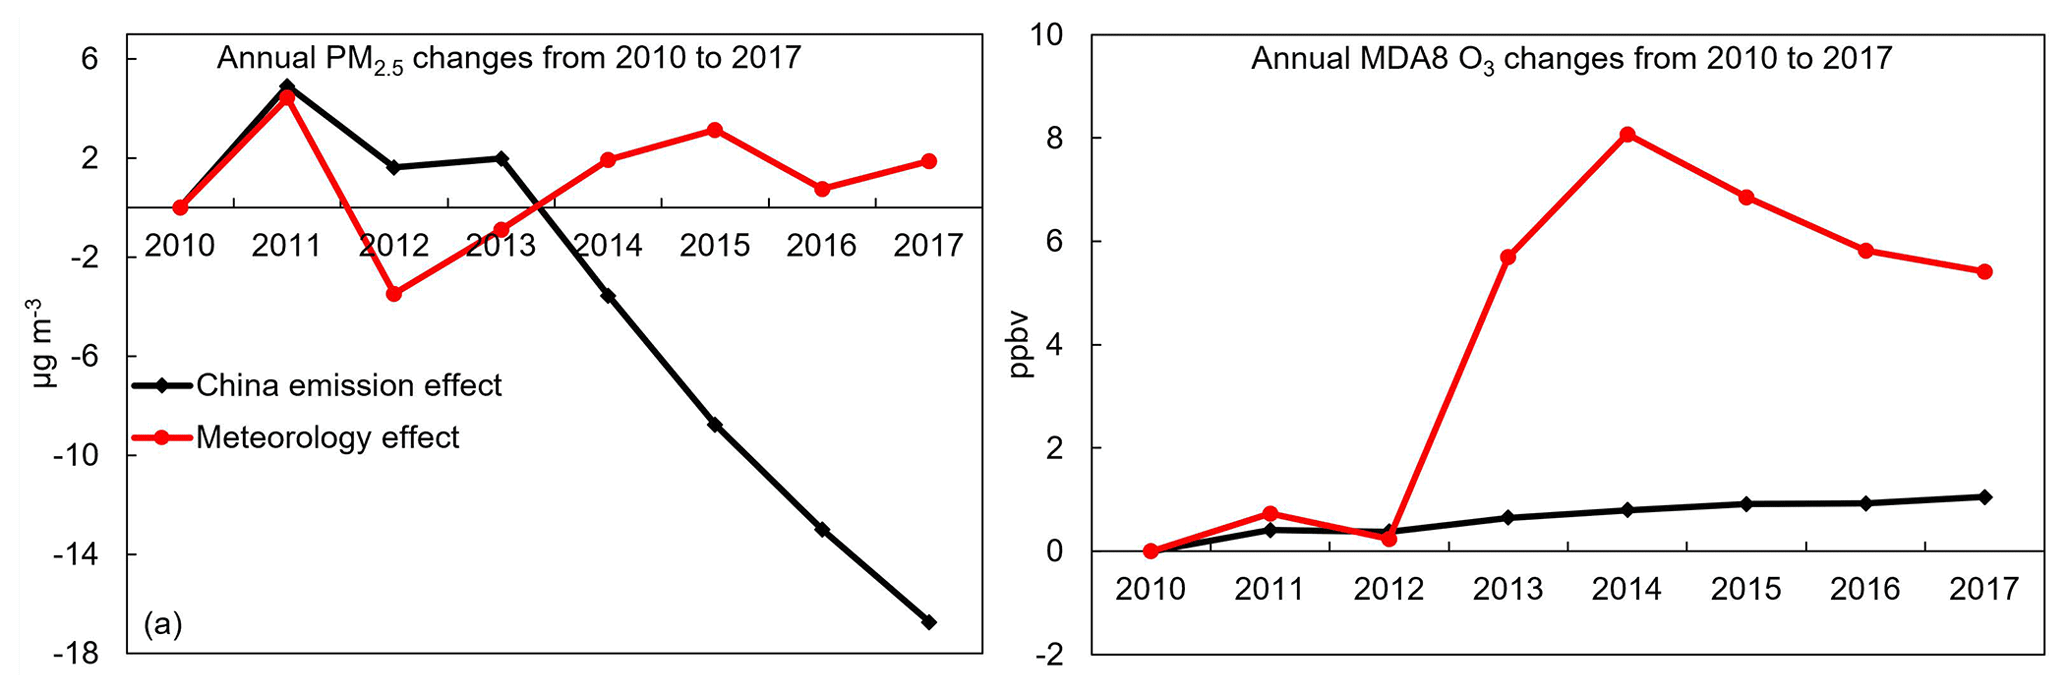
Figure 4The annual PM2.5 (a) and MDA8 O3 (b) changes in China due to emissions and meteorological changes from 2010 to 2017.
In contrast to the PM2.5 trends, the annual average pop-weighted MDA8 O3 has increased relative to 2010 (Fig. 1b), with a peak in 2014 (59.5 ppbv) and subsequent decreases to 2017 (57.1 ppbv). The area-weighted MDA8 O3 was comparable to or larger than the pop-weighted concentration due to the more uniform O3 distribution in China or even higher ozone events in western China from stratosphere–troposphere exchange (Wang et al., 2011; J. Li et al., 2019). For ozone, the emission changes from 2010 to 2013 exacerbate summer ozone pollution in China but alleviate ozone pollution in the other three regions (Fig. S8a). After 2013, the emission decreases in China exacerbate the ozone pollution for all the seasons, especially in winter. The spatial pattern of ozone trends mainly featured increases in the Beijing–Tianjin–Hebei and Yangtze River Delta regions and slightly decreases in the south (Figs. 3 and S5). The anthropogenic emission reductions in China that led to ozone increases (Fig. 4b) could partially be explained by the aerosol sink of hydroperoxyl radicals, which slowed in recent years due to PM2.5 decreases (K. Li et al., 2018). In addition, the effect of interannual meteorological conditions had a profound influence on the annual average MDA8 O3 concentrations. Ozone increased as much as 8.1 ppbv due to meteorology. The meteorology-induced ozone increases can be attributed to increasing temperature, which enhances the ozone production and biogenic NMVOCs (non-methane volatile organic compounds) emissions (Ding et al., 2019b; Liu and Wang, 2020), and increasing solar radiation (Wang et al., 2020; Ma et al., 2021).
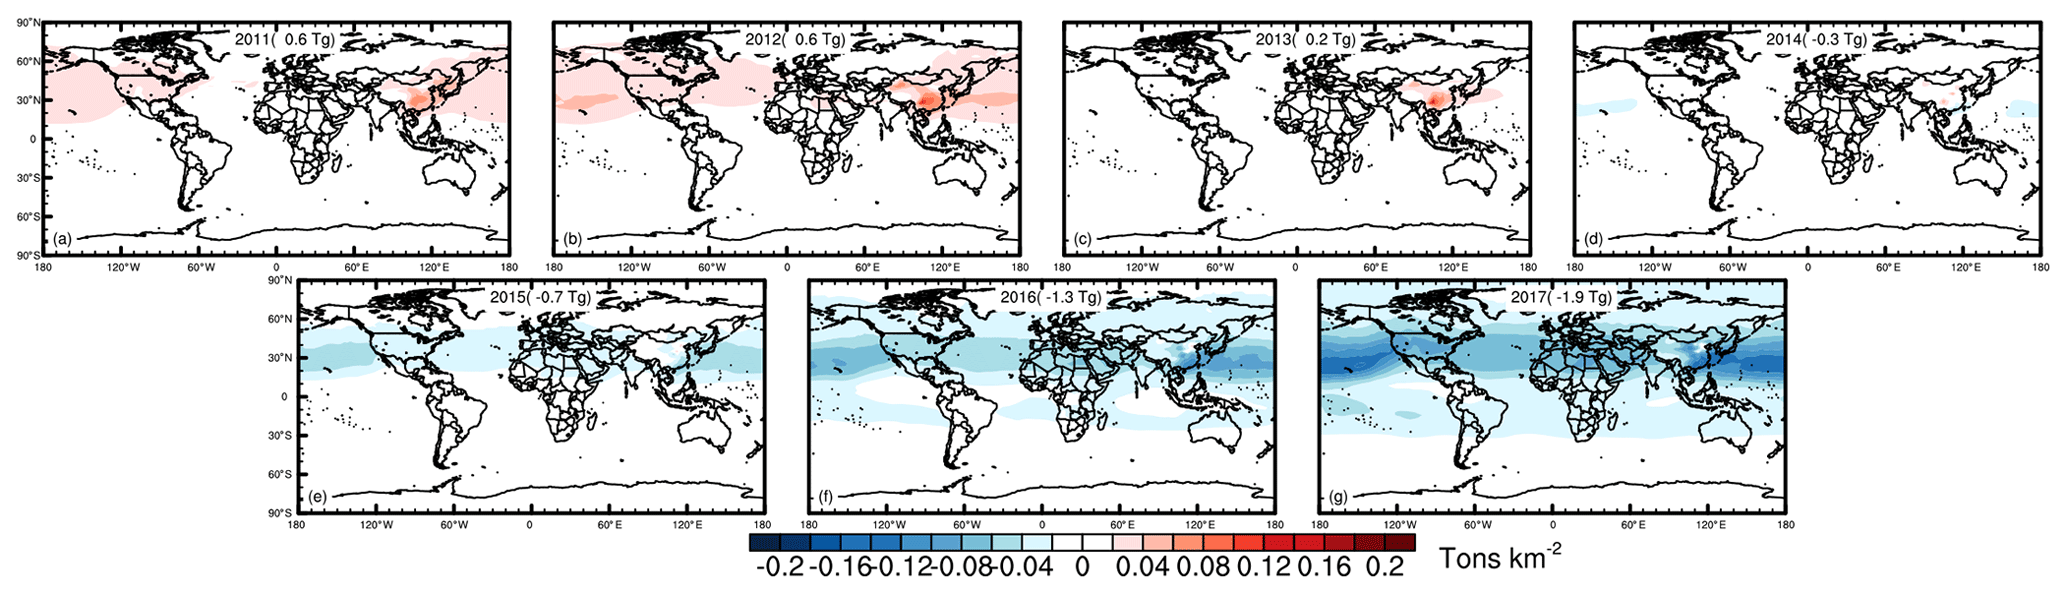
Figure 5Spatial distribution for global tropospheric ozone burden changes from 2010 to 2017 as a result of emission changes in China.
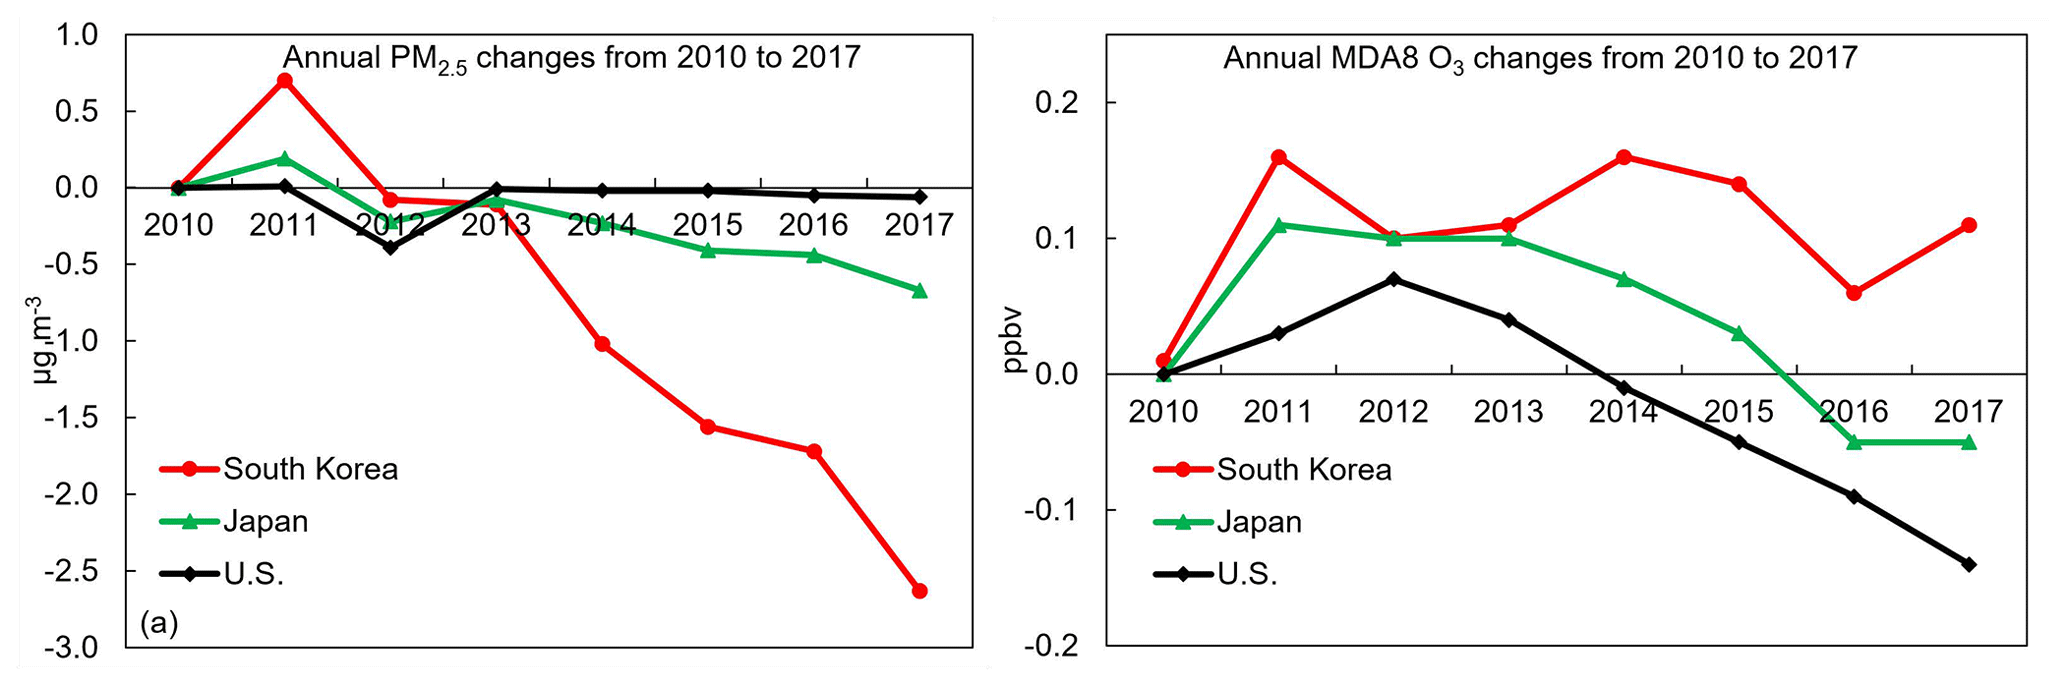
Figure 6The annual population-weighted PM2.5 (a) and MDA8 O3 (b) changes in South Korea, Japan, and US from 2010 to 2017 caused by Chinese emission changes.
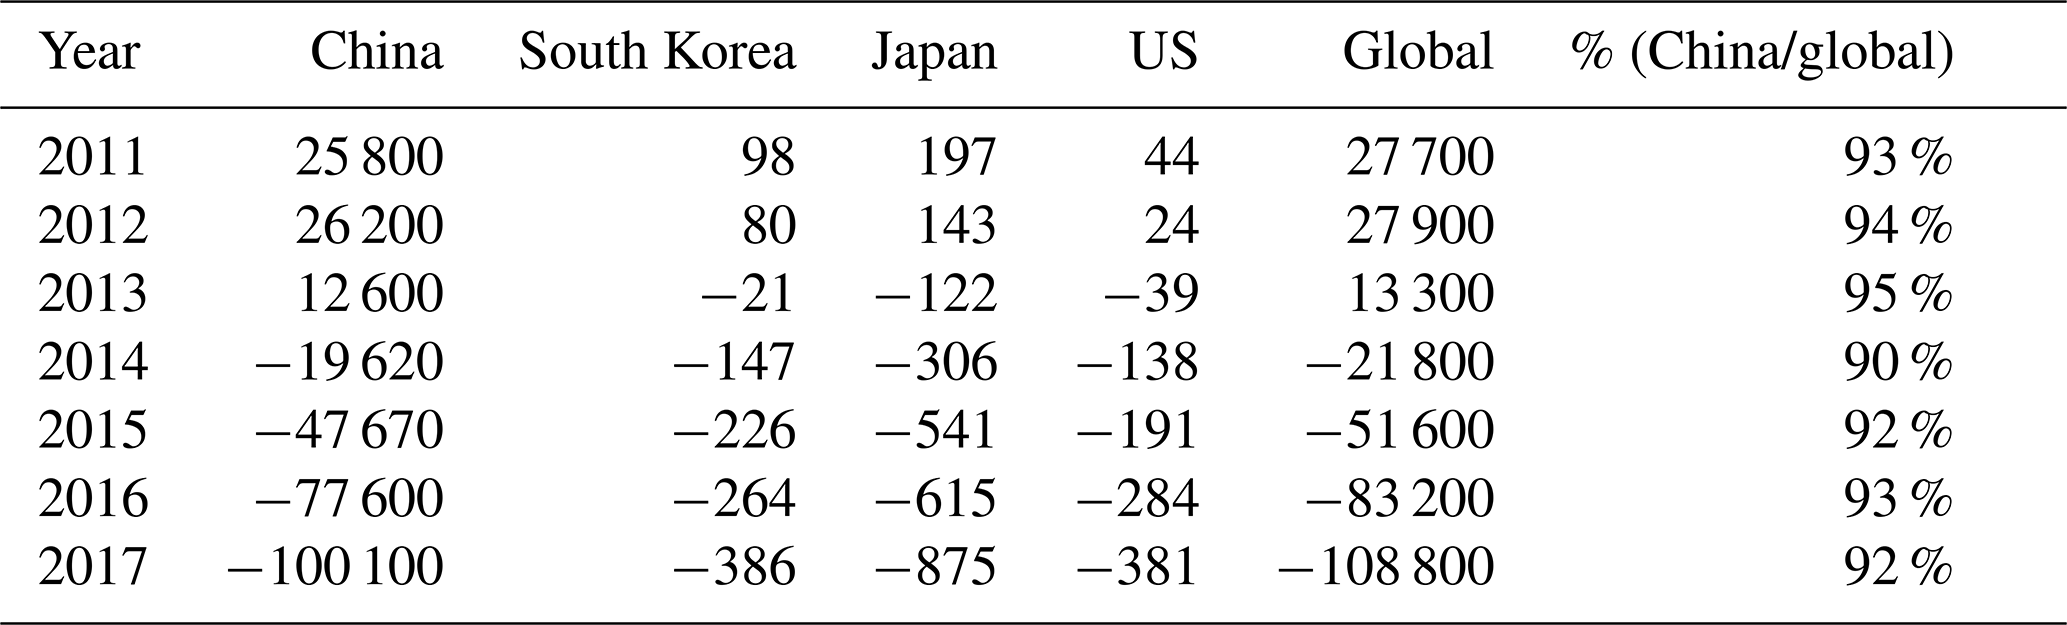
Table 4The changes for the PM2.5-mortality burden under the emission changes in China from 2010 to 2017 in China, as well as three other downwind regions – South Korea, Japan, and US. The mortality burden changes at global level are also included. Positive values mean emission change in China increases the PM2.5-related mortality burden in this region, and negative values mean decreases in the PM2.5-related mortality burden.
3.3 Emission changes in China on global air quality and health
3.3.1 Global and regional air quality
The simulated global tropospheric ozone burden (total ozone below the chemical tropopause of 150 ppbv) from 2010 to 2017 from the CEDS_MEIC simulation is 327.5 ± 5.2 Tg, which agrees well with the present tropospheric ozone burden estimated from previous ensemble models (ACCENT: 336 ± 27 Tg; ACCMIP: 337 ± 23 Tg; TOAR: 340 ± 34 Tg; and CMIP6: 348 ± 15 Tg; Griffiths et al., 2021). From Fig. 5, we find that the change in global tropospheric ozone burden from the emission changes in China ranges from 0.6 Tg (2011 and 2012) to −1.9 Tg (2017). The tropospheric ozone burden changes are not only seen in China but also in downwind regions, including throughout the Northern Hemisphere (Fig. 6).
Due to the prevailing western wind, air pollution in China could be easily transported to downwind regions, especially during springtime (Lin et al., 2012; Liang et al., 2018). From Fig. 6, we see Chinese emissions generate the largest impacts in South Korea, which experienced the largest pop-weighted PM2.5 changes from 2010 through 2017 (ranging from 0.7 µg m−3 in 2012 to −2.63 µg m−3 in 2017; Fig. 6a). The influences are largest in spring compared to in the other seasons for all the downwind regions (Fig. S7b–d). For ozone, we find that the emission changes in China have increased surface ozone in South Korea since 2010, and they are mainly form the increased export of ozone. Both Japan and US first experience increases in ambient pollution due to changes in Chinese emissions but subsequent decreases. However, the increases and the decreases are not temporally aligned and typically modest in magnitude. For the downwind regions, the season with peak ozone changes also varies (Fig. S8b–d).
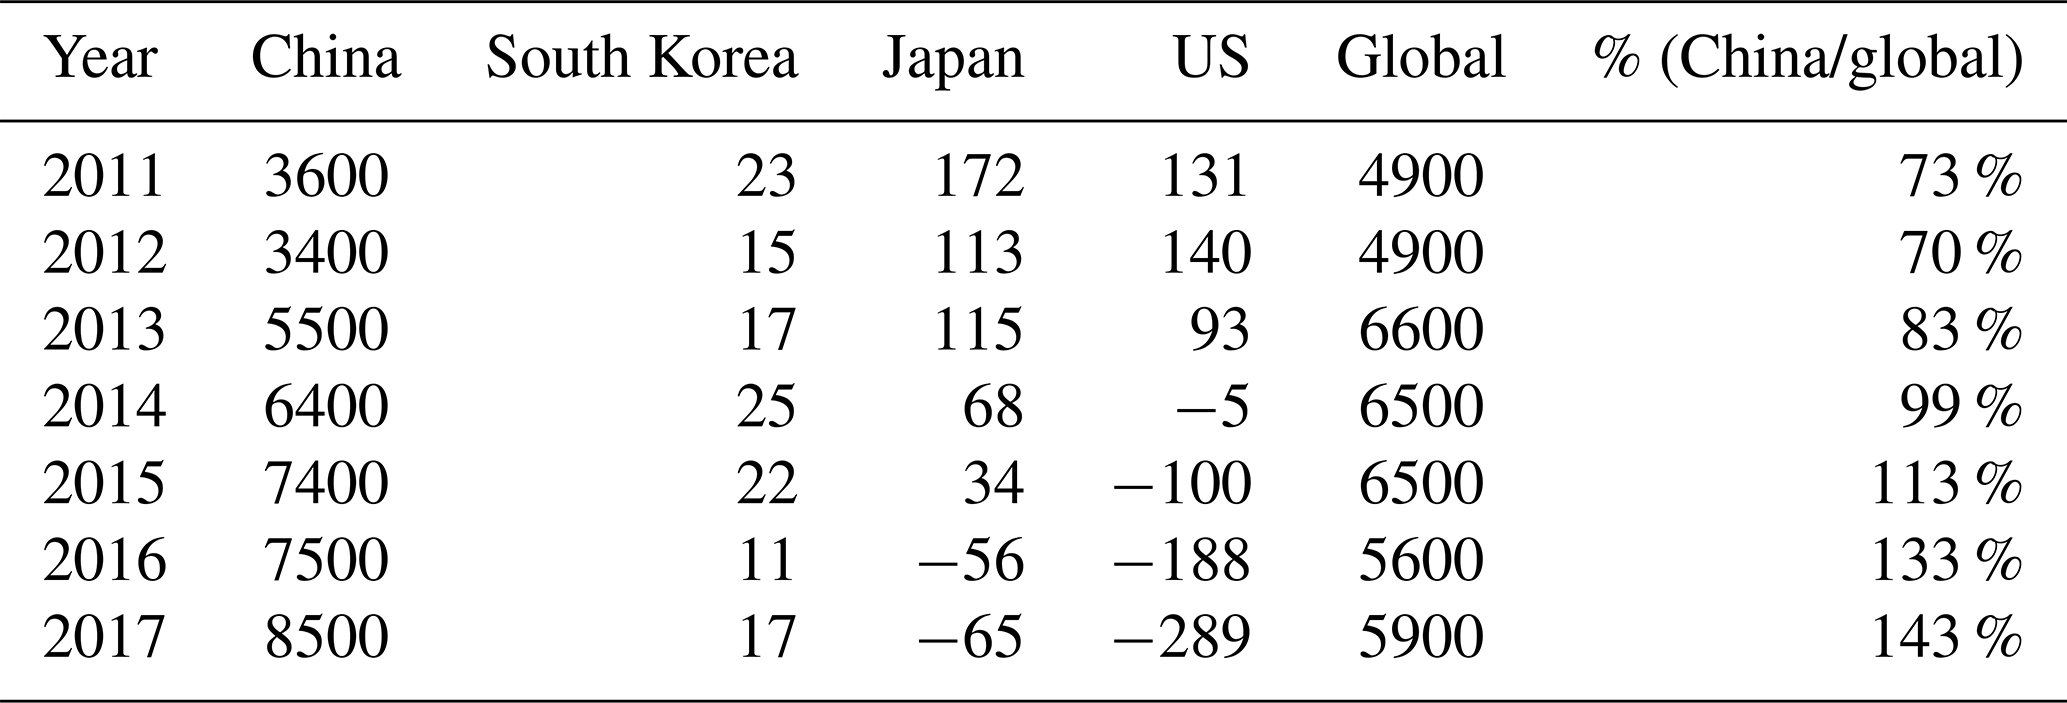
Table 5Like Table 4 but for ozone-related mortality burden changes.
3.3.2 Global and regional air-pollution-related mortality burden changes
In our simulations, the global ambient PM2.5-related mortality burden in 2010 is 4.08 million (95 % CI: 2.15–6.0 million), which is consistent with previous estimates using the same year and applying the same IER method (3.6 ± 1.0 million in 2010; Shindell et al., 2018). Relative to 2010, the emission changes in China lead to premature mortality increases of 27 700 deaths per year (95 % CI: 23 900–31 400 deaths per year) in 2011, with 93 % occurring in China (25 800, 95 % CI: 22 300–29 200 deaths per year; Table 4). We also find that most PM2.5 health burden changes from 2011 through 2017 due to Chinese emissions occur within China. This is due to the relatively linear relations between emission and concentration for PM2.5 and shorter lifetime of aerosols in the troposphere. Relative to the year 2010, emission changes in China lead to 108 800 (95 % CI: 92 800–124 800) fewer premature deaths globally by 2017, with 92 % (95 % CI: 85 900–114 300) occurring in China. Among the three downwind regions considered here, Japan has a smaller change for the annual pop-weighted PM2.5 but much larger changes in PM2.5-related mortality burden changes, ranging from 197 added premature deaths in 2011 and 875 avoided premature deaths in 2017 mainly caused by the much higher population in Japan than that in South Korea (https://countryeconomy.com/countries/compare/japan/south-korea?sc=XE23, last accessed: 3 September 2021). The emission changes in China have a comparable effect on the PM2.5-related premature mortality burden changes in South Korea and the US (Table 4).
For ozone, the global premature mortality burden in 2010 is 1.02 million (95 % CI: 0.73–1.28 million), which is consistent with prior estimates using other global CTMs, such as GEOS-Chem (1.04–1.23 million) and GISS (0.8–1.3 million), while applying the same relative risk value (Malley et al., 2017; Shindell et al., 2018). The emission changes in China increased the global ozone-related mortality by 4900 (95 % CI, 3700–5900) premature deaths per year in 2011 (Table 5), among which 73 % occurs in China (3600 premature deaths per year, 95 % CI: 2700–4300). For the three downwind regions considered here, South Korea, Japan, and US, the added O3-related premature mortality burdens in each country are 23, 172, and 131 premature deaths per year, respectively. By 2017, the anthropogenic emission reductions in China increased the ozone-related mortality burden within China by 8500 premature deaths per year and generated mixed impacts elsewhere. In the downwind regions, the O3-related premature mortality burden decreased in some locations (−65 and −289 premature deaths per year for Japan and US, respectively) and increased it in others (e.g., South Korea).
Dramatic changes in anthropogenic emissions within China have occurred since 2010, with most air pollutants, such as NOx and SO2, peaking around 2012 and 2013, and decreasing significantly thereafter. In this study, we use a global chemistry transport model (CAM-chem) to simulate the effects of emission changes in China on domestic and international air quality, as well as the subsequent air-pollution-related mortality burden from 2010 to 2017. An evaluation of model performance indicated that our model tends to overestimate the annual PM2.5 concentrations in China, with a normalized mean bias (NMB) of 37.2 % and normalized mean error (NME) of 52.0 %. The PM2.5 overestimation is likely caused by uncertainties in the bottom-up emission inventories (Shen et al., 2019; Q. Zhang et al., 2019) and missing pollution pathways for PM2.5 components (Tilmes et al., 2015, 2016; Liu et al., 2020). However, our biases are similar in scale to the biases reported in other high-resolution regional models (25 %–30 % in Shen et al., 2019; ∼ 20 % in Q. Zhang et al., 2019). We also evaluated model performance by applying two sets of emission inventories: a regional emission inventory (MEIC) and a global emission inventory (CEDS), which was extensively in the CMIP6 experiments. For surface PM2.5, we find that model performance with the CEDS inventory tends to predict lower bias metrics, which we attribute to the spatial allocation differences in the two inventories. For surface O3, the simulation using the MEIC inventory generates a lower NMB (13.7 %) and NME (21.9 %) than a comparable simulation using the CEDS inventory (NMB of 15.2 and NME of 36.6 %).
Our simulations suggest that the annual average, population-weighted (pop-weighted) PM2.5 concentration in China peaked in 2011 (94.1 µg m−3) and has decreased sharply thereafter. The annual average, pop-weighted PM2.5 concentration in 2017 was 17.6 % (−14.9 µg m−3) smaller than the concentration in 2010 (84.7 µg m−3). Though CAM-chem overestimates PM2.5 concentrations in China, the simulated decreasing trend for annual PM2.5 we report here (−15.9 µg m−3 for pop-weighted and 7.6 µg m−3 for area-weighted from 2013 to 2017) is comparable with prior studies using a higher-resolution regional air quality model (−19.8 µg m−3 estimated based on Q. Zhang et al., 2019, and −9.0 µg m−3 from Ding et al., 2019a). The emission changes in China from 2010 to 2013 increased the global PM2.5-related premature mortality burden and varied from 27 700 premature deaths per year (95 % confidence interval (CI): 23 900–31 400) in 2011 to 13 300 (95 % CI: 11 420–15 110) premature deaths per year in 2013, most of which occurred within China (∼ 93 %). The sharp emission decline following 2013 brought about significant health benefits by 2017. Relative to 2010, premature deaths declined by 108 800 (92 800–124 800) per year due to emission changes in China, most of which (92 %) were realized within China. Downwind regions, such as South Korea, Japan, and US, experienced similar PM2.5 trends due to Chinese emissions but far smaller in scale. Our simulations indicate that the transport of PM2.5 and its precursors changed the annual pop-weighted PM2.5 concentration in South Korea by 0.7 µg m−3 in 2011 and −2.6 µg m−3 in 2017. This led to 98 additional premature deaths in 2011 and 386 avoided premature deaths in 2017. Annual average pop-weighted PM2.5 concentrations in Japan were influenced less by Chinese emissions but generated much larger changes in PM2.5-associated premature mortality burden changes due to the age structure of the population and higher population (https://countryeconomy.com/countries/compare/japan/south-koreasc=XE23, last access: 3 September 2021). The influence of Chinese emission on US air quality led to 44 additional premature deaths in 2011 and 381 avoided premature deaths in 2017. In contrast to the PM2.5 trends, Chinese emission changes increased the annual average maximum daily 8 h ozone concentration in China, which subsequently increased ozone-related premature deaths. These changes ranged from 3600 additional premature deaths per year in 2011 to 8500 additional premature deaths per year in 2017. Downwind regions, such as South Korea, Japan, and the US, also experienced health impacts (both benefits and disbenefits, depending on the location). In general, we conclude that the sharp emission reductions in China following 2013 created substantial air quality benefits and that resulted in human health improvements at the global scale.
Global anthropogenic emissions data from CEDS by the Joint Global Change Research Institute, Pacific Northwest National Lab, are available from https://doi.org/10.5194/gmd-11-369-2018 (Hoesly et al., 2018). MEIC emission inventory by Tsinghua University, China, is available from http://meicmodel.org/?page_id=560 (last access: 6 May 2021) (MEIC, 2021). Baseline health and population data are available from the World Health Organization and the United Nations, respectively. The CAM-chem model from the National Center for Atmospheric Research, USA, is available at http://www.cesm.ucar.edu/models/cesm1.2/ (last access: 4 May 2020) (CESM, 2020). Data from CESM (Community Earth System Model) modeling that support the findings of this study are available from the corresponding author upon request.
The supplement related to this article is available online at: https://doi.org/10.5194/acp-21-16051-2021-supplement.
YZ and DS originally designed the study, and YZ conducted all simulations, created all figures, and wrote the manuscript, with comments and edits from all authors. BZ and QZ contributed to develop the MEIC emission inventory. KS, LS, JFL, QZ, BZ, JX, and ZJ helped interpolate the results and evaluate the model.
The contact author has declared that neither they nor their co-authors have any competing interests.
Publisher's note: Copernicus Publications remains neutral with regard to jurisdictional claims in published maps and institutional affiliations.
Yuqiang Zhang and Drew Shindell acknowledge the support by NASA GISS grant 80NSSC19M0138. We gratefully acknowledge the CESM model which was developed and distributed by NCAR. We also appreciate the efforts from China Ministry of Ecology and Environment for maintaining the nationwide observation network and publishing hourly PM2.5 and O3 concentrations. We would like to thank the University of North Carolina at Chapel Hill and the Research Computing group for providing computational resources and support that have contributed to these research results.
This research has been supported by the Goddard Institute for Space Studies (grant no. 80NSSC19M0138).
This paper was edited by Andrea Pozzer and reviewed by two anonymous referees.
Anenberg, S. C., West, J. J., Yu, H., Chin, M., Schulz, M., Bergmann, D., Bey, I., Bian, H., Diehl, T., Fiore, A., Hess, P., Marmer, E., Montanaro, V., Park, R., Shindell, D., Takemura, T., and Dentener, F.: Impacts of intercontinental transport of anthropogenic fine particulate matter on human mortality, Air Qual. Atmos. Hlth., 7, 369–379, https://doi.org/10.1007/s11869-014-0248-9, 2014.
Brauer, M., Amann, M., Burnett, R. T., Cohen, A., Dentener, F., Ezzati, M., Henderson, S. B., Krzyzanowski, M., Martin, R. V, Van Dingenen, R., van Donkelaar, A., and Thurston, G. D.: Exposure assessment for estimation of the global burden of disease attributable to outdoor air pollution, Environ. Sci. Technol., 46, 652–60, https://doi.org/10.1021/es2025752, 2012.
Burnett, R. T., Arden Pope, C., Ezzati, M., Olives, C., Lim, S. S., Mehta, S., Shin, H. H., Singh, G., Hubbell, B., Brauer, M., Ross Anderson, H., Smith, K. R., Balmes, J. R., Bruce, N. G., Kan, H., Laden, F., Prüss-Ustün, A., Turner, M. C., Gapstur, S. M., Diver, W. R., and Cohen, A.: An integrated risk function for estimating the global burden of disease attributable to ambient fine particulate matter exposure, Environ. Health Persp., 122, 397–403, https://doi.org/10.1289/ehp.1307049, 2014.
CESM: CESM Models, available at: http://www.cesm.ucar.edu/models/cesm1.2/, last access: 4 May 2020.
Cooper, O. R., Langford, A. O., Parrish, D. D., and Fahey, D. W.: Challenges of a lowered U. S. ozone standard, Science, 348, 1096–1097, 2015.
Crippa, M., Janssens-Maenhout, G., Guizzardi, D., Van Dingenen, R., and Dentener, F.: Contribution and uncertainty of sectorial and regional emissions to regional and global PM2.5 health impacts, Atmos. Chem. Phys., 19, 5165–5186, https://doi.org/10.5194/acp-19-5165-2019, 2019.
Dang, R. and Liao, H.: Severe winter haze days in the Beijing–Tianjin–Hebei region from 1985 to 2017 and the roles of anthropogenic emissions and meteorology, Atmos. Chem. Phys., 19, 10801–10816, https://doi.org/10.5194/acp-19-10801-2019, 2019.
Ding, D., Xing, J., Wang, S., Liu, K., and Hao, J.: Estimated Contributions of Emissions Controls, Meteorological Factors, Population Growth, and Changes in Baseline Mortality to Reductions in Ambient PM2.5 and PM2.5-Related Mortality in China, 2013–2017, Environ. Health Persp., 127, 67009, https://doi.org/10.1289/EHP4157, 2019a.
Ding, D., Xing, J., Wang, S., Chang, X., and Hao, J.: Impacts of emissions and meteorological changes on China's ozone pollution in the warm seasons of 2013 and 2017, Front. Environ. Sci. En., 13, 1–9, https://doi.org/10.1007/s11783-019-1160-1, 2019b.
Ewing, S. A., Christensen, J. N., Brown, S. T., Vancuren, R. A., Cliff, S. S., and Depaolo, D. J.: Pb Isotopes as an Indicator of the Asian Contribution to Particulate Air Pollution in Urban California, Environ. Sci. Technol., 44, 8911–8916, https://doi.org/10.1021/es101450t, 2010.
Fry, M. M., Schwarzkopf, M. D., Adelman, Z., and West, J. J.: Air quality and radiative forcing impacts of anthropogenic volatile organic compound emissions from ten world regions, Atmos. Chem. Phys., 14, 523–535, https://doi.org/10.5194/acp-14-523-2014, 2014.
Griffiths, P. T., Murray, L. T., Zeng, G., Shin, Y. M., Abraham, N. L., Archibald, A. T., Deushi, M., Emmons, L. K., Galbally, I. E., Hassler, B., Horowitz, L. W., Keeble, J., Liu, J., Moeini, O., Naik, V., O'Connor, F. M., Oshima, N., Tarasick, D., Tilmes, S., Turnock, S. T., Wild, O., Young, P. J., and Zanis, P.: Tropospheric ozone in CMIP6 simulations, Atmos. Chem. Phys., 21, 4187–4218, https://doi.org/10.5194/acp-21-4187-2021, 2021.
Hand, J. L., Schichtel, B. A., Malm, W. C., and Frank, N. H.: Spatial and temporal trends in PM2.5 organic and elemental carbon across the United States, Adv. Meteorol., 2013, 367674, https://doi.org/10.1155/2013/367674, 2013.
Hand, J. L., Schichtel, B. A., Malm, W. C., Copeland, S., Molenar, J. V., Frank, N., and Pitchford, M.: Widespread reductions in haze across the United States from the early 1990s through 2011, Atmos. Environ., 94, 671–679, https://doi.org/10.1016/j.atmosenv.2014.05.062, 2014.
He, J. and Zhang, Y.: Improvement and further development in CESM/CAM5: gas-phase chemistry and inorganic aerosol treatments, Atmos. Chem. Phys., 14, 9171–9200, https://doi.org/10.5194/acp-14-9171-2014, 2014.
Heald, C. L., Henze, D. K., Horowitz, L. W., Feddema, J., Lamar- que, J.-F., Guenther, A., Hess, P. G., Vitt, F., Seinfeld, J. H., Goldstein, A. H., and Fung, I.: Predicted change in global secondary organic aerosol concentrations in response to future climate, emissions, and land use change, J. Geophys. Res.-Atmos., 113, D05211, https://doi.org/10.1029/2007JD009092, 2008.
Hoesly, R. M., Smith, S. J., Feng, L., Klimont, Z., Janssens-Maenhout, G., Pitkanen, T., Seibert, J. J., Vu, L., Andres, R. J., Bolt, R. M., Bond, T. C., Dawidowski, L., Kholod, N., Kurokawa, J.-I., Li, M., Liu, L., Lu, Z., Moura, M. C. P., O'Rourke, P. R., and Zhang, Q.: Historical (1750–2014) anthropogenic emissions of reactive gases and aerosols from the Community Emissions Data System (CEDS), Geosci. Model Dev., 11, 369–408, https://doi.org/10.5194/gmd-11-369-2018, 2018.
Huang, J., Pan, X., Guo, X., and Li, G.: Health impact of China's Air Pollution Prevention and Control Action Plan: an analysis of national air quality monitoring and mortality data, Lancet Planetary Health, 2, e313–e323, https://doi.org/10.1016/S2542-5196(18)30141-4, 2018.
Janssens-Maenhout, G., Crippa, M., Guizzardi, D., Dentener, F., Muntean, M., Pouliot, G., Keating, T., Zhang, Q., Kurokawa, J., Wankmüller, R., Denier van der Gon, H., Kuenen, J. J. P., Klimont, Z., Frost, G., Darras, S., Koffi, B., and Li, M.: HTAP_v2.2: a mosaic of regional and global emission grid maps for 2008 and 2010 to study hemispheric transport of air pollution, Atmos. Chem. Phys., 15, 11411–11432, https://doi.org/10.5194/acp-15-11411-2015, 2015.
Jerrett, M., Burnett, R. T., Pope, C. A., Ito, K., Thurston, G., Krewski, D., Shi, Y., Calle, E., and Thun, M.: Long-term ozone exposure and mortality, New Engl. J. Med., 360, 1085–1095, https://doi.org/10.1056/NEJMoa0803894, 2009.
Jin, X., Fiore, A. M., Civerolo, K., Bi, J., Liu, Y., Van Donkelaar, A., Martin, R. V., Al-Hamdan, M., Zhang, Y., Insaf, T. Z., Kioumourtzoglou, M. A., He, M. Z., and Kinney, P. L.: Comparison of multiple PM2.5 exposure products for estimating health benefits of emission controls over New York State, USA, Environ. Res. Lett., 14, 84023, https://doi.org/10.1088/1748-9326/ab2dcb, 2019.
Kanaya, Y., Yamaji, K., Miyakawa, T., Taketani, F., Zhu, C., Choi, Y., Komazaki, Y., Ikeda, K., Kondo, Y., and Klimont, Z.: Rapid reduction in black carbon emissions from China: evidence from 2009–2019 observations on Fukue Island, Japan, Atmos. Chem. Phys., 20, 6339–6356, https://doi.org/10.5194/acp-20-6339-2020, 2020.
Katsouyanni, K., Samet, J., Anderson, H. R., Atkinson, R., Le Tertre, A., Medina, S., Samoli, E., Touloumi, G., Burnett, R. T., Krewski, D., Ramsay, T., Dominici, F., Peng, R. D., Schwartz, J., and Zanobetti, A.: Air Pollution and Health: A European and North American Approach (APHENA), HEI Research Report 142, Health Effects Institute, Boston, MA, available at: https://www.healtheffects.org/system/files/APHENA142.pdf (last access: 27 October 2021), 2009.
Krewski, D., Jerrett, M., Burnett, R. T., Ma, R., Hughes, E., Shi, Y., Turner, M. C., Pope III, C. A., Thurston, G., Calle, E. E., and Thun, M. J.: Extended Follow-Up and Spatial Analysis of the American Cancer Society Study Linking Particulate Air Pollution and Mortality, HEI Research Report 140, Health Effects Institute, Boston, MA, 2009.
Lamarque, J.-F., Emmons, L. K., Hess, P. G., Kinnison, D. E., Tilmes, S., Vitt, F., Heald, C. L., Holland, E. A., Lauritzen, P. H., Neu, J., Orlando, J. J., Rasch, P. J., and Tyndall, G. K.: CAM-chem: description and evaluation of interactive atmospheric chemistry in the Community Earth System Model, Geosci. Model Dev., 5, 369–411, https://doi.org/10.5194/gmd-5-369-2012, 2012.
Li, J., Nagashima, T., Kong, L., Ge, B., Yamaji, K., Fu, J. S., Wang, X., Fan, Q., Itahashi, S., Lee, H.-J., Kim, C.-H., Lin, C.-Y., Zhang, M., Tao, Z., Kajino, M., Liao, H., Li, M., Woo, J.-H., Kurokawa, J., Wang, Z., Wu, Q., Akimoto, H., Carmichael, G. R., and Wang, Z.: Model evaluation and intercomparison of surface-level ozone and relevant species in East Asia in the context of MICS-Asia Phase III – Part 1: Overview, Atmos. Chem. Phys., 19, 12993–13015, https://doi.org/10.5194/acp-19-12993-2019, 2019.
Li, K., Jacob, D. J., Liao, H., Shen, L., Zhang, Q., and Bates, K. H.: Anthropogenic drivers of 2013–2017 trends in summer surface ozone in China, P. Natl. Acad. Sci. USA, 116, 422–427, https://doi.org/10.1073/pnas.1812168116, 2019.
Li, Y., Lin, C., Lau, A. K. H., Liao, C., Zhang, Y., Zeng, W., Li, C., Fung, J. C. H., and Tse, T. K. T.: Assessing Long-Term Trend of Particulate Matter Pollution in the Pearl River Delta Region Using Satellite Remote Sensing, Environ. Sci. Technol., 49, 11670–11678, https://doi.org/10.1021/acs.est.5b02776, 2015.
Li, Y., Henze, D., Jack, D., and Kinney, P.: The influence of air quality model resolution on health impact assessment for fine particulate matter and its components, Air Qual. Atmos. Hlth., 9, 51–68, https://doi.org/10.1007/s11869-015-0321-z, 2016.
Liang, C.-K., West, J. J., Silva, R. A., Bian, H., Chin, M., Davila, Y., Dentener, F. J., Emmons, L., Flemming, J., Folberth, G., Henze, D., Im, U., Jonson, J. E., Keating, T. J., Kucsera, T., Lenzen, A., Lin, M., Lund, M. T., Pan, X., Park, R. J., Pierce, R. B., Sekiya, T., Sudo, K., and Takemura, T.: HTAP2 multi-model estimates of premature human mortality due to intercontinental transport of air pollution and emission sectors, Atmos. Chem. Phys., 18, 10497–10520, https://doi.org/10.5194/acp-18-10497-2018, 2018.
Lin, C. Q., Liu, G., Lau, A. K. H., Li, Y., Li, C. C., Fung, J. C. H., and Lao, X. Q.: High-resolution satellite remote sensing of provincial PM2.5 trends in China from 2001 to 2015, Atmos. Environ., 180, 110–116, https://doi.org/10.1016/j.atmosenv.2018.02.045, 2018.
Lin, M., Fiore, A. M., Horowitz, L. W., Cooper, O. R., Naik, V., Holloway, J., Johnson, B. J., Middlebrook, A. M., Oltmans, S. J., Pollack, I. B., Ryerson, T. B., Warner, J. X., Wiedinmyer, C., Wilson, J., and Wyman, B.: Transport of Asian ozone pollution into surface air over the western United States in spring, J. Geophys. Res.-Atmos., 117, D00V07, https://doi.org/10.1029/2011JD016961, 2012.
Lin, M., Horowitz, L. W., Payton, R., Fiore, A. M., and Tonnesen, G.: US surface ozone trends and extremes from 1980 to 2014: quantifying the roles of rising Asian emissions, domestic controls, wildfires, and climate, Atmos. Chem. Phys., 17, 2943–2970, https://doi.org/10.5194/acp-17-2943-2017, 2017.
Liu, C., Chen, R., Sera, F., Vicedo-Cabrera, A. M., Guo, Y., Tong, S., Coelho, M. S. Z. S., Saldiva, P. H. N., Lavigne, E., Matus, P., Ortega, N. V., Garcia, S. O., Pascal, M., Stafoggia, M., Scortichini, M., Hashizume, M., Honda, Y., Hurtado-Díaz, M., Cruz, J., Nunes, B., Teixeira, J. P., Kim, H., Tobias, A., Íñiguez, C., Forsberg, B., Åström, C., Ragettli, M. S., Guo, Y. L., Chen, B. Y., Bell, M. L., Wright, C. Y., Scovronick, N., Garland, R. M., Milojevic, A., Kyselý, J., Urban, A., Orru, H., Indermitte, E., Jaakkola, J. J. K., Ryti, N. R. I., Katsouyanni, K., Analitis, A., Zanobetti, A., Schwartz, J., Chen, J., Wu, T., Cohen, A., Gasparrini, A., and Kan, H.: Ambient particulate air pollution and daily mortality in 652 cities, New Engl. J. Med., 381, 705–715, https://doi.org/10.1056/NEJMoa1817364, 2019.
Liu, F., Zhang, Q., Van Der A, R. J., Zheng, B., Tong, D., Yan, L., Zheng, Y., and He, K.: Recent reduction in NOx emissions over China: Synthesis of satellite observations and emission inventories, Environ. Res. Lett., 11, 114002, https://doi.org/10.1088/1748-9326/11/11/114002, 2016.
Liu, Y. and Wang, T.: Worsening urban ozone pollution in China from 2013 to 2017 – Part 1: The complex and varying roles of meteorology, Atmos. Chem. Phys., 20, 6305–6321, https://doi.org/10.5194/acp-20-6305-2020, 2020.
Liu, Y., Dong, X., Wang, M., Emmons, L. K., Liu, Y., Liang, Y., Li, X., and Shrivastava, M.: Analysis of secondary organic aerosol simulation bias in the Community Earth System Model (CESM2.1), Atmos. Chem. Phys., 21, 8003–8021, https://doi.org/10.5194/acp-21-8003-2021, 2021.
Lu, Q., Murphy, B. N., Qin, M., Adams, P. J., Zhao, Y., Pye, H. O. T., Efstathiou, C., Allen, C., and Robinson, A. L.: Simulation of organic aerosol formation during the CalNex study: updated mobile emissions and secondary organic aerosol parameterization for intermediate-volatility organic compounds, Atmos. Chem. Phys., 20, 4313–4332, https://doi.org/10.5194/acp-20-4313-2020, 2020.
Lu, X., Hong, J., Zhang, L., Cooper, O. R., Schultz, M. G., Xu, X., Wang, T., Gao, M., Zhao, Y., and Zhang, Y.: Severe Surface Ozone Pollution in China: A Global Perspective, Environ. Sci. Tech. Let., 5, 487–494, https://doi.org/10.1021/acs.estlett.8b00366, 2018.
Lu, X., Zhang, L., Wang, X., Gao, M., Li, K., Zhang, Y., Yue, X., and Zhang, Y.: Rapid Increases in Warm-Season Surface Ozone and Resulting Health Impact in China Since 2013, Environ. Sci. Tech. Let., 7, 240–247, https://doi.org/10.1021/acs.estlett.0c00171, 2020.
Luo, H., Guan, Q., Pan, N., Wang, Q., Li, H., Lin, J., Tan, Z., and Shao, W.: Using composite fingerprints to quantify the potential dust source contributions in northwest China, Sci. Total Environ., 742, 140560, https://doi.org/10.1016/j.scitotenv.2020.140560, 2020.
Ma, X., Huang, J., Zhao, T., Liu, C., Zhao, K., Xing, J., and Xiao, W.: Rapid increase in summer surface ozone over the North China Plain during 2013–2019: a side effect of particulate matter reduction control?, Atmos. Chem. Phys., 21, 1–16, https://doi.org/10.5194/acp-21-1-2021, 2021.
Malley, C. S., Henze, D. K., Kuylenstierna, J. C. I., Vallack, H. W., Davila, Y., Anenberg, S. C., Turner, M. C., and Ashmore, M. R.: Updated global estimates of respiratory mortality in adults ≥ 30 years of age attributable to long-term ozone exposure, Environ. Health Perspect., 125, 087021, https://doi.org/10.1289/EHP1390, 2017.
McDuffie, E. E., Smith, S. J., O'Rourke, P., Tibrewal, K., Venkataraman, C., Marais, E. A., Zheng, B., Crippa, M., Brauer, M., and Martin, R. V.: A global anthropogenic emission inventory of atmospheric pollutants from sector- and fuel-specific sources (1970–2017): an application of the Community Emissions Data System (CEDS), Earth Syst. Sci. Data, 12, 3413–3442, https://doi.org/10.5194/essd-12-3413-2020, 2020.
MEIC: http://meicmodel.org/?page_id=560, last access: 6 May 2021.
Meng, L., Yang, X., Zhao, T., He, Q., Lu, H., Mamtimin, A., Huo, W., Yang, F., and Liu, C.: Modeling study on three-dimensional distribution of dust aerosols during a dust storm over the Tarim Basin, Northwest China, Atmos. Res., 218, 285–295, https://doi.org/10.1016/j.atmosres.2018.12.006, 2019.
Metzger, S., Dentener, F., Pandis, S., and Lelieveld, J.: Gas/aerosol partitioning: 1. A computationally efficient model, J. Geophys. Res., 107, 4312, https://doi.org/10.1029/2001JD001102, 2002.
Nault, B. A., Jo, D. S., McDonald, B. C., Campuzano-Jost, P., Day, D. A., Hu, W., Schroder, J. C., Allan, J., Blake, D. R., Canagaratna, M. R., Coe, H., Coggon, M. M., DeCarlo, P. F., Diskin, G. S., Dunmore, R., Flocke, F., Fried, A., Gilman, J. B., Gkatzelis, G., Hamilton, J. F., Hanisco, T. F., Hayes, P. L., Henze, D. K., Hodzic, A., Hopkins, J., Hu, M., Huey, L. G., Jobson, B. T., Kuster, W. C., Lewis, A., Li, M., Liao, J., Nawaz, M. O., Pollack, I. B., Peischl, J., Rappenglück, B., Reeves, C. E., Richter, D., Roberts, J. M., Ryerson, T. B., Shao, M., Sommers, J. M., Walega, J., Warneke, C., Weibring, P., Wolfe, G. M., Young, D. E., Yuan, B., Zhang, Q., de Gouw, J. A., and Jimenez, J. L.: Secondary organic aerosols from anthropogenic volatile organic compounds contribute substantially to air pollution mortality, Atmos. Chem. Phys., 21, 11201–11224, https://doi.org/10.5194/acp-21-11201-2021, 2021.
Parrish, D. D., Lamarque, J.-F., Naik, V., Horowitz, L., Shindell, D. T., Staehelin, J., Derwent, R., Cooper, O. R., Tanimoto, H., Volz-Thomas, A., Gilge, S., Scheel, H.-E., Steinbacher, M., and Frühlich, M.: Long-term changes in lower tropospheric baseline ozone concentrations: Comparing chemistry–climate models and observations at northern midlatitudes, J. Geophys. Res., 119, 5719–5736, https://doi.org/10.1002/2013JD021435, 2014.
Paulot, F., Paynter, D., Ginoux, P., Naik, V., and Horowitz, L. W.: Changes in the aerosol direct radiative forcing from 2001 to 2015: observational constraints and regional mechanisms, Atmos. Chem. Phys., 18, 13265–13281, https://doi.org/10.5194/acp-18-13265-2018, 2018.
Pennington, E. A., Seltzer, K. M., Murphy, B. N., Qin, M., Seinfeld, J. H., and Pye, H. O. T.: Modeling secondary organic aerosol formation from volatile chemical products, Atmos. Chem. Phys. Discuss. [preprint], https://doi.org/10.5194/acp-2021-547, in review, 2021.
Pfister, G. G., Parrish, D. D., Worden, H., Emmons, L. K., Edwards, D. P., Wiedinmyer, C., Diskin, G. S., Huey, G., Oltmans, S. J., Thouret, V., Weinheimer, A., and Wisthaler, A.: Characterizing summertime chemical boundary conditions for airmasses entering the US West Coast, Atmos. Chem. Phys., 11, 1769–1790, https://doi.org/10.5194/acp-11-1769-2011, 2011.
Pope III, C. A., Burnett, R. T., Thun, M. J., Calle, E. E., Krewski, D., Ito, K., and Thurston, G. D.: Lung cancer, cardiopulmonary motality, and long-term exposure to fine particulate air pollution, JAMA-J. Am. Med. Assoc., 287, 1132–1141, 2002.
Punger, E. M. and West, J. J.: The effect of grid resolution on estimates of the burden of ozone and fine particulate matter on premature mortality in the USA, Air Qual. Atmos. Health, 6, 563–573, https://doi.org/10.1007/s11869-013-0197-8, 2013.
Seltzer, K. M., Shindell, D. T., Kasibhatla, P., and Malley, C. S.: Magnitude, trends, and impacts of ambient long-term ozone exposure in the United States from 2000 to 2015, Atmos. Chem. Phys., 20, 1757–1775, https://doi.org/10.5194/acp-20-1757-2020, 2020.
Shen, G., Ru, M., Du, W. Zhu, X., Zhong, Q., Chen, Y., Shen, H., Yun, X., Meng, W., Liu, J., Cheng, h., Hu, J., Guan, D., and Tao, S.: Impacts of air pollutants from rural Chinese households under the rapid residential energy transition, Nat. Commun., 10, 3405, https://doi.org/10.1038/s41467-019-11453-w, 2019.
Shindell, D., Faluvegi, G., Seltzer, K., and Shindell, C.: Quantified, localized health benefits of accelerated carbon dioxide emissions reductions, Nat. Clim. Change, 8, 1–5, https://doi.org/10.1038/s41558-018-0108-y, 2018.
Silva, R. A., West, J. J., Zhang, Y., Anenberg, S. C., Lamarque, J.-F., Shindell, D. T., Collins, W. J., Dalsoren, S., Faluvegi, G., Folberth, G., Horowitz, L. W., Nagashima, T., Naik, V., Rumbold, S., Skeie, R., Sudo, K., Takemura, T., Bergmann, D., Cameron-Smith, P., Cionni, I., Doherty, R. M., Eyring, V., Josse, B., MacKenzie, I. A., Plummer, D., Righi, M., Stevenson, D. S., Strode, S., Szopa, S., and Zeng, G.: Global premature mortality due to anthropogenic outdoor air pollution and the contribution of past climate change, Environ. Res. Lett., 8, 034005, https://doi.org/10.1088/1748-9326/8/3/034005, 2013.
Silva, R. A., West, J. J., Lamarque, J.-F., Shindell, D. T., Collins, W. J., Dalsoren, S., Faluvegi, G., Folberth, G., Horowitz, L. W., Nagashima, T., Naik, V., Rumbold, S. T., Sudo, K., Takemura, T., Bergmann, D., Cameron-Smith, P., Cionni, I., Doherty, R. M., Eyring, V., Josse, B., MacKenzie, I. A., Plummer, D., Righi, M., Stevenson, D. S., Strode, S., Szopa, S., and Zengast, G.: The effect of future ambient air pollution on human premature mortality to 2100 using output from the ACCMIP model ensemble, Atmos. Chem. Phys., 16, 9847–9862, https://doi.org/10.5194/acp-16-9847-2016, 2016.
Song, C., He, J., Wu, L., Jin, T., Chen, X., Li, R., Ren, P., Zhang, L., and Mao, H.: Health burden attributable to ambient PM2.5 in China, Environ. Pollut., 223, 575–586, https://doi.org/10.1016/j.envpol.2017.01.060, 2017.
Stanaway, J. D., Afshin, A., Gakidou, E., Lim, S. S., Abate, D., Abate, K. H., Abbafati, C., Abbasi, N., Abbastabar, H., Abd-Allah, F., Abdela, J., Abdelalim, A., Abdollahpour, I., Abdulkader, R. S., Abebe, M., Abebe, Z., Abera, S. F., Abil, O. Z., Abraha, H. N., Abrham, A. R., Abu-Raddad, L. J., Abu-Rmeileh, N. M. E., Accrombessi, M. M. K., Acharya, D., Acharya, P., Adamu, A. A., Adane, A. A., Adebayo, O. M., Adedoyin, R. A., Adekanmbi, V., Ademi, Z., Adetokunboh, O. O., Adib, M. G., Admasie, A., Adsuar, J. C., Afanvi, K. A., Afarideh, M., Agarwal, G., Aggarwal, A., Aghayan, S. A., Agrawal, A., Agrawal, S., Ahmadi, A., Ahmadi, M., Ahmadieh, H., Ahmed, M. B., Aichour, A. N., Aichour, I., Aichour, M. T. E., Akbari, M. E., Akinyemiju, T., Akseer, N., Al-Aly, Z., Al-Eyadhy, A., Al-Mekhlafi, H. M., Alahdab, F., Alam, K., Alam, S., Alam, T., Alashi, A., Alavian, S. M., Alene, K. A., Ali, K., Ali, S. M., Alijanzadeh, M., Alizadeh-Navaei, R., Aljunid, S. M., Alkerwi, A., Alla, F., Alsharif, U., Altirkawi, K., Alvis-Guzman, N., Amare, A. T., Ammar, W., Anber, N. H., Anderson, J. A., Andrei, C. L., Androudi, S., Animut, M. D., Anjomshoa, M., Ansha, M. G., Antó, J. M., Antonio, C. A. T., Anwari, P., Appiah, L. T., Appiah, S. C. Y., Arabloo, J., Aremu, O., Ärnlöv, J., Artaman, A., Aryal, K. K., Asayesh, H., Ataro, Z., Ausloos, M., Avokpaho, E. F. G. A., Awasthi, A., Quintanilla, B. P. A., Ayer, R., Ayuk, T. B., and Ayuk, T. B.: Global, regional, and national comparative risk assessment of 84 behavioural, environmental and occupational, and metabolic risks or clusters of risks for 195 countries and territories, 1990–2017: A systematic analysis for the Global Burden of Disease Study 2017, Lancet, 1923–1994, https://doi.org/10.1016/S0140-6736(18)32225-6, 2018.
Tan, Z., Hofzumahaus, A., Lu, K., Brown, S. S., Holland, F., Huey, L. G., Kiendler-Scharr, A., Li, X., Liu, X., Ma, N., Min, K. E., Rohrer, F., Shao, M., Wahner, A., Wang, Y., Wiedensohler, A., Wu, Y., Wu, Z., Zeng, L., Zhang, Y., and Fuchs, H.: No Evidence for a Significant Impact of Heterogeneous Chemistry on Radical Concentrations in the North China Plain in Summer 2014, Environ. Sci. Technol., 54, 5973–5979, https://doi.org/10.1021/acs.est.0c00525, 2020.
Tie, X., Brasseur, G., Emmons, L., Horowitz, L., and Kinnison, D.: Effects of aerosols on tropospheric oxidants: A global model study, J. Geophys. Res., 106, 22931–22964, 2001.
Tie, X., Madronich, S., Walters, S., Edwards, D. P., Ginoux, P., Mahowald, N., Zhang, R., Lou, C., and Brasseur, G.: Assessment of the global impact of aerosols on tropospheric oxidants, J. Geophys. Res., 110, D03204, https://doi.org/10.1029/2004JD005359, 2005.
Tilmes, S.: GEOS5 Global Atmosphere Forcing Data, Research Data Archive at the National Center for Atmospheric Research, Computational and Information Systems Laboratory, Boulder, CO, available at: http://rda.ucar.edu/datasets/ds313.0/ (last access: 20 April 2020), 2016.
Tilmes, S., Lamarque, J.-F., Emmons, L. K., Kinnison, D. E., Ma, P.-L., Liu, X., Ghan, S., Bardeen, C., Arnold, S., Deeter, M., Vitt, F., Ryerson, T., Elkins, J. W., Moore, F., Spackman, J. R., and Val Martin, M.: Description and evaluation of tropospheric chemistry and aerosols in the Community Earth System Model (CESM1.2), Geosci. Model Dev., 8, 1395–1426, https://doi.org/10.5194/gmd-8-1395-2015, 2015.
Tilmes, S., Lamarque, J.-F., Emmons, L. K., Kinnison, D. E., Marsh, D., Garcia, R. R., Smith, A. K., Neely, R. R., Conley, A., Vitt, F., Val Martin, M., Tanimoto, H., Simpson, I., Blake, D. R., and Blake, N.: Representation of the Community Earth System Model (CESM1) CAM4-chem within the Chemistry-Climate Model Initiative (CCMI), Geosci. Model Dev., 9, 1853–1890, https://doi.org/10.5194/gmd-9-1853-2016, 2016.
Tilmes, S., Hodzic, A., Emmons, L. K., Mills, M. J., Gettelman, A., Kinnison, D. E., Park, M., Lamarque, J. F., Vitt, F., Shrivastava, M., Campuzano-Jost, P., Jimenez, J. L., and Liu, X.: Climate Forcing and Trends of Organic Aerosols in the Community Earth System Model (CESM2), J. Adv. Model. Earth Sy., 11, 4323–4351, https://doi.org/10.1029/2019ms001827, 2019.
Turner, M. C., Jerrett, M., Pope, C. A., Krewski, D., Gapstur, S. M., Diver, W. R., Beckerman, B. S., Marshall, J. D., Su, J., Crouse, D. L., and Burnett, R. T.: Long-Term Ozone Exposure and Mortality in a Large Prospective Study, Am. J. Resp. Crit. Care, 193, 1134–1142, https://doi.org/10.1164/rccm.201508-1633OC, 2016.
UN Environment: A Review of 20 Years' Air Pollution Control in Beijing, United Nations Environment Programme, Nairobi, Kenya, 2019.
Wang, W., Parrish, D. D., Li, X., Shao, M., Liu, Y., Mo, Z., Lu, S., Hu, M., Fang, X., Wu, Y., Zeng, L., and Zhang, Y.: Exploring the drivers of the increased ozone production in Beijing in summertime during 2005–2016, Atmos. Chem. Phys., 20, 15617–15633, https://doi.org/10.5194/acp-20-15617-2020, 2020.
Wang, Y., Zhang, Y., Hao, J., and Luo, M.: Seasonal and spatial variability of surface ozone over China: contributions from background and domestic pollution, Atmos. Chem. Phys., 11, 3511–3525, https://doi.org/10.5194/acp-11-3511-2011, 2011.
West, J. J., Naik, V., Horowitz, L. W., and Fiore, A. M.: Effect of regional precursor emission controls on long-range ozone transport – Part 1: Short-term changes in ozone air quality, Atmos. Chem. Phys., 9, 6077–6093, https://doi.org/10.5194/acp-9-6077-2009, 2009a.
West, J. J., Naik, V., Horowitz, L. W., and Fiore, A. M.: Effect of regional precursor emission controls on long-range ozone transport – Part 2: Steady-state changes in ozone air quality and impacts on human mortality, Atmos. Chem. Phys., 9, 6095–6107, https://doi.org/10.5194/acp-9-6095-2009, 2009b.
West, J. J., Smith, S. J., Silva, R. A., Naik, V., Zhang, Y., Adelman, Z., Fry, M. M., Anenberg, S., Horowitz, L. W., and Lamarque, J. F.: Co-benefits of mitigating global greenhouse gas emissions for future air quality and human health, Nat. Clim. Change, 3, 885–889, https://doi.org/10.1038/nclimate2009, 2013.
Wu, W. and Zhang, Y.: Effects of particulate matter (PM2.5) and associated acidity on ecosystem functioning: response of leaf litter breakdown, Environ. Sci. Pollut. R., 25, 30720–30727, 2018.
Young, P. J., Archibald, A. T., Bowman, K. W., Lamarque, J.-F., Naik, V., Stevenson, D. S., Tilmes, S., Voulgarakis, A., Wild, O., Bergmann, D., Cameron-Smith, P., Cionni, I., Collins, W. J., Dalsøren, S. B., Doherty, R. M., Eyring, V., Faluvegi, G., Horowitz, L. W., Josse, B., Lee, Y. H., MacKenzie, I. A., Nagashima, T., Plummer, D. A., Righi, M., Rumbold, S. T., Skeie, R. B., Shindell, D. T., Strode, S. A., Sudo, K., Szopa, S., and Zeng, G.: Pre-industrial to end 21st century projections of tropospheric ozone from the Atmospheric Chemistry and Climate Model Intercomparison Project (ACCMIP), Atmos. Chem. Phys., 13, 2063–2090, https://doi.org/10.5194/acp-13-2063-2013, 2013.
Zhai, S., Jacob, D. J., Wang, X., Shen, L., Li, K., Zhang, Y., Gui, K., Zhao, T., and Liao, H.: Fine particulate matter (PM2.5) trends in China, 2013–2018: separating contributions from anthropogenic emissions and meteorology, Atmos. Chem. Phys., 19, 11031–11041, https://doi.org/10.5194/acp-19-11031-2019, 2019.
Zhang, L., Jacob, D. J., Boersma, K. F., Jaffe, D. A., Olson, J. R., Bowman, K. W., Worden, J. R., Thompson, A. M., Avery, M. A., Cohen, R. C., Dibb, J. E., Flock, F. M., Fuelberg, H. E., Huey, L. G., McMillan, W. W., Singh, H. B., and Weinheimer, A. J.: Transpacific transport of ozone pollution and the effect of recent Asian emission increases on air quality in North America: an integrated analysis using satellite, aircraft, ozonesonde, and surface observations, Atmos. Chem. Phys., 8, 6117–6136, https://doi.org/10.5194/acp-8-6117-2008, 2008.
Zhang, L., Jacob, D. J., Yue, X., Downey, N. V., Wood, D. A., and Blewitt, D.: Sources contributing to background surface ozone in the US Intermountain West, Atmos. Chem. Phys., 14, 5295–5309, https://doi.org/10.5194/acp-14-5295-2014, 2014.
Zhang, Q., Zheng, Y., Tong, D., Shao, M., Wang, S., Zhang, Y., Xu, X., Wang, J., He, H., Liu, W., Ding, Y., Lei, Y., Li, J., Wang, Z., Zhang, X., Wang, Y., Cheng, J., Liu, Y., Shi, Q., Yan, L., Geng, G., Hong, C., Li, M., Liu, F., Zheng, B., Cao, J., Ding, A., Gao, J., Fu, Q., Huo, J., Liu, B., Liu, Z., Yang, F., He, K., and Hao, J.: Drivers of improved PM2.5 air quality in China from 2013 to 2017, P. Natl. Acad. Sci. USA, 116, 24463–24469, https://doi.org/10.1073/pnas.1907956116, 2019.
Zhang, Y., Cooper, O. R., Gaudel, A., Thompson, A. M., Nédélec, P., Ogino, S. Y., and West, J. J.: Tropospheric ozone change from 1980 to 2010 dominated by equatorward redistribution of emissions, Nat. Geosci., 9, 875–879, https://doi.org/10.1038/ngeo2827, 2016.
Zhao, J., Ma, X., Wu, S., and Sha, T.: Dust emission and transport in Northwest China: WRF-Chem simulation and comparisons with multi-sensor observations, Atmos. Res., 241, 104978, https://doi.org/10.1016/j.atmosres.2020.104978, 2020.
Zhao, Y., Hennigan, C. J., May, A. A., Tkacik, D. S., De Gouw, J. A., Gilman, J. B., Kuster, W. C., Borbon, A., and Robinson, A. L.: Intermediate-volatility organic compounds: A large source of secondary organic aerosol, Environ. Sci. Technol., 48, 13743–13750, https://doi.org/10.1021/es5035188, 2014.
Zheng, B., Chevallier, F., Ciais, P., Yin, Y., Deeter, M. N., Worden, H. M., Wang, Y., Zhang, Q., and He, K.: Rapid decline in carbon monoxide emissions and export from East Asia between years 2005 and 2016, Environ. Res. Lett., 13, 044007, https://doi.org/10.1088/1748-9326/aab2b3, 2018a.
Zheng, B., Tong, D., Li, M., Liu, F., Hong, C., Geng, G., Li, H., Li, X., Peng, L., Qi, J., Yan, L., Zhang, Y., Zhao, H., Zheng, Y., He, K., and Zhang, Q.: Trends in China's anthropogenic emissions since 2010 as the consequence of clean air actions, Atmos. Chem. Phys., 18, 14095–14111, https://doi.org/10.5194/acp-18-14095-2018, 2018b.
Zheng, Y., Xue, T., Zhang, Q., Geng, G., Tong, D., Li, X., and He, K.: Air quality improvements and health benefits from China's clean air action since 2013, Environ. Res. Lett., 12, 114020, https://doi.org/10.1088/1748-9326/aa8a32, 2017.