the Creative Commons Attribution 4.0 License.
the Creative Commons Attribution 4.0 License.
 | 27 Oct 2021
Large eddy simulation of boundary-layer turbulence over the heterogeneous surface in the source region of the Yellow River
Yunshuai Zhang
Qian Huang
Yaoming Ma
Jiali Luo
Chan Wang
Zhaoguo Li
Yan Chou
Lake breezes are proved by downdrafts and the divergence flows of zonal wind in the source region of the Yellow River (SRYR) in the daytime based on ERA-Interim reanalysis data. In order to depict the effect of the circulations induced by surface anomaly heating (patches) on the boundary-layer turbulence, the UK Met Office Large Eddy Model was used to produce a set of 1D strip-like surface heat flux distributions based on observations, which were obtained by a field campaign in the Ngoring Lake basin in the summer of 2012. The simulations show that for the cases without background wind, patch-induced circulations (SCs) promote the growth of convective boundary layer (CBL), enhance the turbulent kinetic energy (TKE), and then modify the spatial distribution of TKE. Based on phase-averaged analysis, which separates the attribution from the SCs and the background turbulence, the SCs contribute no more than 10 % to the vertical turbulent intensity, but their contributions to the heat flux can be up to 80 %. The thermal internal boundary layer (TIBL) reduces the wind speed and forms the stable stratification, which produces the obvious change of turbulent momentum flux and heat flux over the heterogeneous surfaces. The increased downdrafts, which mainly occur over the lake patches, carry more warm, dry air down from the free atmosphere. The background wind inhibits the SCs and the development of the CBL; it also weakens the patch-induced turbulent intensity, heat flux, and convective intensity.
- Article
(11809 KB) - Full-text XML
-
Supplement
(1287 KB) - BibTeX
- EndNote


Turbulence in the planetary boundary layer (PBL), which is derived from surface heating and surface fraction, plays an important role in the exchange of heat, momentum, moisture, and chemical constituents between the surface and free atmosphere (Zhang et al., 2018). Previous studies on the turbulence and turbulent exchange over homogeneous surfaces based on Monin–Obukhov similarity theory were conducted before the 1990s (Sommeria and LeMone, 1978; Moeng, 1984). Then turbulence over heterogeneous surfaces was investigated through field campaigns (Wang et al., 2016; Zhao et al., 2018) and numerical simulations (Shao et al., 2013; Liu et al., 2011) in the past few decades, which help us better understand the interactions between the surface and atmosphere. Thermal surface heterogeneity is a typical issue and leads to the formation of local/secondary circulations. Sea and lake breezes are a well-known example of flows that are generated by heterogeneous surface heating between the land and water (Crosman and Horel, 2012). Observations have also revealed the imbalance in the surface energy budget over heterogeneous surfaces (Foken et al., 2010; Xu et al., 2016). The most widely used eddy covariance (EC) system for a single site has been shown to underestimate the turbulent flux due to the large-eddy transport or secondary circulations not being captured (Foken et al., 2010; Xu et al., 2016). The simulation studies conducted by Zhou et al. (2018) and De Roo and Mauder (2018) showed that the flux induced by mesoscale or secondary circulations is the main reason for the energy imbalance. Moreover, the PBL parameterization schemes in the weather/climate model over a heterogeneous surface have been continuously improved until now (Shao et al., 2013). Different surface patterns such as mosaic (Avissar and Schmidt, 1998), chessboard (Liu et al., 2011; Shen et al., 2016), patchy-like (Zhou et al., 2018), and strip-like (Li et al., 2011; Wang et al., 2011) patterns have been utilized to simulate thermodynamic surface heterogeneity. These studies confirmed that the secondary circulation induced by the surface heterogeneity influences the PBL's properties and turbulent characteristics. In addition, several studies have examined the effects of surface heterogeneity on different levels of background wind (Shen and Leclerc, 1995; Liu et al., 2020) and the direction relative to the orientation of the heterogeneity (Wang et al., 2011; Kang and Lenschow, 2014), as well as the spatial and temporal variations of the wind fields (Liu et al., 2018). However, the issues related to the effects of the surface heterogeneity in special areas still need to be explored.
The dynamic and thermodynamic influences of the Tibetan Plateau (TP) on the regional and global weather and climate systems are closely related to its PBL, and turbulence plays a significant role in the mass and energy exchange between the TP and the atmosphere (Chen et al., 2013, 2016). Different landscapes make up the heterogeneous land surface over the TP. Known as the Asian water tower, lakes are widely and densely distributed over the TP, which affects the overlying energy and mass transport through the lake–air turbulent heat flux. Biermann et al. (2014) and Wang et al. (2015) discovered that the turbulent flux of Lake Nam co, which is surrounded by wet grasslands, is actually very considerable but was often underestimated by a hydrodynamic multilayer model from Foken (1984). The source region of the Yellow River (SRYR) is located in the northeastern part of the TP and is known as the “water tower” of China because it contains 48 lakes. The Ngoring and Gyaring (sister) lakes are two major lakes, and Ngoring Lake is the largest in the SRYR (Li et al., 2015; Wen et al., 2015). In addition to the lakes, the forests, alpine meadow, wetlands, rivers, and glaciers comprise the diverse underlying surfaces in the SRYR, with grassland accounting for about 80 % of the area (Mudassar et al., 2018). Consequently, the SRYR is an ideal region for studying the turbulence over a heterogeneous land surface.
Observational studies have revealed that water vapor, heat, and energy exchange occur over alpine meadows/wetlands (Zheng et al., 2015; Jia et al., 2017) and lakes (Li et al., 2015; Wen et al., 2016), and models have been used to simulated the effects of the lakes on the cool and moist regional climate (Wen et al., 2015). However, the features of the boundary-layer turbulence over the heterogeneous underlying surfaces and the effects of thermodynamic surface heterogeneity on the turbulent flux in the SRYR remain unclear. Over the last few decades, the lakes have shrunk, and the grasslands have degraded in the SRYR due to climate change and the excessive utilization of water resources (Brierley et al., 2016; Mudassar et al., 2018). It is essential to investigate the variation in the structure of boundary-layer and turbulent heat flux with changes in the surface's thermal properties and the background wind.
High-resolution field measurements are extremely rare on the TP because of the harsh environmental conditions, so few observational studies on the turbulence characteristics and the turbulent heat flux have been conducted. Large eddy simulation (LES) has the unique advantage of being accurate and able to describe turbulence finely, and thus it has been widely used to investigate the effects of surface heterogeneity on turbulence (Hadfield et al., 1991, 1992; Kang and Lenschow, 2014). However, little has been done to improve our understanding of how the surface heterogeneity affects the boundary-layer turbulence and the contributions of the patch-induced motions to the turbulent flux and energy in the SRYR. Furthermore, modeling the turbulence over the heterogeneous surface in the SRYR can not only lay a basis for the analysis of the local energy and mass transport but also provide a quantitative reference for improving the parameterization schemes over heterogeneous surfaces in weather and climate models.
In this study, we used LES to investigate the detailed turbulence characteristics in the SRYR. Our primary focus was the impacts of the surface heat flux anomalies on the turbulent kinetic energy (TKE), turbulent intensity, and turbulent flux. The turbulence characteristics and turbulent fluxes in the surface and the entrainment layers of PBL were investigated, too. This paper is arranged as follows: Sect. 2 describes the model and data used in this study, Sect. 3 discusses the modeled results in detail, and Sect. 4 provides a summary and discussion of our findings.
2.1 Study area and observations
Ngoring Lake and Gyaring Lake (hereinafter referred to as the two lakes) are located in the SRYR and are surrounded by the alpine meadow. Their mean elevation is 4274 m above sea level. The study area is shown in Fig. 1. The turbulent flux and standard atmospheric variables were measured over the lake and grassland surface. The GPS radiosonde data from the field campaign on 29 July 2012 were used, at 30 m west of Lake Ngoring (near the gradient tower station, TS) and Madoi station (MD) located 30 km east of the lake (34.918∘ N, 98.216∘ E; 4279 m a.m.s.l.). The eddy covariance data for Lake Station (LS) above the northwest of the lake (35.026∘ N, 97.652∘ E) and Grassland Station (GS) (34.913∘ N, 97.553∘ E) at 1.5 km west of the lake shore were used. For further details on the field campaign and the quality control of the sounding and eddy covariance data, see Li et al. (2015, 2017). The synoptic background at 500 hPa and the distribution of the wind components in the vertical and horizontal directions were investigated using the ERA-Interim reanalysis data with a resolution collected at 12:30 and 18:30 LT (LT: local time, used in the whole study) on 29 July 2012, with a delimiting a range of 32–37∘ N, 95–100∘ E, including the two lakes area (34.8–35∘ N, 97–98∘ E) and the surrounding grassland.
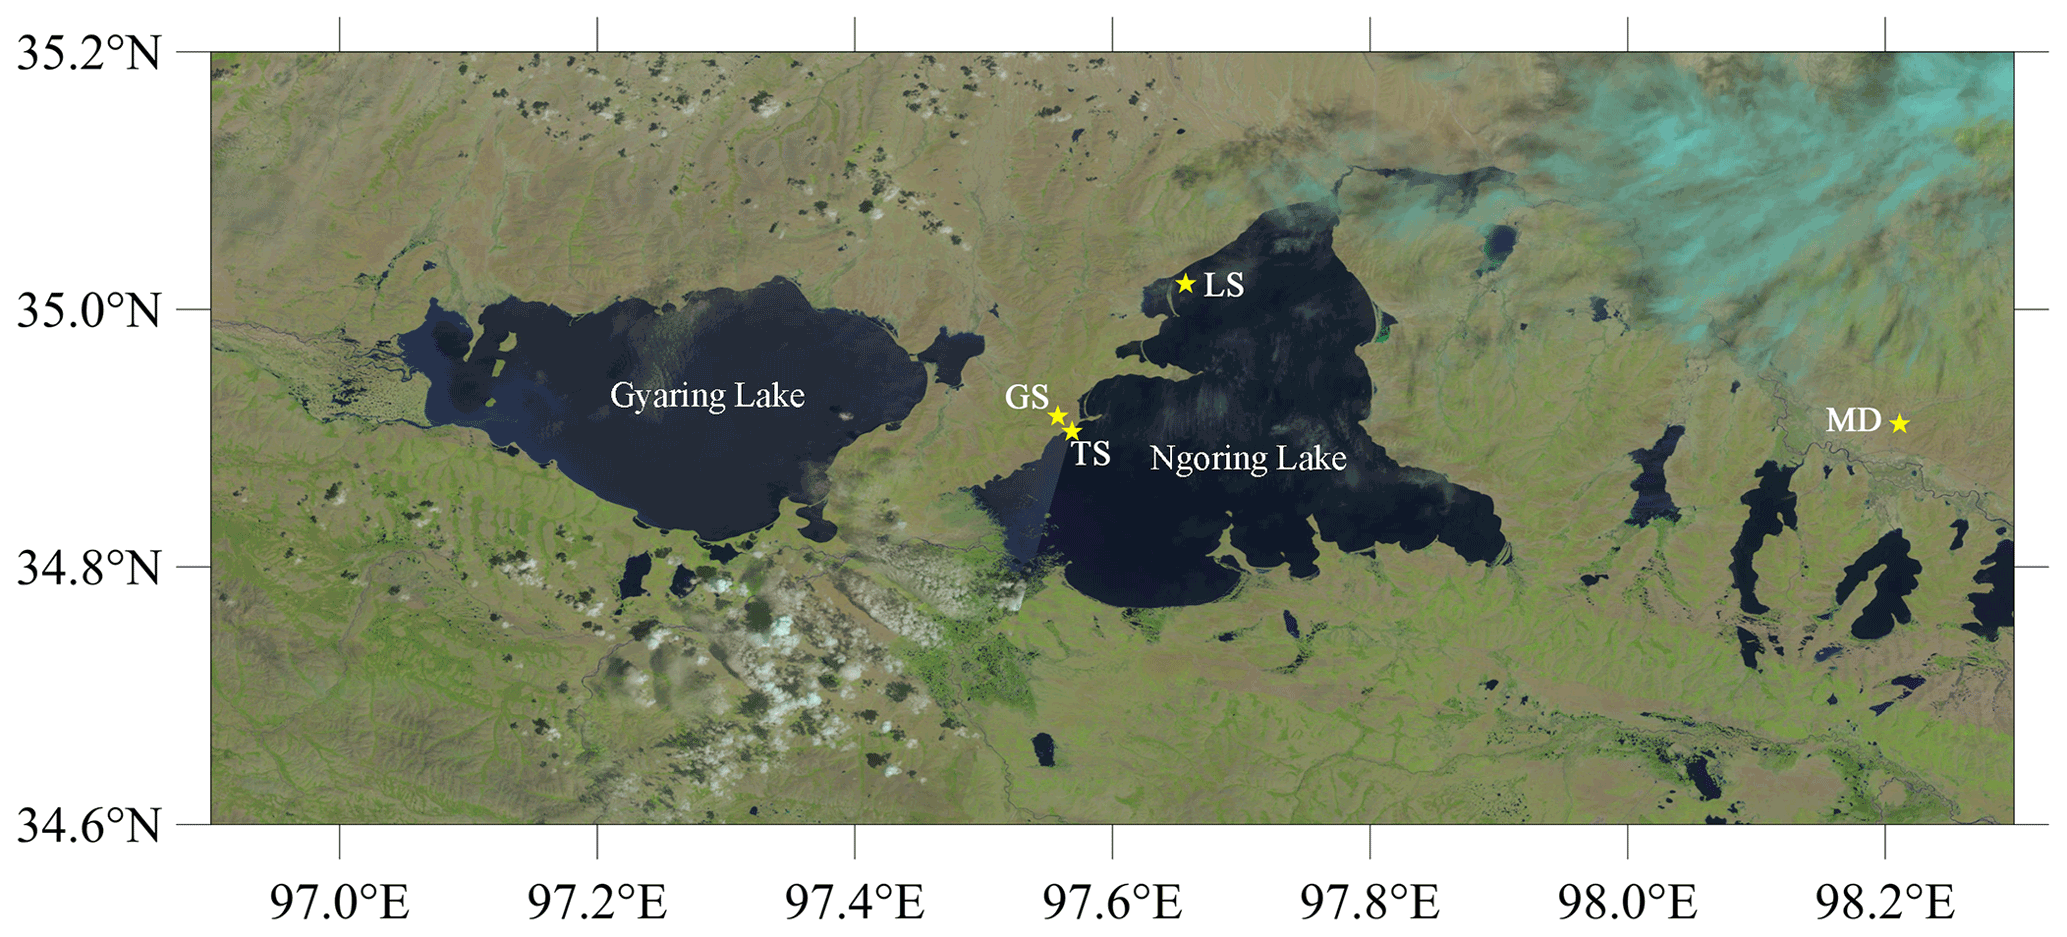
Figure 1Map of the study area obtained using Landsat data on 21 August 2014, with the location of the observation stations marked by yellow stars. The turbulent fluxes were measured at LS and GS stations. The standard atmospheric variables were observed at TS. MD is a fixed meteorological observatory of the China Meteorological Administration.
2.2 Methods
2.2.1 Simulations set up over the heterogeneous underlying surface
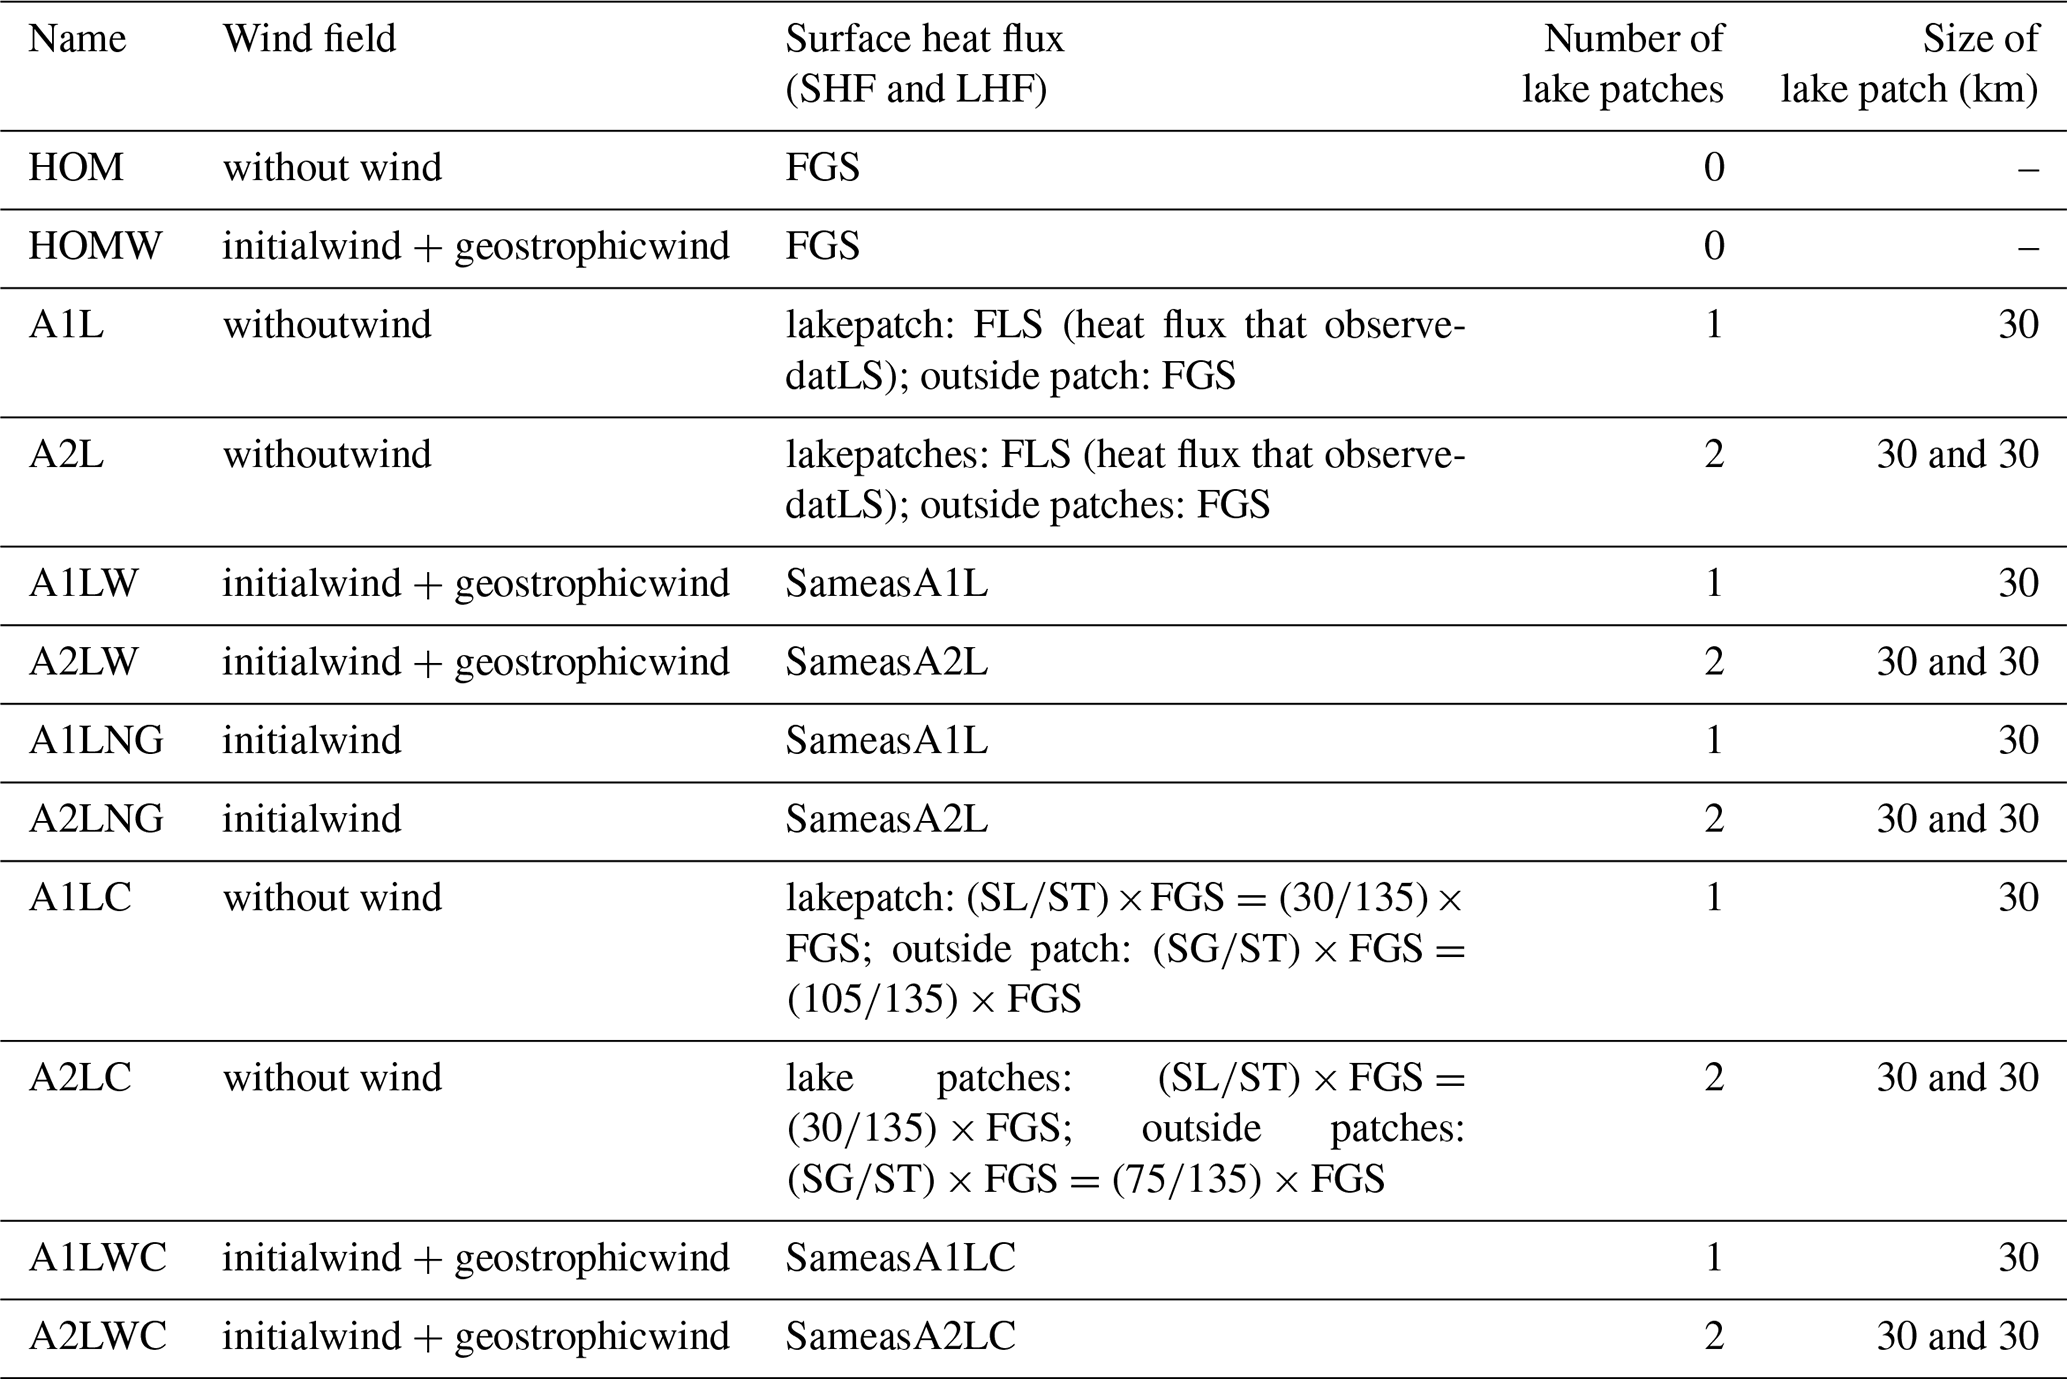
The UK Met Office Large Eddy Model (LEM) version 2.4 (Gray et al., 2001) was used in this paper. The LEM is a three-dimensional and non-hydrostatic numerical model, which can be used to simulate a wide range of turbulence-scale and cloud-scale problems with a high resolution. The domain size was in the y, x, and z directions, respectively, with a horizontal grid spacing of 200 m. According to Honnert et al. (2011, 2020), the horizontal resolution of 200 m is reasonable in this LEM study. There were 74 levels in the vertical direction, with a vertically stretched grid having a minimum spacing of 1.1 m in the surface layer and a maximum of 64.8 m above 2000 m. Periodic lateral boundary conditions were applied, with a rigid lid at the top of the model domain. To reduce the reflection of the internal gravity waves, a Newtonian damping layer was applied above 3500 m. The surface boundary conditions of the model were derived from the Monin–Obukhov similarity theory using the Businger–Dyer functions. The subgrid model used in the LEM was based on the Smagorinsky–Lilly approach (Brown et al., 1994). The potential temperature, wind (u and v), and relative humidity profiles obtained during the field campaign on 29 July 2012 were used to initialize the 3D runs. The LEM was driven by the time-varying sensible heat flux (SHF) and the latent heat flux (LHF) at the surface. The geostrophic wind shear was calculated using the ERA-Interim geostrophic wind at the surface and at 1500 m. These conditions will be detailed in Fig. 2. The simulation time was 12 h and the data were output every hour. The time step is 0.01 s for all simulations. In this study, twelve 3D runs with different surface heat flux under various background wind conditions were performed. Two of the runs were horizontally homogeneous with a uniform grass surface under the conditions of wind (HOMW) and no wind (HOM). The other cases were simulated with one (A1L) or two (A2L) lake patches in the middle of the model domain. The surface heat flux anomaly was applied over a 30 km wide strip (two strips for A2L), extending the entire 30 km width of the domain in the x direction. Here the term heat flux refers to both the sensible and latent heat fluxes. This can be viewed as representing Ngoring Lake and Gyaring Lake in the SRYR. It should be noted that in this study the scale of the heterogeneity was large enough to enable the formation of small eddies over the lake patches that could coexist with the large-scale patch-induced circulations (Patton et al., 2005). Four simulations (A1L, A2L, A1LW, and A2LW) were initialized using the surface heat flux over the patch/patches measured at LS and the heat flux outside the patch/patches measured at GS. This means that the heat flux into the modeled atmosphere decreases as the number of patches increases. However, it is helpful to separate the effects of the total increase in heating from the effects of the localization of the heating when considering the consequences of an unresolved spatially changing heat flux for a global model. In order to keep the total heat flux in the modeled atmosphere constant, a “balanced” surface heat flux approach was used. Therefore, if the surface heat flux observed at GS is denoted as FGS, and the heat flux over the patch and outside of the patch are denoted as FL and FG, respectively. FL and FG were calculated using the following equations:
where ST, SL, and SG are the squares of the model domain, the patch, and the outside of it, respectively. Another four simulations (A1LC, A2LC, A1LWC, and A2LWC) were performed using this balanced surface heat flux approach. The heterogeneous initial conditions were used in the surface heat flux anomaly simulations. The initial profiles over the patch/patches were derived using the data from TS station, and the data observed at the MD station used for the outside patch/patches. Various background wind conditions were also used for the surface heat flux anomaly runs. The parameters and the conditions of each run are listed in Table 1 for convenience. Sketches of the heterogeneous surface and of the surface heat flux over the lake patches and the outside patches for the unbalanced and balanced cases are depicted in Fig. 2.
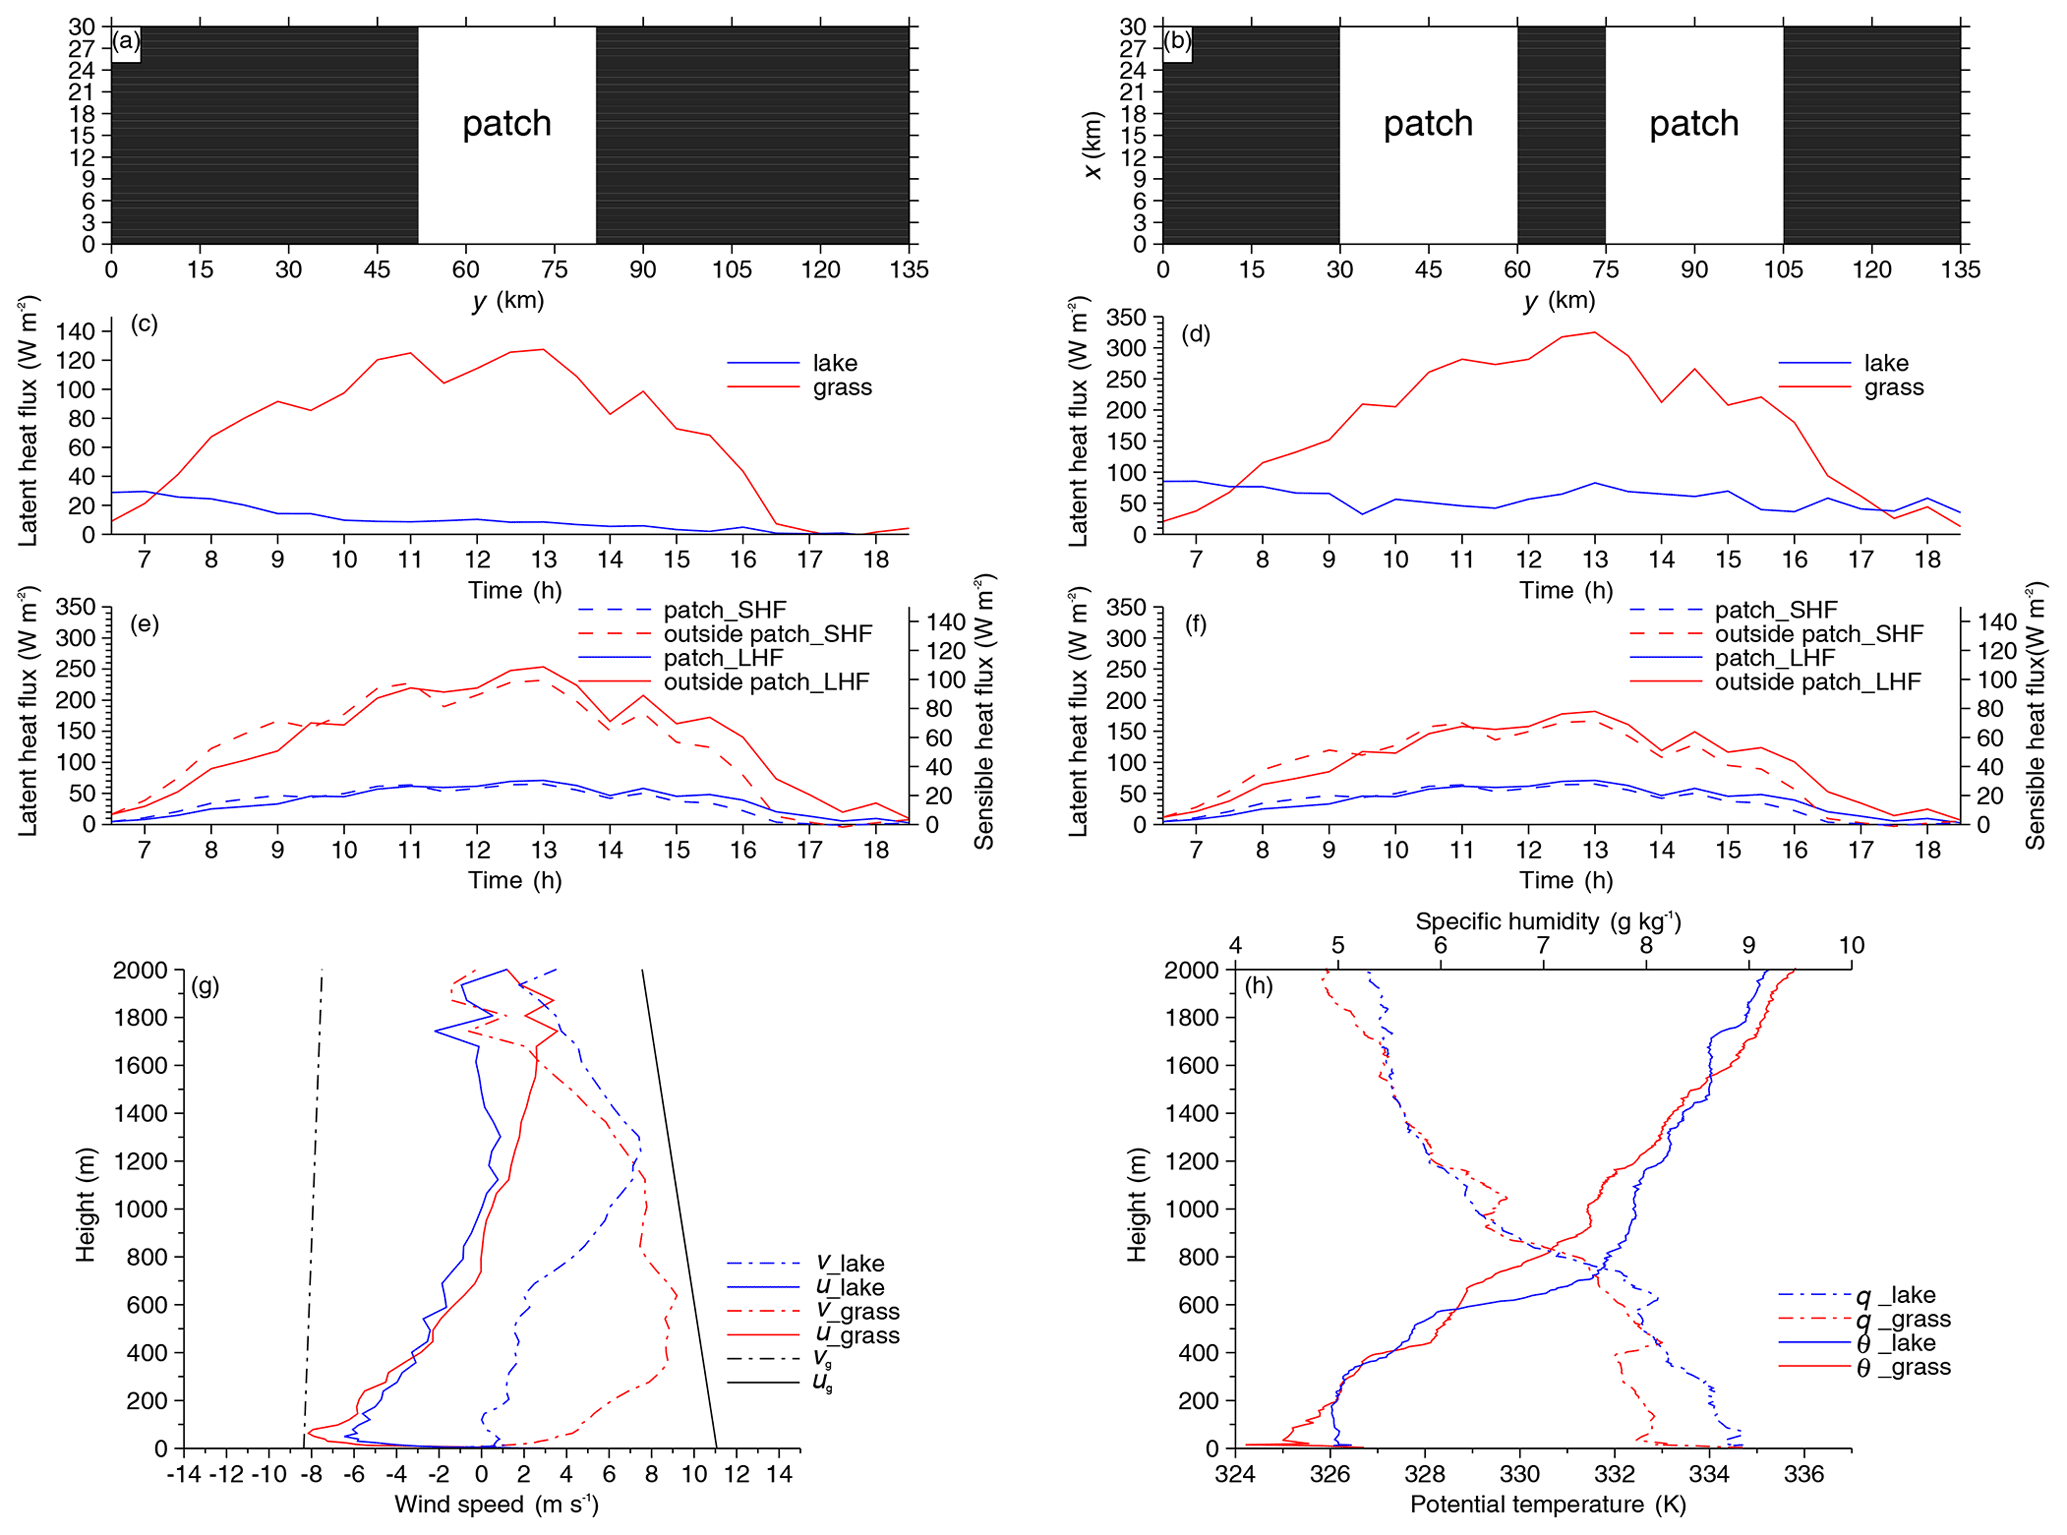
Figure 2Sketch of the heterogeneous surface (a, b), surface sensible heat flux and latent heat flux (c, d) over the grassland (red line) and the lake (blue line) from observation. The SHF and the LHF for runs with (e) one and (f) two lake patches and a constant heat flux. Panels (g) and (h) show the model initial profiles of the winds (solid lines for u, dashed lines forv), potential temperature (solid lines), and special humidity (dashed lines) over the lake patches (blue lines) and outside of the patches (red lines). The input geostrophic winds are also shown (black lines).
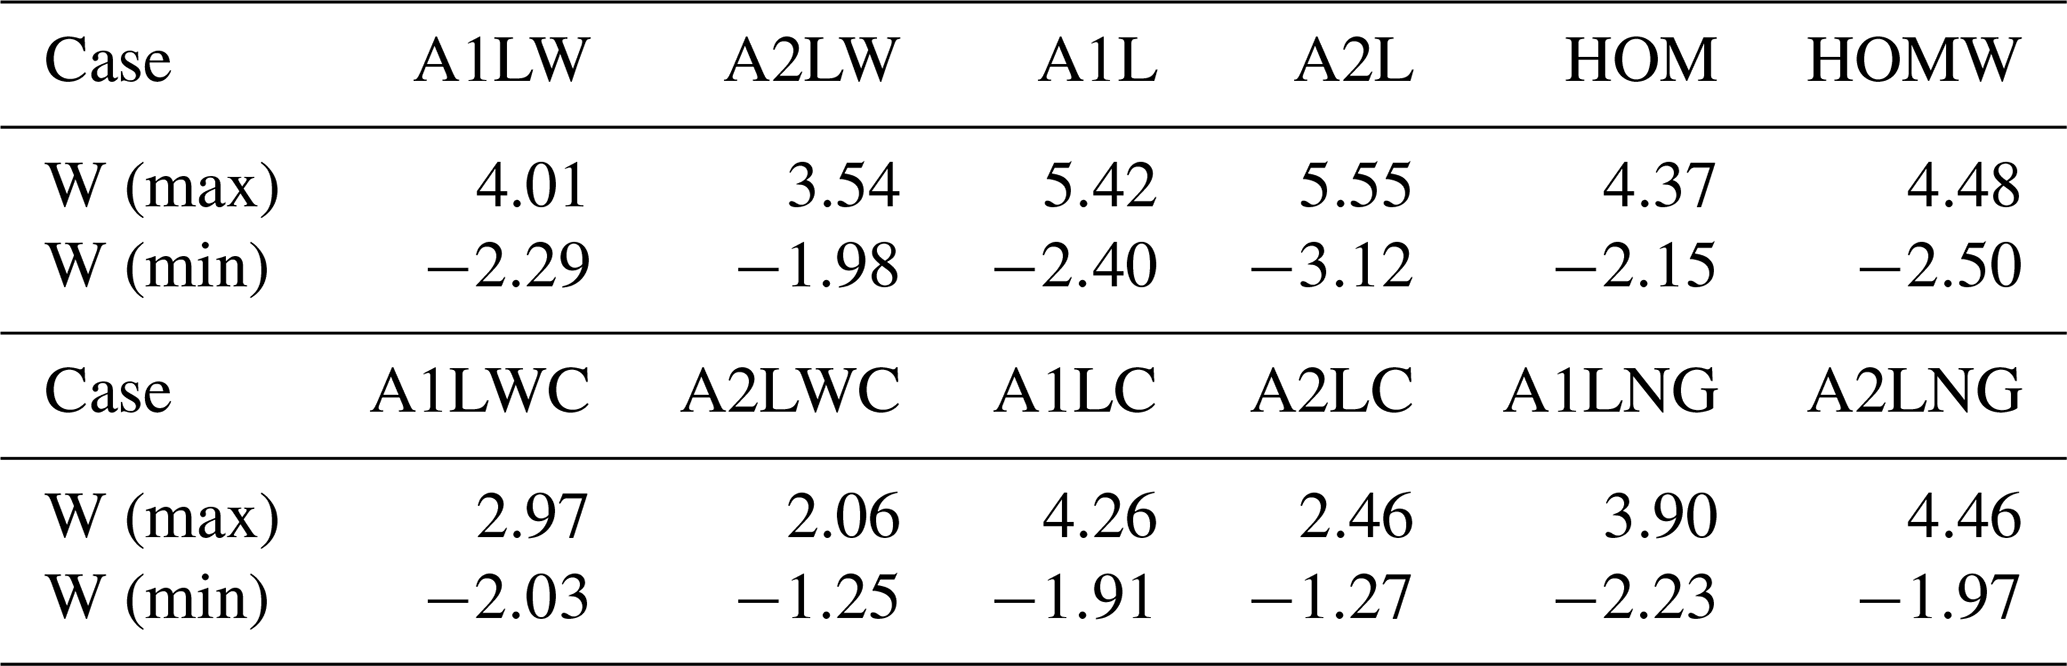
Table 1Parameters for the 3D simulations over the homogeneous surface (HOM) and heterogeneous surface with surface heat flux anomalies (A) under different conditions: with one (1L) or two (2L) lake patches, with initial wind and geostrophic wind (W), without geostrophic wind (NG), and with the constant surface heat flux (C).
The initial potential temperature and special humidity are shown in Fig. 2h, and the horizontal components of the wind profiles and the geostrophic wind are shown in Fig. 2g. A stable layer was found over the grass, and a 200 m convective boundary layer (CBL) was found over the lake at 06:30 LT. The special humidity profiles show that the air tends to be moister over the lake (dashed lines in Fig. 2h). The study area is characterized by a considerable surface heat flux and high wind speeds in the daytime. The stronger initial velocity is from GS, which recorded wind speeds of up to 10 m s−1 below 500 m.
2.2.2 Statistical analysis
According to turbulence theory, a physical quantity φ has two parts, i.e., the horizontal average 〈φ〉 and the turbulent fluctuation φ′, so
This equation usually works in cases with a homogeneous surface. The variances of velocity and the potential temperature variances (, , ) are calculated from v′, w′, and θ′, respectively. For a heterogeneous surface, phase-averaged analysis helps separate the patch-induced circulations from the random turbulent motions. This method has been applied in studies of the one-dimension and two-dimension heterogeneities (Matthias et al., 2014; Kang and Lenschow, 2014; Shen et al., 2016), as well as the complex and irregular heterogeneities (Maronga and Raasch, 2013). In this study, one-dimensional heterogeneous (in the y direction) simulations were performed for which φ can be decomposed into three parts:
where 〈φ〉 is the horizontal average, φhi is the heterogeneity-induced part which is the averaged φ across the domain in the y direction, and φs is from the background turbulence. The variances of velocity and the potential temperature induced by the heterogeneity (, , ) are calculated from vhi, whi, and θhi, respectively.
Phase-averaged analysis was also used to obtain the patch-induced component of the turbulent fluxes. We multiplied w and φ with both in the forms of Eq. (4), and derived the total vertical transport of φ:
Since the horizontal average vertical velocity 〈w〉 is approximately zero in the LES, the turbulent fluxes were divided into two parts: circulation-induced part and background turbulence-induced part:
Moreover, the total kinetic energy e can be written as two parts, ehi and es, which represent the contributions from the patch-induced and background turbulence:
3.1 Synoptic background and wind component distributions
In order to investigate the existence of a daytime (06:30–18:30 LT) lake breeze (the divergent flows over the lake surface and the downdrafts overlying it) using the ERA-Interim reanalysis data with a resolution for the two lakes area (34.8–35∘ N, 97–98∘ E; blue box in Fig. 3), the wind field, temperature field, and geopotential height field at 500 hPa (∼5500 m) at 12:30 LT and 18:30 LT on 29 July 2012 were analyzed. The southerly wind controlled the entire region at 500 hPa at 12:30 LT (Fig. 3a) then it became divergent flow at 18:30 LT (Fig. 3b). The vertical sections of the two wind components (u and w) were also depicted to further ascertain the distribution of the wind field in the longitude and latitude directions. It should be noted that downdrafts are dominant below 500 hPa in the two lakes area during the day (Fig. 3c and d). As can be seen from Fig. 3f, distinct divergent zonal wind (u) flows existed in the two lakes area at 18:30 LT. The wind speed derived from the GPS sounding at 12:30 LT is larger than that at 18:30 LT below 2 km (see Fig. S1 in the Supplement), indicating that the larger background wind covered up the divergent wind at 12:30 LT. Evidently, it is difficult to directly observe the lake breeze circulation due to the synoptic background, but the downdrafts and the divergent zonal wind in the two lakes area demonstrate the existence of a lake breeze. In the following sections, the turbulence characteristics over the heterogeneous underlying surface are simulated and the effects of the patch-induced circulation are analyzed.
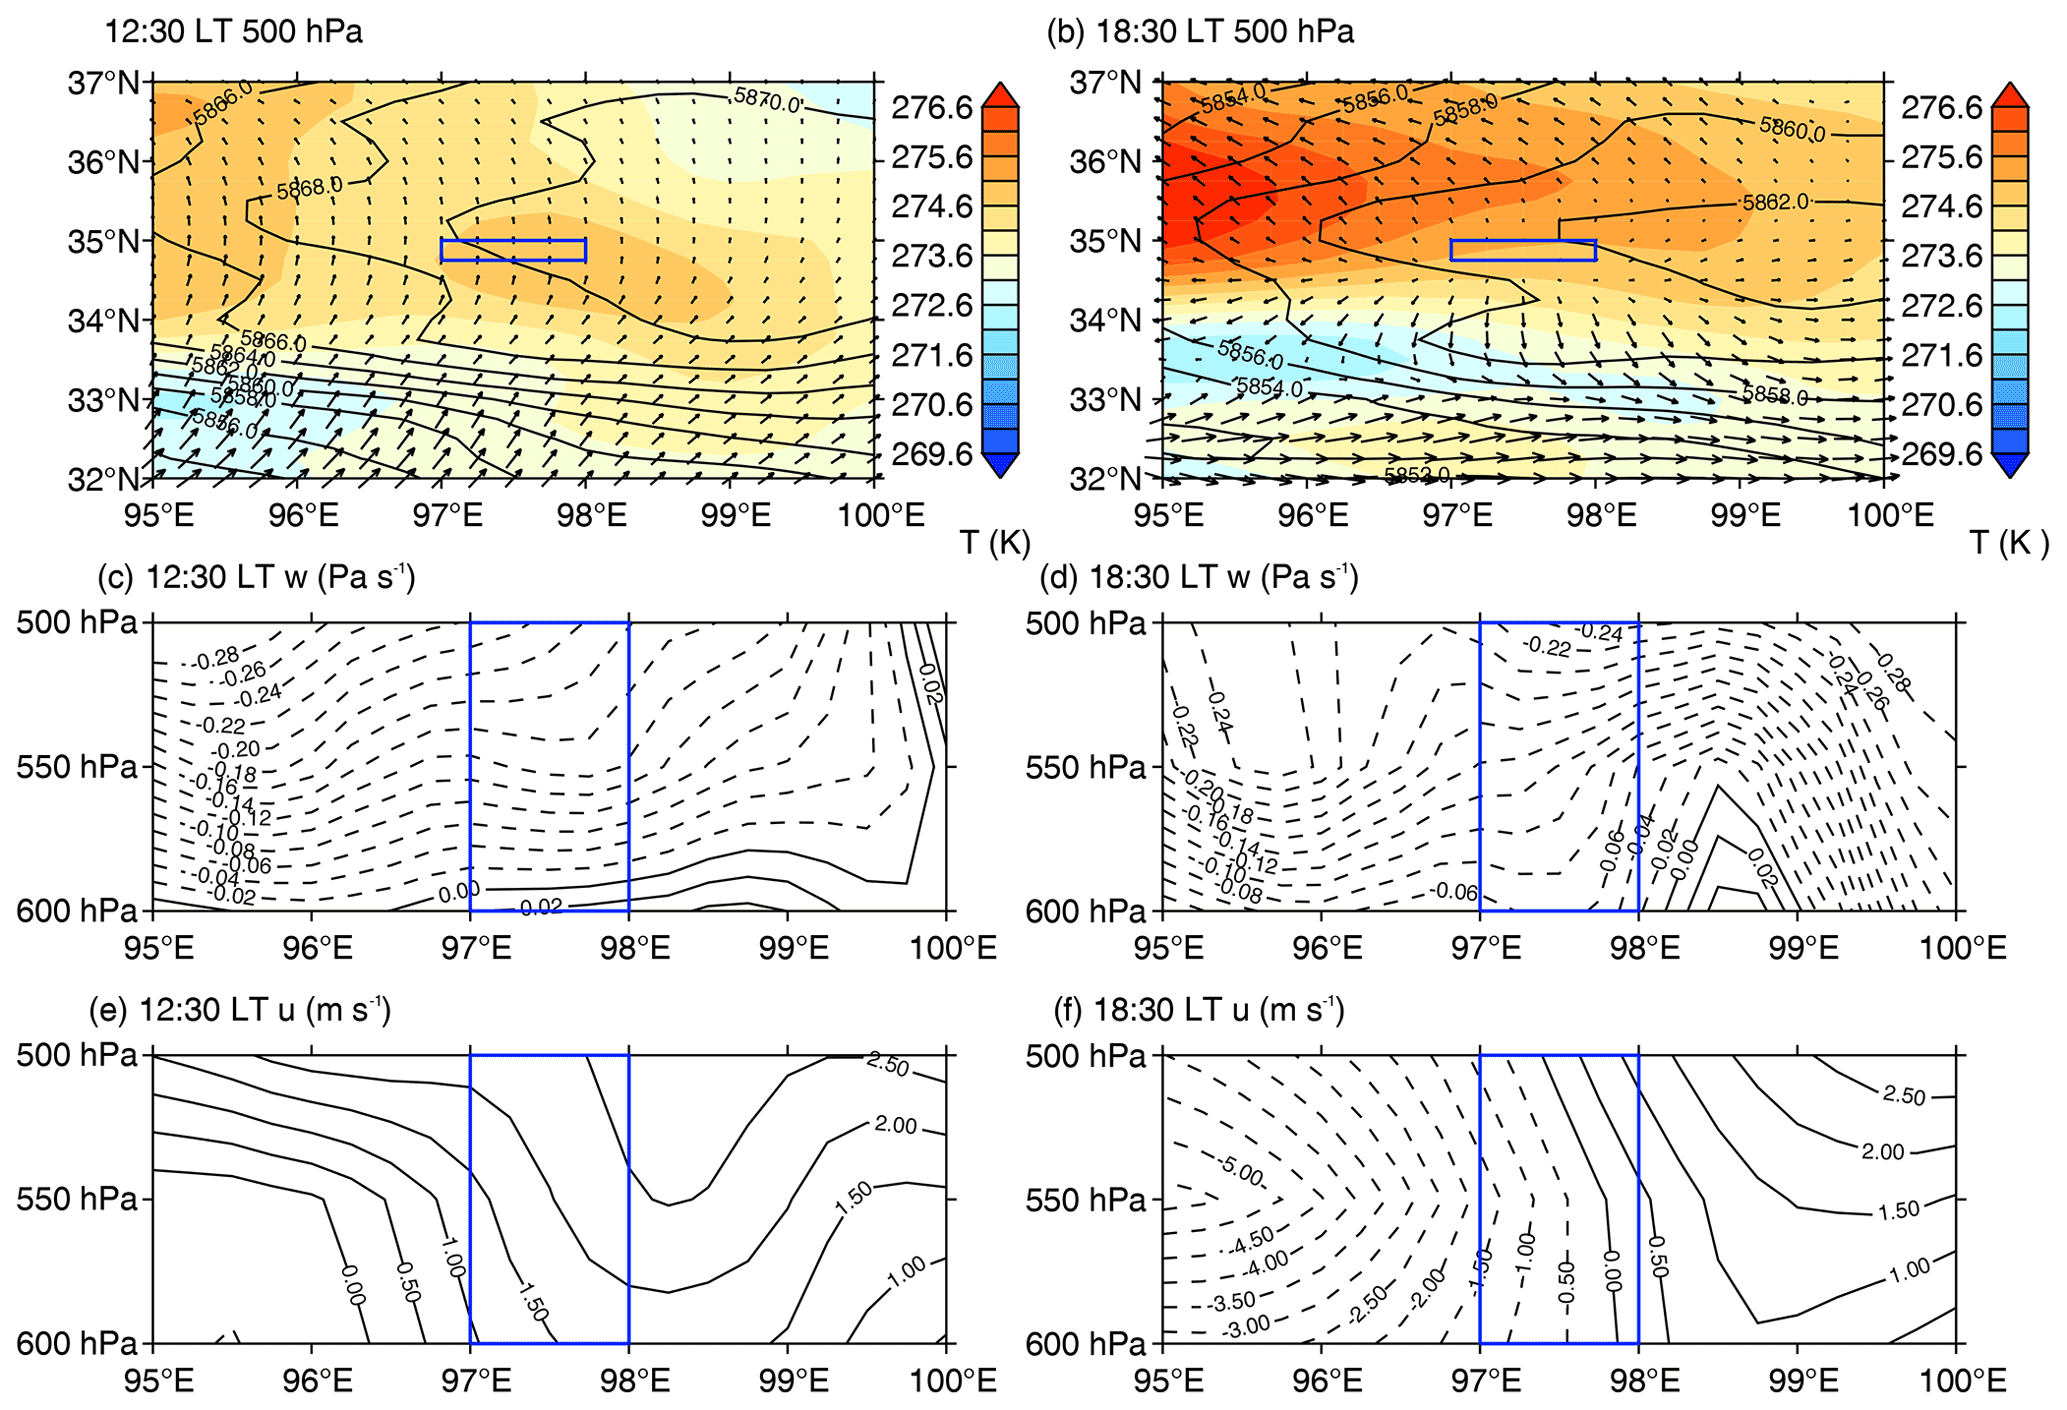
Figure 3Synoptic background on 29 July 2012. Blue boxes represent the two lakes area. Panels (a) and (b) show the wind field, temperature field, and geopotential height field at 500 hPa (∼5500 m) at 12:30 LT (a) and at 18:30 LT (b). The vertical wind (w, c, d) and the zonal wind (u, e, f) below 500 hPa are also shown.
3.2 Effects of the underlying surfaces and background wind on the boundary-layer turbulence
3.2.1 Performance of the LEM and the height of the boundary layer over homogeneous and heterogeneous surfaces
In order to inspect the performance of the LEM over the heterogeneously heated surfaces, the simulated virtual potential temperature (θv) over the lake patch/patches and outside were compared with the observations. In addition, by keeping the total surface heat flux into the modeled domain constant, the profiles of the simulated virtual potential temperature over the homogeneous and heterogeneous surfaces were compared in order to investigate the effects of surface heterogeneity on the structure of the boundary layer. The profiles of the kinematic heat flux for all of the runs were used to determine the height of the boundary layer. Figure 4a and b compare the simulated profiles of the virtual potential temperature over and outside of the lake patch with the corresponding observations (solid lines) over the grassland and the lake surfaces at different times. In order to account for the effects of the unrepresented large-scale forcing, the simulated horizontally averaged potential temperature, water vapor mixing ratio, and horizontal wind (u and v) were relaxed to those observed using the radiosondes with a 3 h (hour) interval during the simulation (Marsham et al., 2008; Huang et al., 2009). The time series of the kinetic energy (see Fig. S2 in the Supplement) indicates that the equilibration time of the model is approximately 3 h.
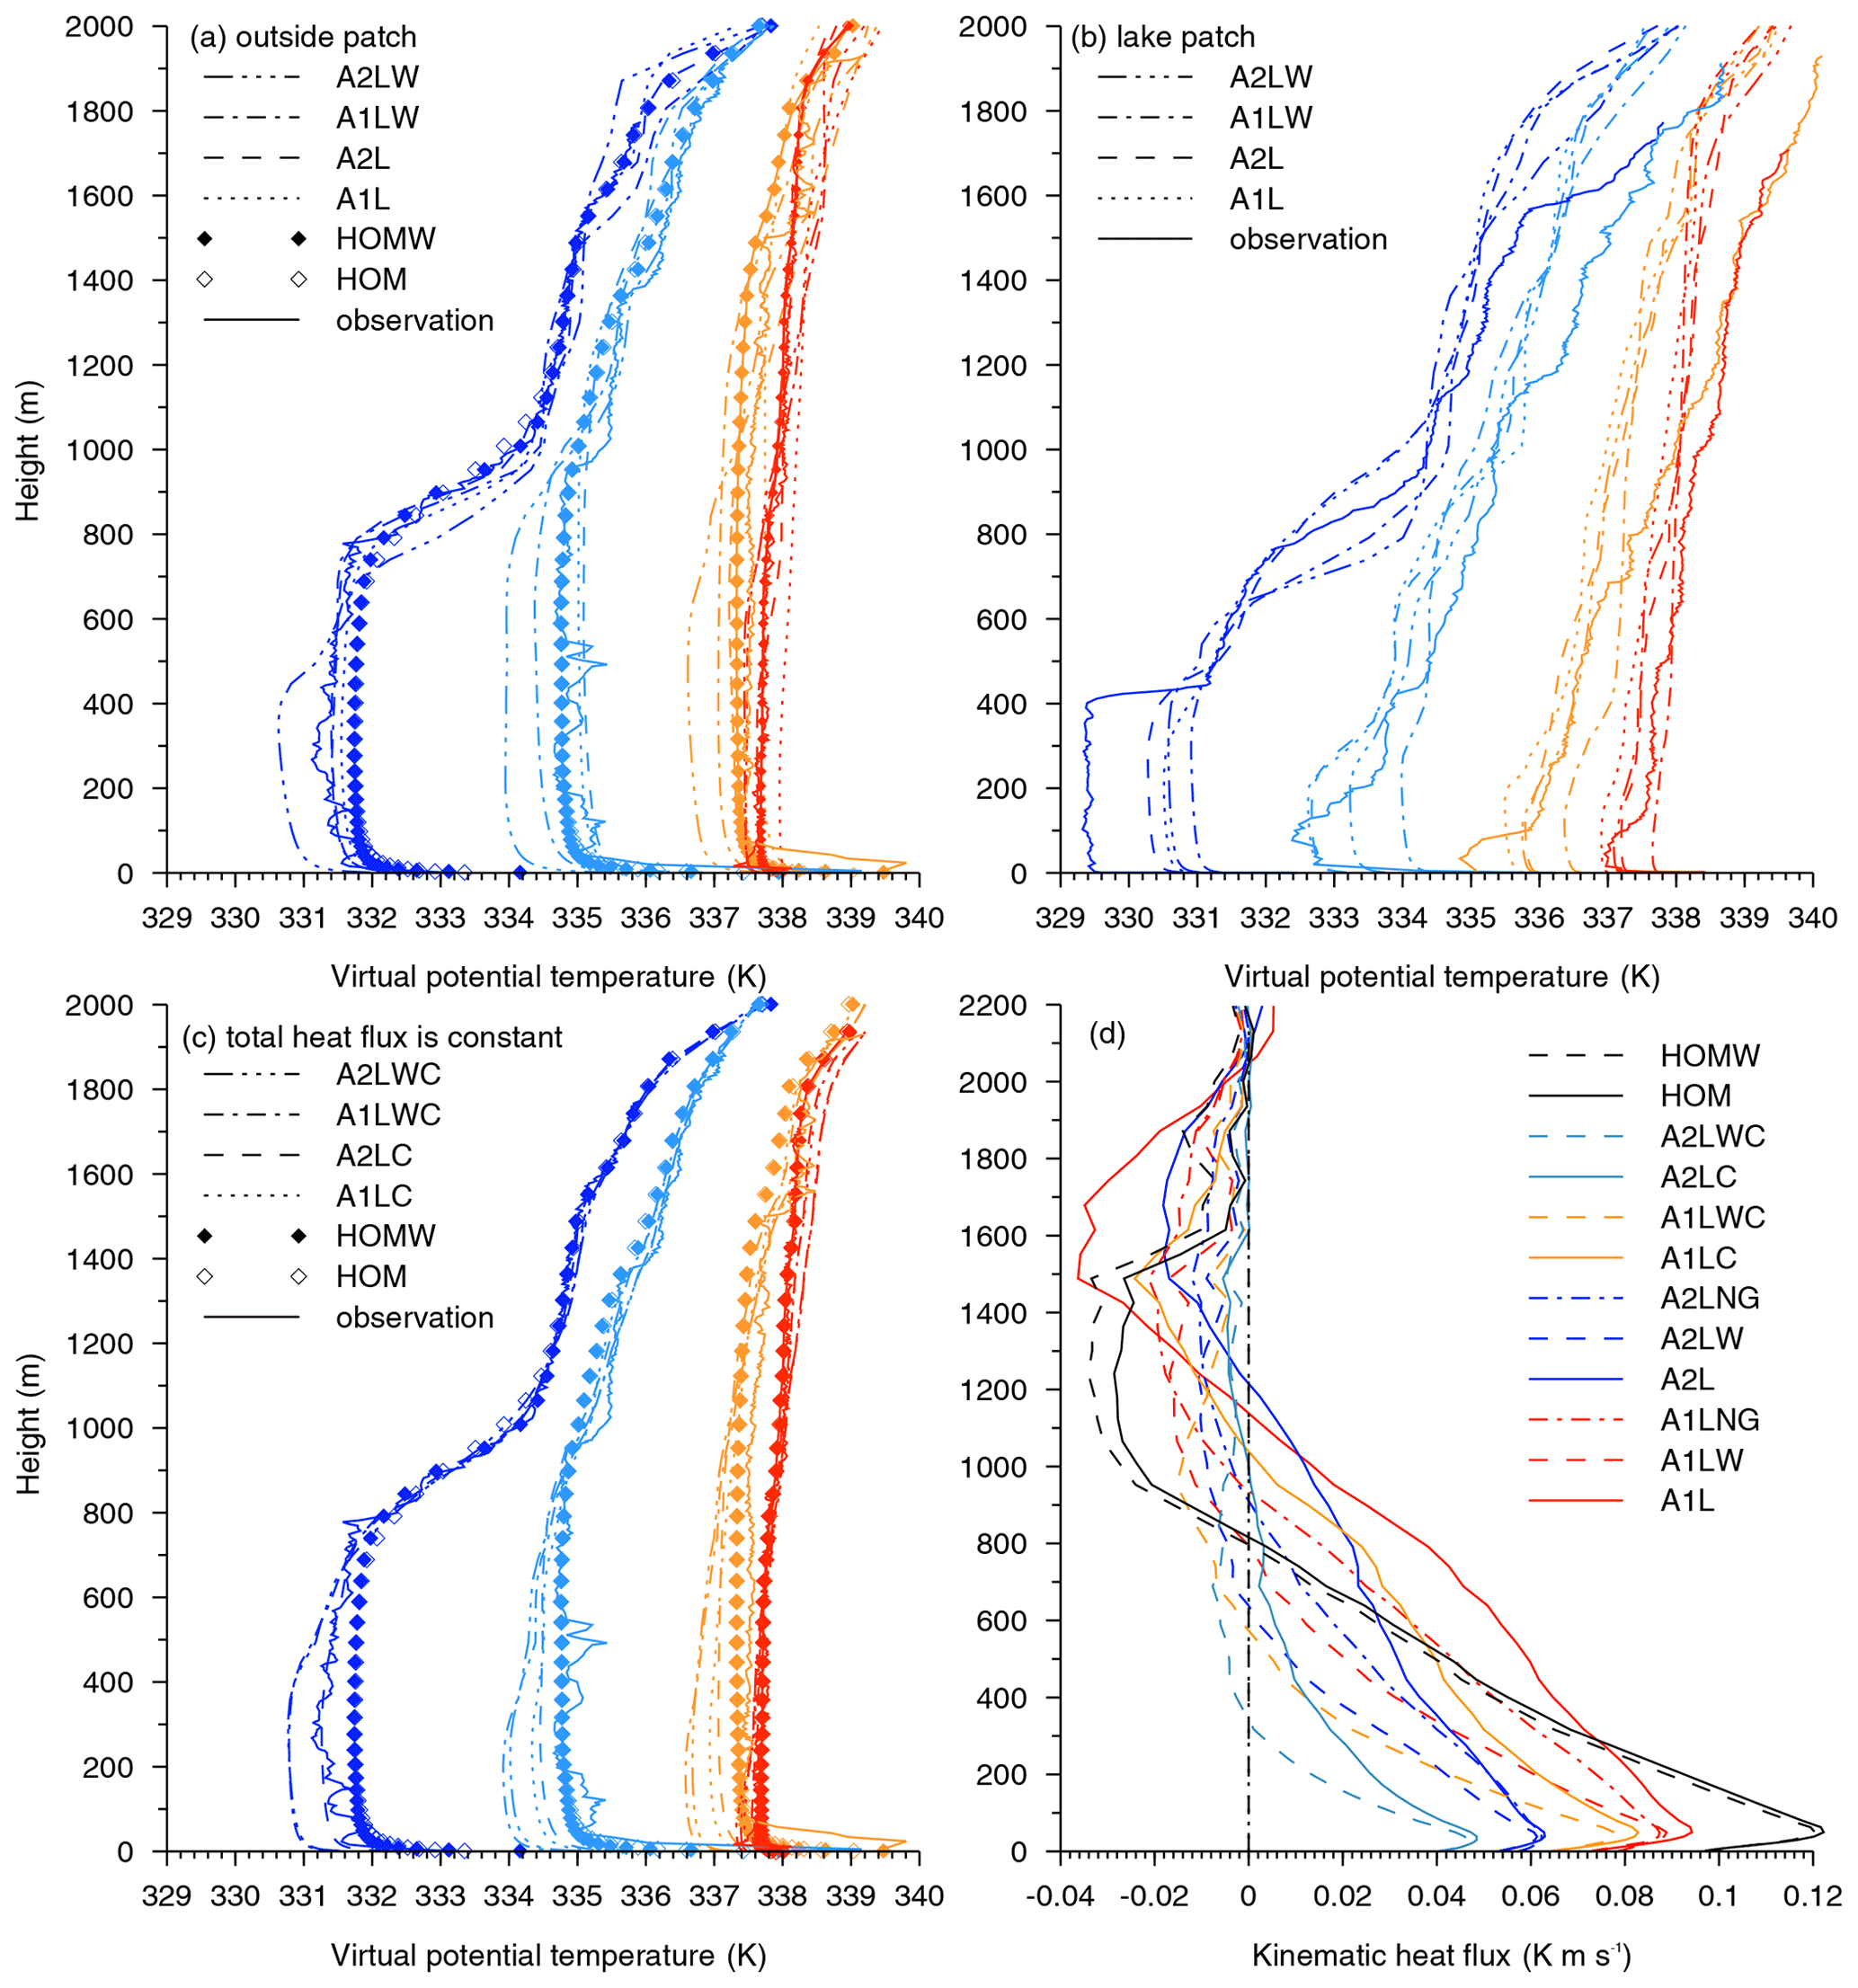
Figure 4The profile of the horizontal, averaged virtual potential temperature for the observations and all of the runs over the lake patches (a) and outside of the lake patches (b). Panel (c) is the same as (a) except for heterogeneous and homogeneous runs with constant surface heat flux. Legends for (a–c) dark and light blue represent the results at 09:30 and 12:30 LT, respectively, and the orange and red lines show the results at 15:30 and 18:30 LT, respectively. (d) The kinematic heat flux for all of the runs.
The observation profiles (solid lines in Fig. 4a) show that the depth of the convective boundary layer (CBL) over the grassland increases from 700 m at 09:30 LT to 1.1 km at 12:30 LT to 1.5 km at 15:30 LT to 1.9 km at 18:30 LT. The inversion layer above the CBL is completely eroded by the turbulence after 12:30 LT. The virtual potential temperature in the well-mixed CBL over the grassland increases by approximately 7 K from 09:30 to 18:30 LT. The CBL over the heterogeneous surfaces with background wind is cooler and shallower than that over the homogeneous surfaces. This may be because the background wind weakens the boundary-layer convection, which inhibits the development of the CBL (Huang et al., 2009). In addition, the model profiles of the virtual potential temperatures over the homogeneously heated and heterogeneously heated surfaces with no background wind have very similar structures and are close to the sounding profiles. This is similar to the modeling results of Liu et al. (2011). The observed virtual potential temperature over the lake surface (solid lines in Fig. 4b) shows that the CBL changes to stable stratification as the radiation increases after sunrise, and the modeled θv over the patches is about 1.0 K warmer than the observed θv. As in Fig. 4a, Fig. 4c also shows that the background wind over the heterogeneous surface inhibits the growth of the CBL.
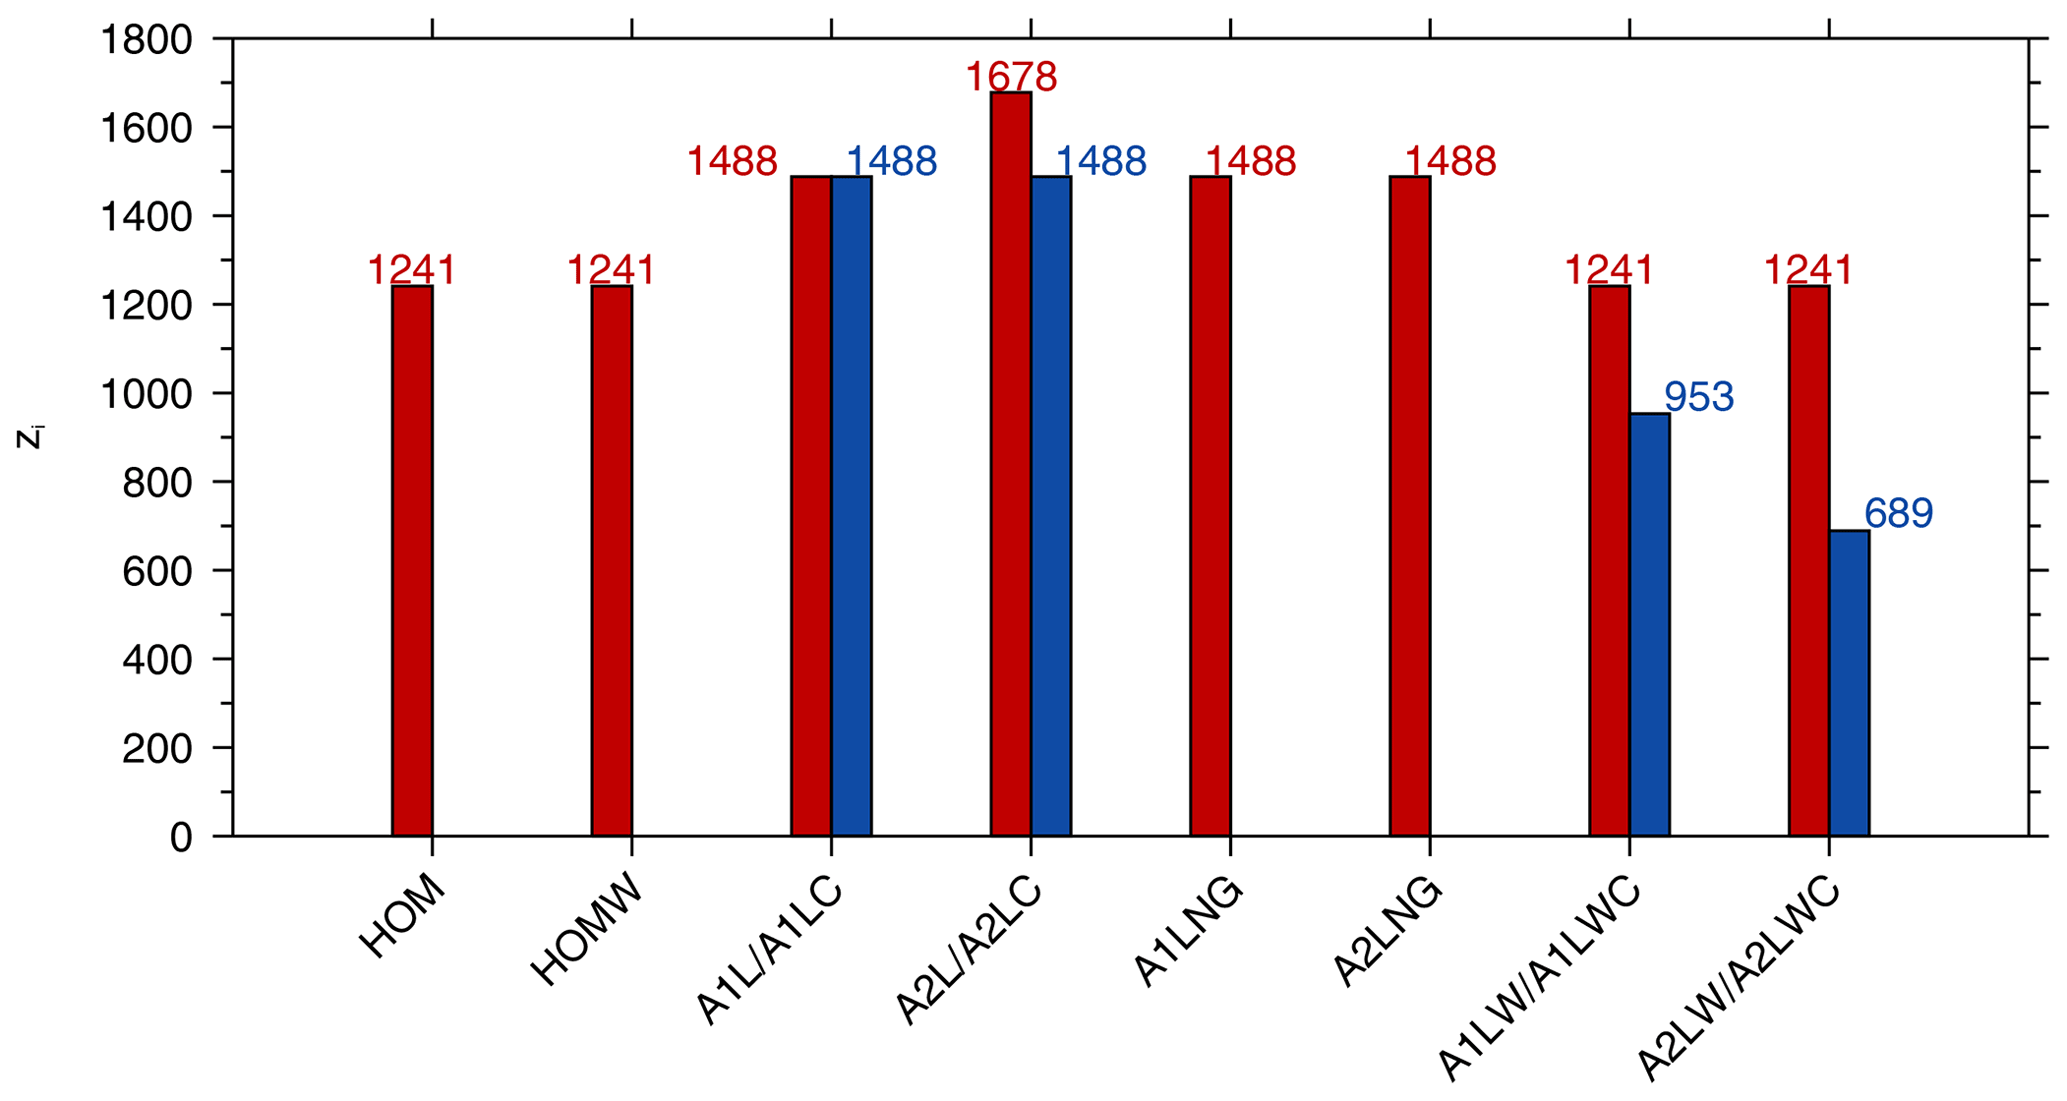
Figure 5Bar chart of the CBL height for each run marked with a concrete value. The red bars from left to right represent runs HOM, HOMW, A1L, A2L, A1LNG, A2LNG, A1LW, and A2LW. The blue bars from left to right represent runs A1LC, A2LC, A1LWC, and A2LWC.
In this study, according to Sullivan et al. (1998), the height of the boundary layer (zi) was determined using the minimum kinematic heat flux of the simulated results. As can be seen, the maximum surface heat flux were relatively large over the homogeneously heated surface, while smaller surface heat flux occurred for the case with two lake patches. Compared to the unbalanced cases (A1L, A1LW, A2L, and A2LW), less heat flux was introduced in the balanced cases (A1LC, A1LWC, A2LC, and A2LWC) and lower CBLs occurred, especially with a wind field (blue bars in Fig. 5). The kinematic heat flux decreased to zero at higher altitude over the heterogeneously heated surface. The region of negative heat flux above that altitude is often called the entrainment layer, which is thicker in the cases with background wind. The heights of the CBL indicate (Fig. 5) that the surface heat flux anomaly may contribute to the deepening of the mixed layer, thus increasing the CBL height. However, the shear generated by the background wind strengthens the turbulent exchange between the entrainment layer and the free atmosphere, resulting in an excessively thick entrainment layer, which, however, inhibits the upward development of the CBL.
3.2.2 Effects of the surface heat flux anomalies and background wind on the TKE
Local circulations will be induced by differential heating, and the TKE determines the transport of the momentum, heat, and moisture through the boundary layer (Tyagi and Satyanarayana, 2013). Thus, the thermal circulations induced by the lake patches were simulated to investigate the effects of the heterogeneous heating on the spatial distribution of the TKE.
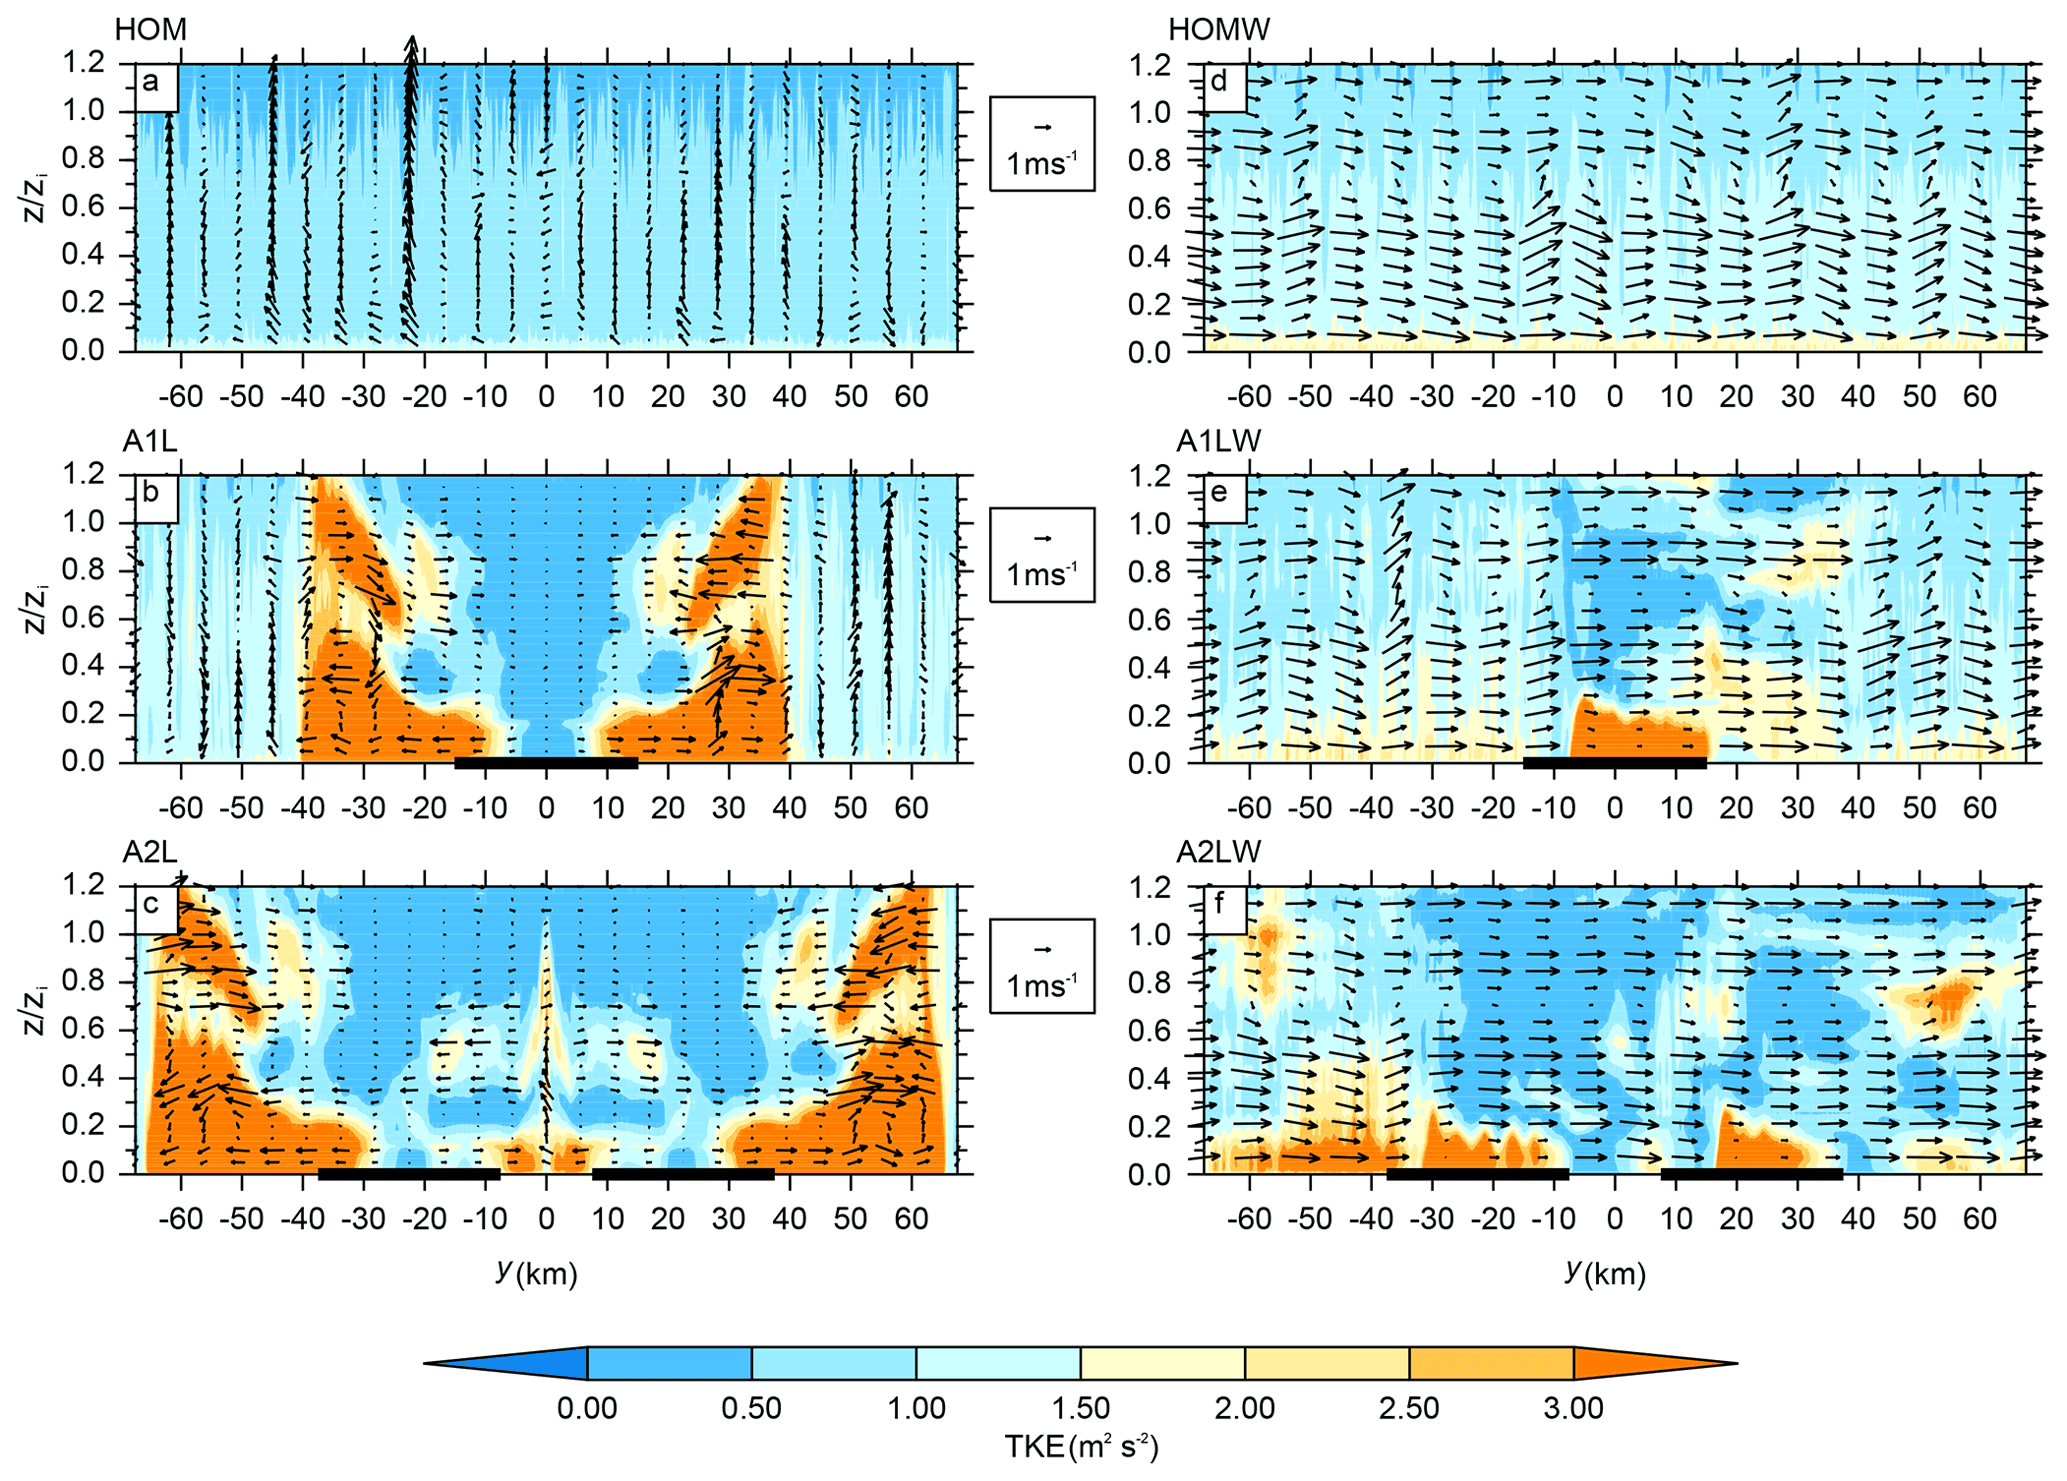
Figure 6The y–z cross sections of the TKE (contour) with superimposed wind vectors composed of v and w wind for runs with (d–f) and without (a–c) background wind over homogeneous (a, d) and heterogeneous (b, c, e, f) surfaces. The thick black lines on the y axis represent the lake patches.
Figure 6 shows the vertical distribution of the TKE and the wind vectors over the homogeneous and heterogeneous surfaces with and without background wind at 15:30 LT. Over the homogeneous surface (Fig. 6a), a relatively uniform TKE with a larger magnitude exists within a much shallower CBL (below 0.1zi), which overlies the scattered and disordered wind vectors throughout the domain. Over the heterogeneous surfaces, the large TKE values are distributed on both sides of the lake patches below 0.5zi, and the divergent winds extend to about 30 km away. In addition, a larger TKE and convergent winds occurred in the upper level of the CBL (Fig. 6b and c). Moreover, the air flow between the two lake patches led to a convergent region (updrafts in y=0 km; Fig. 6c). This is consistent with the results of Avissar and Schmidt (1998), who demonstrated that turbulent eddies are randomly distributed over a homogeneous surface, but the TKE exhibits two maxima near the ground surface and the top of the CBL, which is in agreement with the patch-induced circulations. The similar TKE distribution occurs when the background wind exists over the homogeneous surface (Fig. 6a and d). It should be noted that there is larger TKE over the patch/patches (below 0.2zi) as the similar pattern of TKE in Papangelis et al. (2021), from which the thermal internal boundary layer (TIBL) can be recognized (Fig. 6e and f). Moreover, the background wind inhibits the development of the patch-induced circulation, because the divergent wind derived from the heterogeneous surface can not be viewed at 15:30 LT. Overall, Fig. 6 illustrates that the distributions of the TKE and the patch-induced circulations are symmetrical on both sides of the lake patches, while the distribution is random with smaller TKE values over the homogeneous surface. The background wind tends to reduce the TKE outside patch/patches while enhancing it over the patch/patches.
Table 2The ratio of the TKE of the different runs. Max, Min, and Mean stand for the maximum, minimum, and mean ratios of the TKE in the model domain, respectively.

Furthermore, the ratios of the horizontally averaged TKE in the model domain of the different runs were calculated to examine the effects of the surface anomalies and the background wind on the TKE. As is shown in Table 2, the TKE for the cases with one or two lake patches are about twice that of the TKE of the case without patches (columns 2 and 3), but the background wind leads to a reduction in the impacts of surface flux heterogeneity on the TKE (columns 4 and 5 and 6 and 7). This is consistent with the results of Avissar and Schmidt (1998), who reported that a weak background wind of 2.5 m s−1 is strong enough to considerably reduce the impact of the surface heterogeneity on the CBL. For the homogeneous cases, the TKE increases under the background wind conditions due to the increase in the sheared turbulence. For the runs with balanced surface heat flux (A1LC, A2LC, A1LWC, A2LWC), the effects of the heterogeneity on the TKE are less significant due to the relative smaller surface heat flux, especially for the cases with more lake patches, but the effects of the background wind on the TKE tend to be large.
To further investigate the effects of the surface heat flux anomalies on the development of turbulence, it is instructive to examine the vertical profiles of the buoyancy and shear production terms in the TKE budget equation, which is from the contributions of the resolved (RES) and subgrid (SGS) eddies at 15:30 LT (Fig. 7a–c).
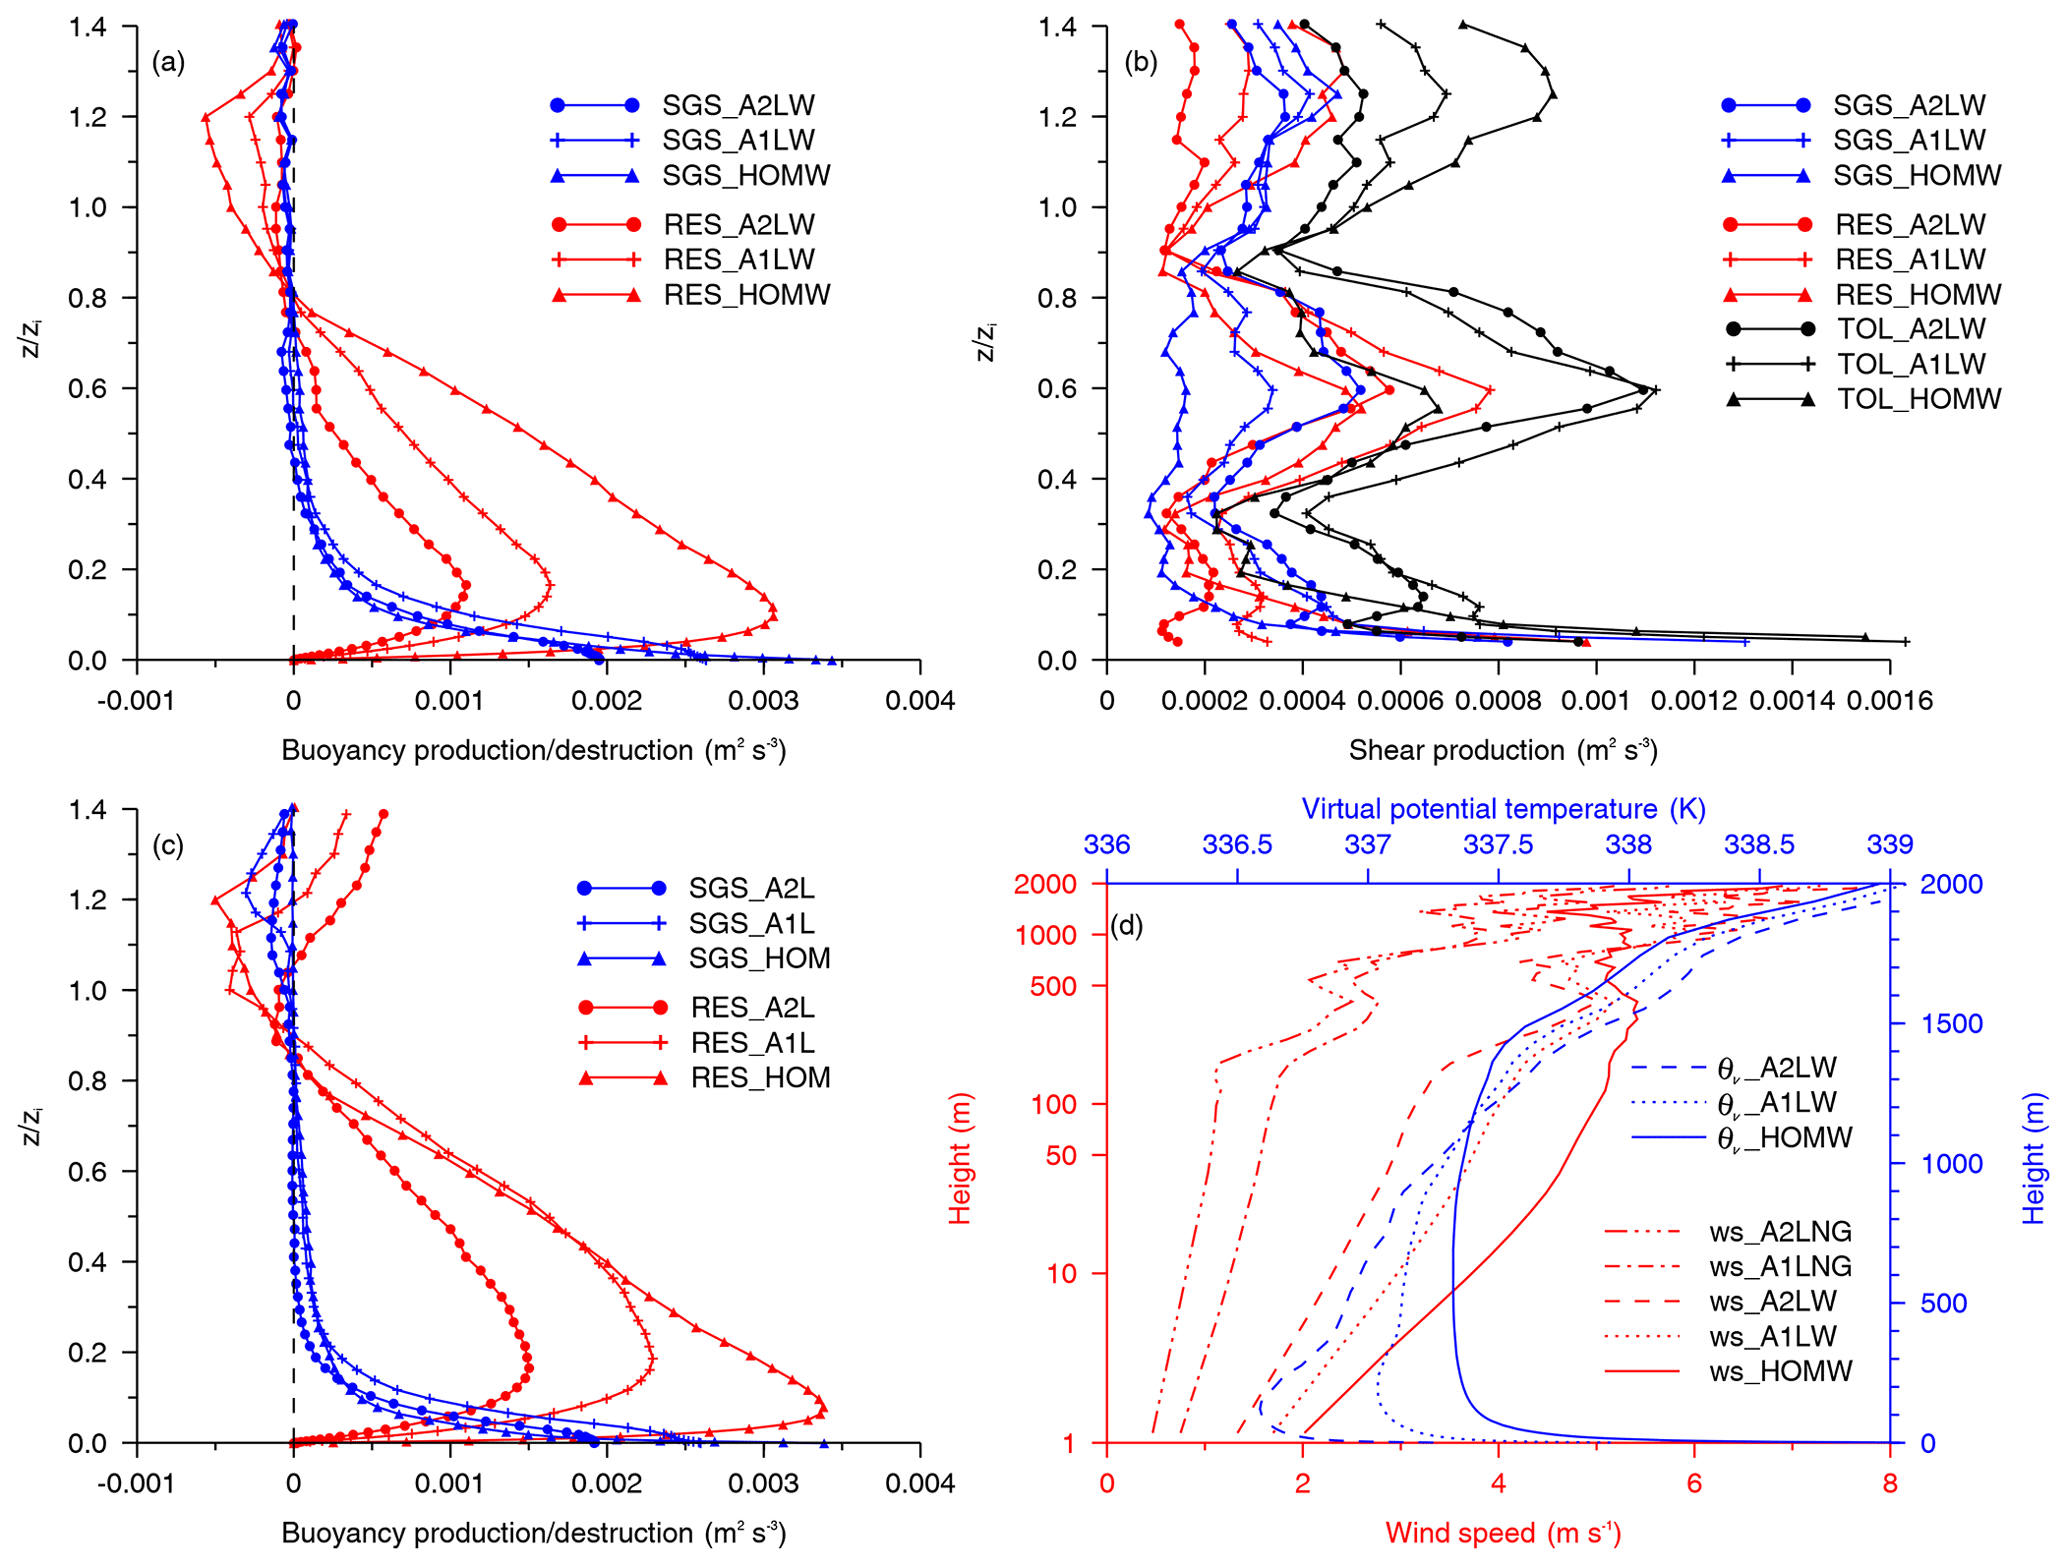
Figure 7Vertical profiles of the buoyancy flux (a) and the shear production term (b) for runs HOMW, A1LW, and A2LW with background wind, and the profiles of the buoyancy flux (c) for runs HOM, A1L, and A2L without background wind. (d) The simulated mean wind versus logarithm of height for runs HOMW, A1LW, A2LW, A1LNG and A2LNG, and the virtual potential temperature profiles (blue line) at the same time (15:30 LT). The resolved and subgrid results are presented as red and blue lines, respectively. The black lines in (b) are the total (resolved and subgrid scale) shear production term.
Figure 7a and c show that the RES buoyancy production/destruction decreases as the number of patches increases and the SGS buoyancy contributions are negligible, except in the surface layer. The buoyancy production/destruction in the TKE budget equation is
The RES buoyancy production/destruction profiles show that the lower maximum occurs for the wind simulations over the heterogeneous surfaces. It is because the larger positive buoyancy production/destruction decreases, especially in the downstream part of the patch (Fig. S4 in the Supplement), which is due to the significantly weakened updrafts of the patch-induced circulations by the background wind. Comparing with no wind simulations (Fig. S4b and c), the buoyancy production/destruction over the patch/patches decreases for wind simulations. It is probably caused by the relatively warm air in a TIBL formed over the patch/patches (Fig. S5b and c in the Supplement) due to the abrupt change in surface heat flux (Mahrt, 2000) with air flowing from the warm patch to the cold patch. Similar with the results of Zhou et al. (2018) and Liu et al. (2020), the cold center of the TIBL (Fig. S5e and f in the Supplement) moves to the downwind of the lake patches. Below 0.9zi, the larger RES shear production occurs in the case with lake patches (Fig. 7b), and the contribution of the SGS shear production is considerable (Fig. 7b), which is significant in the CBL for the cases with surface flux anomalies. Thus, the total shear productions (black lines in Fig. 7b) of the cases with heterogeneous surfaces are larger. In addition, wind shear is the source of the SGS shear production peak at due to the larger momentum flux above 0.6zi (see Fig. S3 in the Supplement), increasing the wind speed and wind shear below. Figure 7d showed the wind profiles (red lines) for runs with background wind (HOMW, A1LW, A2LW) and without geostrophic wind (A1LNG, A2LNG), as well as the virtual potential temperature profiles (blue lines). It shows that patch-induced circulations reduce the modeled mean wind speed below the height of about 800 m for the largest wind speed exists in the homogeneous case (red solid line). The wind profile is log-linear below the height of 20 m and shows a clear mixed layer above it for the homogeneous run, which correspond to a mixed layer shown by the virtual potential temperature profile (blue solid line). For the one/two-lake simulations, the wind profiles (red dotted and dashed lines) exhibit a feature of a stable boundary layer (blue dotted and dashed lines) with a maximum local wind at about 400 m. It should be noted that the stable stratification of wind profiles between 200 and 1000 m are probably caused by the process of the TIBL. It is confirmed by the similar wind profile features from the runs without geostrophic wind over the heterogeneous surface.
3.2.3 Effects of the background wind on the circulations
In order to investigate the effects of the background wind on the patch-induced circulations, the vertical distributions of the vertical velocity and wind fields for the runs with and without background wind were compared. In Fig. 8, the patch-induced circulations are not easy to distinguish in the cases with background wind (about 13.9 m s−1 above a height of 1.2 km) due to the cancellation of the local pressure gradient by the synoptic pressure gradient, which is consistent with the results of Crosman and Horel (2010). This also indicates that the boundary-layer convection tends to weaken as the number of lake patches increases (the maximum updrafts are 4.8, 4.2, 3.5, and 3.3 m s−1 for runs A1L, A2L, A1LW, and A2LW, respectively), which is confirmed by the weaker buoyancy production/destruction for the heterogeneous simulations in Fig. 7a and c. Moreover, the wind fields for the cases without geostrophic winds exhibit divergent flows over the lake patches. As in the study of Kang and Lenschow (2014), our study also confirms that the symmetrical patch-induced circulations and the intensity of the convection become indistinguishable and weak under the background wind conditions. However, the divergent flows in the lower level are still visible when the geostrophic wind is removed (A1LNG and A2LNG in Fig. 8e and f). Comparing with the spatial distribution of the vertical velocity over the homogeneous surface (Fig. 8g and h), the lake patch/patches alter both the boundary-layer convection intensity and the local circulation.
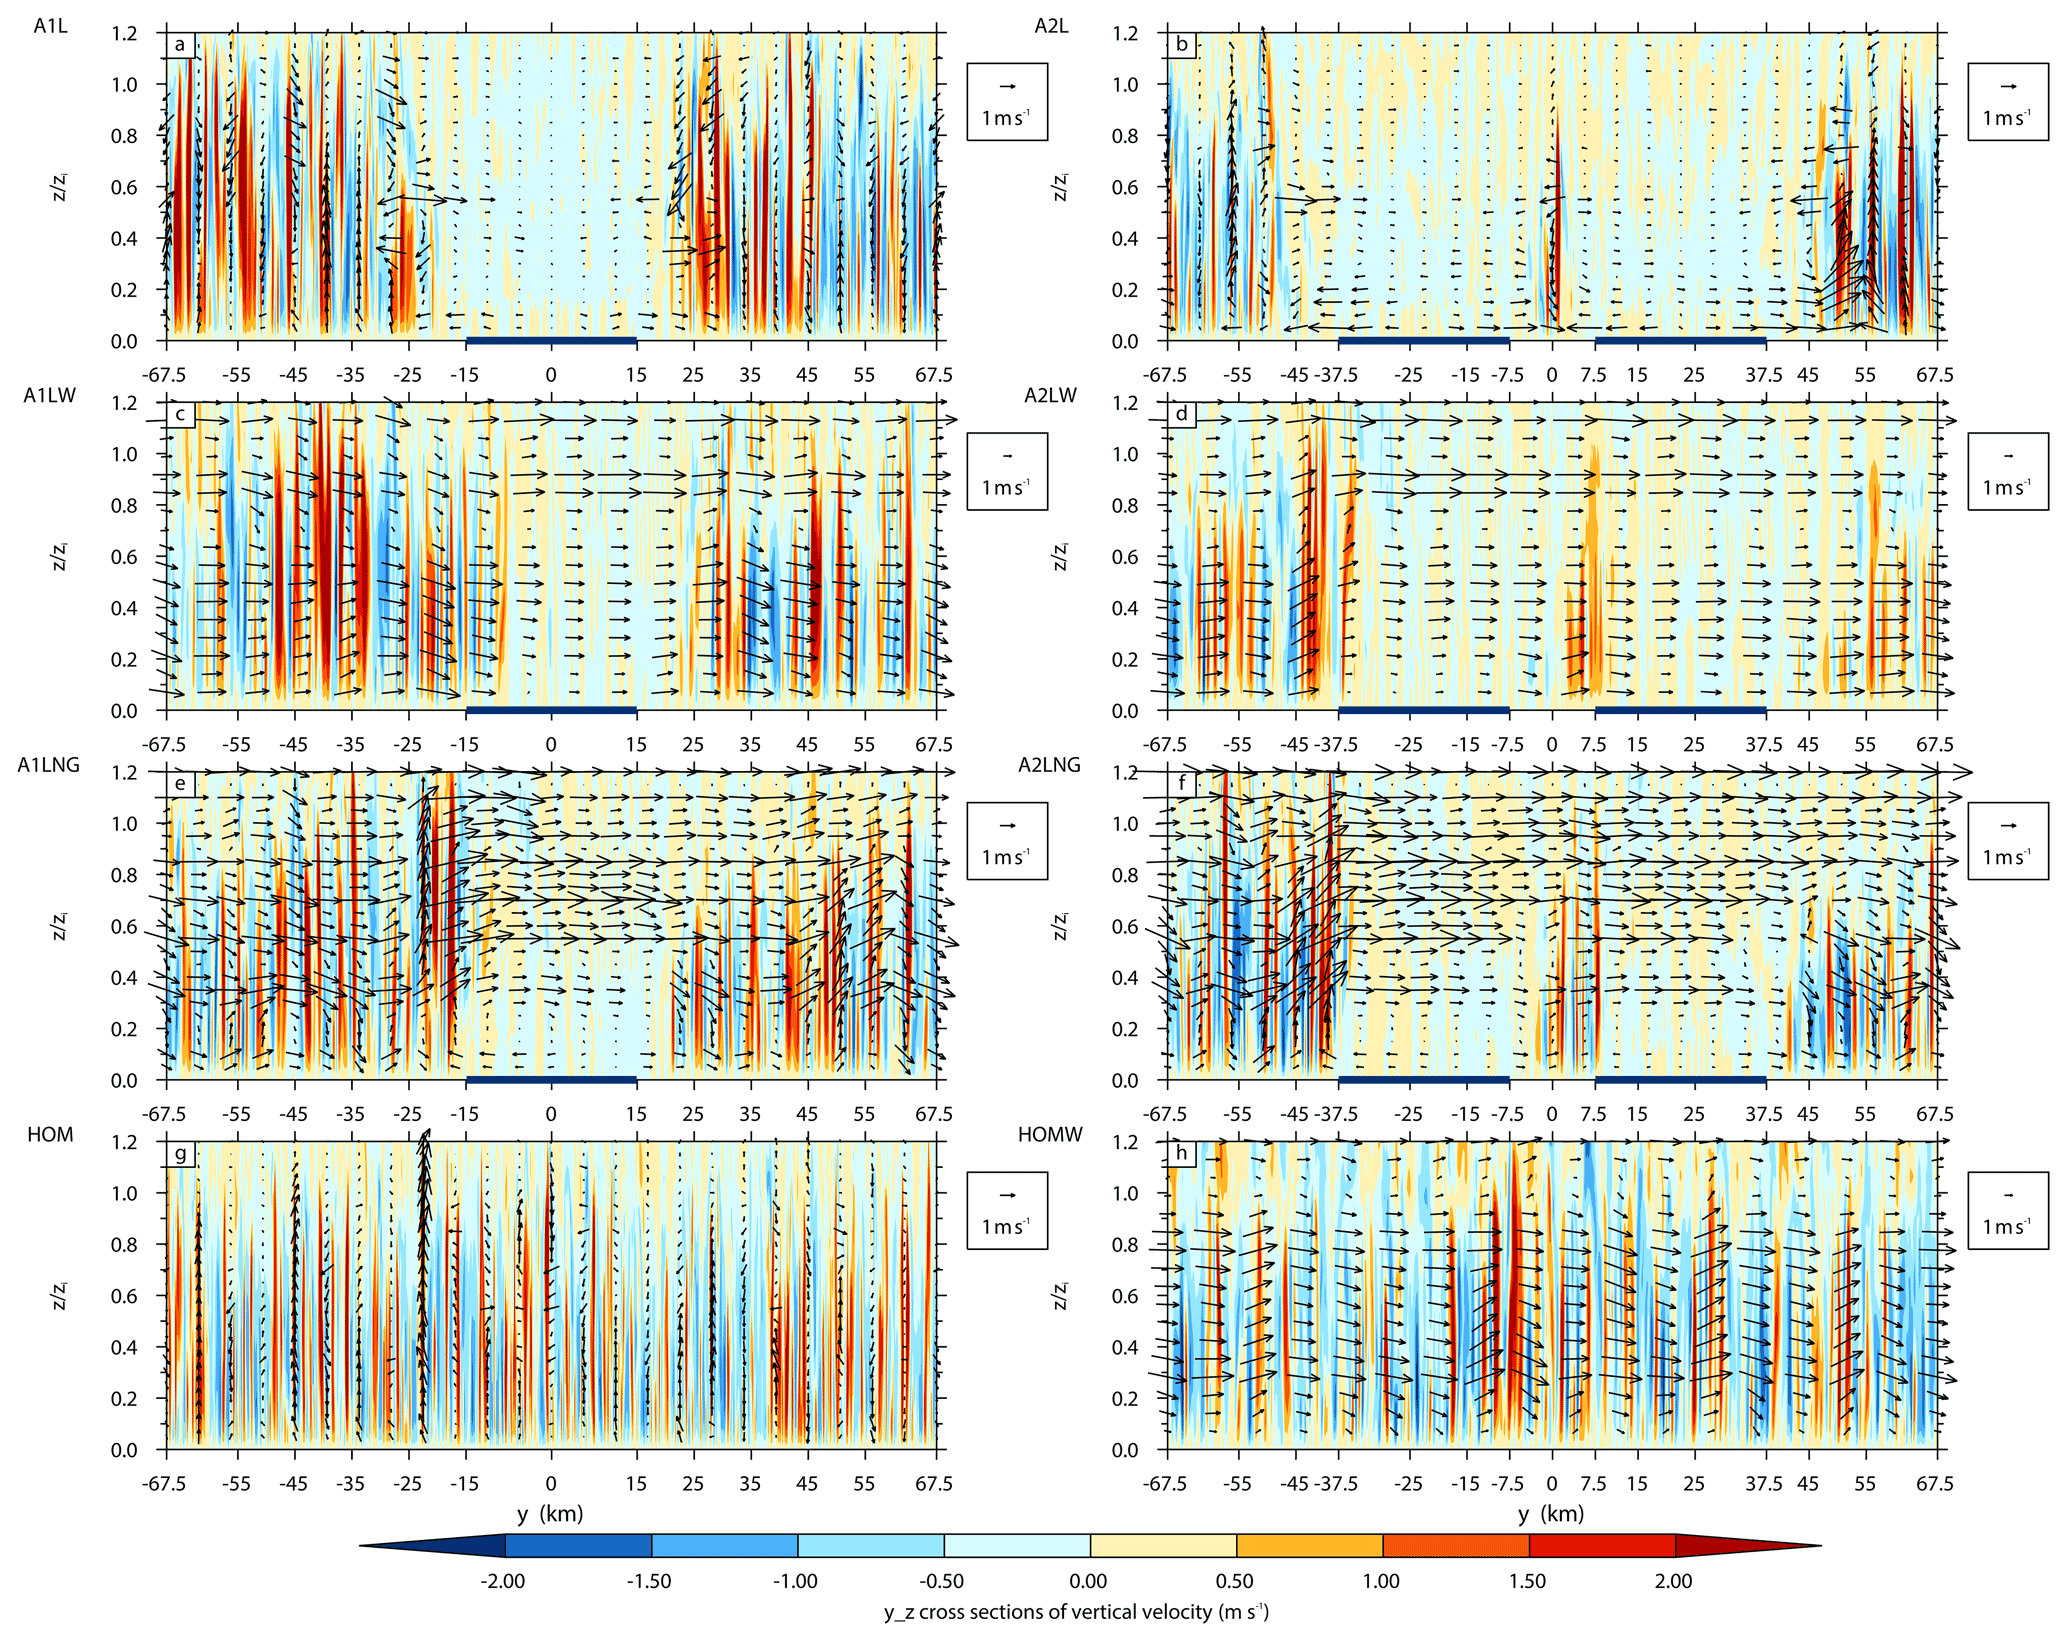
Figure 8Instantaneous y–z cross sections of the vertical velocity (m s−1) and wind vectors above the heterogeneous surfaces for runs without (a, b) and with (c, d) background wind, with the geostrophic wind removed (e, f), and the results over homogeneous surfaces for runs with (h) and without (g) background wind. The blue lines represent the lake patches.
3.3 Effects of patch-induced circulation on the turbulent intensity and heat flux
We used the phase-averaged method to decompose the contributions of the turbulent intensity and the heat flux from the patch-induced circulations and the background turbulence as well as to quantitatively analyze the heterogeneity-induced contribution to the turbulent intensity. For the variance of the velocity, the horizontal (Fig. 9a) and vertical (Fig. 9b) variances induced by the heterogeneity increase as the number of lake patches increases, and the horizontal variance is larger than the vertical variance. However, the background winds tend to decrease both the patch-induced (Fig. 9a and b) and total (Fig. 9e and f) turbulent intensity.
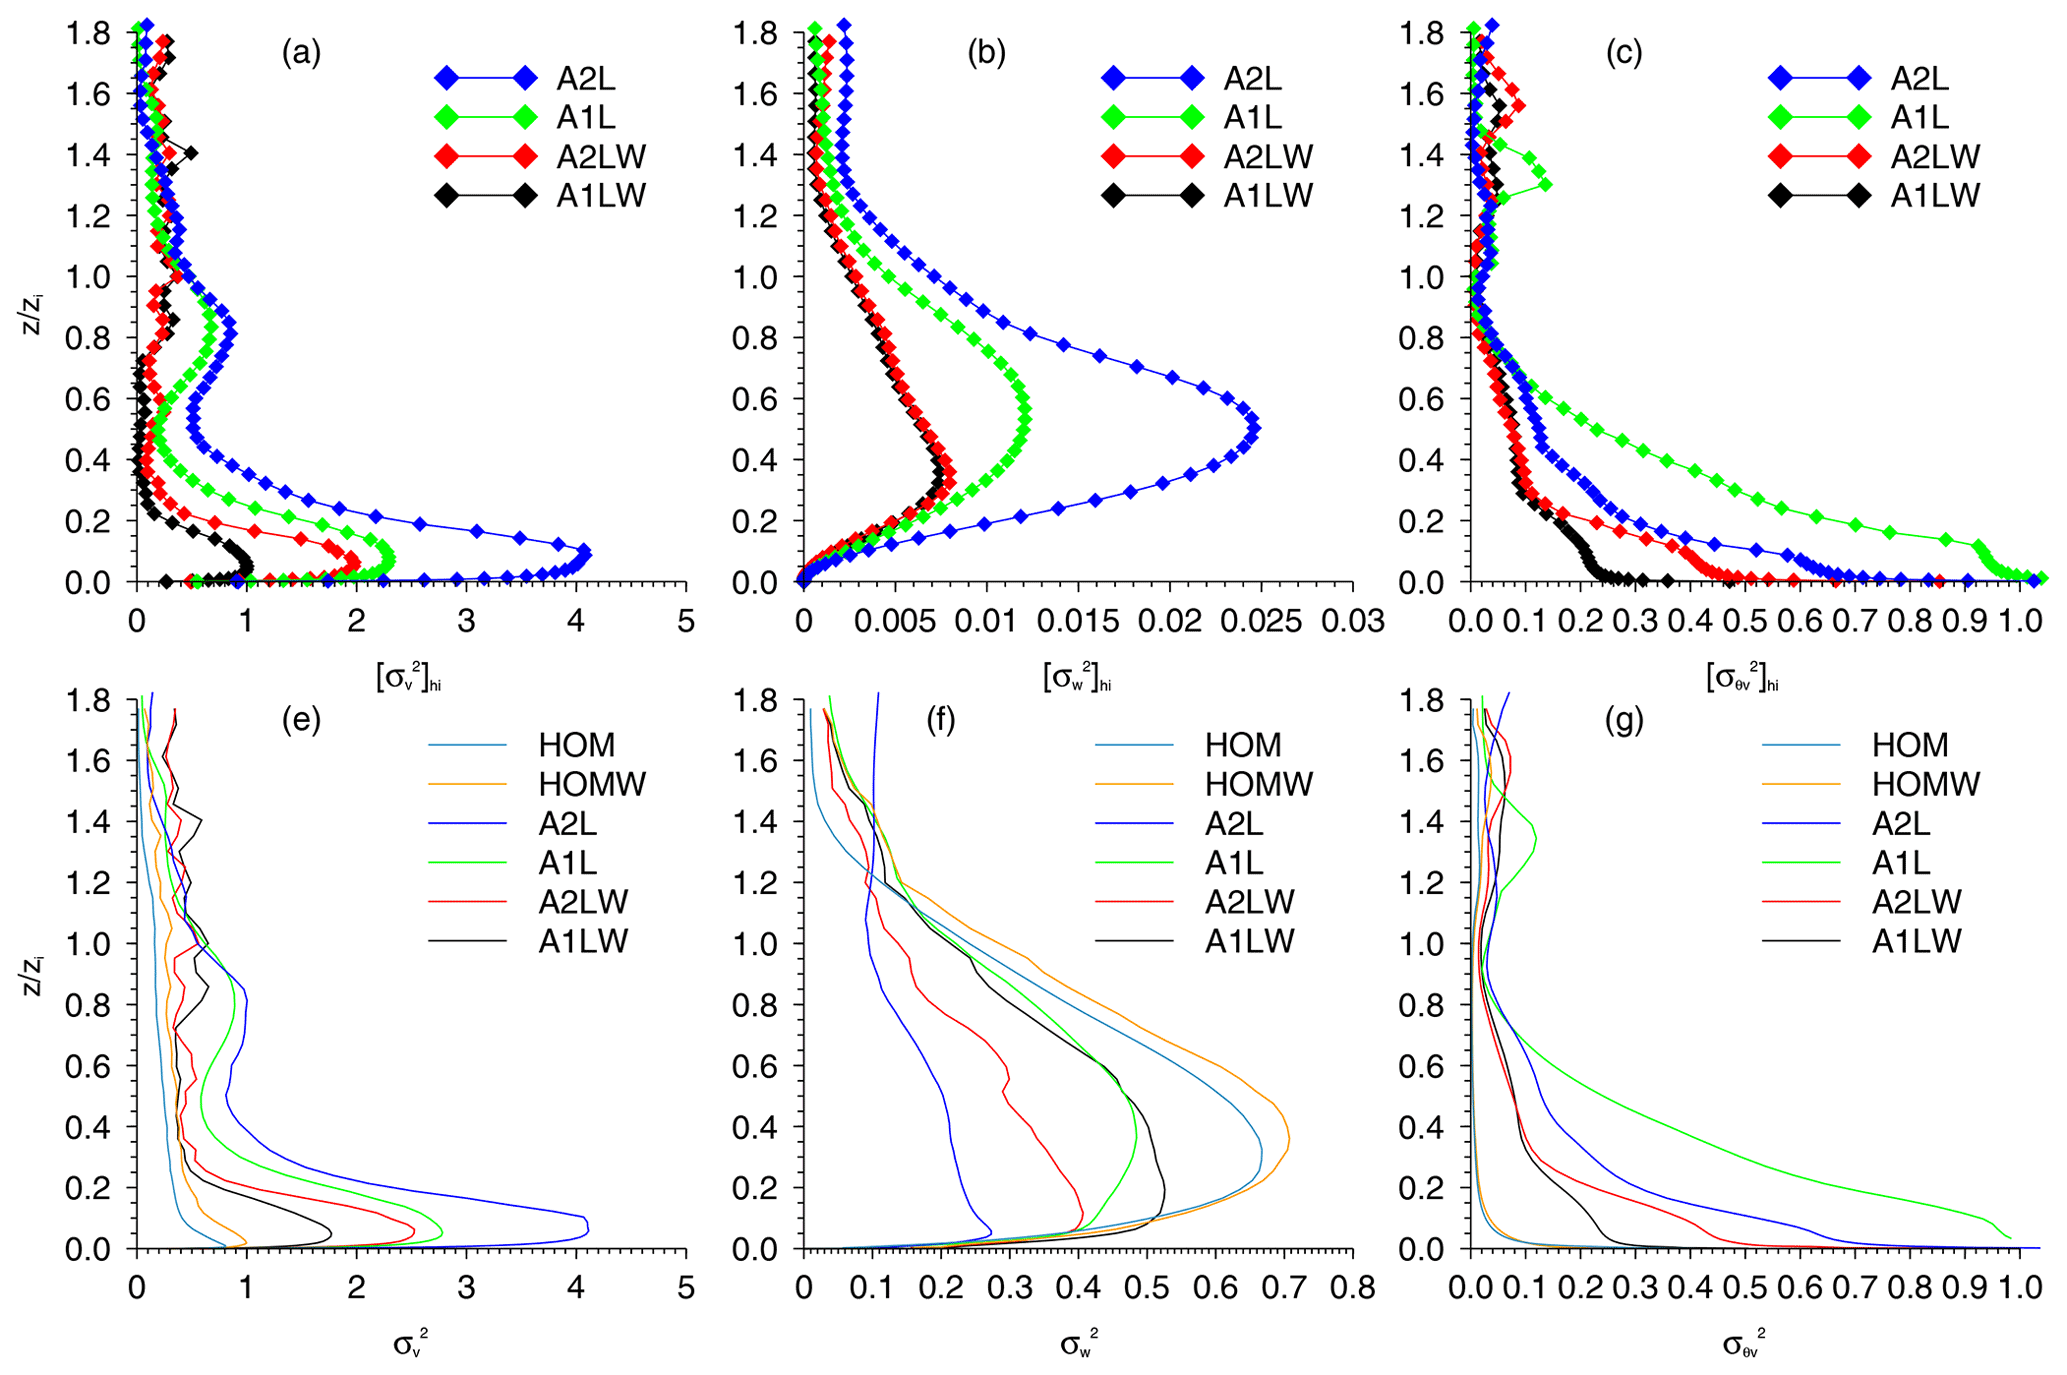
Figure 9Heterogeneity-induced (a–c) and total (e–g) dimensionless turbulence statistics for runs HOM, HOMW, A1L, A1LW, A2L, and A2LW. Shown are the profiles of the (a, e) v variance, (b, f) w variance, and (c, g) θ variance.
This also shows that a larger difference in the variances of the horizontal velocity occurs in the surface layer and gradually decreases with height (Fig. 9a and e), which means that the effects of the surface properties on the horizontal turbulence diminish with height in the CBL. In this respect, our results are similar to those found by Wang et al. (2011), Shao et al. (2013), and De Roo and Mauder (2018). The total horizontal turbulent intensity is mainly from the contribution of the patch-induced circulations and is larger than that of the homogeneous cases (Fig. 9e), which tends to become stronger as the number of patches increases but becomes weaker as the total vertical turbulent intensity increases (Fig. 9f, same as in the cases with balanced surface fluxes). It should be noted that the contribution of the patch-induced circulations to the vertical velocity variance is no more than 10 % (Fig. 9b and f), which implies that the background turbulence contributes more to the fluctuations in the vertical velocity than to those in the horizontal velocity. Figure 9c and g show that the patch-induced motions make the largest contribution to the variances of the potential temperature. However, the background wind decreases the variances of the potential temperature and decreases the impact of the surface heterogeneity on the variances of the potential temperature.

Figure 10(a) Area-averaged total turbulent heat flux (solid lines) and (b) heterogeneity-induced turbulent heat flux (dashed lines). The background turbulence (lines with diamond symbols) of heat flux over the grassland (c) and lake patches (d).
Using the same method, we analyzed the contributions of the patch-induced and background turbulence to the heat flux. Figure 10a shows that as the number of lake patches increases, the area-averaged total heat flux decreases in both the mixed and entrainment layers, and the balanced surface heat flux cases exhibit similar variations (see Fig. S6 in the Supplement). The patch-induced transport of the heat flux increases as the number of lake patches increases (Fig. 10b). The patch-induced motions contribute up to 80 % of the heat flux in run A2L, which has unbalanced surface fluxes (Fig. 10b) and 61 % in run A2LC which has balanced surface fluxes (see Fig. S6). It should also be noted that the background wind tends to decrease the heat flux transport over the heterogeneous surfaces. As is shown in Fig. 10c and e, the contribution of the background turbulence to the local heat flux is larger over the region outside of the lake patches than over the patches. Notice that the minimum heat flux (Fig. 10d, at about 0.3zi) is in the magnitude so strong as it is close to the surface (0.1zi). It probably contributes to the local maximum wind speed. We hope that the results of our analysis of the contributions of the heterogeneity-induced circulation and background turbulence to the turbulence intensity and the heat flux over a heterogeneous surface will provide a basis for further studies of the local energy and mass transport in the SRYR over the TP.
3.4 Turbulence in the surface layer
The frictional velocity (u∗) is a critical parameter in the turbulence exchange near the surface, and it plays an important role in the transport of momentum in the boundary layer. Patil et al. (2016) reported that the frictional velocity increases with wind speed under lower wind speed conditions in the surface layer. Thus, we focused on the variations in the wind speed (Fig. 11a and b) and Reynolds stress (Fig. 11c and d) in the horizontal direction below 200 m in order to investigate the effects of the patch-induced motions on the momentum flux in the surface layer for various background wind. It was found that the inland extension of the patch-induced divergent flows reached about 25 km with no background wind (yellow curves in Fig. 11a and b). The speed of the divergent winds increases from the lake patches to the outside and increases with height below 200 m with and without background wind. The wind speeds decrease rapidly (4.0 m s−1) within 10 km along with the wind blowing from west of the lake patches to east of the lake patch, and then, the wind speeds increase steadily (blue curves in Fig. 11a and b). The changes in the surface winds and surface properties have significant effects on the turbulent momentum flux. Figure 11c and d show that the transport of the momentum flux is smaller over the heterogeneous surface. The consistent variations in the wind speeds and the turbulent stresses illustrate that the lake patches alter the spatial distribution of the turbulent stress, which would further affect the surface wind speeds, especially over the land–lake boundary regions. Moreover, the potential temperature (Fig. 11e and f) and the sensible heat flux (Fig. 11 and h) increase abruptly from the lake patch to the grass patch (e.g., from y=15 km to y=25 km in Fig. 11e), which indicates the formation of the TIBL.
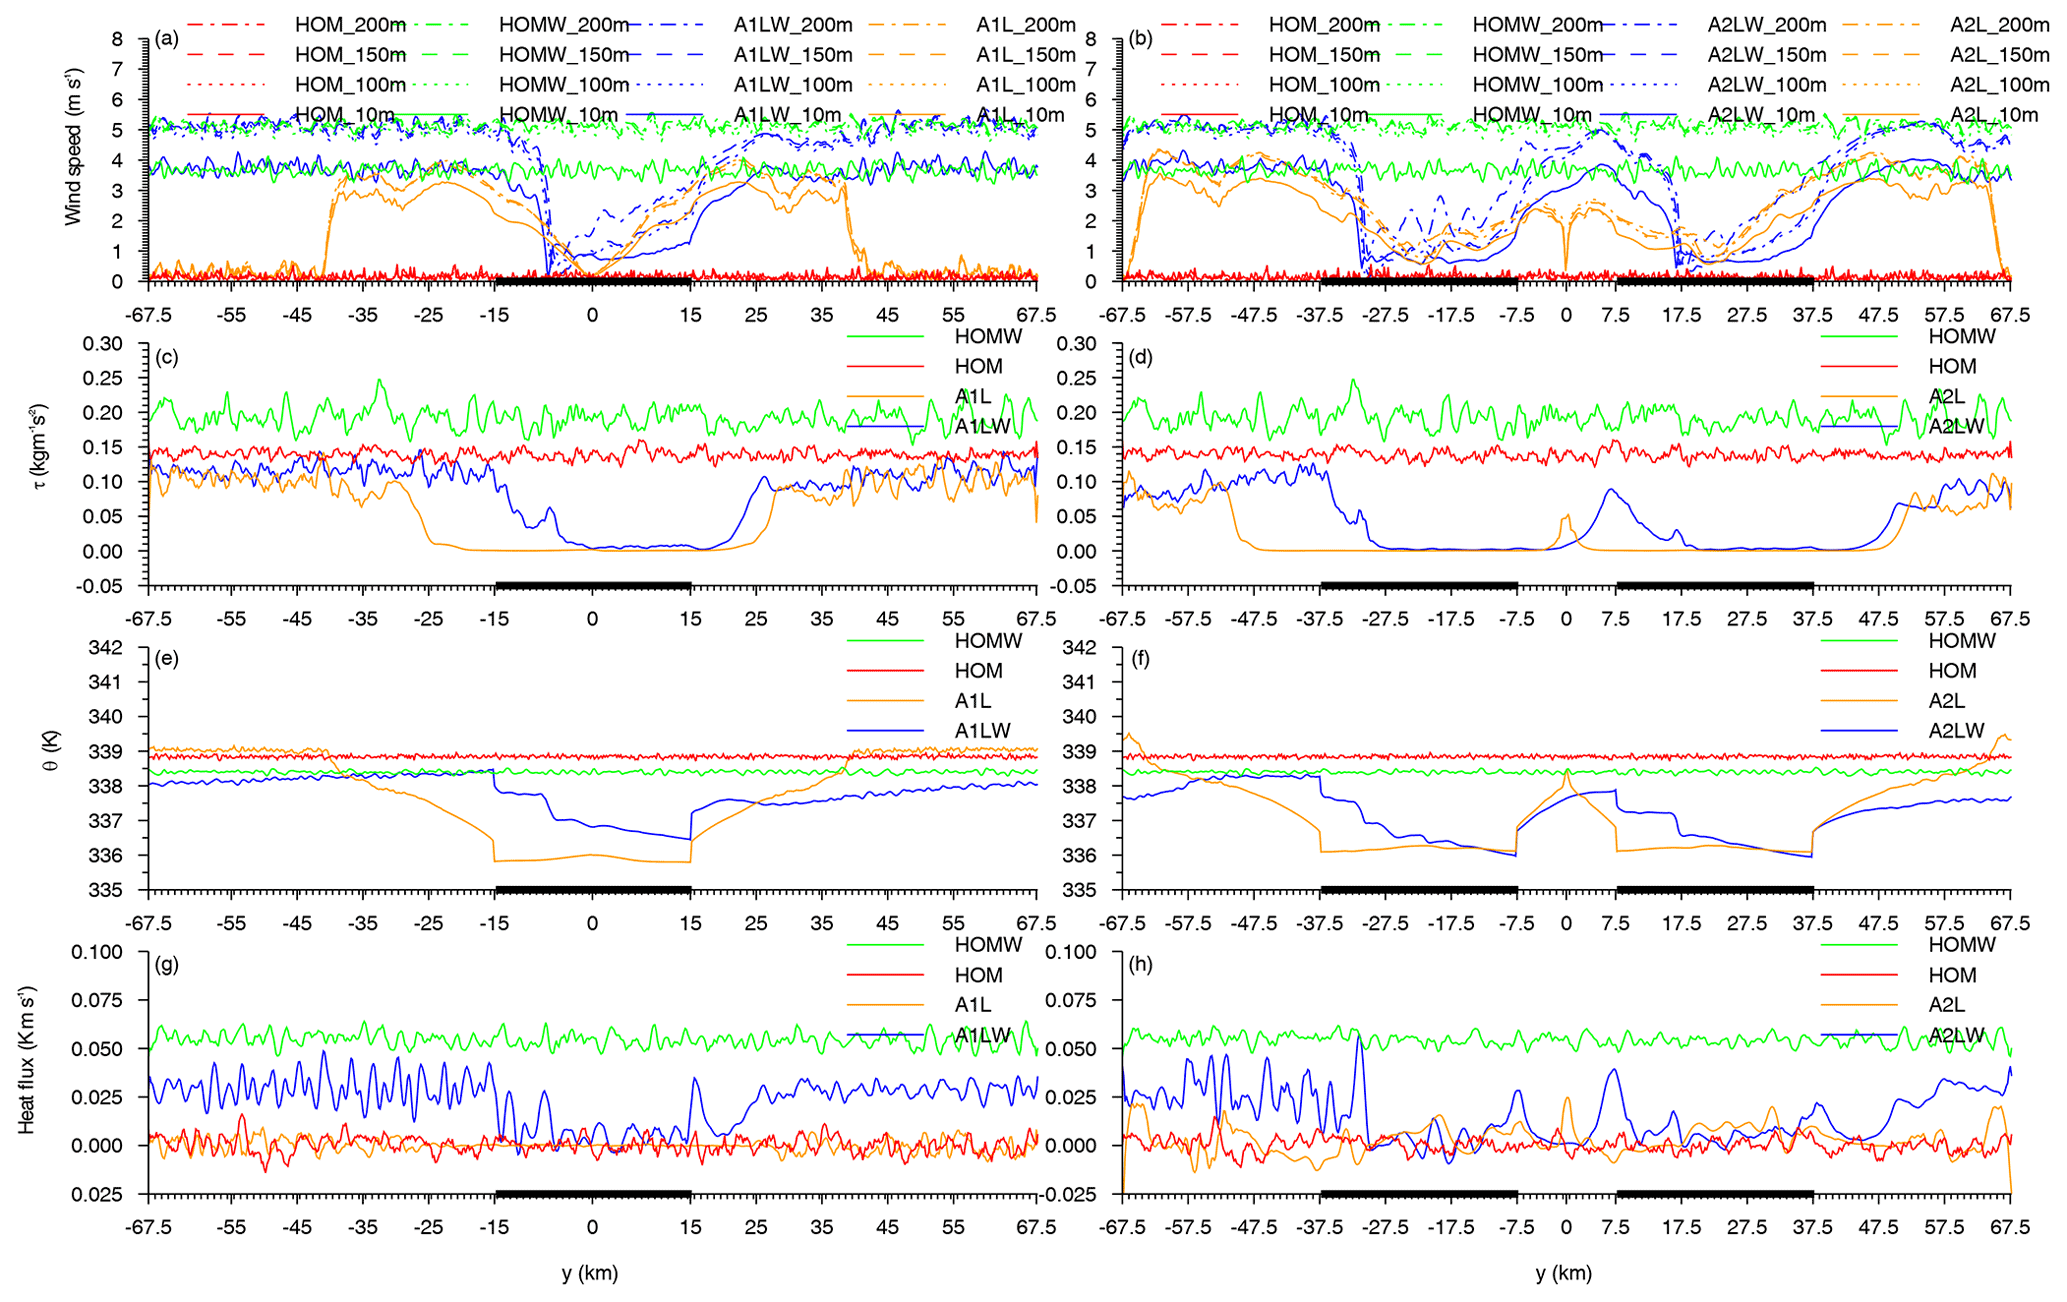
Figure 11Variations in the wind speed (a, b), Reynolds stress (c, d), potential temperature (e, f), and heat flux (g, h) in the horizontal direction below 200 m for the cases with (blue and green lines) and without (yellow and red lines) background wind over homogeneous (red and green lines) and heterogeneous (blue and yellow lines) surfaces. Thick black lines represent the lake patches.
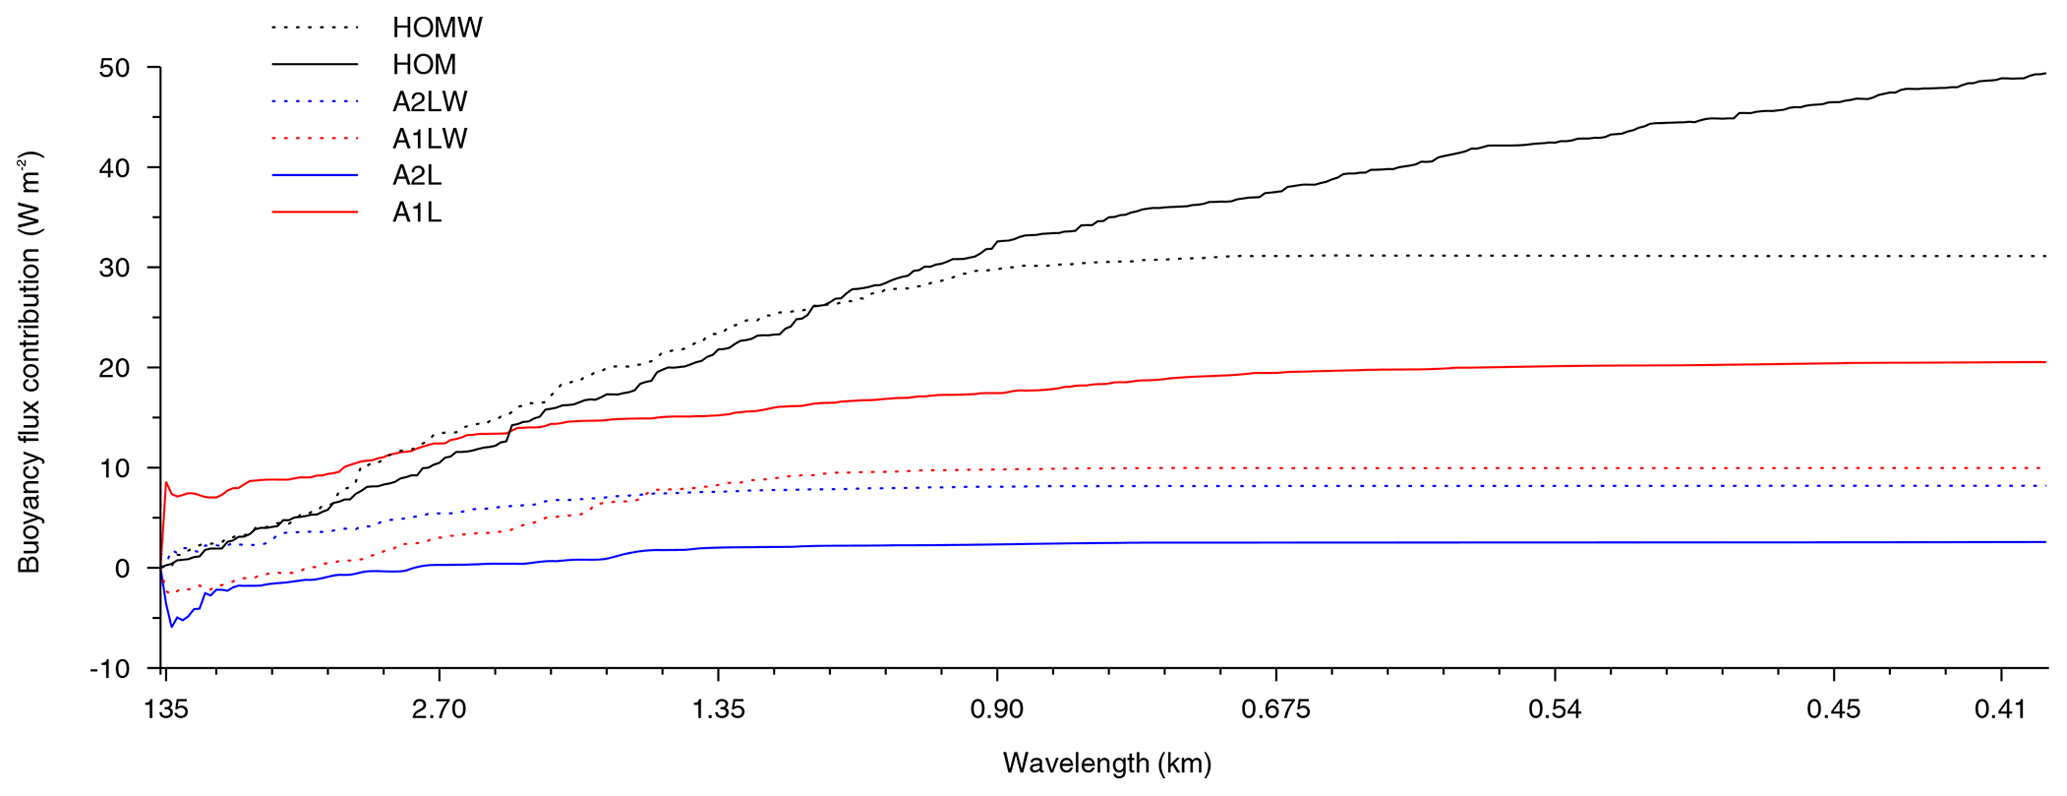
Figure 12The cumulative contribution of the buoyancy flux of all wavelength (km) at a height of 50 m for runs HOM, HOMW, A1L, A2L, A1LW, and A2LW.
In order to quantify the contributions of the buoyancy fluxes, due to the different scales of the eddies, we calculated the ogives, which are the running integrals of the cospectral densities (Friehe et al., 1991), and we used these values to show the cumulative contribution to the fluxes of all of the wavelengths (Brooks and Rogers, 2000). The ogive curves (Fig. 12) show that the small eddies make a significant contribution to the buoyancy fluxes over the homogeneous surfaces with no background wind (solid black line). The background wind increases the buoyancy flux for wavelengths larger than about 1.1 km and decreases it for smaller wavelengths based on a comparison of cases HOM (solid black line) and HOMW (black dotted line). The above results confirm that the heat transport is enhanced by the large eddies but is weakened by the small eddies, especially under the control of the background wind. The buoyancy flux for a wavelength larger than about 2.2 km makes a greater contribution in the case with one lake patch without background wind (solid red line). The buoyancy fluxes for wavelengths of greater than 2.7 km are transported downward for the case with two lake patches. For the case with one lake patch, the background wind tends to decrease the transport of the buoyancy flux for larger wavelengths near the surface (red dotted line) due to the stronger horizontal wind (Fig. 7d), and they help to transport the buoyancy fluxes downward for wavelengths larger than 3.3 km. However, for the case with two lake patches, the background wind causes the large eddies to transport the buoyancy fluxes upward. Thus, increasing the number of lake patches leads to more patch-induced motions, but this does not tend to enhance the ability of the wind to transport heat. It is concluded that slightly more of the buoyancy flux of the case with one lake patch is transported by the small eddies with wavelengths of less than 1.5 km compared with the case with two lake patches and background wind conditions (red and blue dotted lines).
3.5 The characteristics of the boundary-layer turbulence in the entrainment layer
The LES study conducted by Matthias et al. (2014) found that there is increased entrainment from the more strongly heated surface patch cases compared to the homogeneous cases, and the impact of the heterogeneity on entrainment vanishes due to horizontal mixing if the mean flow is aligned perpendicular to the border between the differentially heated patches. To investigate the effects of the thermal properties of the heterogeneous surface and the background wind on the turbulence in the entrainment layer, the characteristics of the heat flux in the entrainment layer were analyzed. Our simulated results show that the downward transport of the heat flux decreases as the number of lake patches increases in the entrainment layer for both the wind and no wind cases (Figs. 4d and 10a), which is also true in the balanced heat flux runs.
Table 3The maximum and minimum vertical velocities at the top of the boundary layer in cases A1LW, A2LW, A1LWC, A2LWC, A1LNG, A2LNG, A1L, A2L, A1LC, A2LC, HOM and HOMW.
By comparing the maximum and minimum vertical velocities at the top of the boundary layer (Table 3), we found that the convective intensity of the entrainment layer in the case with two lake patches and no wind fields is stronger, but it is weakened by the background wind. However, it decreases as the number of lake patches increases in the balanced heat flux cases (A1LC and A2LC), corresponding to a smaller TKE (Table 2) and total turbulent intensity (Fig. 9f). Huang et al. (2009) pointed out that an appropriate surface heat flux and background wind maintain the convective roll, and our simulations demonstrate this roll-like convection (see Fig. S7 in the Supplement), which is mainly induced by the persistence of the background turbulence with stronger geostrophic winds of 7–11 m s−1 (black lines in Fig. 2g). However, Maronga and Raasch (2013) found that a higher wind speed of 6 m s−1 generates convective rolls derived from the secondary circulation over a complex heterogeneous surface.
In addition, the boundary-layer variables (including the vertical velocities, virtual potential temperatures, and water vapor mixing ratios) in the entrainment layer are also subject to the effects of the surface heterogeneity. Figure 13 shows the joint distribution of the vertical velocities and the virtual potential temperatures, as well as the vertical velocities and water vapor mixing ratios. Comparing to the homogeneously heated cases, the increased downdrafts mainly occur over the lake patches, and they carry more warm, dry air down from the free atmosphere (Fig. 13a, b, g, and h), which is due to the convergent airflow caused by the patch-induced circulations at the top of the CBL. This effect is much more evident in the case with two lake patches, but it is weakened by the gradually strengthening background wind (except Fig. 13a, b, g, and h). We obtained the same results for the balanced cases. In particular, colder and moister air exists in the entrainment layer in the cases with background wind (A1LWC and A2LWC).
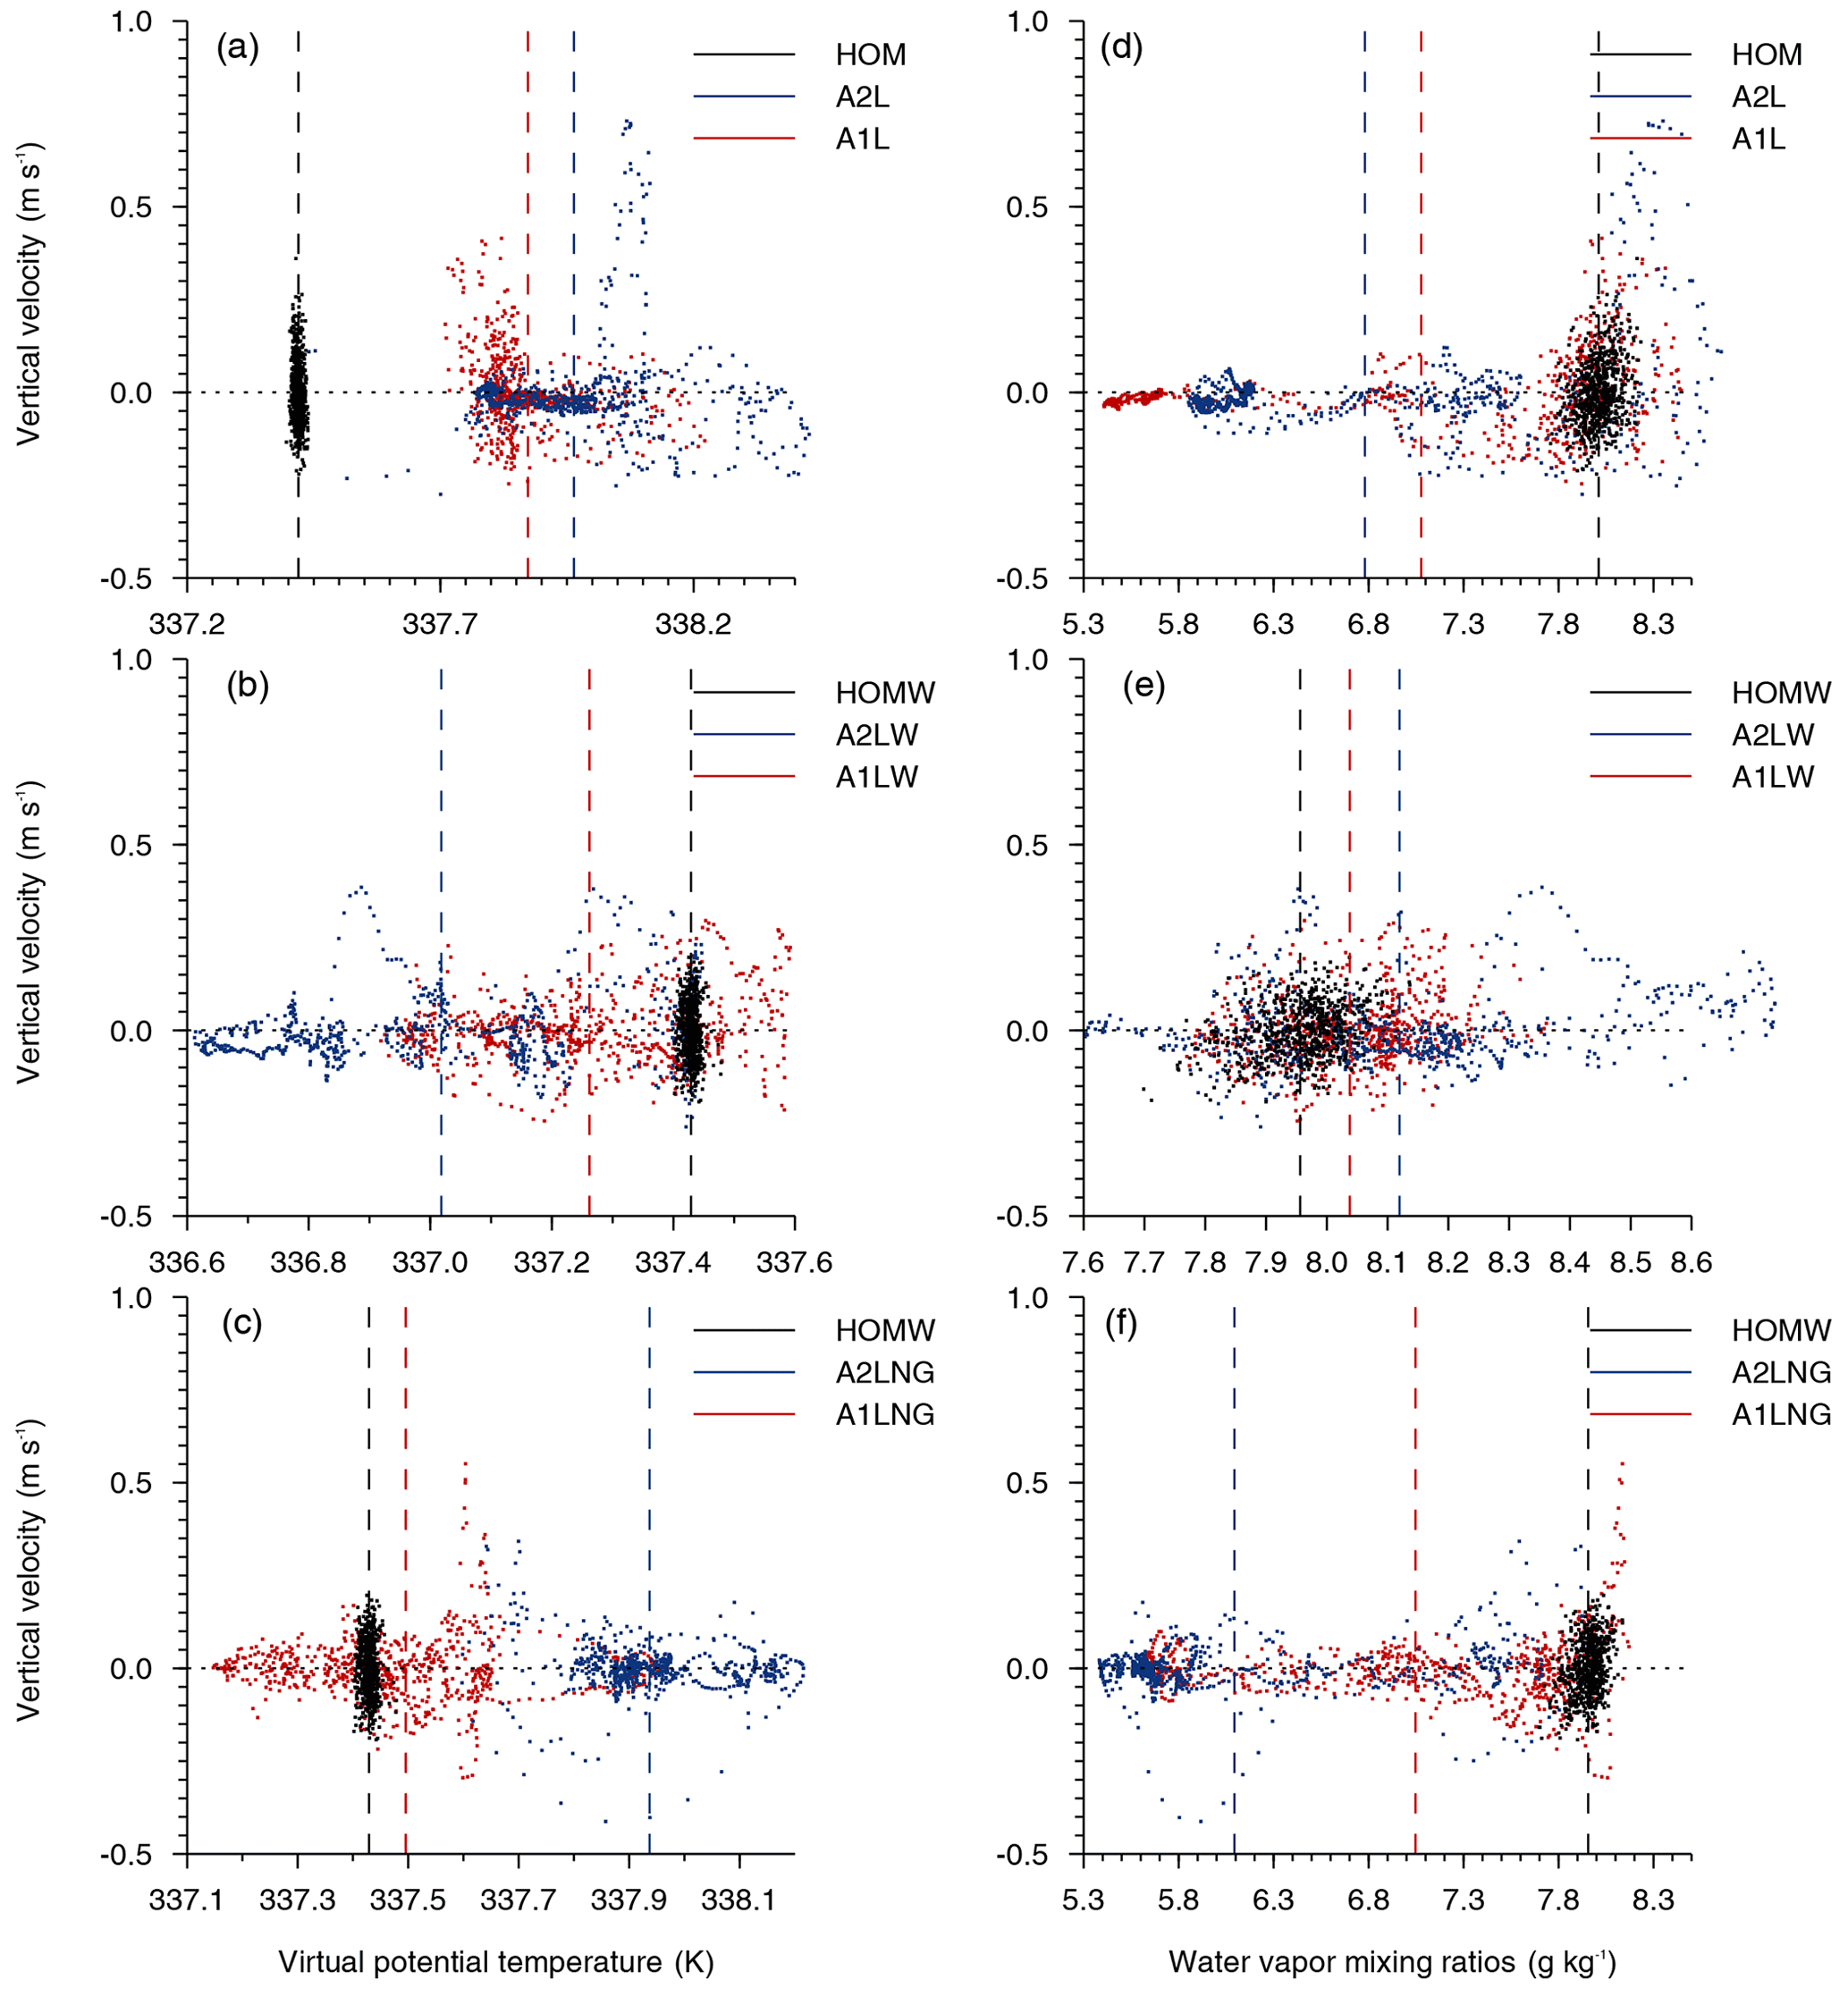
Figure 13The joint vertical velocities, virtual potential temperatures (a–c), and water vapor mixing ratios (d–f) at the top of the CBL for the homogeneous runs (black dot) and heterogeneous runs (red for one lake and blue for two lakes). The black dotted lines represent the mean vertical velocity; the black, red, and blue dashed lines show the mean virtual potential temperatures and water vapor mixing ratios for the homogeneous run, one-lake run, and two-lake run, respectively.
The downdrafts and divergent zonal wind in the two lakes area obtained from the ERA-Interim reanalysis data indicate the existence of a lake breeze in the SRYR. Ten runs of the 1D strip-like distribution of the surface heat flux and two homogeneous runs based on the observations made during the summer of 2012 in the Ngoring Lake basin were conducted in order to investigate the effects of the patch-induced circulations on the boundary-layer turbulence and its energy transport at the lake–air and grass–air interfaces, and the influence of the background wind was also considered.
The thermodynamic heterogeneity of the surface is conducive to deepening the mixed layer, thus increasing the CBL height and enhancing the TKE when there are no background winds. The background wind brings shear, resulting in an excessively thick entrainment layer, which inhibits the growth of the CBL and reduces the effects of the heterogeneous surface on the TKE. The distribution of the TKE over the heterogeneous surface is consistent with the patch-induced circulations described by Avissar and Schmidt (1998). In addition, the enhanced effects by surface heat anomaly on the TKE are far lower in the cases with an balanced surface heat flux. By analyzing the buoyancy and shear production terms in the TKE budget equation and separating the contribution of the resolvable-scale (RES) and subgrid-scale (SGS) eddies, we found that the contributions of the wind shear to the TKE from the SGS eddies are considerable in the CBL (below 0.9zi) over a heterogeneous surface. The patch-induced circulations reduce the modeled mean wind speed. The clear mixed layer is shown by the wind and virtual potential temperature profiles for the homogeneous run, while the stable stratification of wind profiles for the heterogeneous simulations are probably caused by the process of the TIBL. We obtained the same conclusion as Kang and Lenschow (2014); that is, the patch-induced circulations become indistinguishable under background wind conditions, and the background wind also weakens the convective intensity.
Then, we conducted a phase-averaged analysis to separate the contributions of the turbulent intensity and the transport of the total heat flux from those of the patch-induced circulations and the background turbulence field. The patch-induced turbulent intensity increases with increasing lake patches. It mainly contributes to the horizontal turbulent intensity and the potential temperature variance, while it contributes no more than 10 % to the vertical turbulent intensity, of which the background turbulence contributes the most. The background wind weakens the patch-induced and horizontal turbulent intensities but strengthens the vertical turbulent intensity. The contribution of the patch-induced heat flux was up to 80 % in the unbalanced cases and 60 % in the balanced cases. The background turbulence made a larger contribution to the heat flux over the outside of patches, which have a stronger surface heat flux than that over the lake patches. The background wind also inhibits the transport of the heat flux.
To understand the effects of the patch-induced motions on the momentum flux in the surface layer under various background wind conditions, we focused on the variations in the wind speed and the Reynolds stress in the horizontal direction below 200 m. Without background wind, the inland extent of the patch-induced flows was about 25 km. When the background wind flowed into the lake patches, they decreased by 4.0 m s−1 within about 10 km and increased steadily when flowing out of the patches. The synchronized variations in the wind speed and momentum flux in the horizontal direction illustrate that the lake patches alter the spatial distribution of the turbulent stress, which further affects the surface wind speeds, especially over the land–lake boundary regions. We also analyzed the cumulative contribution of eddies with different scales to the buoyancy flux near the surface. It was found that without background wind, the buoyancy flux is transmitted upward by the eddies with larger wavelengths for the case with one lake patch, while there is a negative buoyancy flux in the case with two lake patches. Thus, increasing the number of lake patches leads to more patch-induced motions, which do not tend to enhance the heat transport ability. The background wind promotes the opposite results.
In the entrainment layer, in contrast to Matthias et al. (2014), who found that the entrainment increased for the stronger heated surface patch cases compared to the homogeneous case, we found that the entrainment flux decreases as the number of lake patches increases. For the unbalanced cases, the convective intensity increases as the number of lake patches increases, but the background wind weakens it. For the balanced cases, the convective intensity weakens as the number of lake patches increases, corresponding to a smaller TKE and total turbulent intensity. In this study, whether the convective rolls persist mainly depended on the background turbulence field with a higher geostrophic wind of 7–11 m s−1, while Maronga and Raasch (2013) reported a higher wind speed of 6 m s−1. As the number of lake patches increases, the increased downdrafts are mainly located over the lake patches, and they carry more warm, dry air down from the free atmosphere in both the balanced and unbalanced cases. The background wind weakens this effect even when there is cooler, moister air in the entrainment layer in the balanced cases.
Our study provides ideal simulations of the boundary-layer turbulence over the heterogeneous surface in the SRYR. It mainly focused on the influences of the heterogeneous distribution of the surface heat flux and the background wind. In the future, we plan to conduct further research that will take into consideration the topography and additional physical processes to provide a reference for the study of the energy and water exchange processes over the complex surface of the SRYR.
The code can be accessed by contacting Yunshuai Zhang (zhangysh13@lzu.edu.cn).
The data presented in the paper can be accessed by contacting Yunshuai Zhang (zhangysh13@lzu.edu.cn).
The supplement related to this article is available online at: https://doi.org/10.5194/acp-21-15949-2021-supplement.
QH and YM had the original idea of the study. CW and ZL provided the observation data. YZ and YC conducted model simulation. YZ and YC interpreted the data and plotted the figures. YZ wrote the article with contributions from all the co-authors.
The contact author has declared that neither they nor their co-authors have any competing interests.
Publisher's note: Copernicus Publications remains neutral with regard to jurisdictional claims in published maps and institutional affiliations.
Thanks to the Zoige Plateau Wetland Ecosystem Research Station, Chinese Academy of Sciences, for the field observation data; this study is supported by the Science and Technology Plan of Gansu Province (20JR10RA070). We also thank the three anonymous reviewers for helpful comments during ACP discussions.
This research has been supported by the National Natural Science Foundation of China (grant nos. 91837208 and 41775013) and by the Second Tibetan Plateau Scientific Expedition and Research Program (STEP) (grant nos. 2019QZKK0604 and 2019QZKK0103).
This paper was edited by Stefano Galmarini and reviewed by three anonymous referees.
Avissar, R. and Schmidt, T.: An Evaluation of the Scale at which Ground–Surface Heat Flux Patchiness Affects the Convective Boundary Layer Using Large-Eddy Simulations, J. Atmos. Sci., 55, 2666–2689, https://doi.org/10.1175/1520-0469(1998)055<2666:AEOTSA>2.0.CO;2, 1998.
Biermann, T., Babel, W., Ma, W. Q., Chen, X. L., Thiem, E., Ma, Y. M., and Foken, T.: Turbulent flux observations and modelling over a shallow lake and a wet grassland in the Nam Co basin, Tibetan Plateau, Theor. Appl. Climatol., 116, 301–316, https://doi.org/10.1007/s00704-013-0953-6, 2014.
Brierley, G. J., Li, X., Cullum, C. and Gao, C. (Eds.): Landscape and Ecosystem Diversity, Dynamics and Management in the Yellow River Source Zone, Springer International Publishing, Switzerland, 2016.
Brooks, I. M. and Rogers, D. P.: Aircraft observations of the mean and turbulent structure of a shallow boundary layer over the Persian Gulf, Bound.-Lay. Meteorol., 95, 189–210, https://doi.org/10.1023/A:1002623712237, 2000.
Brown, A. R., Derbyshire, S. H., and Mason, P. J.: Large-eddy simulation of stable atmospheric boundary layers with a revised stochastic subgrid model, Q. J. Roy. Meteor. Soc., 120, 1485–1512, https://doi.org/10.1002/qj.49712052004, 1994.
Chen, X., Añel, J. A., Su, Z. B., Torre, L. D. L., Kelder, H., Peet, J. V., and Ma, Y. M.: The Deep Atmospheric Boundary Layer and Its Significance to the Stratosphere and Troposphere Exchange over the Tibetan Plateau, PLoS ONE, 8, e56909, https://doi.org/10.1371/journal.pone.0056909, 2013.
Chen, X., Škerlak, B., Rotach, M. W., Añel, J. A., Su, Z. B., Ma, Y. M., and Li, M. S.: Reasons for the extremely high-ranging planetary boundary layer over the western Tibetan Plateau in winter, J. Atmos. Sci., 73, 2021–2038, https://doi.org/10.1175/JAS-D-15-0148.1, 2016.
Crosman, E. T. and Horel, J. D.: Sea and Lake Breezes: A Review of Numerical Studies, Bound.-Lay. Meteorol., 137, 1–29, https://doi.org/10.1007/s10546-010-9517-9, 2010.
Crosman, E. T. and Horel, J. D.: Idealized Large-Eddy Simulations of Sea and Lake Breezes: Sensitivity to Lake Diameter, Heat Flux and Stability, Bound.-Lay. Meteorol., 144, 309–328, https://doi.org/10.1007/s10546-012-9721-x, 2012.
De Roo, F. and Mauder, M.: The influence of idealized surface heterogeneity on virtual turbulent flux measurements, Atmos. Chem. Phys., 18, 5059–5074, https://doi.org/10.5194/acp-18-5059-2018, 2018.
Friehe, C. A., Shaw, W. J., Rogers, D. P., Davidson, K. L., Large, W. G., Stage, S. A., Crescenti, G. H., Khalsa, S. J. S., Greenhut, G. K., and Li, F.: Air-sea fluxes and surface layer turbulence around a sea surface temperature front, J. Geophys. Res., 96, 8593–8609, https://doi.org/10.1029/90JC02062, 1991.
Foken, T.: The parameterisation of the energy exchange across the air–sea interface, Dynam. Atmos. Oceans 8, 297–305, https://doi.org/10.1016/0377-0265(84)90014-9, 1984.
Foken, T., Matthias, M., Liebethal, C., Wimmer, F., Beyrich, F., Leps, J. P., Raasch, S., DeBruin, H. A. R., Meijninger, W. M. L., and Bange, J.: Energy balance closure for the LITFASS-2003 experiment, Theor. Appl. Climatol., 101, 149–160, https://doi.org/10.1007/s00704-009-0216-8, 2010.
Gray, M. E. B., Petch, J., Derbyshire, S. H., Brown, A. R., Lock, A. P., Swann, H. A., and Brown, P. R. A.: Version 2.3 of the Met.Office large eddy model: part II, Scientific documentation, Turbulence and Diffusion Note 276, UK Met Office (Exeter, UK), 2001.
Hadfield, M. G., Cotton, W. R., and Pielke, R. A.: Large-eddy simulations of thermally forced circulations in the convective boundary layer. Part I: A small-scale circulation with zero wind, Bound.-Lay. Meteorol., 57, 79–114, https://doi.org/10.1007/bf00119714, 1991.
Hadfield, M. G., Cotton, W. R., and Pielke, R. A.: Large-eddy simulations of thermally forced circulations in the convective boundary layer. Part II: The effect of changes in wavelength and wind speed, Bound.-Lay. Meteorol., 58, 307–327, https://doi.org/10.1007/bf00120235, 1992.
Honnert, R., Masson, V., and Couvreux, F.: A diagnostic for evaluating the representation of turbulence in atmospheric models at the kilometric scale, J. Atmos. Sci., 68 , 3112–3131, https://doi.org/10.1175/JAS-D-11-061.1, 2011.
Honnert, R., Efstathiou, G. A., Beare, R. J., Ito, J., Lock, A., Neggers, R., Plant, R. S., Shin, H. H., Tomassini, L., and Zhou, B.: The Atmospheric Boundary Layer and the “Gray Zone” of Turbulence: A Critical Review, J. Geophys. Res.-Atmos., 125, 13, https://doi.org/10.1029/2019JD030317, 2020.
Huang, Q., Marsham, J. H., Parker, D. J., Tian, W. S., and Tammy, W.: A Comparison of Roll and Nonroll Convection and the Subsequent Deepening Moist Convection: An LEM Case Study Based on SCMS Data, Mon. Weather Rev., 137, 350–365, https://doi.org/10.1175/2008MWR2450.1, 2009.
Jia, D., Wen, J., Ma, Y., Wang, X., and Lai, X.: The warm season characteristics of the turbulence structure and transfer of turbulent kinetic energy over alpine wetlands at the source of the yellow river, Meteorol. Atmos. Phys., 130, 1–14, https://doi.org/10.1007/s00703-017-0534-9, 2017.
Kang, S. L. and Lenschow, D. H.: Temporal evolution of low-level winds induced by two-dimensional mesoscale surface heat-flux heterogeneity, Bound.-Lay. Meteorol., 151, 501–529, https://doi.org/10.1007/s10546-014-9912-8, 2014.
Li, W. L., Lü, S. H., Fu, S. M., Meng, X. H., and Nnamchi, H. C.: Numerical simulation of fluxes generated by inhomogeneities of the underlying surface over the Jinta Oasis in Northwestern China, Adv. Atmos. Sci., 28, 887–906, https://doi.org/10.1007/s00376-010-0041-0, 2011.
Li, Z. G., Lyu, S. H., Ao, Y. H., Wen, L. J., Zhao, L., and Wang, S. Y.: Long-term energy flux and radiation balance observations over Lake Ngoring, Tibetan Plateau, Atmos. Res., 155, 13–25, https://doi.org/10.1016/j.atmosres.2014.11.019, 2015.
Li, Z. G., Lyu, S. H., Wen, L. J., Zhao, L., Ao, Y. H., and Wang, S. Y.: Effect of a cold, dry air incursion on atmospheric boundary layer processes over a high-altitude lake in the Tibetan Plateau, Atmos. Res., 185, 32–43, https://doi.org/10.1016/j.atmosres.2016.10.024, 2017.
Liu, G., Sun, J. N., and Yin, L.: Turbulence characteristics of the shear-free convective boundary layer driven by heterogeneous surface heating, Bound.-Lay. Meteorol., 140, 57–71, https://doi.org/10.1007/s10546-011-9591-7, 2011.
Liu, R., Liu, S. M., Yang, X. F., Lu, H., Pan, X. D., Xu, Z. W., Ma, Y. F., and Xu, T. R.: Wind dynamics over a highly heterogeneous oasis area: an experimental and numerical study, J. Geophys. Res., 123, 8418–8440, https://doi.org/10.1029/2018JD028397, 2018.
Liu, R., Sogachev, A., Yang, X., Liu, S., Xu, T., and Zhang, J.: Investigating microclimate effects in an oasis-desert interaction zone, Agr. Forest Meteorol., 290, 107992, https://doi.org/10.1016/j.agrformet.2020.107992, 2020.
Mahrt, L.: Surface Heterogeneity and Vertical Structure of the Boundary Layer, Bound.-Lay. Meteorol., 96, 33–62, https://doi.org/10.1023/a:1002482332477, 2000.
Maronga, B. and Raasch, S.: Large-eddy simulations of surface heterogeneity effects on the convective boundary layer during the litfass-2003 experiment, Bound.-Lay. Meteorol., 146, 17–44, https://doi.org/10.1007/s10546-012-9748-z, 2013.
Marsham, J. H., Parker, D. J., Grams, C. M., Johnson, B. T., Grey, W. M. F., and Ross, A. N.: Observations of mesoscale and boundary-layer scale circulations affecting dust transport and uplift over the Sahara, Atmos. Chem. Phys., 8, 6979–6993, https://doi.org/10.5194/acp-8-6979-2008, 2008.
Matthias, S., Maronga, B., Florian, H., and Siegfried, R.: On the Effect of Surface Heat-Flux Heterogeneities on the Mixed-Layer-Top Entrainment, Bound.-Lay. Meteorol., 151, 531–556, https://doi.org/10.1007/s10546-014-9913-7, 2014.
Moeng, C.-H.: A Large-Eddy-Simulation Model for the Study of Planetary Boundary-Layer Turbulence, J. Atmos. Sci., 41, 2052–2062, https://doi.org/10.1175/1520-0469(1984)041<2052:ALESMF>2.0.CO;2, 1984.
Mudassar, I., Wen, J., Wang, S. P., Tian, H., and Adnan, M.: Variations of precipitation characteristics during the period 1960-2014 in the source region of the Yellow River, China, J. Arid Land, 10, 388–401, https://doi.org/10.1007/s40333-018-0008-z, 2018.
Papangelis, G., Tombrou, M., and Kalogiros, J.: The Saharan convective boundary layer structure over large scale surface heterogeneity: A large eddy simulation study, Atmos. Res., 248, 105250, https://doi.org/10.1016/j.atmosres.2020.105250, 2021.
Patil, M. N., Waghmare, R. T., Dharmaraj, T., Chinthalu, G. R., Devendraa, S., and Meena, G. S.: The influence of wind speed on surface layer stability and turbulent fluxes over southern Indian peninsula station, J. Earth Syst. Sci., 125, 1399–1411, https://doi.org/10.1007/s12040-016-0735-5, 2016.
Patton, E. G., Sullivan, P. P., and Moeng, C. H.: The influence of idealized heterogeneity on wet and dry planetary boundary layers coupled to the land surface, J. Atmos. Sci., 62, 2078–2097, https://doi.org/10.1175/JAS3465.1, 2005.
Shao, Y. P., Liu, S. F., Schween, J. H., and Crewell, S.: Large-Eddy Atmosphere-Land-Surface Modelling over Heterogeneous Surfaces: Model Development and Comparison with Measurements, Bound.-Lay. Meteorol., 148, 333–356, https://doi.org/10.1007/s10546-013-9823-0, 2013.
Shen, L. D., Sun, J. N., Yuan, R. M., and Liu, P.: Characteristics of secondary circulations in the convective boundary layer over two-dimensional heterogeneous surfaces, J. Meteorol. Res.-PRC, 30, 944–960, https://doi.org/10.1007/s13351-016-6016-z, 2016.
Shen, S. H. and Leclerc, M. Y.: How large must surface inhomogeneities be before they influence the convective boundary layer structure? A case study, Q. J. Roy. Meteor. Soc., 121, 1209–1228, https://doi.org/10.1002/qj.49712152603, 1995.
Sommeria, G. and LeMone, M. A.: Direct testing of a three-dimensional model of the planetary boundary layer against experimental data, J. Atmos. Sci., 35, 25–39, https://doi.org/10.1175/1520-0469(1978)035<0025:DTOATD>2.0.CO;2, 1978.
Sullivan, P. P., Moeng, C., Stevens, B., Lenschow, D. H., and Mayor, S. D.: Structure of the Entrainment Zone Capping the Convective Atmospheric Boundary Layer, J. Atmos. Sci., 55, 3042–3064, https://doi.org/10.1175/1520-0469(1998)055<3042:SOTEZC>2.0.CO;2, 1998.
Tyagi, B. and Satyanarayana, A. N. V.: The Budget of Turbulent Kinetic Energy during Premonsoon Season over Kharagpur as Revealed by STORM Experimental Data, ISRN Meteorology, 2013, 1–11, https://doi.org/10.1155/2013/972942, 2013.
Wang, B. B., Ma, Y. M., Chen, X. L., Ma, W. Q., Su, Z. B., and Menenti, M.: Observation and simulation of lake–air heat and water transfer processes in a high-altitude shallow lake on the Tibetan Plateau, J. Geophys. Res., 120, 12327–12344, https://doi.org/10.1002/2015JD023863, 2015.
Wang, C., Tian, W. S., Parker, D. J., Marsham, J. H., and Guo, Z.: Properties of a simulated convective boundary layer over inhomogeneous vegetation, Q. J. Roy. Meteor. Soc, 137, 99–117, https://doi.org/10.1002/qj.724, 2011.
Wang, Y. J., Xu, X. D., Liu, H. Z., Li, Y. Q., Li, Y. H., Hu, Z. Y., Gao, X. Q., Ma, Y. M., Sun, J. H., Lenschow, D. H., Zhong, S. Y., Zhou, M. Y., Bian, X. D., and Zhao, P.: Analysis of land surface parameters and turbulence characteristics over the Tibetan Plateau and surrounding region, J. Geophys. Res.-Atmos., 121, 9540–9560, https://doi.org/10.1002/2016JD025401, 2016.
Wen, L. J., Lyu, S. H., Li, Z. G., Zhao, L., and Nagabhatla, N.: Impacts of the Two Biggest Lakes on Local Temperature and Precipitation in the Yellow River Source Region of the Tibetan Plateau, Adv. Meteorol., 2015, 10, https://doi.org/10.1155/2015/248031, 2015.
Wen, L. J., Lyu, S. H., Kirillin, G., Li, Z. G., and Zhao, L.: Air-lake boundary layer and performance of a simple lake parameterization scheme over the Tibetan highlands, Tellus A, 68, 31091, https://doi.org/10.3402/tellusa.v68.31091, 2016.
Xu, Z. W., Ma, Y. F., Liu, S. M., Shi, W. J., and Wang, J. M.: Assessment of the Energy balance closure under advective conditions and its impact using remote sensing data, J. Appl. Meteorol. Clim., 56, 127–140, https://doi.org/10.1175/JAMC-D-16-0096.1, 2016.
Zhang, W. C., Guo, J. P., Miao, Y. C., Liu, H., Song, Y., Fang, Z., He, J., Lou, M. Y., Yan, Y., Li, Y., and Zhai, P. M.: On the summertime planetary boundary layer with different thermodynamic stability in China: A radiosonde perspective, J. Climate, 31, 1451–1465, https://doi.org/10.1175/JCLI-D-17-0231.1, 2018.
Zhao, Y., Xu, X. D., Ruan, Z., Chen, B., and Wang, F.: Precursory strong-signal characteristics of the convective clouds of the Central Tibetan Plateau detected by radar echoes with respect to the evolutionary processes of an eastward-moving heavy rainstorm belt in the Yangtze River Basin, Meteorol. Atmos. Phys., 1–16, https://doi.org/10.1007/s00703-018-0597-2, 2018.
Zheng, D. H., Velde, R. V. D., Su, Z. B., Wang, X., Wen, J., Booij, M. J., Hoekstra, A. Y., and Chen, Y. Y.: Augmentations to the Noah Model Physics for Application to the Yellow River Source Area. Part II: Turbulent Heat Fluxes and Soil Heat Transport, J. Hydrometeorol., 16, 2677–2694, https://doi.org/10.1175/JHM-D-14-0199.1, 2015.
Zhou, Y., Li. D., Liu, H., and Li, X.: Diurnal variations of the flux imbalance over homogeneous and heterogeneous landscapes, Bound.-Lay. Meteorol., 168, 417–442, https://doi.org/10.1007/s10546-018-0358-2, 2018.