the Creative Commons Attribution 4.0 License.
the Creative Commons Attribution 4.0 License.
 | 25 Oct 2021
Improved gridded ammonia emission inventory in China
Baojie Li
Lei Chen
Weishou Shen
Jianbing Jin
Teng Wang
Pinya Wang
Yang Yang
Hong Liao
As a major alkaline gas in the atmosphere, NH3 significantly impacts atmospheric chemistry, ecological environment, and biodiversity. Gridded NH3 emission inventories can significantly affect the accuracy of model concentrations and play a crucial role in the refinement of mitigation strategies. However, several uncertainties are still associated with existing NH3 emission inventories in China. Therefore, in this study, we focused on improving fertilizer-application-related NH3 emission inventories. We comprehensively evaluated the dates and times of fertilizer application to the major crops that are cultivated in China, improved the spatial allocation methods for NH3 emissions from croplands with different rice types, and established a gridded NH3 emission inventory for mainland China with a resolution of 5 min × 5 min in 2016. The results showed that the atmospheric NH3 emissions in mainland China amounted to 12.11 Tg, with livestock waste (44.8 %) and fertilizer application (38.6 %) being the two main NH3 emission sources in China. Obvious spatial variability in NH3 emissions was also identified, and high emissions were predominantly concentrated in North China. Further, NH3 emissions tended to be high in summer and low in winter, and the ratio for the July–January period was 3.08. Furthermore, maize and rice fertilization in summer was primarily responsible for the increase in NH3 emissions in China, and the evaluation of the spatial and temporal accuracy of the NH3 emission inventory established in this study using the WRF-Chem and ground-station- and satellite-based observations showed that it was more accurate than other inventories.
- Article
(10045 KB) - Full-text XML
-
Supplement
(1889 KB) - BibTeX
- EndNote


Ammonia, a major form of reactive nitrogen, plays an important role in atmospheric chemistry, the ecological environment, and biodiversity (Sheppard et al., 2011; Zhang et al., 2018). As the major alkaline gas in the atmosphere, it can form (NH4)2SO4 and NH4NO3 with H2SO4 and HNO3 produced from the oxidation of SO2 and NOx, respectively, and contribute to the formation of secondary inorganic aerosols (SIAs), thereby increasing the concentration of PM2.5 (Fu et al., 2017). For example, in China, the contribution of agriculture-related NH3 emissions to SIA and PM2.5 is 29 % and 16 %, respectively (Han et al., 2020). This fine-particle formation has led to substantial health and economic costs (Paulot and Jacob, 2014).
Haze pollution occurs frequently, particularly in eastern China, and is characterized by an extremely high concentration of PM2.5, with a remarkably high proportion (20 %–60 %) of SIAs (Ding et al., 2016; Elser et al., 2016; Wang et al., 2016). The Chinese government has taken effective measures to control SO2 and NOx emissions, and a large number of studies have indicated that SO2 and NOx concentrations and emissions have decreased in recent years (Zheng et al., 2018; K. Li et al., 2019; Zhang et al., 2019). However, measures to reduce NH3 emissions are limited. Satellite retrievals have shown an increase in NH3 vertical column densities (VCDs) in recent years (Warner et al., 2017; Chen et al., 2020), and China has become a global “hotspot” for NH3 emissions and NH3 pollution (Liu et al., 2013; L. Liu et al., 2019). Such increases in NH3 concentrations may reduce the effectiveness of particle pollution control achieved via SO2 and NOx emission reduction (Wang et al., 2013; Fu et al., 2017). Therefore, to effectively control PM pollution and reduce SIA concentrations in China, strategies to reduce NH3 emissions are urgently required.
Recently, NH3 emission reduction has been proposed as a strategic option for mitigating haze pollution (M. X. Liu et al., 2019). Several organizations and researchers have established gridded NH3 emission inventories, such as the MEIC, PKU-NH3, MASAGE_NH3, EDGAR, and REAS (Streets et al., 2003; Paulot et al., 2014; Fu et al., 2015; Kang et al., 2016; Li et al., 2017a; Zhang et al., 2017, 2018; Crippa et al., 2020; Kurokawa and Ohara, 2020). Based on these studies, substantial progress has been made in the development of NH3 emission inventories. However, based on the results of previous studies, NH3 emissions in China have been estimated as 8.0–18.3 Tg/yr (Zhang et al., 2017; Kong et al., 2019), which is indicative of large uncertainties. Unlike SO2 and NOx, which primarily originate from industrial plants, NH3 mainly originates from agricultural activities, which are more difficult to evaluate. Of course, certain non-agricultural sources of NH3 are also important. For example, vehicular emissions contain both NH3 and NOx and may have a more effective pathway to particle formation, particularly in urban areas (Farren et al., 2020; Chang et al., 2016). The amount of NH3 emitted by the transportation sector has not been well quantified and is generally thought to be underestimated (Meng et al., 2017; Farren et al., 2020). Such uncertainty limits the accuracy of NH3 and PM concentration estimates simulated using atmospheric chemistry transport models. Fertilizer application and livestock waste were the largest contributors, accounting for more than 80% of total NH3 emissions (Zhang et al., 2017; Kang et al., 2016); thus, the improvement of NH3 emission inventories should primarily focus on these two sources (Zhao et al., 2020). To improve the NH3 emission inventory, several environmental factors, including wind speed, temperature, and soil pH, have been considered in some studies (Paulot et al., 2014; Zhang et al., 2018; Zhao et al., 2020). The mass-flow approach, which considers nitrogen transformation at different stages of manure management to improve NH3 emission inventories from livestock waste, has also been applied (Huang et al., 2012; Zhang et al., 2018).
Monthly variations in NH3 emissions are primarily caused by fertilizer application, according to previous studies (Huang et al., 2012; Zhang et al., 2018). However, fertilizer-application-related NH3 emission inventories need to be further improved for the following reasons. First, in most existing studies, spatial differences in the quantity of fertilizer application in different provinces were considered, but spatial variations with respect to the timing of fertilizer application were not, hence the uncertainty in the monthly rate of NH3 emissions. For example, with respect to winter wheat, in North China, basal dressing is usually conducted from late September to mid-October, while in the Yangtze River Delta region, it is usually conducted from late October to early November. Even in the same province, the difference in fertilizer application dates can be approximately 15 d. In most studies, fertilizer application dates were set to a specific month; however, this is not consistent with reality. Farmers in the same province usually apply fertilizers across months rather than in a specific month. Additionally, the temporal and spatial differences in fertilization dates are critical to the accuracy of the NH3 emission inventories. Second, there are significant differences in the spatial distribution of planted areas for different crops. This implies that different spatial proxies must be used for different crops. For example, in China, four rice types are cultivated, namely early, late, single-season, and middle rice, which cannot be allocated using the same spatial allocation method.
Therefore, in this study, we established a 2016 NH3 emission inventory for mainland China with a 5 min × 5 min resolution. To improve the accuracy of the emission inventory, we focused on improving the accuracy of NH3 emissions from fertilizer application, and the latest methods in the literature were used for quantifying emissions from other sources, such as livestock waste. Finally, the inventory accuracy was evaluated using WRF-Chem and available ground-station- and satellite-based observation data.
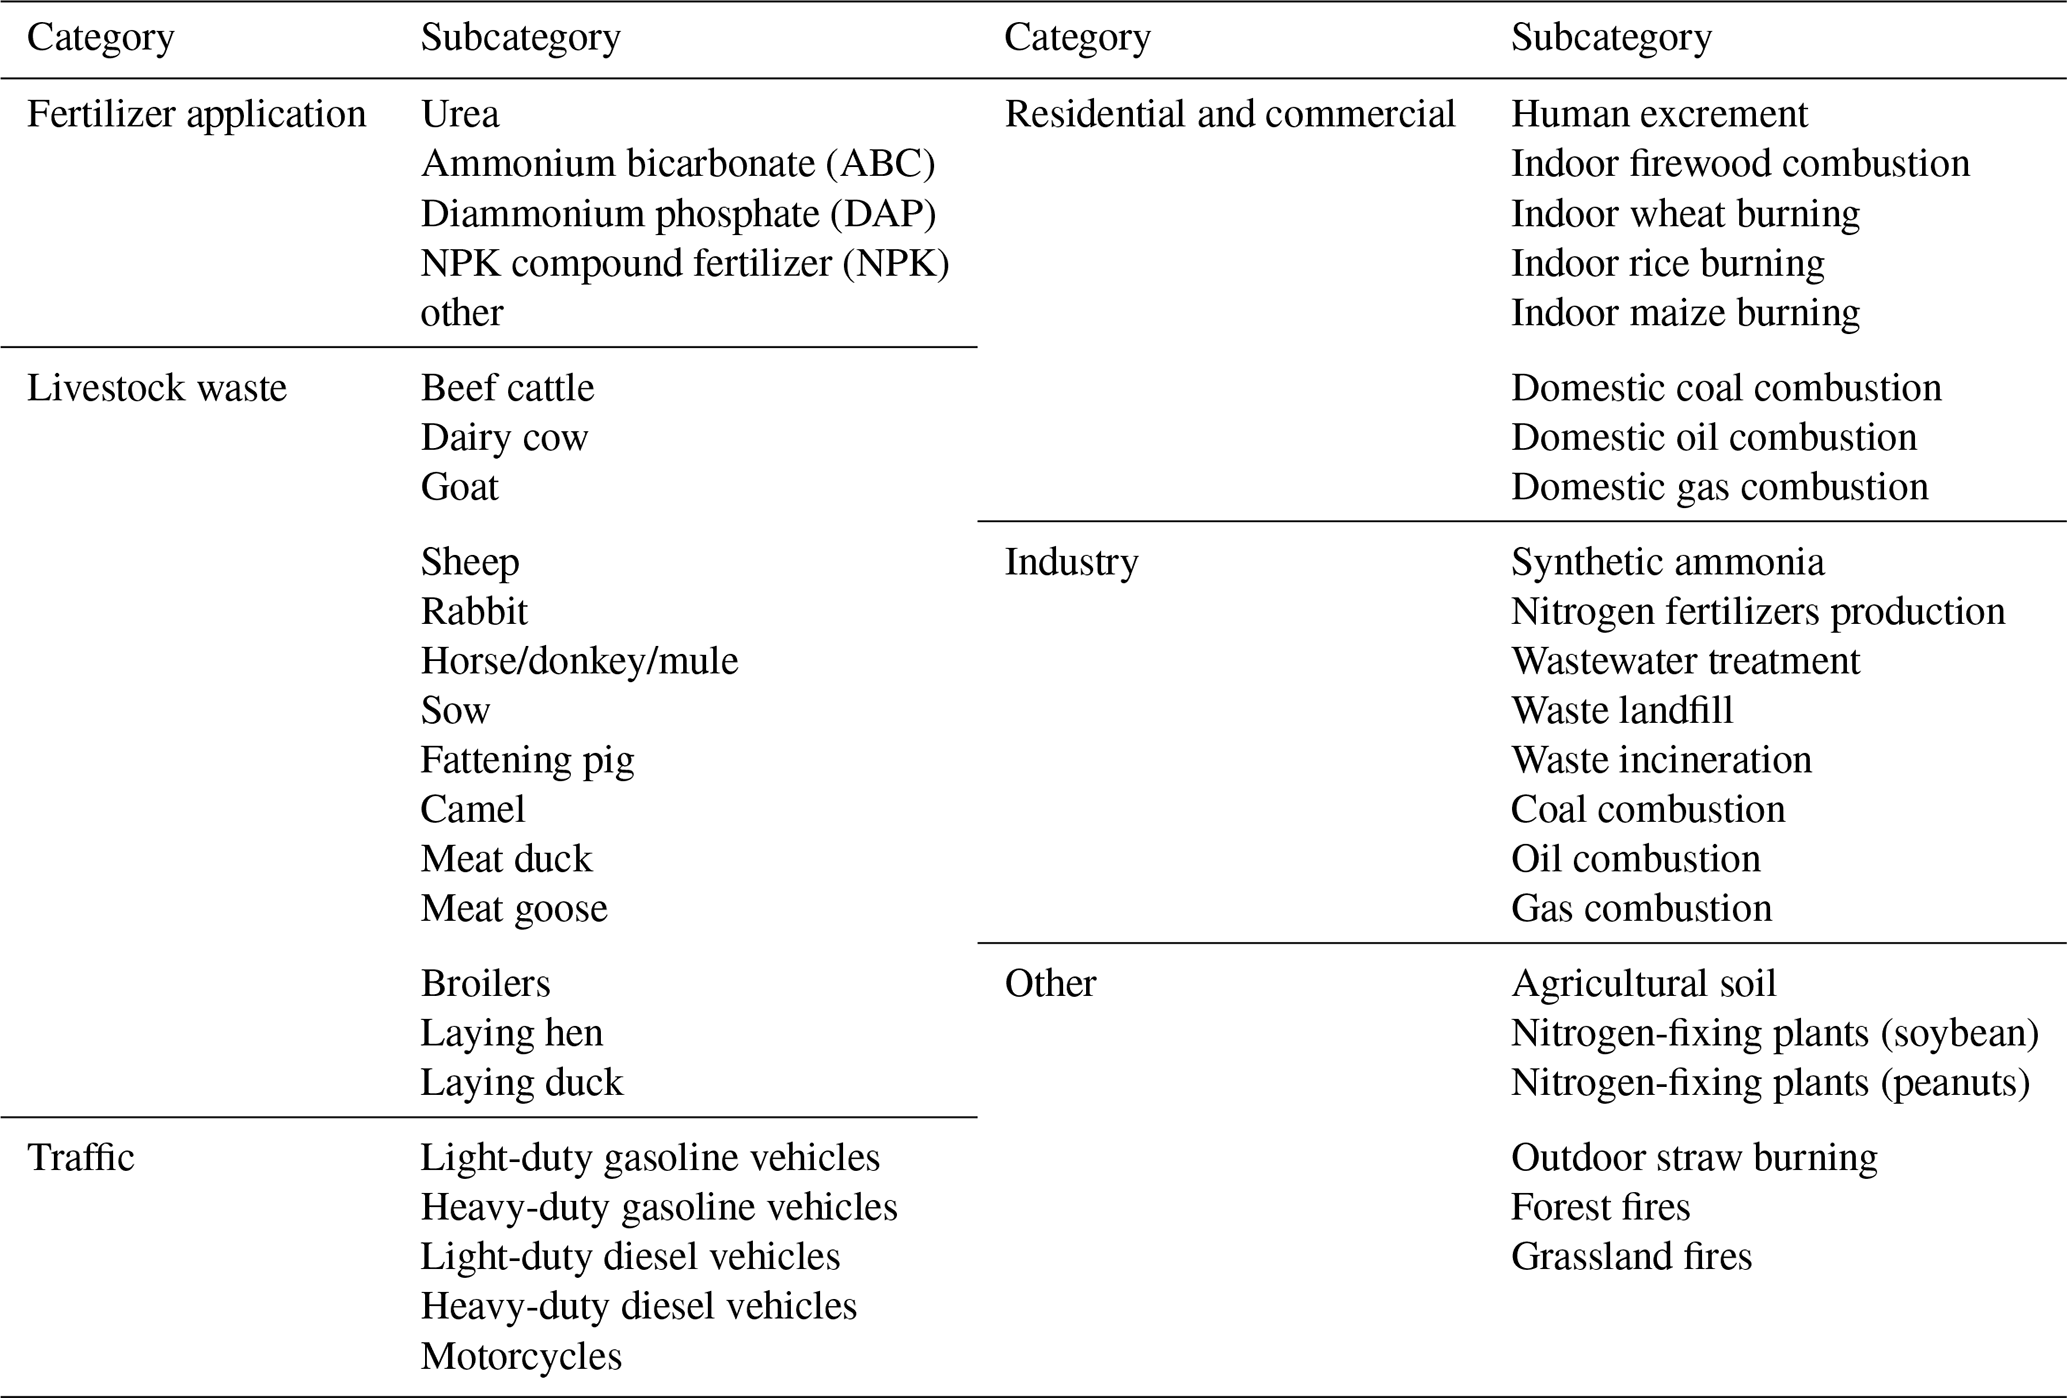
This study was conducted in mainland China. Hong Kong, Macao, and Taiwan were excluded. Fifty emission sources, including fertilizer application, livestock waste, transportation, biomass burning, and agricultural soil, were considered. The categorization of these sources is presented in Table 1. The gridded NH3 emissions () were calculated according to Eq. (1):
where i, j, and k represent the specific grid, source type, and month, respectively. A represents the activity level (e.g., fertilizer application amounts corresponding to each crop, mileage of motor vehicles, etc.), and EF represents the corresponding emission factor.
Reportedly, monthly variations in NH3 emissions can be primarily attributed to differences in fertilizer application amounts (Huang et al., 2012; Zhang et al., 2018). However, fertilizer-application-related NH3 emission inventories have considerable uncertainties owing to several factors, including fertilizer type, crop type, fertilization times, fertilization dates, and environmental factors. Therefore, in this study, we focused on improving the accuracy of fertilizer-application-related NH3 emission inventories.
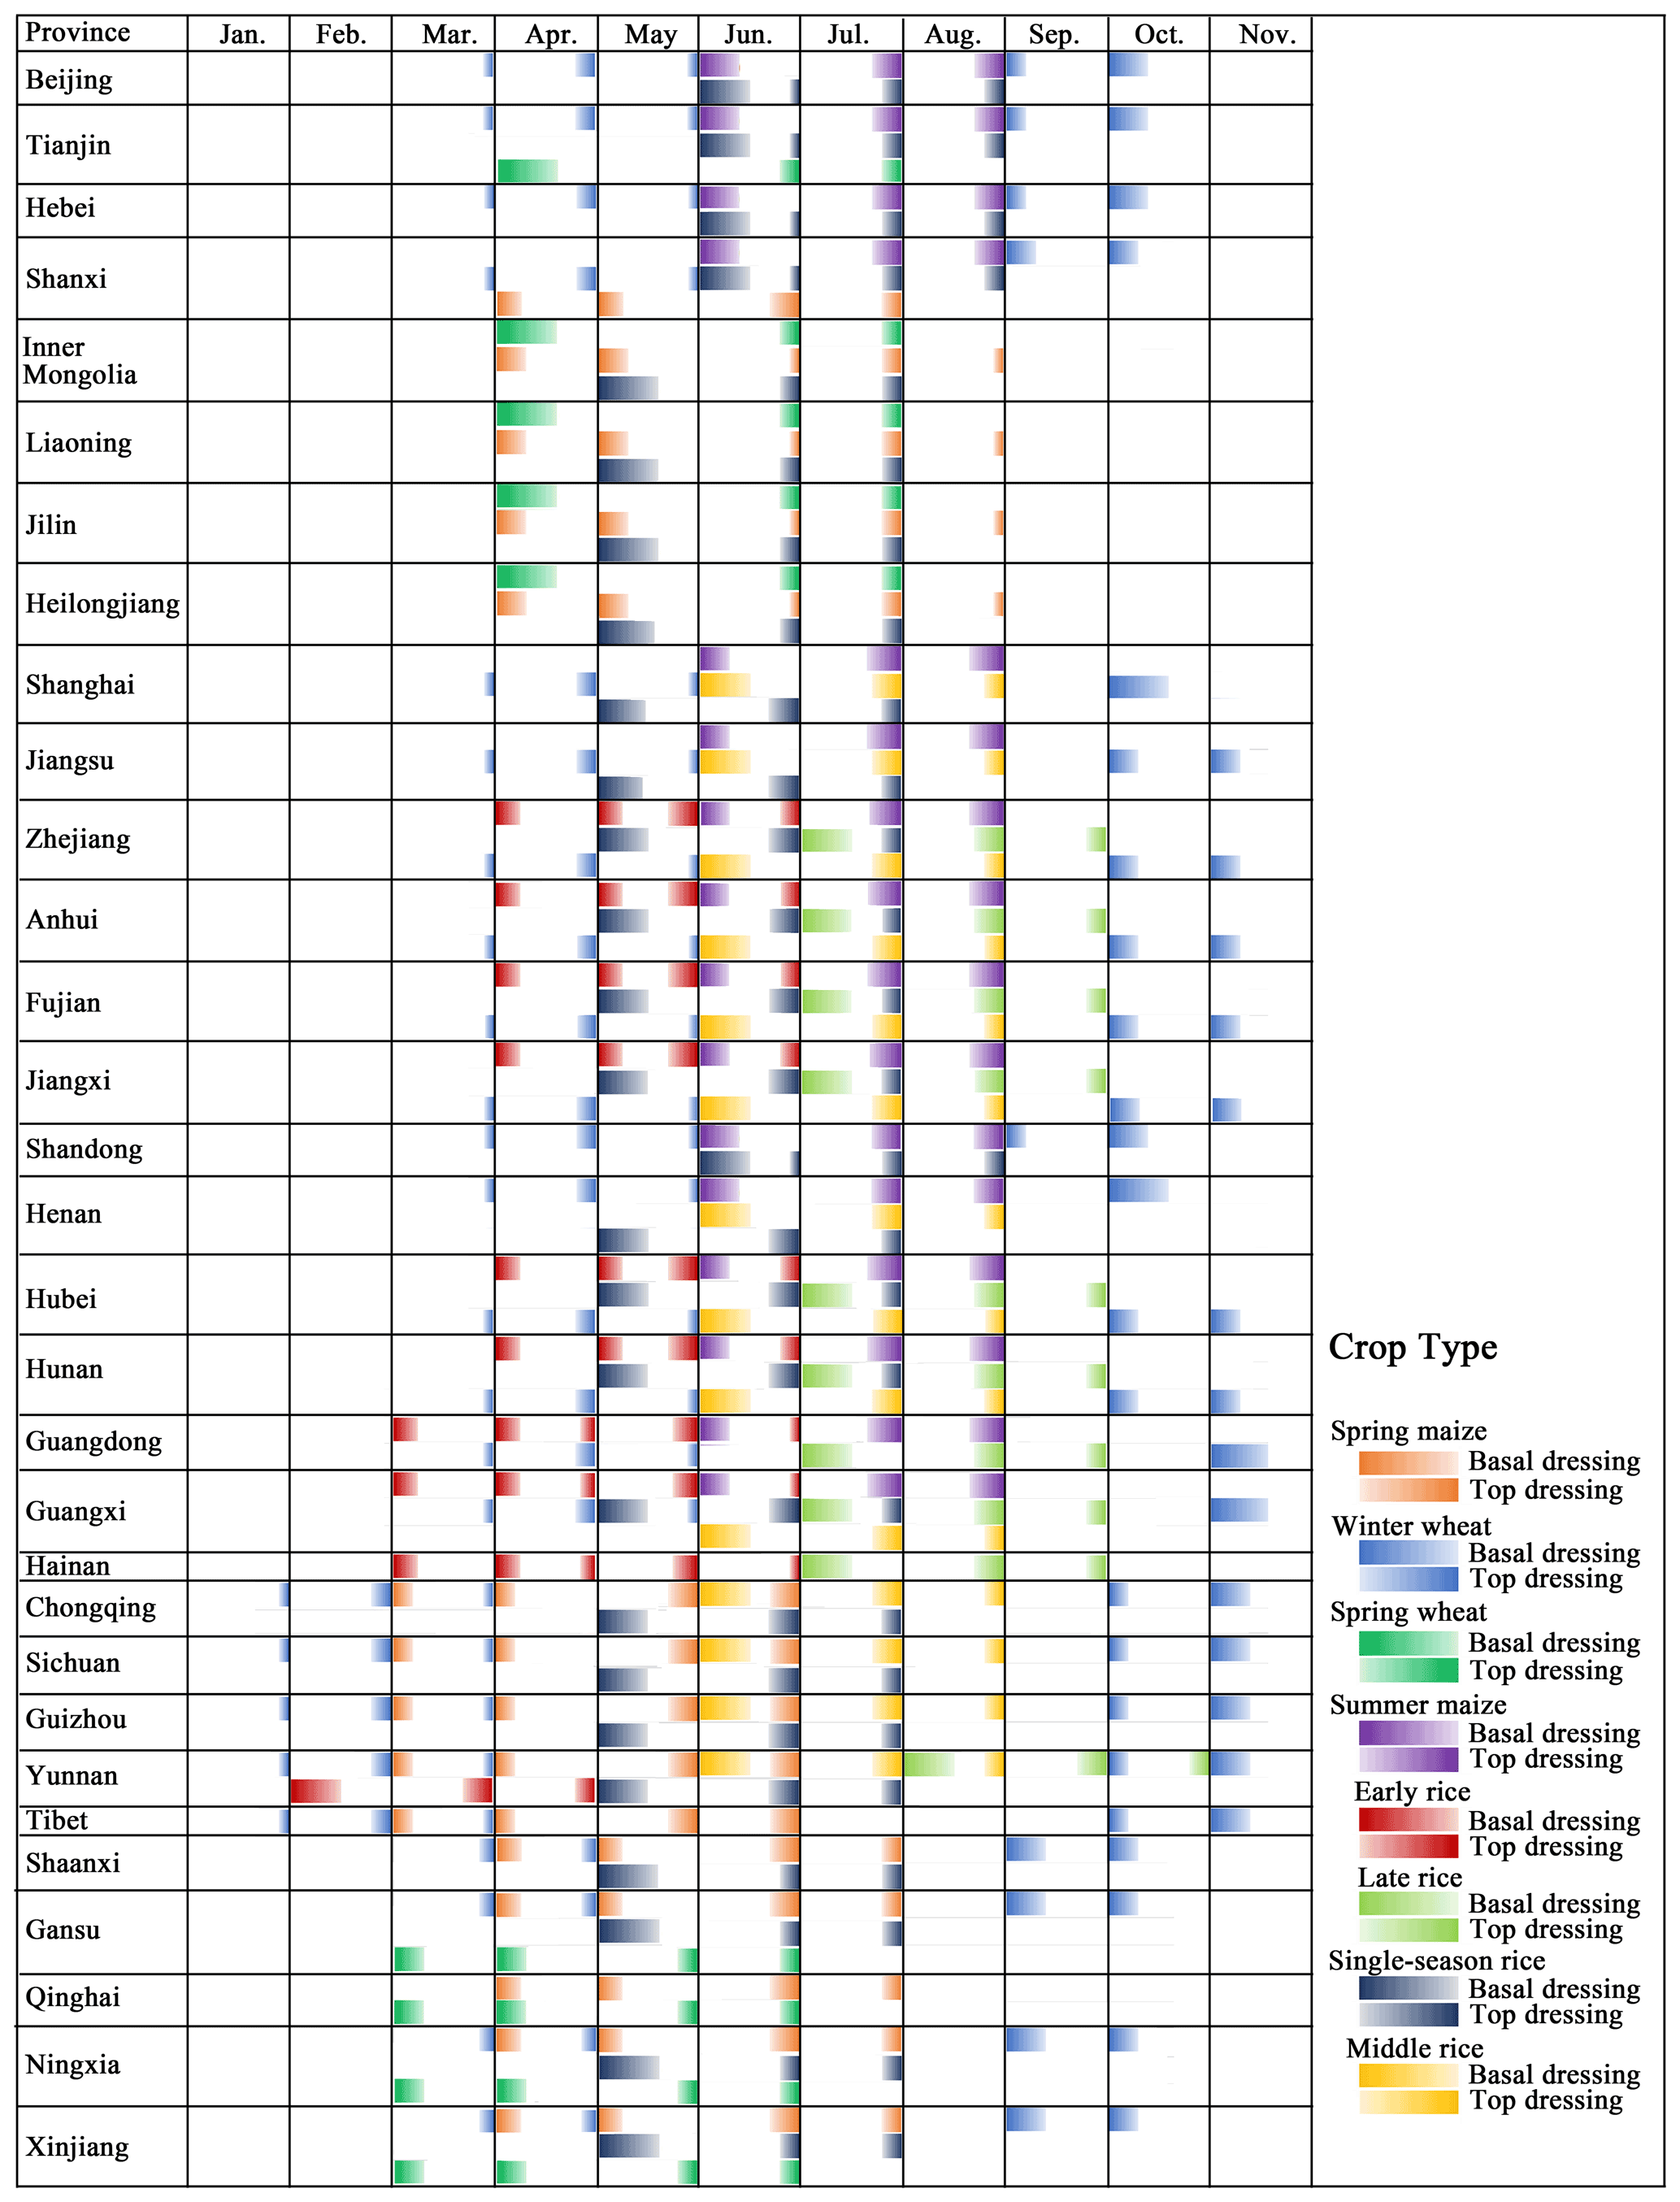
Figure 1Basal and top dressing fertilization months and ratios for maize, wheat, and rice in China.
2.1 Improvement of fertilizer-application-related NH3 emission inventories
Five fertilizer types, including urea, ammonium bicarbonate (ABC), diammonium phosphate (DAP), and complex-fertilizer (NPK), were considered in this study. Additionally, several types of crops that are widely cultivated in China were also considered, including early, middle, late, and single-season rice; winter and spring wheat; spring and summer maize; cotton; potato; spring and winter rapeseed; soybean; spring and summer groundnut; sugarcane; sugar beet; tobacco; apple; citruses; pear; and vegetables. Specifically, the following improvements were made to inventories of NH3 emissions from fertilizer applications.
-
In most previous studies, fertilization dates were set such that they did not change in space but were fixed to a specific month; this is not consistent with the actual situation. Therefore, in this study, we comprehensively evaluated the fertilizer application timing and frequency for rice, maize, and wheat crops (these three plants constituted a total of eight sub-categories as shown in Fig. 1) in different regions by collecting data from a large number of studies online (primarily comprising reports on crop phenology in each province in 2016) and the technical guidelines for field management in each province (see a more detailed explanation in Sect. S1 in the Supplement). The respective amounts of each N fertilizer, applied in different months to each crop category, can be calculated using the following formula:
where i indicates the month. Atotal indicates the total amount of each N fertilizer (ABC, DAP, NPK, urea, and other) applied to the different crop types in each province in 2016, which were calculated as a product of the planted cropland area and the fertilizer application rate per unit area of cropland based on data from MARA (2017) and NDRC (2017). Over the whole growth period, wheat, maize, and rice generally need three applications of N fertilizer (j, namely the basal dressing, first top dressing, and second top dressing). Pj represents the proportion of the total annual fertilization amount applied in the jth dressing. The variation in Pj across the different regions was also considered based on farmer survey data (Wang et al., 2008) and other studies in the literature (Zhang et al., 2009; Zhang and Zhang, 2012); xi,j represents the probability of the jth dressing in month i and is calculated as the proportion of days in the ith month during the window period of jth dressing. Table S1 in the Supplement lists the basal and top dressing fertilization dates for different crops in different provinces.
For example, in 2016, winter wheat was sown, and basal fertilizer was applied in late September to mid-October. So, the dates of basal dressing in Hebei Province span 2 months; in September, while in October. Similarly, the other two top dressings were applied at the jointing and booting stages, i.e., in late March to early April and late April to early May, respectively. According to the proportion of basal dressing and top dressing for wheat in Hebei, we identified the proportion of total fertilizer applied in each month (basal dressing: 0.2 in September, 0.4 in October; top dressing: 0.1 in March, 0.2 in April, and 0.1 in May). Further, the proportion of fertilizer applied in each month in Sichuan, which is located in Southwest China, was different from that in Hebei (basal dressing: 0.2 in October, 0.4 in November; top dressing: 0.1 in January, 0.2 in February, and 0.1 in March). Besides, four sub-categories of rice were considered in this study (early, middle, late, and single-season rice), and given the differences in their fertilization dates in different regions, the fertilization dates varied greatly across the country. Furthermore, a comprehensive assessment of the fertilizer application times and dates corresponding to each crop is of great significance with respect to improving the accuracy of NH3 emission inventories. Therefore, details regarding the fertilization months and the fertilization ratios corresponding to basal dressing and top dressing for the three main crops were considered (Fig. 1). For other crops, we also identified the corresponding fertilization dates and ratios according to their respective phenological periods by collecting large quantities of data from existing literature and reports (Zhang et al., 2009, 2018; Zhang and Zhang, 2012).
-
Given that rice, which is widely cultivated across China, requires N fertilization, the excessive use of N fertilizer results in sizable NH3 emissions (Xia et al., 2020). Figure 1 shows that compared with other crops, the amount of fertilizer applied to rice in different months is more complex. This implies that more attention should be paid to the spatial allocation of fertilizer quantity corresponding to rice. Therefore, using the spatial distribution of each rice sub-category (i.e., early, late, single-season, and middle rice) as spatial proxies rather than the overall spatial distribution of rice can greatly minimize the spatial bias of NH3 emissions from rice fertilization applications. In this study, we used a variety of data to integrate the spatial distribution of the four rice types in the country. First, spatial distribution data corresponding to the abovementioned rice types in 10 provinces of southern China (Henan, Jiangsu, Anhui, Hubei, Hunan, Jiangxi, Zhejiang, Fujian, Guangdong, and Shanghai) were directly obtained from Qiu et al. (2015). This dataset was proposed based on 500 m 8 d composite Moderate Resolution Imaging Spectroradiometer (MODIS) enhanced vegetation indices with two bands (EVI2). Its efficiency was validated using data from 763 ground survey sites, and it showed an overall accuracy of 95.02 %. Second, for other provinces, we used land use and land cover change (LUCC) data as well as cropping frequency data. Areas where paddy fields overlap with a single cropping frequency were considered to be single-season rice areas. Such areas were primarily distributed in Northeast China. Further, areas where paddy fields overlap with a double cropping frequency were considered double-cropping or middle-rice areas. According to the yield of the two rice types in each province, the spatial distribution of early and late rice and middle rice areas can be further distinguished. LUCC data and cropping frequency data with a resolution of 1 km were downloaded from the Resource and Environment Science and Data Center (http://www.resdc.cn/data.aspx?DATAID=184, last access: 11 October 2021 and http://www.resdc.cn/DOI/doi.aspx?DOIid=42, last access: 11 October 2021). The spatial distributions of the rice types (single-season rice, middle rice, and early and late rice) are shown in Fig. S1 in the Supplement. For other crops, we used the EarthStat dataset on crop harvest area (Monfreda et al., 2008), which provides global crop harvest areas and yields at a 5 min × 5 min resolution.
After completing the above improvements, we further considered the effects of soil properties, agricultural activity, and meteorological conditions (Bouwman et al., 2002; Zhang et al., 2018). The monthly emission factors corresponding to fertilizer application were calculated as follows:
where EF0 represents the baseline emission factors that were reported by Cai et al. (2002), Dong et al. (2009), and Zhou et al. (2016) (Table S2); f represents the effects of soil pH, soil cation exchange capacity (CEC), fertilization types (basal dressing and top dressing), and crop types (upland crops and paddy field crops) based on Bouwman et al. (2002) and Zhang et al. (2018). Soil pH and CEC data were obtained from the Harmonized World Soil Database (http://www.fao.org/land-water/databases-and-software/hwsd/en/, last access: 11 October 2021). Detailed f values are listed in Table S2. Further, α represents the monthly scalar, which was applied to characterize the influence of meteorological factors on NH3 emissions (Gyldenkærne et al., 2005; Zhang et al., 2018).
where Ti and Wi represent 2 m air temperature (∘C) and 10 m wind speed (m s−1) for a given month, i, respectively. T and W were processed using ECMWF ERA5 Reanalysis data (https://www.ecmwf.int/en/forecasts/datasets/reanalysis-datasets/era5, last access: 11 October 2021).
2.2 NH3 emission from livestock waste
Traditional NH3 emissions from livestock waste are usually calculated as a product of livestock population and the corresponding emission factors. In this study, a more process-based mass-flow approach was applied, considering nitrogen transformation at the different stages of manure management (Huang et al., 2012; Kang et al., 2016; EEA, 2019). The total ammoniacal nitrogen (TAN) amount was obtained using the annual livestock amount, the daily amount, and the nitrogen content of urine and feces for each livestock category. Details in this regard are provided in Table S3. The outdoor- and indoor-generated TAN contents were separately estimated based on the proportion of the time each livestock category spent indoors and outdoors, respectively. There are three main livestock breeding systems in China, namely grazing, free-ranging, and intensive livestock breeding systems. Among them, half of the livestock urine and feces corresponding to the grazing and free-range systems are discharged indoors. However, for intensive livestock breeding, all the livestock urine and feces are discharged indoors (MEP, 2014). Grazing is practiced only in pastoral and semi-pastoral areas, i.e., in 13 provinces (Hebei, Shanxi, Inner Mongolia, Liaoning, Jilin, Heilongjiang, Sichuan, Yunnan, Tibet, Gansu, Qinghai, Ningxia, and Xinjiang). According to the nitrogen flow and phase of manure management, the activity levels were classified under seven categories: outdoor, housing solid, housing liquid, storage solid, storage liquid, spreading solid, and spreading liquid. Thus, NH3 emissions from livestock were calculated as a product of the TAN of the seven categories and the corresponding emission factors (Huang et al., 2012; MEP, 2014; Kang et al., 2016). Livestock production in each province was obtained from MARA (2017) and NBS (2017c).
After estimating the NH3 emissions corresponding to the three livestock breeding systems in different provinces, we allocated the grazing emissions to grids based on grassland areas in the pastoral and semi-pastoral areas and allocated the emissions from free-range and intensive livestock production based on the corresponding rural residential areas. In addition to emissions from fertilizer applications, the influence of meteorological factors on NH3 emissions from livestock waste was also considered. For outdoor NH3 emissions, we considered the influence of monthly temperature and wind speed using Eq. (3) while accounting only for air temperature for indoor emissions (Zhang et al., 2018).
2.3 NH3 emission from other sources
NH3 emissions from combusted crop residue were estimated based on crop yield, grain-to-straw ratio, combustion ratio, and combustion efficiency (Zhou et al., 2017). The contribution of firewood combustion to NH3 emissions was derived from Cong et al. (2017). Additionally, grassfire and forest fire data were obtained by coupling MCD14ML and MCD64A1 fire products based on previous studies (Qiu et al., 2016; Li et al., 2018). The emissions originating from human excrement were calculated based on the daily excretion data corresponding to children and adults, rural populations, and the fraction of tatty latrines in each province (Huang et al., 2012). The emissions corresponding to the total mileage for each vehicle category were calculated using the number of vehicles and the average annual mileage. Further, NH3 emissions from other sources were determined following the approaches proposed by previous studies (Huang et al., 2012; Kang et al., 2016). Relevant data were obtained from NBS (2017a–d). The specific emission factors and spatial allocation methods for each source are listed in Table S4.
2.4 NH3 emission inventory uncertainty and accuracy evaluation
The uncertainty in NH3 emissions was calculated using the Monte Carlo method, which has been widely used in various inventory studies (Zhao et al., 2011; Kang et al., 2016; B. Li et al., 2019). Based on previous studies, we assumed that the uncertainties in the activity levels and emission factors were uniformly and normally distributed. The detailed parameters of the coefficients of variation (CVs) of the two datasets were derived from Huang et al. (2012). The NH3 emission calculations were replicated 10 000 times with a random selection of all the inputs.
Additionally, the NH3 emission inventory established in this study and the MEIC inventory were applied to WRF-Chem to evaluate the inventory accuracy. Emissions of other air pollutants in 2016 (including SO2, NOx, CO, CO2, NMVOC, BC, OC, PM2.5, and PM10) were obtained from MEIC (http://meicmodel.org/, last access: 11 October 2021) with a horizontal resolution of 0.25∘ (Li et al., 2017b). Simulations were conducted for January, April, July, and October in 2016 to represent the four typical seasons. The simulation domain with a resolution of 27 km is shown in Fig. 2, which covers most parts of North, East, Central, and South China. Areas in China with high NH3 emission density are shown in Fig. 4. Inventory accuracy was further assessed using WRF-Chem and available ground-station- and satellite-based observations. First, we compared the NH3 VCDs obtained using infrared atmospheric sounding interferometer (IASI) satellite observations and with those from WRF-Chem using our estimated inventory and MEIC for the four selected months. Daily IASI NH3 VCDs were downloaded from the ESPRI data center (https://cds-espri.ipsl.upmc.fr/etherTypo/index.php?id=1700&L=1, last access: 11 October 2021). The mean local solar overpass times were 09:30 and 21:30 LT (local time) at the Equator. Furthermore, in this study, only the IASI NH3 VCDs collected from the morning orbit were considered as they are generally more sensitive to NH3 emissions owing to their higher thermal contrast (Van Damme et al., 2014, 2015). Furthermore, to ensure comparison accuracy, the average simulated NH3 concentrations at 09:00 and 10:00 LT were applied to calculate the simulated NH3 VCDs (Zhao et al., 2020). Second, we compared the NH3 concentrations simulated using WRF-Chem to ground observation data in January, April, and July 2016 (as ground observation data were not available for October 2016). Specifically, observed NH3 concentrations were obtained from the Ammonia Monitoring Network in China (AMoN-China) (Pan et al., 2018), and the simulation domain of WRF-Chem consisted of 30 sampling stations from AMoN-China (Fig. 2).
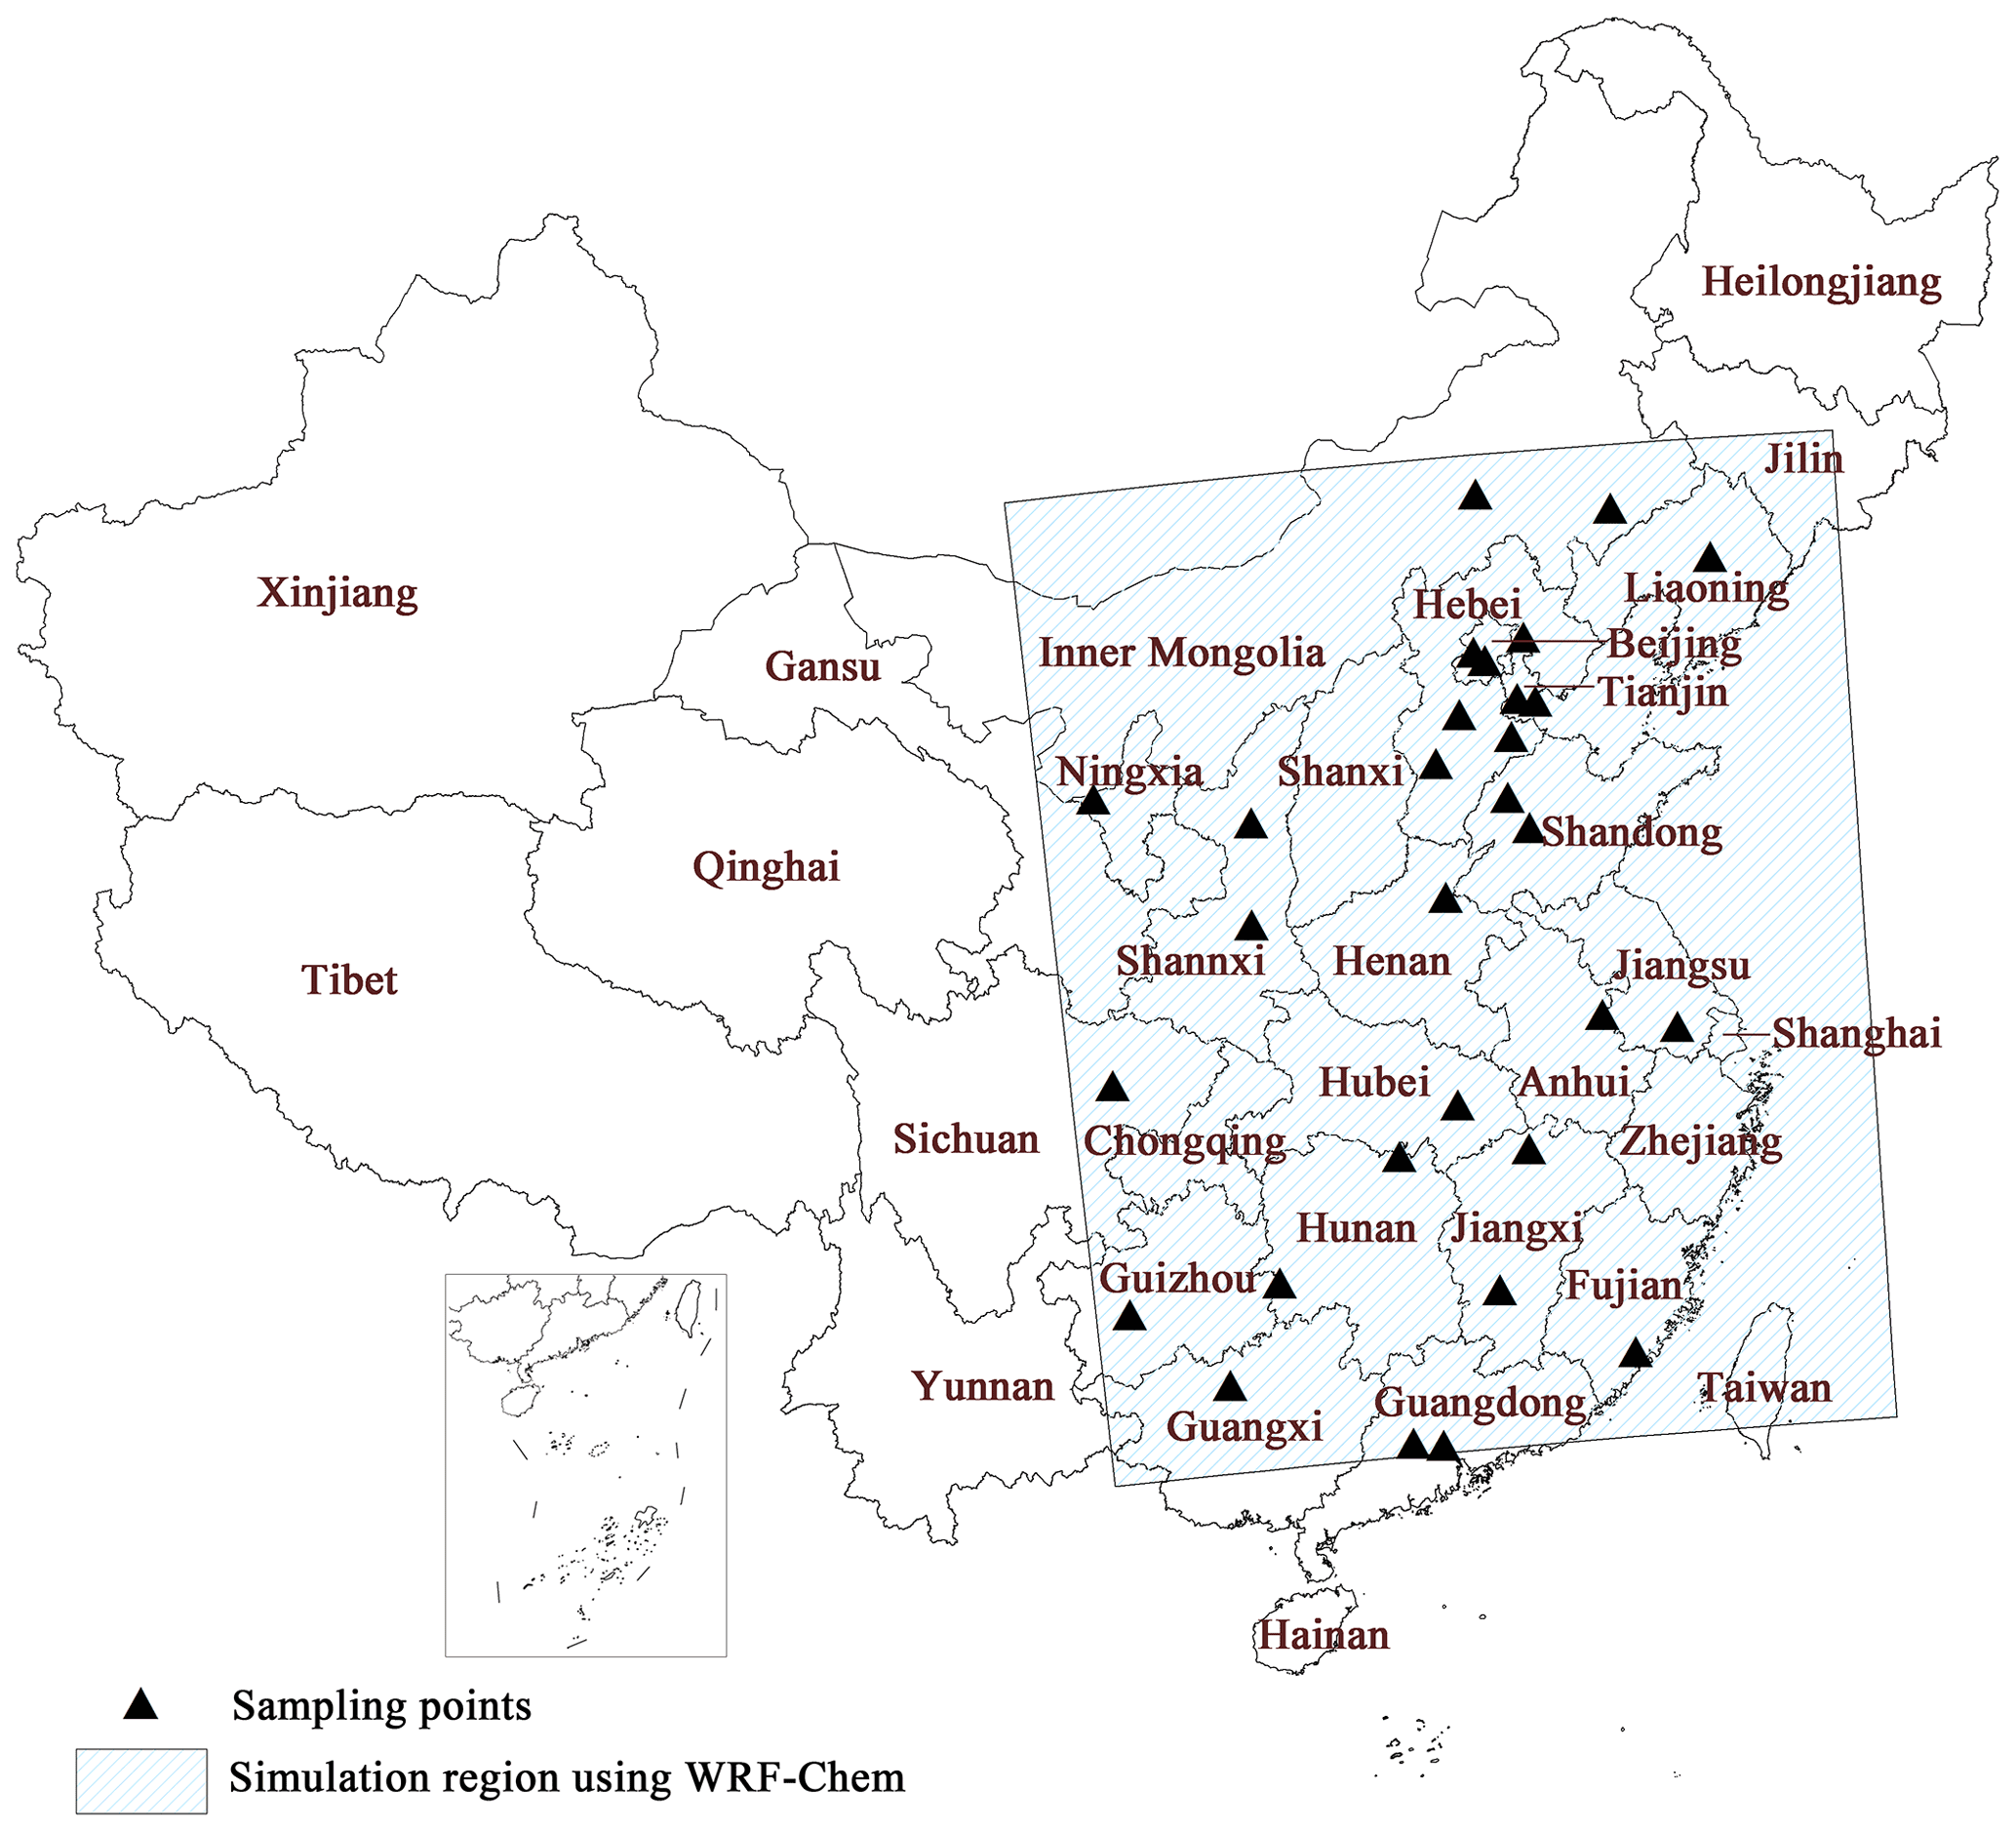
Figure 2WRF-Chem simulation domain and sampling points (Ammonia Monitoring Network, China).
3.1 Emissions and main sources of NH3 in China
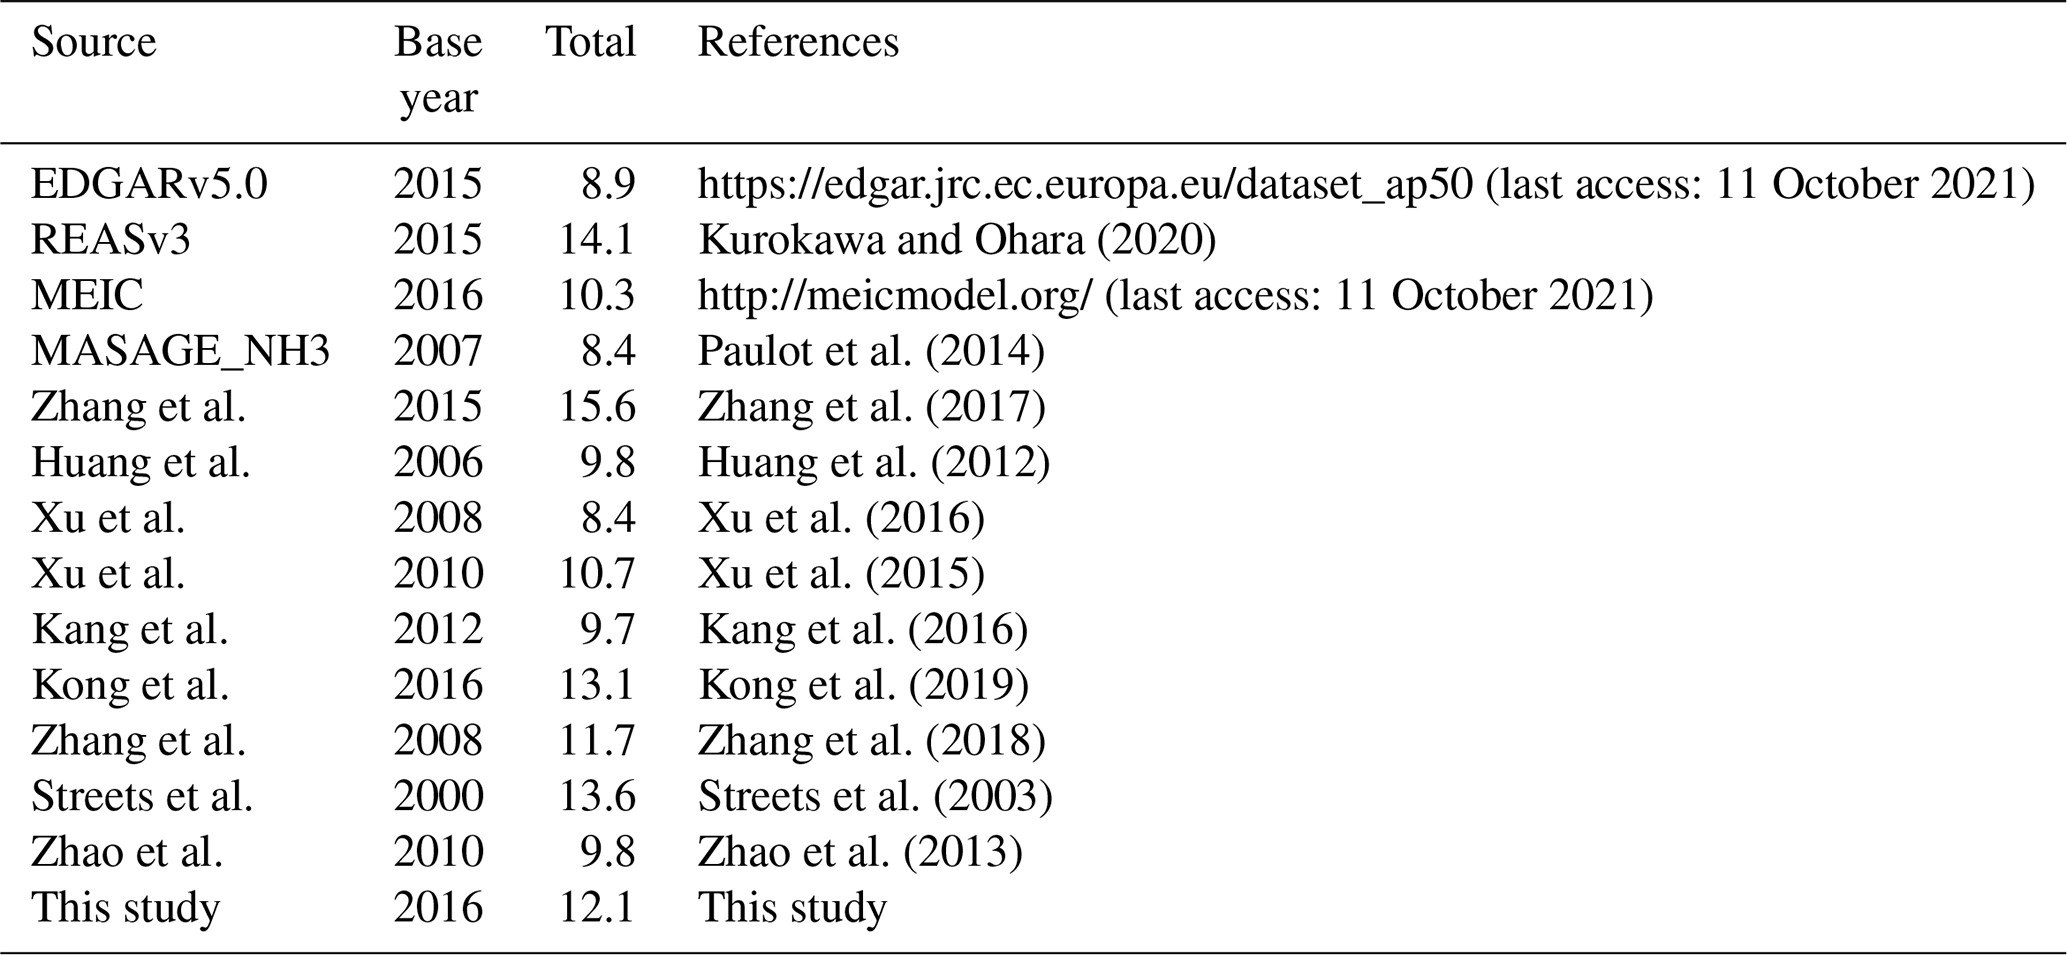
In 2016, the total atmospheric ammonia emission in mainland China was 12.11 Tg (10.54–16.04 Tg, 95 % confidence interval based on a Monte Carlo simulation), and the emission density was 1.28 t km−2. This total NH3 emission amount was found to be approximately threefold that obtained for Europe (4.18 Tg) (Backes et al., 2016) and contributed approximately 38 % and 27 % of Asian and global NH3 emissions, respectively (Bouwman et al., 1997; Kurokawa and Ohara, 2020). Further, this estimated emission was relatively close to the improved emissions based on AMoN-China and the ensemble Kalman filter (13.1 Tg) (Kong et al., 2019). It was also close to the improved bottom-up emission (11.7 Tg) reported by Zhang et al. (2018). However, the estimation was approximately 25 % higher than that reported by Kang et al. (2016) and approximately 15 % lower than the REAS emission (Kurokawa and Ohara, 2020). Table 2 presents a quantitative comparison of this emission inventory with those reported in previous studies.
Table 2Comparison of estimated NH3 emissions with those obtained in other studies.
Similar to other studies, livestock waste (5.42 Tg) and fertilizer application (4.67 Tg) were identified as the two largest NH3 emission sources in China, with their contribution to the total NH3 emission amount reaching over 80 % (Fig. 3). Other sources included synthetic ammonia (0.43 Tg), agriculture soil (0.29 Tg), indoor biomass combustion (0.30 Tg), domestic coal combustion (0.26 Tg), nitrogen fertilizer production (0.22 Tg), transportation (0.10 Tg), and others (0.4 Tg), with contributions to the total emission amount as follows: 3.5 %, 2.4 %, 2.5 %, 2.2 %, 1.8 %, 0.9 %, and 3.3 %, respectively.
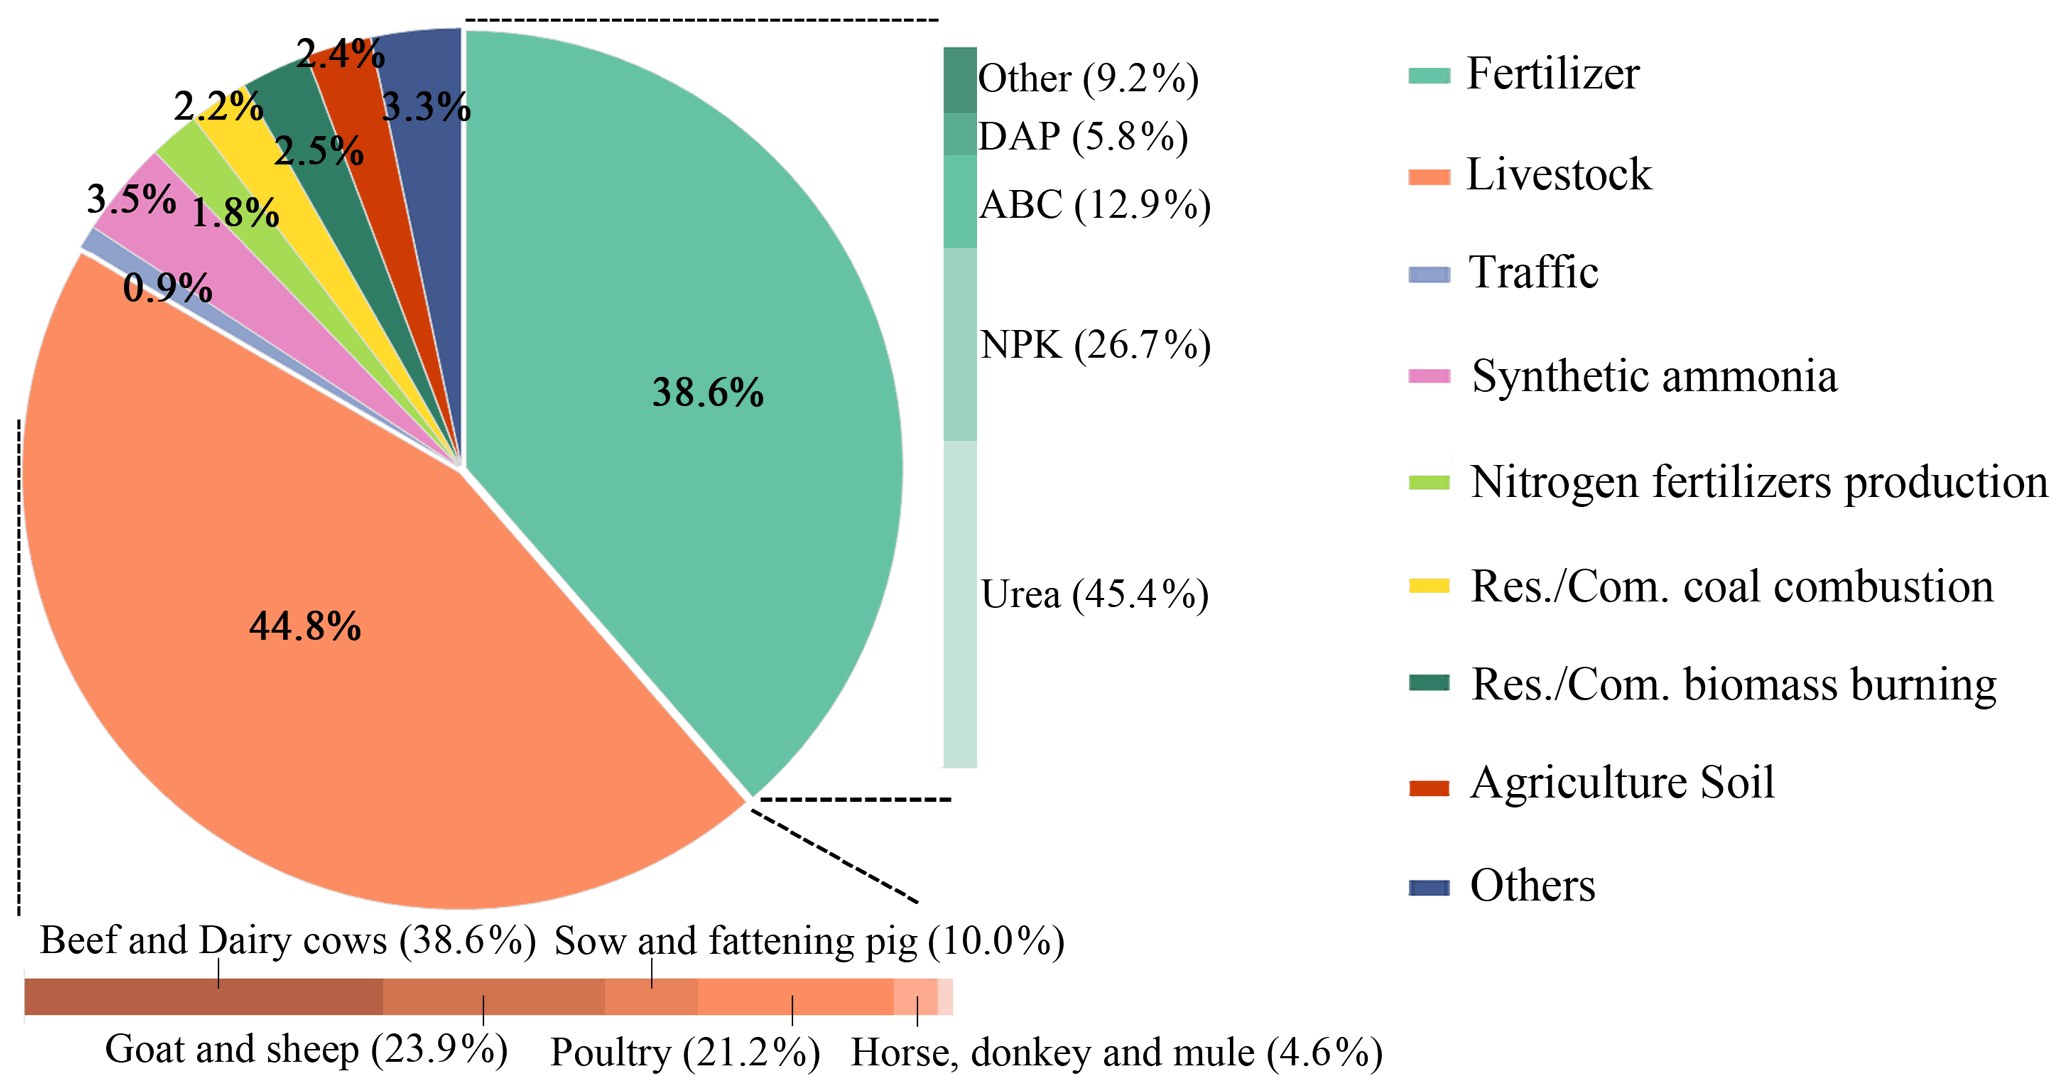
Similar to previously reported results, with respect to the different fertilizers considered, urea was identified as the major contributor to NH3 emissions, accounting for approximately 45.4 % of fertilizer-type-related NH3 emissions (Fig. 3). Kang et al. (2016) observed that ABC is an important fertilizer-type-related NH3 emission source owing to its high volatility; however, in 2016, it only accounted for 12.9 % of fertilizer-type-related NH3 emissions. This is because, in recent years, there has been a significant decrease in the proportion of ABC-related emissions in China owing to the decrease in the amounts of ABC applied to the three main crops, maize, rice, and wheat (from 26.55 kg hm−2 in 2011 to 10.80 kg hm−2 in 2016, i.e., a 59.32 % reduction). However, emissions related to complex fertilizers have increased by 33.61 % (NDRC, 2017). Specifically, NPK fertilizers have become the second-largest source of fertilizer-related NH3 emissions in China (26.7 %). Therefore, replacing ABC with complex fertilizers might reduce fertilizer-related NH3 emissions.
Maize fertilization contributed the most to NH3 emissions (1.21 Tg), accounting for 25.94 % of fertilizer-application-related emissions. This observation could be primarily attributed to the planting area of maize – the largest of the total crop area, up to 22.06 % (NBS, 2017c). Moreover, the maize fertilization dates were concentrated in summer, and the high temperature further increased the NH3 emission rate. It is also worth noting that vegetable fertilization has become the second-largest fertilizer-application-related NH3 emission source (0.89 Tg), i.e., 19.06 %, based on our estimation. In addition to the relatively large area corresponding to vegetable cultivation in China, vegetable-related fertilizer application rates were higher than those corresponding to the three major crops considered in this study (Wang et al., 2018). The amounts of urea, DAP, and NPK used in the fertilization of vegetable-cultivated land were 1.29, 1.77, and 1.40 times those applied in cropland for cultivating the three main crops, respectively. This is due to the lack of scientific fertilization methods for vegetables in China (NDRC, 2017). Further, rice and wheat fertilization accounted for 17.47 % and 14.80 % of fertilizer-application-related emissions, respectively. Furthermore, NH3 emissions corresponding to the above four crop types accounted for more than 75 % of the total NH3 emissions from fertilizer application.
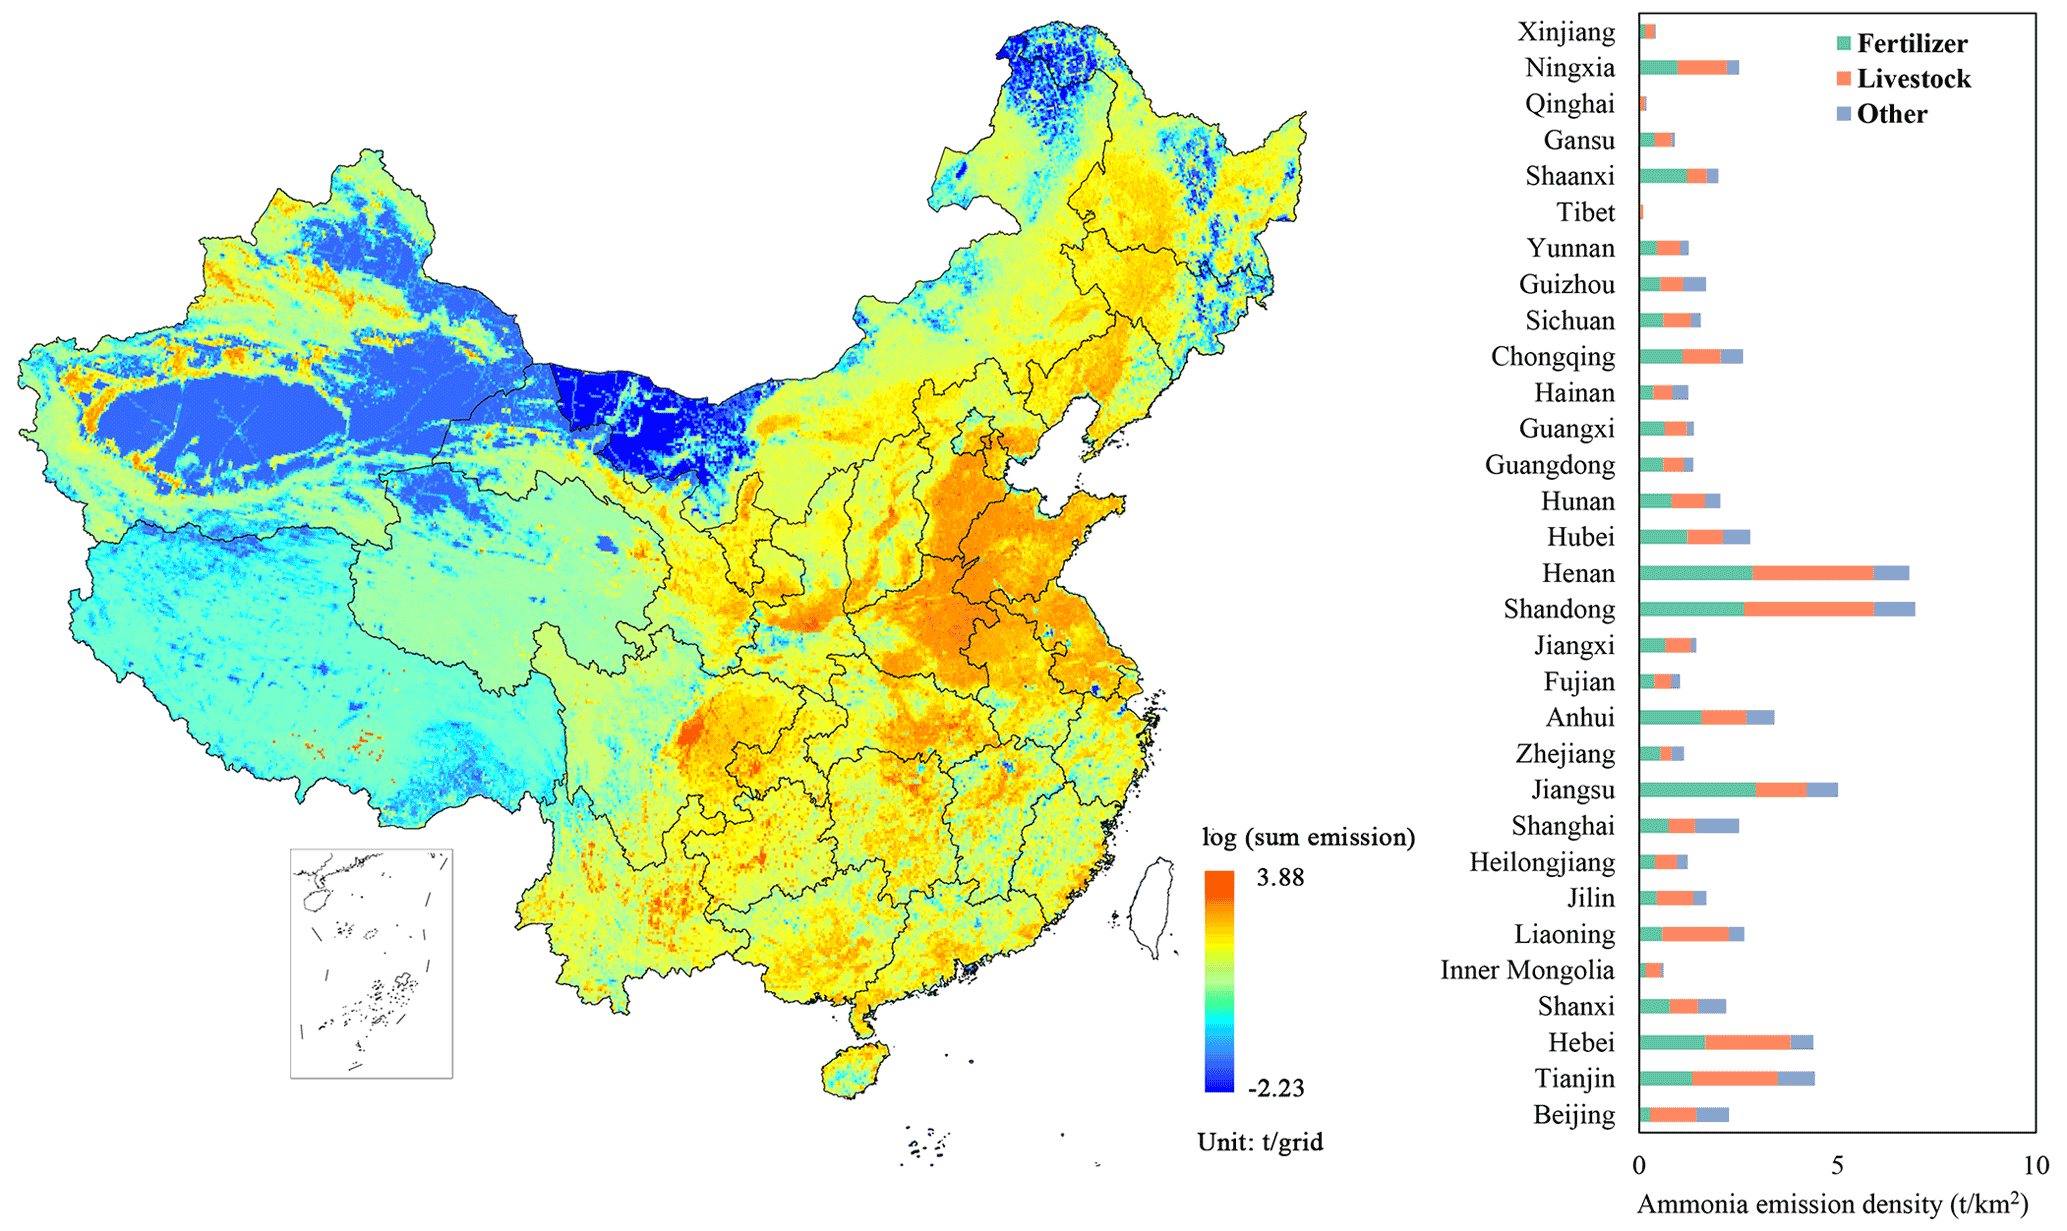
Figure 4Geographical distribution of 2016 NH3 emissions and emission densities in China.
Regarding livestock waste, beef and dairy cow waste were the largest contributors (38.6 %) to livestock-waste-related NH3 emissions. This was followed by goat and sheep waste (23.9 %) and poultry waste (21.2 %); this is consistent with Kang et al. (2016). Further, we analyzed animal-breeding-system-related nitrogen transformation and migration and observed that the contributions of the four manure management stages to NH3 emissions were 1.06, 1.14, 0.85, and 2.73 Tg for outdoor (19.60 %), housing (21.10 %), manure storage (15.65 %), and manure spreading (43.65 %), respectively. This is also consistent with the results of Xu et al. (2017). Our analysis also showed that the free-range system is the largest contributor to livestock-waste-related NH3 emissions, i.e., 2.80 Tg, which accounted for 51.6 % of the total livestock-waste-related emissions. This was followed by the intensive system (1.92 Tg, 35.47 %) and lastly the grazing system (0.70 Tg, 12.90 %). The rapid increase in the proportion of intensive livestock raising has slowed down NH3 emissions to a certain extent (Qian et al., 2018).
3.2 Geographical distribution of NH3 emissions
The spatial distribution of NH3 emissions in 2016 is shown in Fig. 4, from which a strong spatial variability is evident. The highest NH3 emission density of 6.96 t km−2, which was 5.44-fold higher than the national average (1.28 t km−2), was observed in Shandong. Furthermore, 21 provinces had NH3 emissions above this national average density, and the provinces with emission densities exceeding 3 t km−2 included Shandong (6.96 t km−2), Henan (6.81 t km−2), Jiangsu (5.01 t km−2), Tianjin (4.43 t km−2), Hebei (4.39 t km−2), and Anhui (3.41 t km−2). Although these six provinces account for only 8.08 % of the total land area of mainland China, they contributed 33.74 % of NH3 emissions in China. These provinces are all concentrated in the North China Plain (NCP; which includes the above six provinces and Beijing), an area that features well-developed crop farming and animal husbandry. The NCP contains a large amount of high-quality arable land, and the farms in this area produce 34.47 % of China's major farm products (NBS, 2017c). The fertilization of crops emits large amounts of NH3. The soil in this area is alkalescent (the average pH value is 7.15), which further increases the NH3 volatilization. Additionally, the NCP produces as much as 28.16×10⁶ t of pork and beef per year, accounting for 32.5 % of the total (NBS, 2017c), contributing to higher NH3 emissions in the North China Plain.
Shandong and Henan provinces not only had the two top emission densities, but their emissions were also the top two in mainland China, reaching 1.13 and 1.08 Tg, respectively. These high emissions could be primarily attributed to the following reasons: first Shandong and Henan are the major agricultural provinces in China. Although they represent only 3.40 % of the total land area of mainland China, in 2016, they accounted for 38.43 %, 17.74 %, and 16.31 % of wheat, maize, and vegetables yields, respectively (NBS, 2017c). The NH3 emissions corresponding to these three crops were remarkable, accounting for 80.35 % and 79.23 % of the fertilizer-application-related NH3 emissions in Shandong and Henan, respectively. Second, there are a large number of livestock farms in these two provinces (Hu et al., 2017). Specifically, beef cattle and poultry breeding in the two provinces also resulted in high NH3 emissions from livestock waste, and only these two provinces showed livestock-waste-related emission densities above 3 t km−2.

Furthermore, Jiangsu Province had the highest fertilizer-application-related emission density (2.94 t km−2) in China, which was 5.96 times above the national average. This is not only due to the relatively large crop area in this province, but also, more importantly, the fertilizer application rates in this province were much higher than in other provinces. For example, the rates of urea application to wheat and rice, which together constitute the largest planting area in Jiangsu Province, were 191.40 and 223.80 kg hm−2, respectively, i.e., 1.42- and 1.97-fold higher than the national average value, respectively. Further, emissions from fertilizer application accounted for 58.68 % of the total NH3 emissions in Jiangsu. Therefore, enhancing nitrogen fertilizer use efficiency is an important and effective strategy by which NH3 emissions in Jiangsu can be controlled.
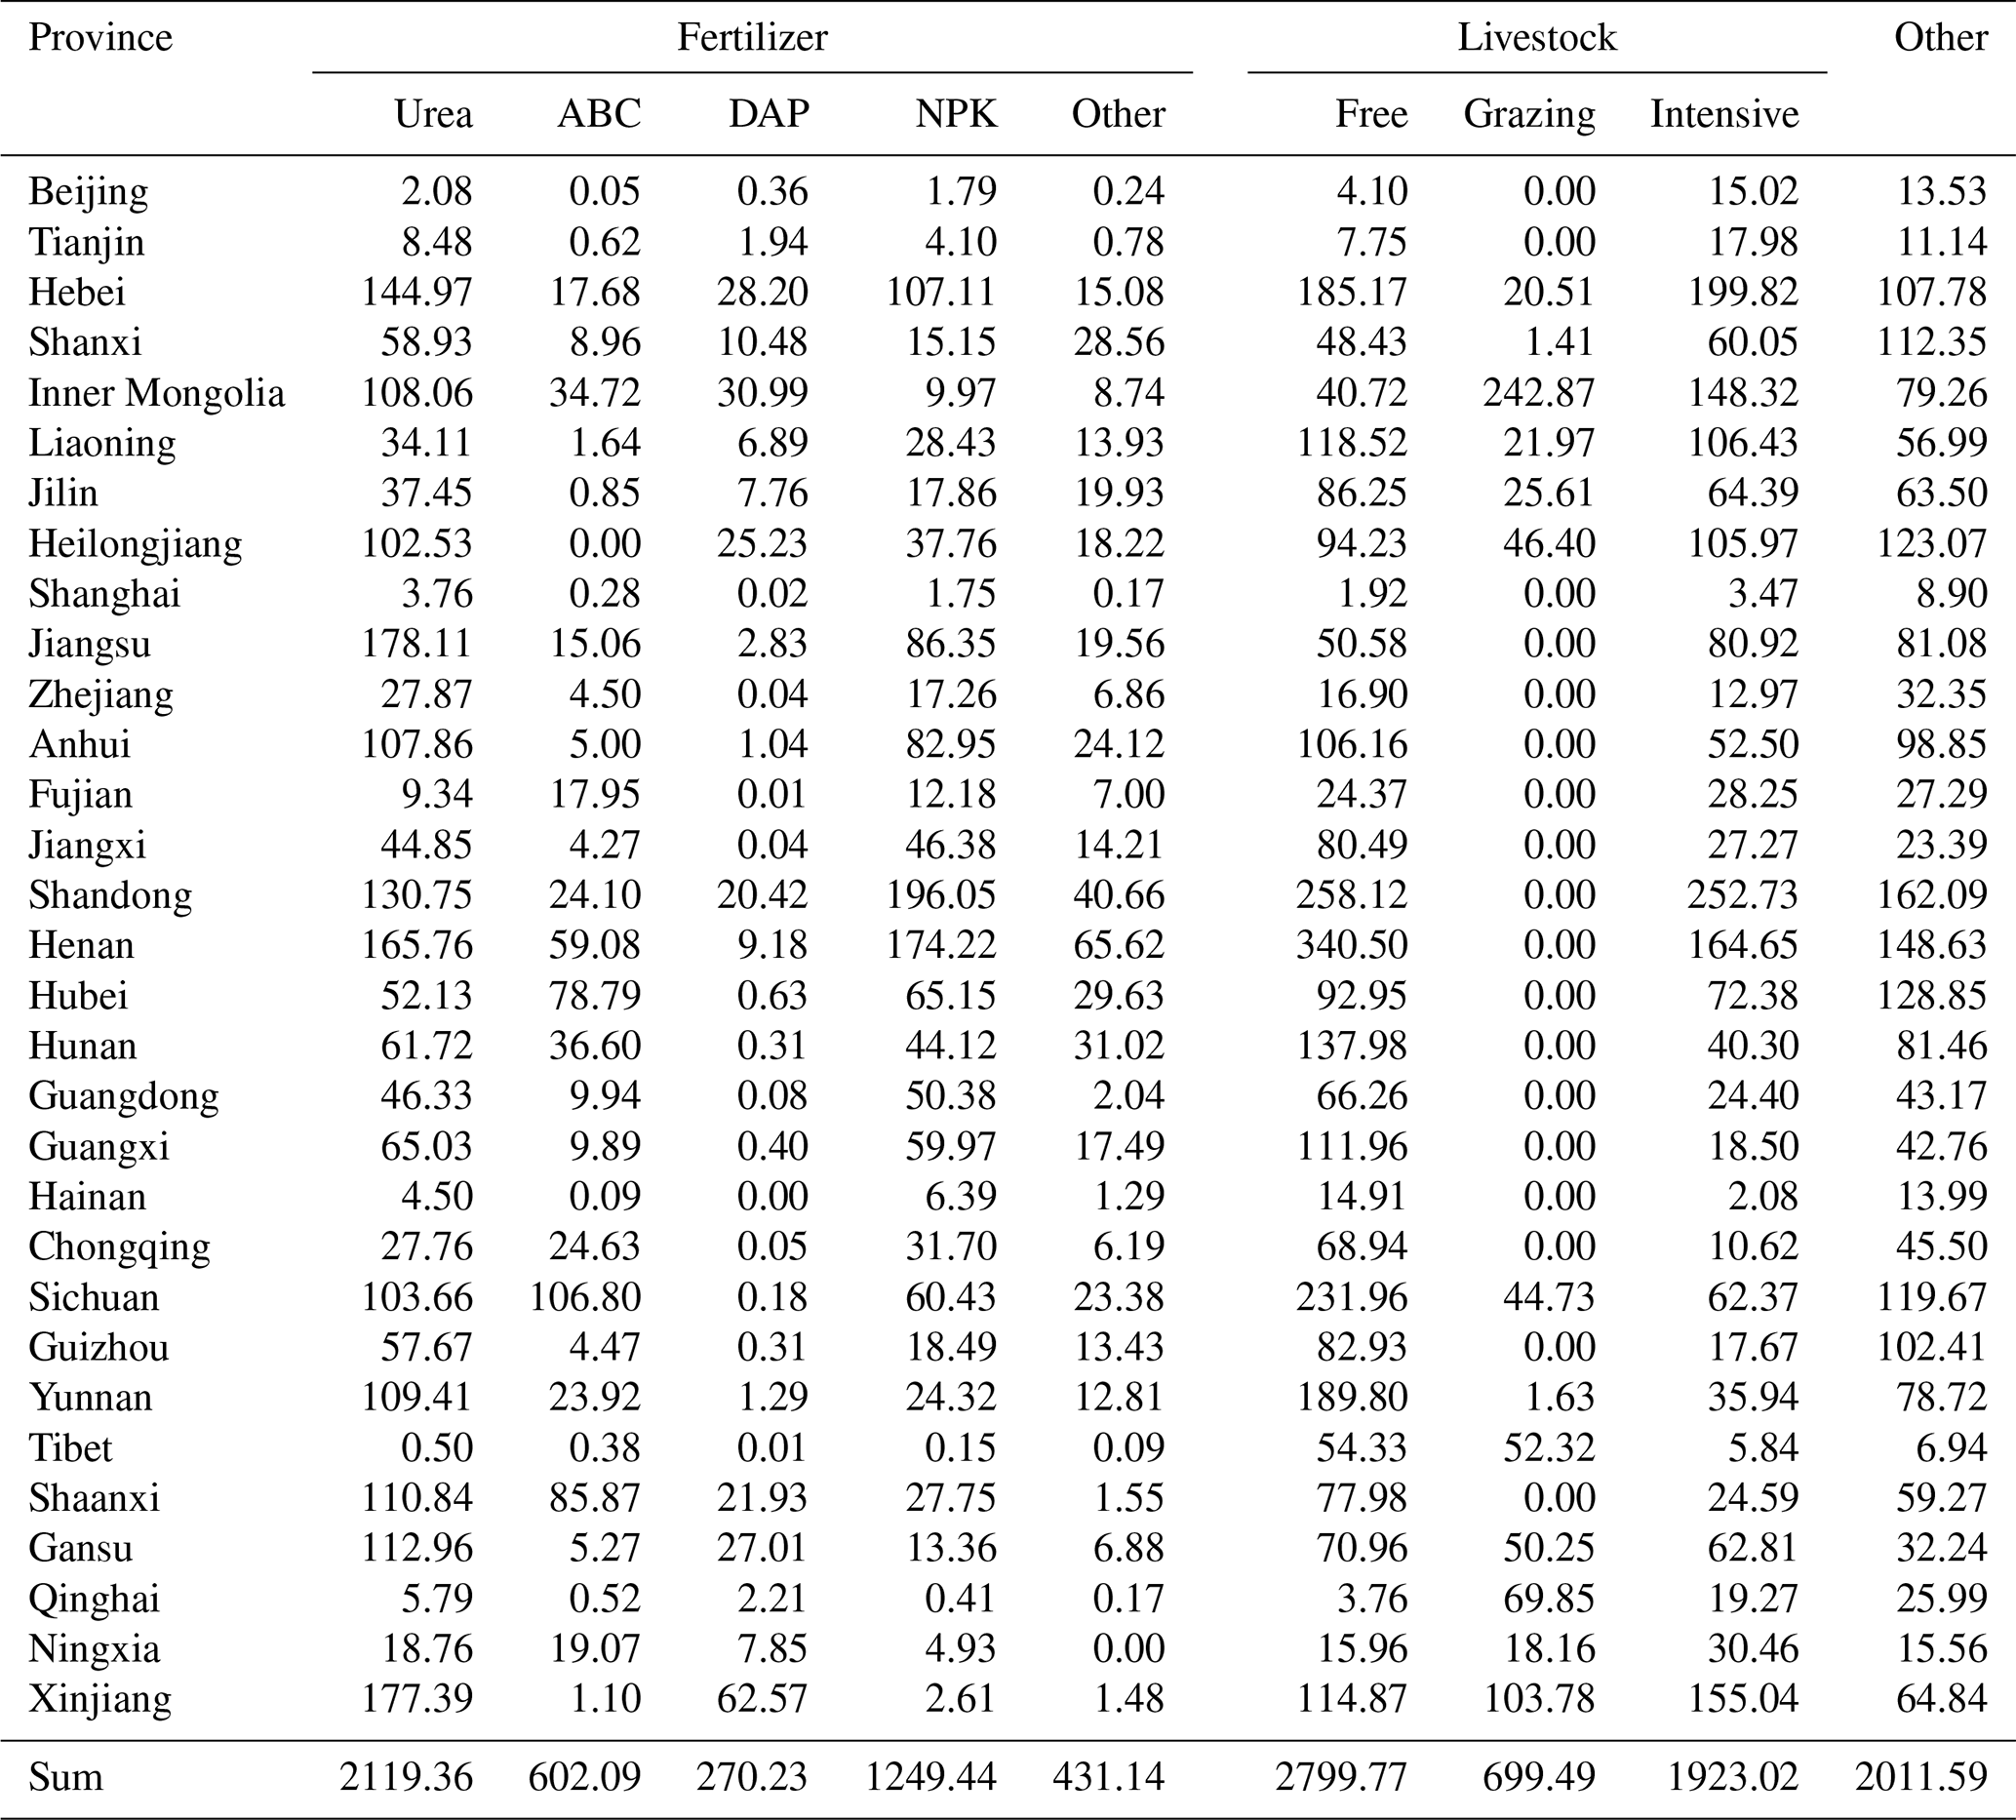
The NH3 emissions in Sichuan and Xinjiang in Western China were also high, ranking fourth (0.75 Tg) and sixth (0.68 Tg) in the country, respectively. Specifically, in Sichuan, rice and vegetable cultivation was identified as the principal fertilizer-application-related NH3 emission source, (25.73 % and 20.85 %, respectively), while cotton cultivation was identified as the main emission source in Xinjiang (49.20 %). These results reflect the huge differences in planting structure in China. In terms of livestock breeding, the largest emission sources in Sichuan were beef cattle and dairy cow breeding (25.43 %) and goat and sheep breeding (23.79 %), while the total contribution of these two livestock breeding practices in Xinjiang was 86.57 %, indicating significant differences in dietary habits in the different provinces China. These findings also indicate that different livestock-waste-related NH3 emission reduction strategies are needed for different regions. The specific NH3 emissions corresponding to different emission sources in the different provinces are shown in Table 3, and the spatial distribution of NH3 emissions from fertilizer application, livestock waste, and other sources is shown in Fig. 4.
Table 3NH3 emissions (Gg) from various sources in the different provinces in mainland China.
3.3 Monthly variation in NH3 emissions
The monthly variation in NH3 emissions from the main emission sources is shown in Fig. 5. Unlike some pollutants (such as PM2.5 and BC) which exhibit higher emissions in winter, NH3 emissions tended to be high in summer and low in winter. The highest and lowest emissions (1.68 and 0.55 Tg, respectively) were recorded in July and January, respectively; the July to January emission ratio was 3.08, which is close to the ratio obtained based on IASI satellite observations (2.85) and larger than that based on MEIC data (1.72).
Further, a comparison of the monthly trend of NH3 emissions based on IASI satellite observations with that obtained in this study showed a strong correlation between the two trends (R2=0.85). Owing to temperature changes, livestock-waste-related emissions increased slowly from 0.30 Tg in January to 0.60 Tg in July and then gradually decreased to 0.34 Tg in December. Additionally, the monthly fluctuation in fertilizer-application-related NH3 emissions was greater than that of livestock-waste-related emissions (Fig. 5a). Fertilizer-application-related NH3 emissions in July were 11.79 times higher than those observed in January. These monthly variations in NH3 emission amounts could be primarily attributed to the effect of the farming season on fertilization. Thus, we further analyzed monthly NH3 emission variation with respect to different crops (Fig. 5b). Based on the results obtained, it was observed that maize and rice fertilization in summer was primarily responsible for the increase in NH3 emissions in China. For example, NH3 emissions from maize and rice fertilization in July accounted for 44.89 % and 27.61 % of the total fertilizer-application-related NH3 emissions, followed by cotton fertilization (8.59 %). Even though wheat also contributed significantly to NH3 emissions (14.80 %), the emissions were primarily concentrated in April and September, accounting for 36.38 % and 23.47 % of the emissions from fertilizer application in these months, respectively.
3.4 Uncertainty and accuracy of the NH3 emission inventory
3.4.1 Uncertainty
Uncertainty in the estimated NH3 emissions results from both the activity level and EF input data. We ran 10 000 Monte Carlo simulations to estimate the range of NH3 emissions from each source with a 95 % confidence interval. The estimated total NH3 emission range was 10.5–16.0 Tg. The 95 % confidence intervals of fertilizer application, livestock waste, and others ranged from −20.5 % to 64.41 %, −23.0 % to 37.1 %, and −42.9 % to 62.4 % (Fig. 6). Due to the large amounts of NH3 emitted by fertilizers and livestock waste, the uncertainty in total NH3 emissions is mainly caused by the uncertainties in these two sources. The uncertainty in fertilizer application was slightly greater than that of livestock waste. The emission factors, especially the corrected EF, were the largest contributors to the uncertainties in fertilizer application emissions. Additionally, it is clear that NH3 emissions from other sources exhibited the largest uncertainty (−42.9 % to 62.4 %), mainly due to the high degree of uncertainty resulting from the many sub-sources, such as −77.1 % to 96.9 % of the transportation sector and −79.4 % to 122.7 % of the industrial sector. In comparison, the emissions from other sources were relatively small; hence, the large uncertainties in other sources did not have a significant impact on the uncertainty in total NH3 emissions.

Figure 6Uncertainties in NH3 emissions sourced from fertilizer application, livestock waste, and others.
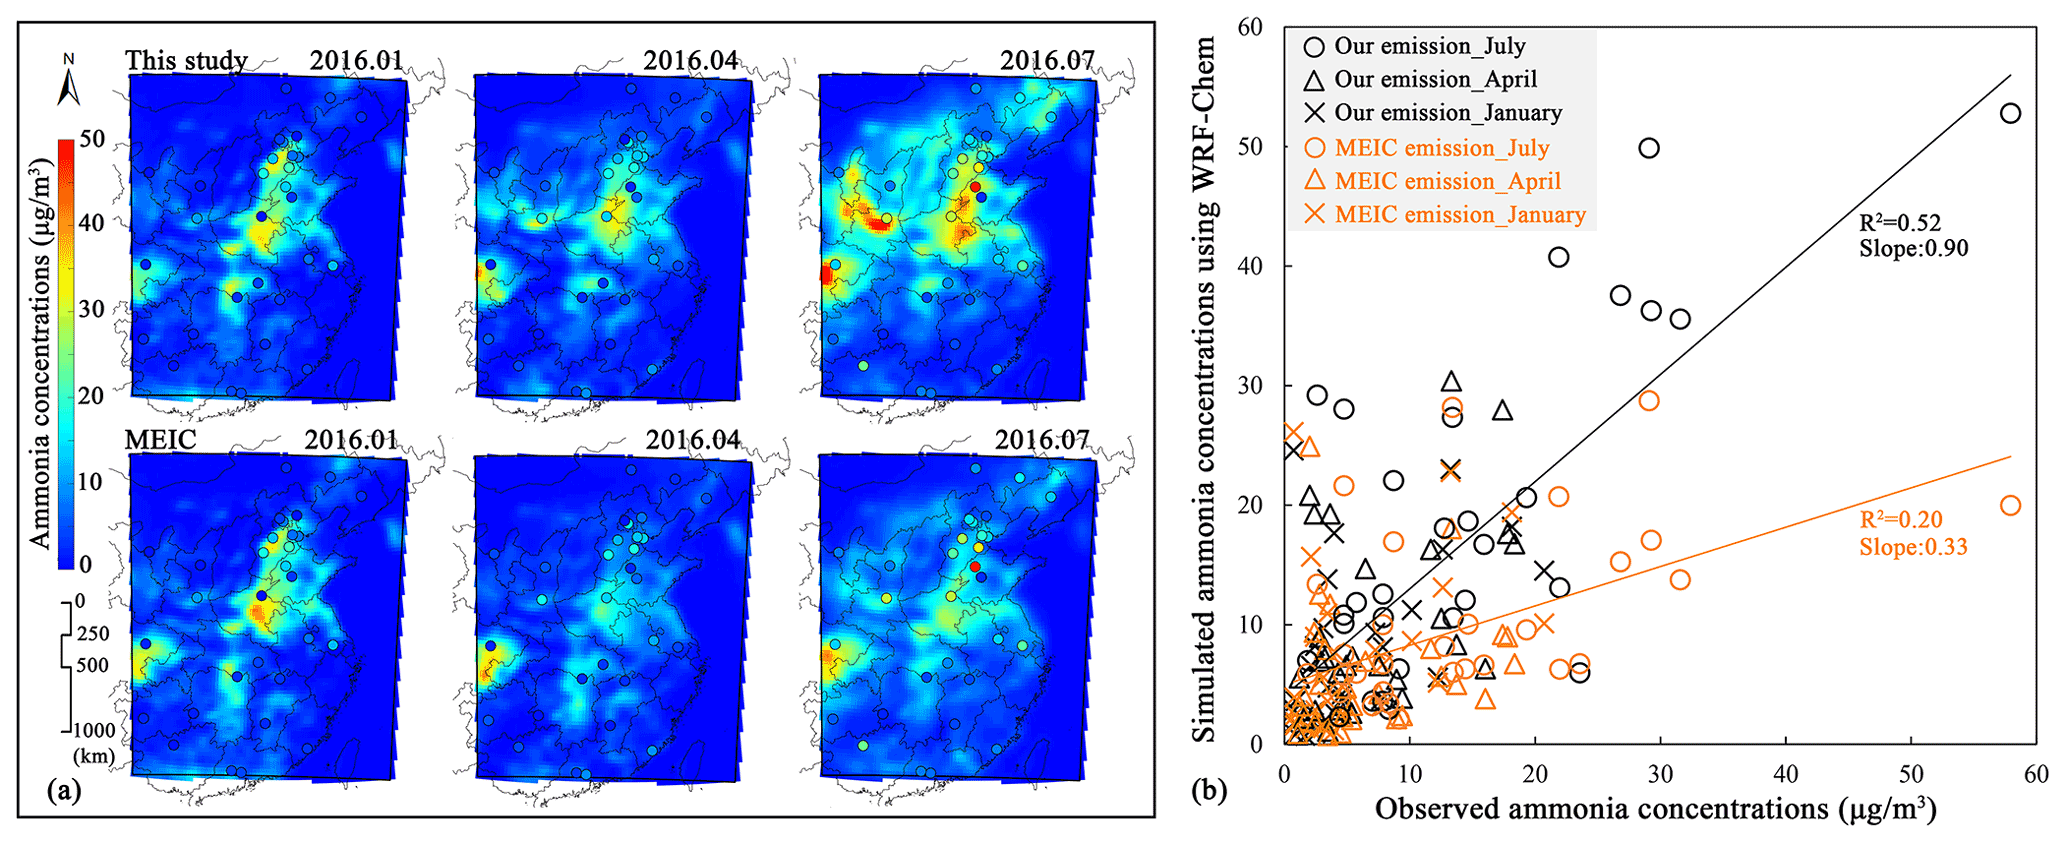
Figure 7(a) Spatial distribution of NH3 concentrations in 2016 from this study and the MEIC inventory. (b) Correlation between simulated NH3 concentrations from different emission inventories and ground observations obtained from AMoN-China.
3.4.2 Temporal accuracy of NH3 emission inventory
We verified the accuracy of the monthly NH3 emission trends obtained in this study by determining the correlation between the monthly IASI satellite observations and the monthly emissions of two inventories (MEIC and our study) in 2016. It was observed that the monthly trend of our inventory was significantly more correlated with the IASI data (R2=0.84) than the MEIC inventory (R2=0.70). The correlations of the monthly trends of the IASI data and the two inventories were also compared for different regions in China. The results showed that except for Central China, the correlations of the monthly trends between our inventory and IASI data were higher than those between the MEIC inventory and IASI data (Table 4). Additionally, the July-to-January emission ratio was used to further verify inventory accuracy, and it was observed that our emission inventory ratios were close to those based on IASI data for all regions of China. However, the ratios based on MEIC data were relatively lower, possibly owing to the underestimation of NH3 emissions in summer.
Table 4Comparison of the monthly NH3 emission trends corresponding to IASI satellite observations with the two inventories.

Note: the R2 value was obtained by fitting the 2016 monthly values between IASI satellite observations and the NH3 emissions from two inventories (MEIC and our study). The R2 values in bold represent improved monthly NH3 emission trend in our inventory compared to that of the MEIC inventory in the corresponding regions.
3.4.3 Spatial accuracy of our NH3 emission inventory
We compared the simulated NH3 concentration using WRF-Chem to ground observations obtained from AMoN-China in January, April, and July (Fig. 7a). Thus, it was observed that the spatial accuracy of our inventory was better than that of the MEIC inventory. Additionally, the simulated NH3 concentration based on our inventory showed high correlation with ground-based observations (R2=0.52), with a slope of 0.9 (close to 1). However, the correlation between the simulated concentration based on MEIC data and ground-based observations was relatively low, R2=0.20, with a slope of only 0.33 (Fig. 7b). The y intercepts of the trend lines between the ground observations and the simulated measurements using MEIC and our inventory were respectively 5.0 and 4.0. Positive intercepts mainly resulted from simulation results that overestimated the concentrations at relatively low values (Fig. 7b) (e.g., the simulation for January). However, the MEIC inventory may have underestimated the NH3 concentration in areas with a high emission density (e.g., the simulation for the North China Plain in July). For each month, we found similar results for the spatial accuracy of our inventory, which were better than that of the MEIC. The R2 values and slopes obtained by fitting the ground-based observations with the NH3 concentrations simulated via the MEIC yielded an R2 of 0.18 and slope of 0.54 in January, R2 of 0.01 and slope of 0.11 in April, and R2 of 0.21 and slope of 0.28 in July, which were significantly lower than those obtained by fitting the simulated NH3 concentrations using our inventory and the ground-based observations (R2 of 0.27 and slope of 0.68 in January, R2 of 0.23 and slope of 0.70 in April, and R2 of 0.53 and slope of 0.87 in July).
We also compared the NH3 VCDs based on IASI satellite observations with those from WRF-Chem based on the inventory established in this study and that based on MEIC data at a 0.25∘ resolution. The NH3 VCDs simulated using our inventory exhibited a similar distribution to that of the IASI VCDs (Fig. 8) and through a density scatterplot were shown to have a better spatial accuracy than that of the MEIC inventory (Fig. S3). In April and July, fitting the NH3 VCDs, simulated with our inventory, with the IASI-based VCDs returned coefficients of determination of 0.41 and 0.42, higher than those obtained by fitting the NH3 VCDs based on MEIC data and IASI data (0.37 and 0.28) (Fig. S3). We observed that the MEIC-based NH3 emissions were significantly underestimated for April and July (a slope of only 0.18 and 0.22). The normalized mean biases (NMBs) between IASI VCDs and MEIC-simulated NH3 VCDs were −76.3 % and −42.5 % in April and July, respectively. For our simulated NH3 VCDs, they were −64.9 % and 6.1 %, respectively. Furthermore, in January and October the spatial accuracy of our inventory (NMB: −23.8 % in January, −10.4 % in October) was better than that of the corresponding MEIC inventory (NMB: −26.5 % in January, −22.9 % in October).
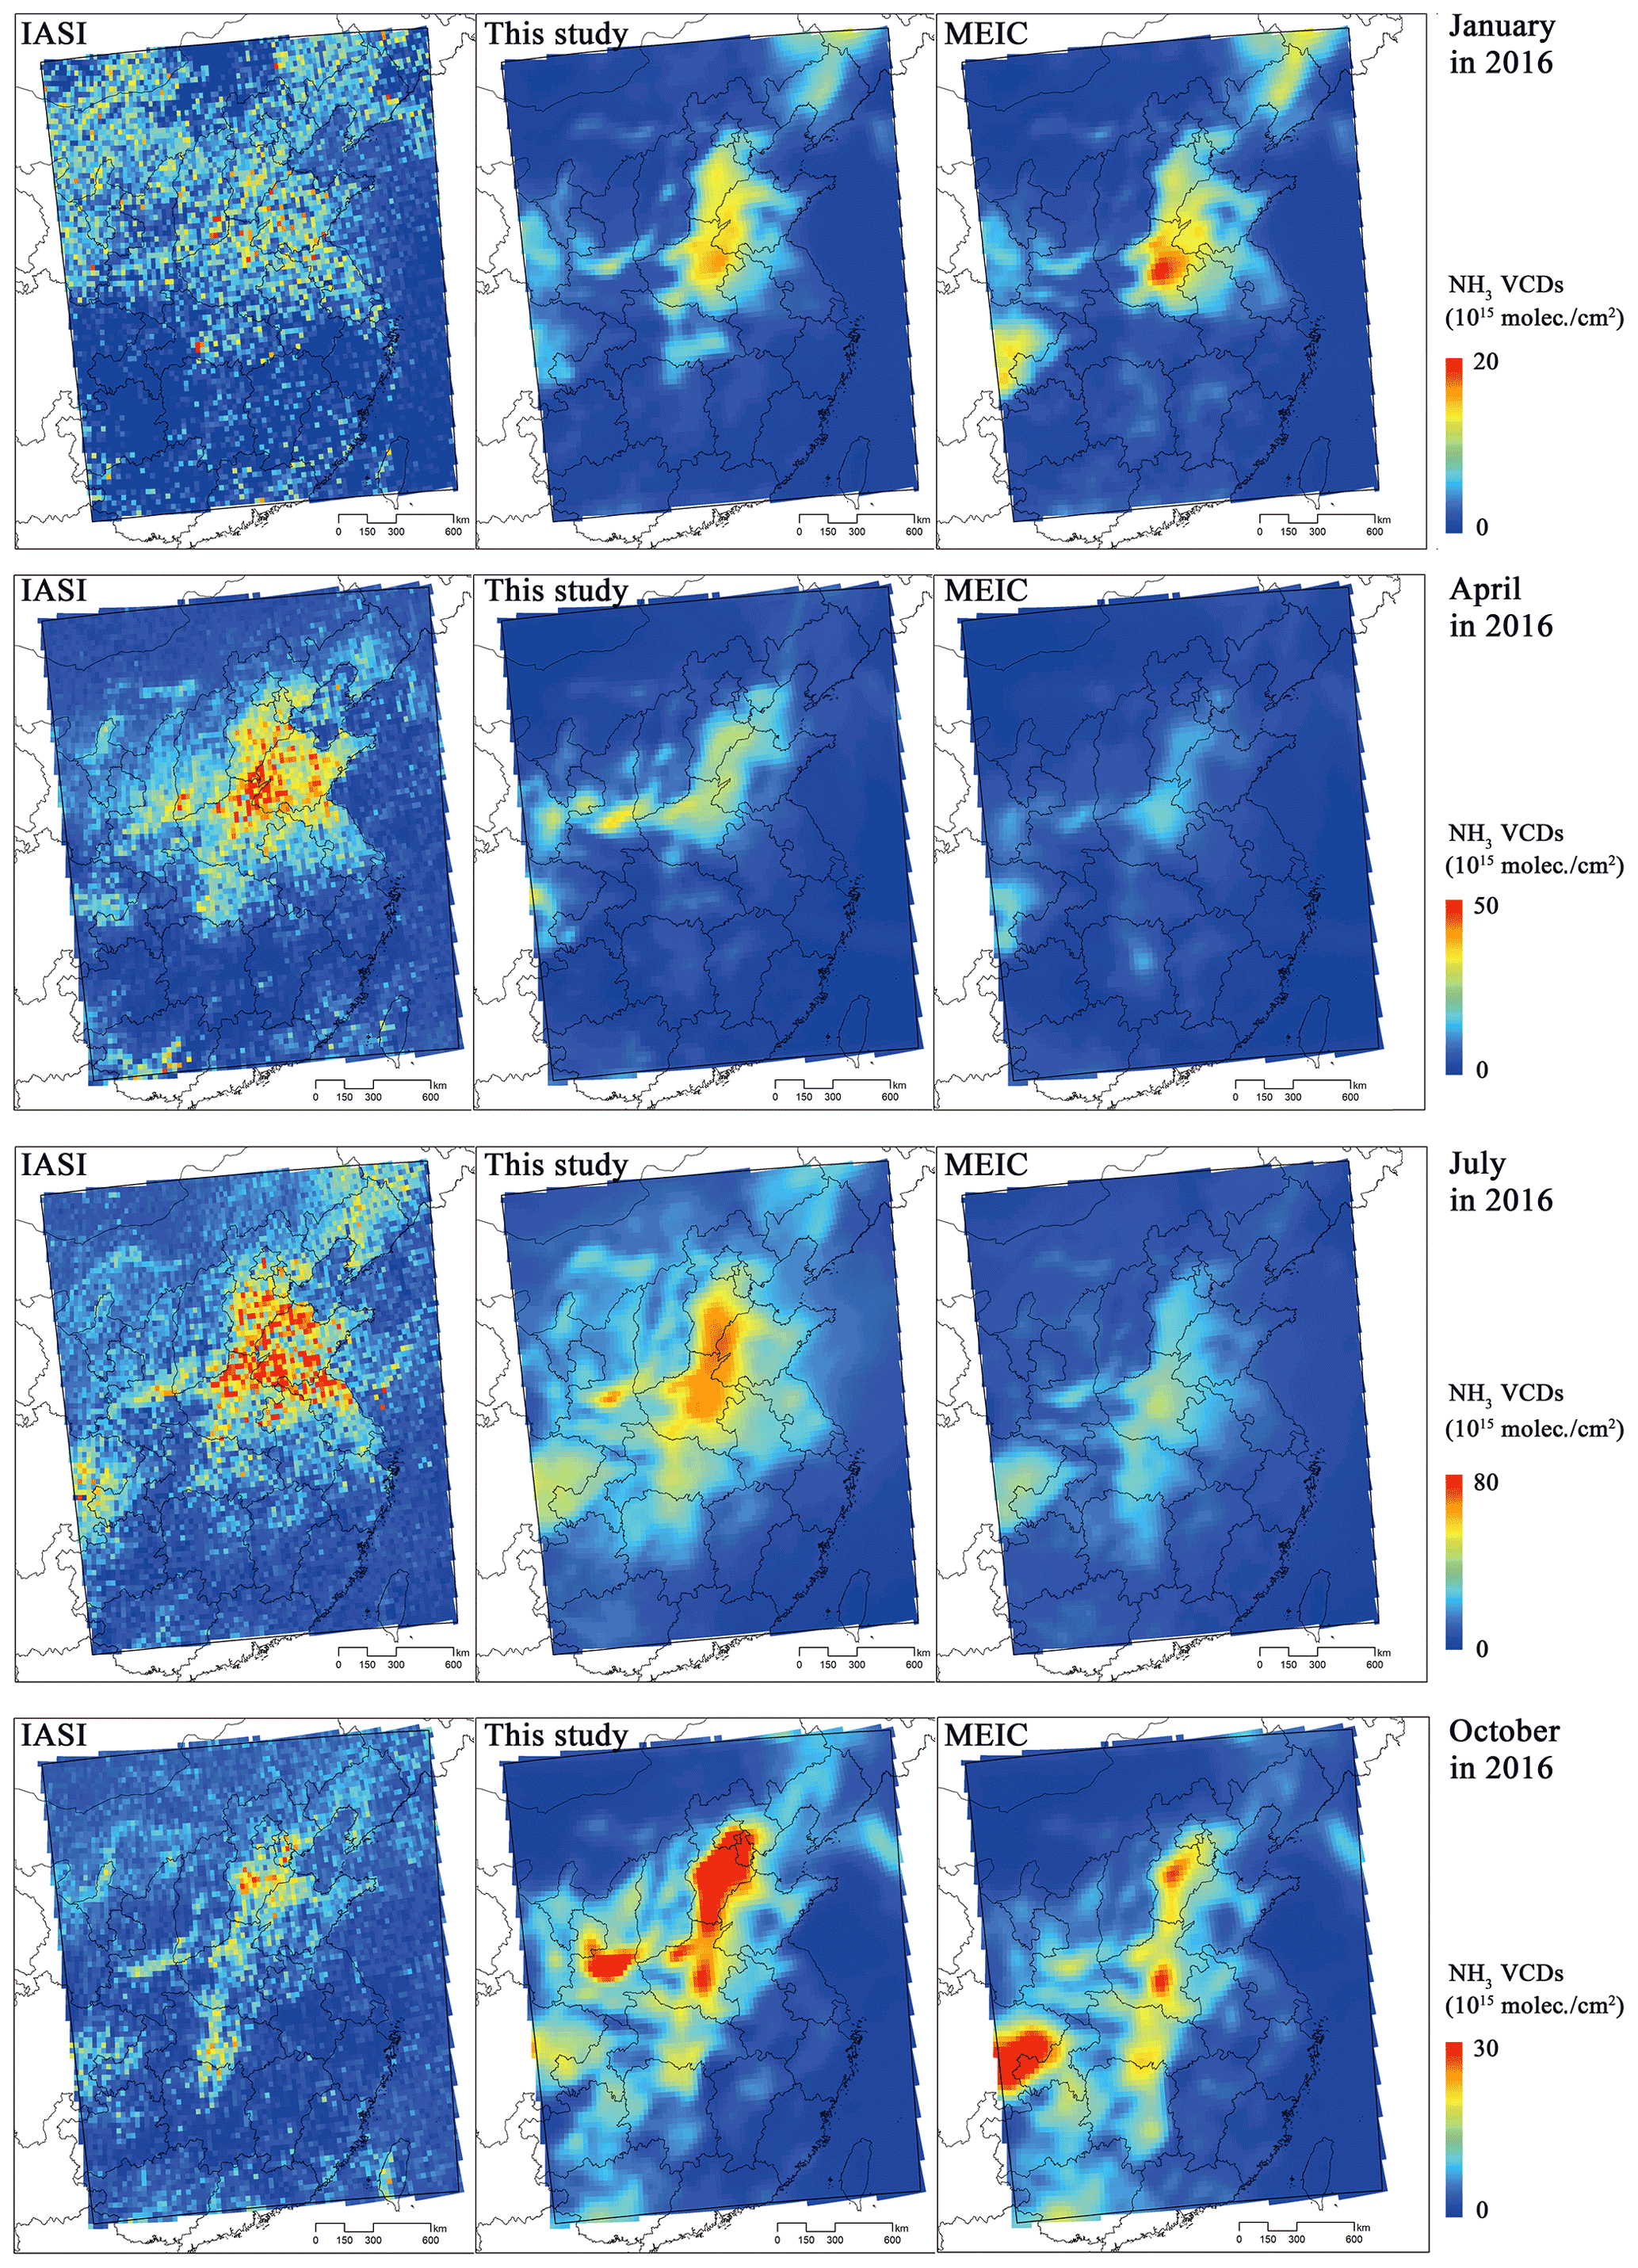
Figure 8The spatial distribution of IASI NH3 VCDs and NH3 VCDs from WRF-Chem based on the two inventories in January, April, July, and October (2016). Different color scales represent different months to indicate the spatial distribution of the NH3 VCDs.
In general, our inventory exhibited better spatial accuracy than other inventories that utilize WRF-Chem and observations, although January and October showed a relatively large bias between measured and simulated data. The NH3 concentrations were low in these 2 months. We found that the accuracy of the simulation increased as the concentration of atmospheric NH3 increased. The mean values of IASI NH3 VCDs in the simulation domain in January and October were 7.2×10¹⁵ and 8.7×10¹⁵ molec. cm−2, respectively, significantly lower than the mean values of 14.9×10¹⁵ and 19.4×10¹⁵ molec. cm−2 in April and July. In January and October, the relatively low NH3 emissions (32.5 % and 54.6 % of July emissions) combined with the short lifetime of NH3 and uncertainties in gaseous NH3 and aerosol partitioning pose a challenge to the chemical mechanisms of the WRF-Chem model, making it more difficult for the model to fully capture the heterogeneity of NH3 concentration. Besides, the relatively large uncertainty in the IASI VCDs could also contribute to inconsistency between simulated and observed concentrations (Van Damme et al., 2017; Chen et al., 2020). Zhang et al. (2018) and Zhao et al. (2020) obtained similar results, which indicated that the correlations between measured and simulated NH3 data were lower in January and October than during the other 2 months.
NH3 – an important component of the nitrogen cycle – can accelerate the formation of SIAs. Even though several effective measures have been taken to reduce SO2 and NOx emissions, the concentration of NH3 in the atmosphere continues to rise, and unfortunately, gridded NH3 emission inventories for China still have large uncertainties. Therefore, establishing and improving such gridded NH3 emission inventories can optimize the simulation results of chemical transport models such as WRF-Chem; this is of great significance in regional pollution control. Therefore, in this study, we focused on improving NH3 emission inventories owing to fertilizer application. To this end, we comprehensively evaluated the times and dates of fertilizer application to the major crops that are cultivated in different regions in China, improved the spatial allocation methods for NH3 emissions from different rice types, and established a gridded NH3 emission inventory for mainland China (2016) with a 5 min × 5 min resolution.
The atmospheric ammonia emission in mainland China was found to be 12.11 Tg, and the average emission density was 1.28 t km−2. Livestock waste (44.8 %) and fertilization application (38.6%) were identified as the two major NH3 emission sources in China. On the one hand, beef and dairy cow breeding contributed the most to livestock-waste-related NH3 emissions, with the free-range system accounting for more than half of the emissions from livestock waste. On the other hand, urea (45.4 %) and NPK (26.7 %) applications were identified as the main fertilizer-application-related NH3 emission sources. NH3 emissions from the cultivation of maize, vegetables, rice, and wheat (25.94 %, 19.06 %, 17.47 %, and 14.8 %, respectively) accounted for over 75 % of the total emissions from fertilizer application, and in addition to showing the top two emission densities, Shandong and Henan provinces also showed the top two emission amounts in mainland China, reaching 1.13 and 1.08 Tg, respectively. The highest emission (1.68 Tg) was recorded in July and the lowest (0.55 Tg) in January. We also observed a strong correlation between the monthly trend of NH3 emissions based on IASI satellite observations and that established in this study (R2=0.84). This monthly variation in NH3 emissions was primarily due to the effect of the farming season on the fertilization process. Specifically, the fertilization of maize and rice in summer was primarily responsible for the increase in NH3 emissions in China. Additionally, the evaluation of the spatial and temporal accuracies of the NH3 emission inventories obtained in this study using WRF-Chem and AMoN-China observations as well as IASI VCDs indicated that the accuracy of our inventory is better than that of other inventories.
We believe that the improved NH3 emission inventory can be used in future research to simulate atmospheric aerosol formation, investigate the influence of NH3 emission on PM2.5 mass burden and aerosol pH changes, develop targeted NH3 reduction strategies to further improve air quality, and explore the atmospheric N cycle process.
The gridded ammonia emission inventory is archived on Zenodo (https://doi.org/10.5281/zenodo.5516929; Li, 2021). The ammonia emissions for each source are available upon request from the first author Baojie Li (baojieli@nuist.edu.cn) or the corresponding author Hong Liao (hongliao@nuist.edu.cn).
The supplement related to this article is available online at: https://doi.org/10.5194/acp-21-15883-2021-supplement.
BL and HL designed and performed this study. LC performed the WRF-Chem simulations and data analysis. JJ contributed the monthly IASI data. WS, TW, PW, and YY discussed the results and commented on the paper.
The contact author has declared that neither they nor their co-authors have any competing interests.
Publisher's note: Copernicus Publications remains neutral with regard to jurisdictional claims in published maps and institutional affiliations.
We acknowledge the Centre National d'Études spatiales (CNES, France) and MEIC team for making their data publicly available. We also thank Yuepeng Pan from the Institute of Atmospheric Physics, Chinese Academy of Sciences, for publishing the observed NH3 concentration data (AMoN-China) (Pan et al., 2018), which is helpful for the verification of the NH3 emission inventory.
This research has been supported by the National Natural Science Foundation of China (grant no. 42007381), the Natural Science Foundation of Jiangsu Province (grant no. BK20200812), and the National Key Research and Development Program of China (grant no. 2020YFA0607803).
This paper was edited by Eleanor Browne and reviewed by two anonymous referees.
Backes, A., Aulinger, A., Bieser, J., Matthias, V., and Quante, M.: Ammonia emissions in Europe, part I: Development of a dynamical ammonia emission inventory, Atmos Environ, 131, 55-66, 10.1016/j.atmosenv.2016.01.041, 2016.
Bouwman, A., Boumans, L., and Batjes, N.: Estimation of global NH3 volatilization loss from synthetic fertilizers and animal manure applied to arable lands and grasslands, Global Biogeochem. Cy., 16, 8-1–8-14, 2002.
Bouwman, A. F., Lee, D. S., Asman, W. A. H., Dentener, F. J., Van Der Hoek, K. W., and Olivier, J. G. J.: A global high-resolution emission inventory for ammonia, Global Biogeochem. Cy., 11, 561–587, https://doi.org/10.1029/97GB02266, 1997.
Cai, G. X., Chen, D. L., Ding, H., Pacholski, A., Fan, X. H., and Zhu, Z. L.: Nitrogen losses from fertilizers applied to maize, wheat and rice in the North China Plain, Nut. Cycl. Agroecosyst., 63, 187–195, https://doi.org/10.1023/A:1021198724250, 2002.
Chang, Y. H., Zou, Z., Deng, C. R., Huang, K., Collett, J. L., Lin, J., and Zhuang, G. S.: The importance of vehicle emissions as a source of atmospheric ammonia in the megacity of Shanghai, Atmos. Chem. Phys., 16, 3577–3594, https://doi.org/10.5194/acp-16-3577-2016, 2016.
Chen, S. H., Cheng, M. M., Guo, Z., Xu, W., Du, X. H., and Li, Y.: Enhanced atmospheric ammonia (NH3) pollution in China from 2008 to 2016: Evidence from a combination of observations and emissions, Environ. Pollut., 263, 114421, https://doi.org/10.1016/j.envpol.2020.114421, 2020.
Cong, H., Zhao, L., Wang, J., and Yao, Z.: Current situation and development demand analysis of rural energy in China, Trans. Chin. Soc. Agricult. Eng., 33, 224–231, 2017.
Crippa, M., Solazzo, E., Huang, G. L., Guizzardi, D., Koffi, E., Muntean, M., Schieberle, C., Friedrich, R., and Janssens-Maenhout, G.: High resolution temporal profiles in the Emissions Database for Global Atmospheric Research, Scient. Data, 7, 121, https://doi.org/10.1038/s41597-020-0462-2, 2020.
Ding, A. J., Huang, X., Nie, W., Sun, J. N., Kerminen, V. M., Petaja, T., Su, H., Cheng, Y. F., Yang, X. Q., Wang, M. H., Chi, X. G., Wang, J. P., Virkkula, A., Guo, W. D., Yuan, J., Wang, S. Y., Zhang, R. J., Wu, Y. F., Song, Y., Zhu, T., Zilitinkevich, S., Kulmala, M., and Fu, C. B.: Enhanced haze pollution by black carbon in megacities in China, Geophys. Res. Lett., 43, 2873–2879, https://doi.org/10.1002/2016gl067745, 2016.
Dong, Y., Chen, C., Huang, C., Wang, H., Li, L., Dai, P., and Jia, J.: Anthropogenic emissions and distribution of ammonia over the Yangtze River Delta, Acta Scientiae Circumstantiae, 29, 1611–1617, 2009.
EEA – European Environment Agency: EMEP/CORINAIR Air Pollutant Emission Inventory Guidebook-2019, 3.B Manure management, available at: https://www.eea.europa.eu/publications/emep-eea-guidebook-2019/part-b-sectoral-guidance-chapters/4-agriculture/ (last access: 25 May 2021), 2019.
Elser, M., Huang, R. J., Wolf, R., Slowik, J. G., Wang, Q. Y., Canonaco, F., Li, G. H., Bozzetti, C., Daellenbach, K. R., Huang, Y., Zhang, R. J., Li, Z. Q., Cao, J. J., Baltensperger, U., El-Haddad, I., and Prévôt, A. S. H.: New insights into PM2.5 chemical composition and sources in two major cities in China during extreme haze events using aerosol mass spectrometry, Atmos. Chem. Phys., 16, 3207–3225, https://doi.org/10.5194/acp-16-3207-2016, 2016.
Farren, N. J., Davison, J., Rose, R. A., Wagner, R. L., and Carslaw, D. C.: Underestimated Ammonia Emissions from Road Vehicles, Environ. Sci. Technol., 54, 15689–15697, https://doi.org/10.1021/acs.est.0c05839, 2020.
Fu, X., Wang, S. X., Ran, L. M., Pleim, J. E., Cooter, E., Bash, J. O., Benson, V., and Hao, J. M.: Estimating NH3 emissions from agricultural fertilizer application in China using the bi-directional CMAQ model coupled to an agro-ecosystem model, Atmos. Chem. Phys., 15, 6637–6649, https://doi.org/10.5194/acp-15-6637-2015, 2015.
Fu, X., Wang, S., Xing, J., Zhang, X., Wang, T., and Hao, J.: Increasing Ammonia Concentrations Reduce the Effectiveness of Particle Pollution Control Achieved via SO2 and NOX Emissions Reduction in East China, Environ. Sci. Technol. Lett., 4, 221–227, https://doi.org/10.1021/acs.estlett.7b00143, 2017.
Gyldenkærne, S., Ambelas Skjøth, C., Hertel, O., and Ellermann, T.: A dynamical ammonia emission parameterization for use in air pollution models, J. Geophys. Res.-Atmos., 110, D07108, https://doi.org/10.1029/2004JD005459, 2005.
Han, X., Zhu, L. Y., Liu, M. X., Song, Y., and Zhang, M. G.: Numerical analysis of agricultural emissions impacts on PM2.5 in China using a high-resolution ammonia emission inventory, Atmos. Chem. Phys., 20, 9979–9996, https://doi.org/10.5194/acp-20-9979-2020, 2020.
Hu, Y., Cheng, H., and Tao, S.: Environmental and human health challenges of industrial livestock and poultry farming in China and their mitigation, Environ. Int., 107, 111–130, https://doi.org/10.1016/j.envint.2017.07.003, 2017.
Huang, X., Song, Y., Li, M. M., Li, J. F., Huo, Q., Cai, X. H., Zhu, T., Hu, M., and Zhang, H. S.: A high-resolution ammonia emission inventory in China, Global Biogeochem. Cy., 26, Gb1030, https://doi.org/10.1029/2011gb004161, 2012.
Kang, Y. N., Liu, M. X., Song, Y., Huang, X., Yao, H., Cai, X. H., Zhang, H. S., Kang, L., Liu, X. J., Yan, X. Y., He, H., Zhang, Q., Shao, M., and Zhu, T.: High-resolution ammonia emissions inventories in China from 1980 to 2012, Atmos. Chem. Phys., 16, 2043–2058, https://doi.org/10.5194/acp-16-2043-2016, 2016.
Kong, L., Tang, X., Zhu, J., Wang, Z. F., Pan, Y. P., Wu, H. J., Wu, L., Wu, Q. Z., He, Y. X., Tian, S. L., Xie, Y. Z., Liu, Z. R., Sui, W. X., Han, L. N., and Carmichael, G.: Improved Inversion of Monthly Ammonia Emissions in China Based on the Chinese Ammonia Monitoring Network and Ensemble Kalman Filter, Environ. Sci. Technol., 53, 12529–12538, https://doi.org/10.1021/acs.est.9b02701, 2019.
Kurokawa, J. and Ohara, T.: Long-term historical trends in air pollutant emissions in Asia: Regional Emission inventory in ASia (REAS) version 3, Atmos. Chem. Phys., 20, 12761–12793, https://doi.org/10.5194/acp-20-12761-2020, 2020.
Li, B.: Gridded ammonia emission inventory in mainland China (v1.0), Zenodo [data set], https://doi.org/10.5281/zenodo.5516929z, 2021.
Li, B., Zhou, S., Wang, T., Sui, X., Jia, Z., Li, Y., Wang, J., and Wu, S.: An improved gridded polycyclic aromatic hydrocarbon emission inventory for the lower reaches of the Yangtze River Delta region from 2001 to 2015 using satellite data, J. Hazard. Mater., 360, 329–339, 2018.
Li, B., Wang, J., Wu, S., Jia, Z., Li, Y., Wang, T., and Zhou, S.: New Method for Improving Spatial Allocation Accuracy of Industrial Energy Consumption and Implications for Polycyclic Aromatic Hydrocarbon Emissions in China, Environ. Sci. Technol., 53, 4326–4334, https://doi.org/10.1021/acs.est.8b06915, 2019.
Li, K., Jacob, D. J., Liao, H., Zhu, J., Shah, V., Shen, L., Bates, K. H., Zhang, Q., and Zhai, S.: A two-pollutant strategy for improving ozone and particulate air quality in China, Nat. Geosci., 12, 906–910, https://doi.org/10.1038/s41561-019-0464-x, 2019.
Li, M., Liu, H., Geng, G. N., Hong, C. P., Liu, F., Song, Y., Tong, D., Zheng, B., Cui, H. Y., Man, H. Y., Zhang, Q., and He, K. B.: Anthropogenic emission inventories in China: a review, Nat. Sci. Rev., 4, 834–866, https://doi.org/10.1093/nsr/nwx150, 2017a.
Li, M., Zhang, Q., Kurokawa, J. I., Woo, J. H., He, K., Lu, Z., Ohara, T., Song, Y., Streets, D. G., Carmichael, G. R., Cheng, Y., Hong, C., Huo, H., Jiang, X., Kang, S., Liu, F., Su, H., and Zheng, B.: MIX: a mosaic Asian anthropogenic emission inventory under the international collaboration framework of the MICS-Asia and HTAP, Atmos. Chem. Phys., 17, 935–963, https://doi.org/10.5194/acp-17-935-2017, 2017b.
Liu, L., Zhang, X. Y., Wong, A. Y. H., Xu, W., Liu, X. J., Li, Y., Mi, H., Lu, X. H., Zhao, L. M., Wang, Z., Wu, X. D., and Wei, J.: Estimating global surface ammonia concentrations inferred from satellite retrievals, Atmos. Chem. Phys., 19, 12051–12066, https://doi.org/10.5194/acp-19-12051-2019, 2019.
Liu, M. X., Huang, X., Song, Y., Tang, J., Cao, J. J., Zhang, X. Y., Zhang, Q., Wang, S. X., Xu, T. T., Kang, L., Cai, X. H., Zhang, H. S., Yang, F. M., Wang, H. B., Yu, J. Z., Lau, A. K. H., He, L. Y., Huang, X. F., Duan, L., Ding, A. J., Xue, L. K., Gao, J., Liu, B., and Zhu, T.: Ammonia emission control in China would mitigate haze pollution and nitrogen deposition, but worsen acid rain, P. Natl. Acad. Sci. USA, 116, 7760–7765, https://doi.org/10.1073/pnas.1814880116, 2019.
Liu, X. J., Zhang, Y., Han, W. X., Tang, A. H., Shen, J. L., Cui, Z. L., Vitousek, P., Erisman, J. W., Goulding, K., Christie, P., Fangmeier, A., and Zhang, F. S.: Enhanced nitrogen deposition over China, Nature, 494, 459–462, https://doi.org/10.1038/nature11917, 2013.
MARA – Ministry of Agriculture and Rural Affairs of China: China Animal Husbandry and Veterinary Yearbook, China Agriculture Press, Beijing, 2017.
Meng, W., Zhong, Q., Yun, X., Zhu, X., Huang, T., Shen, H., Chen, Y., Chen, H., Zhou, F., Liu, J., Wang, X., Zeng, E. Y., and Tao, S.: Improvement of a Global High-Resolution Ammonia Emission Inventory for Combustion and Industrial Sources with New Data from the Residential and Transportation Sectors, Environ. Sci. Technol., 51, 2821–2829, https://doi.org/10.1021/acs.est.6b03694, 2017.
MEP – Ministry of Environmental Protection: The Guideline of Emission Inventory Development for Atmospheric Ammonia, available at: https://www.mee.gov.cn/gkml/hbb/bgg/201408/t20140828_288364.htm (last access: 11 October 2021), 2014.
Monfreda, C., Ramankutty, N., and Foley, J. A.: Farming the planet: 2. Geographic distribution of crop areas, yields, physiological types, and net primary production in the year 2000, Global Biogeochem. Cy., 22, GB1022, https://doi.org/10.1029/2007GB002947, 2008.
NBS – National Bureau of Statistics: China Energy Statistical Yearbook 2016, China Statistics Press, Beijing, 2017a.
NBS – National Bureau of Statistics: China Industry Statistical Yearbook 2016, China Statistics Press, Beijing, 2017b.
NBS – National Bureau of Statistics: China Statistical Yearbook 2016, China Statistics Press, Beijing, 2017c.
NBS – National Bureau of Statistics: China Statistical Yearbook of Environment 2016, China Statistics Press, Beijing, 2017d.
NDRC – National Development and Reform Commission of China: National data on the cost and profit of agricultural product 2016, China Statistics Press, Beijing, 2017.
Pan, Y. P., Tian, S. L., Zhao, Y. H., Zhang, L., Zhu, X. Y., Gao, J., Huang, W., Zhou, Y. B., Song, Y., Zhang, Q., and Wang, Y. S.: Identifying Ammonia Hotspots in China Using a National Observation Network, Environ. Sci. Technol., 52, 3926–3934, https://doi.org/10.1021/acs.est.7b05235, 2018.
Paulot, F. and Jacob, D. J.: Hidden Cost of U.S. Agricultural Exports: Particulate Matter from Ammonia Emissions, Environ. Sci. Technol., 48, 903–908, https://doi.org/10.1021/es4034793, 2014.
Paulot, F., Jacob, D. J., Pinder, R. W., Bash, J. O., Travis, K., and Henze, D. K.: Ammonia emissions in the United States, European Union, and China derived by high-resolution inversion of ammonium wet deposition data: Interpretation with a new agricultural emissions inventory (MASAGE_NH3), J. Geophys. Res.-Atmos., 119, 4343–4364, https://doi.org/10.1002/2013jd021130, 2014.
Qian, Y., Song, K., Hu, T., and Ying, T.: Environmental status of livestock and poultry sectors in China under current transformation stage, Sci. Total Environ., 622–623, 702–709, https://doi.org/10.1016/j.scitotenv.2017.12.045, 2018.
Qiu, B., Qi, W., Tang, Z., Chen, C., and Wang, X.: Rice cropping density and intensity lessened in southeast China during the twenty-first century, Environ. Monit. Assess., 188, 5, https://doi.org/10.1007/s10661-015-5004-6, 2015.
Qiu, X., Duan, L., Chai, F., Wang, S., Yu, Q., and Wang, S.: Deriving High-Resolution Emission Inventory of Open Biomass Burning in China based on Satellite Observations, Environ. Sci. Technol., 50, 11779–11786, 2016.
Sheppard, L. J., Leith, I. D., Mizunuma, T., Neil Cape, J., Crossley, A., Leeson, S., Sutton, M. A., van Dijk, N., and Fowler, D.: Dry deposition of ammonia gas drives species change faster than wet deposition of ammonium ions: evidence from a long-term field manipulation, Global Change Biol., 17, 3589–3607, https://doi.org/10.1111/j.1365-2486.2011.02478.x, 2011.
Streets, D. G., Bond, T., Carmichael, G., Fernandes, S., Fu, Q., He, D., Klimont, Z., Nelson, S., Tsai, N., and Wang, M. Q.: An inventory of gaseous and primary aerosol emissions in Asia in the year 2000, J. Geophys. Res.-Atmos., 108, 8809, https://doi.org/10.1029/2002JD003093, 2003.
Van Damme, M., Clarisse, L., Heald, C. L., Hurtmans, D., Ngadi, Y., Clerbaux, C., Dolman, A. J., Erisman, J. W., and Coheur, P. F.: Global distributions, time series and error characterization of atmospheric ammonia (NH3) from IASI satellite observations, Atmos. Chem. Phys., 14, 2905–2922, https://doi.org/10.5194/acp-14-2905-2014, 2014.
Van Damme, M., Clarisse, L., Dammers, E., Liu, X., Nowak, J. B., Clerbaux, C., Flechard, C. R., Galy-Lacaux, C., Xu, W., Neuman, J. A., Tang, Y. S., Sutton, M. A., Erisman, J. W., and Coheur, P. F.: Towards validation of ammonia (NH3) measurements from the IASI satellite, Atmos. Meas. Tech., 8, 1575–1591, https://doi.org/10.5194/amt-8-1575-2015, 2015.
Van Damme, M., Whitburn, S., Clarisse, L., Clerbaux, C., Hurtmans, D., and Coheur, P. F.: Version 2 of the IASI NH3 neural network retrieval algorithm: near-real-time and reanalysed datasets, Atmos. Meas. Tech., 10, 4905–4914, https://doi.org/10.5194/amt-10-4905-2017, 2017.
Wang, G. H., Zhang, R. Y., Gomez, M. E., Yang, L. X., Zamora, M. L., Hu, M., Lin, Y., Peng, J. F., Guo, S., Meng, J. J., Li, J. J., Cheng, C. L., Hu, T. F., Ren, Y. Q., Wang, Y. S., Gao, J., Cao, J. J., An, Z. S., Zhou, W. J., Li, G. H., Wang, J. Y., Tian, P. F., Marrero-Ortiz, W., Secrest, J., Du, Z. F., Zheng, J., Shang, D. J., Zeng, L. M., Shao, M., Wang, W. G., Huang, Y., Wang, Y., Zhu, Y. J., Li, Y. X., Hu, J. X., Pan, B., Cai, L., Cheng, Y. T., Ji, Y. M., Zhang, F., Rosenfeld, D., Liss, P. S., Duce, R. A., Kolb, C. E., and Molina, M. J.: Persistent sulfate formation from London Fog to Chinese haze, P. Natl. Acad. Sci. USA, 113, 13630–13635, https://doi.org/10.1073/pnas.1616540113, 2016.
Wang, J., Ma, W., Jiang, R., and Zhang, F.: Analysis about Amount and Ratio of Basal Fertilizer and Topdressing Fertilizer on Rice, Wheat, Maize in China, Chin. J. Soil Sci., 39, 329–333, https://doi.org/10.19336/j.cnki.trtb.2008.02.024, 2008.
Wang, X., Zou, C., Gao, X., Guan, X., Zhang, Y., Shi, X., and Chen, X.: Nitrate leaching from open-field and greenhouse vegetable systems in China: a meta-analysis, Environ. Sci. Pollut. Res., 25, 31007–31016, https://doi.org/10.1007/s11356-018-3082-z, 2018.
Wang, Y., Zhang, Q. Q., He, K., Zhang, Q., and Chai, L.: Sulfate-nitrate-ammonium aerosols over China: response to 2000–2015 emission changes of sulfur dioxide, nitrogen oxides, and ammonia, Atmos. Chem. Phys., 13, 2635–2652, https://doi.org/10.5194/acp-13-2635-2013, 2013.
Warner, J. X., Dickerson, R. R., Wei, Z., Strow, L. L., Wang, Y., and Liang, Q.: Increased atmospheric ammonia over the world's major agricultural areas detected from space, Geophys. Res. Lett., 44, 2875–2884, https://doi.org/10.1002/2016gl072305, 2017.
Xia, L., Li, X., Ma, Q., Lam, S. K., Wolf, B., Kiese, R., Butterbach-Bahl, K., Chen, D., Li, Z., and Yan, X.: Simultaneous quantification of N2, NH3 and N2O emissions from a flooded paddy field under different N fertilization regimes, Global Change Biol., 26, 2292–2303, https://doi.org/10.1111/gcb.14958, 2020.
Xu, P., Zhang, Y. S., Gong, W. W., Hou, X. K., Kroeze, C., Gao, W., and Luan, S. J.: An inventory of the emission of ammonia from agricultural fertilizer application in China for 2010 and its high-resolution spatial distribution, Atmos. Environ., 115, 141–148, https://doi.org/10.1016/j.atmosenv.2015.05.020, 2015.
Xu, P., Liao, Y. J., Lin, Y. H., Zhao, C. X., Yan, C. H., Cao, M. N., Wang, G. S., and Luan, S. J.: High-resolution inventory of ammonia emissions from agricultural fertilizer in China from 1978 to 2008, Atmos. Chem. Phys., 16, 1207–1218, https://doi.org/10.5194/acp-16-1207-2016, 2016.
Xu, P., Koloutsou-Vakakis, S., Rood, M. J., and Luan, S.: Projections of NH3 emissions from manure generated by livestock production in China to 2030 under six mitigation scenarios, Sci. Total Environ., 607, 78–86, https://doi.org/10.1016/j.scitotenv.2017.06.258, 2017.
Zhang, F., Chen, X., and Chen, Q.: Fertilization Guide for Major Crops in China, China Agricultural University Press, Beijing, 2009.
Zhang, L., Chen, Y. F., Zhao, Y. H., Henze, D. K., Zhu, L. Y., Song, Y., Paulot, F., Liu, X. J., Pan, Y. P., Lin, Y., and Huang, B. X.: Agricultural ammonia emissions in China: reconciling bottom-up and top-down estimates, Atmos. Chem. Phys., 18, 339–355, https://doi.org/10.5194/acp-18-339-2018, 2018.
Zhang, Q., Zheng, Y., Tong, D., Shao, M., Wang, S., Zhang, Y., Xu, X., Wang, J., He, H., and Liu, W.: Drivers of improved PM2.5 air quality in China from 2013 to 2017, P. Natl. Acad. Sci. USA, 116, 24463–24469, 2019.
Zhang, W. and Zhang, F.: Report on the development of fertilizer in China, China Agricultural University Press, Beijing, 2012.
Zhang, X. M., Wu, Y. Y., Liu, X. J., Reis, S., Jin, J. X., Dragosits, U., Van Damme, M., Clarisse, L., Whitburn, S., Coheur, P. F., and Gu, B. J.: Ammonia Emissions May Be Substantially Underestimated in China, Environ. Sci. Technol., 51, 12089–12096, https://doi.org/10.1021/acs.est.7b02171, 2017.
Zhao, B., Wang, S. X., Wang, J. D., Fu, J. S., Liu, T. H., Xu, J. Y., Fu, X., and Hao, J. M.: Impact of national NOx and SO2 control policies on particulate matter pollution in China, Atmos. Environ., 77, 453–463, https://doi.org/10.1016/j.atmosenv.2013.05.012, 2013.
Zhao, Y., Nielsen, C. P., Lei, Y., McElroy, M. B., and Hao, J.: Quantifying the uncertainties of a bottom-up emission inventory of anthropogenic atmospheric pollutants in China, Atmos. Chem. Phys., 11, 2295–2308, https://doi.org/10.5194/acp-11-2295-2011, 2011.
Zhao, Y., Yuan, M. C., Huang, X., Chen, F., and Zhang, J.: Quantification and evaluation of atmospheric ammonia emissions with different methods: a case study for the Yangtze River Delta region, China, Atmos. Chem. Phys., 20, 4275–4294, https://doi.org/10.5194/acp-20-4275-2020, 2020.
Zheng, B., Tong, D., Li, M., Liu, F., Hong, C., Geng, G., Li, H., Li, X., Peng, L., Qi, J., Yan, L., Zhang, Y., Zhao, H., Zheng, Y., He, K., and Zhang, Q.: Trends in China's anthropogenic emissions since 2010 as the consequence of clean air actions, Atmos. Chem. Phys., 18, 14095–14111, https://doi.org/10.5194/acp-18-14095-2018, 2018.
Zhou, F., Ciais, P., Hayashi, K., Galloway, J., Kim, D. G., Yang, C. L., Li, S. Y., Liu, B., Shang, Z. Y., and Gao, S. S.: Re-estimating NH3 Emissions from Chinese Cropland by a New Nonlinear Model, Environ. Sci. Technol., 50, 564–572, https://doi.org/10.1021/acs.est.5b03156, 2016.
Zhou, Y., Xing, X., Lang, J., Chen, D., Cheng, S., Wei, L., Wei, X., and Liu, C.: A comprehensive biomass burning emission inventory with high spatial and temporal resolution in China, Atmos. Chem. Phys., 17, 2839–2864, https://doi.org/10.5194/acp-17-2839-2017, 2017.