the Creative Commons Attribution 4.0 License.
the Creative Commons Attribution 4.0 License.
 | 22 Oct 2021
The impact of nitrogen and sulfur emissions from shipping on the exceedance of critical loads in the Baltic Sea region
Sara Jutterström
Filip Moldan
Jana Moldanová
Matthias Karl
Volker Matthias
Maximilian Posch
The emissions of nitrogen (N) and sulfur (S) species to the atmosphere from shipping significantly contribute to S and N deposition near the coast and to acidification and/or eutrophication of soils and freshwater. In the countries around the Baltic Sea, the shipping volume and its relative importance as a source of emissions are expected to increase if no efficient regulations are implemented. To assess the extent of environmental damage due to ship emissions for the Baltic Sea area, the exceedance of critical loads (CLs) for N and S has been calculated for the years 2012 and 2040. The paper evaluates the effects of several future scenarios, including the implementation of NECA and SECA (Nitrogen And Sulfur Emission Control Areas). The implementation of NECA and SECA caused a significant decrease in the exceedance of CLs for N as a nutrient while the impact on the – already much lower – exceedance of CLs for acidification was less pronounced. The relative contribution from Baltic shipping to the total deposition decreased from 2012 in the 2040 scenario for both S and N. In contrast to exceedances of CLs for acidification, shipping still has an impact on exceedances for eutrophication in 2040. Geographically, the impact of shipping emissions is unevenly distributed even within each country. This is illustrated by calculating CL exceedances for 21 Swedish counties. The impact, on a national level, is driven by a few coastal counties, where the impact of shipping is much higher than the national summary suggests.
- Article
(3357 KB) - Full-text XML
- BibTeX
- EndNote


Anthropogenic emissions of sulfur (S) and nitrogen (N) species to the atmosphere and subsequent deposition have led to severe environmental problems such as acidification of soils and lakes, impacting freshwater ecosystems and damaging forests (e.g. Grennfelt, 2020). N deposition can also enhance eutrophication on land and water, increasing the risk of ecosystem damage and changes in biodiversity (e.g. Bobbink et al., 2010).
The main source of anthropogenic S to the atmosphere is through the combustion of S-containing fossil fuels, where S reacts during combustion with oxygen, forming sulfur oxides (SOx), mainly sulfur dioxide (SO2), which can be further oxidised in the atmosphere to form sulfuric acid. This oxidation takes place either in the gas phase through a reaction with an OH radical or through heterogeneous oxidation in cloud or fog droplets or aerosol particles. Gas-phase sulfuric acid contributes to the formation of particulate matter and is a key species in new particle formation. Most of the deposition of S is in the form of wet and dry deposition of particulate sulfate (PM-SO4) and dry deposition of SO2. Combustion is also a source of oxides of nitrogen (NOx) to the atmosphere. NOx species are, to a large extent, produced from the reaction of molecular nitrogen and oxygen during the combustion, especially at high temperatures and an excess of oxygen. While in a fresh combustion exhaust, oxides of nitrogen are dominated by NO (typically 85 %–95 %); in the atmosphere, NO quickly reacts with ozone, and the NOx mixture is dominated by NO2. Atmospheric oxidation of NOx predominantly takes place in the gas phase through reaction of NO2 with an OH radical, forming nitric acid (HNO3). Other oxidation channels involve nitrogen pentoxide (N2O5; nighttime oxidation channel), peroxyacetyl nitrates (PAN), peroxynitric acid (HNO4) or nitrous acid (HONO; heterogeneous oxidation channel). Oxidised N is then deposited in form of gaseous HNO3 and, to some extent, NO2, PAN, N2O5 and other species. The majority of oxidised N is deposited as particulate nitrate (NO) through wet and dry deposition processes. Another important N species is ammonia (NH3). The largest source of NH3 is agriculture. In the atmosphere, ammonia reacts readily with both H2SO4 and HNO3, forming particulate ammonium sulfate and nitrate ((NH4)2SO4, NH4NO3). Part of ammonia is also deposited directly through gas deposition. As the marine air masses carrying shipping emissions arrive at coastal areas with agricultural activities, these reactions cause increased particle formation and deposition of these species in these areas.
During the last decades, emissions of S and N air pollutants from land-based sources have been substantially reduced over Europe. S emissions in Europe peaked around 1980 and have decreased by 91 % between 1990 and 2016 in the EU; N emissions have also decreased during this time period (1990–2016), although not quite as dramatically (NOx emissions dropped by 58 % and NH3 emissions by 23 %, respectively; EEA, 2018). Due to the emission reductions of S and N, there has been a significant improvement of the acidification status of European ecosystems since the 1990s (De Wit et al., 2015) but eutrophication has also decreased (Engardt et al., 2017).
The Convention on Long-range Transboundary Air Pollution (CLRTAP; https://unece.org/environment-policy/air, last access: 7 October 2021) under the United Nations Economic Commission for Europe (UNECE) was signed in 1979 and entered into force in 1983 with the purpose of limiting and finding solutions to cross-border air pollution problems within Europe. Under the CLRTAP, the critical load (CL) concept was adopted and further developed. A CL is a deposition threshold for a given pollutant, above which unacceptable damage may occur in the long run. The development of methodologies focussed on S and N deposition to derive CLs for acidity, due to S and N, and eutrophication, due to N. Since 1994, the protocols to the CLRTAP to reduce air pollution due to S and N deposition have been effects based, i.e. the sensitivity of ecosystems, expressed by their CLs, has been guiding the emission reduction agreements, with the ultimate aim of reducing depositions below CLs.
Reductions in S emissions in Europe have led to substantial decreases in the exceedances of CLs for acidity (CLaci) both in area and in average accumulated exceedance (AAE; Posch et al., 2001). The exceeded area for CLaci in Europe has decreased from 30 % in 1980, with areas of very high AAE over central Europe, to 2 % in 2010, with an expected decrease to just 1 % of the exceeded area in 2030 (Slootweg et al., 2014). The exceeded area of CL for eutrophication (CLeutN) in Europe in 1980 has been calculated as being 75 %, decreasing to 65 % in 2010, and is projected to still be quite substantial in 2030 with 49 % of the exceeded area (Slootweg et al., 2014).
While land-based emissions have decreased significantly as a result of international agreements and abatement measures, the regulations implemented for the shipping sector have been more modest. Emissions generated from international shipping are significant in areas with heavy marine traffic, and the Baltic Sea is one of the most highly trafficked seas in the world, and shipping is projected to increase in the future (Baltic LINes, 2016).
International shipping is regulated by the International Maritime Organization (IMO), a body of the United Nations. Environmental pollution from ships is regulated by IMO's International Convention on the Prevention of Pollution from Ships (MARPOL; 73/78) and its annexes. The MARPOL Annex VI – “Regulations for the Prevention of Air Pollution from Ships” – sets limits on emissions of SOx and NOx from international shipping.
Regulation of emissions of S are through maximum allowed fuel S content. Until recently, the S limit in fuel globally was 3.5 % (mass to mass). This has been reduced to 0.5 % as of 1 January 2020. Annex VI enables the establishment of Emission Control Areas (ECAs) with more stringent emission limits both for SOx (SECA) and for NOx (NECA). The Baltic Sea has been, together with the North Sea and the English Channel, established as a SECA in 2006. The fuel S limit that applied in SECA until 1 January 2015 was 1 % (mass to mass); after that date, it was decreased to 0.1 %. Installation of exhaust gas aftertreatment equipment, cleaning the exhaust gas to concentrations corresponding to those of a clean fuel, is allowed as an alternative. In the EU, the S regulations in Annex VI are implemented through the EU Sulfur Directive, which has the following additional restrictions: the limit for passenger ships in regular traffic outside of the SECA area was 1.5 % until 2020 and for ships at berth in EU ports the limit has been set to 0.1 % since 2010.
IMO's NOx regulation sets emission limits through tiers, which apply limiting curves depending on the maximum engine operating speed according to the year when the ship was built. Tiers I and II apply to ships built between 2000 and 2011 and after 2011, respectively. While the tier I limit has, in practice, not any effect, the tier II limit reduces the NOx emissions by 16 %–20 %. Tier III decreases the emissions by 80 % and requires exhaust gas cleaning equipment (selective catalytic reduction or exhaust gas recirculation) or an alternative fuel, such as liquefied natural or biogas (LNG and LBG). The tier III controls apply only to the specified ships while operating in NECAs established to limit NOx emissions; outside such areas, tier II controls apply. The NECA that includes the Baltic Sea, the North Sea and the English Channel has gone into effect in 2021 and applies to ships built after 1 January 2021.
On average, 70 % of shipping emissions are released within a distance of 400 km from the coast and can have significant air quality impacts on coastal regions (e.g. Corbett et al., 1999; Eyring et al., 2005; Sofiev et al., 2018; Jonson et al., 2020). It is expected that the relative contribution from international shipping to air pollutant emissions will increase, as land-based reductions in emissions occur at a faster rate.
In this paper, we investigate the role of shipping emissions of S and N in the exceedances of critical loads for the area around the Baltic Sea for the year 2012 and for a number of emission scenarios for the year 2040.
The deposition of S and N due to various scenarios has been developed within the Sustainable Shipping and Environment of the Baltic Sea region (BONUS SHEBA) project, whose purpose has been to take a holistic approach to emissions from shipping and its impact on the environment in a number of important areas, including that of SOx and NOx emissions on land ecosystems of the Baltic Sea region. By combining the deposition from the current and in the project-developed shipping scenarios, calculated with help of a chemistry transport model, with the critical load data used under the CLRTAP, the exceedances of CLs for acidity and eutrophication have been evaluated for the Baltic Sea area. The model set-up and scenarios are briefly described in the next sections, but for a more detailed description and evaluation of the model performance, the reader is referred to Karl et al. (2019a, b).
2.1 Model set-up
The deposition of S and N has been simulated using the regional atmospheric chemistry transport CMAQ (Community Multiscale Air Quality) model (Byun and Schere, 2006). The CMAQ model simulations were driven by the meteorological fields of the COSMO-CLM version 5.0 (Rockel et al., 2008), using the ERA-Interim re-analysis (Dee et al., 2011) as forcing data for the year 2012. The year 2012 was assessed to be a good reference year for the Baltic Sea area according to an analysis of the temperature anomalies and precipitation anomalies for the decade 2004–2014 for the Baltic proper (Karl et al., 2019a). The 2012 meteorology was also used for the 2040 scenarios to allow direct comparison between the simulations.
Land-based emissions have been calculated using the emission model SMOKE, version 2.4, for Europe (SMOKE-EU; Bieser et al., 2011). These emissions are based on national totals from EMEP (European Monitoring and Evaluation Programme; http://www.ceip.at, last access: 1 November 2018); further details are given in Bieser et al. (2011) and Karl et al. (2019a). Emissions for the scenarios in 2040 are based on changes in emissions of the air pollutants in question between 2010 and 2040 in the Baltic Sea countries, differentiated for different emission sectors according to ECLIPSE v.5 current legislation (CLE) base scenario (Amann et al., 2014).
Shipping emissions in the Baltic Sea and the North Sea were calculated using STEAM (Ship Traffic Emission Assessment Model; Jalkanen et al., 2009, 2012; Johansson et al., 2013). These are based on position data from individual ships collected from AIS (automatic identification system) data and include all IMO registered merchant ships larger than 300 Gt. For smaller vessels, however, it is not mandatory to have AIS senders installed, and these are, therefore, not included. In recent years, installations of AIS senders on small vessels have been increasing, and Jalkanen (2020) found a difference of 15 % between the CO2 emissions calculated from AIS signals of the IMO-registered ships and the CO2 emissions calculated from all AIS signals. The model calculates emissions of SOx, NOx, CO2, CO and particulate matter, differentiated in its components SO, mineral ash and elementary and organic carbon, in high temporal and spatial resolution.
The model was run in three nested domains with resolutions 64 km×64 km for the whole continent, 16 km×16 km for central and northern Europe and 4 km×4 km for the Baltic Sea region. The results from the domain with a resolution of 16 km×16 km were used for the calculations for exceedances of the CLs. Results from hemispheric modelling with the SILAM (System for Integrated Modeling of Atmospheric Composition) model (Sofiev et al., 2015) on a resolution of 0.5∘ × 0.5∘ were used as boundary conditions for the chemical fields in the simulations.
Table 1S and N species in CMAQ deposition, listed approximately in order of importance. Species in italics contribute less than 1 %.

The model output has a time resolution considerably higher (hourly) than what is needed for the exceedance calculations (yearly). The deposition data have been aggregated to yearly sums of N and S for the respective scenario. The model works with a chemical mechanism, including the most common S and N species present (Table 1), and both wet and dry deposition are included in the calculations.
Several of the modelled species are of major importance for atmospheric chemical reactions but are not quantitatively important for the deposition. The largest proportions of the total deposition of N are from HNO3, NH3, particulate NH and NO (together approximately 95 % of the total annual deposition). The S deposition is mostly from SO2 and particulate SO. Karl et al (2019a) compared the modelled wet deposition of oxidised and reduced N for 2012 with data from EMEP monitoring stations and found an underestimation in the CMAQ simulations for all stations in the Baltic Sea region by 20 %–80 %. Comparison of modelled and measured NH3 gas concentrations in Denmark and Poland shows overestimation by the model, indicating that the reason for underestimation of N deposition in the southern part of the Baltic Sea region is the limited availability of sulfuric and nitric acid required for the formation of particulate ammonium nitrate and sulfates.
2.2 Shipping scenario description
The years 2012 and 2040 were chosen to evaluate the impact of shipping on the Baltic Sea region. The year of 2012 was before the introduction of the more stringent SECA limit of 0.1 % fuel S content in the Baltic Sea, and 2040 was chosen in the BONUS SHEBA project as the scenario time horizon representing the future when the current, already agreed-upon legislation, if fully implemented, will have full impact, and when we still can assume non-disruptive development of shipping technology. To investigate the impacts of NECA, introduced in 2021, there needs to be enough time for a substantial part of the fleet to be renewed, since it will only apply to ships built after 1 January 2021.
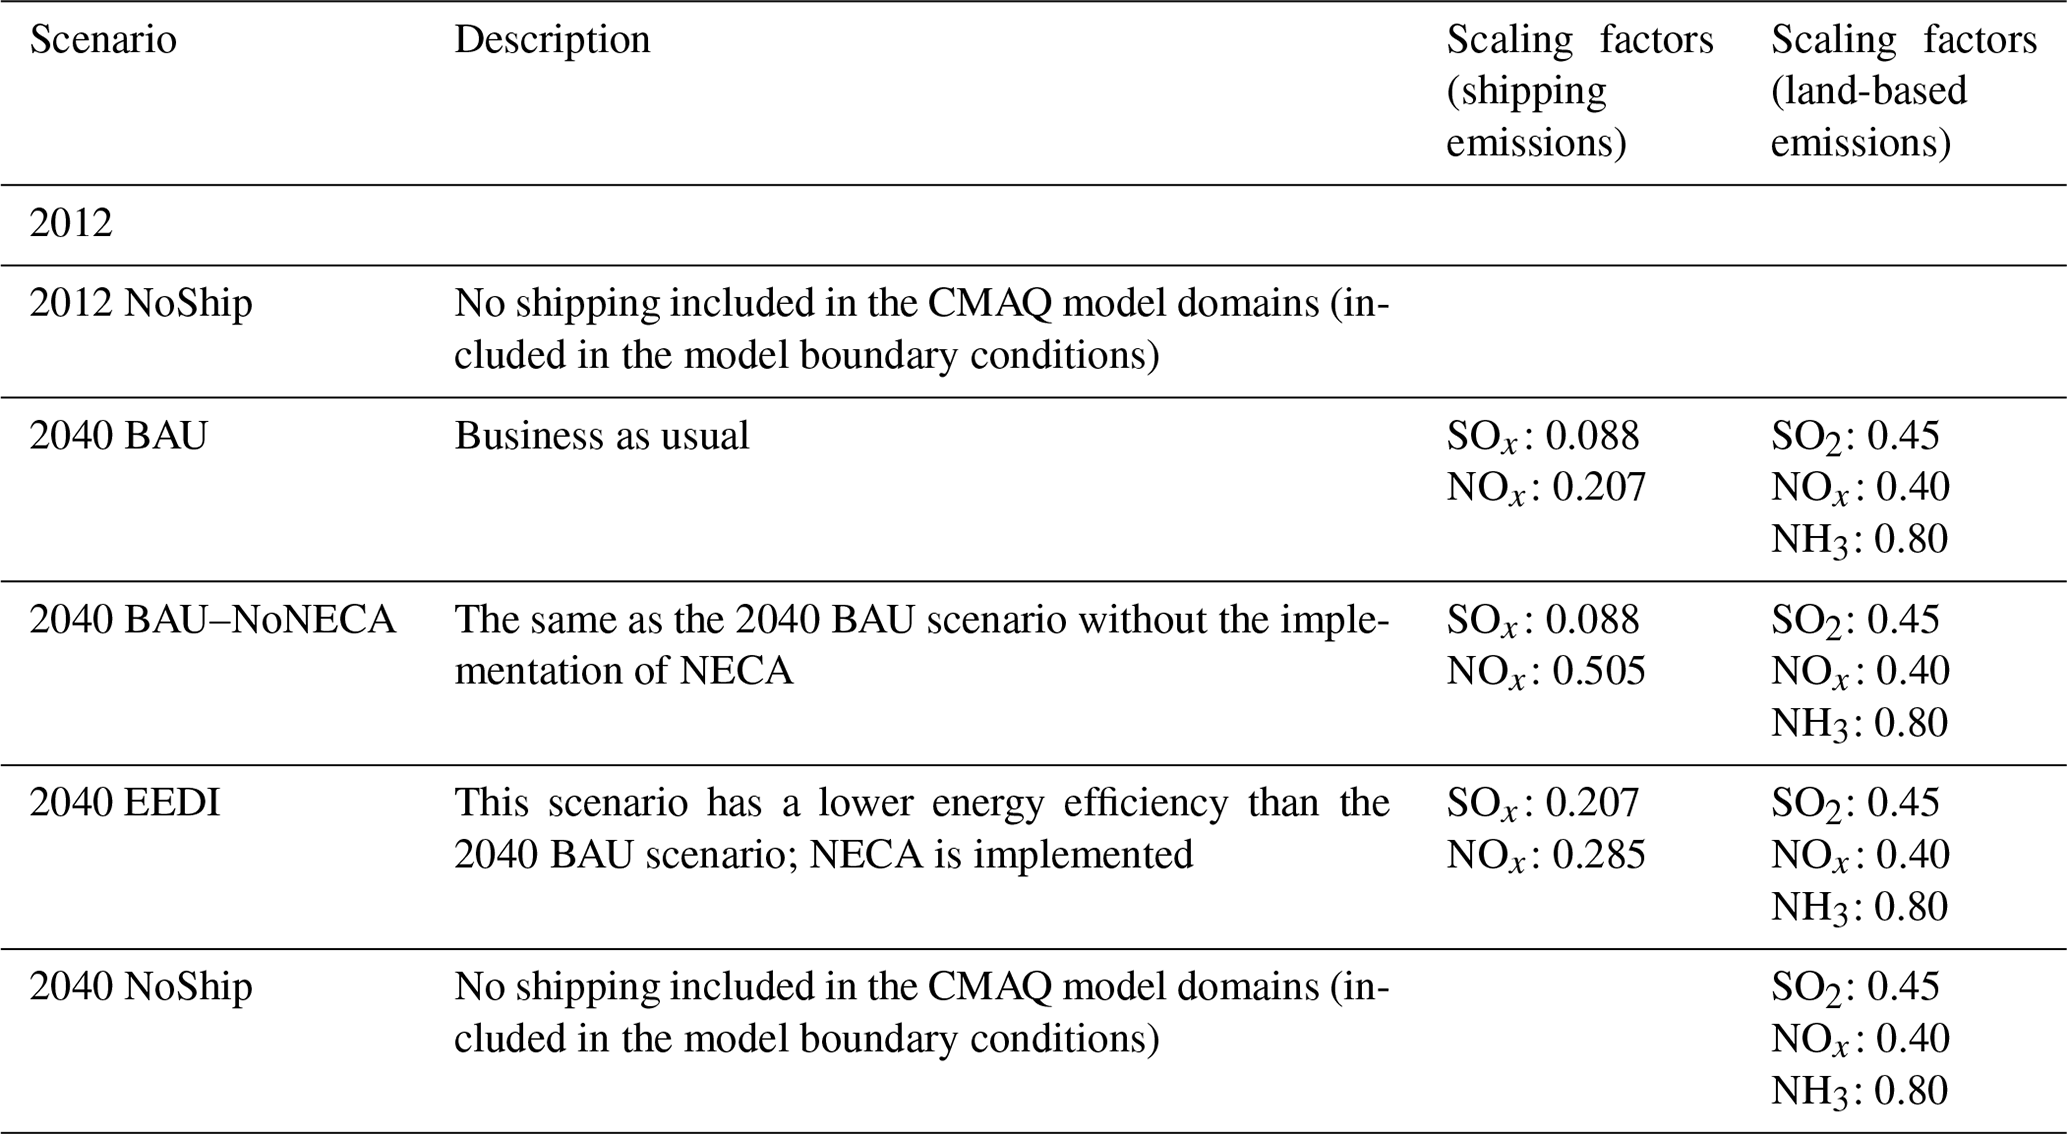
The baseline scenario for 2040 developed in the BONUS SHEBA project is the so-called business as usual (BAU) scenario that takes into account trends of economic growth and development of shipping, extrapolating the current trends, as well as the all agreed-upon regulations. An important parameter in the future scenarios is the development of energy efficiency in shipping, which is regulated by the IMO regulation on Energy Efficiency Design Index (EEDI). The BAU scenario adopts the development of the energy efficiency in shipping according to Kalli et al. (2013), assuming annual efficiency increases of 1.3 % to 2.25 %, depending on ship type, which is beyond the IMO EEDI regulation (corresponding efficiency increases values from 0.65 % to 1.04 %) and significantly reduces shipping fuel consumption. Even though higher than the EEDI regulation, the energy effectivisation in this scenario is still not sufficient to meet – in extrapolation – the IMO goal to reduce fossil CO2 emissions from shipping by 50 % by 2050. Regarding other predefined legislation, the BAU scenario assumes implementation and full compliance with the NECA regulation in the Baltic Sea, North Sea and the English Channel in 2021 (tier III for all ships built (date set when the keel is laid) in 2021 and later operating in the region), implementation and full compliance with the SECA 0.1 % fuel S content limit in this region in 2015 and implementation of the global 0.5 % fuel S content limit in 2020. More details about this scenario can be found in Karl et al. (2019a). In order to investigate the impact of NECA and of the energy effectivisation in the shipping sector, the following two sensitivity scenarios were investigated: one which is the same as BAU, but without the implementation of NECA (BAU–NoNECA), and another which is the same as BAU with the implementation of NECA, but with the energy effectivisation that follows the IMO EEDI regulation (EEDI; see Table 2).
Table 2Description of the evaluated scenarios, including emission scaling factors that give emissions for the 2040 scenarios in relation to 2012 emissions (from Karl et al., 2019a).
2.3 Critical loads of acidity and eutrophication
A critical load (CL) is defined as “a quantitative estimate of an exposure to one or more pollutants below which significant harmful effects on specified sensitive elements of the environment do not occur according to present knowledge” (Nilsson and Grennfelt, 1988). Critical loads are calculated for different receptors (e.g. terrestrial ecosystems and aquatic ecosystems), and a sensitive element can be any part (or the whole) of an ecosystem or ecosystem process. It is up to each country to decide which ecosystems and what sensitive part of an ecosystem they use as a receptor in CL calculations. This freedom of choice can lead to jumps in the magnitude of the calculated CLs along country borders; details on the CLs calculated by individual countries and their choices of what to protect can be found in Hettelingh et al. (2017). The area for which CLs are calculated (EcoArea) is the sensitive area of a country which needs to be protected from air pollution. Critical loads have been defined to avoid the eutrophying effects of N deposition (critical loads of eutrophying N – CLeutN) and for the acidifying effects of both S and N deposition (Sdep and Ndep; critical loads of acidity – CLaci).
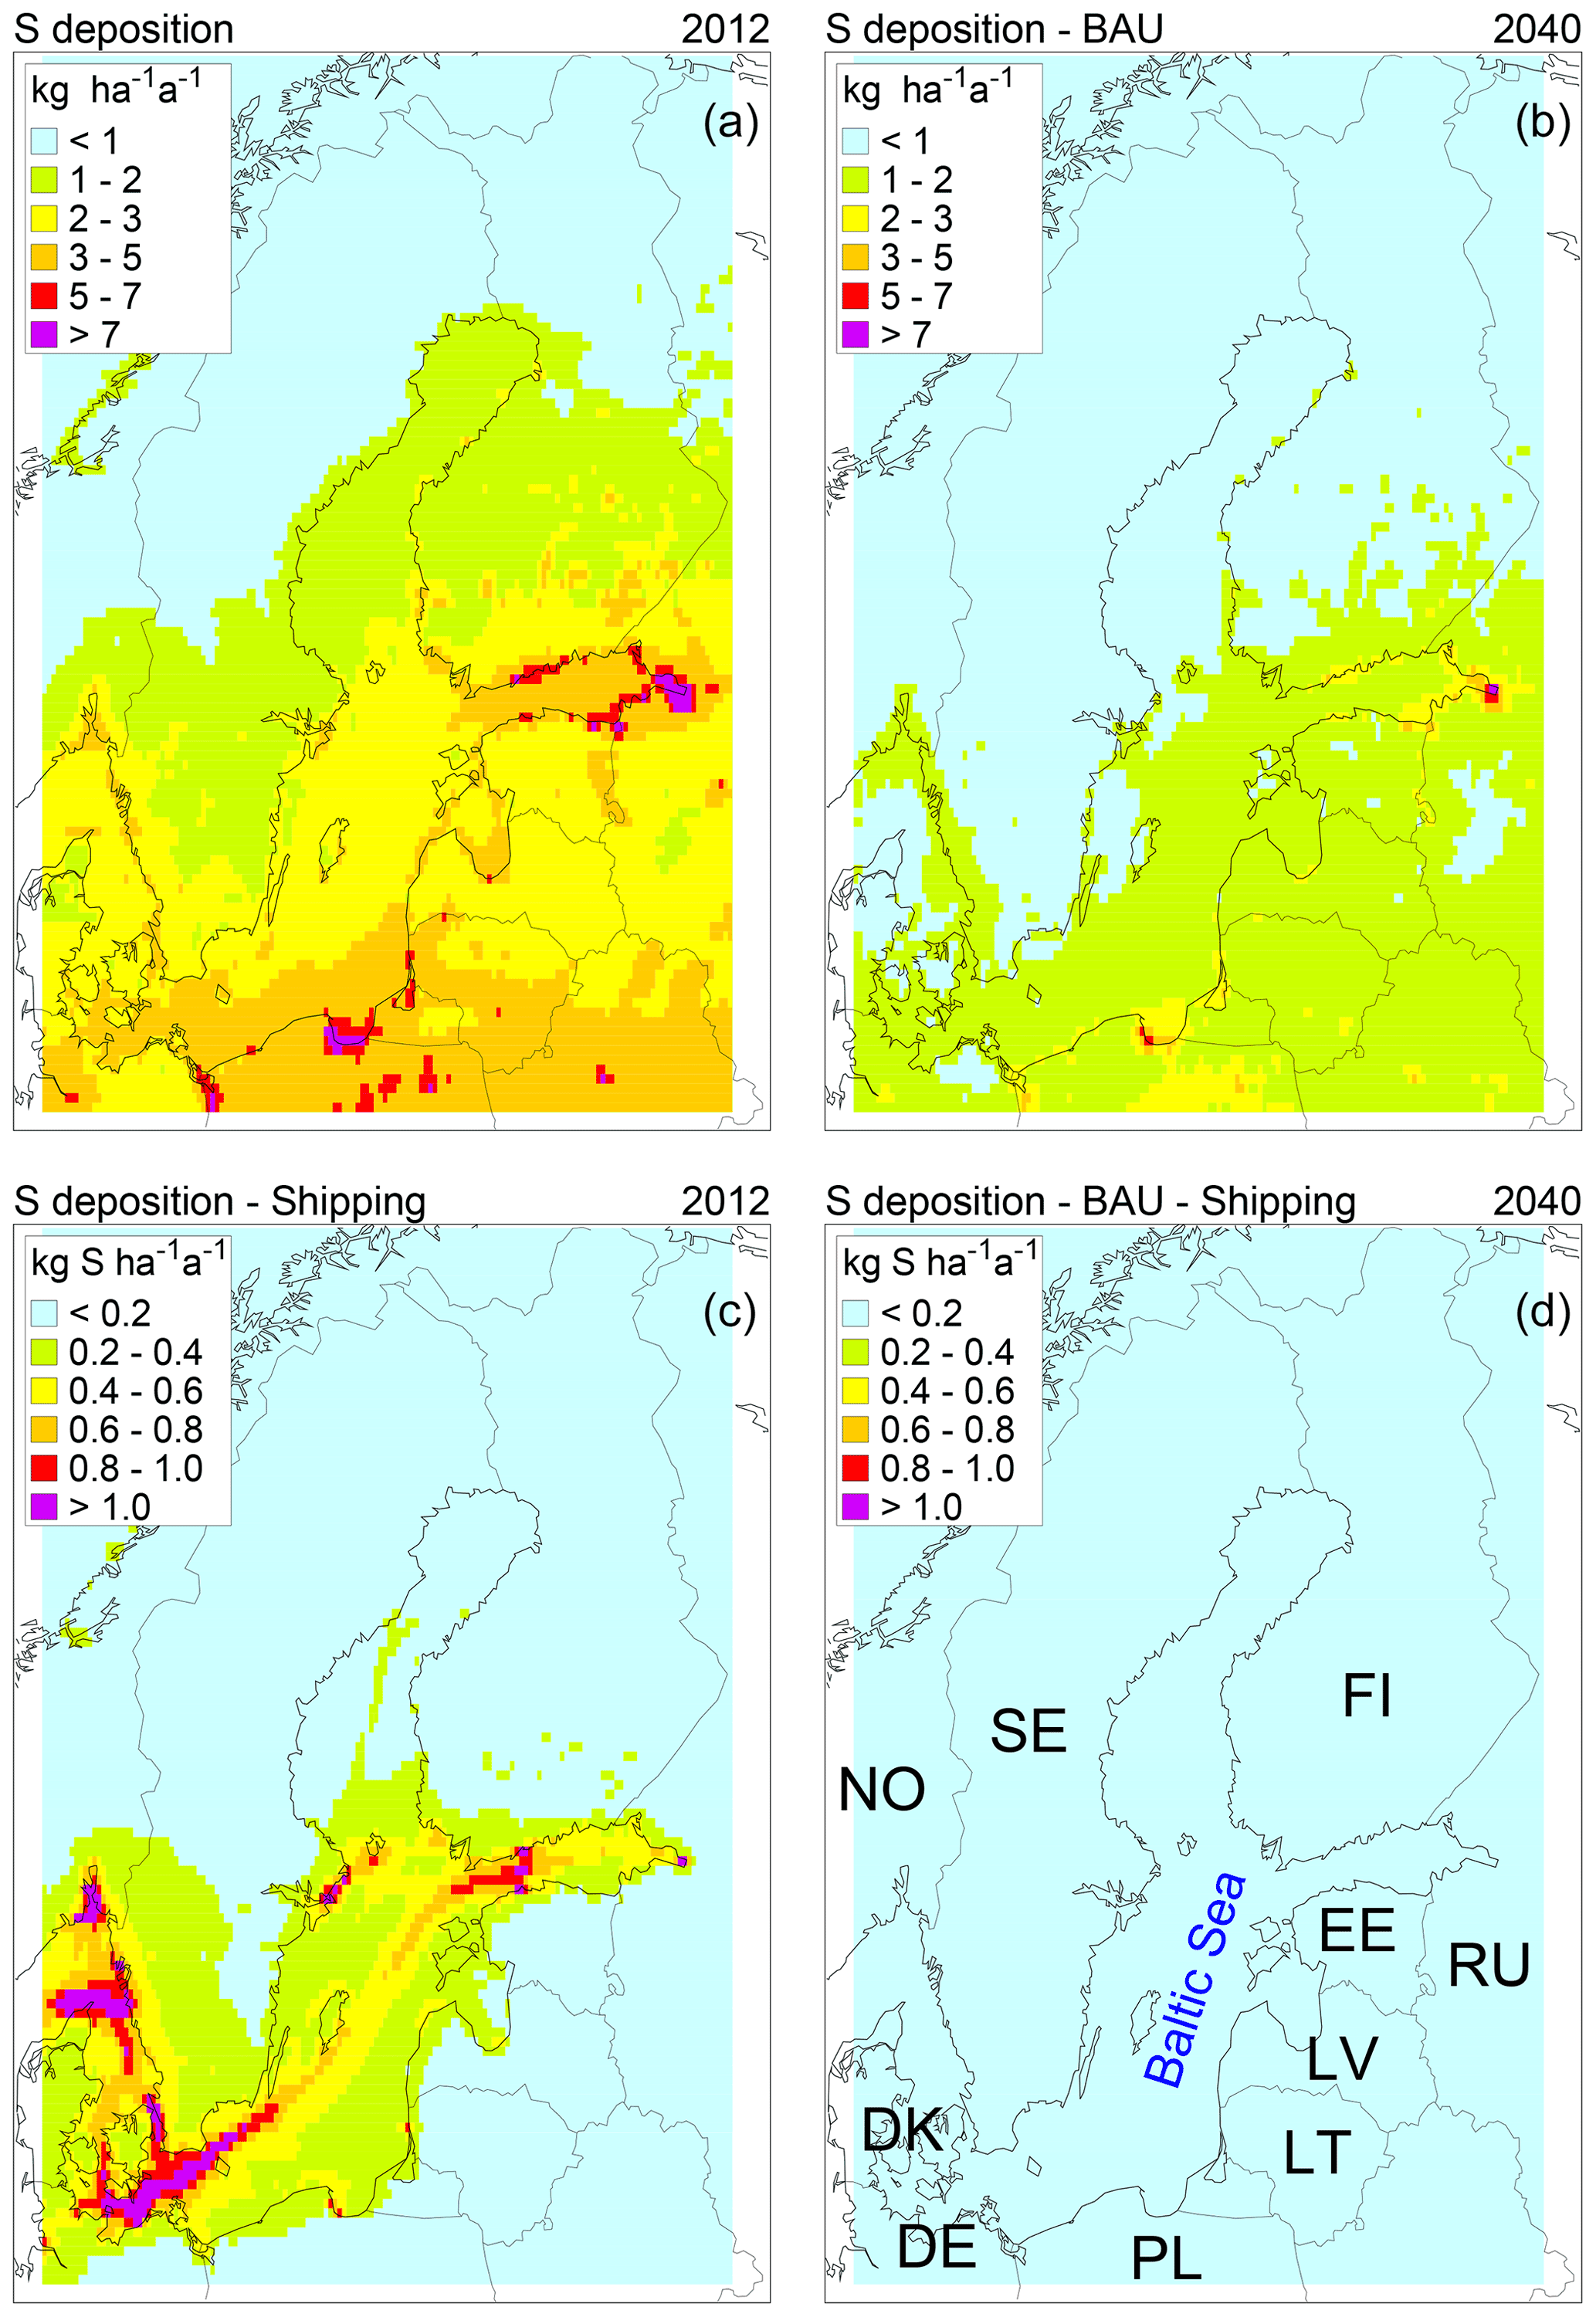
Figure 1(a, b) Total deposition of S in 2012 (a) and in 2040 under the BAU scenario (b) in the extended Baltic Sea region. (c, d) S deposition originating from shipping in 2012 (c) and in 2040 (d), calculated as the difference between the scenario based on total emissions and a scenario where shipping emissions are removed. In the bottom-right map, the countries are labelled with their ISO-3166 two-letter codes.
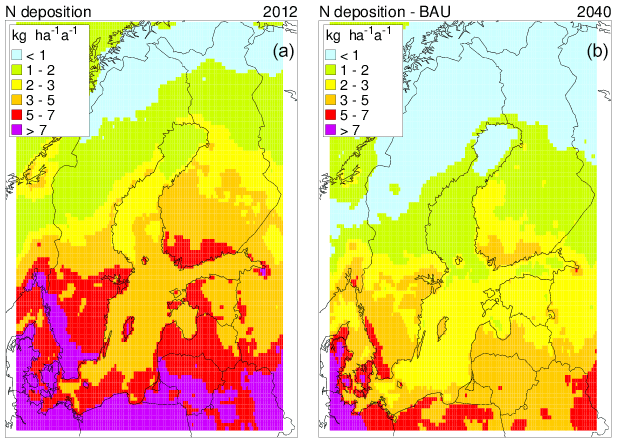
Figure 2Total deposition of N deposition in 2012 (a) and the 2040 BAU scenario (b).
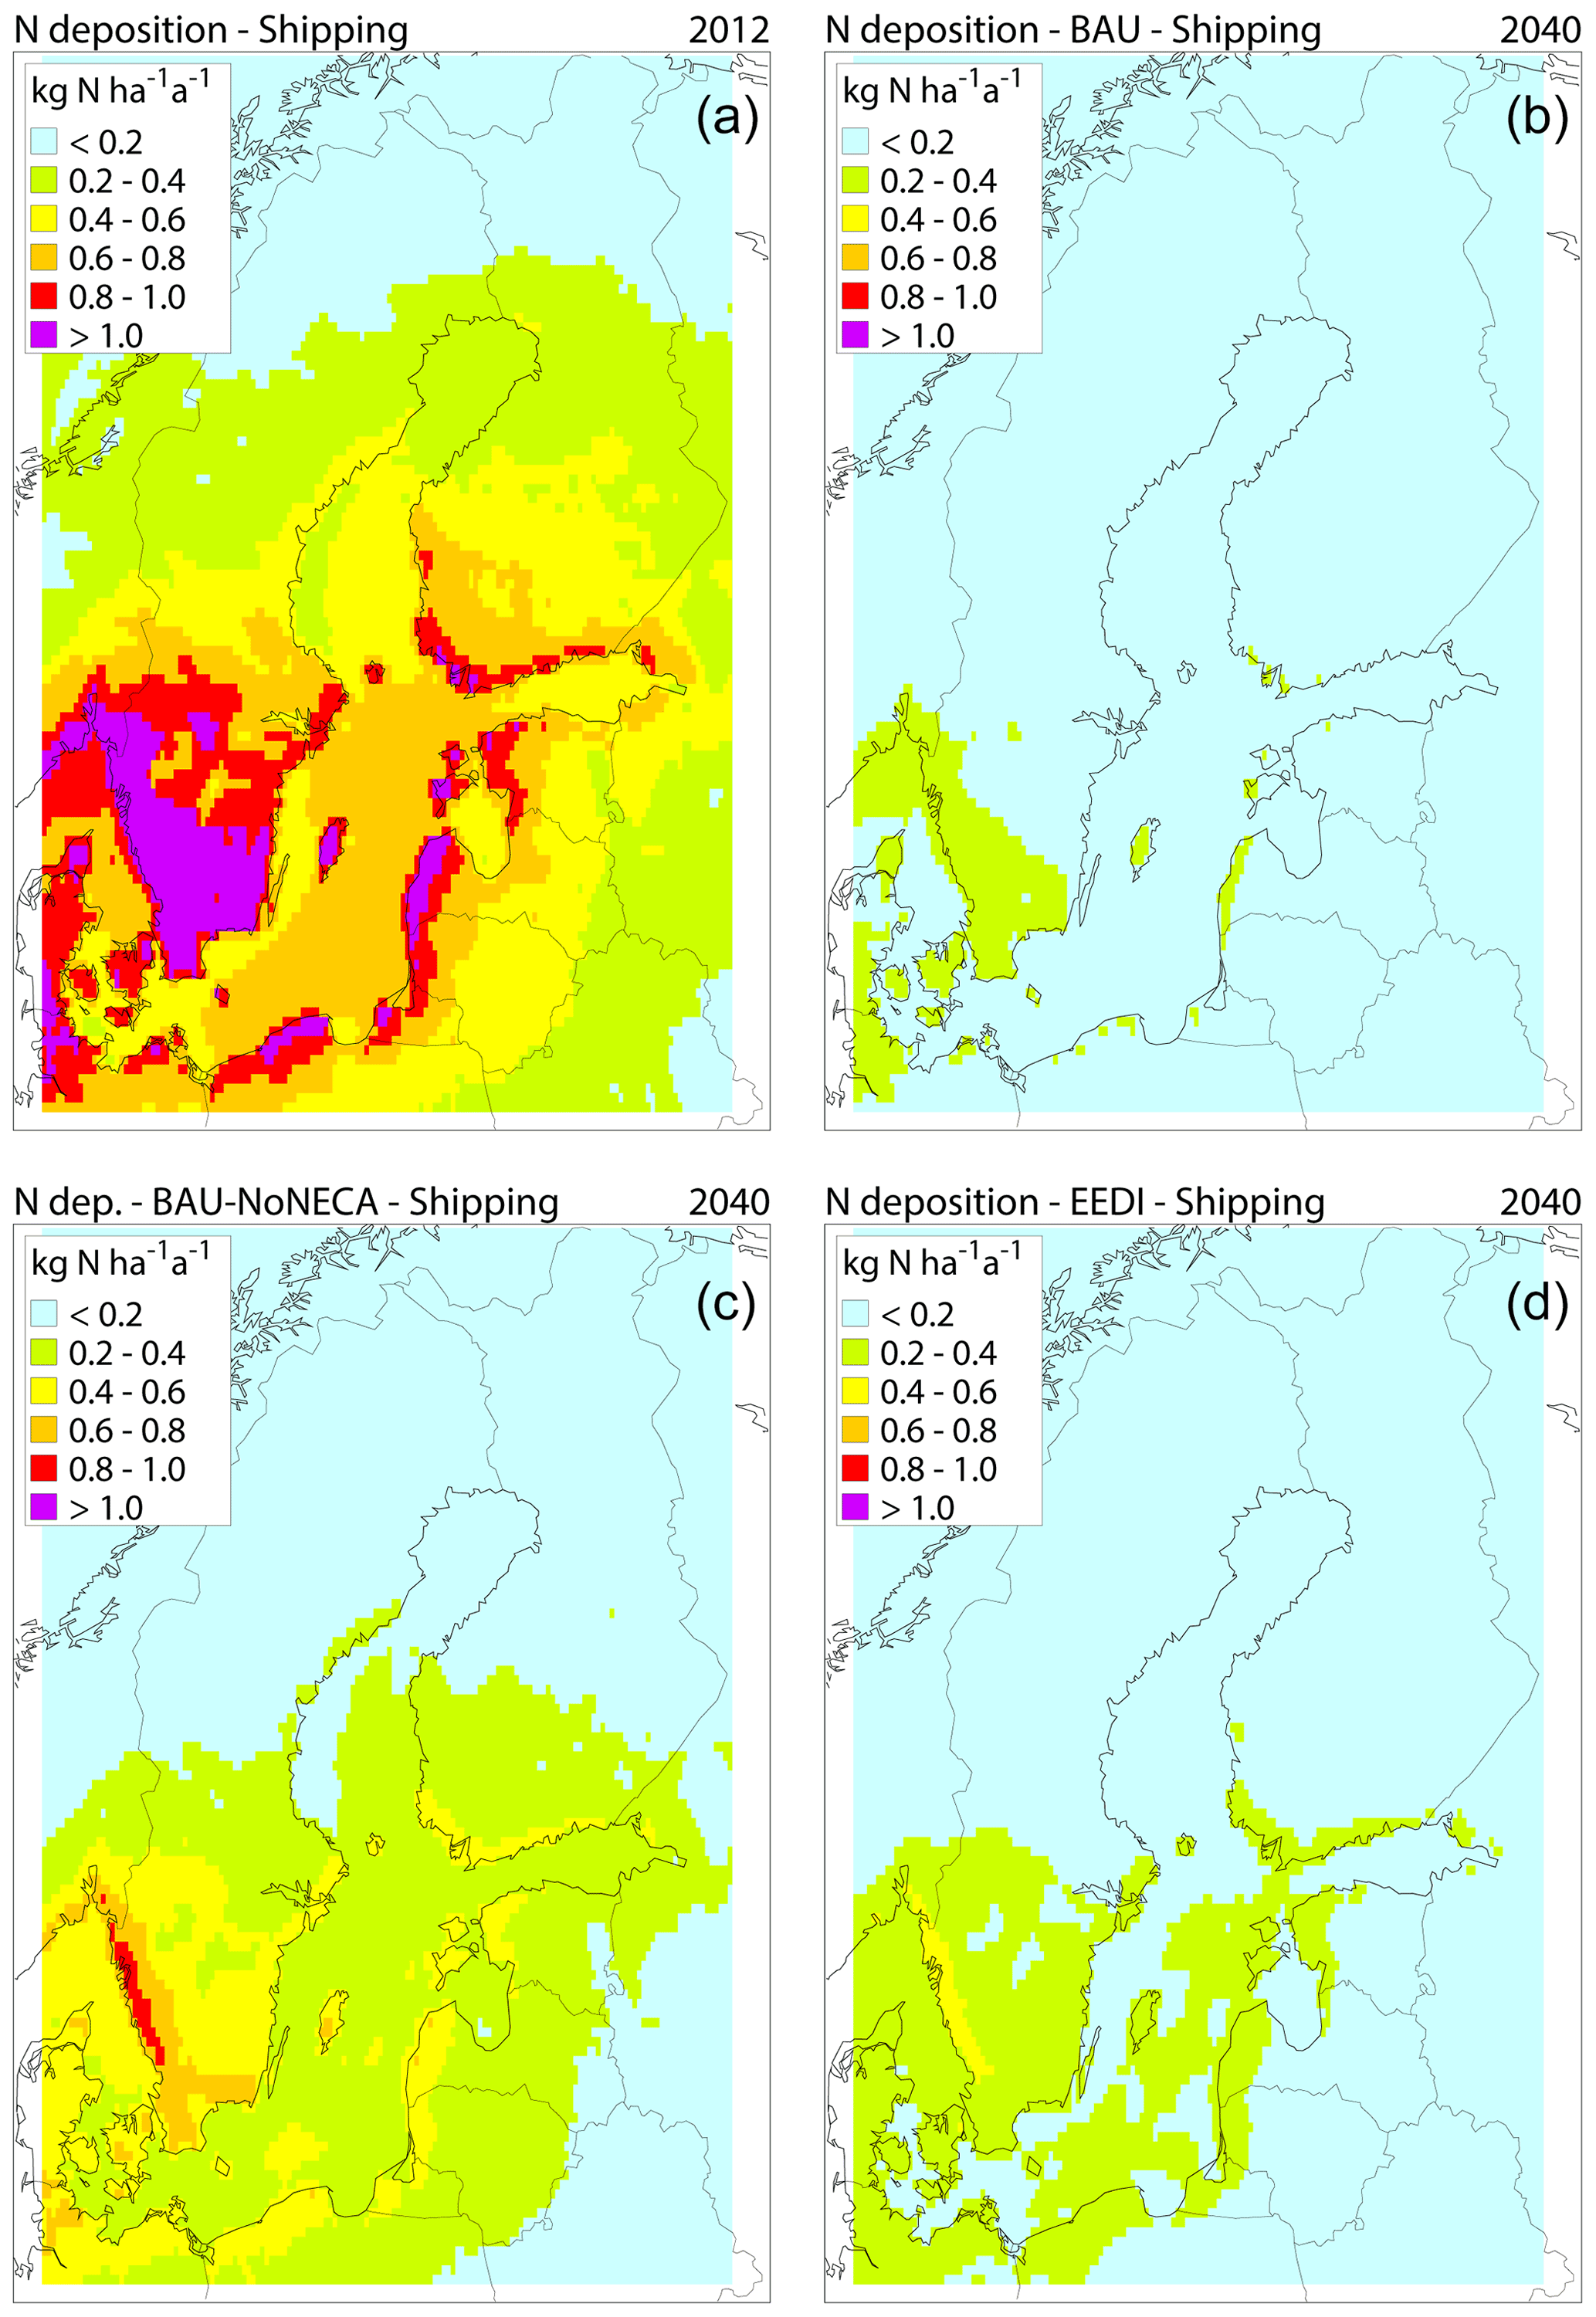
Figure 3N deposition originating from shipping in 2012 (a) and in 2040 (BAU b, BAU–NoNECA c and EEDI d). Deposition from shipping was calculated as the difference between the scenario based on total emissions and the scenario where shipping has been removed.
The critical load for a site is mostly calculated from steady-state (charge and) mass balance equation(s), linking a chemical criterion (e.g. an acceptable N concentration (ANC) in soil solution or a critical ANC limit in lake water) with the corresponding deposition value(s). For eutrophication CLs, empirical values have also been defined for many habitat types (Bobbink and Hettelingh, 2011). While the eutrophication CL is a single number (to be compared with N deposition), the acidity critical load is defined as a trapezoidal function (critical load function – CLF) in the (Ndep, Sdep) plane, defined by the following three characteristic numbers: CLmaxS, CLminN and CLmaxN. Methods to compute CLs are summarised in the Mapping Manual (UNECE, 2004; see also Posch et al., 2015), which is used under the CLRTAP.
If a deposition is higher than the critical load at a site, the CL is said to be exceeded. For eutrophication, the exceedance is defined as the difference between N deposition (Ndep) and the CL, i.e. Ex = Ndep − CLeutN (and set to zero if negative). In the case of acidity, both N and S deposition have to be set in relation to the CLF; it is defined as Ex = ExN + ExS, where ExN and ExS are the amounts of Sdep and Ndep to be reduced to reach the point on the CLF that is closest to (Ndep, Sdep). For technical details and calculation procedures, see Posch et al. (2015). For reporting and mapping purposes, a single exceedance number is computed for each grid cell (or any other region). This number, called the average accumulated exceedance (AAE), is defined as the weighted mean of all ecosystems within the grid cell, with the weights being the respective ecosystem areas (see Posch et al., 2001). Note that the ecosystem areas, for which CLs for acidity and eutrophication are determined, can differ in some countries/regions since the ecosystems that are to be protected from acidification (e.g. lakes) may not be the same as ecosystems threatened by eutrophication (e.g. Natura 2000 areas).
Exceedances in this paper are calculated using the critical load database held at the Coordination Centre for Effects under the CLRTAP (Hettelingh et al., 2017) and used in supporting European assessments and negotiations on emission reductions (e.g. Reis et al., 2012; EEA, 2014). Critical loads of acidity and of eutrophication were calculated for 72 % of the modelled area (13 042 grid cells on a 0.15∘ × 0.15∘ grid). The remaining cells are either sea areas or modelled grid cells covering land areas not relevant for critical load calculations, such as agricultural land or human settlements. CL exceedance calculations for individual counties in Sweden were performed with the same methodology and based on the same critical loads database.
3.1 Atmospheric deposition of S
At a small geographical scale, the modelled deposition of S originating from shipping emissions is highest in the shipping lanes and in the coastal areas (Fig. 1; lower panels). At the geographical area of the whole (extended) Baltic Sea region, the overall gradient is from high deposition near large land-based emission sources in the south and southeast towards low deposition in the north and northwest (Fig. 1; upper panels). There is a strong decrease in S deposition between 2012 and 2040 (Fig. 1; Table 3) due to decreased emissions from both land-based sources and shipping. The deposition from shipping emissions is expected to decrease by approximately 90 % from 2012 to 2040 (Fig. 1; Table 3). In 2040, the differences between the shipping scenarios are marginal, since the decisive legislation, i.e. the introduction of SECA in the Baltic Sea, has been implemented in all future scenarios. Any differences in the S deposition between the 2040 BAU and the 2040 BAU–NoNECA scenarios are caused by the differences in atmospheric processes regarding oxidation of SO2 and the formation and subsequent deposition of ammonium sulfate. By 2040, the S deposition caused by the shipping emissions is not expected to exceed 0.2 kg ha−1 yr−1 anywhere, not even in the shipping lanes (Fig. 1; lower right panel).
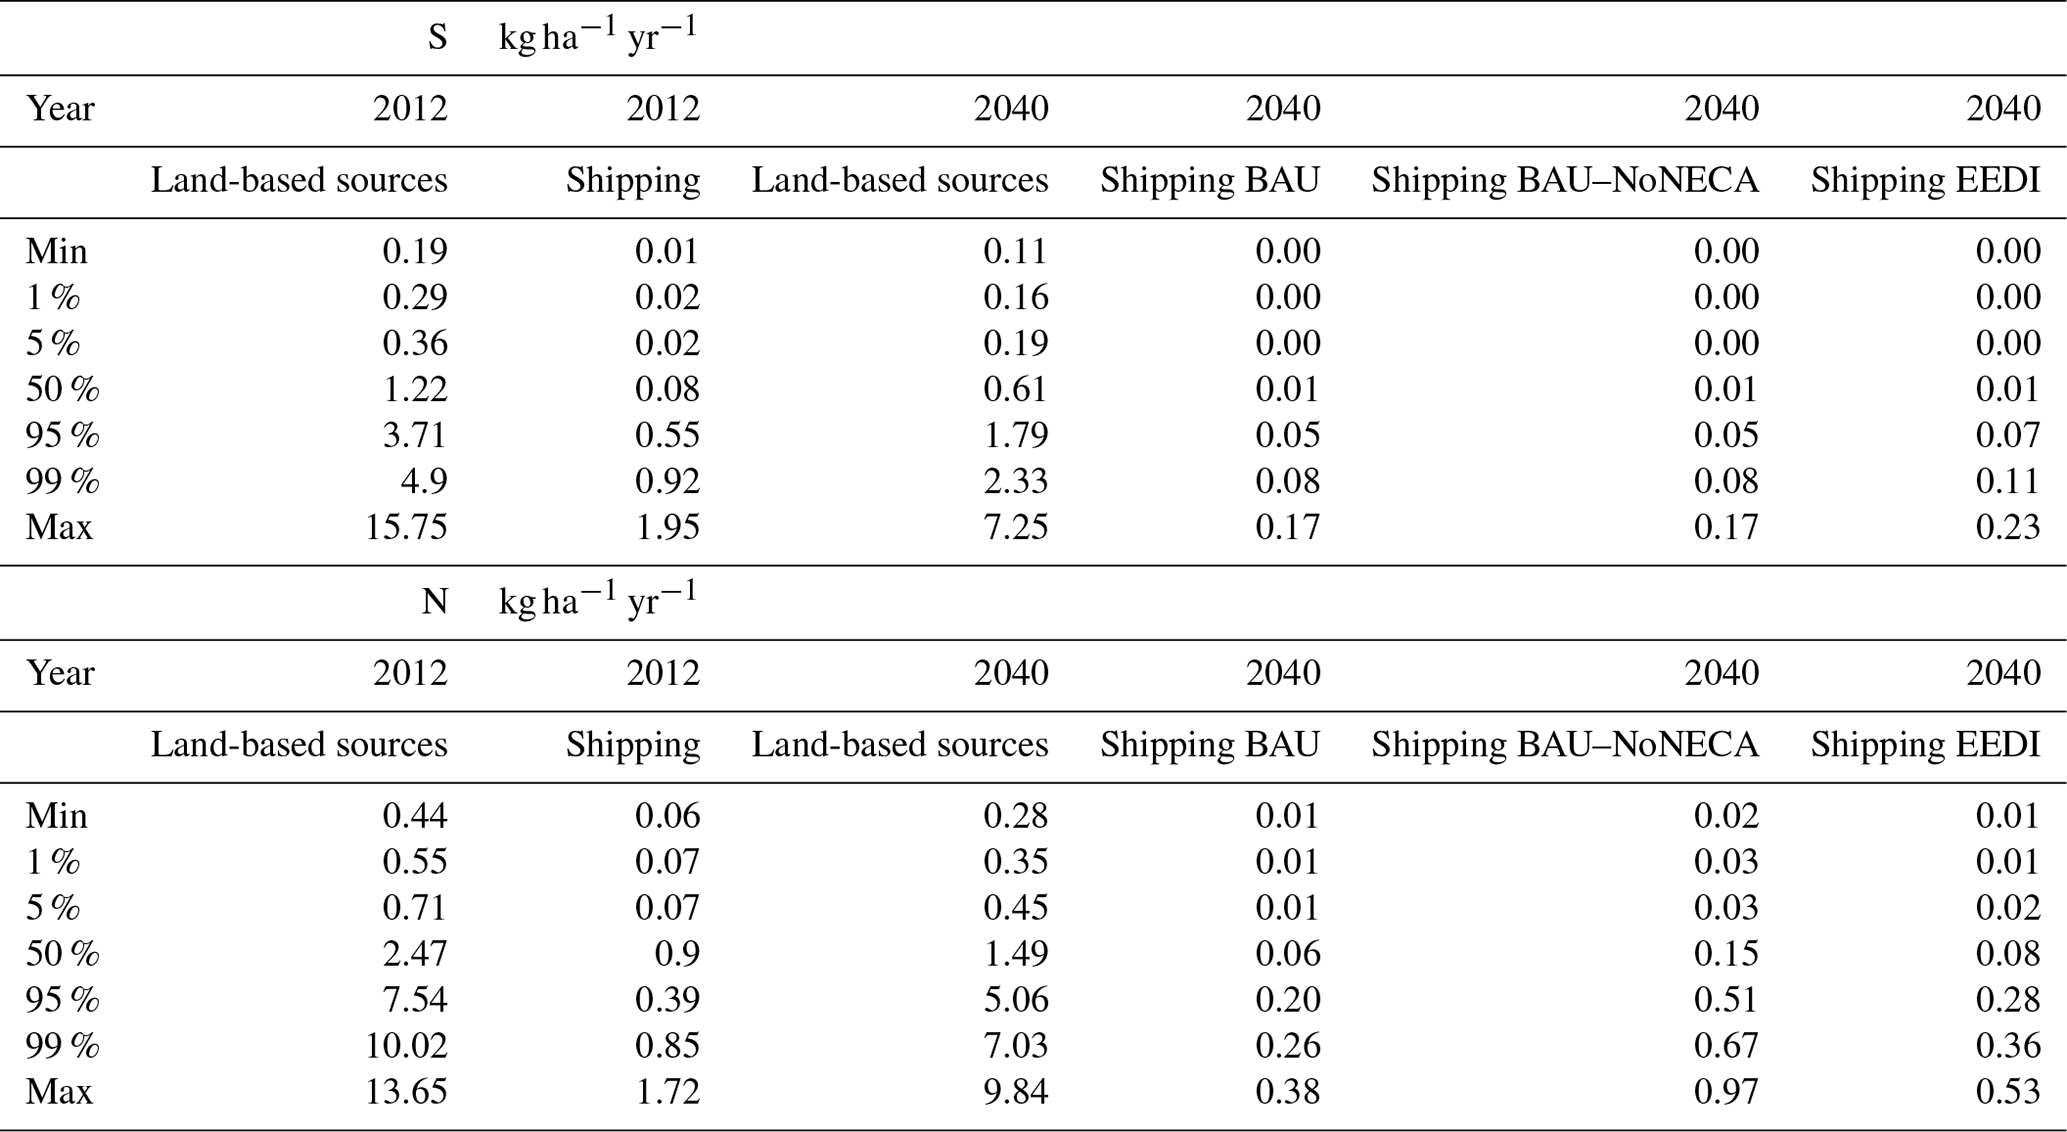
Table 3S and N deposition originating from the land-based sources and from shipping in 2012 and for the three scenarios in 2040. Minimum, maximum and percentiles were calculated on all grid cells in the modelled region.
3.2 Atmospheric deposition of N
Similar to the deposition of S, there is a geographical gradient in N deposition from high deposition in the south to low deposition in the north. This pattern roughly follows the density of agriculture and of other land-based N emissions sources, such as traffic. The overall decrease in N deposition from 2012 to 2040 (Fig. 2) is due to declining emissions from land-based sources and from shipping. The change is pronounced at the whole modelled geographical domain, but the decrease is less strong than that of S. There is a clear decrease in N deposition originating from shipping between 2012 and 2040 for all scenarios (Fig. 3). However, in 2040 there is still a significant amount of N deposition originating from shipping, and the differences between the individual scenarios in 2040 are large. The implementation of NECA has a major impact on N deposition from shipping in most of the coastal areas in the Baltic region (Fig. 3), with the exception of the Gulf of Bothnia in the north, where the shipping intensity is low. Without introducing a NECA (scenario BAU–NoNECA), the contribution to the N deposition on the grid cells within the modelled region would, in median, be more than twice as big as in the BAU case (scenario BAU; Table 3). While the implementation of a NECA has a large impact for the whole region, the lower energy effectivisation scenario (EEDI) makes the biggest difference on the west coast of Sweden. The areas with the highest N deposition originating from shipping emissions overlap with the part of the region with highest AAE of critical loads for eutrophication (see below; Fig. 6).
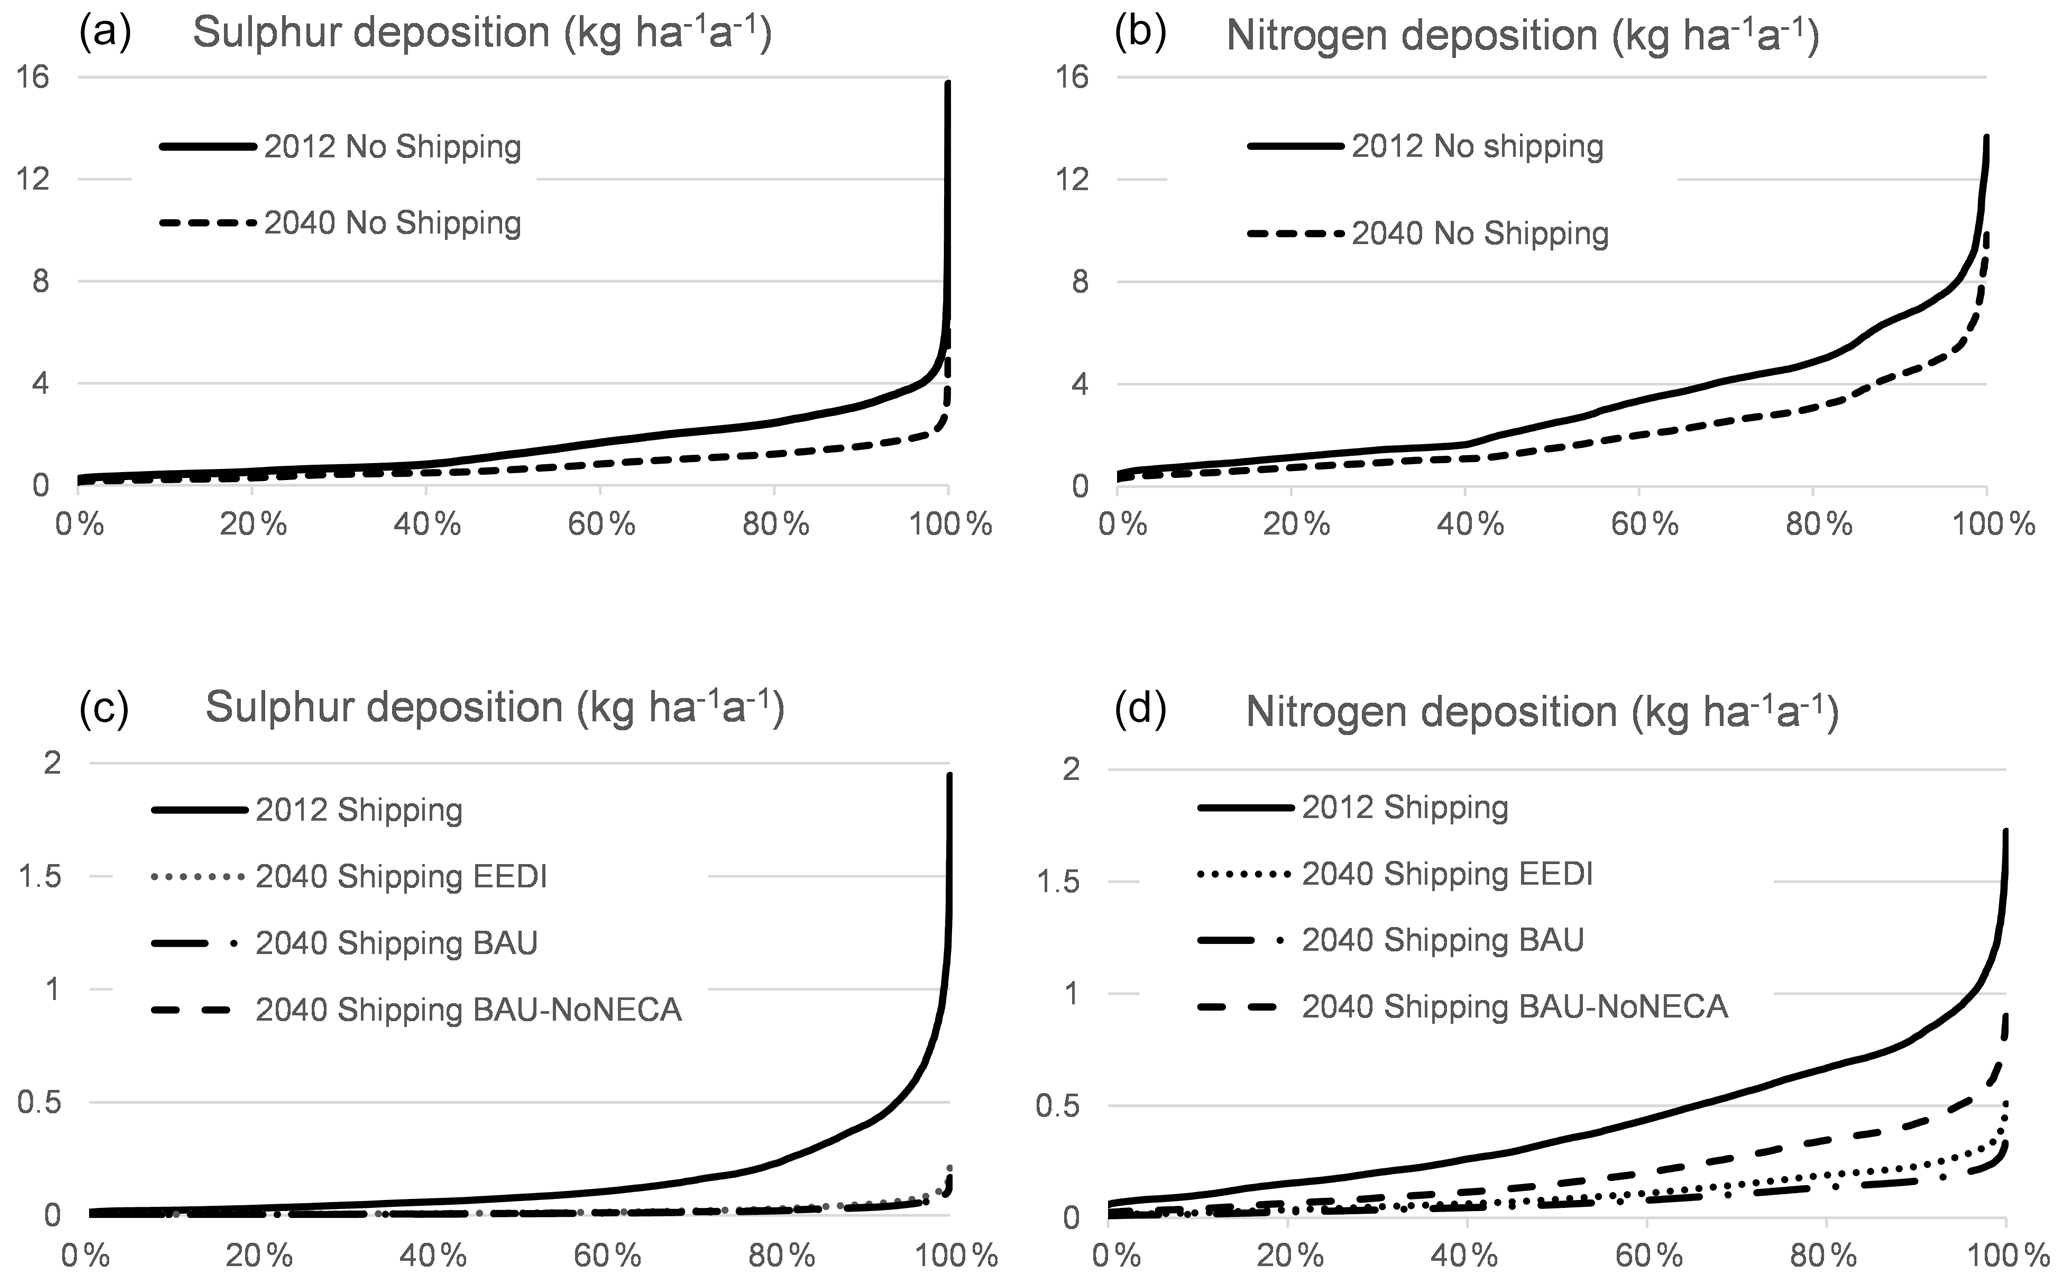
Figure 4Cumulative distribution of deposition of S (a, c) and N (b, d) for all grid cells in the modelled area. Panels (a) and (b) are the deposition from other sources (land-based and shipping from outside the North Sea and the Baltic Sea). Panels (c) and (d) show the deposition from Baltic shipping only. Note the different scales on the y axes for the top and the bottom panels.

Figure 5The average accumulated exceedance (AAE) of CLaci 2012 (a, b) and 2040 (c, d). Panels (a) and (c) show the exceedances for the total deposition. Panels (b) and (d) show the exceedances for the scenario without shipping deposition. The differences in the 2040 NoShip and BAU scenarios for CLaci (c, d) are very small; the differences in 2040 for CLaci between BAU, BAU–NoNECA and EEDI are negligible (maps not shown).
3.3 Contribution of shipping to the deposition of S and N
In the year 2012, the deposition of S was still relatively high, reaching >5 kg ha−1 yr−1 for 1 % of the area with the highest total deposition in the modelled region (Table 3), of which shipping in the Baltic region contributed >0.8 kg ha−1 yr−1. In the year 2040, the deposition of S decreased massively, and the contribution from Baltic shipping is, in absolute terms, very low, above 0.09 kg ha−1 yr−1 only at the most impacted 1 % of the modelled area (Table 3; Fig. 4). The land areas with a high deposition of S typically receive a high deposition originating both from Baltic shipping and from other sources (Fig. 1). Consequently, the Baltic shipping emissions of S, and to an even larger extent of N (Fig. 2), impact predominantly the parts of the modelled domain already under pressure from other air pollution sources.
As stated above, the change from 2012 to 2040 (Table 3; Figs. 1, 2 and 3) followed a similar pattern for both S and N, but the decreasing values until the year 2040 have been less strong for N in all modelled scenarios. Cumulative distribution of the depositions in 2012 and 2040 for different scenarios (Fig. 4) provides further details. Non-implementation of a NECA would have caused Baltic shipping N emissions to contribute to deposition on average more than twice as much than in the BAU scenario, and the less stringent demands on the energy effectivisation of the EEDI scenario would have a clear and quantitatively important impact in terms of N deposition (Fig. 4; Table 3).
3.4 Exceedances of acidity critical loads
The extent and magnitude of the exceedances of CLs for acidification in 2012 and 2040 is presented in Fig. 5. The AAE is a measure of how much the deposition exceeds what the affected areas can withstand (on average in a grid cell; Posch et al., 2015). Geographically, the areas with CLaci exceedances are concentrated at the Swedish west coast and in northern Germany. The different scenarios for the year 2040 differ only in shipping, while the other factors, such as meteorology and emissions from other sources, are the same for these scenarios.
The impact of shipping on CL exceedance can be seen by comparing the NoShip scenario maps on the right with the total scenario maps in the left-hand panels in Fig. 5. For acidification the impact is limited, except for some areas with relatively higher AAE on the Swedish west coast, in northern Germany and in southern Lithuania.
There is an improvement (decrease) in the exceedances of CLaci in the 2040 scenarios compared to 2012. This is, however, also due to emission reductions in the land-based sources. When comparing the two lower panels of Fig. 5, there are only minimal, hardly visible differences, indicating that there is only a very small impact from the Baltic Sea and North Sea shipping in 2040 with regards to the exceedances of CLaci in 2040.
All investigated scenarios include the same regulation for S in marine fuels, and there is not much difference between the scenarios. Neither the introduction of a NECA nor the lower energy efficiency impact the acidification exceedances to any larger extent.
Table 4Exceeded area (in percent of EcoArea) of CLs for acidity for the countries included in the modelled area for all scenarios.
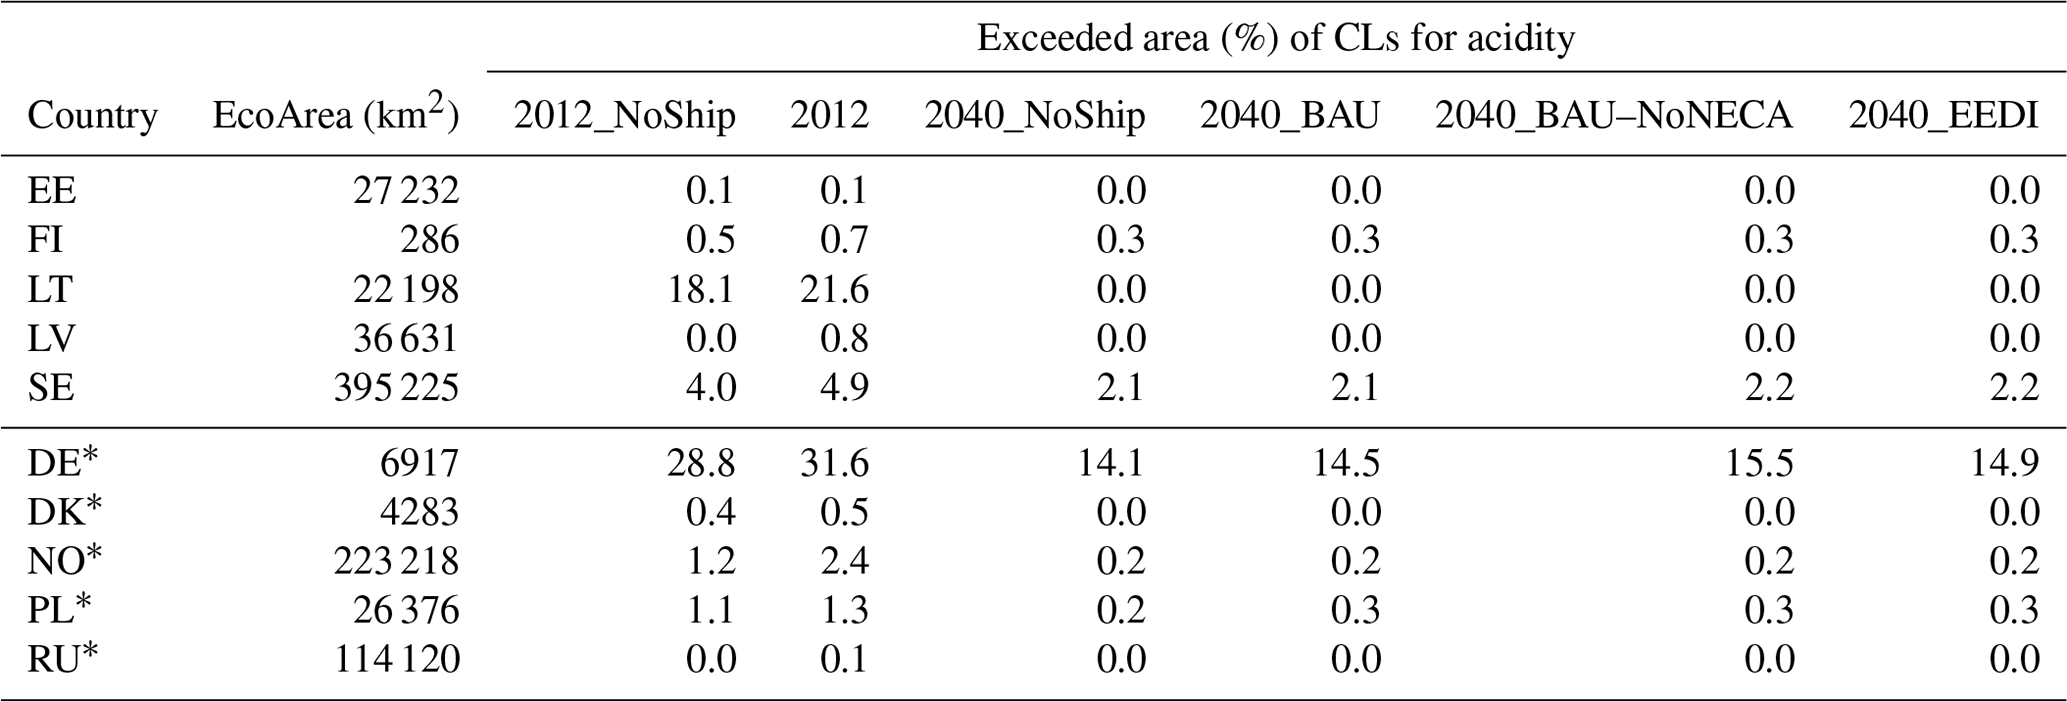
* These countries do not have their entire area included in the modelled area.
Table 5Average accumulated exceedance (eq ha−1 yr−1, equivalents per hectare per year) of CLs for acidity for the countries included in the modelled area for all scenarios.
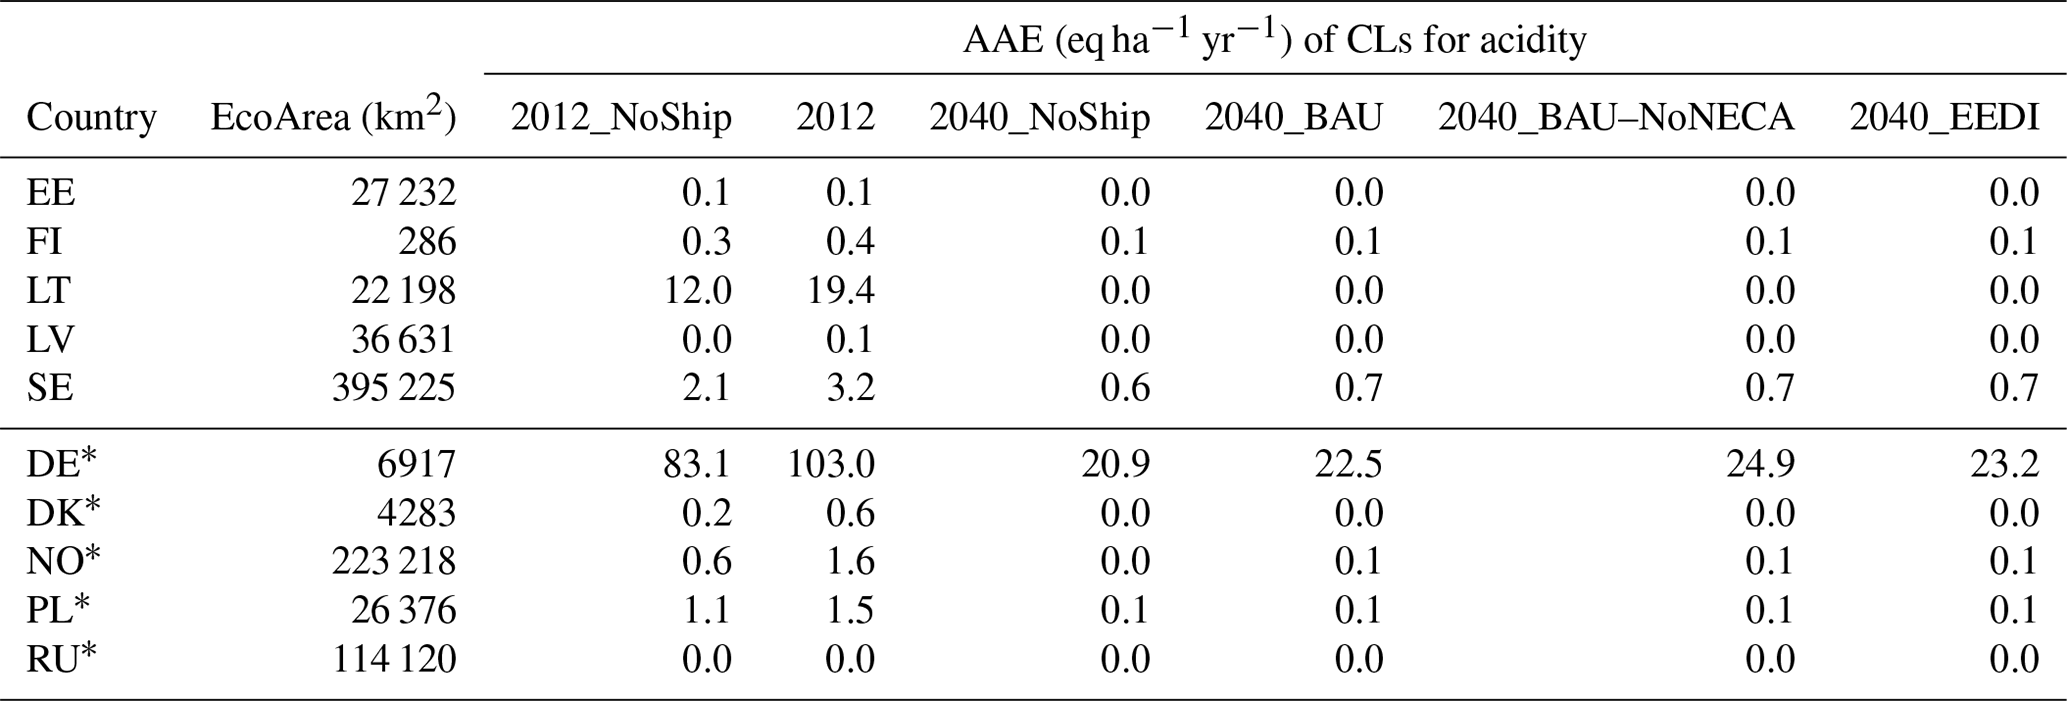
* These countries do not have their entire area included in the modelled area.
CL exceedances are calculated and presented on a national scale in each country for the ecosystem area in need of protection (EcoArea). Tables 4 and 5 present the exceedances of CLaci (for both the EcoArea with CL exceedance and AAE) for all countries surrounding the Baltic Sea. Of the 10 countries, the total country area is modelled for five countries (EE, FI, LT, LV and SE; see Fig. 1 for the country codes), while the modelled domain extends only partially over the remaining five countries (DE, DK, NO, PL and RU). Caution must be exercised when interpreting the calculated exceedance for countries not entirely covered by the modelled area considered here, since any exceeded area percentage is not the percentage for their respective total EcoArea.
Of the five countries with the total area modelled, Lithuania and Sweden have the highest exceedances of CLaci in 2012, both in terms of area and AAE (Tables 4 and 5). The modelled northern part of Germany has the highest exceeded area and AAE, but that is only a small part of the whole country and an interpretation for the whole country is therefore not meaningful. Comparing the results for 2012 with the 2012 NoShip scenario, it shows that shipping has some impact on the exceedances. There is a slight area increase and, especially for the northern part of Germany, quite a substantial increase in AAE. For the rest of the countries, the resulting exceedances are low, both for area and AAE. The results for the 2040 scenarios show several countries with very low or zero exceedances, and there is a great improvement for the countries that had the largest exceedances in 2012. As can be seen in Tables 4 and 5, most of the improvements come from emission reductions on land. However, the impact of shipping on the exceedances of CLaci decreased from 2012 and is rather insignificant in the 2040 scenarios.

Figure 6The average accumulated exceedance (AAE) of CLeutN in 2012. Panel (a) shows the exceedances for the total deposition. Panel (b) shows the exceedances for the scenario without shipping deposition.
3.5 Exceedances of eutrophication critical loads
Eutrophication is clearly a problem, both in terms of area with exceedance and for AAE values, for most of the land ecosystems around the Baltic Sea, except for the north and northeastern part of the Baltic coast (Fig. 6). The largest CLeutN exceedances are in Denmark and on the west coast of Sweden. The impact of shipping on CL exceedances occurs in most of the coastal areas of the central and southern Baltic Sea, including all of southern Sweden. In northern Poland, however, the exceedances are much lower than in Germany and the neighbouring eastern states. Also, between Germany and Denmark a (smaller) jump can be noticed. As mentioned in Sect. 2.3, this is, inter alia, due to the different chemical criteria used for calculating CLs.
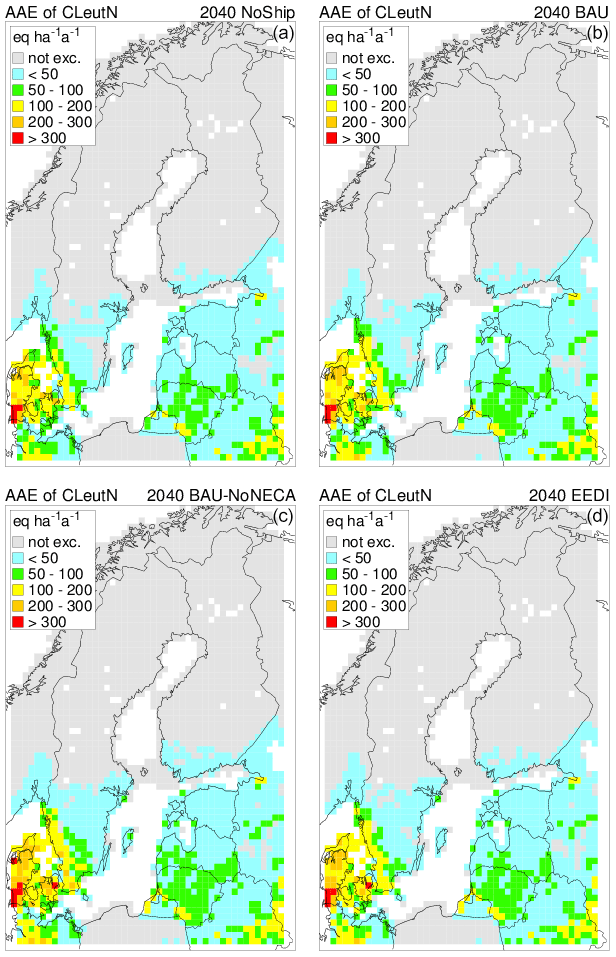
Figure 7The average accumulated exceedance (AAE) of CLeutN in 2040 for the four different scenarios.
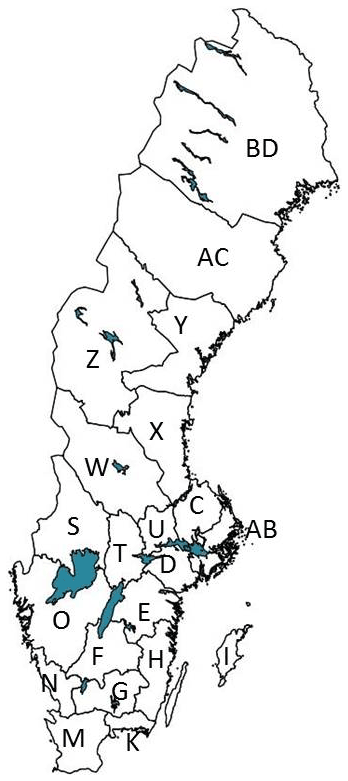
Figure 8Map of Sweden with the county borders and county letter codes. County names are given in Table 8.
For the exceedances of CLs for eutrophication, there are clear improvements seen in the 2040 scenarios (Fig. 7), although eutrophication is still a problem over large parts of the area. There is still a contribution from shipping to the exceedances, although it is less pronounced than in 2012 (see Fig. 6). Without the introduction of NECA (Fig. 7; lower left panel), the exceedances will be higher, especially in Denmark and in the southwest and south of Sweden.
Table 6Exceeded area (in percent of EcoArea) of CLs for eutrophication for the countries included in the modelled area for all scenarios.
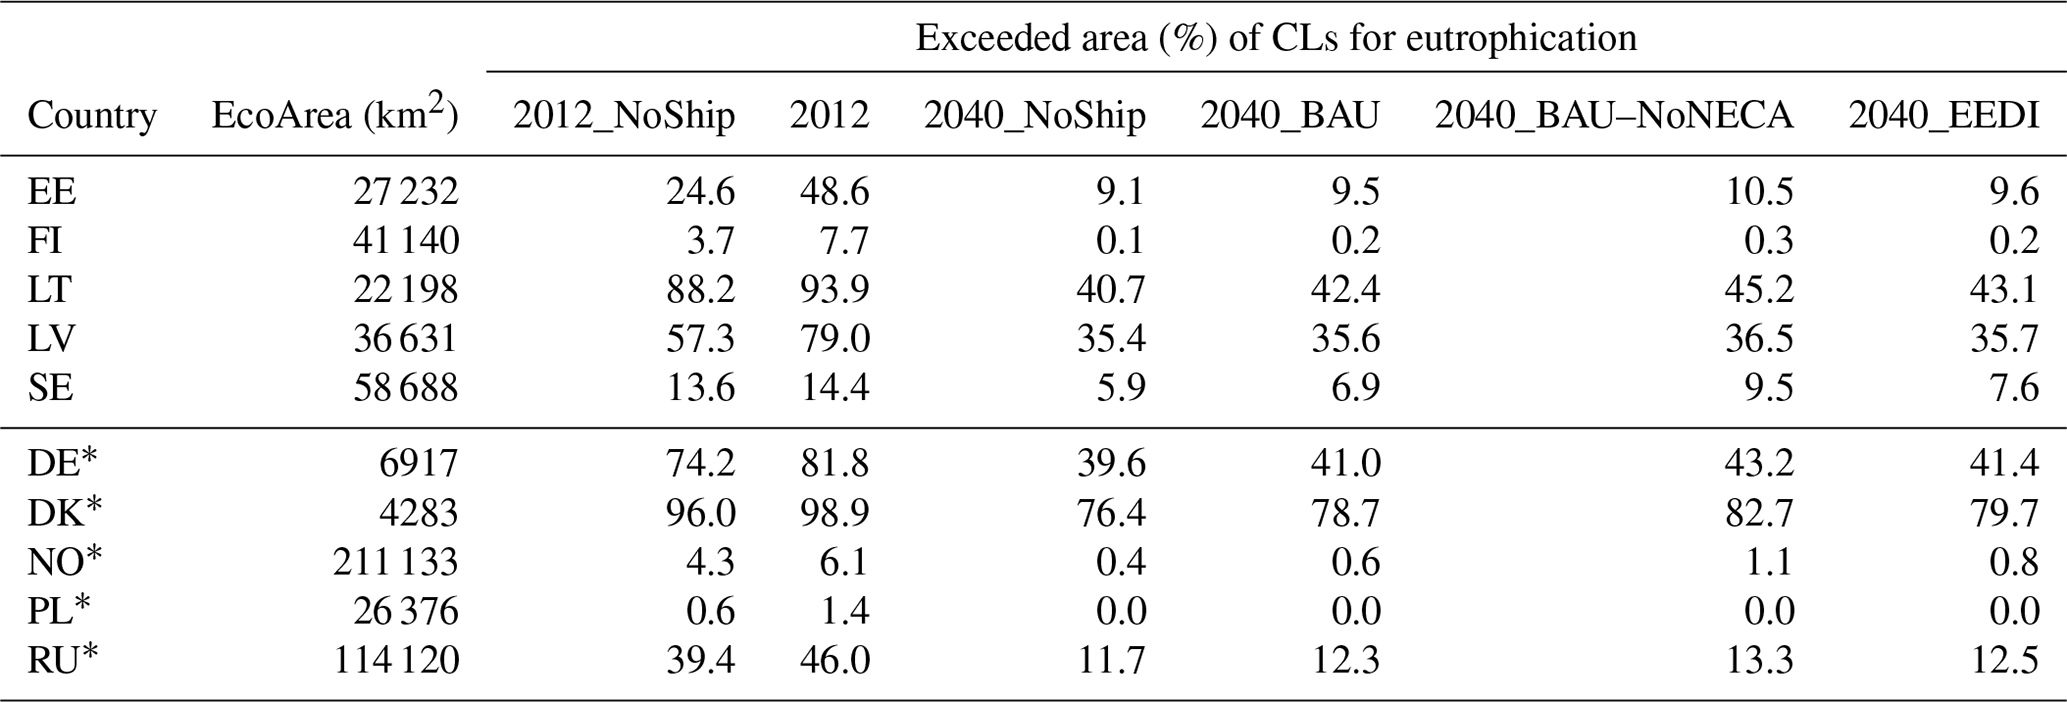
* These countries do not have their entire area included in the modelled area.
Table 7Average accumulated exceedance (eq ha−1 yr−1) of CLs for eutrophication for the countries included in the modelled area for all scenarios.
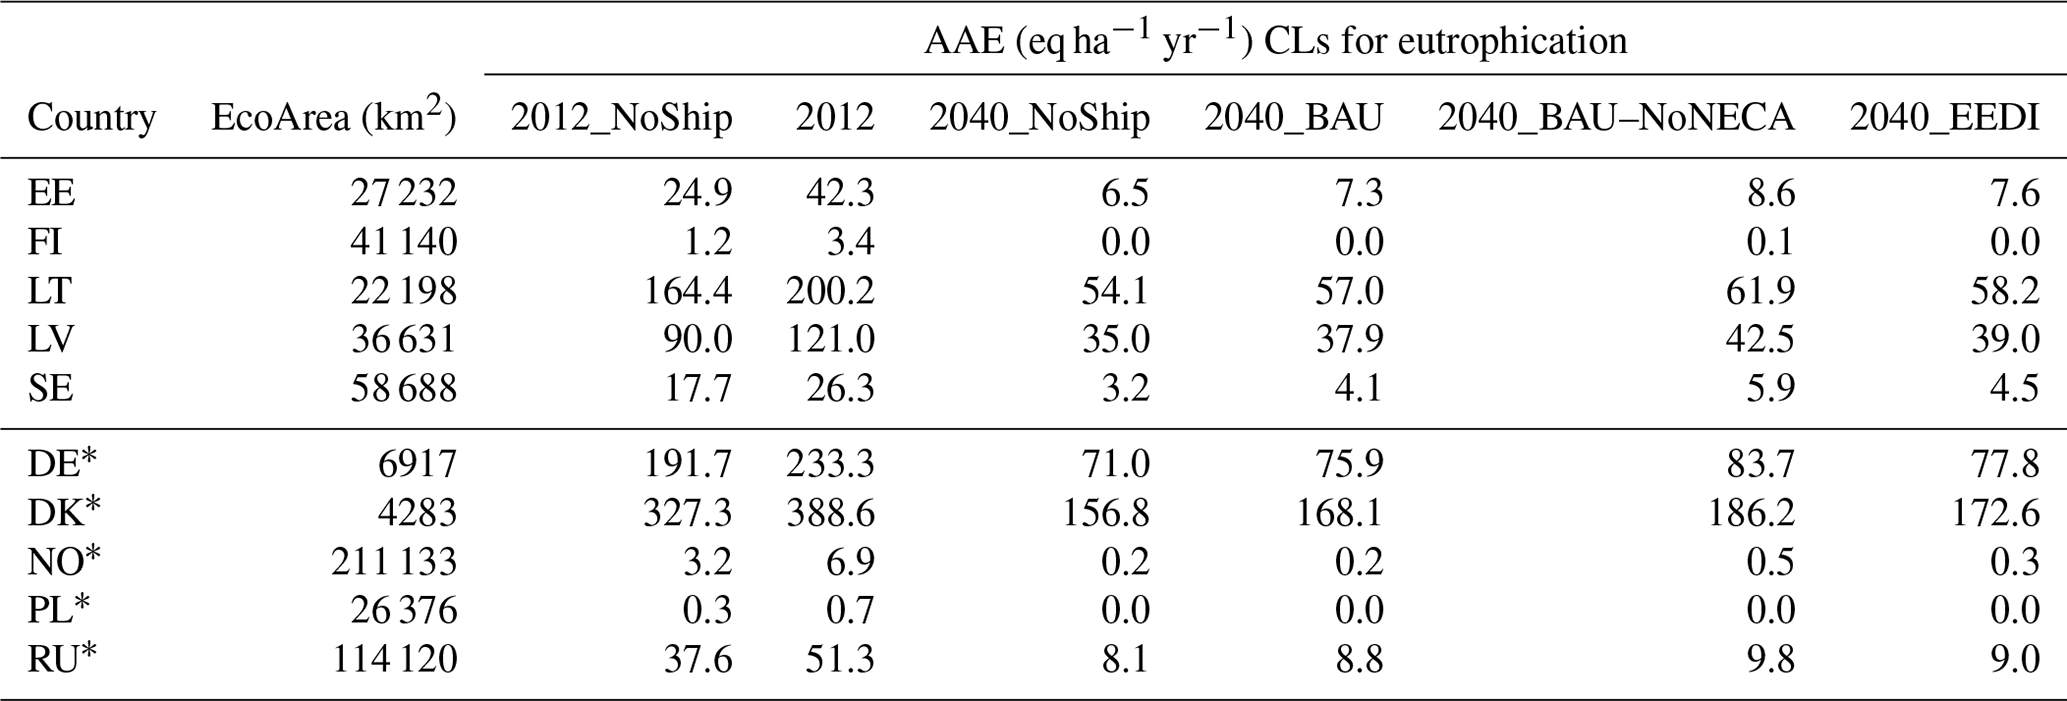
* These countries do not have their entire area included in the modelled area.
Tables 4 and 5 present the exceedances of CLeutN. The exceedances of CLs for eutrophication in 2012 are far greater than those for acidification. Lithuania, Latvia and Estonia each have a large percentage of exceeded area, ranging from almost 50 % to over 90 % (Tables 6 and 7). The situation in Denmark (small parts of the west coast not included in the modelled area) is arguably the worst, with almost the whole area exceeded (Table 6) and very high AAE. The northern part of Germany also has high exceedances of CLs for eutrophication. Comparisons of the results for the 2012 and the 2012 NoShip scenarios demonstrate the contribution that shipping has to the exceedances for eutrophication and, thereby, how much reduced shipping emissions could help to alleviate the situation. In some countries, shipping emissions increase both the exceeded area and the AAE (e.g. Latvia and Estonia). In others, e.g. Denmark and Lithuania, where the area exceeded is high, there is a smaller further increase in the area exceeded but a substantial increase in AAE because the shipping emissions impact areas where the CLs are already exceeded.
For the year 2040, there is a marked decrease in the CLeutN exceedances for all countries, although several still have high exceedances (highest at DK, DE and LV). Comparing the year 2040 NoShip scenario with the other scenarios, shipping is contributing to the exceedances, although to a lesser extent than in 2012. Of the three 2040 scenarios where shipping is included, the BAU scenario with the higher energy efficiency and the introduction of NECA has the lowest exceedances. The highest exceedances are found in the scenario where the NECA is not introduced (BAU–NoNECA). The EEDI scenario, which has implemented NECA but with lower energy efficiency, lies in between the other two scenarios but is closer to the BAU scenario.
3.6 The impact of emissions from shipping on Sweden
Given the large geographical extent of the area impacted by the emissions from Baltic Sea shipping, the division of the impacts by countries (Tables 5 and 6) is logical but hides the fact that the effects are often unevenly distributed within each country. To illustrate the variability in the impact of shipping emissions within a country, we have chosen to look at Sweden in more detail.
Sweden, a country of 450 000 km2 and with an extension of almost 1600 km from south to north, has a large geographical difference in the exceedance of the CLs. In general, the CL exceedance gradient is from the Swedish southwestern coast, which is most affected by both eutrophication and acidification, to the northern part of the country where there is, and has been, relatively less deposition of S and N and lowest CL exceedances. Importantly, for the contribution from Baltic Sea shipping, Sweden has several large ports with heavy shipping traffic and areas close to major shipping routes. The port of Gothenburg, located on the Swedish west coast, is the largest port in Scandinavia. Others include the port of Trelleborg in the south of Sweden, the port of Helsingborg and Malmö, both by the Öresund strait on the west coast and the port of Stockholm on the east coast. Taking a closer look at the impact of shipping for Sweden, the exceedances of CLs for acidification and eutrophication have been calculated on a county level (Fig. 8) for the scenarios in Table 2.
Table 8Average deposition of N and S (kilograms per hectare per year; hereafter kg ha−1 yr−1) in Swedish counties for 2012 and 2012 NoShip.
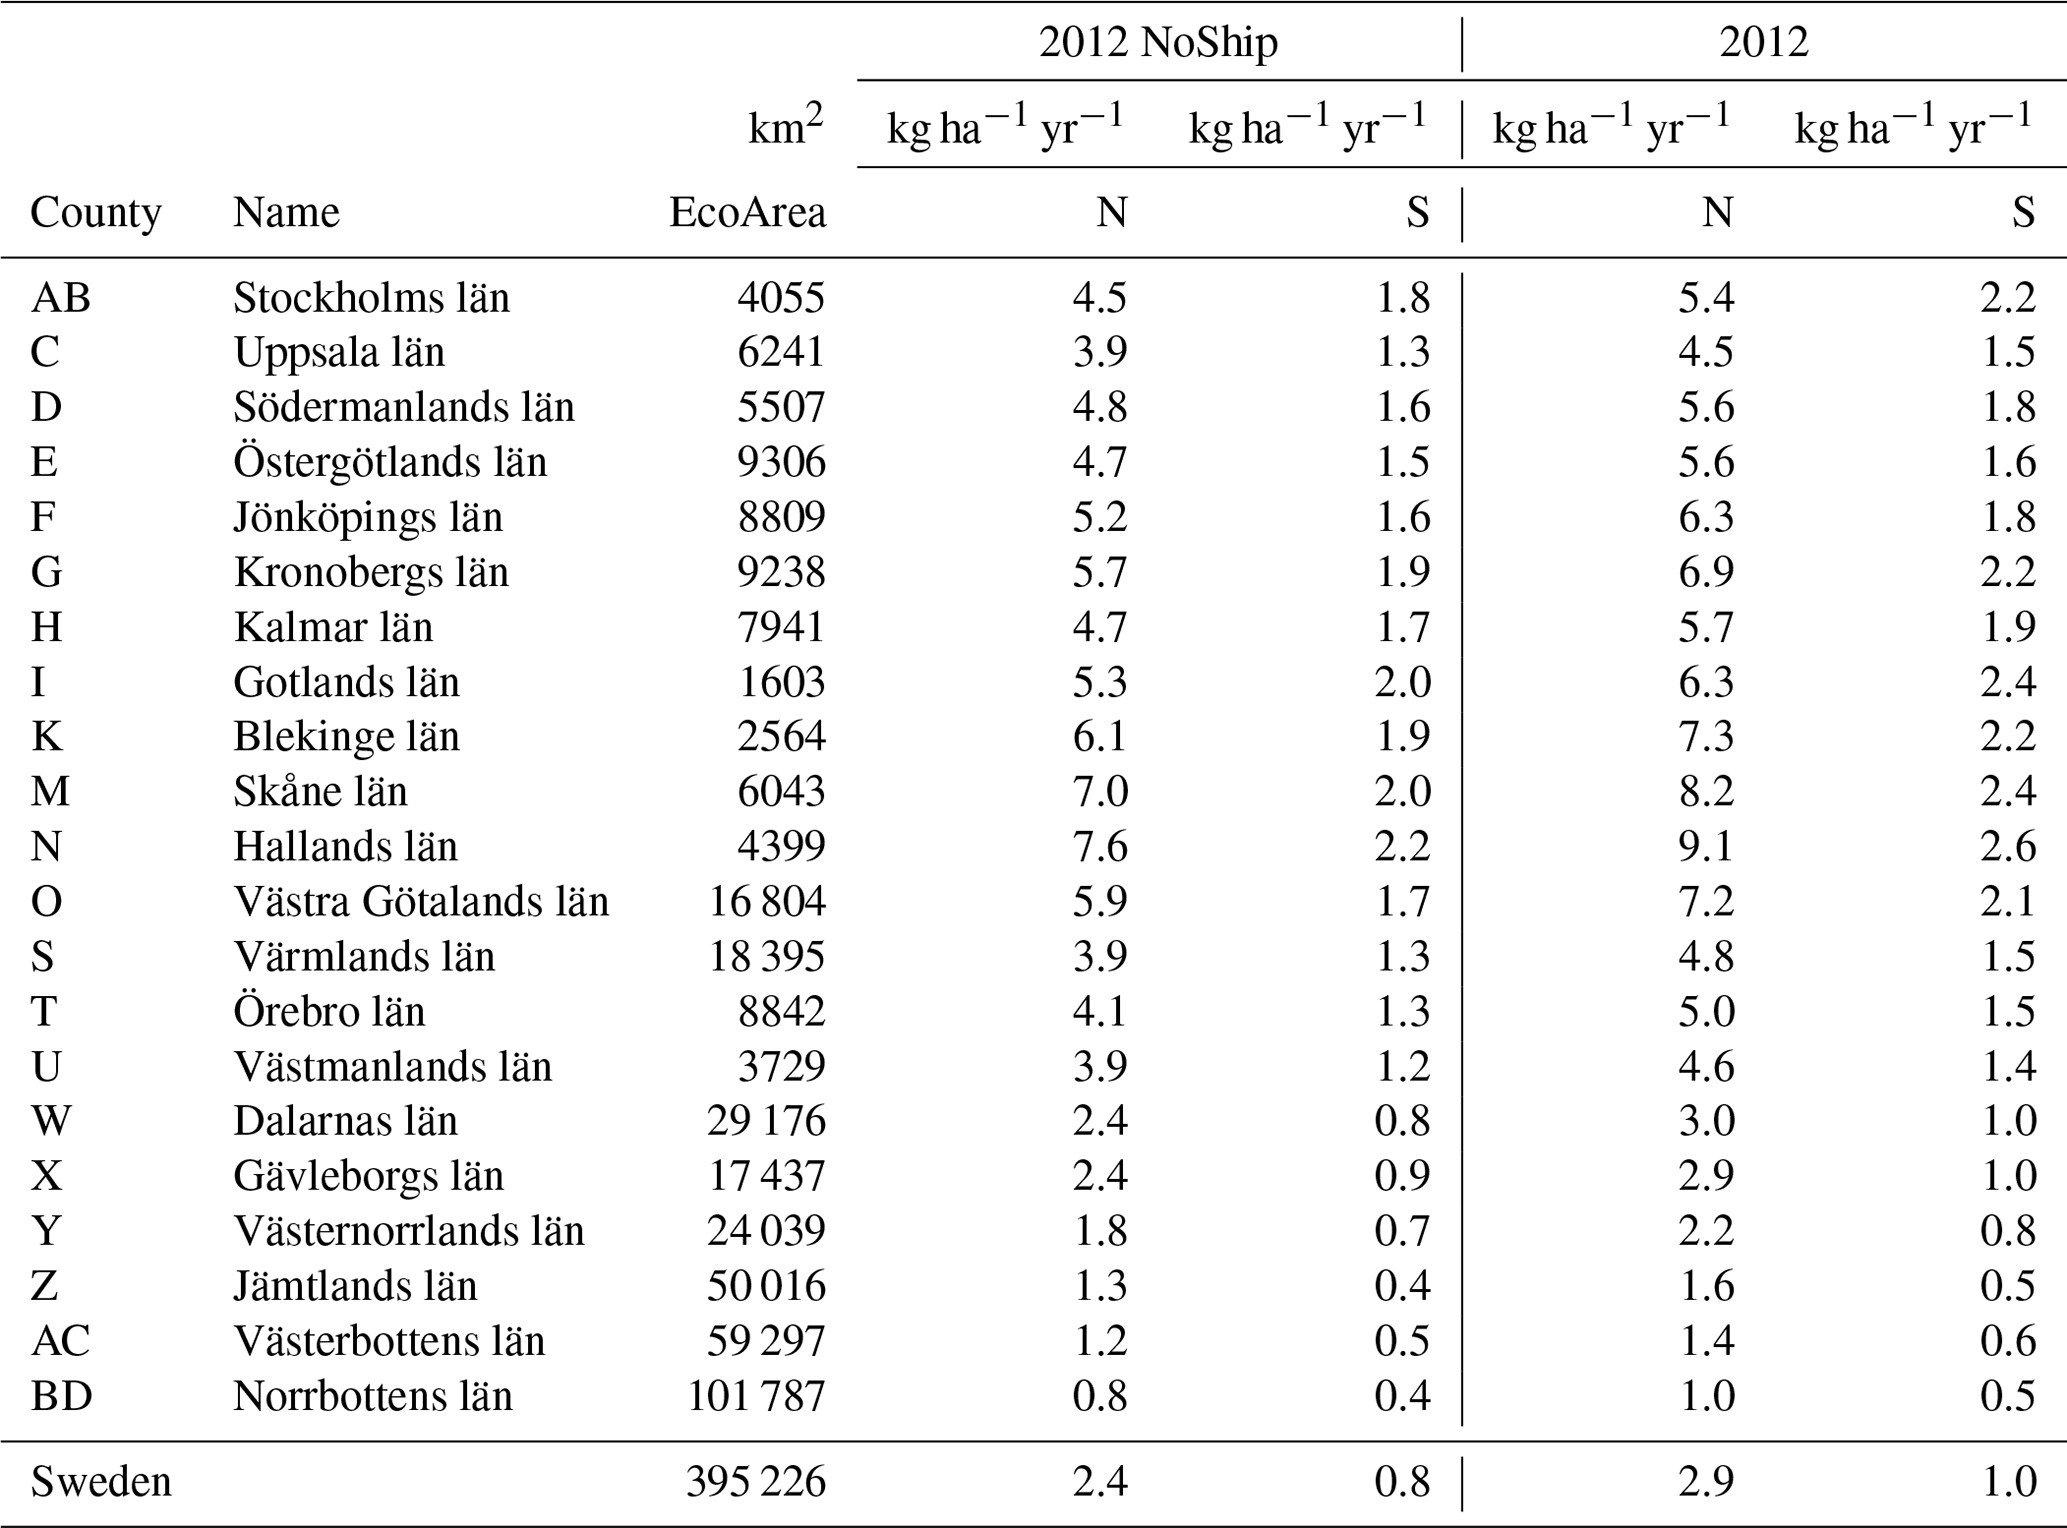
Table 8 gives a list of the Swedish counties and the average deposition of N and S. In 2012, Hallands län (county N) on the Swedish west coast received the highest total deposition of S (2.6 kg ha−1 yr−1; calculated as an average for the EcoArea in the county) followed by counties I and M in the south and southeast (2.4 kg ha−1 yr−1; see also Fig. 1). The northernmost counties receive very little deposition in comparison (0.5–1.0 kg ha−1 yr−1). The highest deposition of S originating from shipping is also over county N, closely followed by county AB (both around 0.5 kg ha−1 yr−1) and then O, M and I (close to 0.4 kg ha−1 yr−1). Counties AB and O receive the largest contribution from shipping in relative terms (21 % and 19 %, respectively).
The highest average deposition of N (on ecosystems with calculated CLaci) is on the south and southwest of Sweden. County N receives the highest deposition (9.1 kg ha−1 yr−1), followed by counties M and K (8.2 and 7.3 kg ha−1 yr−1). The least amount of N deposition is in northern Sweden (1–3 kg ha−1 yr−1; Table 8). The contribution of N deposition from shipping is the largest over county N as well (1.5 kg ha−1 yr−1), followed by county K and O (1.3 and 1.2 kg ha−1 yr−1). In relative terms, the largest contribution from shipping is in counties W, S and H (close to 20 %).
Table 9Exceedances of CLs for acidification (aci) and eutrophication (eut) for both area (percent) and AAE (eq ha−1 yr−1) for 2012 and 2012 NoShip for the respective EcoAreas (EcoAraci is EcoArea for acidification; EcoAreut is EcoArea for eutrophication) in the Swedish counties.
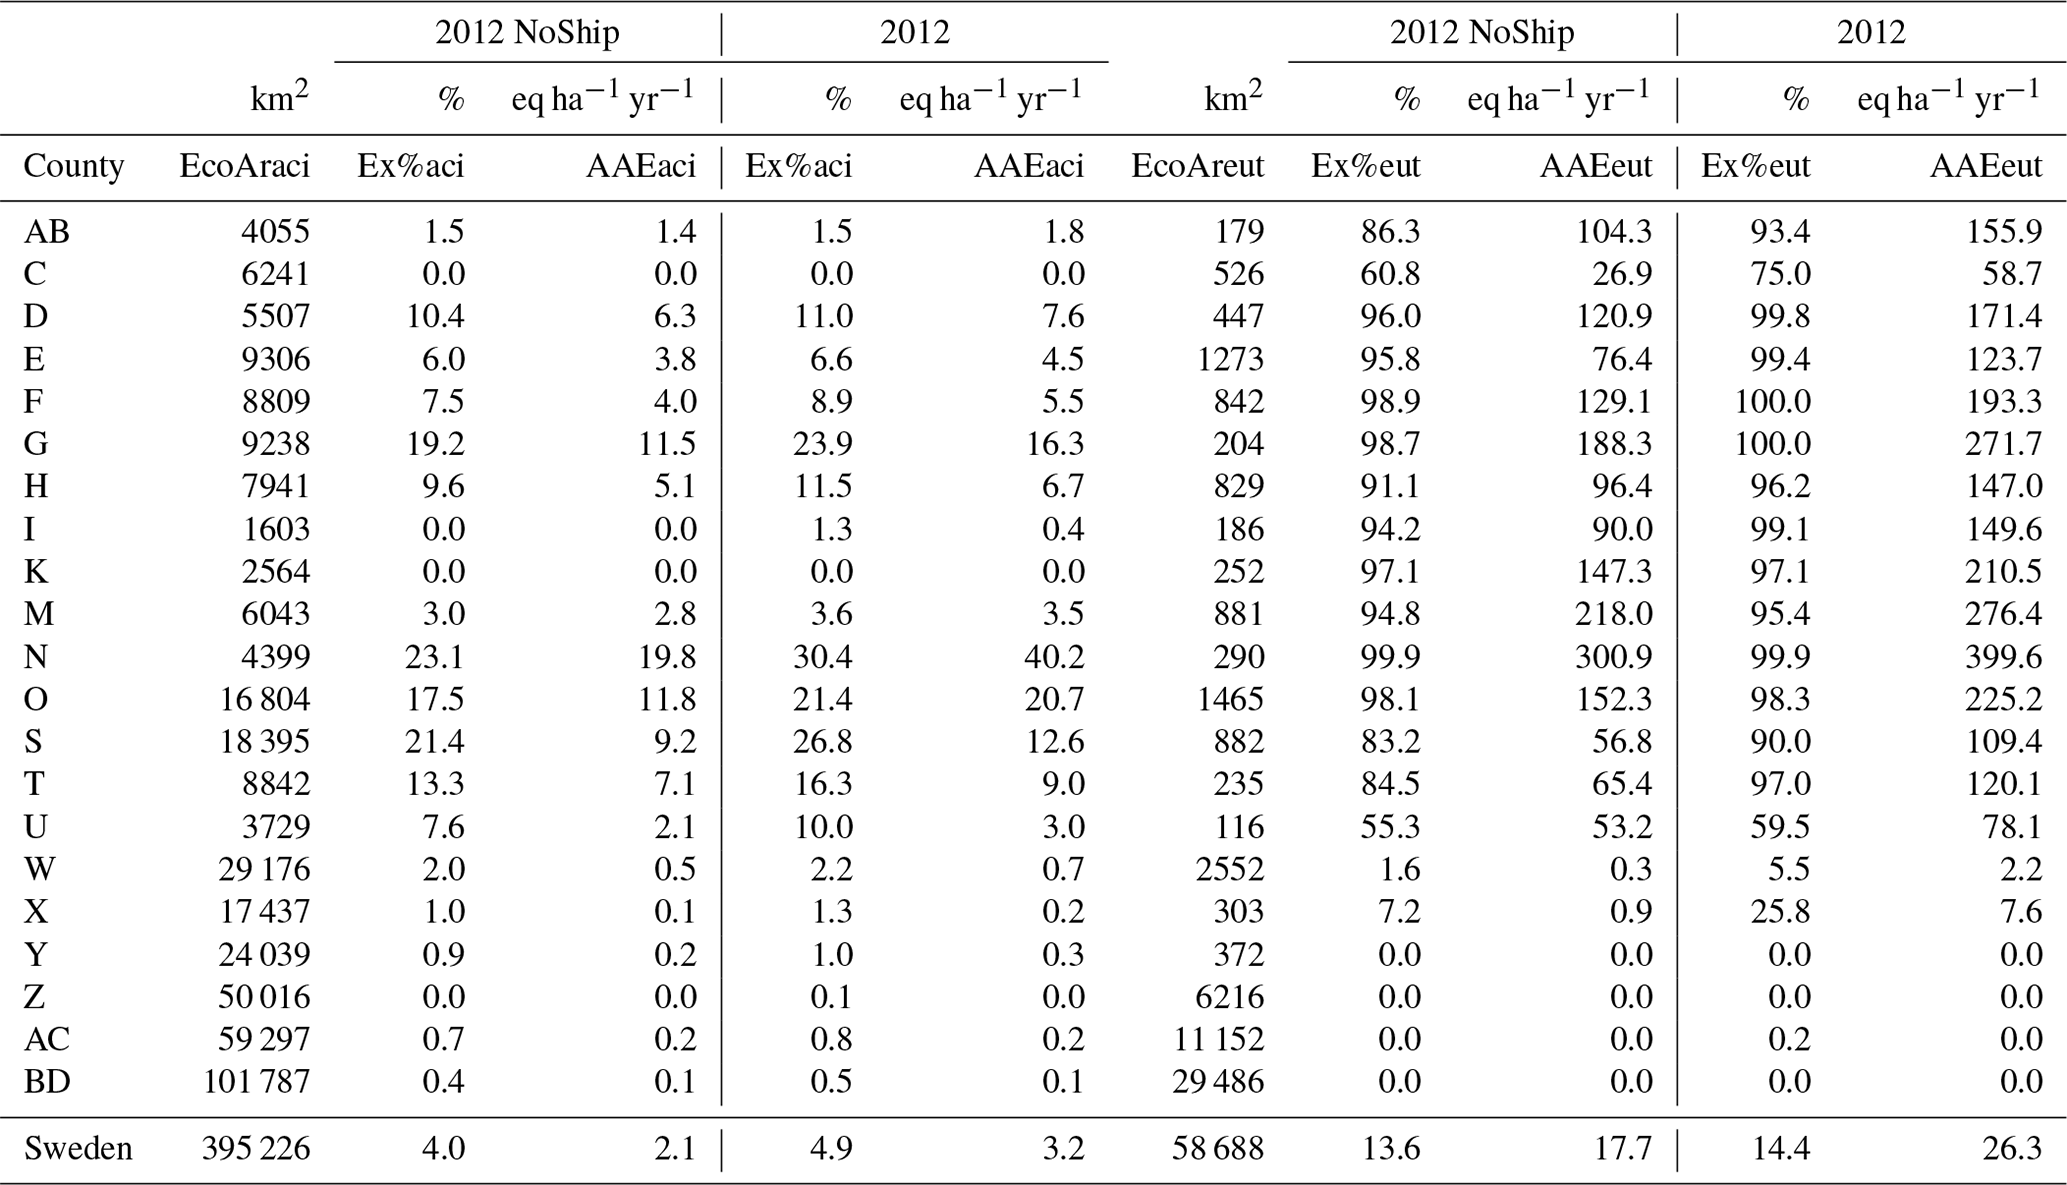
The area of exceedance for the CLs for acidification in Sweden in 2012 is close to 5 % (Table 9). Even though the total percentage is low, there are areas with high exceedances. County N has the highest exceedances in both area and AAE for CLs for acidification (30.4 %; 40.2 eq ha−1 yr−1). Without the shipping emissions (2012 and 2012 NoShip), the exceeded EcoArea would be 23.1 %, and the AAE would be halved. Counties I and M have little to no exceedance when it comes to acidification, even though they receive a similar amount of S deposition as county N. This is due to the low sensitivity to acidification in these regions (county I is rich in limestone, for example). On the other hand, counties G and S have the second- and third-highest exceedances of CL for acidification.
The area of exceedance for CLs for eutrophication in Sweden for 2012 is almost 3 times as much as for acidification (about 14 %). Several of the counties have over 90 % of their areas exceeded with respect to eutrophication, many of which receive a relatively high input of deposition from shipping emissions (Fig. 3). Although the difference in exceeded area for these counties is relatively small between the 2012 and the 2012 NoShip scenario, the input from shipping is reflected in the increased AAE. County N has the largest AAE for eutrophication and is exceeded on 99.9 % of the ecosystem areas sensitive for eutrophication. The difference in AAE between the 2012 and the 2012 NoShip scenario for county N is close to 300 eq ha−1 y−1.
Table 10Average deposition of N and S (kg ha−1 yr−1) in the Swedish counties for the 2040 scenarios (2040 NoShip, BAU, BAU–NoNECA and EEDI).
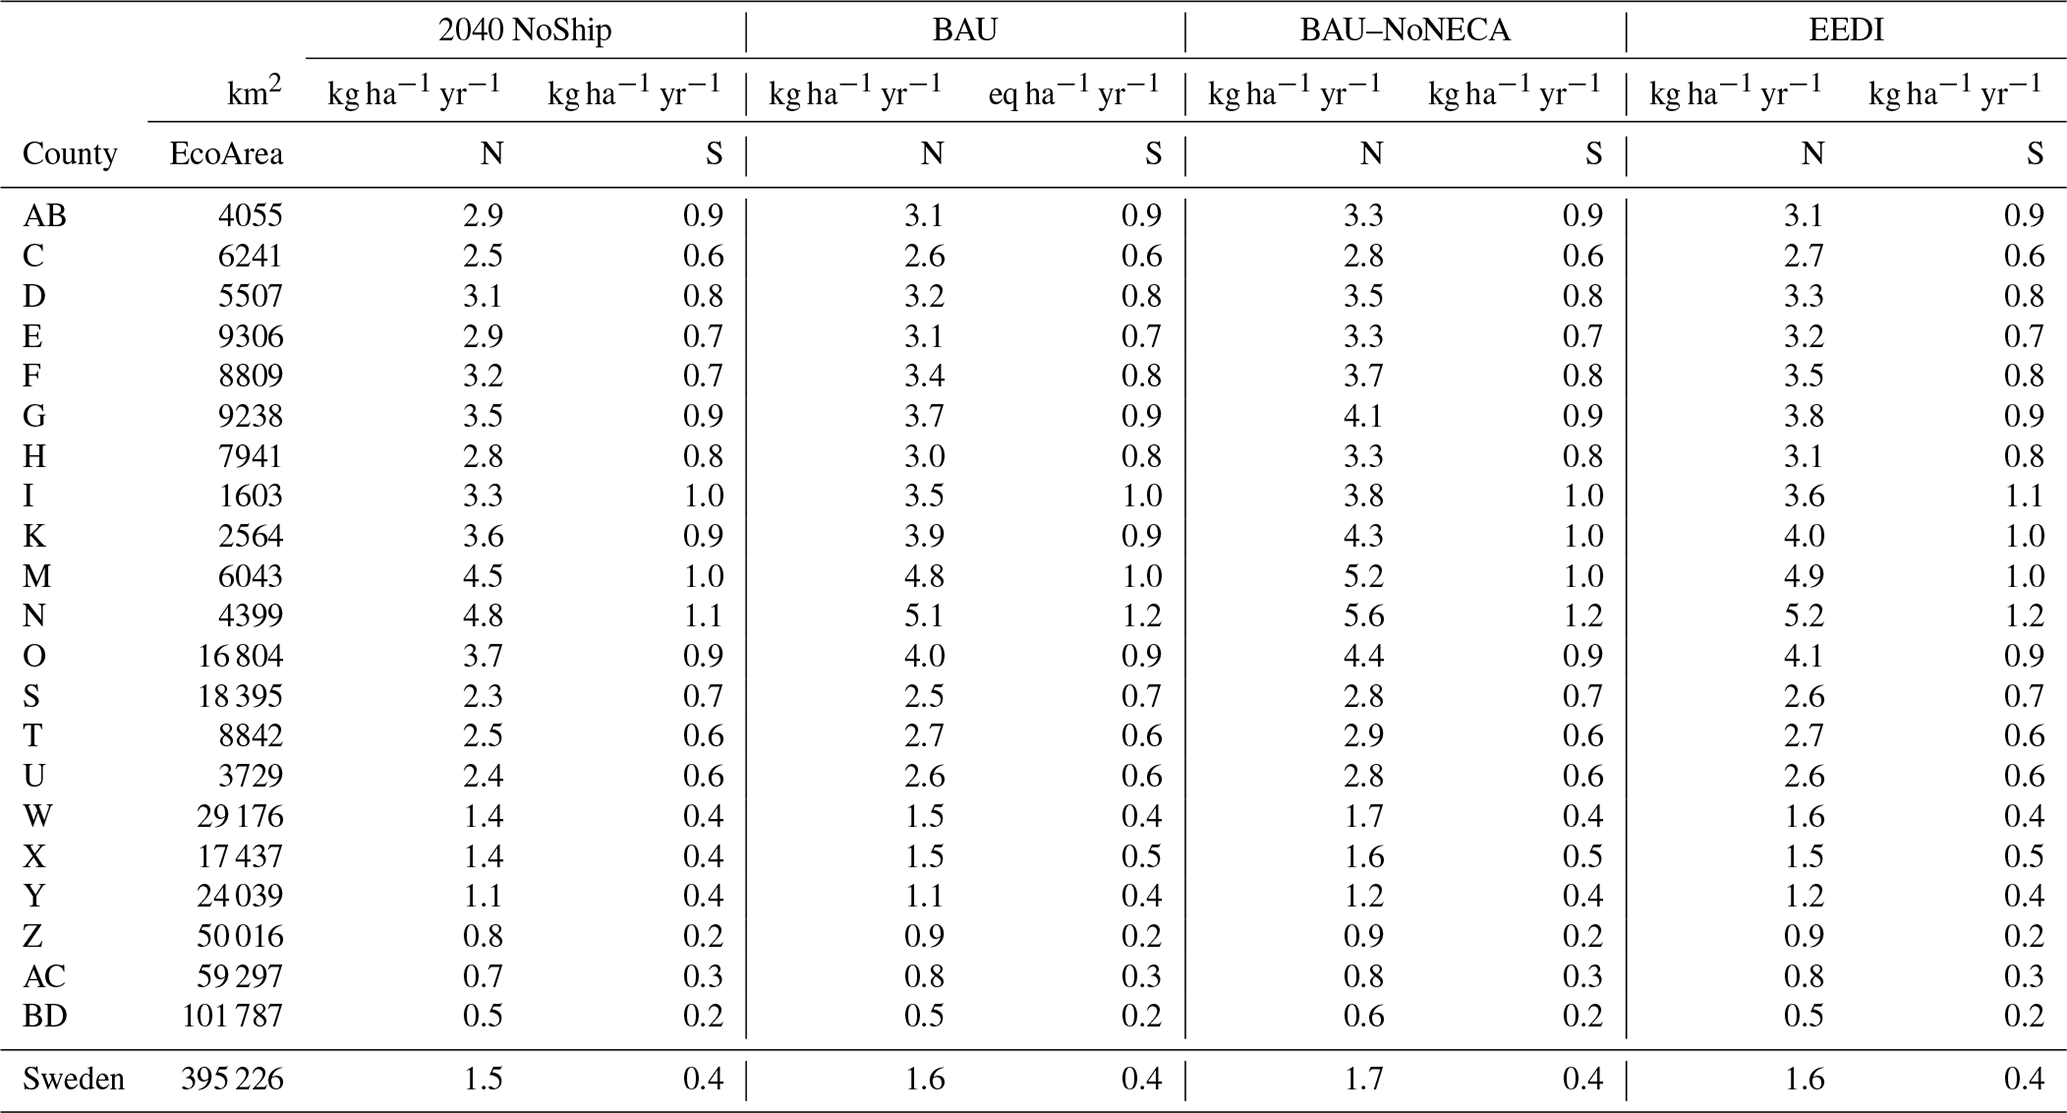
The contribution from shipping to the total deposition of S was between 8 % and 21 % at the county level in 2012. Until 2040, it is expected to decrease to between 2 % and 4 % (Tables 8 and 10). The decrease in S deposition can be mainly attributed to harder restrictions, such as the introduction of a SECA (0.1 %) in 2015, but other developments, such as higher fuel efficiency, changes in fuel type, economic development, etc., also have an impact.
The contribution from shipping to the total deposition of N was between 14 % and 19 % at the county level in 2012. Until 2040, it is expected to decrease to between 5 % and 7 % (Tables 8 and 10).
The area of the exceedance of CLs for acidification drops from 5 % in 2012 to about 2 % for the BAU 2040 scenario. Generally, there is very little difference in the exceedances of CLs for acidification between any of the 2040 scenarios, including the 2040 NoShip scenario. There seems to be little impact of NECA and lower fuel efficiency and even of shipping in general on the critical load exceedances for acidity.
The area of the exceedance of CLs for eutrophication drops from 14 % in 2012 to about half in the BAU scenario for 2040. In contrast to the results for acidification, there is a larger difference between the 2040 scenarios. In the scenario where the NECA has not been implemented (BAU–NoNECA), the exceeded area is, as expected, greater than for BAU and EEDI. The scenario with the NECA implemented, but with the lower energy efficiency (EEDI scenario), has slightly higher exceedances than BAU but is lower than BAU–NoNECA. In contrast to exceedances of CLs for acidification, shipping still has an impact on exceedances for eutrophication in 2040 (Tables 11 and 12). For several of the counties (e.g. O, S, K, F and I), there is a clear improvement with the implementation of the NECA in the exceedances of CLs for eutrophication.
Table 11Exceedances of CLs for acidification (aci) for area (percent) and AAE (eq ha−1 yr−1) for the 2040 scenarios in the Swedish counties.
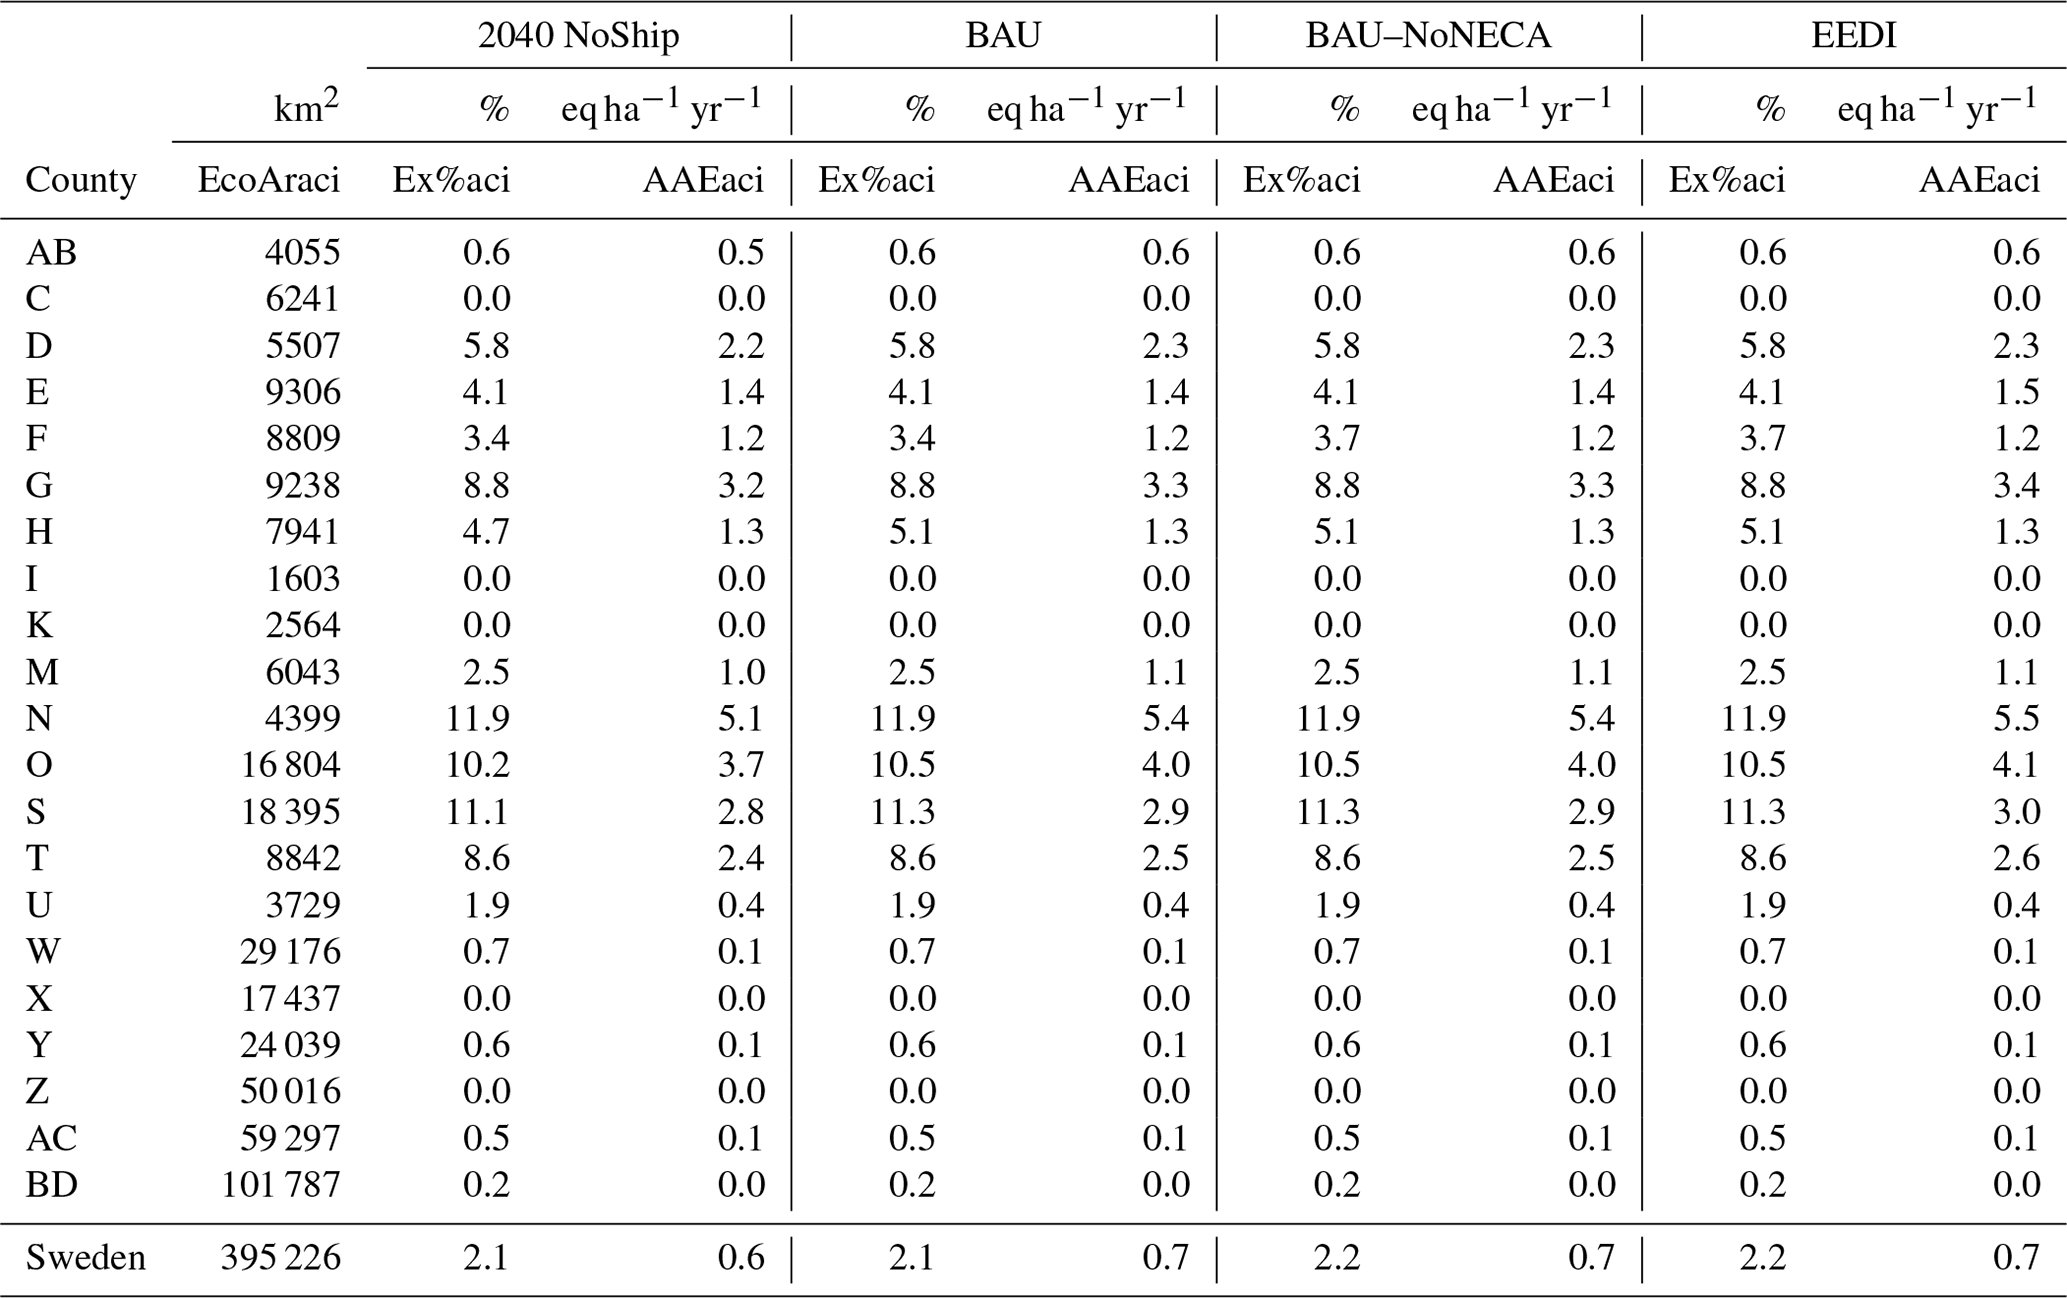
Table 12Exceedances of CLs for eutrophication (eut) for both area (percent) and AAE (eq ha−1 yr−1) for the 2040 scenarios in the Swedish counties.

The introduction of SECA and NECA for the Baltic Sea and the North Sea, together with increased energy efficiency of ship operations and other changes included in the future scenarios, showed a reduction in S and N deposition from shipping even though transport volumes are expected to increase. A decrease in S deposition originating from land-based sources from 2012 to 2040 by about 53 %, in median, for the modelled extended Baltic Sea area was calculated. The implementation of SECA resulted in even stronger relative decrease of shipping-related deposition of S, contributing in 2040 in all three scenarios, in median, less than 1 % of the remaining total S deposition. For N, the total deposition (land based plus shipping) decreased by about 43 % (median). The contribution from shipping decreased from about 10 % in 2012 to 4 %–9 % of the total in 2040, depending on the modelled scenario. The less strong deposition decline for N and the less strong decrease in the shipping contribution explains the differences in exceedances of CLaci and CLeutN.
Jonson et al. (2019) investigated the effects of the Baltic Sea ECA regulations by comparing, among others, the oxidised N and S deposition between 2014, 2016 and 2030. They found that, while shipping in the Baltic Sea was contributing with more than 10 % to S deposition before strengthening of the fuel S limit in 2015, it became an insignificant source of S deposition in 2016 after the implementation of the 0.1 % fuel S limit, and a further decrease in S deposition between 2016 and 2030 is mainly due to changes in land-based emissions. Jonson et al. (2019) expected a reduction in the contribution of Baltic Sea shipping to the deposition of oxidised N by 40 %–50 % between 2016 and 2030. In our results, we can see an even larger decrease from 2012 to 2040, part of which can be explained by more ships being affected by the NECA rules.
The maps with shipping-related deposition of oxidised S (Fig. 1; bottom panels) and oxidised N (Fig. 3) show a distinct difference in regional pattern, with S deposition having maxima along the shipping lines, while the highest deposition of oxidised N is along the coasts. The main reason for the high deposition of S along the shipping lanes is that SO2 is highly water soluble, especially in alkaline sea water, causing the emitted SO2 to quickly deposit on the water surface near the source. The process is further enhanced by rainwater washing out the SO2. The shipping plumes are emitted at low altitude, and the boundary layer above the sea is mostly neutral. Therefore, the exchange between the plumes and the water surface is efficient. On land, the largest contribution from shipping to the total S deposition is along the coasts, where some SO2 has already been oxidised, and the deposition consists of both SO2 and particle-bound sulfate. The modelled deposition of the shipping-related N has a different pattern from that of S, with a higher deposition over the land than over the sea near the shipping lanes (Fig. 3). The reason is most likely that the deposition rate of NO2 is low, and the N deposition is completely dominated by the deposition of N in higher oxidised states. Most of the emitted NO2 must first undergo oxidation in the atmosphere before it is deposited, primarily as particulate nitrate, with some also deposited as HNO3 or organic nitrates. The nitrates are also less soluble in deliquescent aerosol particles and rain droplets than sulfate, especially if these are acidified. The N deposition in coastal areas may be enhanced due to more efficient deposition of particles over land than on the sea surface. Furthermore, the HNO3 formed during transport of maritime emissions over the sea can react in coastal areas with NH3 from agriculture and form additional particulate nitrates. The pattern of N deposition from shipping is similar to the deposition pattern shown in Jonson et al. (2015) of modelled N deposition originating from shipping using the EMEP model.
The exceedances of CLs for both acidity and eutrophication decrease from 2012 to 2040 in all scenarios. There are substantial reductions in land-based emissions that lead to decreases in the exceedances for acidity and eutrophication. For CLaci, when comparing the 2040 scenarios, it shows that the impact of the NECA and of the lower fuel efficiency does not have any noticeable impact on the critical load exceedances. Overall, the contribution from shipping is very low since the S emissions are drastically reduced by the introduction of SECA, which is common to all scenarios.
By 2040, there will still be a significant area with the exceedance of CLs for eutrophication with a noticeable contribution from shipping. The highest impacts are on Denmark and northern Germany. Although the estimated exceedance of CLs for eutrophication for the whole of Sweden in 2040 does not show a significant impact from shipping, this looks quite different on a county level. The introduction of NECA will improve the situation in several of the Swedish counties, but emissions from shipping will still contribute to the exceedances for several counties. In the five counties with the highest exceedances of CLeutN (both area and AAE) in the 2040 BAU scenario, shipping contributes to a mean of 18 % of the AAE. Repka et al. (2021) calculated the costs and environmental benefits of ship-originated SOx and NOx emission reductions in the Baltic Sea and also assessed the effect of shipping emissions on the exceedances of critical loads. While the underlying critical loads database (Hettelingh et al., 2017) used by Repka et al. (2021) is the same as in this work, the geographical domain of the assessment, the models used to calculate atmospheric deposition and the years of the assessment differ. Nevertheless, the overall conclusion about the relatively larger importance of shipping emissions for exceedances of critical loads for eutrophication as opposed to acidification and about the decline in CL exceedances from 2015 to 2030 (from 2012 to 2040 in our work) agree. Direct comparisons between the calculated CL exceedances are difficult due to the different years considered. However, with that caveat, relatively large differences in the calculated critical loads exceedance were found for Lithuania and for Latvia, while results were very similar for, e.g., Finland and Sweden. The differences in CL exceedances are driven by the differences in calculated atmospheric deposition by the different models, which is addressed in detail by Karl et al. (2019b). The comparison of the two works provides an estimate of uncertainty of the calculations due to, e.g., different model set-ups and different meteorology between the modelled years, combined with the change in CL exceedances over time; however, no opportunity is provided to separate the two.
The NECA rules that have been introduced in 2021 only apply to newly built vessels. With a life expectancy of approximately 25 years for ships, significant effects will be seen only about 15 years after the introduction. A national legislation that would speed up the installation of NOx cleaning technology on ships, like the NOx fund in Norway, has great potential to reduce emissions much earlier, probably already in the next decade (Parsmo et al., 2017). The possibility of significantly reducing CL exceedances through further measures in the shipping sector should be utilised even though other sectors also will need to be involved.
An aspect to be considered is the recent IMO target of halving the CO2 shipping emissions by 2050 compared to the 2008 emissions. The decision was made in April 2018 and is not included in the future scenarios in this paper. The reduction in fossil fuel use that will be required to achieve this goal is more far-reaching than what has been adopted in the BAU scenario. New potential abatement technologies to further reduce the fossil CO2 emissions have been screened, e.g., by the Fourth IMO GHG Study (Faber et al., 2020) and include a range of measures such as, e.g., the use of fossil-based alternative fuels with carbon capture, use of fuels without fossil carbon, such as hydrogen, ammonia or synthetic and biomass carbon fuels with carbon capture, use of batteries and use of renewable energy, e.g. wind power and solar panels for auxiliary power. While some of these technologies are zero emission regarding air pollutants (batteries, wind and solar power), others still have emissions of air pollutants, particularly of nitrogen (all combustion technologies, with or without carbon capture). The potential mixture of future technologies needed to meet the IMO 2050 target has not been presented yet, and emission factors for many of these not yet fully developed technologies are largely unknown. A quantitative estimate of the potential impact of a full implementation of the IMO 2050 target on scenarios presented in this study is therefore currently not possible.
For all the future scenarios in this paper, there is an assumption of 100 % compliance with regards to all regulations. An investigation of S emissions from ships in Danish waters after the SECA entered into force showed a compliance rate between 92 %–97 %. Depending on the time period and platform used, the fuel S content of the non-compliant fuel varied between 0.3 % and 1.5 % (Mellqvist et al., 2017). This rate of noncompliance would increase the SO2 emissions of the order of 20 %–80%, though from a very low level. Compliance monitoring and efficient enforcement of especially NECA regulation but also of fuel S content regulations are currently the subjects of intensive research and discussion, not only by environmentalists but also by lawyers and policy makers.
The air quality model CMAQ is developed and maintained by the U.S. Environmental Protection Agency (US EPA). COSMO-CLM is the community model of the German climate research (https://www.clm-community.eu/, last access: 26 February 2021). The simulations with COSMO-CLM and CMAQ were performed at the German Climate Computing Centre (DKRZ) within the project “Regional Atmospheric Modelling” (project ID 0302).
The critical loads database is currently hosted by Coordination Centre for Effects (CCE) at the Umweltbundesamt in Germany (http://www.umweltbundesamt.de/en/Coordination_Centre_for_Effects, last access: 8 October 2021). The data are only available from the individual countries that provided them, and the contact information can be found in Hettelingh et al. (2017).
FM, SJ and JM conceived the paper. MK and VM modelled deposition from shipping. MP calculated the CL exceedance and produced the CL exceedance maps. SJ, FM and JM wrote the paper, with ideas and feedback from MK, VM and MP.
The authors declare that they have no conflict of interest.
Publisher's note: Copernicus Publications remains neutral with regard to jurisdictional claims in published maps and institutional affiliations.
This article is part of the special issue “Shipping and the Environment – From Regional to Global Perspectives (ACP/OS inter-journal SI)”. It is a result of the Shipping and the Environment – From Regional to Global Perspectives, Gothenburg, Sweden, 23–24 October 2017.
This work is part of the BONUS SHEBA (Sustainable Shipping and Environment of the Baltic Sea region) research project (Call 2014-41). BONUS (Art 185) is funded jointly by the EU and the national governments of the participating partner countries.
The national funds were provided by the German Federal Ministry of Education and Research (grant no. 03F0720A for Volker Matthias and Matthias Karl), and the Swedish Environmental Protection Agency (for Sara Jutterström, Filip Moldan and Jana Moldanová). The Swedish Environmental Protection Agency provided also funds through Sjöfartens utsläpp och kritisk belastning (project no. NV-07751-17). The work on the paper (by Sara Jutterström, Filip Moldan and Jana Moldanová) was also supported by the project platform CSHIPP, which received funding from a subsidy contract (grant no. C006) of the Interreg Baltic Sea Region. Maximilian Posch received support through the Trust Fund for the effect-oriented activities under the CLRTAP.
This paper was edited by Andreas Petzold and reviewed by two anonymous referees.
Amann, M., Borken-Kleefeld, J., Cofala, J., Hettelingh, J.-P., Heyes, C., Höglund-Isaksson, L., Holland, M., Kiesewetter, G., Klimont, Z., Rafaj, P., Posch, M., Sander, R., Schöpp, W., Wagner, F., and Winiwarter, W.: The Final Policy Scenarios of the EU Clean Air Policy Package, TSAP Report #11, International Institute for Applied Systems Analysis, Laxenburg, Austria, 2014.
Baltic LINes: Shipping in the Baltic Sea – Past, present and future developments relevant for Maritime Spatial Planning. Project Report I, 35 pp., available at: https://vasab.org/wp-content/uploads/2018/06/Baltic-LINes-Shipping_Report-20122016.pdf (last access: October 2019), 2016.
Bieser, J., Aulinger, A., Matthias, V., Quante, M., and Builtjes, P.: SMOKE for Europe – adaptation, modification and evaluation of a comprehensive emission model for Europe, Geosci. Model Dev., 4, 47–68, https://doi.org/10.5194/gmd-4-47-2011, 2011.
Bobbink, R. and Hettelingh, J.-P. (Eds.): Review and revision of empirical critical loads and dose response relationships, Proceedings of an international expert workshop, Noordwijkerhout, 23–25 June 2010, RIVM-Report 680359002, Bilthoven, the Netherlands, 243 pp., https://doi.org/10.21945/RIVM-680359002, 2011.
Bobbink, R., Hicks, K., Galloway, J., Spranger, T., Alkemade, R., Ashmore, M., Bustamante, M., Cinderby, S., Davidson, E., Dentener, F., Emmett, B., Erisman, J., Fenn, M., Gilliam, F., Nordin, A., Pardo, L., and de Vries, W.: Global assessment of nitrogen deposition effects on terrestrial plant diversity: a synthesis, Ecol. Appl., 20, 30–59, 2010.
Byun, D. and Schere, K.: Review of the Governing Equations, Computational Algorithms, and Other Components of the Models-3 Community Multiscale Air Quality (CMAQ) Modeling System, Appl. Mech. Rev., 59, 51–77, 2006.
Corbett, J. J., Fischbeck, P. S., and Pandis, S. N.: Global nitrogen and sulphur inventories for oceangoing ships, J. Geophys. Res., 104, 3457–3470, 1999.
Dee, D. P., Uppala, S. M., Simmons, A. J., Berrisford, P., Poli, P., Kobayashi, S., Andrae, U., Balmaseda, M. A., Balsamo, G., Bauer, P., Bechtold, P., Beljaars, A. C. M., van de Berg, L., Bidlot, J., Bormann, N., Delsol, C., Dragani, R., Fuentes, M., Geer, A. J., Haimberger, L., Healy, S. B., Hersbach, H., Hólm, E. V., Isaksen, L., Kållberg, P., Köhler, M., Matricardi, M., McNally, A. P., Monge-Sanz, B. M., Morcrette, J.-J., Park, B.-K., Peubey, C., de Rosnay, P., Tavolato, C., Thépaut, J.-N., and Vitart, F.: The ERA-Interim reanalysis: configuration and performance of the data assimilation system, Q. J. Roy. Meteor. Soc., 137, 553–597, https://doi.org/10.1002/qj.828, 2011.
De Wit, H. A., Hettelingh, J.-P., and Harmens, H. (Eds): Trends in ecosystem and health responses to long-range transported atmospheric pollutants, NIVA-Report 6946-2015 (ICP-Waters Report 125, revised), Norwegian Institute for Water Research, Oslo, Norway, 92 pp., available at: https://www.niva.no (last access: 20 September 2021), 2015.
EEA: Effects of air pollution on European ecosystems, EEA Technical Report 11/2014, European Environment Agency, Copenhagen, Denmark, 38 pp., https://doi.org/10.2800/18365, 2014.
EEA: European Union emission inventory report 1990–2016, under the UNECE Convention on Long-range Transboundary Air Pollution (LRTAP), EEA Report No. 6/2018, European Environ. Agency, 150 pp., https://doi.org/10.2800/571876, 2018.
Engardt, M., Simpson, D., Schwikowski, M., and Granat, L.: Deposition of sulphur and nitrogen in Europe 1900–2050, Model calculations and comparison to historical observations, Tellus B, 69, 1328945, https://doi.org/10.1080/16000889.2017.1328945, 2017.
Eyring, V., Köhler, H. W., van Aardenne, J., and Lauer, A.: Emissions from international shipping: 1. The last 50 years, J. Geophys. Res., 110, D17305, https://doi.org/10.1029/2004JD005619, 2005.
Faber, J., Hanayama, S., Zhang, S., Pereda, P., Comer, B., Hauerhof, E., Schim van der Loeff, W., Smith, T., Zhang, Y., Kosaka, H., Adachi, M., Bonello, J., Galbraith, C., Gong, Z., Hirata, K., Hummels, D., Kleijn, A., Lee, D., Liu, Y., Lucchesi, A., Mao, X., Muraoka, E., Osipova, L., Qian, H., Rutherford, D., Suárez de la Fuente, S., Yuan, H., Velandia Perico, C., Wu, L., Sun, D., Yoo, D., and Xing, H.: The Fourth IMO GHG Study, London, UK, 2020.
Grennfelt, P., Engleryd, A., Forsius, M., Hov, Ø., Rodhe, H., and Cowling, E.: Acid rain and air pollution: 50 years of progress in environmental science and policy, Ambio, 49, 849–864, https://doi.org/10.1007/s13280-019-01244-4, 2020.
Hettelingh, J.-P., Posch, M., and Slootweg, J. (Eds.): European critical loads: database, biodiversity and ecosystems at risk: CCE Final Report 2017, RIVM Report 2017-0155, Bilthoven, the Netherlands, 204 pp., https://doi.org/10.21945/RIVM-2017-0155, 2017.
Jalkanen, J.-P.: Emissions from Baltic Sea shipping in 2006–2019, HELCOM Maritime 20/5-2.INF, 5-2 Emissions from Baltic Sea shipping in 2006–2019.pdf, available at: https://helcom.fi (last access: 19 August 2021), 2020.
Jalkanen, J.-P., Brink, A., Kalli, J., Pettersson, H., Kukkonen, J., and Stipa, T.: A modelling system for the exhaust emissions of marine traffic and its application in the Baltic Sea area, Atmos. Chem. Phys., 9, 9209–9223, https://doi.org/10.5194/acp-9-9209-2009, 2009.
Jalkanen, J.-P., Johansson, L., Kukkonen, J., Brink, A., Kalli, J., and Stipa, T.: Extension of an assessment model of ship traffic exhaust emissions for particulate matter and carbon monoxide, Atmos. Chem. Phys., 12, 2641–2659, https://doi.org/10.5194/acp-12-2641-2012, 2012.
Johansson, L., Jalkanen, J.-P., Kalli, J., and Kukkonen, J.: The evolution of shipping emissions and the costs of regulation changes in the northern EU area, Atmos. Chem. Phys., 13, 11375–11389, https://doi.org/10.5194/acp-13-11375-2013, 2013.
Jonson, J. E., Jalkanen, J. P., Johansson, L., Gauss, M., and Denier van der Gon, H. A. C.: Model calculations of the effects of present and future emissions of air pollutants from shipping in the Baltic Sea and the North Sea, Atmos. Chem. Phys., 15, 783–798, https://doi.org/10.5194/acp-15-783-2015, 2015.
Jonson, J. E., Gauss, M., Jalkanen, J.-P., and Johansson, L.: Effects of strengthening the Baltic Sea ECA regulations, Atmos. Chem. Phys., 19, 13469–13487, https://doi.org/10.5194/acp-19-13469-2019, 2019.
Jonson, J. E., Gauss, M., Schulz, M., Jalkanen, J.-P., and Fagerli, H.: Effects of global ship emissions on European air pollution levels, Atmos. Chem. Phys., 20, 11399–11422, https://doi.org/10.5194/acp-20-11399-2020, 2020.
Kalli, J., Jalkanen, J.-P., Johansson, L., and Repka, S.: Atmospheric emissions of European SECA shipping: long term projections, WMU J. Marit. Affairs, 12, 129–145, https://doi.org/10.1007/s13437-013-0050-9, 2013.
Karl, M., Bieser, J., Geyer, B., Matthias, V., Jalkanen, J.-P., Johansson, L., and Fridell, E.: Impact of a nitrogen emission control area (NECA) on the future air quality and nitrogen deposition to seawater in the Baltic Sea region, Atmos. Chem. Phys., 19, 1721–1752, https://doi.org/10.5194/acp-19-1721-2019, 2019a.
Karl, M., Jonson, J. E., Uppstu, A., Aulinger, A., Prank, M., Sofiev, M., Jalkanen, J.-P., Johansson, L., Quante, M., and Matthias, V.: Effects of ship emissions on air quality in the Baltic Sea region simulated with three different chemistry transport models, Atmos. Chem. Phys., 19, 7019–7053, https://doi.org/10.5194/acp-19-7019-2019, 2019b.
Mellqvist, J., Beecken, J., Conde, V., and Ekholm, J.: Surveillance of sulphur emissions from ships in Danish waters. Report to the Danish Environmental Protection Agency, Chalmers University of Technology, Gothenburg, https://doi.org/10.17196/DEPA.001, 2017.
Nilsson, J. and Grennfelt, P. (Eds.): Critical loads for sulphur and nitrogen. Environmental Report 1988:16 (Nord 1988:98), Nordic Council of Ministers, Copenhagen, 31 pp., 1988.
Parsmo, R., Yaramenka, K., Winnes, H., and Fridell, E.: NOx Abatement in the Baltic Sea; An Evaluation of Different Policy Instruments, IVL report C247, IVL Swedish Environmental Research Institute, available at: https://www.ivl.se/download/18.34244ba71728fcb3f3fa33/1591705756100/C247.pdf (last assess: 19 March 2021), 2017.
Posch, M., Hettelingh, J.-P., and De Smet, P. A. M.: Characterization of critical load exceedances in Europe, Water Air Soil Pollut., 130, 1139–1144, https://doi.org/10.1023/A:1013987924607, 2001.
Posch, M., De Vries, W., and Sverdrup, H. U.: Mass balance models to derive critical loads of nitrogen and acidity for terrestrial and aquatic ecosystems, Chapter 6, in: Critical Loads and Dynamic Risk Assessments: Nitrogen, Acidity and Metals in Terrestrial and Aquatic Ecosystems, edited by: De Vries, W., Hettelingh, J.-P., and Posch, M., Environmental Pollution Series, Springer, Dordrecht, 25, 171–205, https://doi.org/10.1007/978-94-017-9508-1_6, 2015.
Reis, S., Grennfelt, P., Klimont, Z., Amann, M., ApSimon, H., Hettelingh, J.-P., Holland, M.,Le Gall, A.-C., Maas, R., Posch, M., Spranger, T., Sutton, M. A., and Williams, M.: From acid rain to climate change, Science, 338, 1153–1154, https://doi.org/10.1126/science.1226514, 2012.
Repka, S., Erkkilä-Välimäki, A., Jonson, J. E., Posch, M., Törrönen, J., and Jalkanen, J. P.: Assessing the costs and environmental benefits of IMO regulations of ship-originated SOx and NOx emissions in the Baltic Sea, Ambio, 50, 1718–1730, https://doi.org/10.1007/s13280-021-01500-6, 2021.
Rockel, B., Will, A., and Hense, A.: The Regional Climate Model COSMO-CLM (CCLM), Meteorol. Z., 17, 347–348, 2008.
Slootweg .J, Posch, M., Hettelingh, J.-P., and Mathijssen, L. (Eds.): Modelling and Mapping impacts of atmospheric deposition on plant species diversity in Europe: CCE Status Report 2014. RIVM Report 2014-0075, Coordination Centre for Effects, Bilthoven, the Netherlands, 160 pp., https://doi.org/10.21945/RIVM-2014-0075, 2014.
Sofiev, M., Vira, J., Kouznetsov, R., Prank, M., Soares, J., and Genikhovich, E.: Construction of the SILAM Eulerian atmospheric dispersion model based on the advection algorithm of Michael Galperin, Geosci. Model Dev., 8, 3497–3522, https://doi.org/10.5194/gmd-8-3497-2015, 2015.
Sofiev, M., Winebrake, J. J., Johansson, L., Carr, E. W., Prank, M., Soares, J., Vira, J., Kouznetsov R., Jalkanen, J.-P., and Corbett, J. J.: Cleaner fuels for ships provide public health benefits with climate tradeoffs, Nat. Commun., 9, 406, https://doi.org/10.1038/s41467-017-02774-9, 2018.
UNECE: Manual on methodologies and criteria for modelling and mapping critical loads and levels, and air pollution effects, risks and trends, UNECE Convention on Long-range Transboundary Air Pollution, available at: http://www.icpmapping.org (last access: 7 October 2021), 2004.