the Creative Commons Attribution 4.0 License.
the Creative Commons Attribution 4.0 License.
 | 19 Oct 2021
Technical note: Pyrolysis principles explain time-resolved organic aerosol release from biomass burning
Mariam Fawaz
Anita Avery
Timothy B. Onasch
Leah R. Williams
Emission of organic aerosol (OA) from wood combustion is not well constrained; understanding the governing factors of OA emissions would aid in explaining the reported variability. Pyrolysis of the wood during combustion is the process that produces and releases OA precursors. We performed controlled pyrolysis experiments at representative combustion conditions. The conditions changed were the temperature, wood length, wood moisture content, and wood type. The mass loss of the wood, the particle concentrations, and light-gas concentrations were measured continuously. The experiments were repeatable as shown by a single experiment, performed nine times, in which the real-time particle concentration varied by a maximum of 20 %. Higher temperatures increased the mass loss rate and the released concentration of gases and particles. Large wood size had a lower yield of particles than the small size because of higher mass transfer resistance. Reactions outside the wood became important between 500 and 600 ∘C. Elevated moisture content reduced product formation because heat received was shared between pyrolysis reactions and moisture evaporation. The thermophysical properties, especially the thermal diffusivity, of wood controlled the difference in the mass loss rate and emission among seven wood types. This work demonstrates that OA emission from wood pyrolysis is a deterministic process that depends on transport phenomena.
- Article
(2267 KB) - Full-text XML
-
Supplement
(10939 KB) - BibTeX
- EndNote


The emission of organic aerosol (OA) particles from open biomass and biofuel burning contributes 93 % of the global atmospheric primary organic aerosol emissions (POA), with 19 % from biofuel burning for residential energy consumption (Bond et al., 2004). OA emission factors from biofuel burning are used in emission inventories (Denier van der Gon et al., 2015; Wu et al., 2019; Morino et al., 2018; Cao et al., 2006), regional and global air quality models (Lane et al., 2007; Yu et al., 2004; Wang et al., 2018; Tsimpidi et al., 2017; Theodoritsi and Pandis, 2019), and exposure studies for health impacts (Tuet et al., 2019; Hystad et al., 2019; Carter et al., 2017; Okello et al., 2018).
Emission of OA from biomass is observed to be variable and chaotic, making the determination of definite emission factors difficult (Nielsen et al., 2017; Shrivastava et al., 2006; Jolleys et al., 2014). To explain measurement variability, the emission behavior has been related to combustion parameters. The most used parameters are heat flux (Haslett et al., 2018; Eriksson et al., 2014); wood type (Weimer et al., 2008; McDonald et al., 2000), whether softwood or hardwood (Schmidl et al., 2008; Iinuma et al., 2007); moisture content (van Zyl et al., 2019); and combustion phase, whether flaming or smoldering (Yokelson et al., 1997; McKenzie et al., 1995; Amaral et al., 2014). The most prevalent characterization factor in emission studies is the modified combustion efficiency (MCE) (Ward and Hao, 1991); others, such as the fire radiative energy (FRE) (Freeborn et al., 2008; Ichoku and Kaufman, 2005) and inferred pyrolysis temperature (Sekimoto et al., 2018), have also been used. Previous emission studies have alluded to the role of pyrolysis in the emission of organic aerosols (Yokelson et al., 1996; Sekimoto et al., 2018); however, there has not yet been a comprehensive attempt to understand how emission occurs and how governing factors at the point of origin affect the types and amounts of particles and gases. We suggest that the study should start at the source of emission.
When wood is heated, the first response is thermal degradation, known as pyrolysis. Pyrolysis reactions form products in the solid phase (char) (Shafizadeh, 1982), in the gas phase as permanent gases (e.g., CO, CO2, and hydrocarbons) and as condensable products (CPs) that have high molecular weight (Evans and Milne, 1987). The latter are known as tar in pyrolysis literature, and these products overlap with condensed organic aerosol. Owing to the pressure gradient between the formation site and the surface, both gas and CPs (Diebold, 1994; Suuberg et al., 1996) can be ejected from the wood (Staggs, 2003). Before release, CPs can be broken down to form gaseous material (Pattanotai et al., 2013) due to secondary pyrolysis reactions within the wood. After release and in the absence of oxidation reactions associated with combustion, the CPs may condense to become particles (Zhang et al., 2013), or they may crack at high temperature to form permanent gases (Boroson et al., 1989b; Morf et al., 2002) due to secondary reactions outside the wood. After ignition, gas-phase oxidation reactions can consume CPs to form permanent gases that will not condense at any relevant temperature, such as CO and CO2. CPs may also polymerize at high temperatures to form soot (Atiku et al., 2017; Fitzpatrick et al., 2009). All of these processes reduce the yield of OA. The exothermic reactions that occur outside or at the surface of the wood, often called flaming and smoldering, provide energy for the pyrolysis of unreacted wood and production of OA precursors.
Considering the processes that control emission can lead to a greater understanding of the connection between OA emission and the nature of the fuel and the combustion process. A systematic sequence of investigation would evaluate several processes: (a) the control of solid-phase processes, or pyrolysis, on the emission of CPs and gases and the potential of CPs to become OA; (b) the alteration of OA emission caused by the gas-phase processes oxidation (including flaming), polymerization, and secondary pyrolysis; and (c) the feedback energy the solid-phase processes receive from the heat release from gas-phase oxidation reactions.
Much of the work in pyrolysis literature aims to describe industrial applications such as bio-oil production and energy generation from biomass. “Thermally-thin” applications employ pulverized wood for which heat transfer to the center occurs nearly instantly (Wagenaar et al., 1993; Di Blasi and Branca, 2001; Janse et al., 2000). Product yield from thermally-thin wood is measured either as lumped groups of tar, char, and gases (Di Blasi et al., 2001; Grønli and Melaaen, 2000) or speciated measurements of gaseous molecules and tar molecules using FTIR or GC–MS (Anca-Couce et al., 2017; Corbetta et al., 2014; Dufour et al., 2007). These studies can provide final yields for industrial applications, product types, and kinetic parameters for modeling thermally-thick pyrolysis.
In thermally thick pyrolysis, heat transfer in and mass transfer out of the wood matrix are important limiting factors. This type of pyrolysis is less often explored because of its limited relevance to industrial processes, although decomposition rates of thermally thick wood have been examined, because they affect fire safety (Tran and White, 1992; Lee et al., 1977). Samples investigated are commonly 1–3 cm, with cylindrical and spherical shapes (Remacha et al., 2018; Bennadji et al., 2013; Di Blasi et al., 2001; Ding et al., 2018b; Gauthier et al., 2013). Differences in time-dependent mass loss and in overall product yield occur over a range of wood sizes, shapes, and temperature or heat flux to which they are exposed. Throughout these works, larger sizes and non-rounded shapes have not been investigated to ascertain whether known pyrolysis principles are sufficient to explain behavior in real-world applications. Furthermore, time-dependent release occurs because of heat and mass transfer rates within the wood matrix. A few of the studies referenced above reported time-resolved escape of light gases, but none have measured time-resolved emission of condensable products, so there is little evidence to indicate whether the product division changes as the pyrolysis front penetrates into the wood. Any such shifts could affect both ignition timing and emission characteristics.
The name pyrolytic organic matter (PyOM) is introduced here as the name of particles that are directly emitted from pyrolysis in the absence of oxidation reactions inside and outside the wood. In literature, common names of organic aerosol particles from biomass burning include biomass burning organic aerosol (BBOA), brown carbon (BrC), primary organic aerosol (POA), and secondary organic aerosol (SOA), but these products are not exactly like pyrolysis particles in their properties or emission behavior. BBOA contains oxidation products from combustion and atmospheric oxidation reactions (Huffman et al., 2009). BrC is defined based on the optical properties of OA (Andreae and Gelencsér, 2006). POA and SOA from biomass burning come from all combustion processes, fresh (May et al., 2013) or aged (Capes et al., 2008), and sampled at the source or in the atmosphere (Cubison et al., 2011).
In this work we developed an approach that relates the emission measurements from wood pyrolysis with the processes responsible for the emissions in the wood. This approach was accomplished by coupling our previously developed pyrolysis model (Fawaz et al., 2020) with emission measurements. The objective of the work presented here is to determine the extent to which released PyOM is governed by transport phenomena within the wood during pyrolysis. This is achieved by selecting and varying the important factors that influence heat, mass, and momentum transfer in pyrolysis: thermal boundary conditions, wood size, moisture content, and wood type. Chemical characterization of emitted PyOM was also made and will be discussed in future work.
This section describes the experiments performed to measure the change in the mass of the wood and the release of gas and particles during controlled pyrolysis. The details of the pyrolysis model used in the analysis of the experimental results were published in Fawaz et al. (2020).
2.1 Sampling setup
Figure 1 is a schematic of the experiment. The pyrolysis reactor was described in detail in previous work (Fawaz et al., 2020) and is briefly reviewed here. The reactor was made of a 2.6 kW cylindrical heater (height 20.3 cm and diameter 15.2 cm) connected to a proportional–integral–derivative (PID) temperature controller. A thermocouple bonded to the wall of the reactor at height 13.5 cm provided feedback to the controller, and a thermocouple at 6.7 cm monitored the temperature of the reactor. The top of the reactor was covered with a movable layer of fire bricks to prevent heat losses during the experiment. Heat was delivered to the sides of the wood through radiative heat transfer from the walls of the reactor. Nitrogen gas flowed through the reactor to maintain oxygen-deficient conditions, and a precision scale (Sartorius ENTRIS 6202I) measured the wood mass change.

Smoke emitted from the reactor cooled during the primary dilution stage in the fume hood and was pulled into a duct at a speed of 7 m s−1. Gases were sampled directly from the duct, and the particles were measured after undergoing a secondary dilution stage in a probe. The secondary dilution probe was 1 m in length and had two concentric tubes (o.d. = 0.75 in., i.d. = 0.5 in.); the internal tube was made of a porous metal with a 20 µm pore size. The sample flow entered the inner tube, and the dilution flow entered the outer tube. The flow of air from the outer tube to the inner tube formed a barrier to reduce the loss of particles to the walls of the probe. Compressed HEPA and activated carbon filtered air was provided to the dilution probe. The secondary dilution ratio was the ratio of the dilution flow of air to the sample flow from the duct. Air and vacuum flows were monitored by two low-pressure drop mass flow meters (Alicat, MW-100SPLM/175SPLM), and the sample flow was measured directly using a bubble flow meter before and after each experiment. The secondary dilution ratio across experiments ranged between 150 and 200 (Table S1 in the Supplement). Particle sampling was done near ambient temperature during the experiments. A dark, heavy, sticky, material was released in some experiments, especially at lower temperatures. This material deposited on the cold surfaces of the reactor before reaching the sampling system and could not be collected.
The number size distribution of particles was measured by an engine exhaust particle sizer (TSI, EEPS 3090), the mass was measured by a DustTrak aerosol monitor (TSI, DustTrak 8530), the concentrations of CO and CO2 gas were measured by a analyzer (Horiba, AIA-220), and the total concentration of carbon content in gas-phase hydrocarbons (HCs) was measured by a flame ionization analyzer (Horiba, FIA-236). The gas instruments were calibrated every day with zero and span gas. The electrometers of the EEPS were zeroed every day to check the stability of the instrument.
2.2 Wood sample description
Wood samples of varying type, size, and moisture content were used. Seven types of wood were used: Douglas fir (Pseudotsuga menziesii, kg m−3), two types of pine (Pinus radiata, termed pineR, kg m−3, and Pinus echinata, termed pineE, kg m−3), ipe (Handroanthus, kg m−3), maple (Acer nigrum, kg m−3), birch (Betula papyrifera, kg m−3), and poplar (Liriodendron tulipifera, kg m−3). The end grain and flat grain of each wood type are shown in Fig. S1 in the Supplement. The apparent density of each wood sample was calculated as the ratio of the mass to the volume of the wood sample.
PineR, pineE, and Douglas fir are softwoods and ipe, maple, birch, and poplar are hardwoods. In lumber, the division of softwood and hardwood can be based on botanical or anatomical definitions. Botanically, hardwoods belong to the angiosperm family and softwoods to the gymnosperm family, and anatomically, hardwoods are more porous than softwoods (Bergman et al., 2010). Chemically, the difference between softwood and hardwood is less clear (Di Blasi et al., 2001). The main structural groups of wood are cell wall material, extractives, and ash. Hemicellulose, cellulose, and lignin are the components of cell wall material; volatile sugar and acids are the major components of extractives; and inorganic oxides make up ash (Reed, 2002).
Two size dimensions of wood were used; cm are called in this work “large”, and cm are called “small”. The wood was cut longitudinally with the grain as shown in Fig. S2 in the Supplement. The large wood size was the same order of magnitude as those used in wood cookstoves, and the small size was used to evaluate the effect of the length of the wood on emission. Both wood sizes are considered thermally thick, a condition in which a thermal gradient forms between the surface and the center when the wood is exposed to heat from its surroundings (Pyle and Zaror, 1984).
Two wood moisture contents (MCs) were used for pineR: dry samples at 8±1 % and wet wood at 25±2 %. Dry wood samples used were received as kiln dried wood, and the MC of the samples was between 7 %–9 %. The wood MC was increased by soaking pineR wood samples for 24 h based on the method of Lee and Diehl (1981). The MC of the soaked wood was measured in four internal positions to confirm the permeation of water and a homogeneous distribution of water throughout the wood.
2.3 Experimental design
Two groups of experiments were performed. The first group varied pyrolysis conditions of reactor temperature, wood moisture content, and wood size for two wood types: birch and pineR. PineR is a low-density softwood and birch is a high-density hardwood. These two woods were chosen to evaluate whether the response to changing input conditions depends on wood type. The second group of experiments explored how emissions from pyrolysis change based on the type of the wood. Seven wood types, including birch and PineR, were used in constant temperature experiments at 400, 500, and 600 ∘C. This range was selected because at temperatures less than 400 ∘C, pyrolysis was extremely slow and did not occur at certain conditions, and at temperatures higher than 600 ∘C secondary reactions consumed OA precursors before formation. In combustion conditions, temperatures higher than 600 ∘C are associated with flaming combustion. The conditions of all the experiments used in the analysis are shown in Table S1.
2.4 Reactor operation
The experiments were performed under isothermal conditions; the wall temperature of the reactor was maintained at a set point temperature of either 400, 500, or 600 ∘C. To begin an experiment, the reactor was raised to the set point temperature, after which data collection was initiated, and nitrogen gas purged the reactor for 2 min at 20 L min−1. The wood sample was inserted after the purge period, and this event marked the experiment start time.
After the wood sample was inserted, the reactor was kept partially covered with firebricks to prevent heat loss to the ambient atmosphere. The experiment ended when the residual mass of the solid stopped changing within the uncertainty limit of the mass balance and when the hydrocarbon gas concentration returned to background values measured before the experiment. Each experiment was replicated to determine the uncertainty.
2.5 Analysis
A LabVIEW program collected the thermocouple, mass balance, gas analyzer, and flowmeter data. TSI software packages were used to collect data from the EEPS and DustTrak, and the data streams were synchronized with the signals collected in LabVIEW.
The background concentration of the gases in ambient air was measured before and after the experiment and subtracted from the gas signal during the experiment. We assumed a linear drift in the signal between initial and final measurements. The real-time concentrations were smoothed using a MATLAB moving mean function with an averaging period of 3 s, unless otherwise stated. Product collection was calculated as the total mass of all measured products divided by the initial mass of the wood. The products measured include the final char mass and the total mass of PyOM, CO, CO2, and HCs. The yield or mass fraction of each product is the sum of its real-time measured mass divided by the initial mass of the wood. In the elevated MC experiments, calculated mass fractions are provided on an as-received basis and wet basis, where the as-received mass of the wood was the mass before water absorption and the wet mass was after absorption, respectively.
The EEPS measured the number concentration of the particles from 6–560 nm. A density of 1.3×10³ kg m−3 was used (Hennigan et al., 2011) to convert from number to mass distribution. EEPS data were corrected for counting errors; details of the correction are in Sect. S2 in the Supplement and summarized here. The EEPS underestimates the size of large particles (Dp>100 nm) (Zimmerman et al., 2014), so the method of Lee et al. (2013) was used to correct size distributions by comparing measured concentrations for size-selected ammonium nitrate particles between the EEPS and a long time-of-flight aerosol mass spectrometer (LToF-AMS, Aerodyne Research, Inc.).
Pyrolysis experiments at 400 ∘C released particles with diameters larger than the upper limit of the EEPS measurement range, causing an underestimation in the mass concentration. When the particle sizes exceeded the size range measured by the EEPS, the mass concentration measured by the DustTrak was used for the total mass of the particles. In Sect. S3 in the Supplement, we compare the PyOM concentrations from the EEPS and DustTrak measurements at 400 and 500 ∘C to evaluate the differences between the two instrument outputs and the adequacy of using the DustTrak data at 400 ∘C.
The measured particle concentration was multiplied by the dilution ratio of the secondary dilution stage during the experiment. Thus, the PyOM mass concentrations reported here are those that would be measured in the primary dilution stage, so they are directly comparable to the gas concentrations.
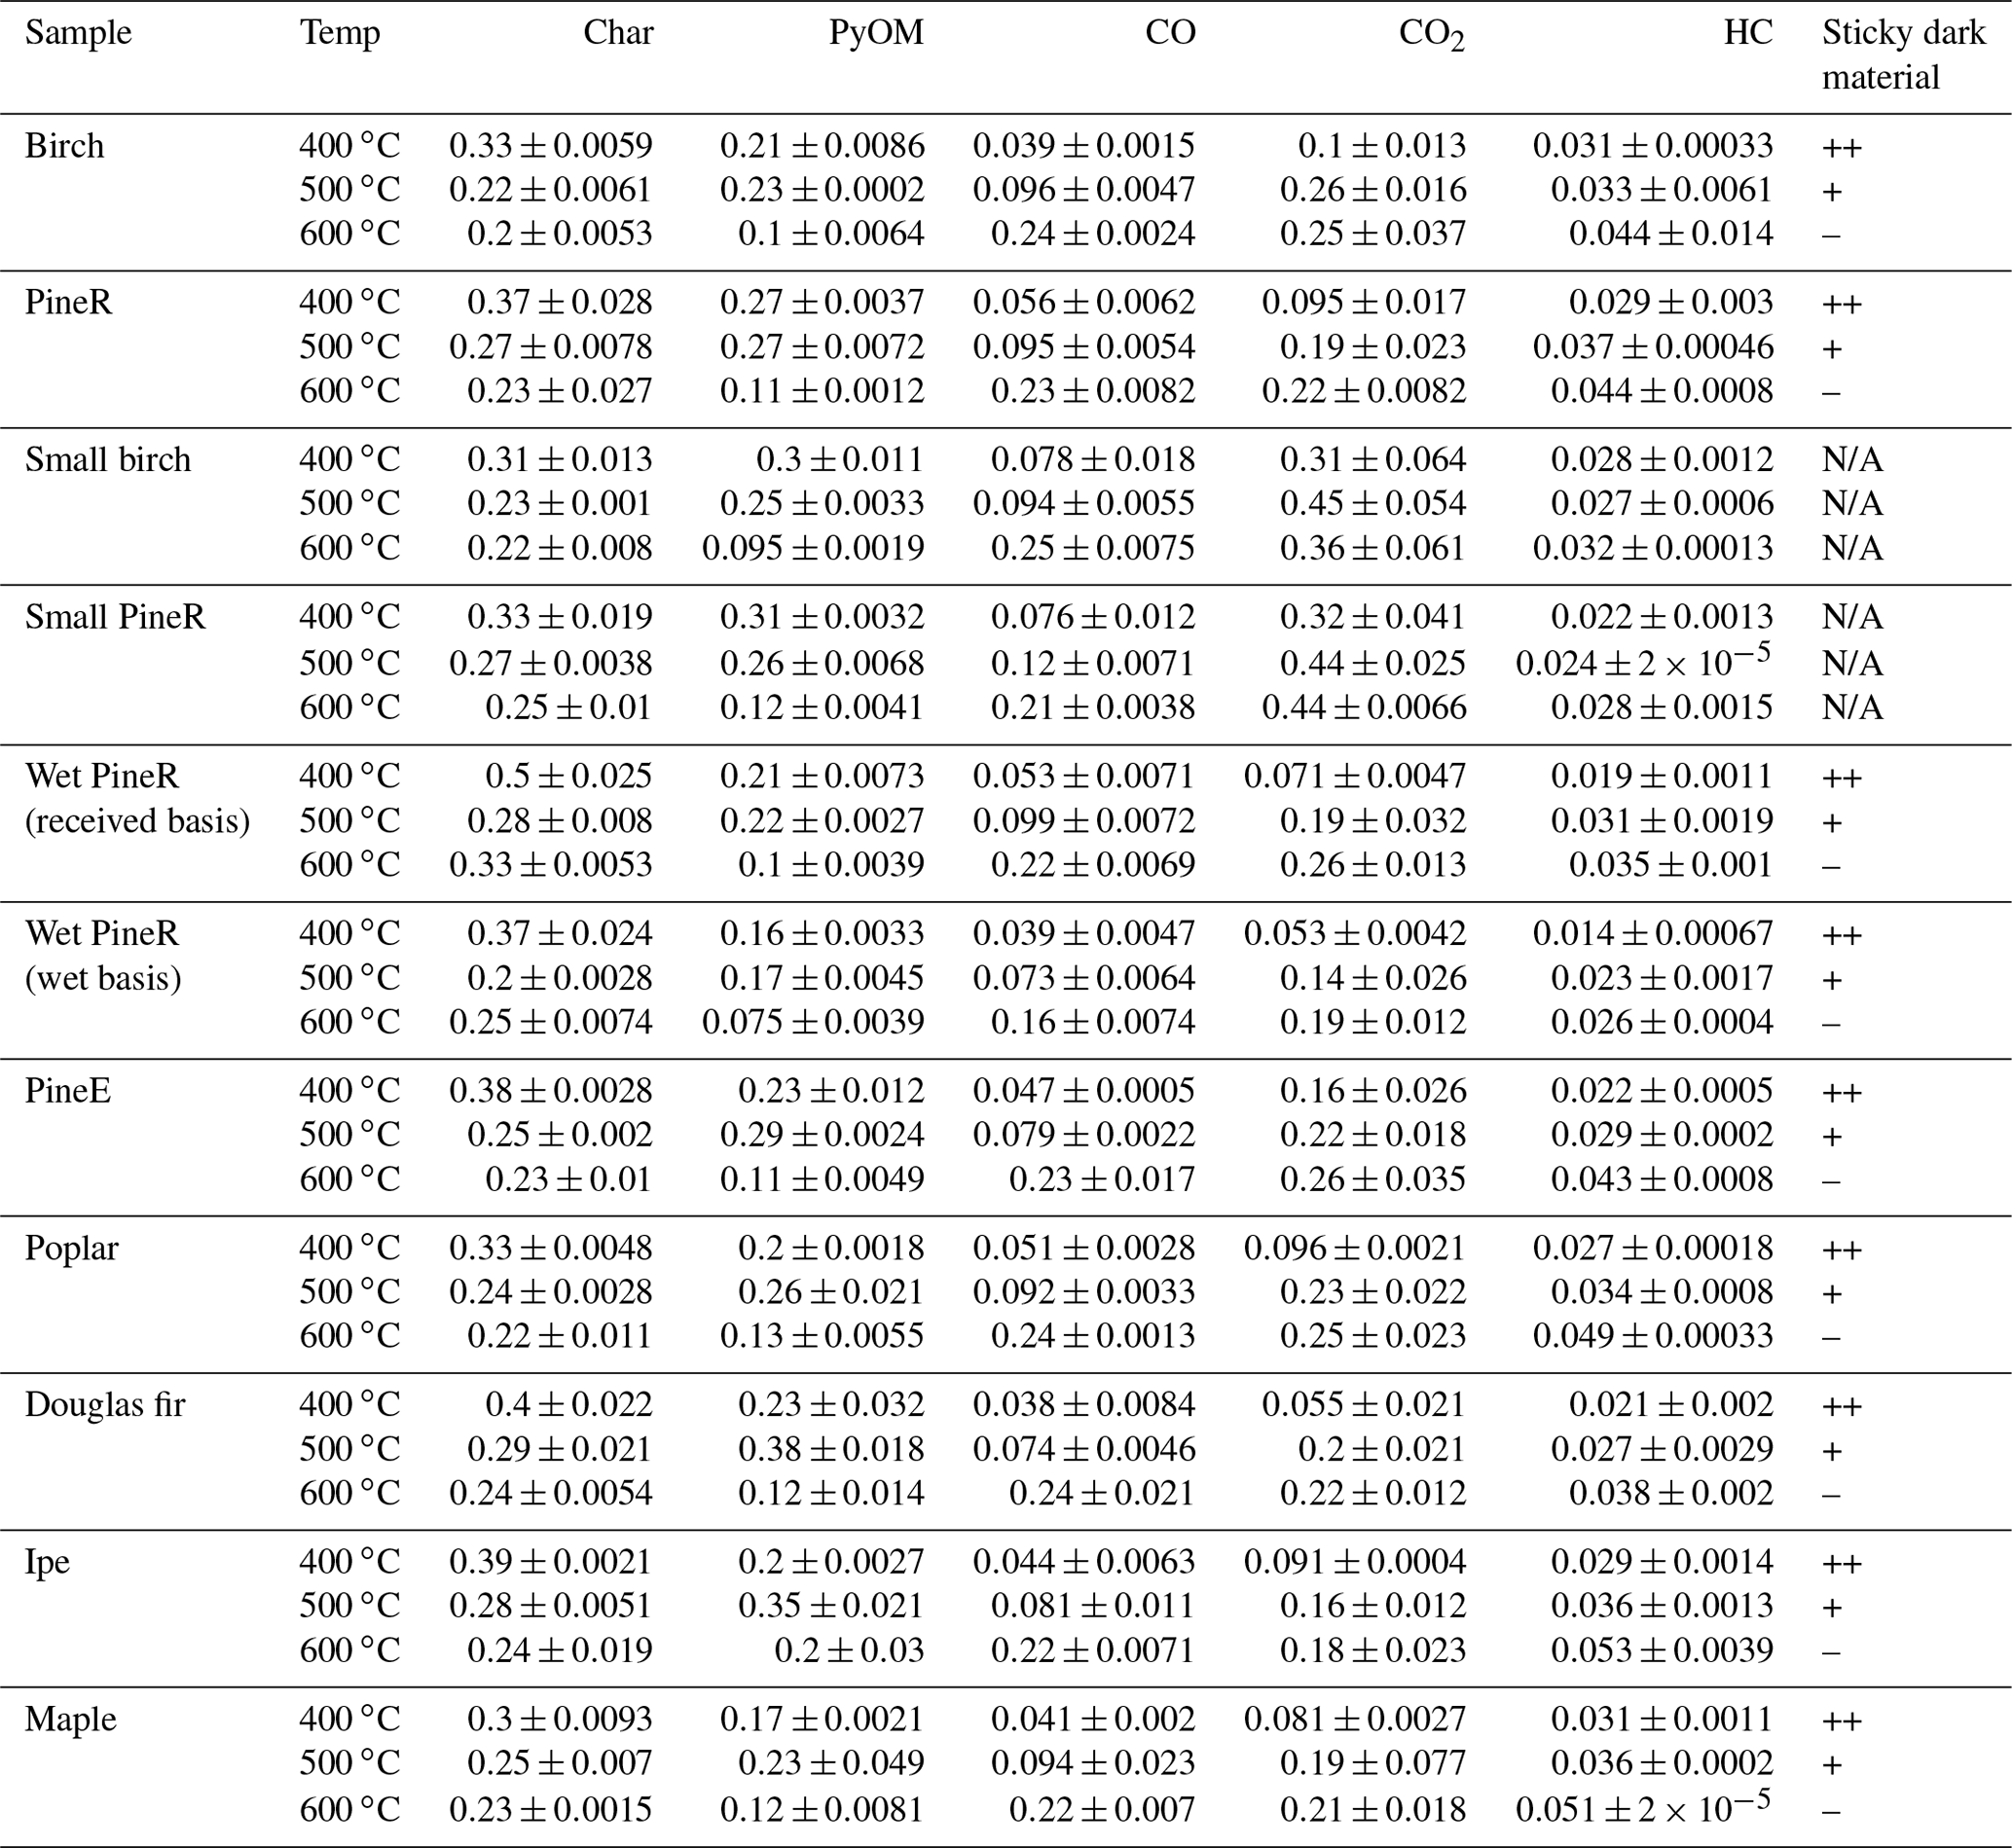
Table 1 shows the yields of all measured products for the two groups of the pyrolysis experiments. The yields of PyOM show that 10 %–30 % of the initial wood mass was emitted as particles, depending on the conditions of the experiment. One test (large birch at 500 ∘C) was repeated nine times, and the average coefficient of variation of the real-time mass concentration of PyOM was 15±3 % (Fig. S21 in the Supplement), indicating that the tests were repeatable. Collected product percentages, excluding water, of all experiments were between 77 % and 90 % of the wood mass. The lower end of the mass closure was observed at 400 ∘C because of the loss of dark heavy sticky material onto the reactor. The assumption of the PyOM density did not have a quantified effect on the PyOM yield and mass closure. The real-time modified combustion efficiency of birch experiments at the three temperatures is shown in Fig. S24 in the Supplement.
Table 1Average yields of measured products for each replicated experimental condition. Wet pineR yields are expressed on a wet basis (the mass of the wood used included the moisture content) and on an as-received basis (the mass of the wood before increasing its moisture). The last column is a semi-quantitative indicator of whether the production of the dark sticky material was detected during the experiment. In the table “–” indicates the lack of production and “+” indicates production, with “++” signifying more production than +. “N/A” indicates that a detection was not possible during those experiments.
3.1 Effect of temperature
Figure 2 shows the real-time mass loss rate and mass concentration of emitted gases and PyOM during pyrolysis of large pineR and birch wood at 400, 500, and 600 ∘C. The time series all have two peaks, although some peaks are more pronounced than others. At each fixed temperature, the mass loss rate, PyOM, and gas concentrations exhibit similar behavior with time but the relative heights of the two peaks differ among temperatures. Figures S22 and S23 in the Supplement plot the mean and standard deviations of the experiments discussed in this section; they show that the observed trends are caused by the wood response to the boundary conditions and are not experimental artifacts.
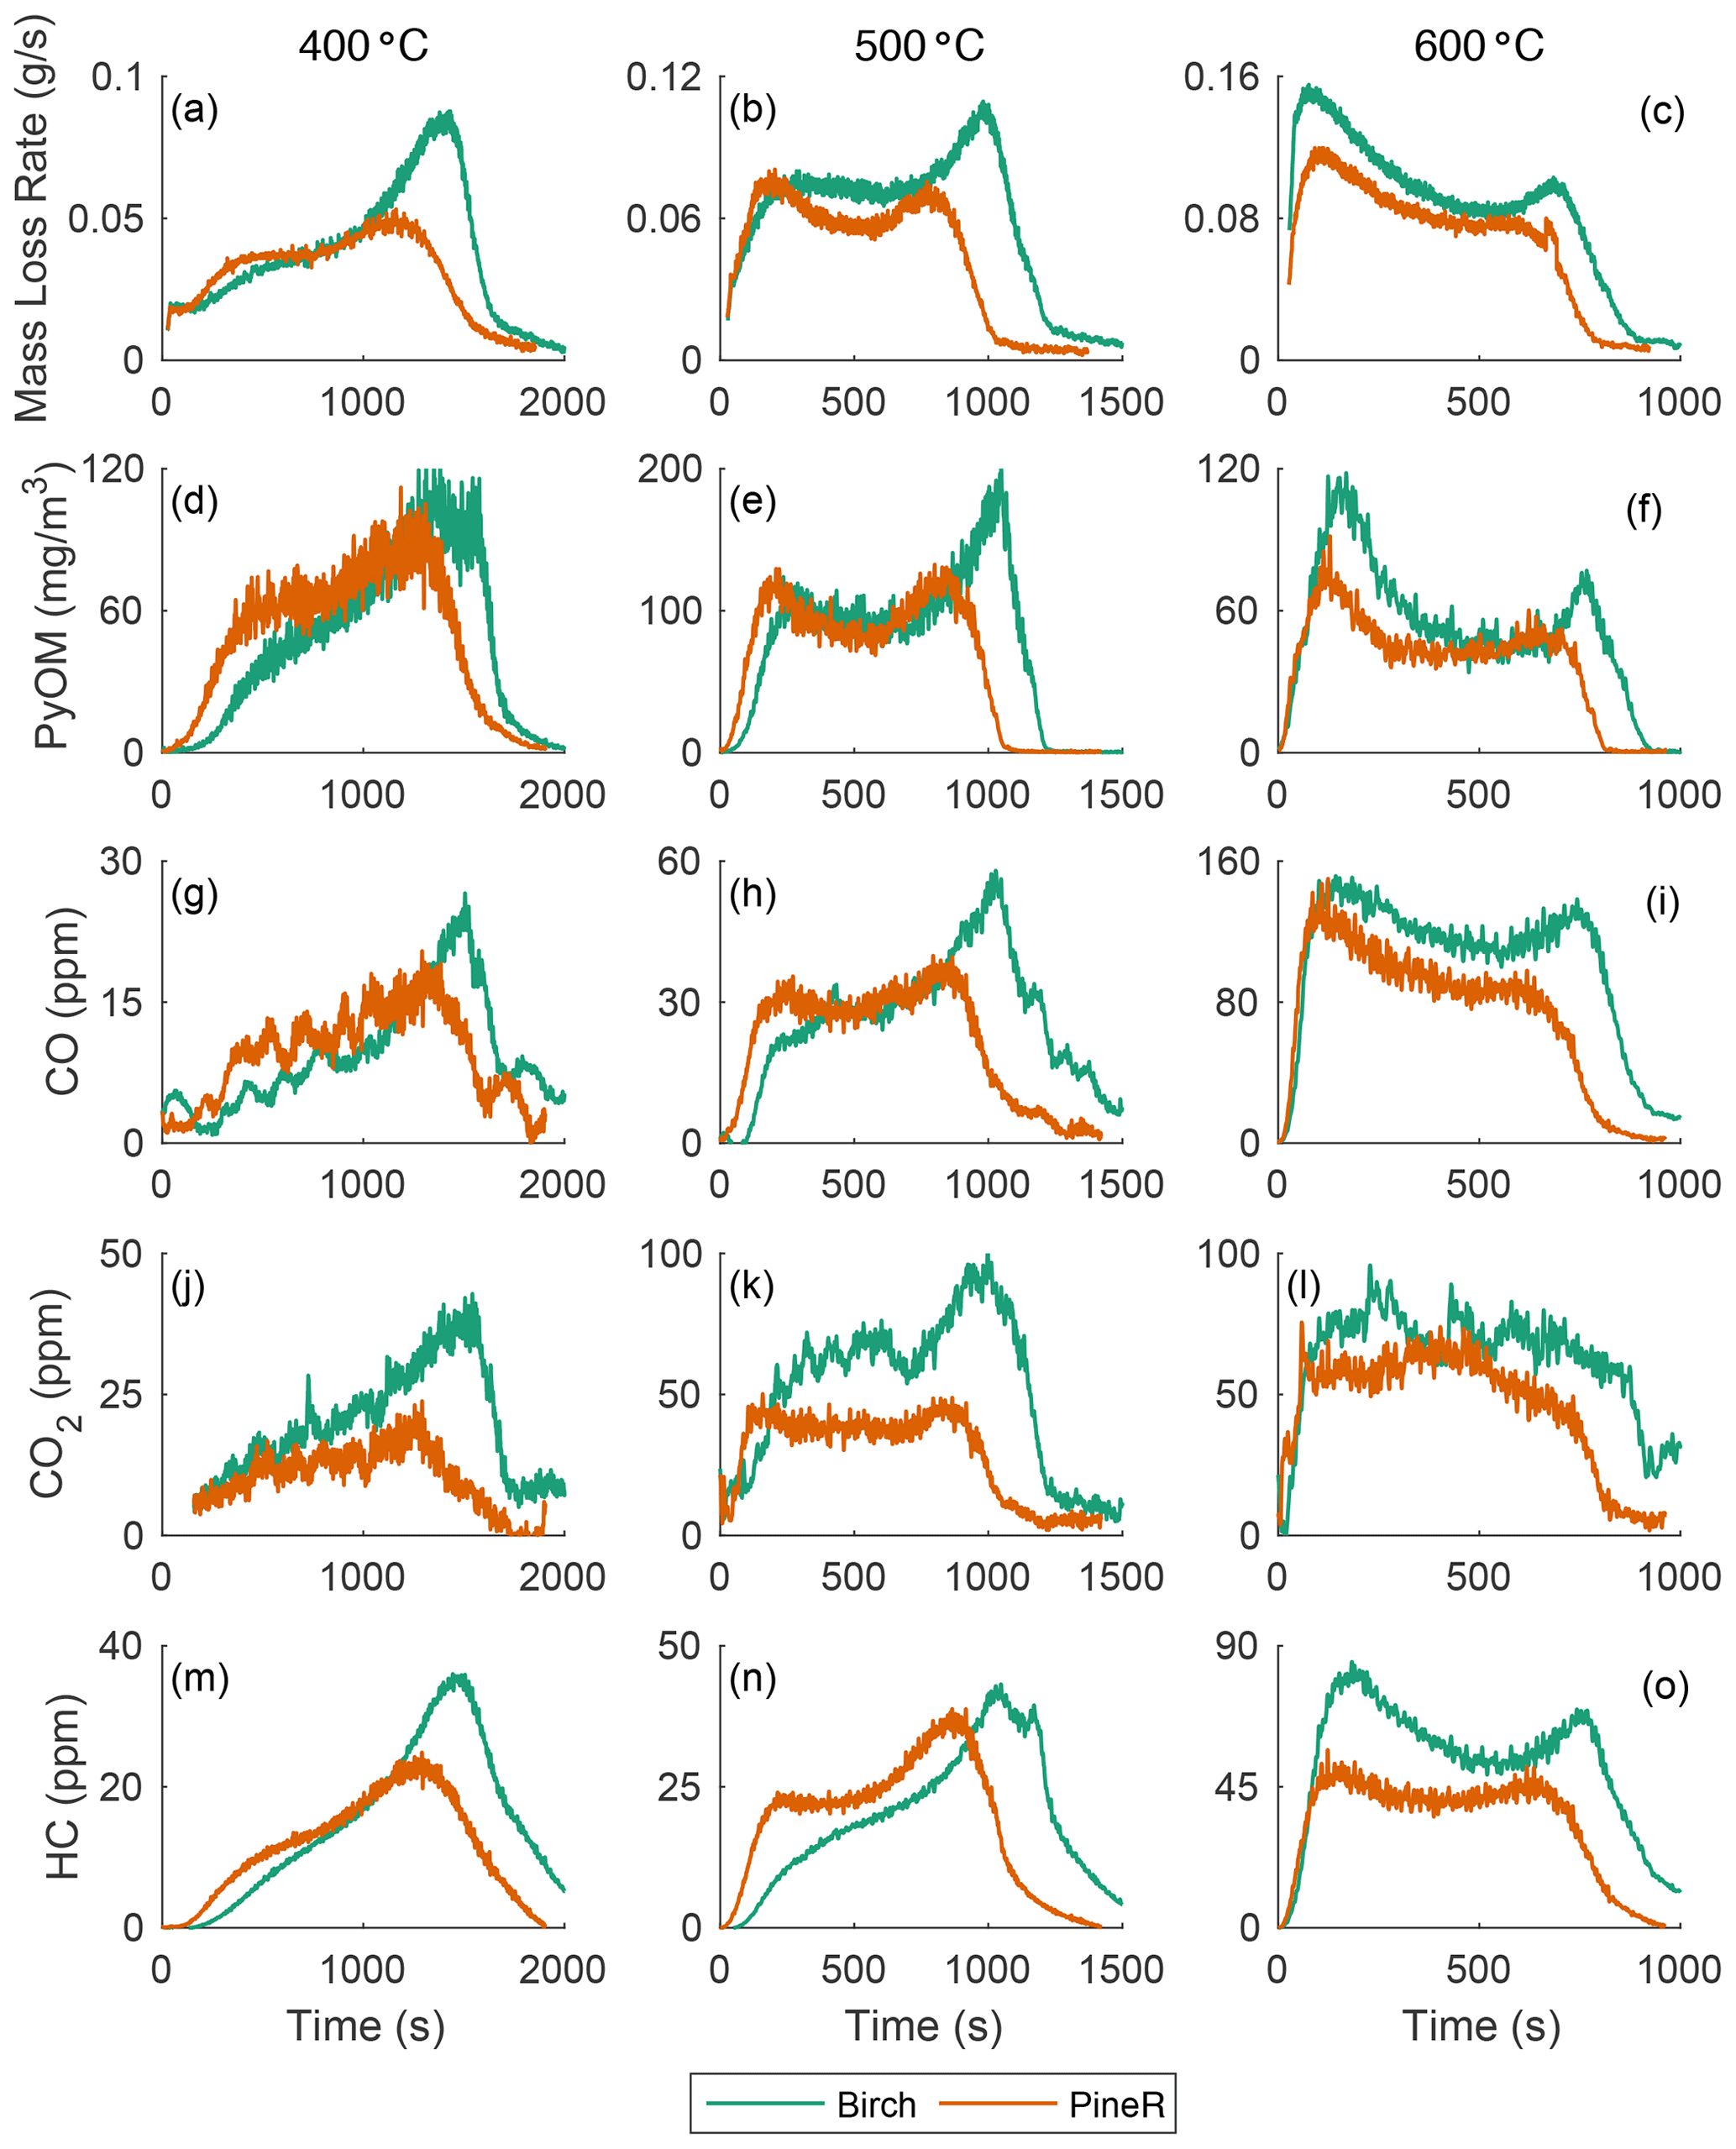
Figure 2The mass loss rate and real-time concentration of particles and gases for birch and pineR at three reactor temperatures. Note the significant changes in the scales from plot to plot. Fluctuations in the CO2 signals are due to noise near the detection limit.
Using a pyrolysis model verified experimentally, Fawaz et al. (2020) showed that the real-time mass loss rate from thermally thick wood could be predicted and that internal and external heat transfer govern the thermochemical degradation that produces the gases and PyOM precursors. That work, and other pyrolysis literature of thermally thick wood (Di Blasi et al., 2000; Ding et al., 2018a), shows that the two distinct peaks of mass loss rate that appear in Fig. 2a–c can be explained by the reactor temperature and thermal diffusivity of a given wood type at a fixed size. Modeling results of the mass loss rate of birch and pineR at 400, 500, and 600 ∘C are shown in Sect. S4.3 in the Supplement. The model also shows that the heating rate at the surface ranged between 4–10 for birch wood and 0–1 for the wood center, among the three reactor temperatures (Figs. S31–S36 in the Supplement).
The heat the wood receives at the surface initiates reactions and is conducted towards the center of the wood. The surface layers of the wood gain temperature rapidly, reacting and losing mass to form the first peak in emissions. When these layers are depleted the declining portion of the first peak forms. Each location inside the wood receives heat conducted from the surface and transfers heat toward the wood center. As pyrolysis progresses, the outer layers of the wood become char, which has a lower thermal conductivity than wood. This thermal resistance barrier slows the travel of the elevated temperature zone, creating the portion of the mass-loss curve that appears as a saddle at 500 and 600 ∘C. The rate of mass loss declines when most of the material has reacted in the heated section, and when unreacted wood is not heated rapidly enough to maintain the same level of product formation. This principle explains the sharp second peak, which occurs when the thermal wave reaches the center. The earlier peak times and shorter overall pyrolysis duration of pineR compared to birch at all temperatures is due to the lower density and greater thermal diffusivity of pineR compared to birch. The higher the thermal diffusivity, the faster the heat transfer rate from the surface to the center, making pyrolysis reactions in pineR faster than birch. Birch has a larger overall mass loss; the higher density of birch compared to pineR means there is more mass to react and form products. Mass loss as a function of time and temperature is repeatable (Fig. S21), because it is governed by the relative rates of heat transfer, temperature increase, and char formation within the wood.
At all temperatures, the real-time mass concentration of PyOM (Fig. 2d–f) had similar real-time features to the mass loss rate. The concentrations of CO, CO2, and HC (Fig. 2g–o) are also similar in behavior. For example, the slope of the first peak increases with temperature for all measured products. Relative peak heights and the nature of the saddle between peaks changed with wood size and temperature in nearly the same way for mass loss rate, PyOM, and gases. The relative magnitude of PyOM and gases is relatively constant, regardless of the wood type and temperature, suggesting that the product emission throughout the entire pyrolysis process is similar. Concentrations of CO and CO2 at 400 ∘C are noisy because they are near the instrumental detection limit.
Emissions of gases and PyOM increase as a function of increasing temperature, except for PyOM at 600 ∘C (Fig. 2f) for which the PyOM was lower than at 400 and 500 ∘C. At and above this temperature, secondary pyrolysis reactions (known as tar cracking reactions in pyrolysis literature) break down CPs and transform them to CO and CO2 (Morf et al., 2002) and increase CO yields compared to CO2 and other gases (Nunn et al., 1985). These reactions are likely the cause of the reduced PyOM yield at 600 ∘C and the more than doubling in CO concentration from 500 to 600 ∘C. At temperatures lower than 600 ∘C, the collected PyOM yield is the maximum particle yield from pyrolysis.
3.2 Wood size
At smaller wood sizes, heat transfer into the center takes less time, and pyrolysis and product release are completed more rapidly (Figs. S37 and S38 in the Supplement). If no reactions occur after pyrolysis, equivalent product yields would be expected from small and large wood. Transport through the porous char matrix after pyrolysis depends on the permeability of the material, the travel distance between the gas production site and the surface, as well as the pressure difference between the production site and the surface. If the precursors are not able to exit the wood freely, large and small wood might have different yields.
At 400 ∘C, transport resistance inside the wood appears to reduce PyOM emission from larger wood, as the yield of PyOM for small birch and small pineR was higher than that for large wood (40 % difference for birch and 15 % difference for pineR). Yields of PyOM are shown in Table 1 and summarized graphically in Figs. S39 and S40 in the Supplement. These differences are not attributable to reactions outside the wood, where the residence time at elevated temperature was kept constant. Neither are they likely to be caused by product degradation within the wood (Boroson et al., 1989a, b). The influence of wood size in birch, along with a higher density that is associated with lower total porosity (Plötze and Niemz, 2011), caused a greater inhibition of mass release compared to pineR.
Increased temperature generates gases more quickly, creating a greater pressure gradient and reducing the likelihood of mass transfer resistance. At 500 ∘C, there was no difference in PyOM yields between large and small wood for pineR. However, at 500 ∘C, mass transfer resistance still reduced the PyOM yield between large and small wood for the higher-density birch. There was no difference in yield between wood sizes for either type at 600 ∘C.
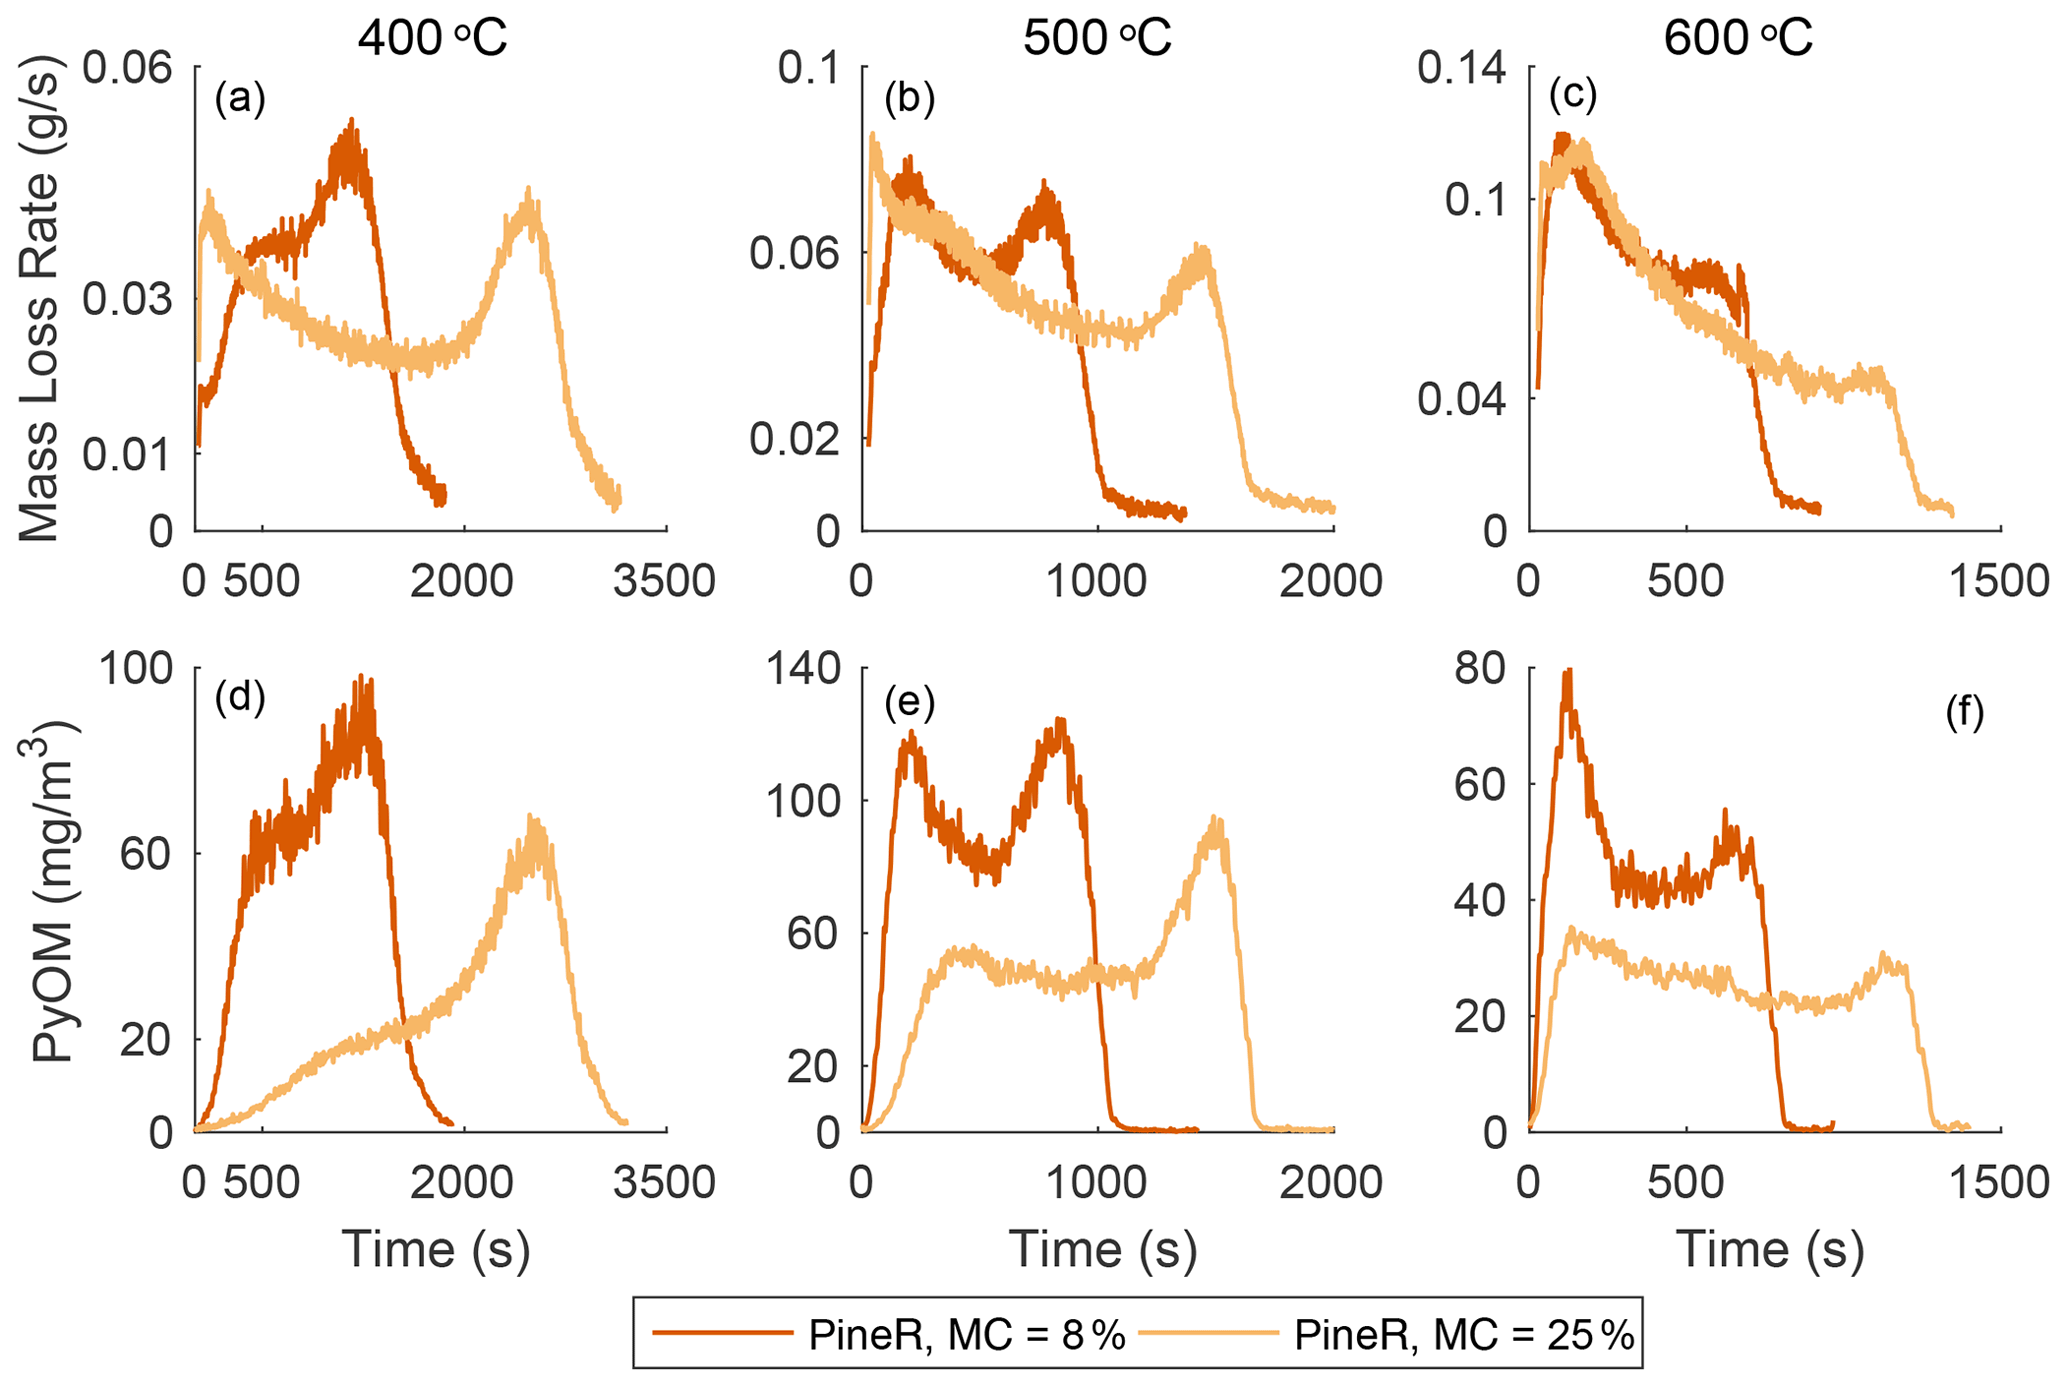
Figure 3(a–c) Comparison between real-time mass loss rates and (d–f) mass concentration of PyOM at low and high MCs for PineR wood samples.
3.3 Moisture content
When free water evaporates from the wood matrix, less energy is available for thermochemical degradation and product release (Fatehi and Bai, 2014), and the rates of these processes are reduced. Figure 3 shows that the mass loss rate and real-time mass concentration of PyOM for pineR at MC = 8 % (dry) and at MC = 25 % (wet) have some similar features, such as the dual peaks and change in mass loss rate magnitude with reactor temperature. Many of the differences, including the time required to complete the reaction, can be explained by the energy consumed by evaporation.
Compared with dry wood, initial mass loss from wet wood was equal or faster due to rapid evaporation of water at the surface. Evaporation occurs at 100 ∘C and pyrolysis reaction rates become significant at temperatures higher than 280 ∘C (Broido, 1976). The first peak results from the balance between radiative heat flux at the surface and the formation of char and is most affected by the change in relative rates. At 400 and 500 ∘C, heat transfer into the wood is slow enough that evaporation at 100 ∘C occurs before pyrolysis reactions at the surface, and the first peak of PyOM emission is reduced to a broad shoulder appeared instead. At 600 ∘C, heat transfer is rapid, and both pyrolysis and evaporation occur simultaneously at the surface. After the initial peak, continuous internal heat transfer in the wood sustains pyrolysis and product formation, and there is little difference between the second peak height in the dry and wet cases.
The sharing of energy between water evaporation and pyrolysis shifts product yields towards char (Beaumont and Schwob, 1984; Peters and Bruch, 2003; Di Blasi et al., 2000) and reduces the reaction temperature. The effect of reaction temperature on yield reduction is evident in the change in yield between 400 and 500 ∘C where more char, less gases, and less PyOM were produced at the lower temperature. Further, the yield of PyOM from pyrolysis of wet pineR on an as-received basis was lower than that of pineR at MC = 8 % at the same reactor temperature (Table 1).
Published findings show conflicting effects of moisture content on particle emission yields. Some observe that higher moisture content increases OA emission (May et al., 2014; van Zyl et al., 2019; Magnone et al., 2016), while others find a reduction in OA emission with moisture content (Huangfu et al., 2014). Wood moisture has competing effects on emission. Wet wood has a higher ignition delay and a higher critical heat flux for ignition (Simms and Law, 1967), prolonging pyrolysis and CP emission that occur in the absence of oxidation processes. As shown here, the rate of condensable product formation itself may be diminished, and that could reduce the rate of oxidation reactions after ignition (Price-Allison et al., 2019).
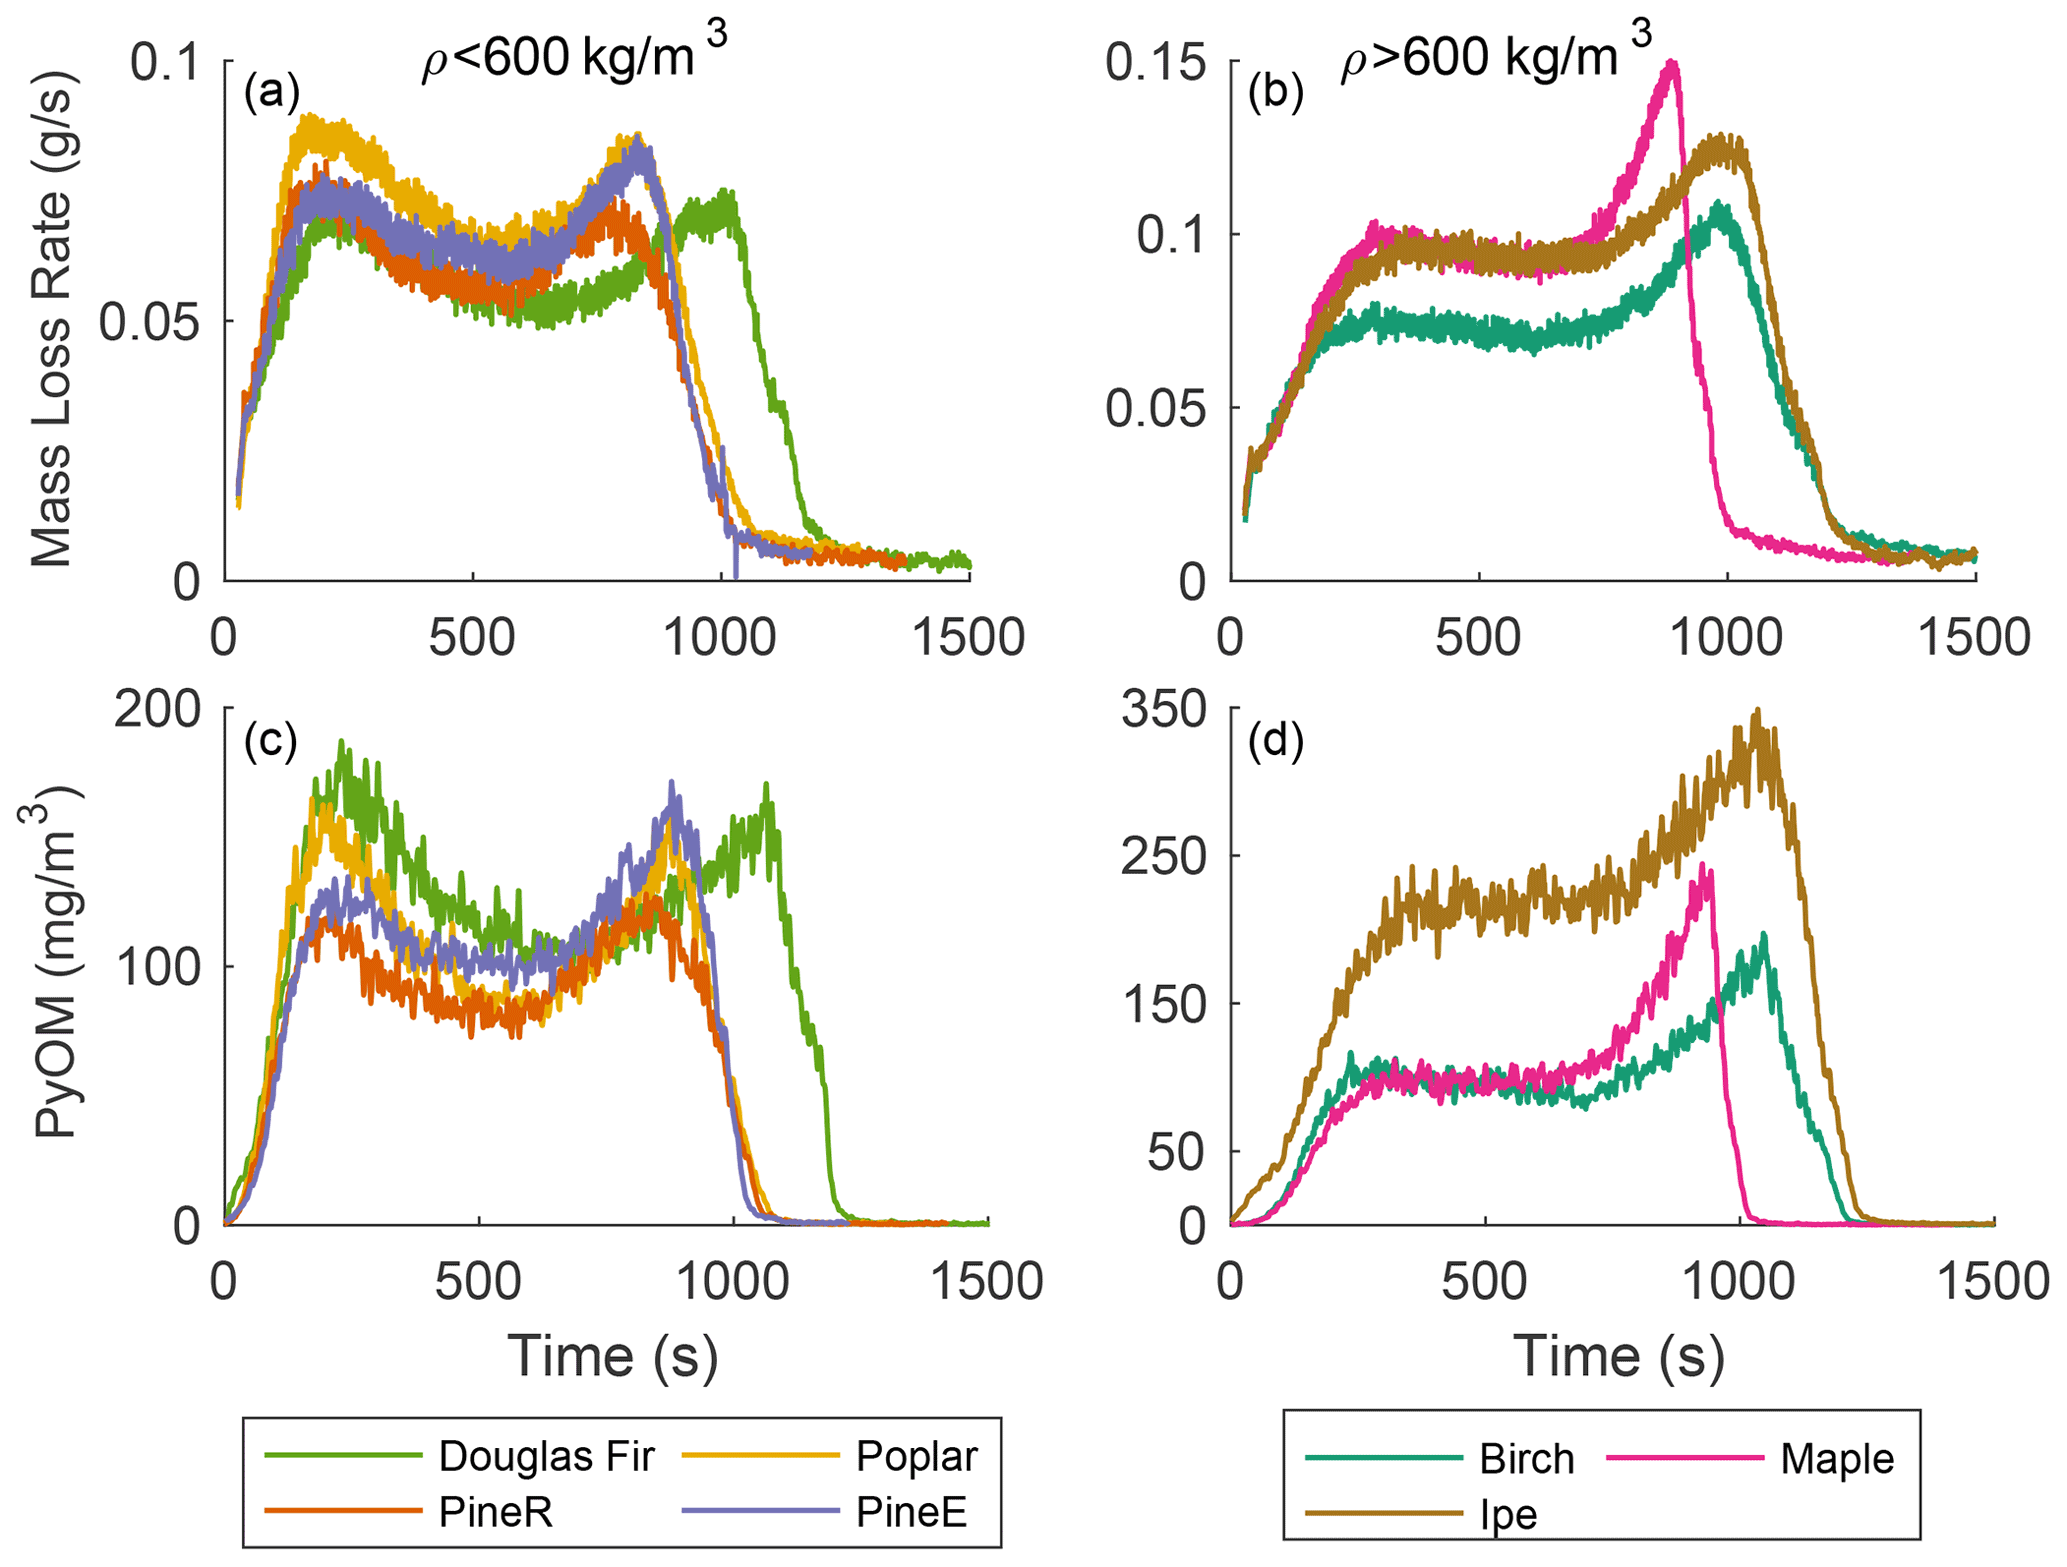
Figure 4(a, c) Mass loss rate and real-time mass concentration of PyOM for low-density wood (ρ<600 kg m−3) and (b, d) high-density wood (ρ>600 kg m−3) at a reactor temperature of 500 ∘C.
3.4 Wood type
Seven types of wood were used in pyrolysis experiments at each reactor temperature. Thermal properties of dry wood depend on density (MacLean, 1941), so we present results grouped by density, although there may be other causes of differences. Figure 4a and c show mass loss rate and the real-time mass concentration of PyOM from woods with densities below 600 kg m−3, and Fig. 4b and d show the same quantities for woods with densities above 600 kg m−3. The reactor temperature 500 ∘C is shown because it is least sensitive to mass transfer resistance (low-temperature effect) and secondary reactions (high-temperature effect), as discussed previously. For each wood, regardless of density, its real-time PyOM mass concentration and mass loss rate share the same features in terms of pyrolysis duration, peak shape, and relative peak heights.
Low-density wood types include softwoods (pineE, pineR, and Douglas fir) and one hardwood (poplar). These wood types had similar behavior, except for Douglas fir with a 20 % longer pyrolysis duration. The peak heights in the mass loss rate and real-time mass concentration are within 25 % of each other, showing that for this group the pyrolysis behavior is similar.
The high-density wood types include birch, maple, and ipe, all hardwoods. The mass loss rate of the wood types in this group had different pyrolysis durations and ratios between the first and second peak compared to the low-density wood, with a shorter first peak and a larger second peak at the end. The higher second peak, a repeatable feature for high-density wood, is caused by the availability of more unreacted wood mass internally than in low-density wood. Ipe emitted more particles than birch and maple and had a higher yield even though the magnitude of the mass loss rates were comparable among the three wood types. This work's thermochemical approach does not offer the reason behind the high particle emission for ipe compared to other woods and remains an open question.
In pyrolysis studies, wood type effect has been distinguished in thermally thin wood based on the fractions of cellulose, hemicellulose, and lignin (Grønli et al., 2002). Di Blasi et al. (2001) found that the mass loss rate behavior for thermally thick wood can be related to the chemical makeup at low heat flux, and at higher heat fluxes the mass loss rate was explained by transport phenomena. When heat transfer controls pyrolysis and burning, the difference in the mass loss rate of the wood can be explained using the thermal diffusivity of the wood (Spearpoint and Quintiere, 2001). As demonstrated in this work and modeled (Fawaz et al., 2020), the mass loss rate change as a function of wood type and heat flux can be explained by the heat transfer in the wood. Section S4.3 shows that the mass loss rate of birch and pineR can be predicted by the same global kinetics using Gpyro (Lautenberger and Fernandez-Pello, 2009). No studies have investigated the role of the chemical makeup of the wood in the pyrolysis of thermally thick wood. The difference in real-time emissions among each group of wood (low- and high-density wood groups) can be attributed to the differences in wood composition.
Measurements of emission factors to represent open biomass burning have often been reported for individual wood types (Stockwell et al., 2014; Chen et al., 2007). Tabulations for use in atmospheric models have been grouped by ecosystem type (Akagi et al., 2011; Andreae, 2019), sometimes separating by flaming and smoldering (Koppmann et al., 2005). Measurements of wood burning in fireplaces and domestic stoves have provided in-depth chemical composition of gas and particulate emission for different wood species (McDonald et al., 2000; Schauer et al., 2001; Vicente and Alves, 2018). However, these studies could not attribute variations of measured emission yields to wood type (Gonçalves et al., 2011; Ozgen et al., 2014). Temperatures and heating rates in these studies were not reported.
We have shown that differences in yields of particles and gases could be explained by reactor temperature, moisture content, and wood size, and the difference in real-time emission among wood types can be explained by the difference in the physical properties of the wood. Varying PyOM and gas emissions from different vegetation types, as widely reported in literature, are likely attributable to these factors rather than to differences among wood species.
The results of the developed approach reported here show that time-dependent emission of particles and gases from pyrolysis is a repeatable and deterministic process. Coupled with model findings, we found that the real-time mass loss rate can be explained by heat and mass transfer processes, and in turn, real-time emission of particles and gases follows the mass loss rate.
The conditions of pyrolysis influence the product yield and the real-time concentrations. We reported here the effect of the heating conditions, wood size, moisture content, and wood type on product emission. Comparative yields of particles and gases can be explained by thermochemical principles that are well known in pyrolysis literature. Increasing temperatures increase mass loss rates and increase the concentration of emitted particles between 400 and 500 ∘C. At 600 ∘C the particle concentration decreased, likely due to gas-phase secondary reactions outside the wood. Increasing wood size decreased the yield of particles at the lowest temperature due to mass transfer resistance. Increasing moisture content reduced the yield and real-time concentration of particles and gases when drying reactions consumed some of the energy that the wood received for pyrolysis. The mass loss rate of different wood types showed differences between low-density (ρ<600 kg m−3) and high-density wood (ρ>600 kg m−3).
We have demonstrated that the first step in biomass emission – release of particles and gases from pyrolysis – is predictable and repeatable. The principles demonstrated here have not previously been exploited to guide understanding of biomass burning emissions to the atmosphere. Quantifying relevant physical factors, such as temperature, wood size, and thermal diffusivity of the wood matrix, would likely reduce the unexplained variation in reported biomass emission rates. A more predictive understanding would require investigation of the remaining steps in the process, including gas-phase oxidation and feedback from exothermic gas-phase reactions to the solid phase.
The data presented in this manuscript can be found in “Manuscript Figure Data”, https://doi.org/10.5281/zenodo.5562674 (Fawaz, 2021).
The supplement related to this article is available online at: https://doi.org/10.5194/acp-21-15605-2021-supplement.
MF developed the methodology, collected the data, and performed the formal analysis. AA collected the AMS data. MF and TCB wrote the original draft. All authors reviewed the draft.
The contact author has declared that neither they nor their co-authors have any competing interests.
Publisher's note: Copernicus Publications remains neutral with regard to jurisdictional claims in published maps and institutional affiliations.
The authors would like to thank Indoor Climate Research and Training for hosting the experiments.
This research has been supported by the Division of Atmospheric and Geospace Sciences (grant no. AGS-1742956).
This paper was edited by James Allan and reviewed by András Gelencsér and one anonymous referee.
Akagi, S. K., Yokelson, R. J., Wiedinmyer, C., Alvarado, M. J., Reid, J. S., Karl, T., Crounse, J. D., and Wennberg, P. O.: Emission factors for open and domestic biomass burning for use in atmospheric models, Atmos. Chem. Phys., 11, 4039–4072, https://doi.org/10.5194/acp-11-4039-2011, 2011. a
Amaral, S. S., De Carvalho Jr., J. A., Costa, M. A. M., Neto, T. G. S., Dellani, R., and Leite, L. H. S.: Comparative study for hardwood and softwood forest biomass: Chemical characterization, combustion phases and gas and particulate matter emissions, Bioresource Technol., 164, 55–63, https://doi.org/10.1016/j.biortech.2014.04.060, 2014. a
Anca-Couce, A., Sommersacher, P., and Scharler, R.: Online experiments and modelling with a detailed reaction scheme of single particle biomass pyrolysis, J. Anal. Appl. Pyrol., 127, 411–425, 2017. a
Andreae, M. O.: Emission of trace gases and aerosols from biomass burning – an updated assessment, Atmos. Chem. Phys., 19, 8523–8546, https://doi.org/10.5194/acp-19-8523-2019, 2019. a
Andreae, M. O. and Gelencsér, A.: Black carbon or brown carbon? The nature of light-absorbing carbonaceous aerosols, Atmos. Chem. Phys., 6, 3131–3148, https://doi.org/10.5194/acp-6-3131-2006, 2006. a
Atiku, F. A., Lea-Langton, A. R., Bartle, K. D., Jones, J. M., Williams, A., Burns, I., and Humphries, G.: Some Aspects of the Mechanism of Formation of Smoke from the Combustion of Wood, Energ. Fuel., 31, 1935–1944, https://doi.org/10.1021/acs.energyfuels.6b02639, 2017. a
Beaumont, O. and Schwob, Y.: Influence of physical and chemical parameters on wood pyrolysis, Ind. Eng. Chem. Proc. DD., 23, 637–641, https://doi.org/10.1021/i200027a002, 1984. a
Bennadji, H., Smith, K., Shabangu, S., and Fisher, E. M.: Low-temperature pyrolysis of woody biomass in the thermally thick regime, Energ. Fuel., 27, 1453–1459, 2013. a
Bergman, R., Cai, Z., Carll, C. G., Clausen, C. A., Dietenberger, M. A., Falk, R. H., Frihart, C. R., Glass, S. V., Hunt, C. G., Ibach, R. E., Kretschmann, D. E., Rammer, D. R., and Ross, R. J.: Wood Handbook, Wood as an Engineering Material, Forest Products Laboratory, Department of Agriculture, Madison, available at: https://www.fpl.fs.fed.us/products/publications/several_pubs.php?grouping_id=100&header_id=p (last access: 27 April 2020), 2010. a
Bond, T., Streets, D., Yarber, K., Nelson, S., Woo, J.-H., and Klimont, Z.: A technology-based global inventory of black and organic carbon emissions from combustion, J. Geophys. Res.-Atmos., 109, D14203, https://doi.org/10.1029/2003JD003697, 2004. a
Boroson, M. L., Howard, J. B., Longwell, J. P., and Peters, W. A.: Heterogeneous cracking of wood pyrolysis tars over fresh wood char surfaces, Energ. Fuel., 3, 735–740, https://doi.org/10.1021/ef00018a014, 1989a. a
Boroson, M. L., Howard, J. B., Longwell, J. P., and Peters, W. A.: Product yields and kinetics from the vapor phase cracking of wood pyrolysis tars, AICHE J., 35, 120–128, https://doi.org/10.1002/aic.690350113, 1989b. a, b
Broido, A.: Kinetics of solid-phase cellulose pyrolysis, in: Symposium on Thermal Uses and Properties of Carbohydrates and Lignins, San Francisco, Calif., USA, 1976, 172nd National Meeting of the American Chemical Society, Academic Press, 1976. a
Cao, G., Zhang, X., and Zheng, F.: Inventory of black carbon and organic carbon emissions from China, Atmos. Environ., 40, 6516–6527, https://doi.org/10.1016/j.atmosenv.2006.05.070, 2006. a
Capes, G., Johnson, B., McFiggans, G., Williams, P. I., Haywood, J., and Coe, H.: Aging of biomass burning aerosols over West Africa: Aircraft measurements of chemical composition, microphysical properties, and emission ratios, J. Geophys. Res.-Atmos., 113, D00C15, https://doi.org/10.1029/2008JD009845, 2008. a
Carter, E., Norris, C., Dionisio, K. L., Balakrishnan, K., Checkley, W., Clark, M. L., Ghosh, S., Jack, D. W., Kinney, P. L., Marshall, J. D., Naeher, L. P., Peel, J. L., Sambandam, S., Schauer, J. J., Smith, K. R., Wylie, B. J., and Baumgartner, J.: Assessing exposure to household air pollution: A systematic review and pooled analysis of carbon monoxide as a surrogate measure of particulate matter, Environ. Health Persp., 125, 076002, https://doi.org/10.1289/EHP767, 2017. a
Chen, L.-W. A., Moosmüller, H., Arnott, W. P., Chow, J. C., Watson, J. G., Susott, R. A., Babbitt, R. E., Wold, C. E., Lincoln, E. N., and Hao, W. M.: Emissions from laboratory combustion of wildland fuels: Emission factors and source profiles, Environ. Sci. Technol., 41, 4317–4325, 2007. a
Corbetta, M., Frassoldati, A., Bennadji, H., Smith, K., Serapiglia, M. J., Gauthier, G., Melkior, T., Ranzi, E., and Fisher, E. M.: Pyrolysis of centimeter-scale woody biomass particles: kinetic modeling and experimental validation, Energ. Fuel., 28, 3884–3898, 2014. a
Cubison, M. J., Ortega, A. M., Hayes, P. L., Farmer, D. K., Day, D., Lechner, M. J., Brune, W. H., Apel, E., Diskin, G. S., Fisher, J. A., Fuelberg, H. E., Hecobian, A., Knapp, D. J., Mikoviny, T., Riemer, D., Sachse, G. W., Sessions, W., Weber, R. J., Weinheimer, A. J., Wisthaler, A., and Jimenez, J. L.: Effects of aging on organic aerosol from open biomass burning smoke in aircraft and laboratory studies, Atmos. Chem. Phys., 11, 12049–12064, https://doi.org/10.5194/acp-11-12049-2011, 2011. a
Denier van der Gon, H. A. C., Bergström, R., Fountoukis, C., Johansson, C., Pandis, S. N., Simpson, D., and Visschedijk, A. J. H.: Particulate emissions from residential wood combustion in Europe – revised estimates and an evaluation, Atmos. Chem. Phys., 15, 6503–6519, https://doi.org/10.5194/acp-15-6503-2015, 2015. a
Di Blasi, C. and Branca, C.: Kinetics of primary product formation from wood pyrolysis, Ind. Eng. Chem. Res., 40, 5547–5556, 2001. a
Di Blasi, C., Hernandez, E. G., and Santoro, A.: Radiative Pyrolysis of Single Moist Wood Particles, Ind. Eng. Chem. Res., 39, 873–882, https://doi.org/10.1021/ie990720i, 2000. a, b
Di Blasi, C., Branca, C., Santoro, A., and Hernandez, E.: Pyrolytic behavior and products of some wood varieties, Combust. Flame, 124, 165–177, https://doi.org/10.1016/S0010-2180(00)00191-7, 2001. a, b, c, d
Diebold, J. P.: A unified, global model for the pyrolysis of cellulose, Biomass Bioenerg., 7, 75–85, https://doi.org/10.1016/0961-9534(94)00039-V, 1994. a
Ding, Y., Zhou, R., Wang, C., Lu, K., and Lu, S.: Modeling and analysis of bench-scale pyrolysis of lignocellulosic biomass based on merge thickness, Bioresource Technol., 268, 77–80, https://doi.org/10.1016/J.BIORTECH.2018.07.134, 2018a. a
Ding, Y., Zhou, R., Wang, C., Lu, K., and Lu, S.: Modeling and analysis of bench-scale pyrolysis of lignocellulosic biomass based on merge thickness, Bioresource Technol., 268, 77–80, 2018b. a
Dufour, A., Girods, P., Masson, E., Normand, S., Rogaume, Y., and Zoulalian, A.: Comparison of two methods of measuring wood pyrolysis tar, J. Chromatogr. A, 1164, 240–247, 2007. a
Eriksson, A. C., Nordin, E. Z., Nyström, R., Pettersson, E., Swietlicki, E., Bergvall, C., Westerholm, R., Boman, C., and Pagels, J. H.: Particulate PAH Emissions from Residential Biomass Combustion: Time-Resolved Analysis with Aerosol Mass Spectrometry, Environ. Sci. Technol., 48, 7143–7150, https://doi.org/10.1021/es500486j, 2014. a
Evans, R. J. and Milne, T. A.: Molecular characterization of the pyrolysis of biomass, Energ. Fuel., 1, 123–137, 1987. a
Fatehi, H. and Bai, X. S.: A Comprehensive Mathematical Model for Biomass Combustion, Combust. Sci. Technol., 186, 574–593, 2014. a
Fawaz, M.: mfawaz2/PyEx: Manuscript Figure Data (v1.0), Zenodo [data set], https://doi.org/10.5281/zenodo.5562674, 2021. a
Fawaz, M., Lautenberger, C., and Bond, T. C.: Prediction of organic aerosol precursor emission from the pyrolysis of thermally thick wood, Fuel, 269, 117333, https://doi.org/10.1016/j.fuel.2020.117333, 2020. a, b, c, d, e
Fitzpatrick, E., Bartle, K., Kubacki, M., Jones, J., Pourkashanian, M., Ross, A., Williams, A., and Kubica, K.: The mechanism of the formation of soot and other pollutants during the co-firing of coal and pine wood in a fixed bed combustor, Fuel, 88, 2409–2417, https://doi.org/10.1016/J.FUEL.2009.02.037, 2009. a
Freeborn, P. H., Wooster, M. J., Hao, W. M., Ryan, C. A., Nordgren, B. L., Baker, S. P., and Ichoku, C.: Relationships between energy release, fuel mass loss, and trace gas and aerosol emissions during laboratory biomass fires, J. Geophys. Res.-Atmos., 113, D01301, https://doi.org/10.1029/2007JD008679, 2008. a
Gauthier, G., Melkior, T., Grateau, M., Thiery, S., and Salvador, S.: Pyrolysis of centimetre-scale wood particles: New experimental developments and results, J. Anal. Appl. Pyrol., 104, 521–530, 2013. a
Gonçalves, C., Alves, C., Fernandes, A. P., Monteiro, C., Tarelho, L., Evtyugina, M., and Pio, C.: Organic compounds in PM2.5 emitted from fireplace and woodstove combustion of typical Portuguese wood species, Atmos. Environ., 45, 4533–4545, 2011. a
Grønli, M. G. and Melaaen, M. C.: Mathematical model for wood pyrolysis comparison of experimental measurements with model predictions, Energ. Fuel., 14, 791–800, 2000. a
Grønli, M. G., Várhegyi, G., and Di Blasi, C.: Thermogravimetric analysis and devolatilization kinetics of wood, Ind. Eng. Chem. Res., 41, 4201–4208, 2002. a
Haslett, S. L., Thomas, J. C., Morgan, W. T., Hadden, R., Liu, D., Allan, J. D., Williams, P. I., Keita, S., Liousse, C., and Coe, H.: Highly controlled, reproducible measurements of aerosol emissions from combustion of a common African biofuel source, Atmos. Chem. Phys., 18, 385–403, https://doi.org/10.5194/acp-18-385-2018, 2018. a
Hennigan, C. J., Miracolo, M. A., Engelhart, G. J., May, A. A., Presto, A. A., Lee, T., Sullivan, A. P., McMeeking, G. R., Coe, H., Wold, C. E., Hao, W.-M., Gilman, J. B., Kuster, W. C., de Gouw, J., Schichtel, B. A., Collett Jr., J. L., Kreidenweis, S. M., and Robinson, A. L.: Chemical and physical transformations of organic aerosol from the photo-oxidation of open biomass burning emissions in an environmental chamber, Atmos. Chem. Phys., 11, 7669–7686, https://doi.org/10.5194/acp-11-7669-2011, 2011. a
Huangfu, Y., Li, H., Chen, X., Xue, C., Chen, C., and Liu, G.: Effects of moisture content in fuel on thermal performance and emission of biomass semi-gasified cookstove, Energy Sustain. Dev., 21, 60–65, 2014. a
Huffman, J. A., Docherty, K. S., Mohr, C., Cubison, M. J., Ulbrich, I. M., Ziemann, P. J., Onasch, T. B., and Jimenez, J. L.: Chemically-Resolved Volatility Measurements of Organic Aerosol from Different Sources, Environ. Sci. Technol., 43, 5351–5357, https://doi.org/10.1021/es803539d, https://doi.org/10.1021/es803539d, 2009. a
Hystad, P., Duong, M., Brauer, M., Larkin, A., Arku, R., Kurmi, O. P., Qi Fan, W., Avezum, A., Azam, I., Chifamba, J., Dans, A., Du Plessis, J. L., Gupta, R., Kumar, R., Lanas, F., Liu, Z., Lu, Y., Lopez-Jaramillo, P., Mony, P., Mohan, V., Mohan, D., Nair, S., Puoane, T., Rahman, O., Tse Lap, A., Wang, Y., Wei, L., Yeates, K., Rangarajan, S., Teo, K., and Yusuf, S.: Health effects of household solid fuel use: Findings from 11 countries within the prospective urban and rural epidemiology study, Environ. Health Persp., 127, 057003, https://doi.org/10.1289/EHP3915, 2019. a
Ichoku, C. and Kaufman, Y. J.: A method to derive smoke emission rates from MODIS fire radiative energy measurements, IEEE T. Geosci. Elect., 43, 2636–2649, 2005. a
Iinuma, Y., Brüggemann, E., Gnauk, T., Müller, K., Andreae, M. O., Helas, G., Parmar, R., and Herrmann, H.: Source characterization of biomass burning particles: The combustion of selected European conifers, African hardwood, savanna grass, and German and Indonesian peat, J. Geophys. Res.-Atmos., 112, D08209, https://doi.org/10.1029/2006JD007120, 2007. a
Janse, A., Westerhout, R., and Prins, W.: Modelling of flash pyrolysis of a single wood particle, Chem. Eng. Process., 39, 239–252, 2000. a
Jolleys, M. D., Coe, H., McFiggans, G., McMeeking, G. R., Lee, T., Kreidenweis, S. M., Collett, J. L., and Sullivan, A. P.: Organic aerosol emission ratios from the laboratory combustion of biomass fuels, J. Geophys. Res.-Atmos., 119, 12850–12871, https://doi.org/10.1002/2014JD021589, 2014. a
Koppmann, R., von Czapiewski, K., and Reid, J. S.: A review of biomass burning emissions, part I: gaseous emissions of carbon monoxide, methane, volatile organic compounds, and nitrogen containing compounds, Atmos. Chem. Phys. Discuss., 5, 10455–10516, https://doi.org/10.5194/acpd-5-10455-2005, 2005. a
Lane, T. E., Pinder, R. W., Shrivastava, M., Robinson, A. L., and Pandis, S. N.: Source contributions to primary organic aerosol: Comparison of the results of a source-resolved model and the chemical mass balance approach, Atmos. Environ., 41, 3758–3776, https://doi.org/10.1016/j.atmosenv.2007.01.006, 2007. a
Lautenberger, C. and Fernandez-Pello, C.: Generalized pyrolysis model for combustible solids, Fire Safety J., 44, 819–839, 2009. a
Lee, B. P., Li, Y. J., Flagan, R. C., Lo, C., and Chan, C. K.: Sizing Characterization of the Fast-Mobility Particle Sizer (FMPS) Against SMPS and HR-ToF-AMS, Aerosol Sci. Tech., 47, 1030–1037, https://doi.org/10.1080/02786826.2013.810809, 2013. a
Lee, C. K. and Diehl, J.: Combustion of irradiated dry and wet oak, Combust. Flame, 42, 123–138, https://doi.org/10.1016/0010-2180(81)90151-6, 1981. a
Lee, C. K., Chaiken, R. F., and Singer, J. M.: Charring pyrolysis of wood in fires by laser simulation, in: Symposium (International) on Combustion, Cambridge, Massachusetts, USA, 15–20 August 1976, vol. 16, 1459–1470, Elsevier, 1977. a
MacLean, J.: Heating, piping & air conditioning, 13, 380–391, available at: https://www.fpl.fs.fed.us/documnts/pdf1941/macle41a.pdf (last access: last access: January 2021), 1941. a
Magnone, E., Park, S.-K., and Park, J. H.: Effects of moisture contents in the common oak on carbonaceous aerosols generated from combustion processes in an indoor wood stove, Combust. Sci. Technol., 188, 982–996, 2016. a
May, A. A., Levin, E. J. T., Hennigan, C. J., Riipinen, I., Lee, T., Collett, J. L., Jimenez, J. L., Kreidenweis, S. M., and Robinson, A. L.: Gas-particle partitioning of primary organic aerosol emissions: 3. Biomass burning, J. Geophys. Res.-Atmos., 118, 327–338, https://doi.org/10.1002/jgrd.50828, 2013. a
May, A. A., McMeeking, G. R., Lee, T., Taylor, J. W., Craven, J. S., Burling, I., Sullivan, A. P., Akagi, S., Collett Jr., J. L., Flynn, M., Coe, H., Urbanski, S. P., Seinfeld, J. H., Yokelson, R. J., and Kreidenweis, S. M.: Aerosol emissions from prescribed fires in the United States: A synthesis of laboratory and aircraft measurements, J. Geophys. Res.-Atmos., 119, 11–826, 2014. a
McDonald, J. D., Zielinska, B., Fujita, E. M., Sagebiel, J. C., Chow, J. C., and Watson, J. G.: Fine Particle and Gaseous Emission Rates from Residential Wood Combustion, Environ. Sci. Technol., 34, 2080–2091, https://doi.org/10.1021/es9909632, 2000. a, b
McKenzie, L. M., Hao, W. M., Richards, G. N., and Ward, D. E.: Measurement and Modeling of Air Toxins from Smoldering Combustion of Biomass, Environ. Sci. Technol., 29, 2047–2054, https://doi.org/10.1021/es00008a025, 1995. a
Morf, P., Hasler, P., and Nussbaumer, T.: Mechanisms and kinetics of homogeneous secondary reactions of tar from continuous pyrolysis of wood chips, Fuel, 81, 843–853, https://doi.org/10.1016/S0016-2361(01)00216-2, 2002. a, b
Morino, Y., Chatani, S., Tanabe, K., Fujitani, Y., Morikawa, T., Takahashi, K., Sato, K., and Sugata, S.: Contributions of Condensable Particulate Matter to Atmospheric Organic Aerosol over Japan, Environ. Sci. Technol., 52, 8456–8466, https://doi.org/10.1021/acs.est.8b01285, 2018. a
Nielsen, I. E., Eriksson, A. C., Lindgren, R., Martinsson, J., Nyström, R., Nordin, E. Z., Sadiktsis, I., Boman, C., Nøjgaard, J. K., and Pagels, J.: Time-resolved analysis of particle emissions from residential biomass combustion – Emissions of refractory black carbon, PAHs and organic tracers, Atmos. Environ., 165, 179–190, https://doi.org/10.1016/J.ATMOSENV.2017.06.033, 2017. a
Nunn, T. R., Howard, J. B., Longwell, J. P., and Peters, W. A.: Product Compositions and Kinetics in the Rapid Pyrolysis of Sweet Gum Hardwood, Ind. Eng. Chem. Process. DD., 24, 836–844, https://doi.org/10.1021/i200030a053, 1985. a
Okello, G., Devereux, G., and Semple, S.: Women and girls in resource poor countries experience much greater exposure to household air pollutants than men: Results from Uganda and Ethiopia, Environ. Int., 119, 429–437, https://doi.org/10.1016/j.envint.2018.07.002, 2018. a
Ozgen, S., Caserini, S., Galante, S., Giugliano, M., Angelino, E., Marongiu, A., Hugony, F., Migliavacca, G., and Morreale, C.: Emission factors from small scale appliances burning wood and pellets, Atmos. Environ., 94, 144–153, 2014. a
Pattanotai, T., Watanabe, H., and Okazaki, K.: Experimental investigation of intraparticle secondary reactions of tar during wood pyrolysis, Fuel, 104, 468–475, https://doi.org/10.1016/J.FUEL.2012.08.047, 2013. a
Peters, B. and Bruch, C.: Drying and pyrolysis of wood particles: experiments and simulation, J. Anal. Appl. Pyrol., 70, 233–250, https://doi.org/10.1016/S0165-2370(02)00134-1, 2003. a
Plötze, M. and Niemz, P.: Porosity and pore size distribution of different wood types as determined by mercury intrusion porosimetry, Eur. J. Wood Wood Prod., 69, 649–657, https://doi.org/10.1007/s00107-010-0504-0, 2011. a
Price-Allison, A., Lea-Langton, A., Mitchell, E., Gudka, B., Jones, J., Mason, P., and Williams, A.: Emissions performance of high moisture wood fuels burned in a residential stove, Fuel, 239, 1038–1045, 2019. a
Pyle, D. and Zaror, C.: Heat transfer and kinetics in the low temperature pyrolysis of solids, Chem. Eng. Sci., 39, 147–158, https://doi.org/10.1016/0009-2509(84)80140-2, 1984. a
Reed, T. B.: Encyclopedia of biomass thermal conversion: the principles and technology of pyrolysis, gasification and combustion, Biomass Energy Foundation Press, Golden, Colorado, USA, available at: http://www.drtlud.com/?resource=prt02851 (last access: December 2019), 2002. a
Remacha, M. P., Jiménez, S., and Ballester, J.: Devolatilization of millimeter-sized biomass particles at high temperatures and heating rates. Part 1: Experimental methods and results, Fuel, 234, 757–769, 2018. a
Schauer, J. J., Kleeman, M. J., Cass, G. R., and Simoneit, B. R.: Measurement of emissions from air pollution sources. 3. C1- C29 organic compounds from fireplace combustion of wood, Environ. Sci. Technol., 35, 1716–1728, 2001. a
Schmidl, C., Marr, I. L., Caseiro, A., Kotianová, P., Berner, A., Bauer, H., Kasper-Giebl, A., and Puxbaum, H.: Chemical characterisation of fine particle emissions from wood stove combustion of common woods growing in mid-European Alpine regions, Atmos. Environ., 42, 126–141, https://doi.org/10.1016/j.atmosenv.2007.09.028, 2008. a
Sekimoto, K., Koss, A. R., Gilman, J. B., Selimovic, V., Coggon, M. M., Zarzana, K. J., Yuan, B., Lerner, B. M., Brown, S. S., Warneke, C., Yokelson, R. J., Roberts, J. M., and de Gouw, J.: High- and low-temperature pyrolysis profiles describe volatile organic compound emissions from western US wildfire fuels, Atmos. Chem. Phys., 18, 9263–9281, https://doi.org/10.5194/acp-18-9263-2018, 2018. a, b
Shafizadeh, F.: Introduction to pyrolysis of biomass, J. Anal. Appl. Pyrol., 3, 283–305, 1982. a
Shrivastava, M. K., Lipsky, E. M., Stanier, C. O., and Robinson, A. L.: Modeling Semivolatile Organic Aerosol Mass Emissions from Combustion Systems, Environ. Sci. Technol., 40, 2671–2677, https://doi.org/10.1021/ES0522231, 2006. a
Simms, D. and Law, M.: The ignition of wet and dry wood by radiation, Combust. Flame, 11, 377–388, 1967. a
Spearpoint, M. J. and Quintiere, J. G.: Predicting the piloted ignition of wood in the cone calorimeter using an integral model–effect of species, grain orientation and heat flux, Fire Safety J., 36, 391–415, 2001. a
Staggs, J.: Heat and mass transport in developing chars, Polym. Degrad. Stabil., 82, 297–307, https://doi.org/10.1016/S0141-3910(03)00185-X, 2003. a
Stockwell, C. E., Yokelson, R. J., Kreidenweis, S. M., Robinson, A. L., DeMott, P. J., Sullivan, R. C., Reardon, J., Ryan, K. C., Griffith, D. W. T., and Stevens, L.: Trace gas emissions from combustion of peat, crop residue, domestic biofuels, grasses, and other fuels: configuration and Fourier transform infrared (FTIR) component of the fourth Fire Lab at Missoula Experiment (FLAME-4), Atmos. Chem. Phys., 14, 9727–9754, https://doi.org/10.5194/acp-14-9727-2014, 2014. a
Suuberg, E. M., Milosavljevic, I., and Oja, V.: Two-regime global kinetics of cellulose pyrolysis: The role of tar evaporation, Symposium (International) on Combustion, 26, 1515–1521, https://doi.org/10.1016/S0082-0784(96)80373-0, 1996. a
Theodoritsi, G. N. and Pandis, S. N.: Simulation of the chemical evolution of biomass burning organic aerosol, Atmos. Chem. Phys., 19, 5403–5415, https://doi.org/10.5194/acp-19-5403-2019, 2019. a
Tran, H. C. and White, R. H.: Burning rate of solid wood measured in a heat release rate calorimeter, Fire Mater., 16, 197–206, 1992. a
Tsimpidi, A. P., Karydis, V. A., Pandis, S. N., and Lelieveld, J.: Global-scale combustion sources of organic aerosols: sensitivity to formation and removal mechanisms, Atmos. Chem. Phys., 17, 7345–7364, https://doi.org/10.5194/acp-17-7345-2017, 2017. a
Tuet, W. Y., Liu, F., de Oliveira Alves, N., Fok, S., Artaxo, P., Vasconcellos, P., Champion, J. A., and Ng, N. L.: Chemical Oxidative Potential and Cellular Oxidative Stress from Open Biomass Burning Aerosol, Environ. Sci. Tech. Let., 6, 126–132, https://doi.org/10.1021/acs.estlett.9b00060, 2019. a
van Zyl, L., Tryner, J., Bilsback, K. R., Good, N., Hecobian, A., Sullivan, A., Zhou, Y., Peel, J. L., and Volckens, J.: Effects of Fuel Moisture Content on Emissions from a Rocket-Elbow Cookstove, Environ. Sci. Technol., 53, 4648–4656, https://doi.org/10.1021/acs.est.9b00235, 2019. a, b
Vicente, E. and Alves, C.: An overview of particulate emissions from residential biomass combustion, Atmos. Res., 199, 159–185, 2018. a
Wagenaar, B., Prins, W., and van Swaaij, W. P. M.: Flash pyrolysis kinetics of pine wood, Fuel Process. Technol., 36, 291–298, 1993. a
Wang, P., Ying, Q., Zhang, H., Hu, J., Lin, Y., and Mao, H.: Source apportionment of secondary organic aerosol in China using a regional source-oriented chemical transport model and two emission inventories, Environ. Pollut., 237, 756–766, https://doi.org/10.1016/j.envpol.2017.10.122, 2018. a
Ward, D. E. and Hao, W. M.: Projections of Emissions from Burning of Biomass for Use in Studies of Global Climate and Atmospheric Chemistry, in: Proceedings of the National Air and Waste Management Association, Air and Waste Management Association, Vancouver, British Columbia, 1991. a
Weimer, S., Alfarra, M., Schreiber, D., Mohr, M., Prévôt, A. S., and Baltensperger, U.: Organic aerosol mass spectral signatures from wood-burning emissions: Influence of burning conditions and wood type, J. Geophys. Res.-Atmos., 113, D10304, https://doi.org/10.1029/2007JD009309, 2008. a
Wu, L., Wang, X., Lu, S., Shao, M., and Ling, Z.: Emission inventory of semi-volatile and intermediate-volatility organic compounds and their effects on secondary organic aerosol over the Pearl River Delta region, Atmos. Chem. Phys., 19, 8141–8161, https://doi.org/10.5194/acp-19-8141-2019, 2019. a
Yokelson, R. J., Griffith, D. W., and Ward, D. E.: Open-path Fourier transform infrared studies of large-scale laboratory biomass fires, J. Geophys. Res.-Atmos., 101, 21067–21080, 1996. a
Yokelson, R. J., Susott, R., Ward, D. E., Reardon, J., and Griffith, D. W.: Emissions from smoldering combustion of biomass measured by open-path Fourier transform infrared spectroscopy, J. Geophys. Res.-Atmos., 102, 18865–18877, https://doi.org/10.1029/97jd00852, 1997. a
Yu, S., Dennis, R. L., Bhave, P. V., and Eder, B. K.: Primary and secondary organic aerosols over the United States: estimates on the basis of observed organic carbon (OC) and elemental carbon (EC), and air quality modeled primary OC/EC ratios, Atmos. Environ., 38, 5257–5268, 2004. a
Zhang, Y., Obrist, D., Zielinska, B., and Gertler, A.: Particulate emissions from different types of biomass burning, Atmos. Environ., 72, 27–35, https://doi.org/10.1016/J.ATMOSENV.2013.02.026, 2013. a
Zimmerman, N., Godri Pollitt, K. J., Jeong, C.-H., Wang, J. M., Jung, T., Cooper, J. M., Wallace, J. S., and Evans, G. J.: Comparison of three nanoparticle sizing instruments: The influence of particle morphology, Atmos. Environ., 86, 140–147, https://doi.org/10.1016/J.ATMOSENV.2013.12.023, 2014. a