the Creative Commons Attribution 4.0 License.
the Creative Commons Attribution 4.0 License.
 | 14 Oct 2021
Controls on surface aerosol particle number concentrations and aerosol-limited cloud regimes over the central Greenland Ice Sheet
Ian M. Brooks
Ken S. Carslaw
Benjamin J. Murray
Von P. Walden
Matthew D. Shupe
Claire Pettersen
David D. Turner
Christopher J. Cox
William D. Neff
Ralf Bennartz
Ryan R. Neely III
This study presents the first full annual cycle (2019–2020) of ambient surface aerosol particle number concentration measurements (condensation nuclei > 20 nm, N20) collected at Summit Station (Summit), in the centre of the Greenland Ice Sheet (72.58∘ N, −38.45∘ E; 3250 ). The mean surface concentration in 2019 was 129 cm−3, with the 6 h mean ranging between 1 and 1441 cm−3. The highest monthly mean concentrations occurred during the late spring and summer, with the minimum concentrations occurring in February (mean: 18 cm−3). High-N20 events are linked to anomalous anticyclonic circulation over Greenland and the descent of free-tropospheric aerosol down to the surface, whereas low-N20 events are linked to anomalous cyclonic circulation over south-east Greenland that drives upslope flow and enhances precipitation en route to Summit. Fog strongly affects particle number concentrations, on average reducing N20 by 20 % during the first 3 h of fog formation. Extremely-low-N20 events (< 10 cm−3) occur in all seasons, and we suggest that fog, and potentially cloud formation, can be limited by low aerosol particle concentrations over central Greenland.
- Article
(12353 KB) - Full-text XML
- BibTeX
- EndNote


The Greenland Ice Sheet (GrIS) has been losing mass at an unprecedented and accelerating rate since the early 21st century (Rignot et al., 2008, 2011; van den Broeke et al., 2016; Fettweis et al., 2017; Trusel et al., 2018; The IMBIE Team, 2020) and, as a result, has become the largest single contributor to global sea level rise (van den Broeke et al., 2016; Bamber et al., 2018; Slater et al., 2020). The majority of this mass loss is due to changes in the ice sheet surface mass balance (Slater et al., 2020) and, in particular, increased surface melt and run-off (Enderlin et al., 2014; van den Broeke et al., 2016; The IMBIE Team, 2020). Clouds play a critical role in the ice sheet surface mass balance, both by providing mass input in the form of precipitation and by modulating the net radiation at the surface, thus influencing surface melt and run-off (Bennartz et al., 2013; Van Tricht et al., 2016; Hofer et al., 2017; Miller et al., 2017). To make accurate projections of the future contribution of the GrIS to sea level rise, models must correctly represent the properties of clouds and their interaction with the surface energy budget. Although circulation anomalies drive a larger proportion of surface melt, discrepancies in cloud microphysical properties between different models currently result in larger uncertainties in future GrIS melt projections than the difference between low- and high-greenhouse-emission scenarios (Hofer et al., 2019). Amongst the largest uncertainties in cloud microphysical modelling are the type, concentration, and sources of aerosol particles (e.g. Seinfeld et al., 2016). Improving our understanding of aerosols and their relationship with cloud properties over the GrIS is therefore key to reducing the uncertainty in future projections of GrIS melt and global sea level rise.
Cloud properties are sensitive to the type and concentration of tropospheric aerosol particles (e.g. Twomey, 1977; Curry et al., 1996; Storelvmo, 2017). Mixed-phase clouds in particular, which contribute significantly to surface warming over the GrIS (Miller et al., 2015; Van Tricht et al., 2016), are sensitive to the number concentration of cloud condensation nuclei and ice-nucleating particles (e.g. Norgren et al., 2018; Solomon et al., 2018), where cloud condensation nuclei (CCN) are a subset of aerosol particles on which liquid droplets can form, and ice-nucleating particles (INPs) are a subset of aerosols that can catalyse the formation of ice crystals.
In ice-covered polar regions, CCN concentrations can be very low; surface CCN concentrations at 0.2 % supersaturation are usually less than 100 cm−3 and can regularly fall below 10 cm−3 in the high Arctic (e.g. Mauritsen et al., 2011; Leck and Svensson, 2015), compared to typical values of over 1000 cm−3 at rural mid-latitude sites (e.g. Schmale et al., 2018). In cases where CCN are extremely low (< 10 cm−3), the small number of sites for droplet activation limits cloud droplet number concentration, and high supersaturations cause all available CCN to activate and grow to relatively large sizes, facilitating further growth by collision and coalescence and resulting in precipitation as drizzle (Mauritsen et al., 2011). This generates a positive feedback where the lack of CCN can result in total dissipation of the cloud (Mauritsen et al., 2011; Stevens et al., 2018). Thus, within this CCN-limited regime, the availability of CCN becomes a dominant control on cloud formation and longevity such that a small increase in concentration can lead to a decrease in droplet size that serves to reduce precipitation efficiency, leading to a relative increase in cloud liquid water path (LWP) (Mauritsen et al., 2011). The change in LWP in turn modulates the cloud longwave radiative effect (Mauritsen et al., 2011; Miller et al., 2015). Alternatively, the addition of CCN when a cloud is not in the CCN-limited regime can have a cooling effect at the surface in the summer due to the associated increase in cloud reflectivity of incoming solar radiation (Twomey, 1977; Intrieri et al., 2002). For optically thin clouds (< 40 g m−2), which are common at Summit Station (Summit; Shupe et al., 2013b; Miller et al., 2015), the smaller droplet size associated with increased CCN results in higher cloud emissivity, increasing the downwelling longwave radiative flux and having a relative warming effect at the surface (Lubin and Vogelmann, 2006; Garrett and Zhao, 2006). Understanding when and where each of these processes dominates is extremely important for understanding cloud radiative forcing and the surface energy budget (Schmale et al., 2021).
The concentration of ice-nucleating particles (INPs) is also an important control on the longevity and radiative impact of clouds. INPs are required to form primary ice in supercooled liquid clouds that are warmer than the homogeneous freezing temperature (approximately −38 ∘C) (e.g. Kanji et al., 2017). Because the low-level clouds that have the largest radiative effect at the Arctic surface usually have temperatures between −38 ∘C and 0 ∘C (Shupe and Intrieri, 2004; Shupe et al., 2013b; Miller et al., 2015), INP concentrations are an important control on the ice and liquid water contents of these clouds. Clouds containing ice crystals are optically thinner than those containing only supercooled water droplets and therefore emit less longwave radiation towards the surface, having a relative cooling effect (e.g. Prenni et al., 2007). Even more importantly, once ice crystals are present in a supercooled cloud, the lower saturation vapour pressure of ice versus liquid water results in the preferential growth of ice crystals at the expense of liquid droplets when the environment is subsaturated with respect to water but supersaturated with respect to ice. This is known as the Wegener–Bergeron–Findeisen (WBF) process, the result of which is a decrease in LWP as droplets evaporate and an increase in precipitation due to the growth of relatively large ice crystals, ultimately leading to cloud dissipation (e.g. Lohmann and Feichter, 2005). INP concentrations are typically orders of magnitude lower than CCN concentrations and are particularly low in the Arctic based on limited existing measurements (∼ 10−7 to 10−5 cm−3, Wex et al., 2019). The lack of INPs in the Arctic may contribute to the unusual persistence of low-level mixed-phase stratocumulus clouds (Morrison et al., 2012), which are highly important for radiative forcing at the surface, and played a role in the anomalous GrIS surface melt event in 2012 (Bennartz et al., 2013).
Both CCN and INP concentrations are also important for precipitation accumulation. In liquid clouds, the increase in cloud droplet number concentration and associated decrease in cloud droplet size under high CCN concentrations reduces the opportunities for droplet collision and coalescence and hence reduces precipitation relative to equivalent situations with lower droplet concentrations (e.g. Lohmann and Feichter, 2005). In mixed-phase clouds this process is more complex, since changes in the cloud droplet size distribution can have both positive and negative effects on the efficiency of ice production (Cheng et al., 2010; Lance et al., 2011; Possner et al., 2017). Cloud phase partitioning is also important since ice phase clouds have markedly different precipitation characteristics to those containing super-cooled liquid water (Pettersen et al., 2018; McIlhattan et al., 2020). Model simulations generally overestimate precipitation accumulation over the GrIS (McIlhattan et al., 2017; Kay et al., 2018; Lenaerts et al., 2020) and in particular the contribution from mixed-phase clouds. McIlhattan et al. (2017) find that the Community Earth System Model (CESM) overestimates snow frequency from mixed-phase clouds by 52 % and underestimates the occurrence frequency of liquid-bearing clouds by 21 % over the central GrIS. This is consistent with an overly active WBF process in the model – a process that is strongly controlled by INP concentrations.
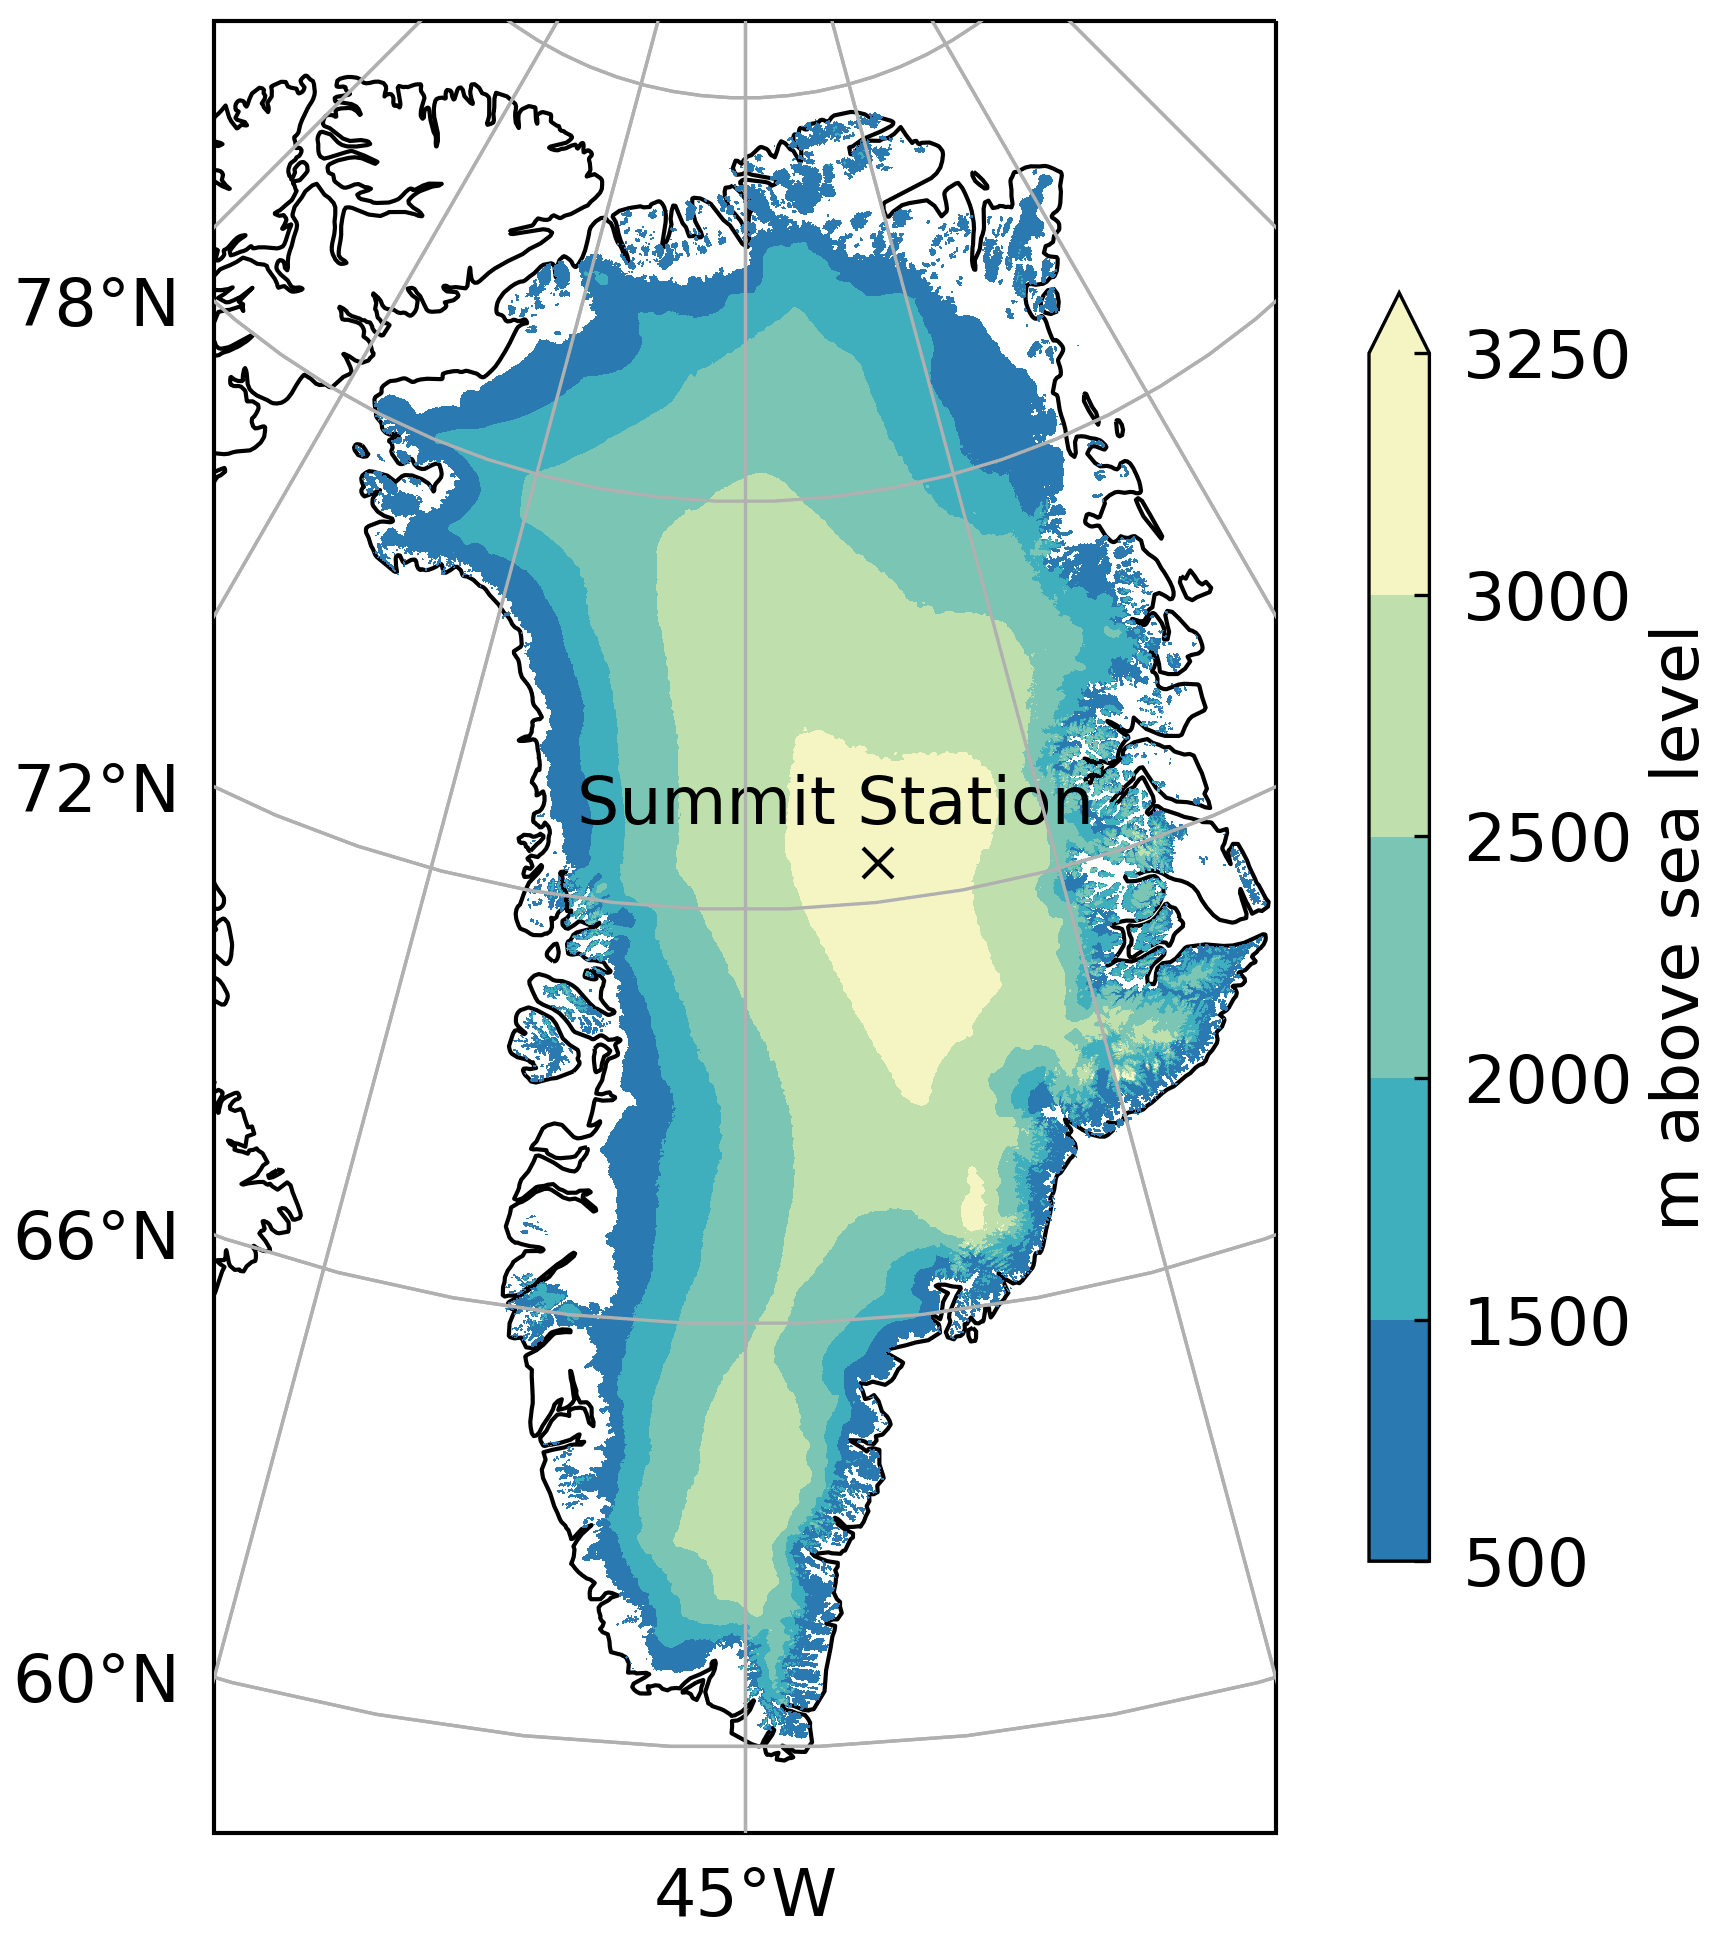
Figure 1Location of Summit Station at the highest point on the Greenland Ice Sheet. Ice elevation contours are from the Greenland Ice Mapping Project (Howat et al., 2017).
To date, all observations of the CCN-limited regime (Mauritsen et al., 2011; Leaitch et al., 2016), and INP concentrations (Wex et al., 2019), in the Arctic are located at marine or coastal sites. However, the central GrIS is a distinct Arctic environment due to its high elevation (3250 at its highest point, Fig. 1) and persistent ice cover (1.7 × 10⁶ km2) that results in a year-round high surface albedo. There are no substantial local sources of aerosol from the surface for over 400 km in any direction from the centre of the ice sheet. The year-round high surface albedo of the central GrIS (Box et al., 2012) results in unique seasonality in cloud radiative forcing. Most parts of the Arctic have less snow and ice cover in the summer and hence a lower albedo; during this time clouds can have a net cooling effect at the surface due their relatively high albedo (e.g. Shupe and Intrieri, 2004). In contrast, over the central GrIS the seasonal change in surface albedo is negligible and clouds have a net warming effect at the surface year-round (Miller et al., 2015; Van Tricht et al., 2016).
The high elevation and extreme radiative cooling from the centre of the GrIS drive low-level katabatic winds that radiate towards the ice sheet edge and, combined with synoptic and large-scale circulation patterns, support the formation of a persistent high-pressure system over Greenland (Heinemann and Klein, 2002; Hanna et al., 2016). For this reason, Greenland has been referred to as the “northern wind pole”, where upper-level air currents driven by the Hadley circulation descend and return to lower latitudes (Hobbs, 1945; Heinemann and Klein, 2002). The descent of upper tropospheric air to the surface of the central GrIS results in a larger contribution of well-mixed free-tropospheric aerosol (Stohl, 2006). Hence, the transport processes and source regions controlling the concentrations of aerosol particles over the central GrIS are distinct from other Arctic sites (Hirdman et al., 2009; Backman et al., 2021).
The presumed insignificance of local aerosol sources at the surface of the GrIS suggests that both low CCN concentrations with the potential to limit cloud formation and low INP concentrations that can control cloud phase could certainly occur. The difference in aerosol transport pathways to the GrIS when compared to coastal or marine Arctic sites implies that the processes controlling aerosol-limited cloud regimes, and their frequency of occurrence, might differ substantially from other Arctic locations. Hence, a thorough analysis of the role of the aerosol-limited conditions over the GrIS is warranted, especially given the unique sensitivity of the GrIS to longwave cloud forcing.
Despite the potential for aerosol-limited clouds to affect the surface mass balance of the GrIS, and the large uncertainties in modelled cloud microphysical properties over Greenland (Hofer et al., 2019; Schmale et al., 2021), there are very few observations of aerosol particle number concentration over the central GrIS, and those that do exist are mostly limited to the summer season (Ziemba et al., 2010; Flyger et al., 1976; Hogan et al., 1984; Davidson et al., 1993; Bergin et al., 1994, 1995). This study presents the first full year of surface aerosol particle number concentration measurements from Summit Station, in the central GrIS, which can be used as a baseline for future modelling studies investigating the effect of cloud–aerosol interactions on the GrIS surface energy budget and mass balance. We assess local and synoptic controls on surface aerosol particle concentrations at Summit and present three case studies where extremely low total particle number concentrations (< 10 cm−3) coincide with cloud dissipation, indicating that CCN-limited clouds occur over the central GrIS and could be an important contributor to the surface energy budget.
Guy et al. (2020)Crilley et al. (2018)GMLMET (2021)Guy et al. (2020)Sheppard and Joe (2008)Moran et al. (1998)Shupe et al. (2013b)Turner et al. (2007)Shupe et al. (2013b)Flynna et al. (2007)Table 1Measurements used in this study; references provide additional instrument information and methodologies for derived parameters.
All observations in this study were made at Summit Station (Summit), a scientific research base funded by the US National Science Foundation. Summit is located at the highest point on the GrIS (3250 ), is over 400 km from the coast in the east and west directions, and is over 1000 km from the south-west and south-east coasts (Fig. 1). Aerosol, cloud, and atmospheric profile measurements were collected as part of the ICECAPS-ACE project: ICECAPS (Integrated Characterization of Energy, Clouds, Atmospheric State, and Precipitation at Summit) has been operating at Summit since 2010 and consists of a suite of ground-based remote sensing instrumentation and twice-daily radiosonde launches (Shupe et al., 2013b). The ACE (Aerosol Cloud Experiment) addition to ICECAPS began collecting data in February 2019 and includes measurements of surface aerosol particle number concentration and size distribution in addition to turbulent and radiative fluxes used to characterise the surface energy budget. This study uses a subset of ICECAPS-ACE data listed in Table 1, as well as meteorological measurements from the NOAA Global Monitoring Laboratory (GMLMET, 2021). The references in Table 1 provide additional information on the instruments and methodologies for the derived parameters. Section 2.1 provides the details of the aerosol particle number concentration sampling and quality control.
To investigate the effect of near-surface local processes that have the potential to modify surface aerosol particle concentrations, we look at four event types: fog, precipitation, blowing snow (BLSN), and strong surface-based temperature inversions (SBIs). For each type, we examine the change in aerosol particle concentrations across multiple events. To qualify, events of each type must last at least 60 min, and separate events of the same type must be at least 5 h apart. Sections 2.2 to 2.4 provide specific details about how each event type is defined.
To assess the synoptic controls on surface aerosol particle concentrations, we use ERA5 reanalysis data (Hersbach et al., 2020) made available by the European Centre for Medium-Range Weather Forecasts (ECMWF). ERA5 is the highest-resolution global reanalysis product to date, with ∼ 15 km horizontal resolution over Greenland, 137 pressure levels up to 80 km, and 1 h temporal resolution. We also use ERA5 reanalysis to drive the FLEXPART Lagrangian particle dispersion model (Pisso et al., 2019) to simulate aerosol transport pathways and surface emission sensitivities. Section 2.5 provides further details about the FLEXPART experimental design.
2.1 Surface aerosol particle number concentrations
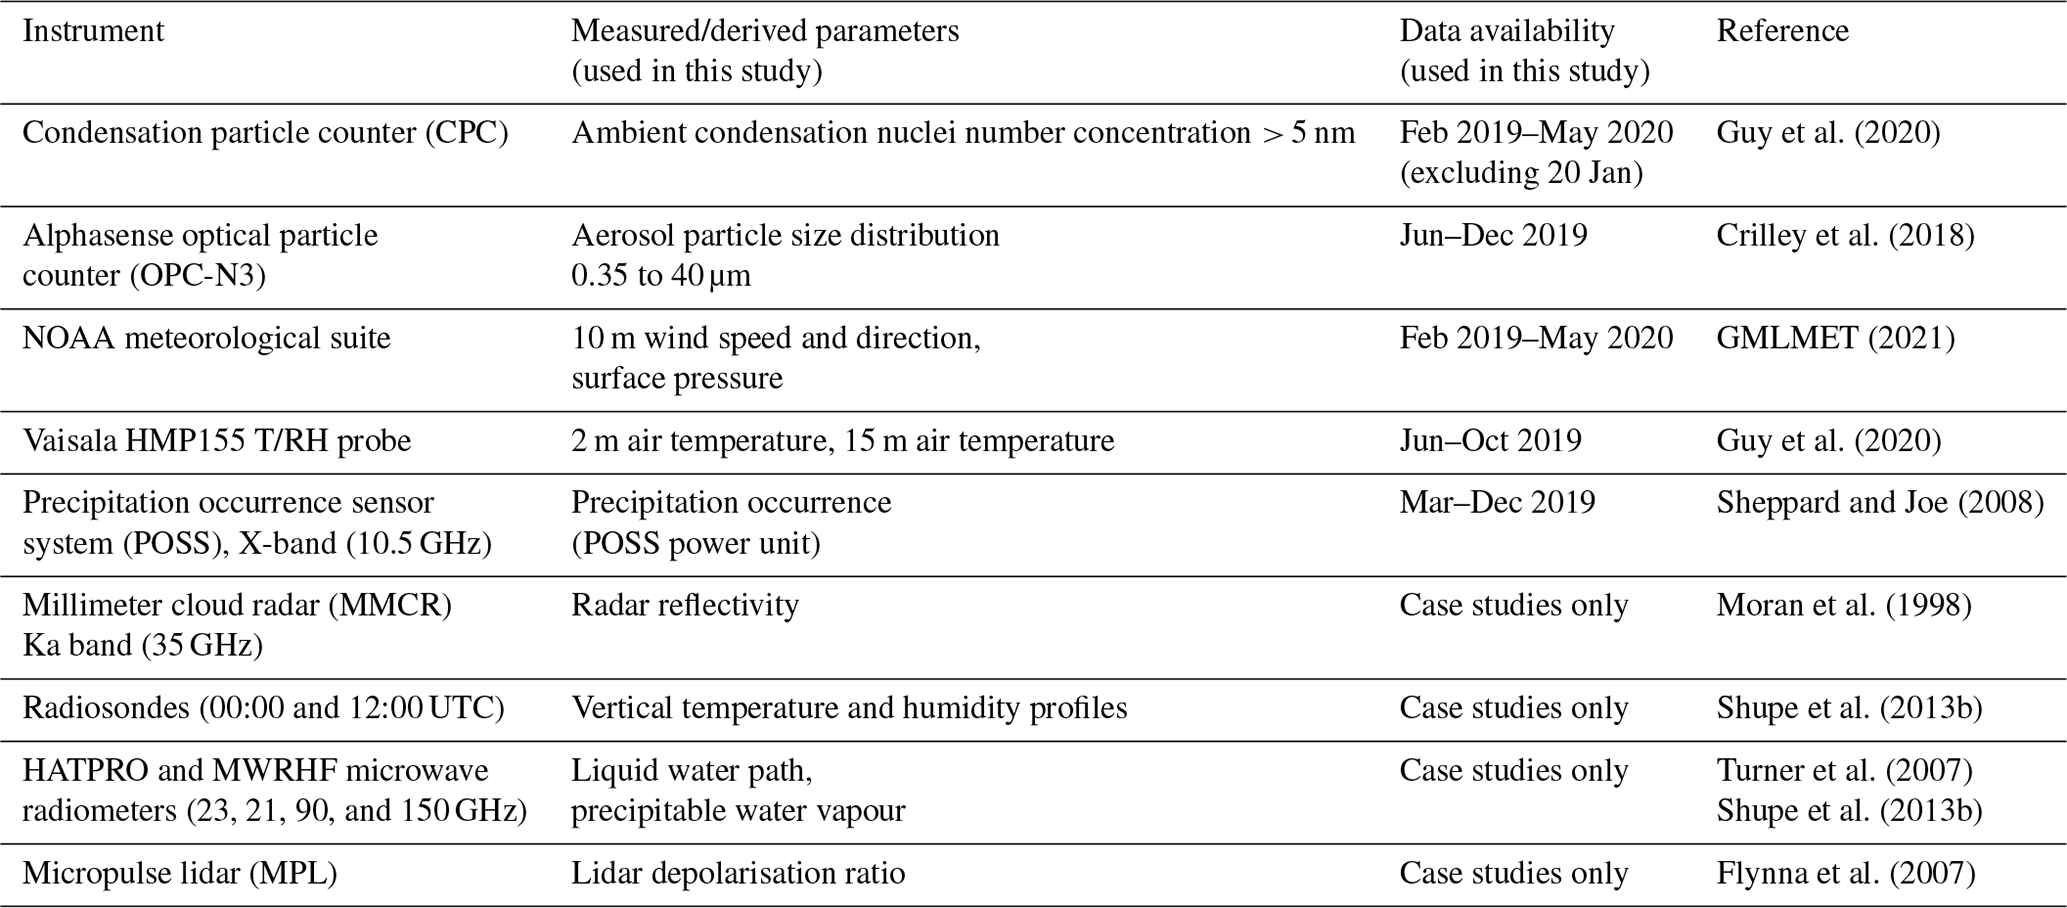
A condensation particle counter (GRIMM CPC 5.400) measured the ambient number concentration of condensation nuclei at 1 Hz frequency. The omnidirectional conical inlet head was located ∼ 3 m above the surface (this varied slightly throughout the observation period with snow drifting and accumulation), and air was sampled with a flow rate of 0.3 L min−1. The inlet was connected to the CPC via a 6 m length of conductive silicone tubing with an 8 mm inner diameter. Although the CPC is calibrated to measure condensation nuclei > 5 nm diameter, the addition of the long inlet results in a loss of particles inside the tubing. Figure 2 shows an estimation of the loss of aerosol particles inside the inlet generated by the Particle Loss Calculator (von der Weiden et al., 2009). Smaller particles are increasingly lost due to diffusion to the walls of the inlet, and larger particles are lost due to sedimentation and deposition. The Particle Loss Calculator does not account for the temperature gradient within the tubing; however, because the cold air in the inlet stream transitions into a warmer inlet (inside the heated building), this will act to reduce the loss of particles (von der Weiden et al., 2009). Also, because particle concentrations are small (≪ 100 000 cm−3), loss due to coagulation is negligible (von der Weiden et al., 2009). Based on these modelled inlet losses, the CPC measured condensation nuclei with diameters between 20 nm and 2.3 µm with over 50 % efficiency (Fig. 2). For this reason we henceforth refer to the CPC concentration measurements as N20, indicating number concentrations of particles with diameter > 20 nm. Modelled inlet losses are < 15 % for particles with diameters between 0.08 and 1 µm, which is representative of the typical size range of CCN in clean Arctic environments (Hudson and Da, 1996; Leaitch et al., 2016).
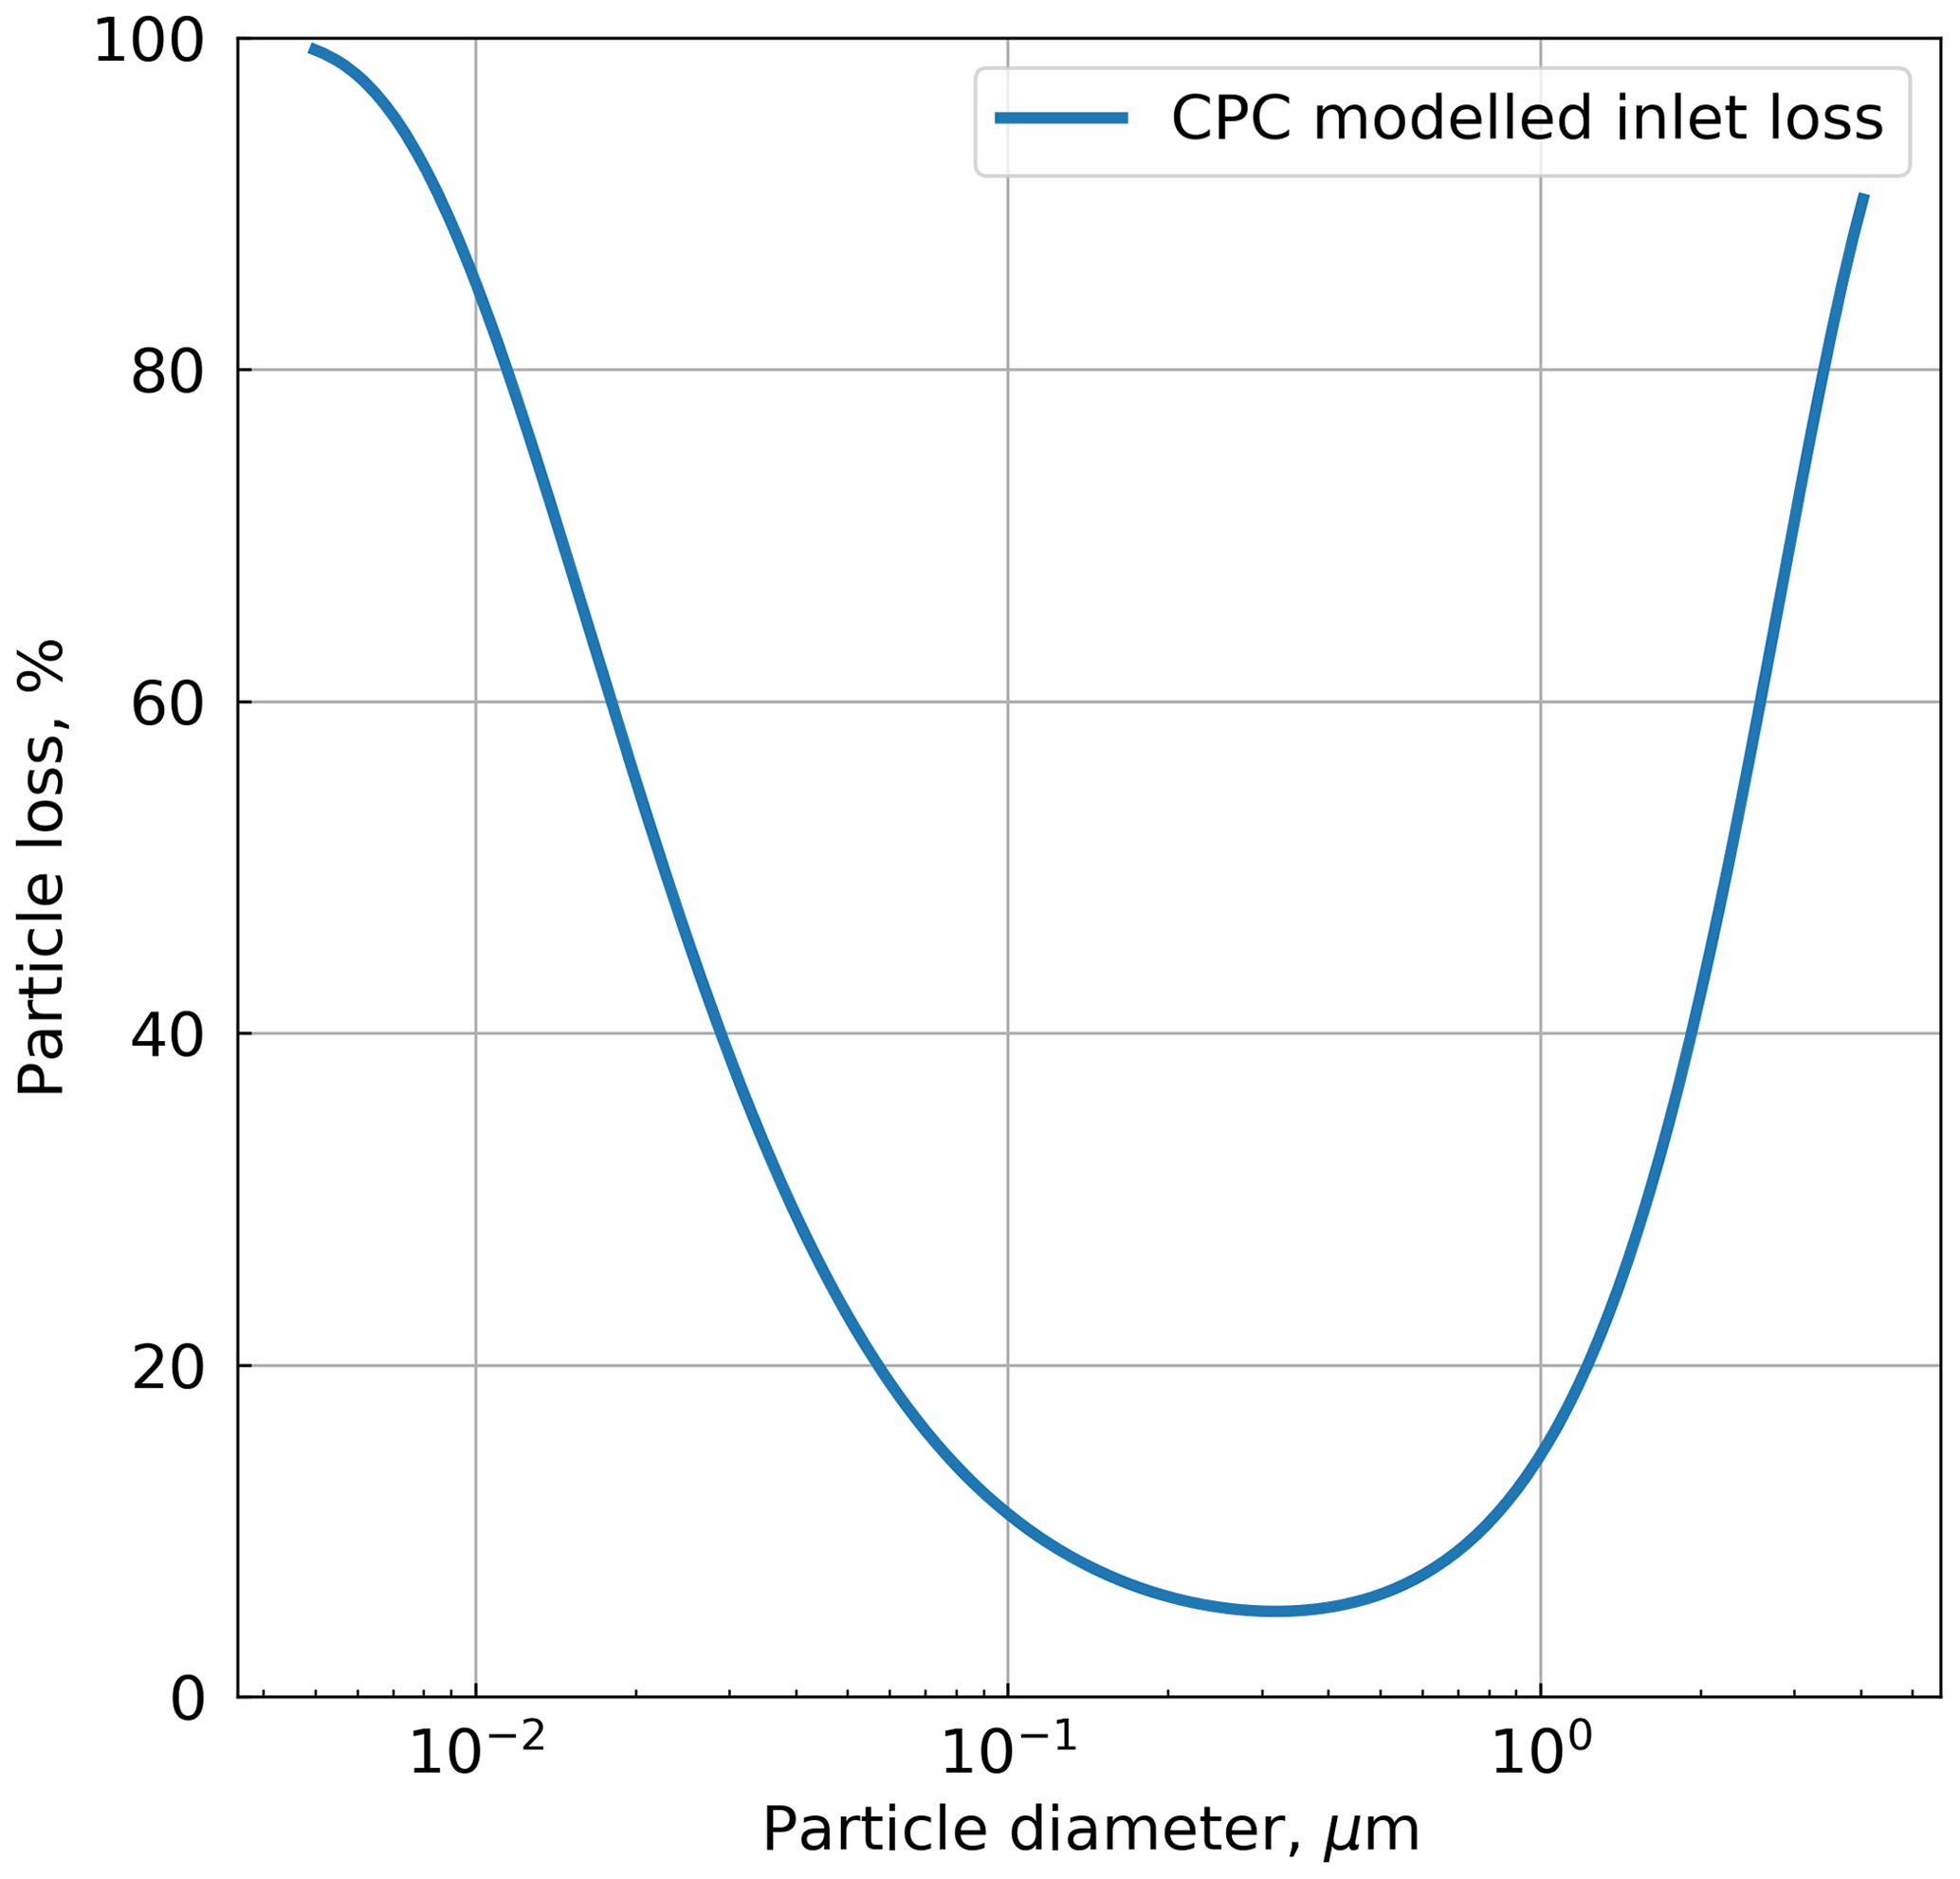
Figure 2Modelled particle loss as a function of particle diameter in the CPC inlet, as estimated by the Particle Loss Calculator (von der Weiden et al., 2009).
Ziemba et al. (2010) made measurements of surface aerosol particle size distribution between 5.5 and 195 nm at Summit in May and June 2007. Their observations suggest that high concentrations of nucleation-mode particles (< 30 nm diameter) occur periodically during the summer at Summit. The reduced collection efficiency of our CPC between 20 and 40 nm would have resulted in an undercount of the total N20 by up to 27 % during the 2007 measurement period reported by Ziemba et al. (2010) but only 8 % in the accumulation mode (100 to 200 nm). The concentration of ultra-fine particles (< 100 nm diameter) at Summit likely varies seasonally as well as on shorter timescales. In the absence of year-round measurements of particle size distribution at Summit, it is not possible to fully quantify the uncertainties in N20 reported here.
To filter out data that may have been impacted by local station pollution, we omitted measurements collected when wind speeds are < 1 m s−1 and when the wind direction is such that contaminated air from station operations may have advected across the inlet (between 270 and 360∘ from true north). A comparison between two OPC-N3 optical particle counters (described further in Sect. 2.2), located at the opposite sides of camp, confirmed that these criteria are sufficient to account for the impact of local station pollution (not shown). The removal of data associated with particular surface wind conditions may bias the dataset; however, during the measurement period considered in this study wind speeds < 1 m s−1 only occur 3.4 % of the time and polluting wind directions only occur 9.1 % of the time.
2.2 Detection of fog
Supercooled liquid fog is common at Summit and occurs in all seasons, with a minimum occurrence in April and maximum in September (Cox et al., 2019). Fog droplets form on CCN and grow by condensation to typical diameters of 15 to 25 µm (Cox et al., 2019). Particles larger than ∼ 3 µm cannot pass through the CPC inlet (Fig. 2); hence, during fog events, the CPC measures the interstitial aerosol particle concentration. In this way, fog can result in extremely low surface aerosol particle concentration measurements that are not representative of the aerosol population outside of the fog (Bergin et al., 1995). In the absence of an instrument designed specifically to detect fog at Summit, we use data from an Alphasense optical particle counter (OPC-N3, Crilley et al., 2018) located next to the CPC inlet to identify fog periods.
The OPC-N3 resolves particle size distribution in 24 bins between 0.35 and 40 µm diameter. Natural aerosol particles with diameters greater than 10 µm are highly unlikely to be present in central Greenland due to the large distance from the source of any coarse-mode aerosol particles and the large dry deposition velocity of such particles (Giorgi, 1986; Jaenicke, 1990). Under this assumption, particles detected by the OPC-N3 with diameters over 10 µm must be fog droplets or ice crystals. Real-time data monitoring at Summit and comparison with visual observations for 6 months confirm that the OPC-N3 detects particles within this size range during both fog and blowing snow. At Summit, 80 % of cases of drifting or blowing snow reported by on-site observers in 2019 occurred when the 3 h mean 10 m wind speed was > 6 m s−1; we remove all cases with wind speeds above this threshold to separate fog events from possible blowing snow events. We classify fog events as when the total concentration of particles with diameters > 10 µm is greater than 0.1 cm−3. Figure 3 provides an example of the detection of fog using this methodology and the associated reduction in N20 measured by the CPC.
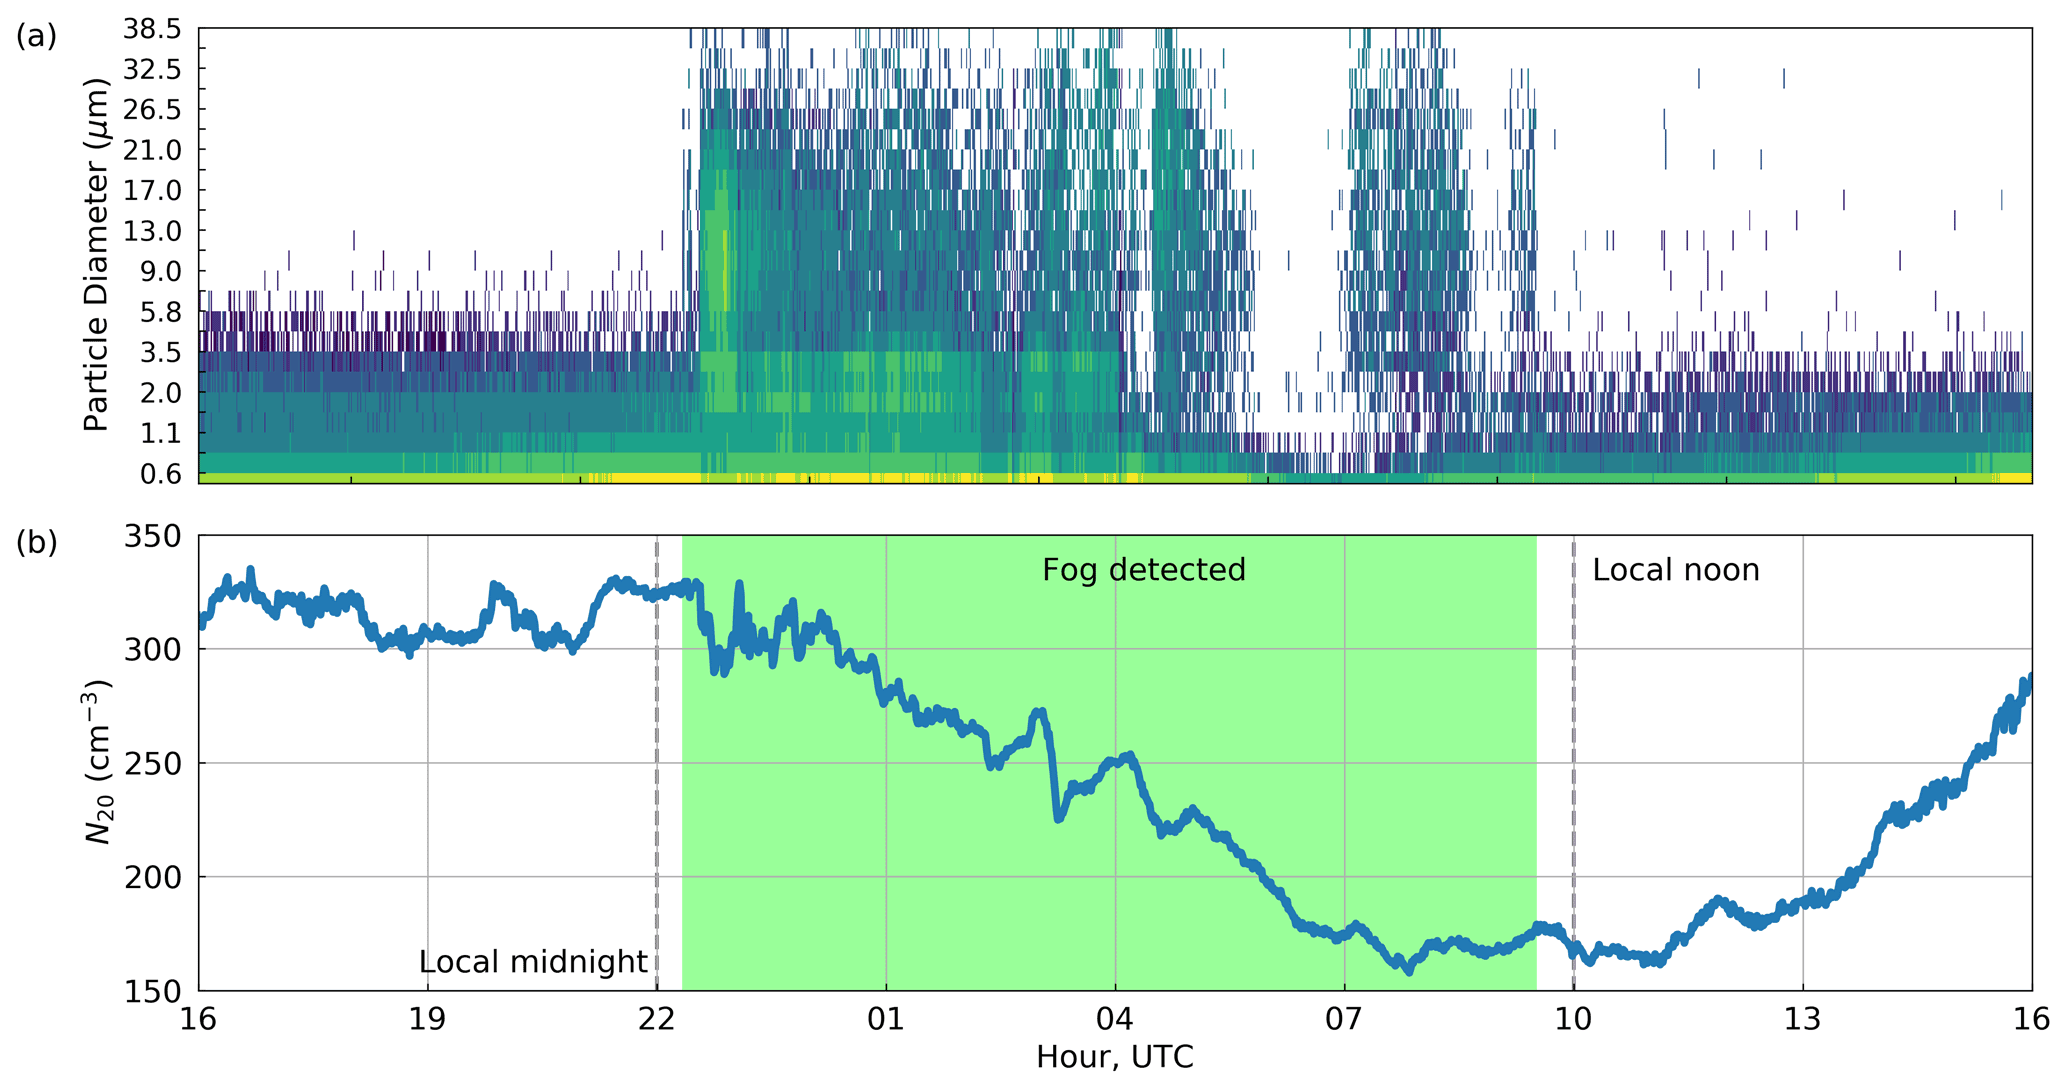
Figure 3(a) Particle size distribution from the OPC-N3 from 31 July 2019 16:00 UTC to 1 August 2019 16:00 UTC (1 min averages). (b) N20 particle number concentration from the CPC during the same period (1 min averages). The duration of the fog event identified by the methodology described in Sect. 2.2 is shaded in green.
Comparing this OPC-N3 fog classification to manual on-site observations reported at 00:00, 12:00, and 18:00 UTC daily, the OPC-N3 does not detect fog when fog is reported by the observer (false negatives) in 35 out of 152 cases (23 %). Six of these cases can be attributed to inconsistent observer log entries or to logged issues with the OPC-N3; some others may result from discrepancies between the actual and reported observation time. However, false positive detection is rare, occurring in only 6 cases (1 %). Therefore, although some fog events might be missed by the OPC-N3 fog classification, it is an accurate indicator of fog presence. The OPC-N3 was in operation between June and December 2019, and during this time the data are 96 % complete.
2.3 Detection of precipitation and blowing snow
Below-cloud wet scavenging during snowfall can also reduce surface aerosol particle concentrations (e.g. Martin et al., 1980; Paramonov et al., 2011). A precipitation occurrence sensor system (POSS) (Sheppard and Joe, 2008) located about 2 at Summit measures the Doppler velocity spectrum of hydrometeors within a 1 m3 sampling volume. Surface snowfall rate retrieved from the POSS agrees well with retrievals from the lowest reliable range gate of the millimeter cloud radar (MMCR) at Summit, with a root mean squared error of 0.08 mm h−1 (Castellani et al., 2015). The POSS power unit (the zeroth moment of the Doppler spectrum) can be used as a binary indicator of precipitation, and in this study we use a threshold of two POSS power units to identify precipitation events and exclude blowing snow, as per Pettersen et al. (2018). POSS data are 95 % complete between June and December 2019.
The wind speed threshold for blowing snow (BLSN) varies depending on temperature and the properties of surface snow (Schmidt, 1982; Mann et al., 2000). In Sect. 2.2 we used a 6 m s−1 threshold as a minimum to avoid cases of possible blowing snow. However, to positively identify BLSN events we use a 10 m wind speed threshold of ≥ 9 m s−1. During 2019, on-site observers reported blowing or drifting snow 99 % of the time when the 3 h mean wind speed was above this threshold.
2.4 Detection of surface-based temperature inversions
Surface-based temperature inversions (SBIs) occur at Summit in all seasons due to strong and persistent radiative cooling of the surface. SBIs are most common in the winter (Oct–Mar) where they occur over 70 % of the time with a typical magnitude of ∼ 5 ∘C between 10 and 2 (Miller et al., 2013). In the summer (JJA), the amplitude of SBIs is weaker, and they only occur ∼ 30 % of the time (Miller et al., 2013). SBIs limit the turbulent mixing of air (and aerosols) down to the surface, and as a result, aerosol particle concentrations measured at the surface may not be representative of concentrations at cloud level (Igel et al., 2017). To explore the effect of SBIs on surface aerosol particle concentrations in this study we classify SBI events where the 15 m minus the 2 m (above ground level) temperature difference is greater than 3 ∘C (> 0.23 ). Detection of SBI events is limited to June through October 2019 due to outages in the 15 m temperature sensor, but during this time data were 97 % complete.
2.5 Aerosol source regions and transport pathways
The FLEXPART Lagrangian particle dispersion model (Pisso et al., 2019) is used to simulate aerosol transport pathways and surface emission sensitivities throughout 2019. FLEXPART simulations were run every 6 h and driven by reanalysis data from ERA5, at the same horizontal and vertical resolution as the input data. In each simulation, 40 000 particles were released at 100 at Summit, and FLEXPART traced each particle back in time for 20 d. Particles follow the mean 3D wind field from ERA5 combined with a stochastic 3D turbulence field and parameterised convection (Forster et al., 2007). FLEXPART also simulates wet and dry deposition as linear decay constants based on a user input particle mean diameter, density, water, and ice nucleation efficiency. In both cases deposition acts to reduce the total mass of each particle, and a particle's back trajectory stops when its mass reaches zero. Due to limited prior information about aerosols at Summit, we used the default aerosol tracer species, which assumes a particle mean diameter of 0.25 µm, density of 1400 kg m−3, and water and ice nucleation efficiencies of 0.9 and 0.1, respectively. Particles of 0.25 µm diameter are efficiently measured by the CPC at Summit (Fig. 2), fall within the typical size range of Arctic CCN (e.g. Jung et al., 2018), and have the relatively long atmosphere lifetimes necessary for advection over the GrIS (> 10 d in the middle-upper troposphere; Jaenicke, 1990). FLEXPART outputs gridded emission sensitivity and supplementary back trajectory data that include the mean (centroid) back trajectory of all particles for each simulation, as well as the percentage of particles within the planetary boundary layer (PBL) at each time step. The surface emission sensitivity is proportional to the total amount of time that all particle back trajectories have spent near the surface (0–2000 m) during the simulation period, representing the probability that aerosol particles emitted from each grid cell would have been detected at Summit at the simulation start time. We plot surface emission sensitivity as a percentage of the maximum value to facilitate comparisons between figures.
3.1 Surface aerosol particle number concentrations at Summit, 2019–2020
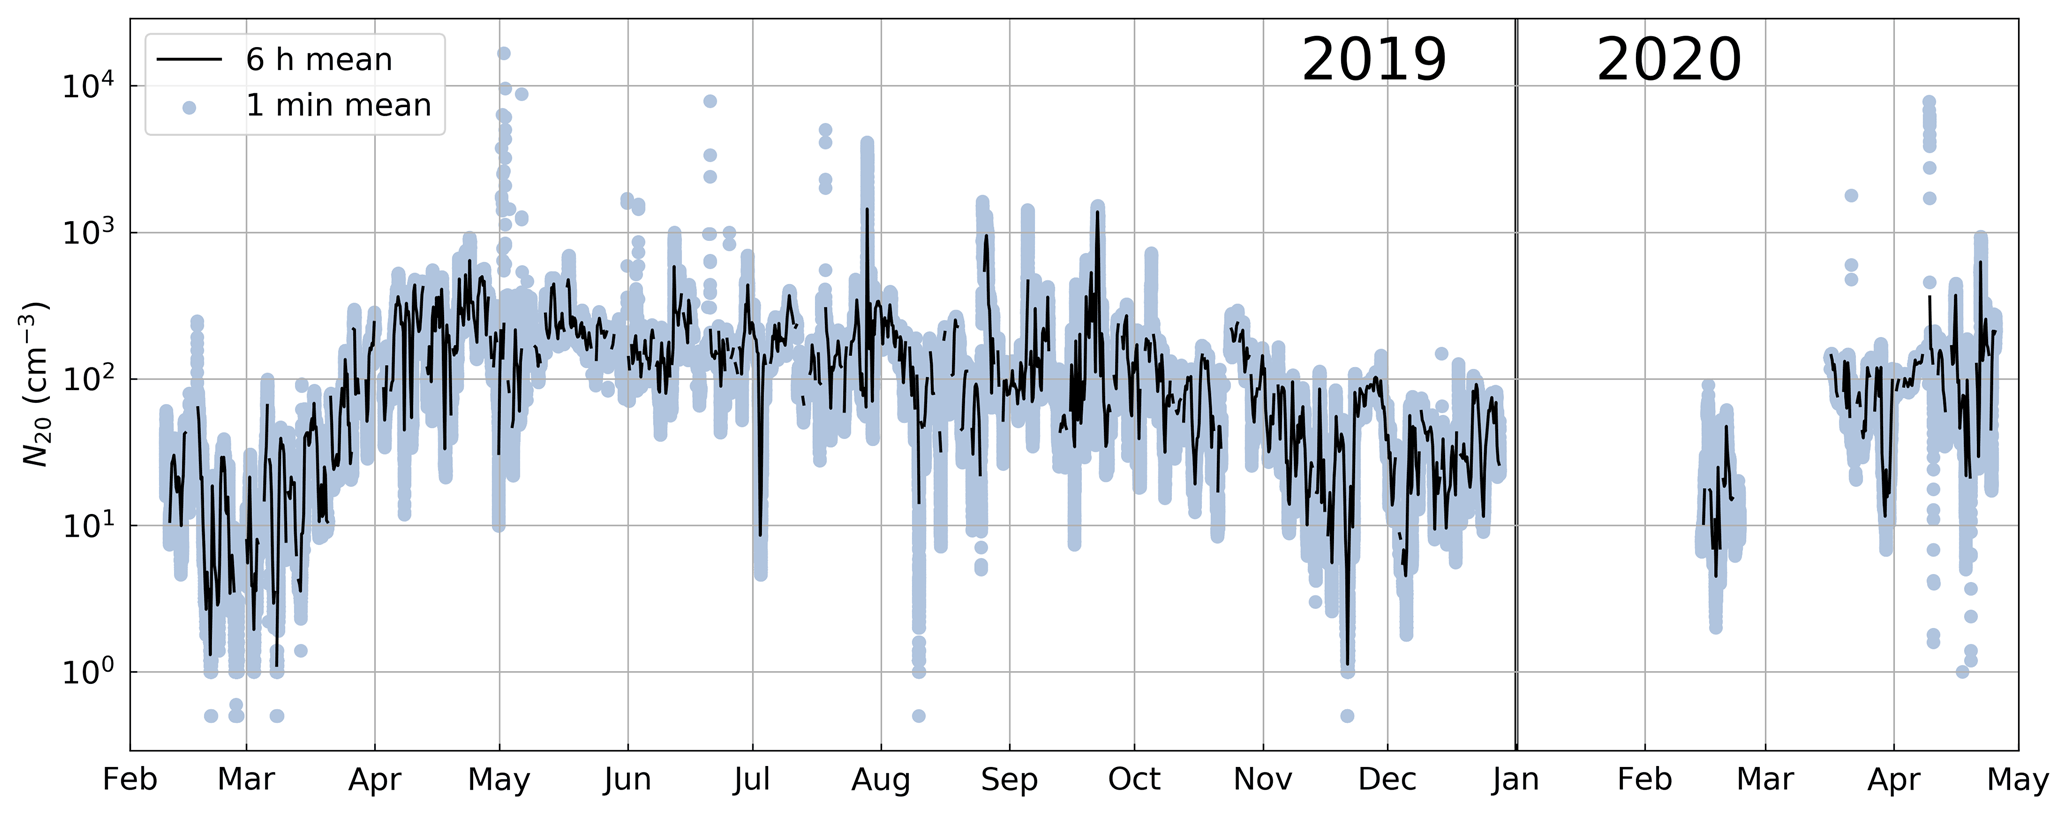
The mean surface N20 in 2019 was 129 cm−3, with the 6 h mean ranging between 1 and 1441 cm−3 (Fig. 4). The minimum N20 in 2019 at Summit occurs in late February and early March, followed by a sharp increase of 2 orders of magnitude throughout March and April (Fig. 4). Between May and October, concentrations are fairly consistent and on the order of 100 cm−3 before decreasing again between October and December. Although data in early 2020 are limited, a similar increase in concentrations between February and May is apparent (Fig. 4).
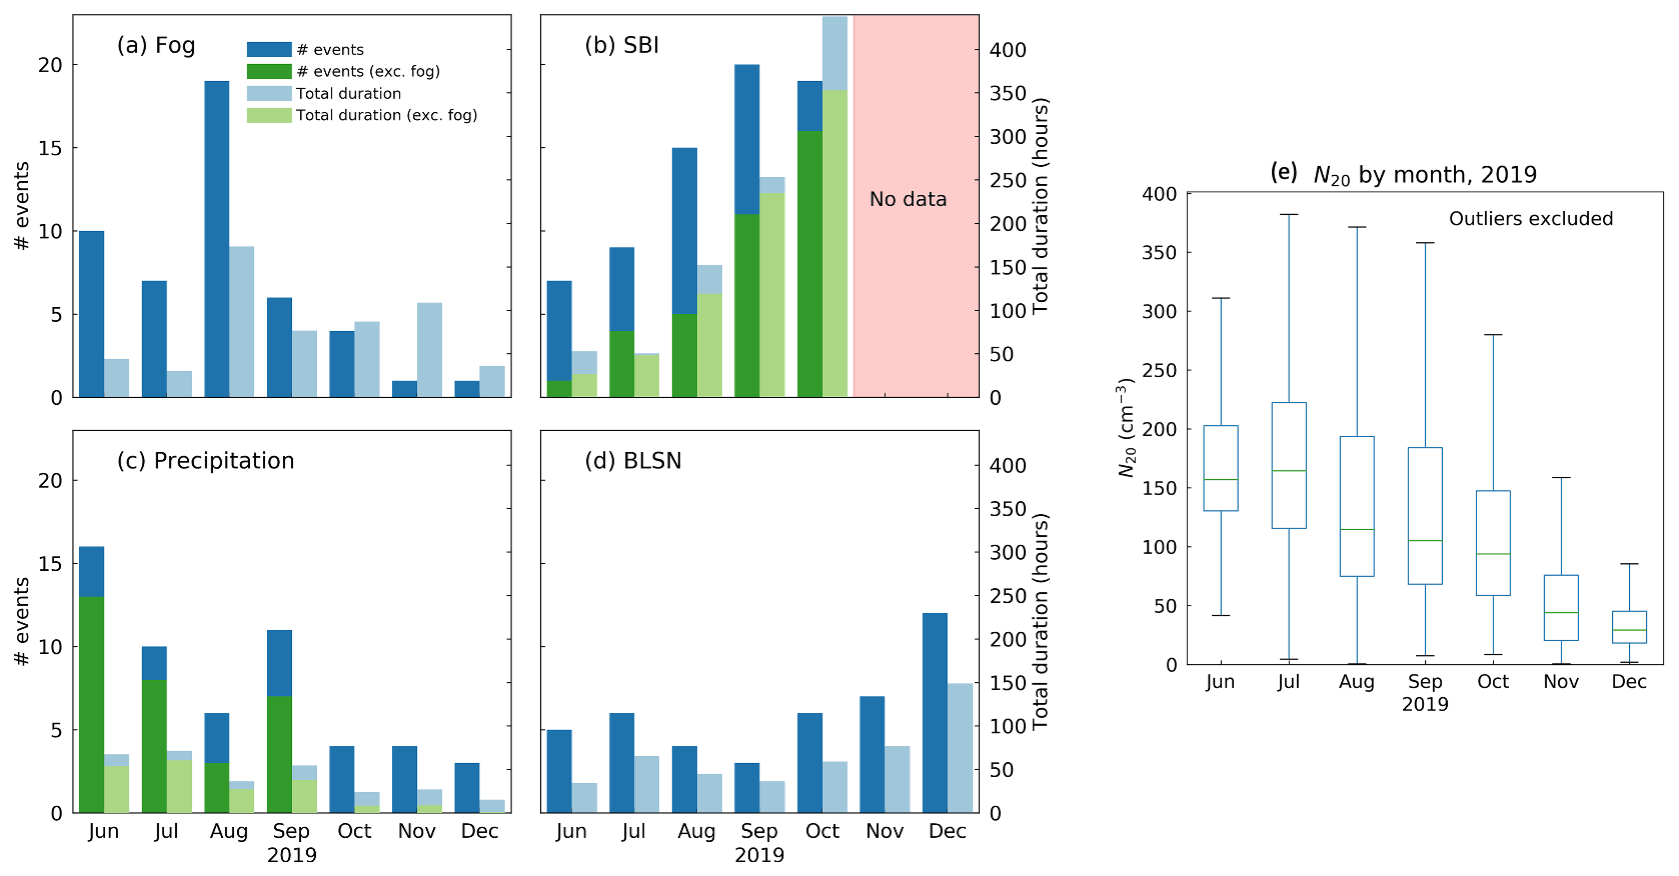
Figure 5Frequency and duration of (a) fog events, (b) surface-based temperature inversion events, (c) precipitation events, and (d) blowing snow events, detected between June and December 2019 using the methodology described in Sects. 2.2–2.4. Blue bars include all events, and green bars show the change in distribution for SBI and precipitation events after the removal of events containing fog. (e) The distribution of N20 for the same months, excluding outliers.
3.2 The effect of local surface processes on aerosol particle concentrations
The OPC-N3 identified 48 distinct fog events whilst it was operational between June and December 2019. The longest cumulative fog duration was in August (Fig. 5a) when fog was present for ∼ 23 % of the month, consistent with previous multi-year observations of supercooled liquid fogs at Summit (Cox et al., 2019). The mean duration of fog events was 3.3 h, and the longest event lasted 9.8 h.
SBI events were also present in all months and increased in total duration from summer to winter (Fig. 5b), again consistent with previous observations (Miller et al., 2013). The average duration of SBI events was 8.4 h, and the longest individual event lasted 5.8 d. SBI and fog events are not independent since fog condensate often forms due to surface cooling associated with the establishment of SBIs (e.g. Cox et al., 2019). Just under half of all detected SBI events also contained fog (Fig. 5b), although because fog events are typically shorter, this only accounted for 17 % of the total SBI duration.
Precipitation frequency and duration was highest in the summer and lowest in November and December (Fig. 5c). The average duration of precipitation events was 2.9 h, and the longest event lasted 14.1 h. In contrast, BLSN events occurred most frequently in November and December, with an average duration of 6.9 h (Fig. 5d). The seasonal distribution and duration of precipitation and BLSN events are also consistent with previous multi-year observations (Castellani et al., 2015; Pettersen et al., 2018; Bennartz et al., 2019; Cox et al., 2019). Fog was detected during 23 of the 54 precipitation events (Fig. 5c). Because the OPC-N3 does not distinguish between fog and BLSN, it is not possible to determine how often fog might have been present during BLSN events. However, because of the high concentrations of ice crystals during blowing snow events, any supercooled water droplets are likely to be removed either through riming or through the WBF process.
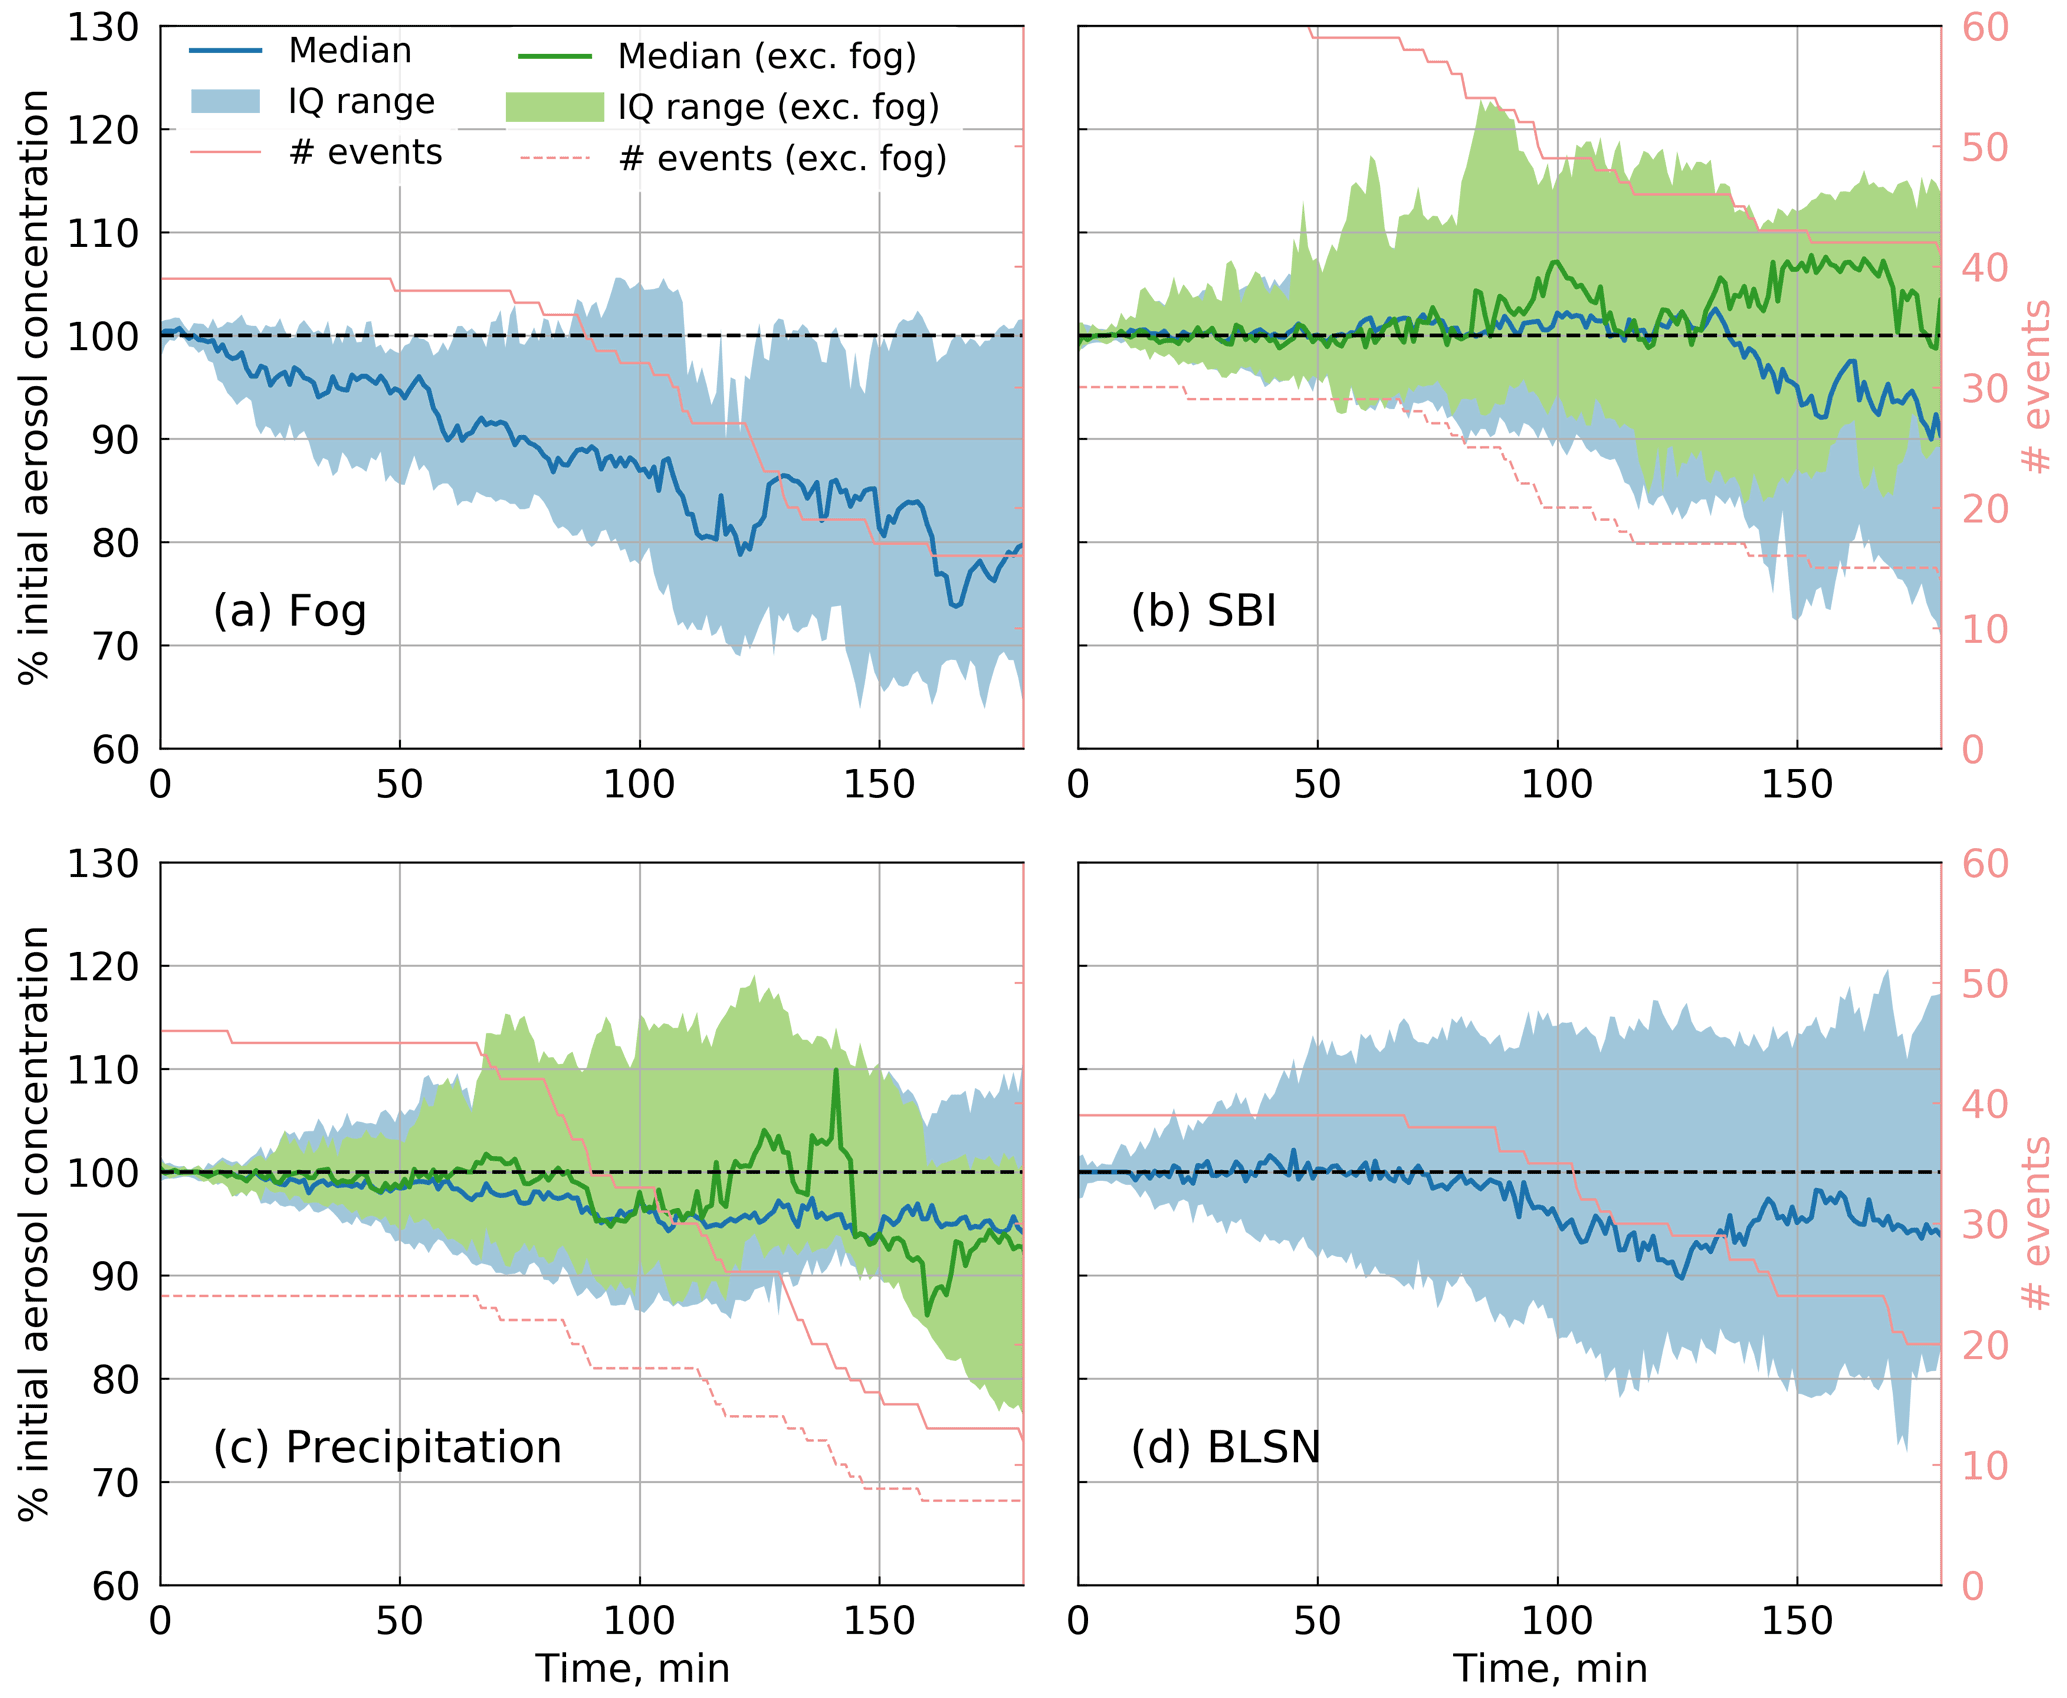
Figure 6The change in surface aerosol particle concentration (%) over time during the first 3 h of each event for (a) fog, (b) surface-based temperature inversions, (c) precipitation, and (d) blowing snow events. The thick blue line and blue shading are the median and interquartile range of all events; the thick green line and green shading are the median and interquartile range for SBI and precipitation events that do not contain fog. The pink line indicates the total number of events at each time step for all events (solid) and excluding fog events (dashed).
Figure 6 shows the median change in N20 during the first 3 h of each event type. Only during fog events is there a consistent change: after 3 h, the majority of fog events show a reduction in N20 by up to 35 % (Fig. 6a). For SBI events, there is very little discernible change in N20 during the first 2 h (Fig. 6b). After ∼ 140 min there is a small median reduction in N20 that is not present when events that contain fog are omitted. During both precipitation and BLSN events, the median change in N20 remains close to zero (Fig. 6c and d).

Figure 7(a) Surface pressure anomaly (3 d mean, solid black line) and N20 anomaly (3 d median, dashed) during 2019. Red and blue shading highlight high- and low-aerosol-concentration events, respectively (high/low events are where the N20 anomaly is above the 75th/below the 25th percentile). (b) The mean and interquartile range in surface pressure anomaly across all high (red) and low (blue) N20 events, for the 72 h before and after the maximum (minimum) N20 for each high (low) event.
3.3 Synoptic controls on surface aerosol particle concentrations
Here we explore the general relationship between N20 and synoptic conditions during 2019. Because both N20 and variables that change on synoptic timescales (i.e. surface pressure, geopotential height) vary seasonally, this seasonal dependence is removed prior to analysis. To calculate N20 anomalies we subtract the monthly median value for 2019. For all other variables (from GML-MET, 2020, and ERA5) anomalies are calculated by subtracting the 10-year (2009–2019) monthly mean climatology. Generally throughout 2019 anomalous changes in the 3 d mean surface pressure are in phase with anomalous 3 d median N20, with some exceptions (Fig. 7a). To look at typical synoptic conditions associated with anomalous N20 at Summit, we look at high- and low-N20 events, where the 3 d median N20 anomaly is greater than the 75th percentile or less than the 25th percentile, respectively. To avoid oversampling, any events separated by less than 4 d are combined into a single event. The resulting high- and low-N20 events are highlighted in Fig. 7a and are spread evenly throughout the annual cycle (15 high events and 14 low events).
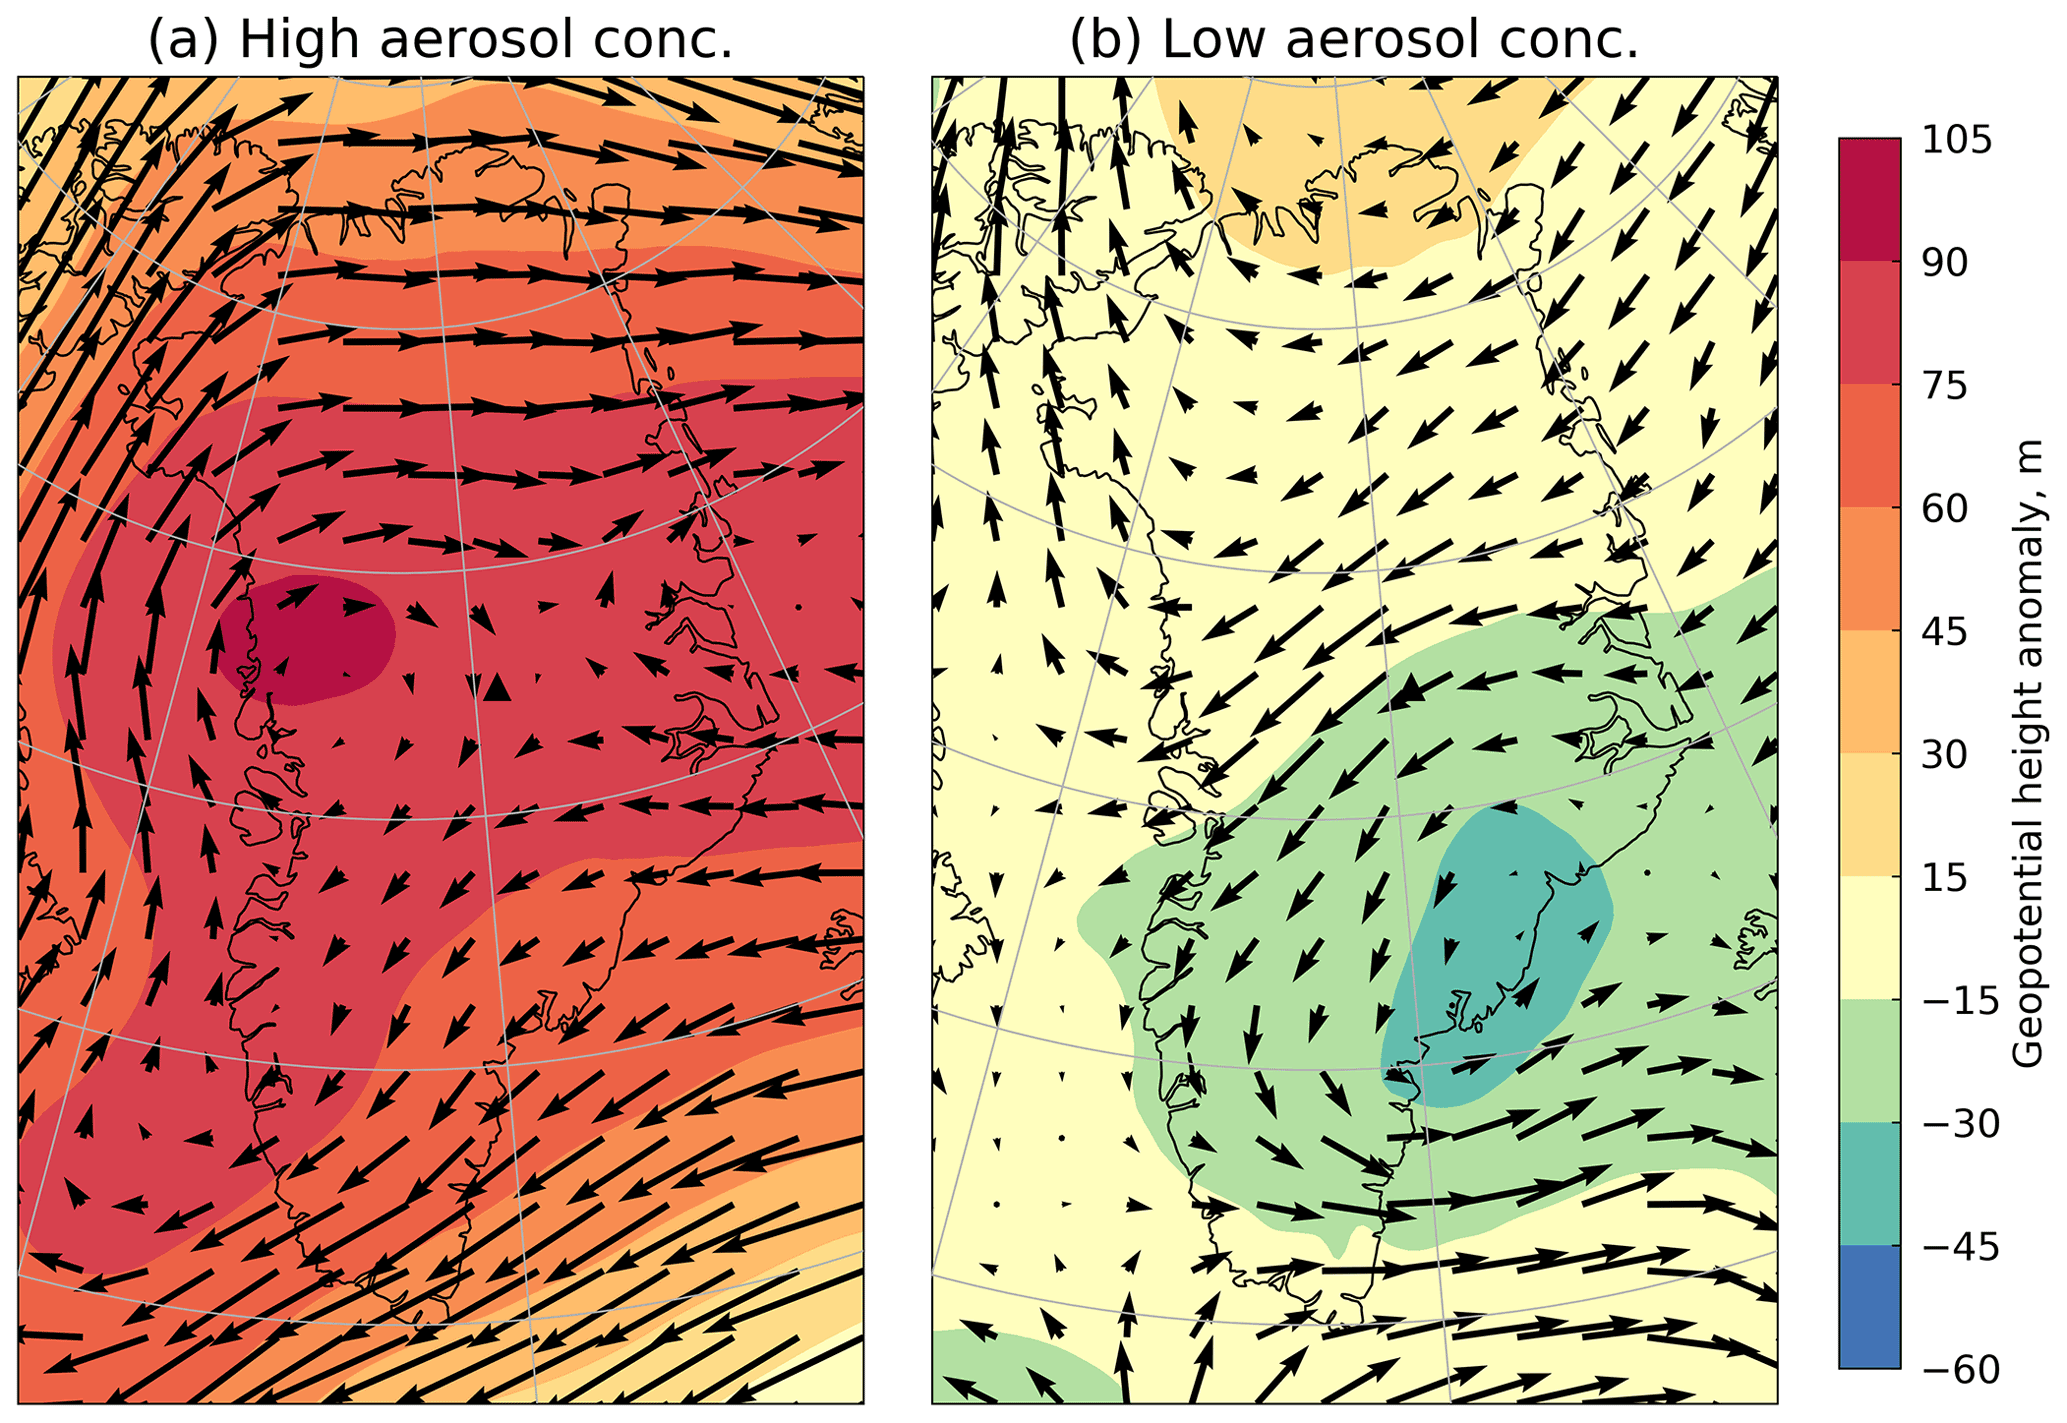
Figure 8ERA5 mean 500 hPa geopotential height anomaly (shaded) and 500 hPa horizontal wind anomalies (barbed) for all high-N20 events (a) and low-N20 events (b).
On average, an increase in surface pressure anomaly precedes anomalously high-N20 events, with the maximum N20 coinciding with surface pressure anomalies levelling off (Fig. 7b). In contrast, a decrease in surface pressure anomaly precedes the majority of low-N20 events, with the minimum N20 coinciding with the minimum surface pressure anomaly on average (Fig. 7b). Averaged over all high-N20 events, 500 hPa geopotential heights are anomalously high (by over 75 m in central Greenland), and there is an anomalous anti-cyclonic circulation over the GrIS (Fig. 8a). In contrast, when averaged over the low-N20 events, there is a region of anomalously low geopotential heights and anomalous cyclonic circulation centred on south-east Greenland (Fig. 8b).
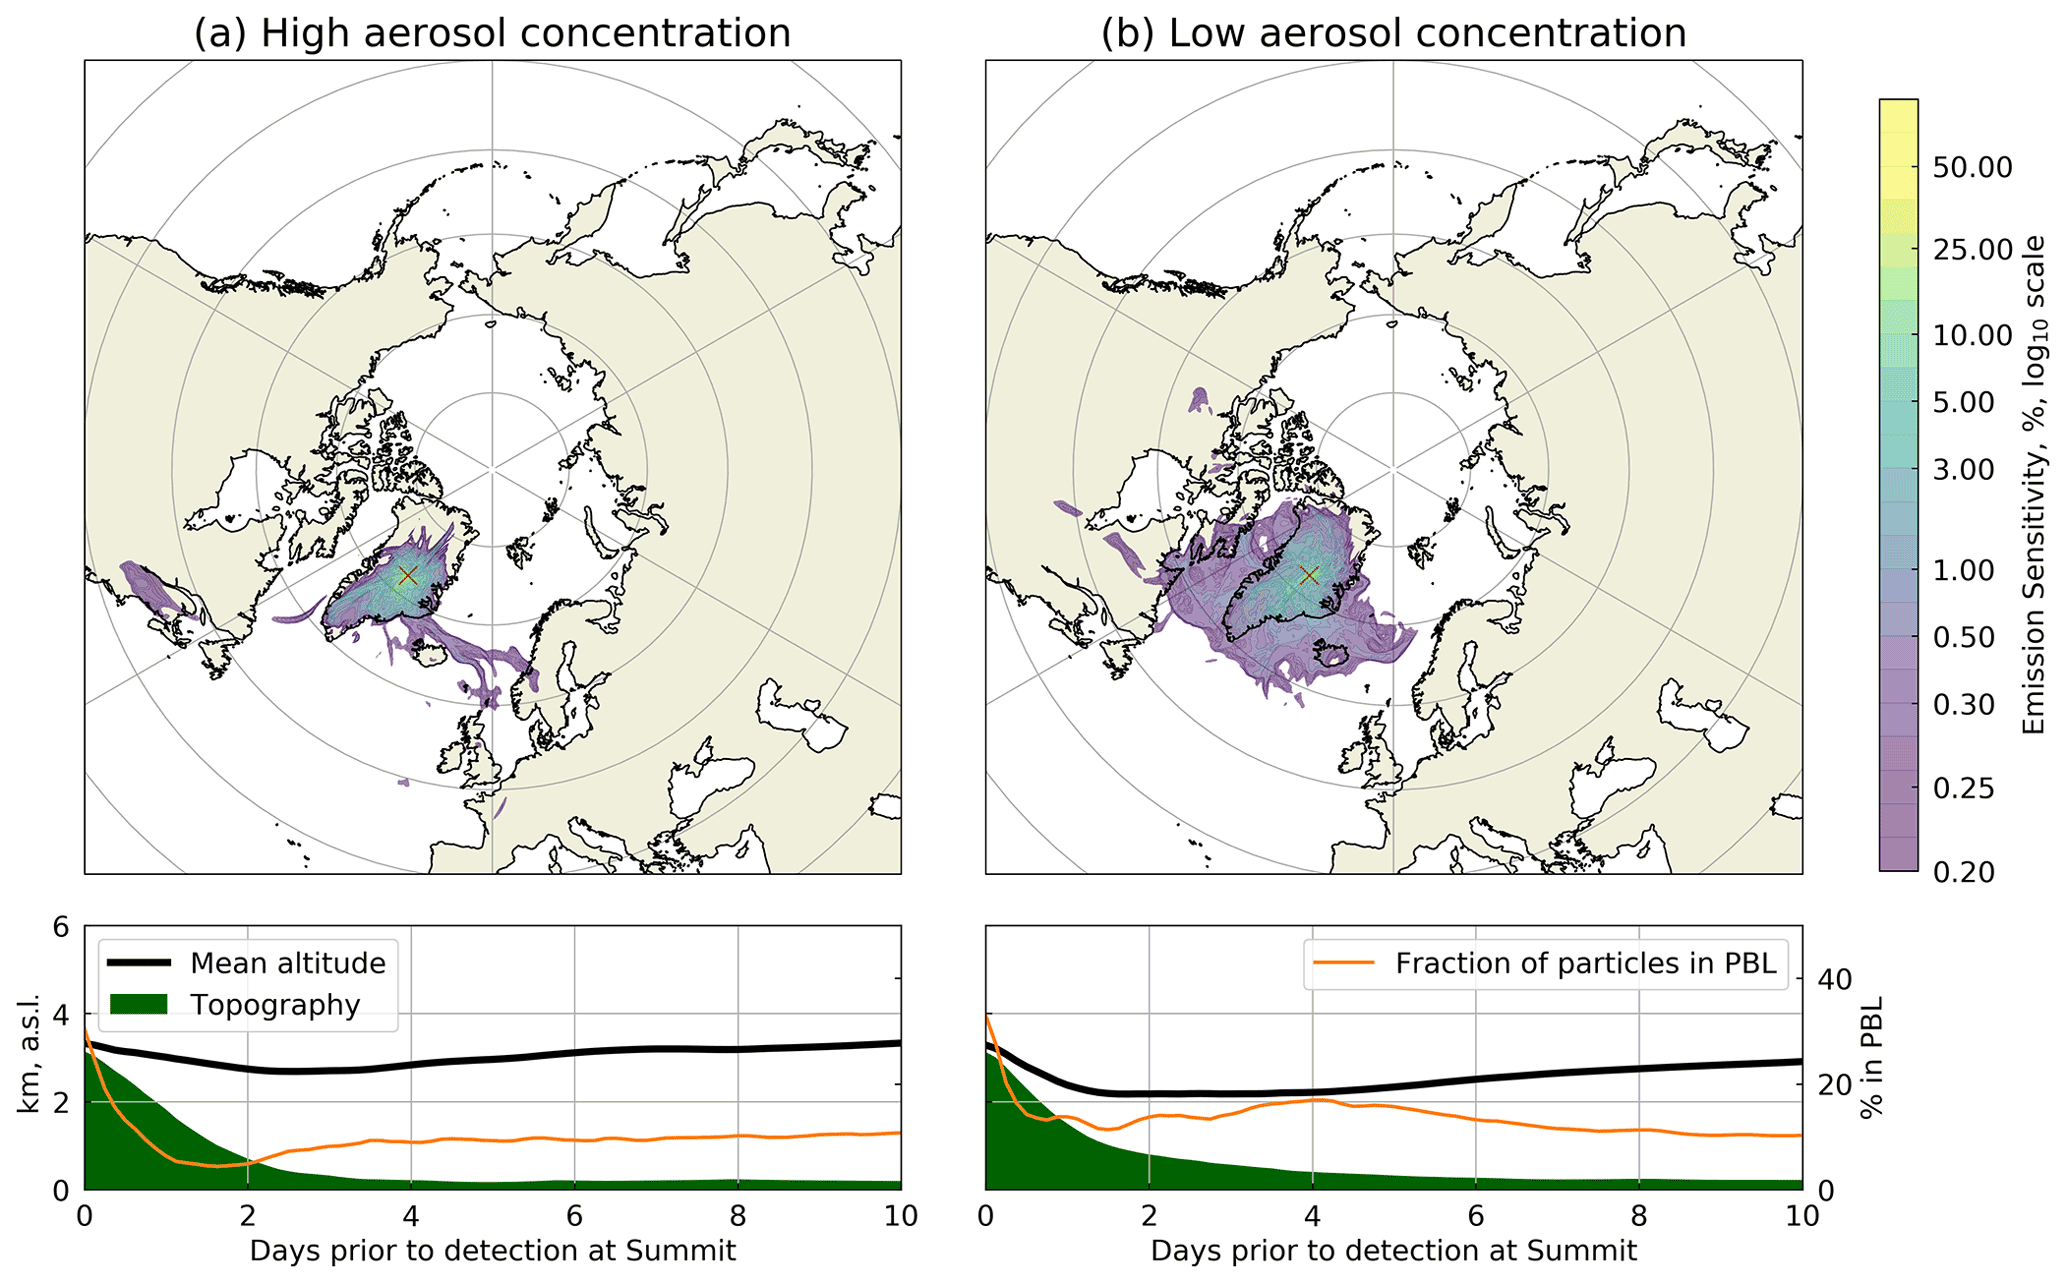
Figure 9Results from FLEXPART back trajectory simulations averaged over the high-N20 events (a) and the low-N20 events (b). Upper: surface emission sensitivity aggregated over 20 d prior to detection at Summit (as a percentage of the maximum value). Lower: mean altitude and fraction of particles within the planetary boundary layer (PBL) for all simulated particles over the 10 d prior to detection.
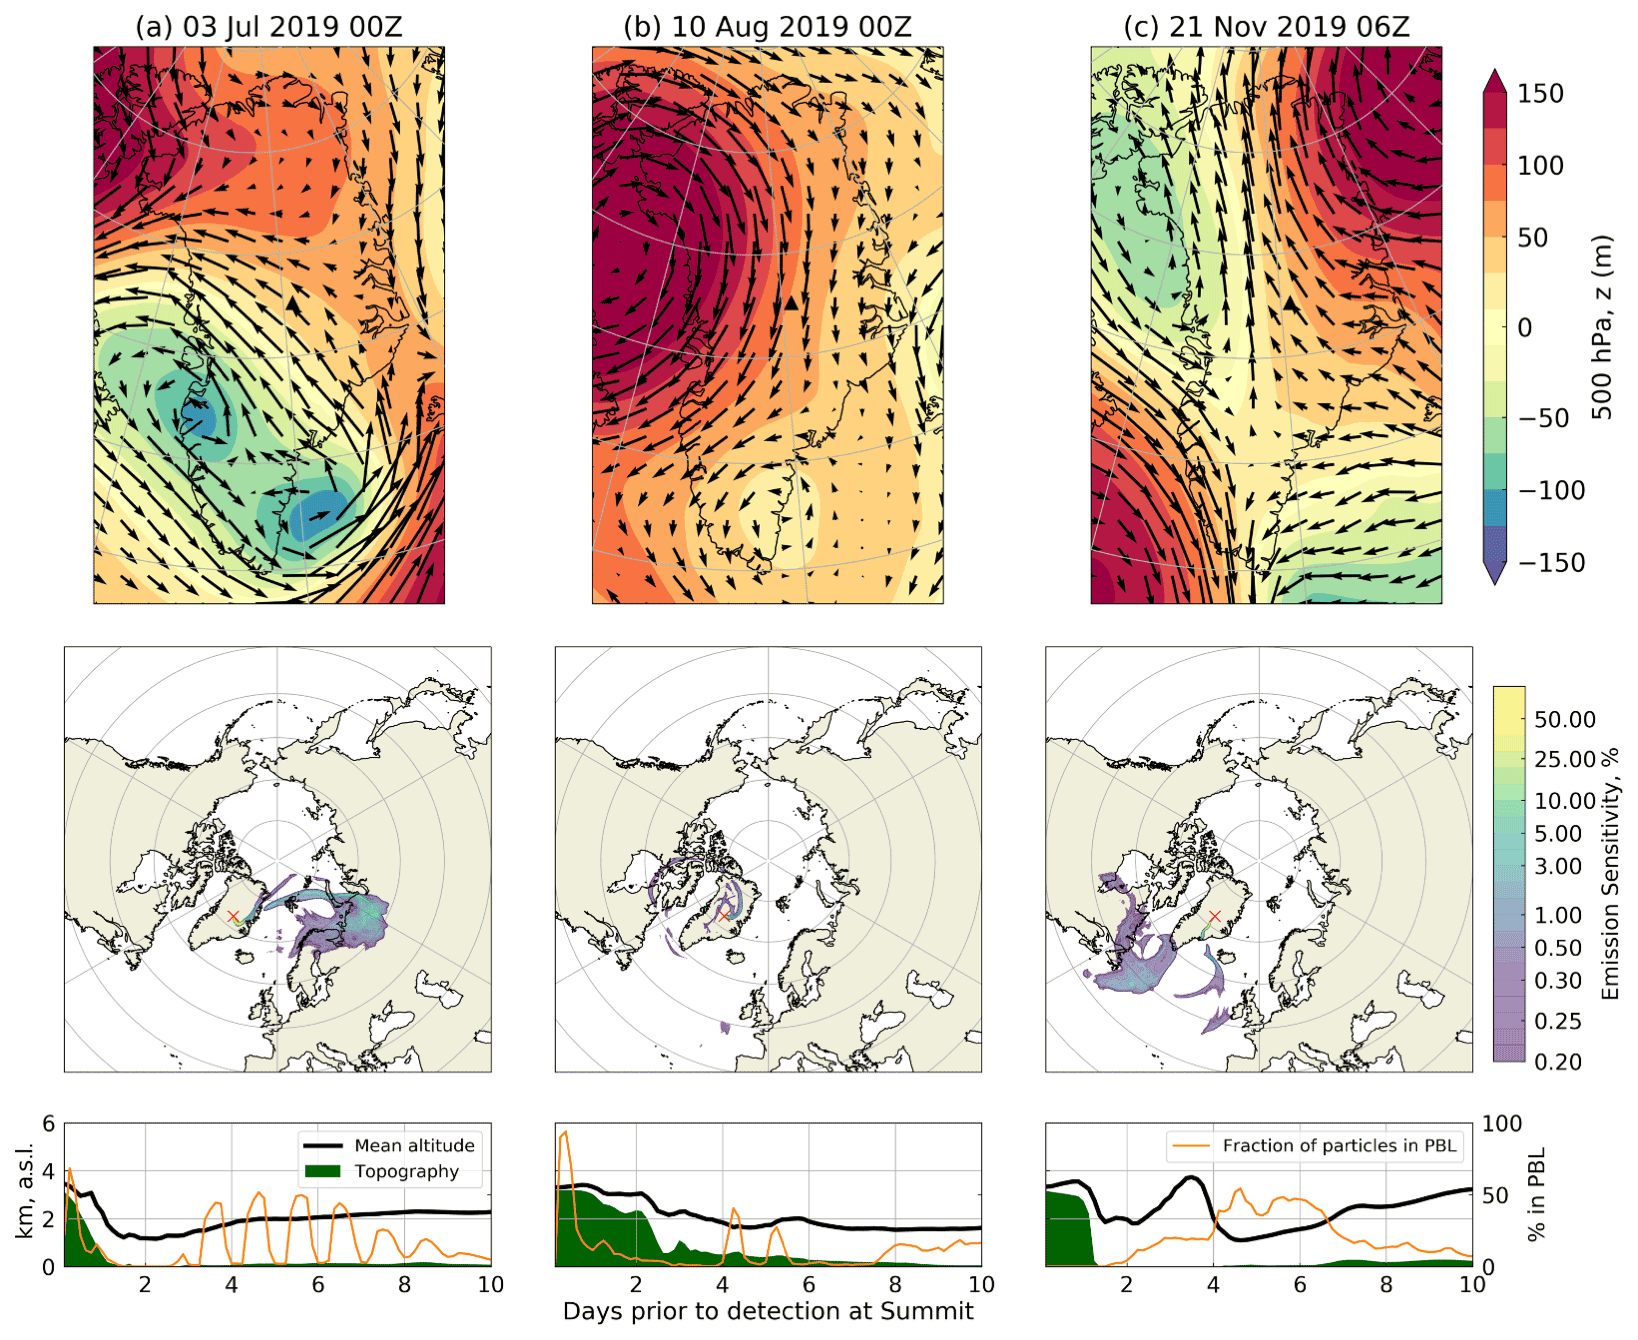
Figure 10Synoptic anomaly plots and aerosol transport pathways during the three low-N20 cases studies. Upper row: 500 hPa geopotential height and horizontal wind anomalies from ERA5. Middle row: FLEXPART surface emission sensitivity (as a percentage of the maximum value) over the 10 d prior to aerosol detection at Summit. Lower row: FLEXPART mean aerosol transport height (back bold line) and percentage of particles within the planetary boundary layer (orange line) over the 10 d prior to detection at Summit. The shaded green area represents the mean height of topography beneath all particles.
FLEXPART simulations of surface emission sensitivity during the high-N20 events show that sensitivity to surface emissions in the 20 d prior to detection at Summit outside of the ice sheet itself is rare (Fig. 9a), although there is some sensitivity to emissions from North America and Europe. Because there are no significant aerosol sources over the ice sheet itself, this implies that most of the simulated particles arriving at Summit during these events have been high in the atmosphere (> 2000 ) for over 20 d prior to detection at Summit. This is supported by the low percentages of simulated particles in the planetary boundary layer and relatively high mean altitude of all simulated particles during the high-N20 events (Fig. 9a). In contrast, the surface emission sensitivity during the low-N20 events covers a broader area, encompassing coastal Greenland, Iceland, the Canadian Arctic, and the intervening north Atlantic Ocean (Fig. 9b). There is a much higher percentage of simulated particles in the boundary layer in the week preceding detection at Summit during the low-N20 events than during the high-N20 events, and during the low-N20 events the simulated particles are transported up to the highest point of the ice sheet from lower elevations (Fig. 9b).
3.4 Case studies of potential aerosol-limited cloud regimes at Summit
Figure 4 demonstrates that N20 falls below 10 cm−3 in all seasons at Summit, suggesting that surface CCN concentrations fall below this threshold even more frequently. Given the existing evidence that aerosol particle concentrations this low can limit cloud formation elsewhere in the Arctic (Mauritsen et al., 2011; Stevens et al., 2018), we hypothesise that fog formation can be limited by low CCN concentrations over central Greenland and, if there are occasions where the surface aerosol particle concentration is representative of concentration at cloud height, that cloud formation can be limited by low CCN concentrations too. In this section we look in detail at three events where extremely low aerosol particle concentrations (N20 < 10 cm−3 for > 3 h) coincided with cloud dissipation in the absence of fog to look for further evidence of CCN-limited cloud regimes at Summit. All times throughout the discussion of these case studies are given in UTC.
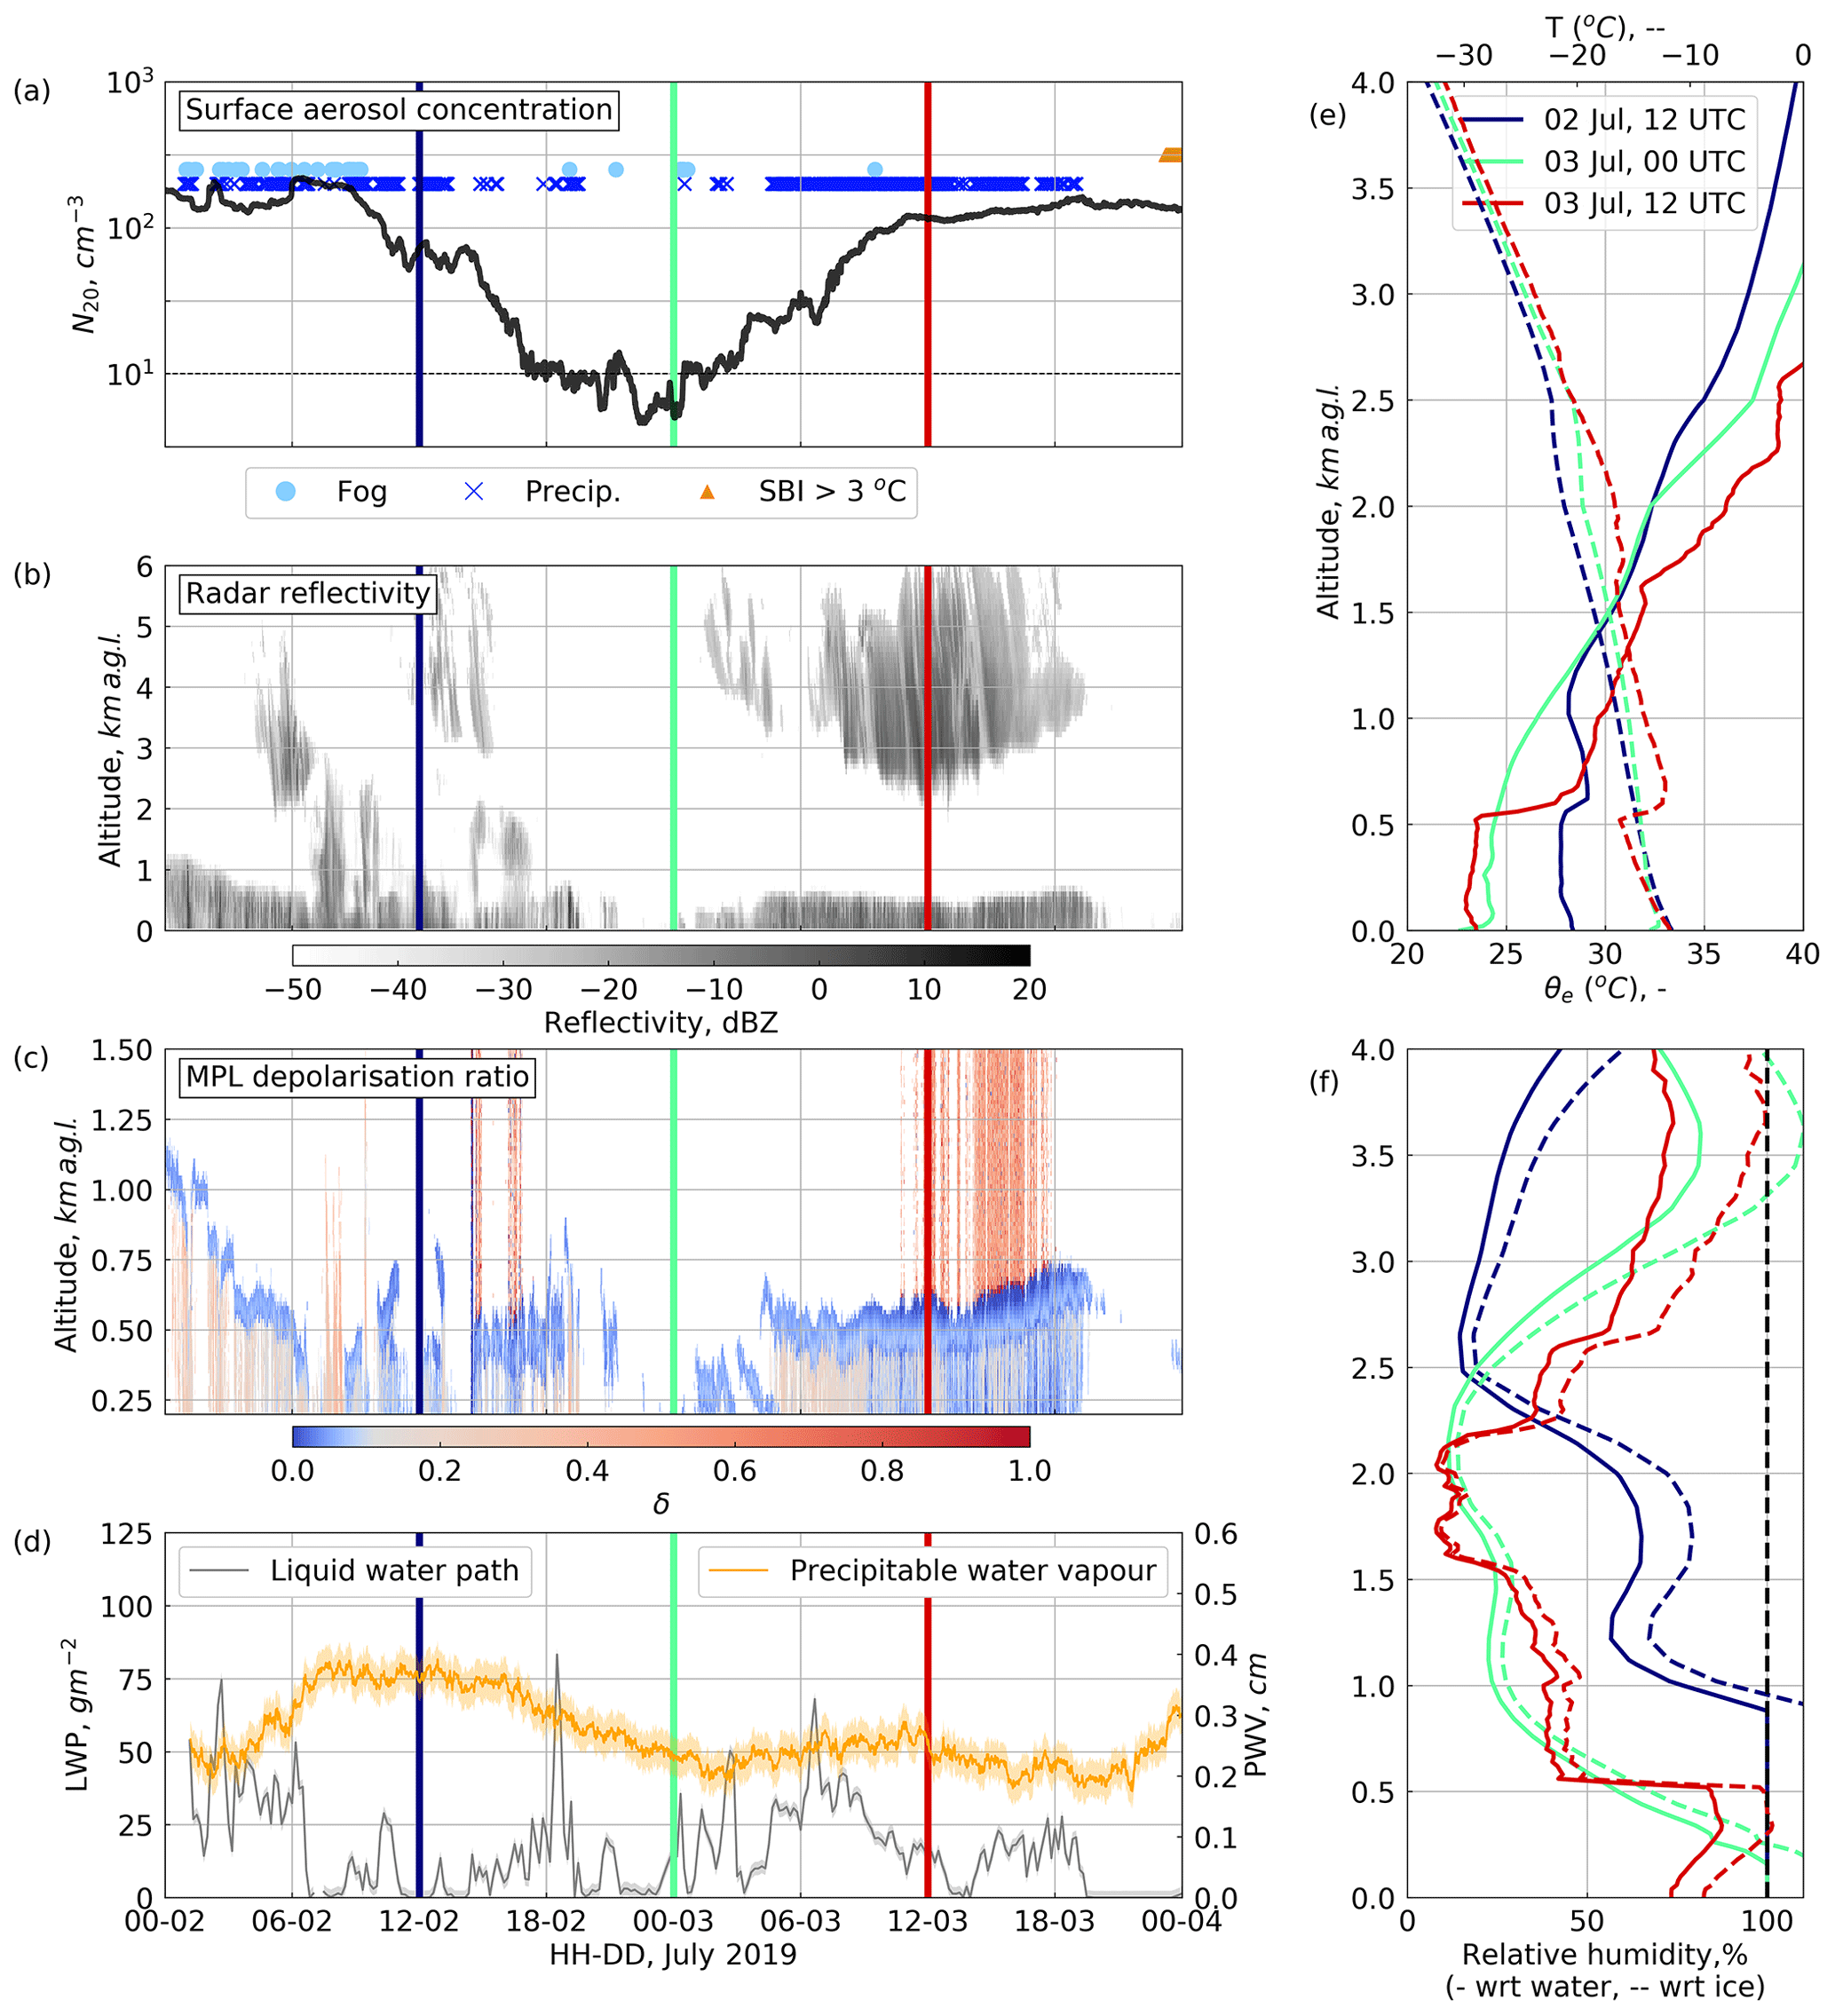
Figure 11Conditions during the 3 July 2019 low-aerosol case study. (a) Surface N20 (CPC), with occurrences of fog (OPC-N3), precipitation (POSS), and SBI > 3 ∘C events indicated. (b) Radar reflectivity (MMCR). (c) Lidar depolarisation ratio (MPL); blue colours represent liquid droplets and reds are ice crystals. (d) Column integrated liquid water path and precipitable water vapour (MWR). (e) Temperature (dashed) and equivalent potential temperature (solid) radiosonde profiles. (f) Relative humidity with respect to water (solid) and ice (dashed) from radiosonde profiles. The coloured vertical lines on the left-hand plots correspond to the time of each vertical radiosonde profile in the right-hand plots.
For each of the three cases considered (3 July 2019, 10 August 2019, and 21 November 2019), air is advected to the top of the ice sheet from different directions: on 3 July 2019, the primary aerosol source region is northern Siberia (Fig. 10a); on 10 August 2019, air approaches Summit from the north via the Canadian Arctic Archipelago (Fig. 10b); and on 21 November 2019, air approaches Summit from the south-east and is sensitive to emissions from northern Quebec (Fig. 10c). Two of the three case studies (3 July 2019 and 21 November 2019) occur in the presence of anomalously low 500 hPa geopotential heights over south-east Greenland, with a stronger-than-usual south-easterly wind component drawing air up the ice sheet from the south-east coast (Fig. 10a and c). On both of these occasions > 50 % of particles are within the PBL 4–6 d prior to arrival at Summit. On the 10 August 2019 case, there is an anomalous region of high 500 hPa geopotential heights over north-west Greenland and a stronger-than-usual northerly wind component over Summit (Fig. 10b). Although the FLEXPART-simulated particles remain closer to the ground for a longer period of time, the percentage of particles within the PBL in the 10 d prior to detection at Summit is much lower on 10 August 2019 than in the other two cases (Fig. 10b). On all three occasions, air is advected up to the ice sheet to Summit from lower elevations and spends > 1 d prior to detection at Summit within the lowest 800 m a.g.l. over the GrIS. The local conditions associated with each case are outlined below.
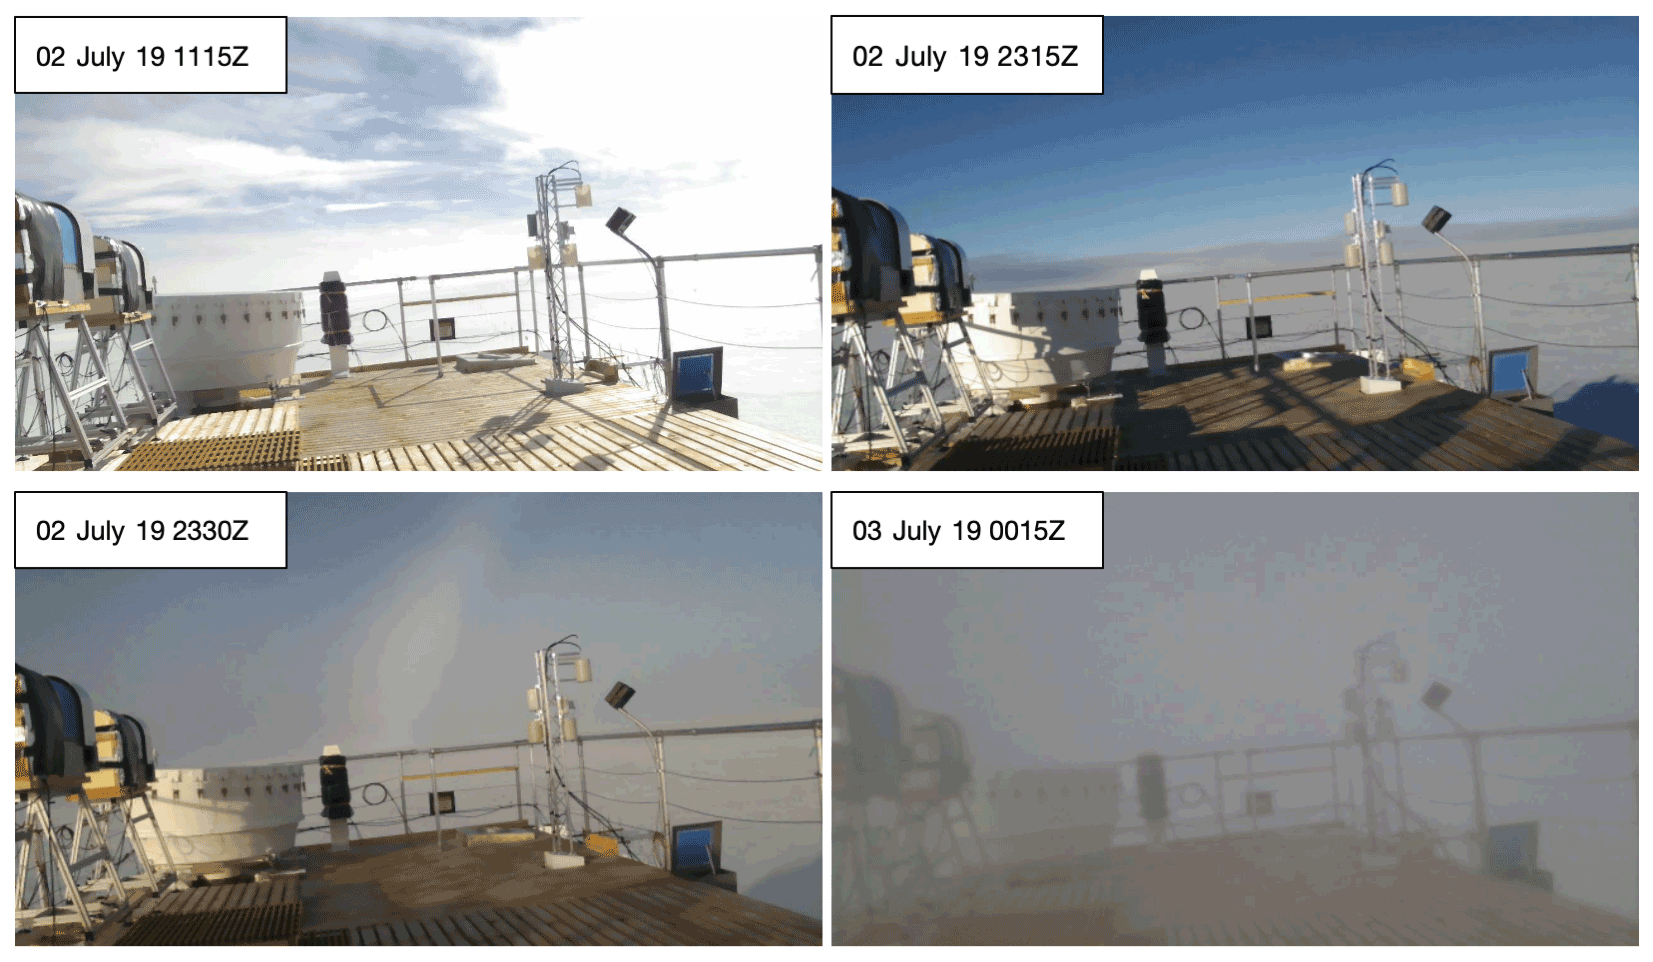
Figure 12Photographs from a webcam oriented towards the eastern horizon on 2 and 3 July 2019. The aerosol inlet is visibly mounted on the mast in the SE corner.
3.4.1 3 July 2019
On 2 July 2019, N20 dropped rapidly from ∼ 200 to < 10 cm−3 over a period of ∼ 9 h (Fig. 11a). The 12:00 equivalent potential temperature profile on 2 July 2019 shows that the lowest layer of broken stratocumulus cloud existed within a well-mixed boundary layer (Fig. 11e). Shortly after 18:00, N20 dropped below 10 cm−3, and there was a reduction in cloud cover (Fig. 11a–c). The on-site observer log recorded a transition from broken altocumulus at 18:00 to few clouds and unlimited visibility at 00:00 on 3 July 2019, despite the fact that the lowest 200 remained saturated with respect to water (Fig. 11f). On this occasion, the 00:00 radiosonde was launched from the surface at 23:15, and typically the weather observation is recorded at the time of launch. Photographs from a webcam viewing the aerosol inlet (taken every 15 min and orientated towards the eastern horizon) confirm that skies were clear and visibility was good at 23:15, but by 23:30 there was a clearly visible fog bow, indicating liquid fog droplets (Fig. 12). Notably on this occasion, N20 fell to < 10 cm−3 in the absence of fog. At 00:15 visibility was obscured and the OPC-N3 detected fog at the surface (Fig. 12). The fact that the OPC-N3 did not detect fog droplets until 00:15, despite an increase in LWP at 23:30 (Fig. 11d), could be explained by the fact that either (a) the droplets forming the fog bow at 23:30 were too large to be detected by the OPC-N3 (> 40 µm diameter) or (b) the fog was in the process of descending to the surface. In either case, both (a) and (b) support the hypothesis of Mauritsen et al. (2011) – that in the absence of sufficient CCN, any existing CCN activate and grow to relatively large sizes, falling to the surface as drizzle.
The rapid transition from clear skies (despite a saturated surface layer) at 23:15 to fog at 00:15 coincided with N20 beginning to increase again (Fig. 11a). As N20 continued to increase, a thin low-level mixed-phase cloud returned and gradually lifted and thickened. By 12:00 on 3 July 2019, N20 had returned to ∼ 200 cm−3, and the lowest cloud layer had developed into a typical Arctic mixed-phase cloud (Shupe et al., 2006; Morrison et al., 2012; Shupe et al., 2013b) with a cloud top close to 500 m (Fig. 11c), capping a well-mixed boundary layer (Fig. 11e).
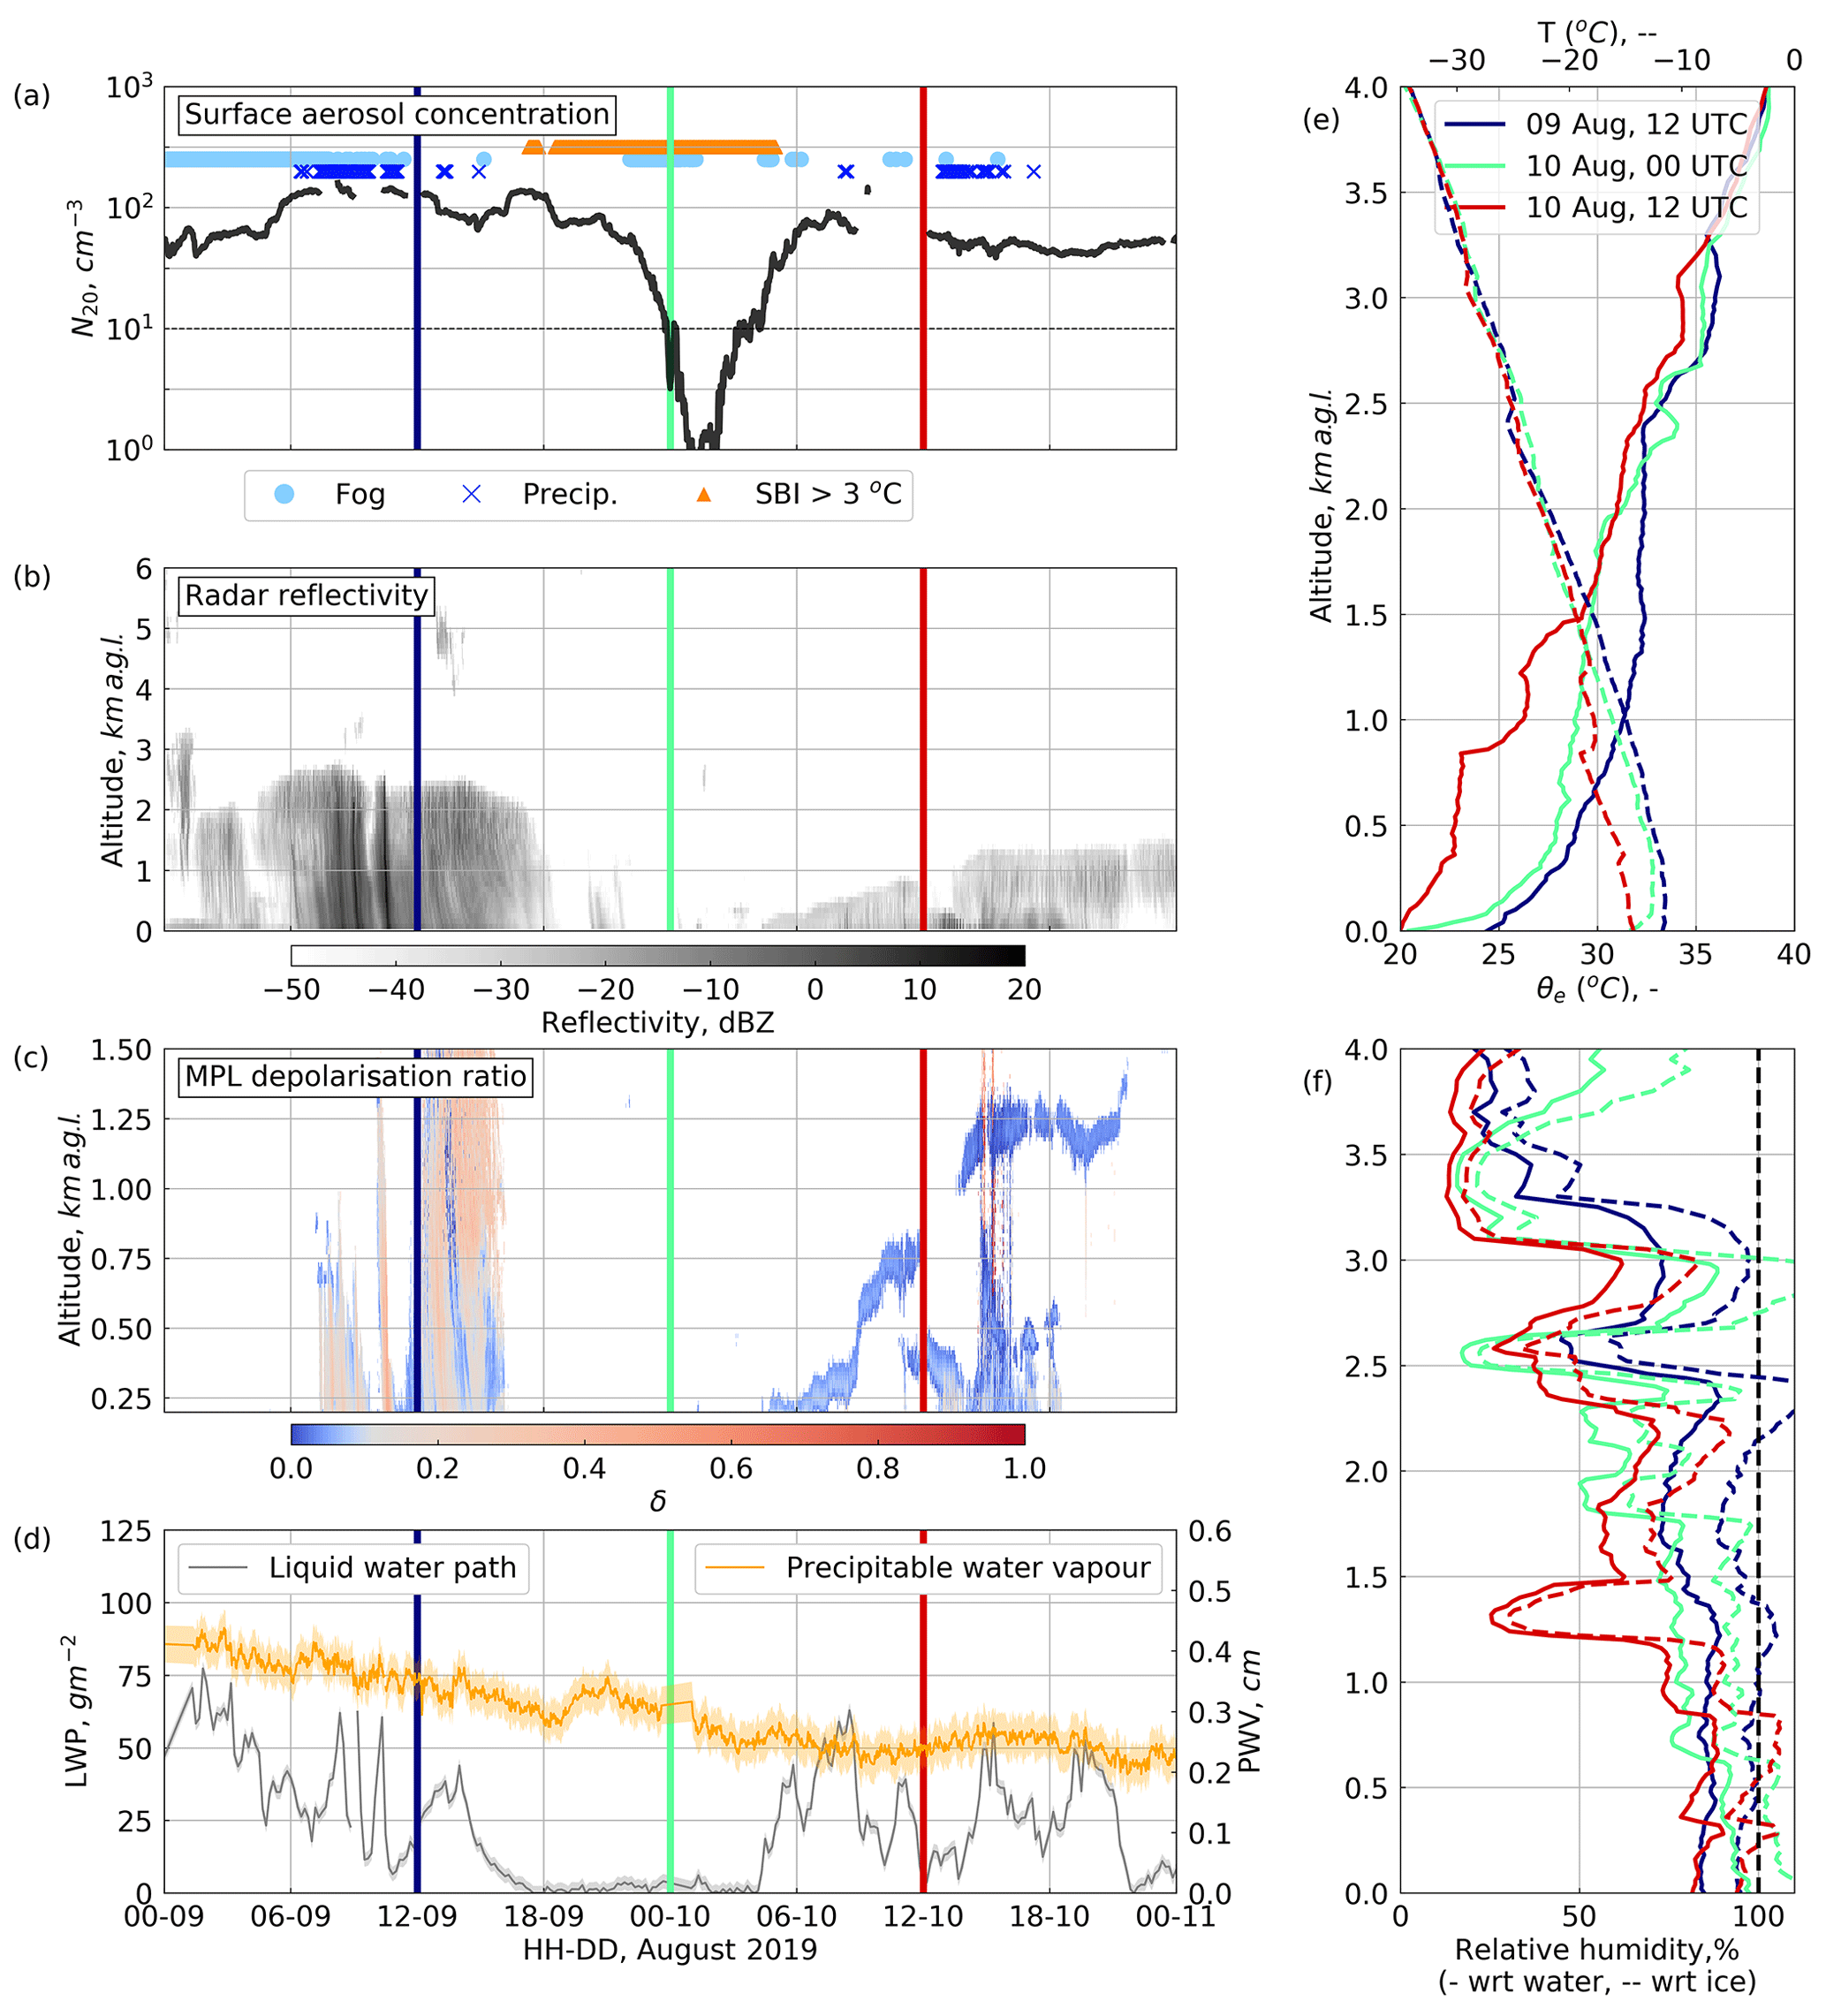
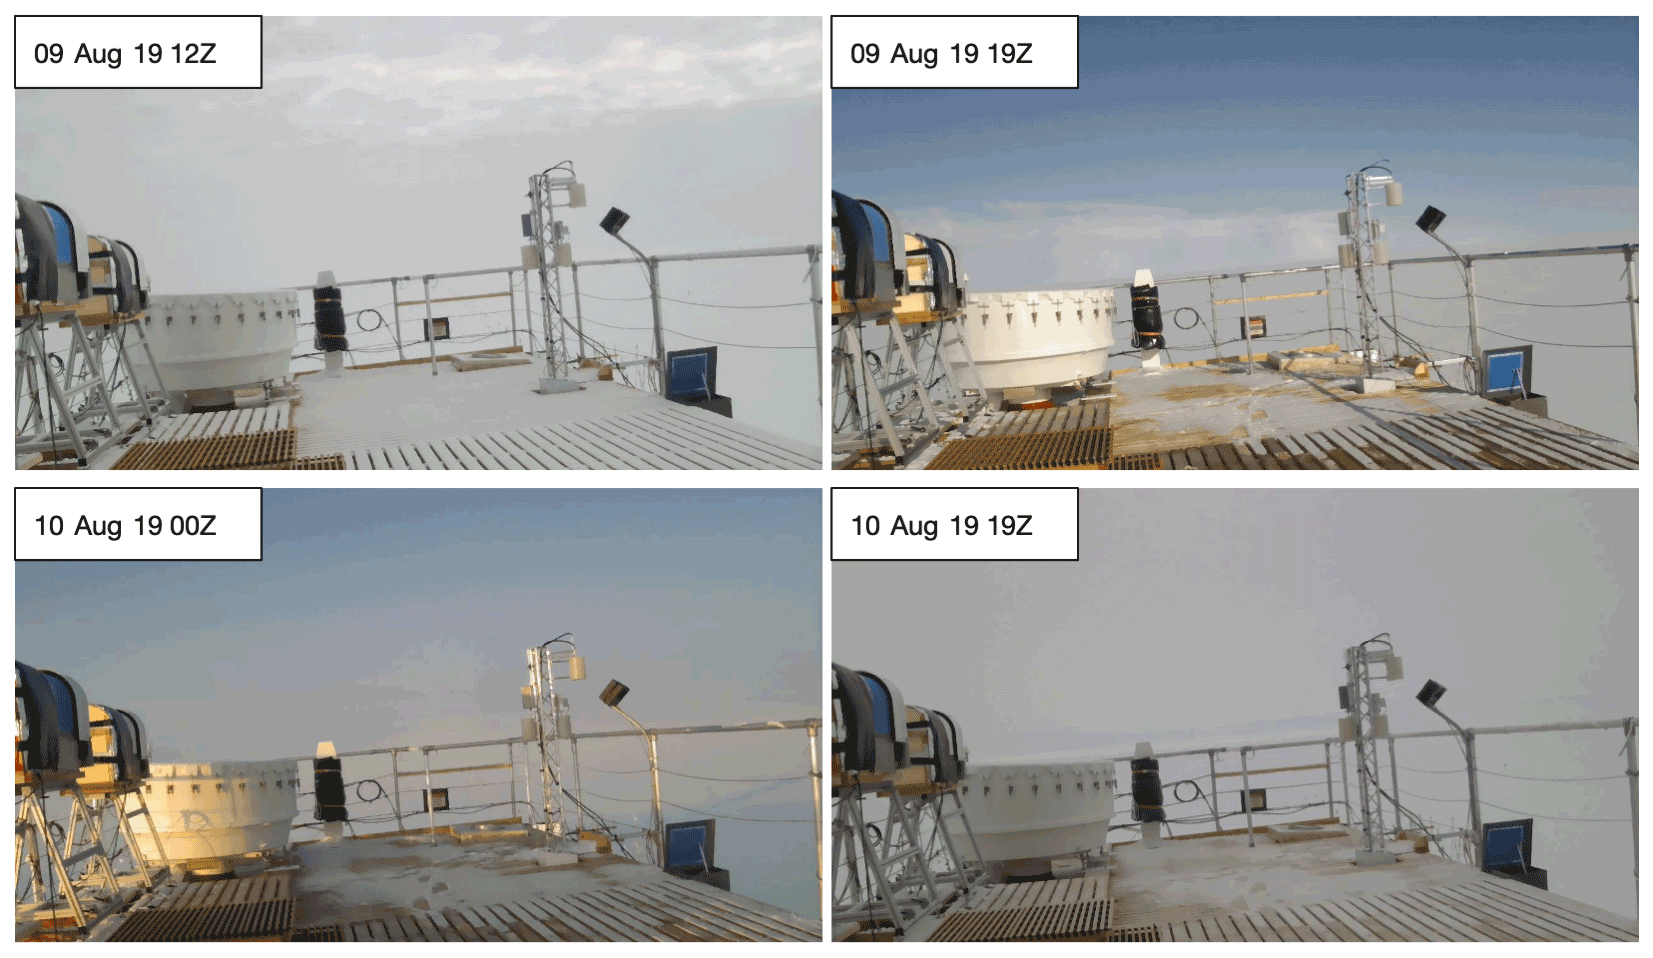
Figure 14Photographs from a webcam oriented towards the eastern horizon on 9 and 10 August 2019. The aerosol inlet is visibly mounted on the mast in the SE corner.
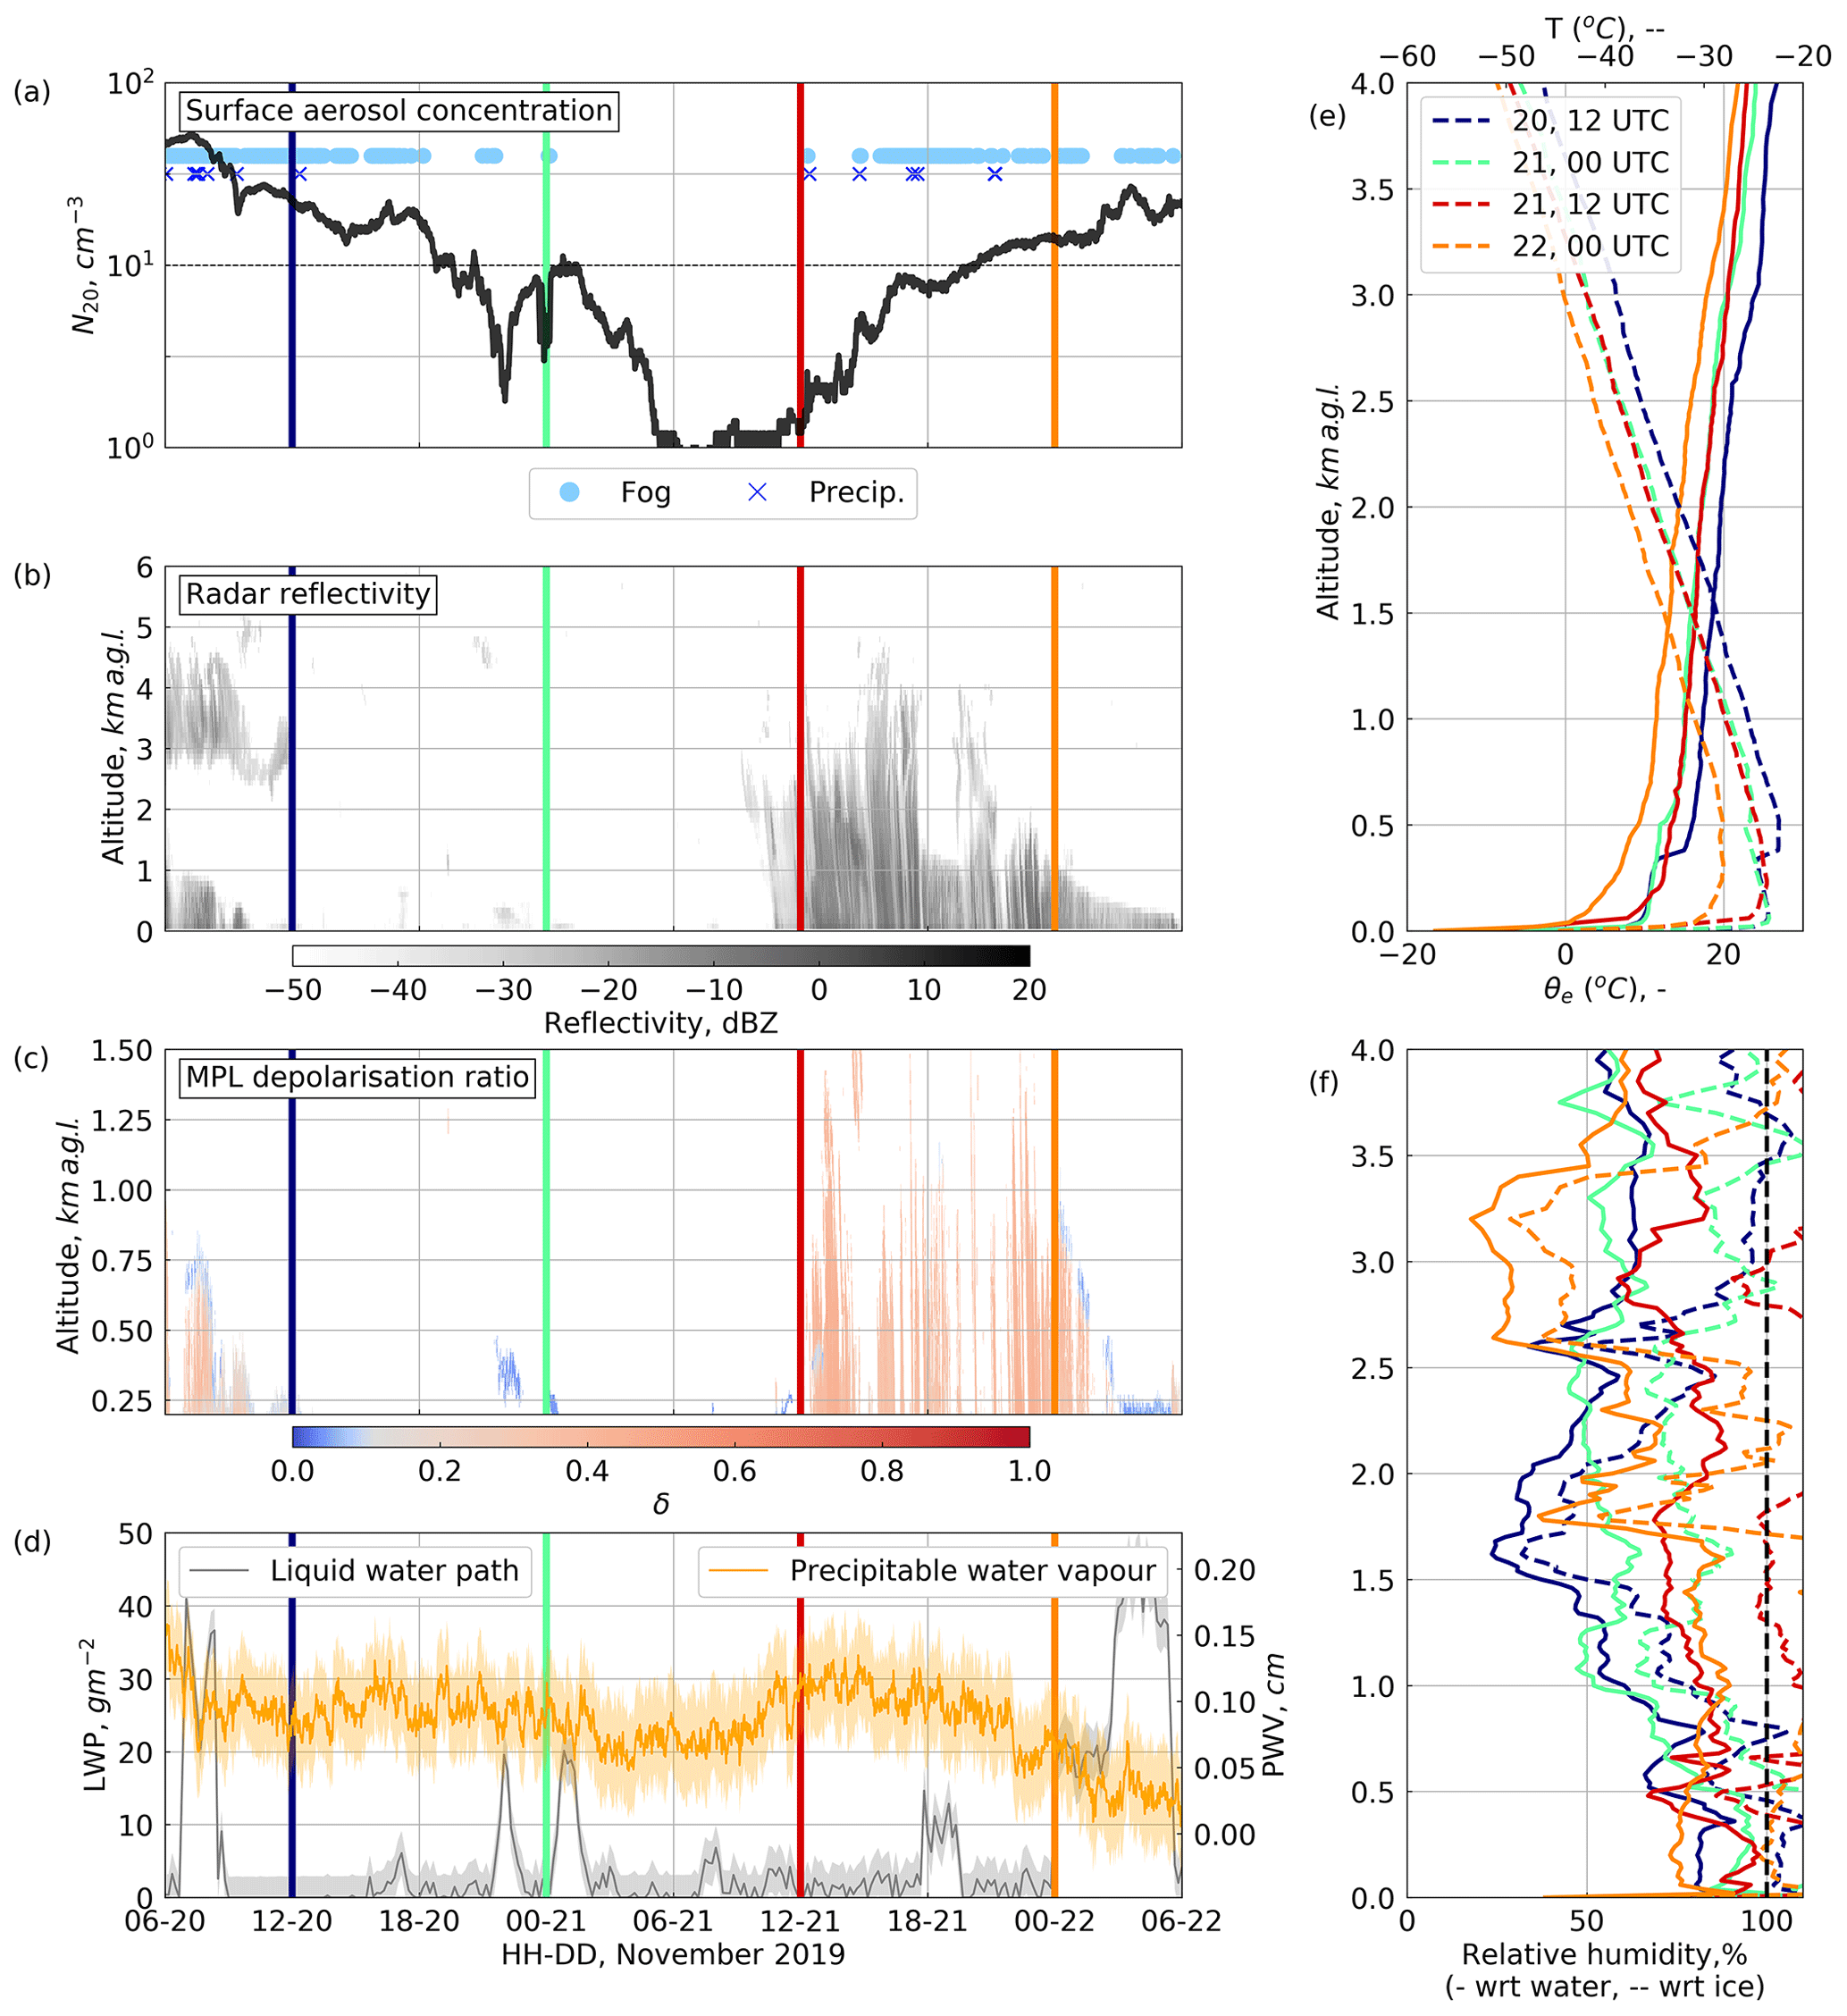
Figure 15Same as Fig. 11 but during the 21 November 2019 low-aerosol case study. Note that there are no SBI events recorded during this period due to missing data but that the radiosonde profiles indicate a constant shallow surface-based temperature inversion throughout.
3.4.2 10 August 2019
At 12:00 on 9 August 2019 there was a 2.5 km deep cloud over Summit (Fig. 13b) and surface N20 was ∼ 100 cm−3 (Fig. 13a). Between 14:00 and 18:00, there was a sharp decrease in liquid water path (Fig. 13d) as the cloud thinned until there was nothing detected by the radar at 19:00 (Fig. 13b). At this time, the surface-based temperature inversion strengthened to > 0.23 (Fig. 13a), likely due to the increase in longwave cooling at the surface after the reduction in cloud cover. In this case, it was only after the strengthening of the surface temperature inversion that N20 began to decrease. At 21:40 the OPC-N3 detected fog, and N20 decreased more rapidly, falling below 10 cm−3 at 23:35 and reaching a minimum of 0.5 cm−3 at 01:00 on 10 August 2019, after which the fog thinned and cleared (Fig. 13a). N20 began to rise again from 02:15, and when the particle concentration increased above 10 cm−3 at 04:00, there was a sudden sharp increase in liquid water path (Fig. 13d), and a thin low mixed-phase cloud developed (Fig. 13c). The cloud thickened as N20 continued to increase back to ∼ 100 cm−3 at 07:00. Fig. 14 shows the transition from cloudy to clear skies, then to thin fog, and back to overcast again throughout this event.
3.4.3 21 November 2019
Surface N20 decreased from 50 cm−3 at 06:00 on 20 November 2019 to a minimum of 0.5 cm−3 at 06:30 on 21 November 2019 and remained below 10 cm−3 for a total of 24 h (Fig. 15a). As N20 decreased, a low-level mixed-phase cloud thinned, and liquid water path fell to 0 g m−2 by 09:00 (Fig. 15c and d). The 20 November 12:00 radiosonde shows that the boundary layer was neutrally stratified up to about 300 m, above a very shallow stable surface layer (where the air temperature increased 7 ∘C in the 4 m immediately above the surface) (Fig. 15e). At 00:00 on 21 November 2019 the temperature inversion in the lowest 4 m of the atmosphere strengthened to 12 ∘C, the sky above Summit was clear, and N20 continued to fall until 06:00. At 12:00 on 21 November 2019 a 3 km deep ice cloud moved across Summit (Fig. 15b and c), and N20 began to increase again (Fig. 15a). Liquid water path initially remained close to zero but increased sharply when N20 rose above 10 cm−3 at 00:00 on 22 November 2019. Between the 20 November 2019 12:00 and the 22 November 2019 00:00 radiosonde profile, the 3 potential temperature decreased by > 5 ∘C (Fig. 15e), possibly indicating an air mass transition during this period.
4.1 The seasonal cycle of surface aerosol particle concentrations at Summit
Despite differences in the measured size ranges, the N20 values reported in the present study are of the same order of magnitude as previous summertime measurements of condensation nuclei at Summit (100–500 cm−3 in the first week of July 1992, Bergin et al., 1994) and from DYE III on the south-east GrIS (∼ 6–1000 cm−3 in July and August 1982, Hogan et al., 1984). These results are also comparable in magnitude to N10 concentrations measured at other Arctic stations (∼ 1–2000 cm−3 at Utqiaġvik, Alaska, and ∼ 5–3000 cm−3 at Pallas, Finland; Asmi et al., 2013); however, the seasonal cycle is notably different. The seasonal cycle in surface aerosol particle concentration at many sea level Arctic sites is dominated by the cycle of Arctic haze (e.g. Shaw, 1995); where anthropogenic pollutants build up in the winter, resulting in maximum aerosol particle concentrations in early spring, followed by a sharp reduction of particles in the summer. In contrast, at Summit we see minimum surface aerosol particle concentrations in the winter and higher concentrations in the late spring and summer. The seasonal cycle at Summit in 2019 is consistent with multi-year seasonal cycles of mineral particles in snow pit samples at Summit (Drab et al., 2002), as well as with measurements of bulk aerosol light scattering and absorption coefficients that are related to aerosol particle concentrations (Schmeisser et al., 2018), suggesting that it is a persistent annual feature.
Hirdman et al. (2009) used FLEXPART back trajectory simulations to show that surface aerosol particle concentrations at Summit are an order of magnitude less sensitive to surface emissions from within the Arctic compared to lower-altitude Arctic sites, which is a possible explanation for why Summit does not experience Arctic haze build-up during the winter. In contrast, the GrIS is more sensitive to aerosol sources above the boundary layer, often originating further south and descending to the GrIS via subsidence driven by radiative cooling (Stohl, 2006; Hirdman et al., 2009).
At sea level Arctic sites (both marine and coastal), the extremely low aerosol particle concentrations observed in the summer are largely attributed to increases in wet deposition (Garrett et al., 2010; Browse et al., 2012). An important distinction between Summit (where the 0 ∘C isotherm is always below the surface except in extreme situations; Shupe et al., 2013b; Bennartz et al., 2013) and sea level Arctic sites is that Summit does not currently experience rain during the summer. The fact that mean monthly N20 is relatively high in the summer at Summit could be related to the fact that wet deposition is much less efficient in ice-bearing clouds (Henning et al., 2004). In this case, future increases in the height of the 0 ∘C isotherm over the GrIS could result in lower summertime aerosol particle concentrations.
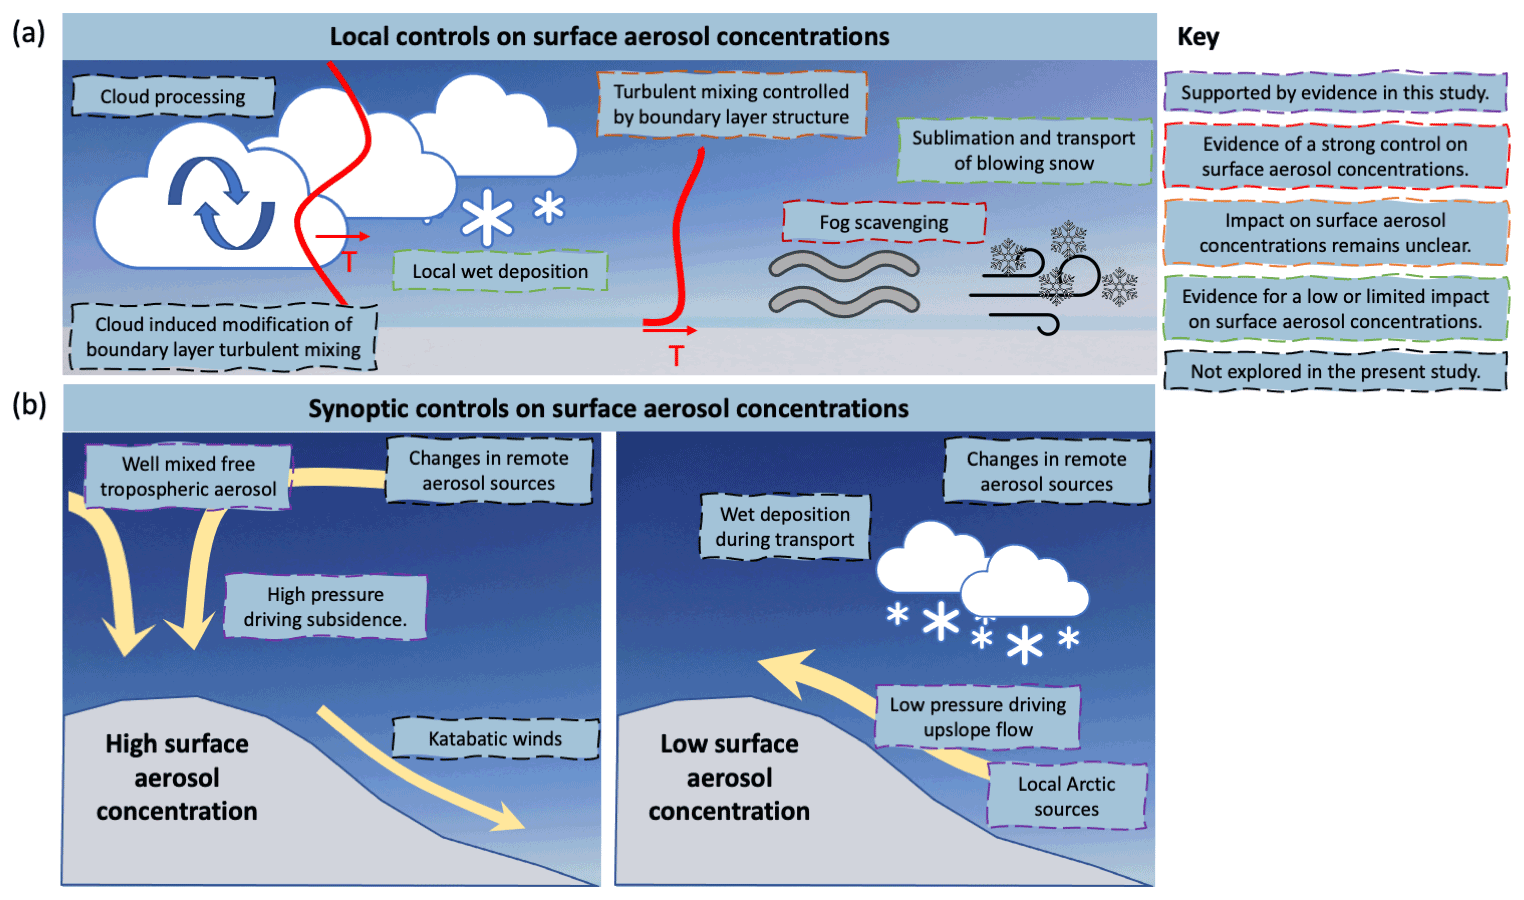
Figure 16Conceptual model illustrating the key components controlling surface aerosol particle concentrations over the central GrIS, highlighting factors that are supported by evidence in this study and important areas for future research (see legend inset).
4.2 Controls on surface aerosol particle concentrations at Summit
The processes controlling surface aerosol particle concentrations over the central GrIS form a complex system, integrating local meteorological conditions, air mass history during aerosol transport, source regions, and transport pathways. Figure 16 illustrates some of the key components of this system, distinguishing between those processes that are supported by evidence in this study and those for which uncertainties still remain. We have made the assumption that there are no local sources of aerosol at the surface. There is a possibility that particle growth via condensation of precursor gases, possibly released from organic material in the snowpack, could occasionally contribute to near-surface CCN concentrations (Ziemba et al., 2010). We do not consider this process in the present study, but the contribution of ultra-fine particle growth to CCN concentrations over the GrIS remains unclear and warrants further investigation.
Out of the four surface processes considered in this study (fog, SBIs, precipitation and BLSN), only fog events have a strong and consistent effect on measured N20. The effect of fog on surface aerosol particle concentrations is consistent with previous studies that were limited to the summer months (Bergin et al., 1994, 1995). Future studies should ensure that fog is accounted for before generalising sampled particle concentrations over wider regions or altitude ranges. Importantly, the observed decrease in aerosol particle number concentration during fog events reflects the number of particles that are incorporated into droplets too large to pass through the CPC inlet, either through CCN activation and growth or scavenging by fog droplets, and these particles are not necessarily deposited at the surface.
Despite the potential for SBIs to act as a barrier for turbulent mixing and hence reduce the rate that aerosol particles are transported down to the surface (Dibb et al., 1992; Li et al., 2019; Thomas et al., 2019), we found no consistent change in N20 during the first 3 h of SBI events and no relationship between the change in N20 and the mean intensity of the SBI, which ranges between 0.23 and 0.92 (not shown). SBIs may have a more important role on surface aerosol particle concentrations over longer timescales, especially because the loss of aerosol particles to the surface by dry deposition is slow (Garrett et al., 2010); however, because fog regularly forms during SBI events, it is difficult to isolate the influence of the SBI from the influence of fog scavenging on aerosol particle concentrations during longer events. SBIs may also contribute to observed reduction in N20 during fog events by restricting turbulent mixing. This study does not consider changes in mechanically induced turbulence over time or elevated temperature inversions; further studies are required to understand the role of changes in turbulent mixing on controlling surface aerosol particle concentrations.
N20 also does not respond consistently to the precipitation or BLSN events considered in this study (Fig. 6c and d). This is in agreement with Bergin et al. (1995), who did not observe a significant effect of precipitation on surface aerosol particle concentrations at Summit during the summer. Below-cloud scavenging rates are sensitive to a wide range of parameters that we do not consider here, including snow crystal size and habit, degree of riming, relative humidity, and Reynolds number (Feng, 2009; Browse et al., 2012). We also do not distinguish between below-cloud precipitation and clear-sky precipitation (diamond dust). However, although the rate of wet deposition might vary between events, below-cloud scavenging should reduce N20, and the fact that we do not consistently observe this suggests that other processes are acting to maintain surface aerosol particle concentrations during precipitation. For example, in both the 3 July 2019 and 21 November 2019 case studies (Sect. 3.4), aerosol particle concentrations increase during precipitation. One explanation for this could be the release of particles near the surface via below-cloud evaporation of hydrometeors. Low-level mixed-phase clouds in particular can act to facilitate the transport of particles from the free troposphere into the boundary layer through entrainment and activation at cloud top and release through evaporation at cloud base (Igel et al., 2017). At Summit, the majority of precipitation occurs in the presence of these low-level mixed-phase clouds (Pettersen et al., 2018). Clouds can also act to increase the efficiency of turbulent mixing down to the surface because below-cloud turbulent mixing driven by the sinking of radiatively cooled air near the cloud top can extend down into the mechanically driven surface mixed layer (Brooks et al., 2017; Shupe et al., 2013a). Precipitation itself might also contribute to this increase in turbulent mixing via drag. Given that most of the aerosol particles arriving at Summit descend from the free troposphere (Hirdman et al., 2009), the role of clouds in the transport of aerosol particles into the boundary layer of the GrIS is an important area for future research.
Synoptic conditions play an important role in controlling N20 at Summit, with most anomalously high-N20 events coinciding with anomalously high surface pressure during 2019 (Fig. 7). The difference in aerosol emission sensitivity and transport pathway simulations between anomalously high- and low-N20 events (Fig. 9), combined with the difference in mean synoptic anomalies (Fig. 8), implies that high surface aerosol particle concentrations occur at Summit when air is transported down to the surface from high in the free troposphere, associated with subsidence related to anomalously strong high-pressure systems over Greenland (Fig. 16b). This free-tropospheric air is sensitive to emissions from middle and low latitudes that can release particles high into the atmosphere where they remain suspended for long periods of time (i.e. > 20 d) (Stohl, 2006; Hirdman et al., 2009; Roiger et al., 2011). This result is consistent with previous studies investigating the transport pathways of aerosol particles that arrive at Summit. Both Hirdman et al. (2009) and Schmeisser et al. (2018) conclude that because on average the majority of air arriving at Summit has only been in contact with the surface over the ice sheet itself, particles measured at Summit must have descended from the free troposphere after transportation at high altitudes over timescales > 20 d. Persistent anomalously high geopotential heights over central Greenland are also associated with the occurrence of precipitating low-level mixed-phase stratocumulus clouds (McIlhattan et al., 2020) that can encourage the transport of aerosol particles from the free tropospheric into the boundary layer (Igel et al., 2017).
Anomalously low aerosol particle concentrations typically occur in the presence of anomalous cyclonic circulation and low geopotential heights off the south-east coast of Greenland (Fig. 8b) that drive air up to the top of the GrIS from the coast and surrounding ocean (Figs. 9b and 16b). During such events, adiabatic cooling due to orographic lifting as the air is advected up the GrIS results in increased condensation and precipitation (Schuenemann et al., 2009). These conditions are associated with deep glaciated clouds advecting over Summit from south-east Greenland (Pettersen et al., 2018). The associated increase in wet deposition en route to Summit could contribute to the relatively low N20. These events are more common in the winter season, when the north Atlantic storm track is more active (Schuenemann et al., 2009). Hogan et al. (1984) also reached a similar conclusion based on surface aerosol particle measurements at DYE III during the summer; they observed that low particle concentrations followed moist upslope flow and precipitation driven by a low-pressure system to the south of Greenland and that concentrations increased after the establishment of a high-pressure system and downslope flow.
This study does not consider changes in emission or removal rates along the aerosol transport pathway. Emission rates vary seasonally within the Arctic due to changes in ice cover and biomass burning (Willis et al., 2018), and isolated events such as volcanic eruptions can have large impacts on background aerosol particle concentrations (e.g. Friberg et al., 2015). Removal rates vary along a particular transport pathway with changes in precipitation amount and phase (Garrett et al., 2010; Browse et al., 2012). Given this, it is quite remarkable that the relationship between anomalous aerosol particle concentrations at Summit and anomalous synoptic conditions is so evident. The strength of this relationship implies that future changes in Arctic large-scale circulation could affect aerosol particle concentrations and aerosol–cloud–radiation interactions over the GrIS. In particular, changes in the frequency of storms moving up the south-east coast of Greenland (Ulbrich et al., 2008) or the position of the Icelandic low (Berdahl et al., 2018) might affect the frequency of extremely-low-aerosol-particle-concentration events over the central GrIS.
4.3 Potential for cloud formation to be limited by low CCN concentrations and discussion of case studies
N20 fell below 10 cm−3 on multiple occasions year-round at Summit in 2019 (Fig. 4). Because CCN are a subset of total condensation nuclei concentration, it is likely that CCN concentrations fall low enough to limit cloud and fog formation, based on approximate threshold estimates determined from past observational and modelling studies over the Arctic Ocean (Mauritsen et al., 2011; Stevens et al., 2018). The ratio of CCN/N10 at a supersaturation of 0.55 % measured over Summit during a research flight in 2008 was 0.52 (Lathem et al., 2013), which is similar to the mean CCN/N10 ratio observed at the Zeppelin Observatory in Svalbard outside of the Arctic haze season (Jung et al., 2018). However this ratio is a function of supersaturation, and at very high supersaturations (that can occur under extremely low CCN concentrations) small particles that do not typically act as CCN can activate (Leaitch et al., 2016; Baccarini et al., 2020). If we make the assumption that all CCN are activated after the first 3 h of fog formation during the events in Fig. 6a, the fact that we see a median 20 % reduction in total N20 during these events implies a CCN/N20 ratio of 0.2, and for the individual event example in Fig. 3, the CCN/N20 would have been 0.46. Using the more conservative ratio estimation of 0.46, surface CCN concentrations will have fallen below 10 cm−3 for 46 d or 15 % of the measurement period during 2019. Because supercooled liquid fog can have a large effect on surface radiative fluxes at Summit (liquid fog at Summit has an average total (SW+LW) cloud radiative forcing of 26.1 W m−2 compared to clear skies, Cox et al., 2019), if fog formation is limited by low CCN concentrations, this could have an important effect on the ice sheet surface energy budget, especially over individual events which can play a role in pre-conditioning the snow surface in advance of melt (Miller et al., 2017). The same could be true for clouds where surface concentrations are representative of CCN concentrations at cloud level. For example, the exceptional July 2012 Greenland melt event was enhanced by the presence of low-level mixed-phase clouds with a LWP of ∼ 30 g m−2 (Bennartz et al., 2013); in this case, if small changes in CCN concentrations acted to either increase or decrease the cloud LWP, they could have controlled the presence versus absence of surface melt.
For all three of the case studies in Sect. 3.4, decreasing aerosol particle concentrations were associated with a reduction in cloud cover, and the reverse was also true. However, differences in timing and boundary layer structure imply that different processes were involved in each case. This demonstrates that it is not sufficient to use simple correlations between cloud properties and aerosol particle concentrations to investigate cloud–aerosol interactions, since there are many additional confounding variables. Although we cannot delineate the individual drivers of the changes in N20 during these case studies based purely on observations, the near-zero liquid water path is convincing evidence that low CCN concentrations are limiting the formation of liquid water droplets at the surface despite supersaturation when N20 is < 10 cm−3 in all three case studies (i.e. fog formation). Note the only other events where we observed N20 < 10 cm−3 and LWP > 10 g m−2 occurred in February and March 2019 and were associated with clouds with base heights between 250 and 1000 The static stability of the surface layer in these cases means it is not possible to know whether the surface N20 was representative of aerosol particle concentrations in the cloud layer.
Finally, for all three case studies, back trajectory simulations indicate that aerosol particles were transported upslope to Summit from lower elevations (Fig. 10), and two of the cases (July and November) occurred in the presence of cyclonic circulation off the south-east coast of Greenland – the typical synoptic condition associated with anomalously low aerosol particle concentrations at Summit (Fig. 8). Although the simulated aerosol source regions are all from high latitudes (> 50∘N; Fig. 10), they originate from very different directions (Siberia on 3 July 2019, the Canadian Archipelago on 10 August 2019, and south-west of Greenland on 21 November 2019). This suggests that the upslope transport pathway to Summit, which is strongly linked to precipitation over the GrIS (Schuenemann et al., 2009) and notably from glaciated as opposed to mixed-phase clouds (Pettersen et al., 2018), has a stronger influence on N20 than the source region. These upslope flow enhanced precipitation events are also coupled to anomalously warm temperatures over the GrIS, which likely results in a higher percentage of rain (and hence increased wet deposition) en route to Summit (Pettersen et al., 2021). These results imply that increased wet deposition during transport may play a large role in driving CCN concentrations below the threshold where they can sustain cloud formation. The role of wet deposition in controlling aerosol particle concentrations over the central GrIS is therefore an important area for future research.
This study presents the first full year of surface aerosol particle number concentration measurements from the central Greenland Ice Sheet and assesses the local and synoptic controls on surface N20. In 2019, the minimum aerosol particle concentrations occur in February (which has a monthly average concentration of just 18 cm−3 and a standard deviation of σN = 16 cm−3), and the maximum concentrations occur in April (monthly mean: 247 cm−3, σN: 130 cm−3) and May (monthly mean: 206 cm−2, σN: 165 cm−3). Between May and October, concentrations remain on the order of 100 cm−3 before they decrease again between October and December. This seasonal cycle is distinct from that of many sea level Arctic sites which experience minimum surface aerosol concentrations in the summer (Freud et al., 2017; Schmeisser et al., 2018).
Changes in synoptic conditions strongly control N20, with almost all anomalously high-N20 events associated with anomalously high surface pressure over Summit. High N20 occurs under anomalously high geopotential heights and strong anticyclonic circulation over Greenland, which act to enhance the descent of free-tropospheric air to the ice sheet surface. Low N20 occurs in the presence of anomalous cyclonic circulation over south-east Greenland, when low-pressure systems drive up slope flow that is associated with increased precipitation (Schuenemann et al., 2009; Pettersen et al., 2018). Below-average aerosol particle concentrations occur more often in the winter, when the frequency of low-pressure systems driven by the North Atlantic storm track increases (Schuenemann et al., 2009). The distinction between upslope flow and descent from higher altitudes appears to be a stronger control on N20 than aerosol source region, suggesting an important role for wet deposition along aerosol transport pathways.
We find that fog strongly effects surface aerosol particle concentration measurements, in agreement with previous studies that look at isolated events during the summer (Bergin et al., 1994, 1995). On average, there is a 20 % reduction in N20 after the first 3 h of a fog event. Because fog significantly modifies local surface aerosol particle concentrations, future studies should ensure that fog is accounted for before generalising sampled aerosol particle concentrations over wider regions or altitude ranges. In contrast, precipitation, blowing snow, and strong surface-based temperature inversions (> 0.23 ) do not have a consistent effect on N20 during the first 3 h of the event. Competing influences of advection, or either cloud or mechanically induced changes in the turbulent structure of the boundary layer, might play roles in modulating aerosol particle concentrations during these events and are not considered in this study.
This study uses a conservative estimate to determine that surface aerosol particle concentrations low enough to limit cloud and or fog formation (based on observations and model simulations over the Arctic ocean; Mauritsen et al., 2011; Stevens et al., 2018) do occur in both winter and summer over the central GrIS. However, long-term vertical profiles of CCN concentrations are necessary to determine how often this is relevant at cloud height. Although practically difficult, continuous vertical profiles of aerosol particle concentrations above the GrIS are essential for understanding the interaction between clouds, aerosols, and the ice sheet surface energy budget and should be a priority for future campaigns. Vertical aerosol profiles are particularly important over the central GrIS where most of the aerosol particles arriving at the surface descend from higher elevations in the free troposphere (Hirdman et al., 2009; Schmeisser et al., 2018; this study). The unique transport pathway and resulting seasonal cycle of aerosol particles over the central GrIS demonstrate that observations of aerosol properties at sea level Arctic sites cannot be generalised over the GrIS, in agreement with previous studies (e.g. Hirdman et al., 2009; Schmeisser et al., 2018; Schmale et al., 2021).
All data are publicly available. ICECAPS-ACE aerosol measurements and multi-level temperature sensor data can be accessed through the CEDA archive at http://catalogue.ceda.ac.uk/uuid/f06c6aa727404ca788ee3dd0515ea61a (Guy et al., 2020). NOAA GML meteorological data are available at https://gml.noaa.gov/aftp/data/meteorology/in-situ/sum/2019 (GMLMET, 2021). All additional ICECAPS data are available from the Arctic Data Center: MMCR (https://doi.org/10.18739/A2Q52FD4V; Shupe, 2020a), MPL (https://doi.org/10.18739/A2862BC30; Shupe, 2020b), POSS (https://doi.org/10.18739/A2GQ6R30G; Shupe, 2020c), HATPRO and MWRHF (https://doi.org/10.18739/A2542J92G; Turner and Bennartz, 2020), and radiosonde profiles (https://doi.org/10.18739/A20P0WR53; Walden and Shupe, 2020). ERA5 reanalysis data are made available by the European Centre for Medium-Range Weather Forecasts (ECMWF) and can be accessed at the Copernicus Climate Data Store (https://doi.org/10.24381/cds.bd0915c6; Hersbach et al., 2018).
The original ICECAPS project proposal was conceived by MDS, VPW, DDT, and RB. HG led data collection and curation of ICECAPS-ACE aerosol data supervised by RRN and IMB. HG led the analysis with contributions from RRN, IMB, BJM, CP, MDS, and CJC. HG prepared the manuscript with contributions from all co-authors.
The contact author has declared that neither they nor their co-authors have any competing interests.
Publisher's note: Copernicus Publications remains neutral with regard to jurisdictional claims in published maps and institutional affiliations.
The efforts of technicians at Summit Station and science support provided by Polar Field Services were crucial to maintaining data quality and continuity at Summit. We acknowledge Bethany Wyld for assistance during the ICECAPS-ACE field installation and Richard Rigby for his support setting up and running the FLEXPART model. We also gratefully acknowledge support from the National Centre for Atmospheric Science (NCAS), the NCAS Atmospheric Measurement and Observation Facility, and notably Barbara Brooks for support in instrument troubleshooting and data quality control. ICECAPS is a long-term research programme with a large number of collaborators, and we are grateful for all their efforts in developing and maintaining the various instruments and data products used in this study. Matthew D. Shupe and William D. Neff were supported by National Science Foundation grant no. OPP1801477. We are grateful for the thoughtful suggestions of two anonymous reviewers that have improved the quality of this paper.
This research has been supported by the Natural Environment Research Council (grant no. NE/L002574/1 and NSFGEO-NERC grant no. 1801477).
This paper was edited by Armin Sorooshian and reviewed by two anonymous referees.
Asmi, A., Collaud Coen, M., Ogren, J. A., Andrews, E., Sheridan, P., Jefferson, A., Weingartner, E., Baltensperger, U., Bukowiecki, N., Lihavainen, H., Kivekäs, N., Asmi, E., Aalto, P. P., Kulmala, M., Wiedensohler, A., Birmili, W., Hamed, A., O'Dowd, C., G Jennings, S., Weller, R., Flentje, H., Fjaeraa, A. M., Fiebig, M., Myhre, C. L., Hallar, A. G., Swietlicki, E., Kristensson, A., and Laj, P.: Aerosol decadal trends – Part 2: In-situ aerosol particle number concentrations at GAW and ACTRIS stations, Atmos. Chem. Phys., 13, 895–916, https://doi.org/10.5194/acp-13-895-2013, 2013. a
Baccarini, A., Karlsson, L., Dommen, J., Duplessis, P., Vüllers, J., Brooks, I. M., Saiz-Lopez, A., Salter, M., Tjernström, M., Baltensperger, U., Zieger, P., and Schmale, J.: Frequent new particle formation over the high Arctic pack ice by enhanced iodine emissions, Nat. Commun., 11, 1–11, 2020. a
Backman, J., Schmeisser, L., and Asmi, E.: Asian emissions explain much of the Arctic Black Carbon events, Geophys. Res. Lett., 48, e2020GL091913, https://doi.org/10.1029/2020GL091913, 2021. a
Bamber, J. L., Westaway, R. M., Marzeion, B., and Wouters, B.: The land ice contribution to sea level during the satellite era, Environ. Res. Lett., 13, 063008, https://doi.org/10.1088/1748-9326/aac2f0, 2018. a
Bennartz, R., Shupe, M. D., Turner, D. D., Walden, V. P., Steffen, K., Cox, C. J., Kulie, M. S., Miller, N. B., and Pettersen, C.: July 2012 Greenland melt extent enhanced by low-level liquid clouds, Nature, 496, 83–86, https://doi.org/10.1038/nature12002, 2013. a, b, c, d
Bennartz, R., Fell, F., Pettersen, C., Shupe, M. D., and Schuettemeyer, D.: Spatial and temporal variability of snowfall over Greenland from CloudSat observations, Atmos. Chem. Phys., 19, 8101–8121, https://doi.org/10.5194/acp-19-8101-2019, 2019.
Berdahl, M., Rennermalm, A., Hammann, A., Mioduszweski, J., Hameed, S., Tedesco, M., Stroeve, J., Mote, T., Koyama, T., and McConnell, J. R.: Southeast greenland winter precipitation strongly linked to the Icelandic Low position, J. Climate, 31, 4483–4500, 2018. a
Bergin, M. H., Jaffrezo, J. L., Davidson, C. I., Caldow, R., and Dibb, J.: Fluxes of chemical species to the Greenland ice sheet at Summit by fog and dry deposition, Geochim. Cosmochim. Ac., 58, 3207–3215, 1994. a, b, c, d
Bergin, M. H., Jaffrezo, J.-L., Davidson, C. I., Dibb, J. E., Pandis, S. N., Hillamo, R., Maenhaut, W., Kuhns, H. D., and Makela, T.: The contributions of snow, fog, and dry deposition to the summer flux of anions and cations at Summit, Greenland, J. Geophys. Res., 100, 16275–16288, https://doi.org/10.1029/95JD01267, 1995. a, b, c, d, e
Box, J. E., Fettweis, X., Stroeve, J. C., Tedesco, M., Hall, D. K., and Steffen, K.: Greenland ice sheet albedo feedback: thermodynamics and atmospheric drivers, The Cryosphere, 6, 821–839, https://doi.org/10.5194/tc-6-821-2012, 2012. a
Brooks, I. M., Tjernström, M., Persson, P. O. G., Shupe, M. D., Atkinson, R. A., Canut, G., Birch, C. E., Mauritsen, T., Sedlar, J., and Brooks, B. J.: The Turbulent Structure of the Arctic Summer Boundary Layer During The Arctic Summer Cloud-Ocean Study, J. Geophys. Res.-Atmos., 122, 9685–9704, 2017. a
Browse, J., Carslaw, K. S., Arnold, S. R., Pringle, K., and Boucher, O.: The scavenging processes controlling the seasonal cycle in Arctic sulphate and black carbon aerosol, Atmos. Chem. Phys., 12, 6775–6798, https://doi.org/10.5194/acp-12-6775-2012, 2012. a, b, c
Castellani, B. B., Shupe, M. D., Hudak, D. R., and Sheppard, B. E.: The annual cycle of snowfall at Summit, Greenland, J. Geophys. Res.-Atmos., 120, 6654–6668, 2015. a
Cheng, C.-T., Wang, W.-C., and Chen, J.-P.: Simulation of the effects of increasing cloud condensation nuclei on mixed-phase clouds and precipitation of a front system, Atmos. Res., 96, 461–476, 2010. a
Cox, C. J., Noone, D. C., Berkelhammer, M., Shupe, M. D., Neff, W. D., Miller, N. B., Walden, V. P., and Steffen, K.: Supercooled liquid fogs over the central Greenland Ice Sheet, Atmos. Chem. Phys., 19, 7467–7485, https://doi.org/10.5194/acp-19-7467-2019, 2019. a, b, c, d, e
Crilley, L. R., Shaw, M., Pound, R., Kramer, L. J., Price, R., Young, S., Lewis, A. C., and Pope, F. D.: Evaluation of a low-cost optical particle counter (Alphasense OPC-N2) for ambient air monitoring, Atmos. Meas. Tech., 11, 709–720, https://doi.org/10.5194/amt-11-709-2018, 2018. a, b
Curry, J. A., Rossow, W. B., Randall, D., Schramm, J. L., Rossow, W. B., Randall, D., and Schramm, J. L.: Overview of Arctic cloud and radiation characteristics, J. Climate, 9, 1731–1764, 1996. a
Davidson, C., Jaffrezo, J.-L., Mosher, B., Dibb, J. E., Borys, R., Bodhaine, B., Rasmussen, R., Boutron, C., Gorlach, U., Cachier, H., Ducret, J., Colin, J.-L., Heidam, N. Z., Kemp, K., and Hillamo, R.: Chemical constituents in the air and snow at Dye 3, Greenland–I. Seasonal variations, Atmos. Environ. A-Gen., 27, 2709–2722, https://doi.org/10.1016/0960-1686(93)90304-H, 1993. a
Dibb, J. E., Jaffrezo, J. L., and Legrand, M.: Initial findings of recent investigations of air-snow relationships in the summit region of the Greenland ice sheet, J. Atmos. Chem., 14, 167–180, 1992. a
Drab, E., Gaudichet, A., Jaffrezo, J. L., and Colin, J. L.: Mineral particles content in recent snow at Summit (Greenland), Atmos. Environ., 36, 5365–5376, 2002. a
Enderlin, E. M., Howat, I. M., Jeong, S., Noh, M.-J., VanAngelen, J. H., and Van den Broeke, M. R.: An improved mass budget for the Greenland ice sheet, Geophys. Res. Lett., 41, 866–872, https://doi.org/10.1002/2013GL059010, 2014. a
Feng, J.: A size-resolved model for below-cloud scavenging of aerosols by snowfall, J. Geophys. Res.-Atmos., 114, 1–8, 2009. a
Fettweis, X., Box, J. E., Agosta, C., Amory, C., Kittel, C., Lang, C., van As, D., Machguth, H., and Gallée, H.: Reconstructions of the 1900–2015 Greenland ice sheet surface mass balance using the regional climate MAR model, The Cryosphere, 11, 1015–1033, https://doi.org/10.5194/tc-11-1015-2017, 2017. a
Flyger, H., Heidam, N., Hansen, K., Megaw, W., Walther, E., and Hogan, A.: The background level of the summer tropospheric aerosol, sulphur dioxide and ozone over Greenland and the North Atlantic Ocean, J. Aerosol Sci., 7, 103–140, 1976. a
Flynna, C. J., Mendozaa, A., Zhengb, Y., and Mathurb, S.: Novel polarization-sensitive micropulse lidar measurement technique, Opt. Express, 15, 2785–2790, 2007. a
Forster, C., Stohl, A., and Seibert, P.: Parameterization of Convective Transport in a Lagrangian Particle Dispersion Model and Its Evaluation, J. Appl. Meteorol. Clim., 46, 403–422, 2007. a
Freud, E., Krejci, R., Tunved, P., Leaitch, R., Nguyen, Q. T., Massling, A., Skov, H., and Barrie, L.: Pan-Arctic aerosol number size distributions: seasonality and transport patterns, Atmos. Chem. Phys., 17, 8101–8128, https://doi.org/10.5194/acp-17-8101-2017, 2017. a
Friberg, J., Martinsson, B. G., Sporre, M. K., Andersson, S. M., Brenninkmeijer, C. A. M., Hermann, M., Velthoven, P. F. J., and Zahn, A.: Influence of volcanic eruptions on midlatitude upper tropospheric aerosol and consequences for cirrus clouds, Earth and Space Science, 2, 285–300, 2015. a
Garrett, T. J. and Zhao, C.: Increased Arctic cloud longwave emissivity associated with pollution from mid-latitudes, Nature, 440, 787–789, 2006. a
Garrett, T. J., Zhao, C., and Novelli, P. C.: Assessing the relative contributions of transport efficiency and scavenging to seasonal variability in Arctic aerosol, Tellus B, 62, 190–196, 2010. a, b, c
Giorgi, F.: A particle dry-deposition parameterization scheme for use in tracer transport models, J. Geophys. Res., 91, 9794–9806, https://doi.org/10.1029/JD091iD09p09794, 1986. a
GMLMET: Meteorology Measurements from the NOAA/ESRL/GMD Baseline Observatory Summit Station, GMLMET [data set], available at: https://gml.noaa.gov/aftp/data/meteorology/in-situ/sum/2019, last access: 1 April 2021. a, b, c
Guy, H., Neely III, R. R., and Brooks, I.: ICECAPS-ACE: Integrated Characterization of Energy, Clouds, Atmospheric state, and Precipitation at Summit, Greenland – Aerosol Cloud Experiment measurements, Centre for Environmental Data Analysis [data set], available at: http://catalogue.ceda.ac.uk/uuid/f06c6aa727404ca788ee3dd0515ea61a (last access: 1 April 2021), 2020. a, b, c
Hanna, E., Cropper, T. E., Hall, R. J., and Cappelen, J.: Greenland Blocking Index 1851-2015: a regional climate change signal, Int. J. Climatol., 36, 4847–4861, 2016. a
Heinemann, G. and Klein, T.: Modelling and observations of the katabatic flow dynamics over Greenland, Tellus A, 54, 542–554, 2002. a, b
Henning, S., Bojinski, S., Diehl, K., Ghan, S., Nyeki, S., Weingartner, E., Wurzler, S., and Baltensperger, U.: Aerosol partitioning in natural mixed-phase clouds, Geophys. Res. Lett., 31, L06101, https://doi.org/10.1029/2003GL019025, 2004. a
Hersbach, H., Bell, B., Berrisford, P., Biavati, G., Horányi, A., Muñoz Sabater, J., Nicolas, J., Peubey, C., Radu, R., Rozum, I., Schepers, D., Simmons, A., Soci, C., Dee, D., and Thépaut, J.-N.: ERA5 hourly data on pressure levels from 1979 to present, Copernicus Climate Change Service (C3S) Climate Data Store (CDS) [data set], https://doi.org/10.24381/cds.bd0915c6, 2018. a
Hersbach, H., Bell, B., Berrisford, P., Hirahara, S., Horányi, A., Muñoz-Sabater, J., Nicolas, J., Peubey, C., Radu, R., Schepers, D., Simmons, A., Soci, C., Abdalla, S., Abellan, X., Balsamo, G., Bechtold, P., Biavati, G., Bidlot, J., Bonavita, M., De Chiara, G., Dahlgren, P., Dee, D., Diamantakis, M., Dragani, R., Flemming, J., Forbes, R., Fuentes, M., Geer, A., Haimberger, L., Healy, S., Hogan, R. J., Hólm, E., Janisková, M., Keeley, S., Laloyaux, P., Lopez, P., Lupu, C., Radnoti, G., de Rosnay, P., Rozum, I., Vamborg, F., Villaume, S., and Thépaut, J. N.: The ERA5 global reanalysis, Q. J. Roy. Meteor. Soc., 146, 1999–2049, 2020. a
Hirdman, D., Sodemann, H., Eckhardt, S., Burkhart, J. F., Jefferson, A., Mefford, T., Quinn, P. K., Sharma, S., Ström, J., and Stohl, A.: Source identification of short-lived air pollutants in the Arctic using statistical analysis of measurement data and particle dispersion model output, Atmos. Chem. Phys., 10, 669–693, https://doi.org/10.5194/acp-10-669-2010, 2010. a, b, c, d, e, f, g, h
Hobbs, W. H.: The Greenland Glacial Anticyclone, J. Meteorol., 2, 143–153, 1945. a
Hofer, S., Tedstone, A. J., Fettweis, X., and Bamber, J. L.: Decreasing cloud cover drives the recent mass loss on the Greenland Ice Sheet, Science Advances, 3, e1700584, https://doi.org/10.1126/sciadv.1700584, 2017. a
Hofer, S., Tedstone, A. J., Fettweis, X., and Bamber, J. L.: Cloud microphysics and circulation anomalies control differences in future Greenland melt, Nat. Clim. Change, 9, 523–528, 2019. a, b
Hogan, A. W., Barnard, S. C., Kebschull, K., Townsend, R., and Samson, J. A.: Aerosol variation in the western hemisphere Arctic, J. Aerosol Sci., 15, 13–33, 1984. a, b, c
Howat, I., Negrete, A., and Smith, B.: The Greenland Ice Mapping Project (GIMP) Land Ice and Ocean Classification Mask, Version 1, NASA National Snow and Ice Data Center Distributed Active Archive Center, https://doi.org/10.5067/B8X58MQBFUPA, 2017. a
Hudson, J. G. and Da, X.: Volatility and size of cloud condensation nuclei, J. Geophys. Res.-Atmos., 101, 4435–4442, 1996. a
Igel, A. L., Ekman, A. M. L., Leck, C., Tjernström, M., Savre, J., and Sedlar, J.: The free troposphere as a potential source of arctic boundary layer aerosol particles, Geophys. Res. Lett., 44, 7053–7060, 2017. a, b, c
Intrieri, J. M., Fairall, C. W., Shupe, M. D., Persson, P. O. G., Andreas, E. L., Guest, P. S., and Moritz, R. E.: An annual cycle of Arctic surface cloud forcing at SHEBA, J. Geophys. Res.-Oceans, 107, 8039, https://doi.org/10.1029/2000JC000439, 2002. a
Jaenicke, R.: Problems of the Distribution of the Global Aerosol, Russ. Chem. Rev., 59, 959–972, https://doi.org/10.1070/rc1990v059n10abeh00356, 1990. a, b
Jung, C. H., Yoon, Y. J., Kang, H. J., Gim, Y., Lee, B. Y., Ström, J., Krejci, R., and Tunved, P.: The seasonal characteristics of cloud condensation nuclei (CCN) in the arctic lower troposphere, Tellus B, 70, 1–13, 2018. a, b
Kanji, Z. A., Ladino, L. A., Wex, H., Boose, Y., Burkert-Kohn, M., Cziczo, D. J., and Krämer, M.: Overview of ice nucleating particles, Meteoro. Mon., 58, 1–1, 2017. a
Kay, J. E., L'Ecuyer, T., Pendergrass, A., Chepfer, H., Guzman, R., and Yettella, V.: Scale-aware and definition-aware evaluation of modeled near-surface precipitation frequency using CloudSat observations, J. Geophys. Res.-Atmos., 123, 4294–4309, 2018. a
Lance, S., Shupe, M. D., Feingold, G., Brock, C. A., Cozic, J., Holloway, J. S., Moore, R. H., Nenes, A., Schwarz, J. P., Spackman, J. R., Froyd, K. D., Murphy, D. M., Brioude, J., Cooper, O. R., Stohl, A., and Burkhart, J. F.: Cloud condensation nuclei as a modulator of ice processes in Arctic mixed-phase clouds, Atmos. Chem. Phys., 11, 8003–8015, https://doi.org/10.5194/acp-11-8003-2011, 2011. a
Lathem, T. L., Beyersdorf, A. J., Thornhill, K. L., Winstead, E. L., Cubison, M. J., Hecobian, A., Jimenez, J. L., Weber, R. J., Anderson, B. E., and Nenes, A.: Analysis of CCN activity of Arctic aerosol and Canadian biomass burning during summer 2008, Atmos. Chem. Phys., 13, 2735–2756, https://doi.org/10.5194/acp-13-2735-2013, 2013. a
Leaitch, W. R., Korolev, A., Aliabadi, A. A., Burkart, J., Willis, M. D., Abbatt, J. P. D., Bozem, H., Hoor, P., Köllner, F., Schneider, J., Herber, A., Konrad, C., and Brauner, R.: Effects of 20–100 nm particles on liquid clouds in the clean summertime Arctic, Atmos. Chem. Phys., 16, 11107–11124, https://doi.org/10.5194/acp-16-11107-2016, 2016. a, b, c
Leck, C. and Svensson, E.: Importance of aerosol composition and mixing state for cloud droplet activation over the Arctic pack ice in summer, Atmos. Chem. Phys., 15, 2545–2568, https://doi.org/10.5194/acp-15-2545-2015, 2015. a
Lenaerts, J. T. M., Camron, M. D., Wyburn-Powell, C. R., and Kay, J. E.: Present-day and future Greenland Ice Sheet precipitation frequency from CloudSat observations and the Community Earth System Model, The Cryosphere, 14, 2253–2265, https://doi.org/10.5194/tc-14-2253-2020, 2020. a
Li, J., Chen, H., Li, Z., Wang, P., Fan, X., He, W., and Zhang, J.: Analysis of Low-level Temperature Inversions and Their Effects on Aerosols in the Lower Atmosphere, Adv. Atmos. Sci., 36, 1235–1250, 2019. a
Lohmann, U. and Feichter, J.: Global indirect aerosol effects: a review, Atmos. Chem. Phys., 5, 715–737, https://doi.org/10.5194/acp-5-715-2005, 2005. a, b
Lubin, D. and Vogelmann, A. M.: A climatologically significant aerosol longwave indirect effect in the Arctic, Nature, 439, 453–456, 2006. a
Mann, G. W., Anderson, P. S., and Mobbs, S. D.: Profile measurements of blowing snow at Halley, Antarctica, J. Geophys. Res., 105, 491–508, 2000. a
Martin, S. J., Wang, P. K., and Pruppacher, H. R.: A Theoretical Determination of the Efficiency with which Aerosol Particles are Collected by Simple Ice Crystal Plates, J. Atmos. Sci., 37, 1628–1638, 1980. a
Mauritsen, T., Sedlar, J., Tjernström, M., Leck, C., Martin, M., Shupe, M., Sjogren, S., Sierau, B., Persson, P. O. G., Brooks, I. M., and Swietlicki, E.: An Arctic CCN-limited cloud-aerosol regime, Atmos. Chem. Phys., 11, 165–173, https://doi.org/10.5194/acp-11-165-2011, 2011. a, b, c, d, e, f, g, h, i, j
McIlhattan, E. A., L'Ecuyer, T. S., and Miller, N. B.: Observational evidence linking Arctic supercooled liquid cloud biases in CESM to snowfall processes, J. Climate, 30, 4477–4495, 2017. a, b
McIlhattan, E. A., Pettersen, C., Wood, N. B., and L'Ecuyer, T. S.: Satellite observations of snowfall regimes over the Greenland Ice Sheet, The Cryosphere, 14, 4379–4404, https://doi.org/10.5194/tc-14-4379-2020, 2020. a, b
Miller, N. B., Turner, D. D., Bennartz, R., Shupe, M. D., Kulie, M. S., Cadeddu, M. P., and Walden, V. P.: Surface-based inversions above central Greenland, J. Geophys. Res.-Atmos., 118, 495–506, 2013. a, b, c
Miller, N. B., Shupe, M. D., Cox, C. J., Walden, V. P., Turner, D. D., and Steffen, K.: Cloud radiative forcing at Summit, Greenland, J. Climate, 28, 6267–6280, 2015. a, b, c, d, e
Miller, N. B., Shupe, M. D., Cox, C. J., Noone, D., Persson, P. O. G., and Steffen, K.: Surface energy budget responses to radiative forcing at Summit, Greenland, The Cryosphere, 11, 497–516, https://doi.org/10.5194/tc-11-497-2017, 2017. a, b
Moran, K. P., Mariner, B. E., Post, M. J., Kropfli, R. A., Welsh, D. C., and Widener, K. B.: An Unattended Cloud-Profiling Radar for Use in Climate Research, B. Am. Meteorol. Soc., 79, 443–455, 1998. a
Morrison, H., De Boer, G., Feingold, G., Harrington, J., Shupe, M. D., and Sulia, K.: Resilience of persistent Arctic mixed-phase clouds, Nat. Geosci., 5, 11–17, 2012. a, b
Norgren, M. S., de Boer, G., and Shupe, M. D.: Observed aerosol suppression of cloud ice in low-level Arctic mixed-phase clouds, Atmos. Chem. Phys., 18, 13345–13361, https://doi.org/10.5194/acp-18-13345-2018, 2018. a
Paramonov, M., Grönholm, T., and Virkkula, A.: Below-cloud scavenging of aerosol particles by snow at an urban site in Finland, Boreal Environ. Res., 16, 304–320, 2011. a
Pettersen, C., Bennartz, R., Merrelli, A. J., Shupe, M. D., Turner, D. D., and Walden, V. P.: Precipitation regimes over central Greenland inferred from 5 years of ICECAPS observations, Atmos. Chem. Phys., 18, 4715–4735, https://doi.org/10.5194/acp-18-4715-2018, 2018. a, b, c, d, e, f
Pettersen, C., Henderson, S., Mattingly, K., Bennartz, R., and Breeden, M.: The Critical Role of Euro-Atlantic Blocking in Promoting Snowfall in Central Greenland, J. Geophys. Res.-Atmos., in review, 2021. a
Pisso, I., Sollum, E., Grythe, H., Kristiansen, N. I., Cassiani, M., Eckhardt, S., Arnold, D., Morton, D., Thompson, R. L., Groot Zwaaftink, C. D., Evangeliou, N., Sodemann, H., Haimberger, L., Henne, S., Brunner, D., Burkhart, J. F., Fouilloux, A., Brioude, J., Philipp, A., Seibert, P., and Stohl, A.: The Lagrangian particle dispersion model FLEXPART version 10.4, Geosci. Model Dev., 12, 4955–4997, https://doi.org/10.5194/gmd-12-4955-2019, 2019. a, b
Possner, A., Ekman, A. M., and Lohmann, U.: Cloud response and feedback processes in stratiform mixed-phase clouds perturbed by ship exhaust, Geophys. Res. Lett., 44, 1964–1972, 2017. a
Prenni, A. J., Harrington, J. Y., Tjernström, M., DeMott, P. J., Avramov, A., Long, C. N., Kreidenweis, S. M., Olsson, P. Q., and Verlinde, J.: Can ice-nucleating aerosols affect Arctic seasonal climate?, B. Am. Meteorol. Soc., 88, 541–550, 2007. a
Rignot, E., Box, J. E., Burgess, E., and Hanna, E.: Mass balance of the Greenland ice sheet from 1958 to 2007, Geophys. Res. Lett., 35, 1–5, 2008. a
Rignot, E., Velicogna, I., van den Broeke, M. R., Monaghan, A., and Lenaerts, J. T.: Acceleration of the contribution of the Greenland and Antarctic ice sheets to sea level rise, Geophys. Res. Lett., 38, L05503, https://doi.org/10.1029/2011GL046583, 2011. a
Roiger, A., Schlager, H., Schäfler, A., Huntrieser, H., Scheibe, M., Aufmhoff, H., Cooper, O. R., Sodemann, H., Stohl, A., Burkhart, J., Lazzara, M., Schiller, C., Law, K. S., and Arnold, F.: In-situ observation of Asian pollution transported into the Arctic lowermost stratosphere, Atmos. Chem. Phys., 11, 10975–10994, https://doi.org/10.5194/acp-11-10975-2011, 2011. a
Schmale, J., Henning, S., Decesari, S., Henzing, B., Keskinen, H., Sellegri, K., Ovadnevaite, J., Pöhlker, M. L., Brito, J., Bougiatioti, A., Kristensson, A., Kalivitis, N., Stavroulas, I., Carbone, S., Jefferson, A., Park, M., Schlag, P., Iwamoto, Y., Aalto, P., Äijälä, M., Bukowiecki, N., Ehn, M., Frank, G., Fröhlich, R., Frumau, A., Herrmann, E., Herrmann, H., Holzinger, R., Kos, G., Kulmala, M., Mihalopoulos, N., Nenes, A., O'Dowd, C., Petäjä, T., Picard, D., Pöhlker, C., Pöschl, U., Poulain, L., Prévôt, A. S. H., Swietlicki, E., Andreae, M. O., Artaxo, P., Wiedensohler, A., Ogren, J., Matsuki, A., Yum, S. S., Stratmann, F., Baltensperger, U., and Gysel, M.: Long-term cloud condensation nuclei number concentration, particle number size distribution and chemical composition measurements at regionally representative observatories, Atmos. Chem. Phys., 18, 2853–2881, https://doi.org/10.5194/acp-18-2853-2018, 2018. a
Schmale, J., Zieger, P., and Ekman, A. M. L.: Aerosols in current and future Arctic climate, Nat. Clim. Change, 11, 95–105, https://doi.org/10.1038/s41558-020-00969-5, 2021. a, b, c
Schmeisser, L., Backman, J., Ogren, J. A., Andrews, E., Asmi, E., Starkweather, S., Uttal, T., Fiebig, M., Sharma, S., Eleftheriadis, K., Vratolis, S., Bergin, M., Tunved, P., and Jefferson, A.: Seasonality of aerosol optical properties in the Arctic, Atmos. Chem. Phys., 18, 11599–11622, https://doi.org/10.5194/acp-18-11599-2018, 2018. a, b, c, d, e
Schmidt, R. A.: Properties of blowing snow, Rev. Geophys., 20, 39–44, 1982. a
Schuenemann, K. C., Cassano, J. J., and Finnis, J.: Synoptic forcing of precipitation over greenland: Climatology for 1961–99, J. Hydrometeorol., 10, 60–78, 2009. a, b, c, d, e
Seinfeld, J. H., Bretherton, C., Carslaw, K. S., Coe, H., DeMott, P. J., Dunlea, E. J., Feingold, G., Ghan, S., Guenther, A. B., Kahn, R., Kraucunas, I., Kreidenweis, S. M., Molina, M. J., Nenes, A., Penner, J. E., Prather, K. A., Ramanathan, V., Ramaswamy, V., Rasch, P. J., Ravishankara, A. R., Rosenfeld, D., Stephens, G., and Wood, R.: Improving our fundamental understanding of the role of aerosol–cloud interactions in the climate system, P. Natil. Acad. Sci. USA, 113, 5781–5790, 2016. a
Shaw, G. E.: The Arctic haze phenomenon, B. Am. Meteorol. Soc., 76, 2403–2414, 1995. a
Sheppard, B. E. and Joe, P. I.: Performance of the precipitation occurrence sensor system as a precipitation gauge, J. Atmos. Ocean. Tech., 25, 196–212, 2008. a, b
Shupe, M.: Millimeter Cloud Radar measurements taken at Summit Station, Greenland, 2019, Arctic Data Center [data set], https://doi.org/10.18739/A2Q52FD4V, 2020a. a
Shupe, M.: Micropulse lidar (MPL) measurements taken at Summit Station, Greenland, 2019, Arctic Data Center [data set], https://doi.org/10.18739/A2862BC30, 2020b. a
Shupe, M.: Precipitation Occurrence Sensor System measurements taken at Summit Station, Greenland, 2019, Arctic Data Center [data set], https://doi.org/10.18739/A2GQ6R30G, 2020c. a
Shupe, M. D. and Intrieri, J. M.: Cloud radiative forcing of the Arctic surface: The influence of cloud properties, surface albedo, and solar zenith angle, J. Climate, 17, 616–628, 2004. a, b
Shupe, M. D., Matrosov, S. Y., and Uttal, T.: Arctic mixed-phase cloud properties derived from surface-based sensors at SHEBA, J. Atmos. Sci., 63, 697–711, 2006. a
Shupe, M. D., Persson, P. O. G., Brooks, I. M., Tjernström, M., Sedlar, J., Mauritsen, T., Sjogren, S., and Leck, C.: Cloud and boundary layer interactions over the Arctic sea ice in late summer, Atmos. Chem. Phys., 13, 9379–9399, https://doi.org/10.5194/acp-13-9379-2013, 2013a. a
Shupe, M. D., Turner, D. D., Walden, V. P., Bennartz, R., Cadeddu, M. P., Castellani, B. B., Cox, C. J., Hudak, D. R., Kulie, M. S., Miller, N. B., Others, Neely, R. R., Neff, W. D., and Rowe, P. M.: High and dry: New observations of tropospheric and cloud properties above the Greenland Ice Sheet, B. Am. Meteorol. Soc., 94, 169–186, 2013b. a, b, c, d, e, f, g
Slater, T., Hogg, A. E., and Mottram, R.: Ice-sheet losses track high-end sea-level rise projections, Nat. Clim. Change, 10, 879–881, https://doi.org/10.1038/s41558-020-0893-y, 2020. a, b
Solomon, A., de Boer, G., Creamean, J. M., McComiskey, A., Shupe, M. D., Maahn, M., and Cox, C.: The relative impact of cloud condensation nuclei and ice nucleating particle concentrations on phase partitioning in Arctic mixed-phase stratocumulus clouds, Atmos. Chem. Phys., 18, 17047–17059, https://doi.org/10.5194/acp-18-17047-2018, 2018. a
Stevens, R. G., Loewe, K., Dearden, C., Dimitrelos, A., Possner, A., Eirund, G. K., Raatikainen, T., Hill, A. A., Shipway, B. J., Wilkinson, J., Romakkaniemi, S., Tonttila, J., Laaksonen, A., Korhonen, H., Connolly, P., Lohmann, U., Hoose, C., Ekman, A. M. L., Carslaw, K. S., and Field, P. R.: A model intercomparison of CCN-limited tenuous clouds in the high Arctic, Atmos. Chem. Phys., 18, 11041–11071, https://doi.org/10.5194/acp-18-11041-2018, 2018. a, b, c, d
Stohl, A.: Characteristics of atmospheric transport into the Arctic troposphere, J. Geophys. Res.-Atmos., 111, 1–17, 2006. a, b, c
Storelvmo, T.: Aerosol effects on climate via mixed-phase and ice clouds, Annu. Rev. Earth Pl. Sc., 45, 199–222, 2017. a
The IMBIE Team: Mass balance of the Greenland Ice Sheet from 1992 to 2018, Nature, 579, 233–239, https://doi.org/10.1038/s41586-019-1855-2, 2020. a, b
Thomas, M. A., Devasthale, A., Tjernström, M., and Ekman, A. M. L.: The Relation Between Aerosol Vertical Distribution and Temperature Inversions in the Arctic in Winter and Spring, Geophys. Res. Lett., 46, 2836–2845, 2019. a
Trusel, L. D., Das, S. B., Osman, M. B., Evans, M. J., Smith, B. E., Fettweis, X., Mcconnell, J. R., Noël, B. P. Y., and van den Broeke, M. R.: Nonlinear rise in Greenland runoff in response to post-industrial Arctic warming, Nature, 564, 104–108, 2018. a
Turner, D. and Bennartz, R.: Microwave Radiometer measurements of sky brightness temperature taken at Summit Station, Greenland, 2019, Arctic Data Center [data set], https://doi.org/10.18739/A2542J92G, 2020. a
Turner, D. D., Clough, S. A., Liljegren, J. C., Clothiaux, E. E., Cady-Pereira, K. E., and Gaustad, K. L.: Retrieving Liquid Water Path and Precipitable Water Vapor From the Atmospheric Radiation Measurement (ARM) Microwave Radiometers, IEEE T. Geosci. Remote, 45, 3680–3690, 2007. a
Twomey, S.: The influence of pollution on the shortwave albedo of clouds, J. Atmos. Sci., 34, 1149–1152, 1977. a, b
Ulbrich, U., Pinto, J. G., Kupfer, H., Leckebusch, G. C., Spangehl, T., and Reyers, M.: Changing Northern Hemisphere storm tracks in an ensemble of IPCC climate change simulations, J. Climate, 21, 1669–1679, 2008. a
van den Broeke, M. R., Enderlin, E. M., Howat, I. M., Kuipers Munneke, P., Noël, B. P. Y., van de Berg, W. J., van Meijgaard, E., and Wouters, B.: On the recent contribution of the Greenland ice sheet to sea level change, The Cryosphere, 10, 1933–1946, https://doi.org/10.5194/tc-10-1933-2016, 2016. a, b, c
Van Tricht, K., Lhermitte, S., Lenaerts, J., Gorodetskaya, I., L'Ecuyer, S., Noël, B., Van Den Broeke, M., Turner, D., and Van Lipzig, N.: Clouds enhance Greenland ice sheet meltwater runoff, Nat. Commun., 7, 10266, https://doi.org/10.1038/ncomms10266, 2016. a, b, c
von der Weiden, S.-L., Drewnick, F., and Borrmann, S.: Particle Loss Calculator – a new software tool for the assessment of the performance of aerosol inlet systems, Atmos. Meas. Tech., 2, 479–494, https://doi.org/10.5194/amt-2-479-2009, 2009. a, b, c, d
Walden, V. P. and Shupe, M.: Radiosonde temperature and humidity profiles taken at Summit Station, Greenland, 2019, Arctic Data Center [data set], https://doi.org/10.18739/A20P0WR53, 2020. a
Wex, H., Huang, L., Zhang, W., Hung, H., Traversi, R., Becagli, S., Sheesley, R. J., Moffett, C. E., Barrett, T. E., Bossi, R., Skov, H., Hünerbein, A., Lubitz, J., Löffler, M., Linke, O., Hartmann, M., Herenz, P., and Stratmann, F.: Annual variability of ice-nucleating particle concentrations at different Arctic locations, Atmos. Chem. Phys., 19, 5293–5311, https://doi.org/10.5194/acp-19-5293-2019, 2019. a, b
Willis, M. D., Leaitch, W. R., and Abbatt, J. P.: Processes Controlling the Composition and Abundance of Arctic Aerosol, Rev. Geophys., 56, 621–671, https://doi.org/10.1029/2018RG000602, 2018. a
Ziemba, L. D., Dibb, J. E., Griffin, R. J., Huey, L. G., and Beckman, P.: Observations of particle growth at a remote, Arctic site, Atmos. Environ., 44, 1649–1657, 2010. a, b, c