the Creative Commons Attribution 4.0 License.
the Creative Commons Attribution 4.0 License.
 | 14 Oct 2021
Nighttime chemistry of biomass burning emissions in urban areas: A dual mobile chamber study
Spiro D. Jorga
Kalliopi Florou
Christos Kaltsonoudis
John K. Kodros
Christina Vasilakopoulou
Manuela Cirtog
Axel Fouqueau
Bénédicte Picquet-Varrault
Athanasios Nenes
Spyros N. Pandis
Residential biomass burning for heating purposes is an important source of air pollutants during winter. Here we test the hypothesis that significant secondary organic aerosol production can take place even during winter nights through oxidation of the emitted organic vapors by the nitrate (NO3) radical produced during the reaction of ozone and nitrogen oxides. We use a mobile dual smog chamber system which allows the study of chemical aging of ambient air against a control reference. Ambient urban air sampled during a wintertime campaign during nighttime periods with high concentrations of biomass burning emissions was used as the starting point for the aging experiments. Biomass burning organic aerosol (OA) was, on average, 70 % of the total OA at the beginning of our experiments. Ozone was added in the perturbed chamber to simulate mixing with background air (and subsequent NO3 radical production and aging), while the second chamber was used as a reference. Following the injection of ozone, rapid OA formation was observed in all experiments, leading to increases in the OA concentration by 20 %–70 %. The oxygen-to-carbon ratio of the OA increased on average by 50 %, and the mass spectra of the produced OA was quite similar to the oxidized OA mass spectra reported during winter in urban areas. Furthermore, good correlation was found for the OA mass spectra between the ambient-derived emissions in this study and the nocturnal aged laboratory-derived biomass burning emissions from previous work. Concentrations of NO3 radicals as high as 25 ppt (parts per trillion) were measured in the perturbed chamber, with an accompanying production of 0.1–3.2 µg m−3 of organic nitrate in the aerosol phase. Organic nitrate represented approximately 10 % of the mass of the secondary OA formed. These results strongly indicate that the OA in biomass burning plumes can chemically evolve rapidly even during wintertime periods with low photochemical activity.
- Article
(2323 KB) - Full-text XML
-
Supplement
(488 KB) - BibTeX
- EndNote


Biomass burning from residential heating, agricultural fires, prescribed burning, and wildfires is a major source of atmospheric pollutants worldwide (Watson, 2002; Bond et al., 2004; Robinson et al., 2006). Emissions from biomass burning contribute both primary organic aerosol (POA) and organic vapors that, upon further reactions in the atmosphere, can produce secondary organic aerosol (SOA; Andreae and Merlet, 2001; Akagi et al., 2011; Bruns et al., 2016; Akherati et al., 2020). The use of wood burning for domestic heating purposes is one of the major sources of organic aerosol (OA) in many countries and is a major contributor to the violation of daily particulate matter (PM) standards in European cities (Alfarra et al., 2007; Favez et al., 2010; Fuller et al., 2014). Biomass burning emissions and their products have significant, but still uncertain, impacts on human health and climate (Ford et al., 2018; O'Dell et al., 2019).
The organic aerosol emitted during biomass burning undergoes extensive physical and chemical changes in the atmosphere. More volatile components evaporate as emissions dilute in the atmosphere (Tkacik et al., 2017); these semivolatile organic compounds (SVOCs), together with the other emitted intermediate volatility (IVOCs) and volatile organic compounds (VOCs), are subsequently oxidized, leading to the production of SOA. Photochemical oxidation of biomass burning emissions and the resulting SOA production have been studied both in the laboratory (Hennigan et al., 2011; Ortega et al., 2013; Tkacik et al., 2017; Ahern et al., 2019; Kodros et al., 2020) and in the field (Capes et al., 2008; Jolleys et al., 2015; Vakkari et al., 2018). The reactions of VOCs, IVOCs, and SVOCs with the OH radical are considered to be the dominant chemical pathway for oxidation, but reactions of emitted monoterpenes with ozone can also contribute to the SOA formation during the chemical aging of biomass burning emissions (Yu et al., 1999; Zhao et al., 2015). Despite considerable uncertainties remaining on the amount of SOA that can be produced, and the net change in the biomass burning OA concentration when evaporation is considered, it is clear that this daytime processing is important for converting the fresh biomass burning OA to oxidized OA (OOA; Bougiatioti et al., 2014).
Atmospheric processing of biomass burning OA during periods of low photochemical activity (such as in winter or at night), known also as “dark” aging, has received substantially less attention than photochemical processing. Recent aircraft measurements during agricultural biomass burning periods indicated that nighttime oxidation of biomass burning VOCs is dominated by NO3 (Decker et al., 2019). Hartikainen et al. (2018) reported high amounts of nitrogen-containing organic compounds both in the gas and particle phase after dark aging of residential wood combustion emissions. Kodros et al. (2020) reported significant and rapid OOA production in laboratory experiments in which fresh biomass burning emissions were exposed to NO3 and suggested that dark oxidation may be an important process on regional scales. In the same study, ambient measurements in an urban area suggested that the mixing of O3 from the residual layer down to the nocturnal boundary layer can enhance the formation of NO3 and the nighttime oxidation of biomass burning emissions. The mixing of ozone from the residual layer and the importance to nighttime chemistry was also suggested in studies on nighttime oxidation of biogenic VOCs (Brown et al., 2009, 2013). Despite this important finding, the degree to which biomass burning plumes undergo nighttime aging and produce significant amounts of SOA remains poorly understood. Lacking consideration of such nocturnal chemistry in transport models has been suggested as being a possible source of the underprediction of oxidized organic aerosol mass by a factor of 3–5 (Fountoukis et al., 2016; Tsimpidi et al., 2014) during wintertime in polluted areas with low photochemical activity.
Fresh biomass burning emissions from a single source have been used as the starting point of almost all previous laboratory smog chamber studies. The use of a dual-chamber system with a starting point of ambient air rich in biomass burning emissions, but also primary and secondary pollutants from other sources, offers a bridge between traditional laboratory studies and ambient observations. Such a system offers the capability of aging realistic biomass burning emissions from multiple sources and fuels diluted in the atmosphere and mixed with other pollutants (e.g., NOx from transportation). In this study, we take advantage of the high levels of OA from residential biomass burning in Patras, Greece (the country's third-largest city), to investigate the importance of nighttime chemistry in the processing of biomass burning OA. Biomass burning leads to concentrations of OA exceeding 50 µg m−3 in Patras in the early evening (Florou et al., 2017). A dual atmospheric simulation chamber system is used to elucidate the formation of SOA during winter periods in urban areas with high biomass burning organic aerosol concentrations.
2.1 Dual-chamber system
The dual-chamber system developed by Kaltsonoudis et al. (2019) was used for experiments in early 2020 in Patras, Greece, during the PyroTRACH-PANACEA Wintertime 2020 experiment. The system consists of two 1.5 m−3 Teflon (PTFE) reactors attached to metallic frames. Use of the second reactor as a reference (control chamber) allows the identification and potential correction of any major experimental artifacts that could be due to the walls of the chamber and the other complexities of this experimental system. The dual-chamber system was deployed from 10 January until 15 February 2020 in the city of Patras. The chambers, along with the available instrumentation, were located indoors, at the campus of the University of Peloponnese, approximately a few kilometers away from the center of the city (Fig. S1 in Supplement). The windows of the laboratory were kept open before and during the experiments, so the temperature of the dual-chamber system was in the 12–20 ∘C range, while the outdoor temperature was, on average, 5 ∘C lower. The relative humidity (RH) in the chambers ranged from 35 % to 45 %.
2.2 Experimental description
Both chambers were flushed with ambient air before each experiment, using a metal bellows pump (Senior Aerospace; MB-602) for 1–2 h. This process is used to achieve higher sampling efficiency and brings the system (chamber walls and tubing) close to equilibrium, with ambient air reducing losses of vapors to the sampling lines and walls of the chamber. Ambient air during nighttime cold periods was introduced inside both chambers. In one of the chambers (perturbed chamber), ozone was added and, upon reaction with the existing NOx in the chamber, formed NO3 radicals. The second chamber (control chamber) was used as the reference in order to help us understand the unperturbed evolution of the system inside the chamber. During all experiments, the chambers were kept under dark conditions. Ambient air was flushed through each of the chambers with a flow of 80 L min−1. More than 70 % of the ambient PM was transferred to the chambers, and the concentrations of the measured VOCs were within 5 % of their ambient values.
Using an automated valve switching between the two reactors, the particle and gas concentrations in both chambers were measured. Data were collected 1.5 min after the switching of the valve to avoid any memory effects related to the sampling lines. For the gas phase measurements, PTFE tubing (0.25 in or 0.61 cm) was used, while for the particle phase the tubing was copper (0.25 in or 0.61 cm).
After filling the chambers with ambient air, the content of each chamber was characterized for approximately 1 h. The ozone added in the perturbed chamber after the characterization period was in the range of 50–250 ppb (parts per billion). These values are higher than the 20 ppb measured during the nighttime in Patras in this campaign, but some acceleration of the corresponding chemical processes is necessary to reduce the effects of the walls and to limit the duration of the experiments in the relatively small chambers used.
In selected experiments, approximately 40 ppb of d9-butanol was added in both chambers to measure the OH concentration. Following Barmet et al. (2012), the OH concentration in the chambers was estimated with the measured decay of the butanol concentration, assuming a reaction rate constant with OH of cm−3 molecule−1 s−1.
An incoherent broadband cavity-enhanced absorption spectrometer (IBB-CEAS) was used to measure the NO3 radical concentration. Detailed information about the technique can be found elsewhere (Venables et al., 2006; Ventrillard-Courtillot et al., 2010; Chen and Venables, 2011; Fouqueau et al., 2020). Briefly, the light from a LED source centered on the 662 nm absorption cross section of NO3 radical is focused and introduced into a high-finesse optical cavity composed of two high-reflectivity (∼ 99.98 %) and 1 m curvature mirrors. The optical cavity has a length of 0.61 m and allows up to 4.5 km (at 662 nm) optical path and a detection limit up to 3 ppt (parts per trillion; integration time of 10 s). Particle-free air is passed through the cavity at 2.5 L min−1. Spectra between 640 and 685 nm were recorded with an Ocean Optics QE65 Pro spectrometer. A time resolution of 1 min was selected for these experiments. Calibration with NO2 (800 ppb in dry nitrogen; Air Liquide) was performed daily in order to precisely determine the reflectivity of the mirrors and estimate the optical path. The sample spectra were fitted against standard spectra of the following gas species absorbing in the spectral region of the instrument: NO3 radical (Orphal et al., 2003), NO2 (Vandaele et al., 1998), and H2O (reference spectrum recorded with the instrument) using the DOASIS software.
A quadrupole proton transfer reaction mass spectrometer (PTR-MS; Ionicon Analytik GmbH) was used to measure the concentration of VOCs, including d9-butanol. We calculated the initial VOC levels in the chambers using the concentrations of 42 (acetonitrile), 69 (isoprene), 71 (MVK or methyl vinyl ketone and MACR or methacrolein), 73 (MEK methyl ethyl ketone), 79 (benzene), 93 (toluene), and 107 (xylene). We used the above peaks because the PTR-MS was calibrated for those values. For the experiments for which the PTR-MS was not available, we scaled the initial VOC concentration using the black carbon (BC) levels. Using a series of gas monitors, the concentration of nitrogen oxides (NO and NO2 and ozone (O3) were measured (Teledyne API models T201 and 400E, respectively).
A TSI scanning mobility particle sizer (SMPS; classifier model 3080; differential mobility analyzer, DMA, model 3081; condensation particle counter, CPC, model 3775) was used for measuring the particle number distribution in the 15–700 nm range. An Aerodyne high-resolution time-of-flight aerosol mass spectrometer (HR-ToF-AMS) was measuring the composition and mass spectrum of OA. We did not use a dryer before the instruments and the RH of the samples were recorded. For the analysis of the HR-ToF-AMS data, we used the AMS software toolkit (SQUIRREL v1.57I) and for the high-resolution data the Peak Integration by Key Analysis (PIKA v1.16I) software. The elemental ratios were calculated using the improved method of Canagaratna et al. (2015). The mass concentration and particle distribution of BC were measured using a single particle soot photometer (SP2; Droplet Measurement Techniques).
The collection efficiency (CE) of the AMS was calculated, applying the algorithm of Kostenidou et al. (2007), comparing the SMPS volume distributions and the AMS mass distributions. The CE ranged between 0.40–0.45, depending on the experiment. Using the same algorithm, the density of the OA was calculated to be in the range of 1.25–1.4 g cm−3. Using the theta (θ) angle (Kostenidou et al., 2009), a comparison between the OA spectra of the ambient and the chamber content after filling, we concluded that the OA composition injected in the chambers was the same as in the ambient air. The theta angle between the two chambers and the ambient OA spectra was always less than 4∘, suggesting excellent agreement. Also, the OA mass spectra in the two chambers right after their filling was in very good agreement (θ= 3–4∘), confirming that both chambers had the same OA composition initially. The θ angle is a useful metric for the comparison of OA mass spectra, similar to the often used R2. A θ angle of two AMS spectra in the 0–5∘ range indicates an excellent match between the compared spectra, which should be considered identical for all practical purposes (R2 ranging from 1 to 0.99). For a θ angle of 6–10∘, there is a good match (R2 approximately 0.98–0.96), but there are some small differences. A θ of 11–15∘ shows that the spectra are quite similar, but they are not the same (R2 is 0.95–0.92), while for a θ in the 16–30∘ range the spectra are coming from different sources, but there are some similarities (R2 is 0.91–0.73). A θ angle higher than 30∘ suggests clearly different AMS spectra. We use the θ angle in this study due to its ability to better represent relatively small differences than the coefficient of determination.
Following the completion of each perturbation experiment, a wall loss characterization experiment was conducted to measure the size-dependent particle wall loss rate constant inside the two chambers (Wang et al., 2018). The particles were produced by the atomization (TSI; model 3076) of an aqueous solution of ammonium sulfate (5 g L−1). The ammonium sulfate after the atomizer passed through a diffusion dryer and was then injected in the chambers without passing through a neutralizer. Using an ionizing fan, the chamber walls were swept before the start of each experiment to keep the particle loss rates low (Jorga et al., 2020).
The perturbation experiments started around 17:30–18:30 LT (local time) each evening (approximately 30 min after sunset which, during the campaign, was from 17:00 to 18:00 LT), when the OA concentration was elevated from local nocturnal biomass burning emissions in the area for heating. The initial conditions in the experiments are summarized in Table 1. In total, 13 experiments, 11 involving perturbation and 2 blank experiments, in which no ozone was injected in either chamber, were performed during January and February 2020 using ambient air from Patras.
Table 1Initial conditions for the dual-chamber experiments.
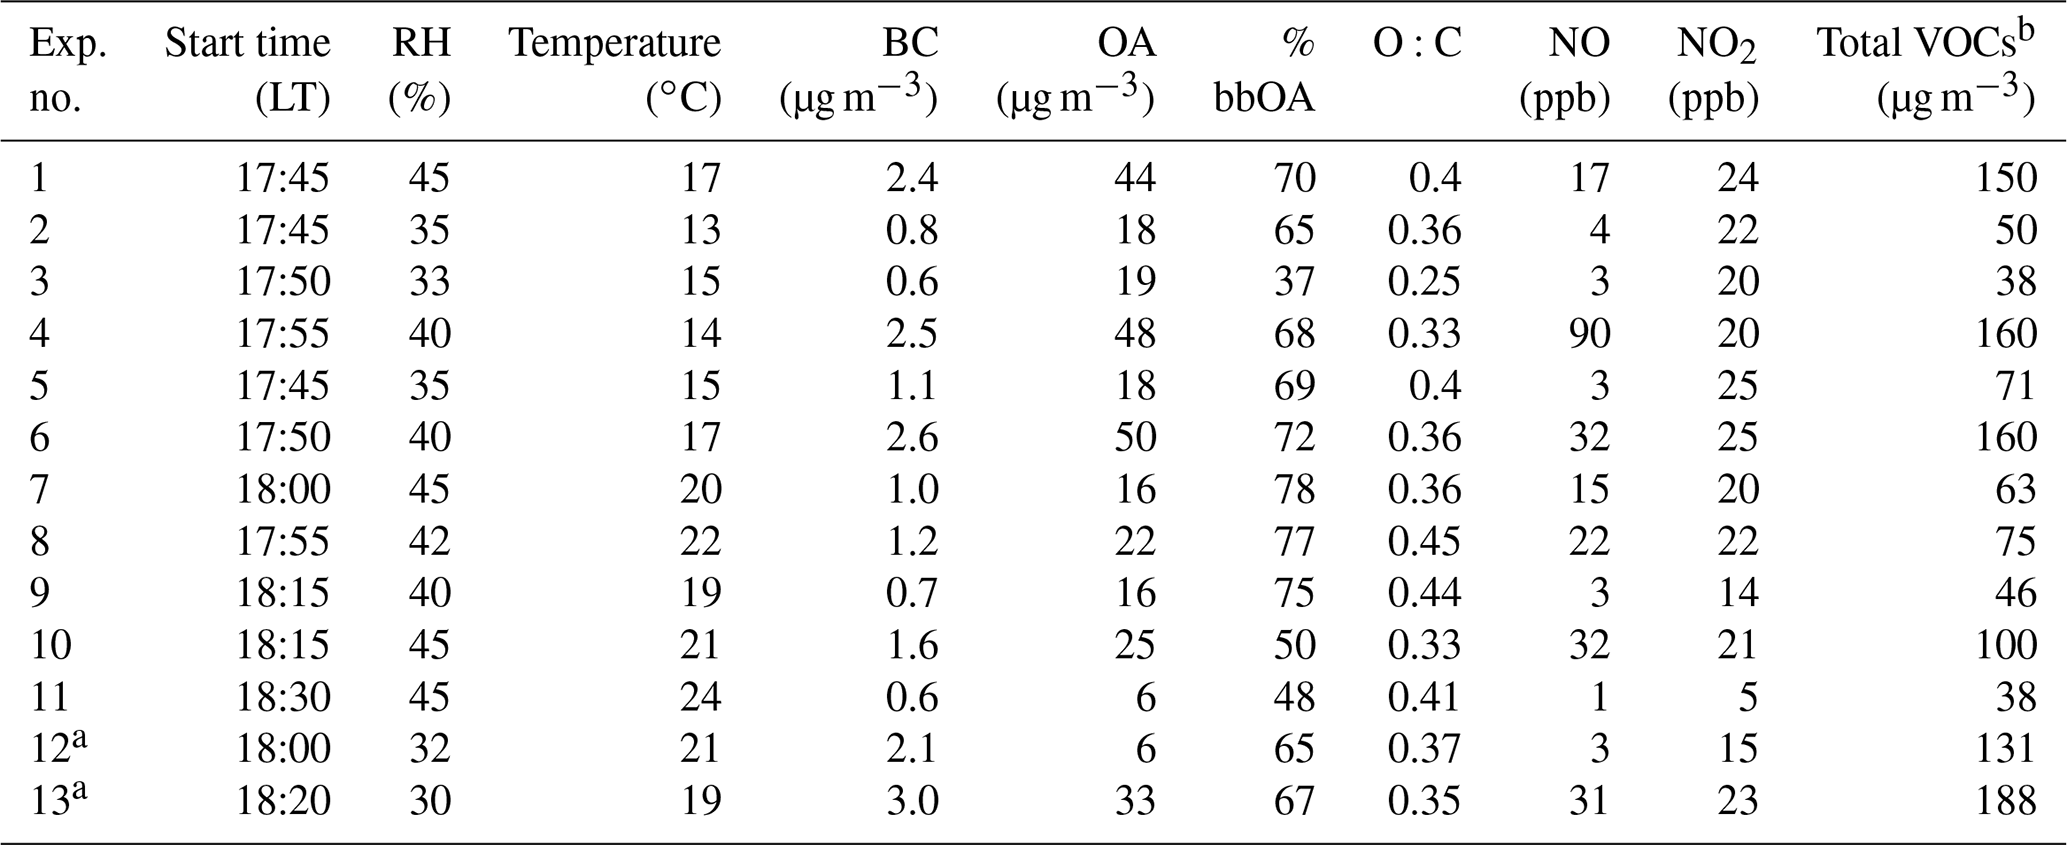
a Blank experiment. b Sum of the VOCs quantified by the PTR-MS.
Our study was designed so that the experiments would start when biomass burning was the major source of both organic aerosol and VOCs. In this section, we first present in detail the results of one typical experiment (Exp. 1), and then we summarize the results of the rest of the conducted experiments. Exp. 1 started during an early evening period with moderate to high concentrations of biomass burning OA (bbOA), VOCs, and NOx (Table 1) and combined all the necessary elements to demonstrate the behavior of the system studied.
3.1 Results of a typical perturbation experiment
The average PM1 concentration in the chambers during the filling process of Exp. 1 was approximately 50 µg m−3. The concentration of OA during that period was 44 µg m−3, with 2.4 µg m−3 of BC. The positive matrix factorization (PMF) analysis of the full campaign ambient data set suggested that 70 % of the OA at the time of filling originated from biomass burning (Kaltsonoudis et al., 2021). Other OA sources included cooking OA or COA (15 %), oxygenated OA or OOA (10 %), and hydrocarbon-like OA or HOA (5 %). PMF was applied to the high-resolution AMS organic mass spectra ( up to 300) at 3 min resolution from the month-long field campaign. Solutions with one to seven factors were investigated. The best solution included four factors corresponding to bbOA, OOA, COA, and HOA. The time series of the four factors during the full field campaign are shown in Fig. S2. The detailed analysis of the field campaign, the determination of the PMF factors, and particle and gas measurements will be included in a forthcoming publication.
The initial concentration of O3 in the two chambers was 10 ppb, of NO 17 ppb, and of NO2 24 ppb, with the values within 5 % of their ambient concentrations. The measured initial VOC levels were approximately 150 µg m−3, while the RH inside both chambers was approximately 45 %. The rest of the conditions are summarized in Table 1.
In Exp. 1, NO2 increased to 30 ppb in the perturbed chamber in approximately 30 min after the ozone injection, while at the same time NO levels dropped to close to zero. In the perturbed chamber, 2 h after the injection, the mixing ratio of NO2 was 18 ppb and of ozone 220 ppb. In the control chamber, the concentrations of the abovementioned gases remained within 10 % of their initial levels. Due to the time needed for mixing and the rapid reaction of NO and O3, it is difficult to measure accurately the injected O3 concentration. A zeroth order estimate can be made, assuming that the injected amount of ozone is equal to the final (equilibrated) amount of ozone in the perturbed chamber plus the reacted NOx (Table S1). Based on this zeroth order estimate, the injected ozone in Exp. 1 was approximately 240 ppb.
Following the injection of ozone in the perturbed chamber (t=0 h), there was a rapid increase in OA (Fig. 1). Approximately 33 µg m−3 of SOA was produced in 2.5 h (70 % increase from the initial injected OA levels). In just 1 h after the injection of ozone, the OA concentration increased by approximately 25 µg m−3. This high-rate secondary OA production rate of approximately 25 is at least partially due to the high ozone levels used in these experiments to accelerate the corresponding chemistry and reduce the problems caused by losses of both particles and vapors to the walls of the chamber. Although this formation rate is true under high ozone levels, the absolute increase in the OA concentration indicates the strong potential of the ambient air in an urban area with strong biomass burning emissions to form SOA even under dark conditions. The change in OA in the control chamber after the particle wall loss corrections was less than 7 % at all times. This strongly indicates that the OA changes in the perturbation chamber were not due to experimental artifacts.

Figure 1Particle wall-loss-corrected aerosol mass concentration (CE =0.4) for the AMS-measured (a) organics, (b) sulfate, (c) nitrates, and (d) ammonium in both the perturbed (red line) and the control chamber (blue line) during Exp. 1.
The sulfate concentration remained practically the same (within 10 %) in both the perturbed and the control chambers after accounting for particle wall losses. The initial nitrate in the perturbed chamber was 1 µg m−3 more than in the control. This small difference can be an artifact of the sampling system in this specific experiment. Production of approximately 6 µg m−3 of aerosol nitrate was observed in the perturbed chamber, with the majority of this increase in the form of organic nitrate. Using the method described in Farmer et al. (2010), using the ratio from the AMS, we estimate that close to 60 % of the formed secondary aerosol nitrate in the perturbed chamber was organic nitrate. Details of the organic nitrate estimation approach can be found in the Supplement. Taking into account the organic nitrate, there was a 77 % increase in the OA compared to the initial concentration.
An increase in the ammonium concentration by close to 1 µg m−3 was observed in the perturbed chamber (a 90 % increase in ammonium compared to its levels before the injection of ozone), while in the control chamber its concentration remained within 8 % of the initial value. Most of this increase was due to the formation of ammonium nitrate. Approximately 40 % of the total nitrate formed was inorganic nitrate, which requires approximately 1 µg m−3 of ammonium to be neutralized. So, the increase in ammonium is consistent with the increase in inorganic nitrate, assuming that ammonium nitrate was formed.
3.2 Organic aerosol spectra
Figure 2 represents the OA mass spectra in the two chambers at the start and end of Exp. 1. The comparison of the OA mass spectra in the perturbed chamber at the beginning (after the air injection) and at the end (2.5 h after the ozone injection) of Exp. 1 indicates that there was an increase in the fractional signal of : 28 (CO+), 29 (CHO+), 30 (CH2O+), 43 (C2H3O+), and 44 (). The highest decrease was observed in 55 (), 57 (), 60 (), 69 (), 91 (), and 95 (). The θ angle between the spectra was 19∘, indicating significant change. The initial and final spectra in the control chamber had a θ angle of 8∘, with changes in 28, 44, 57, and 60.
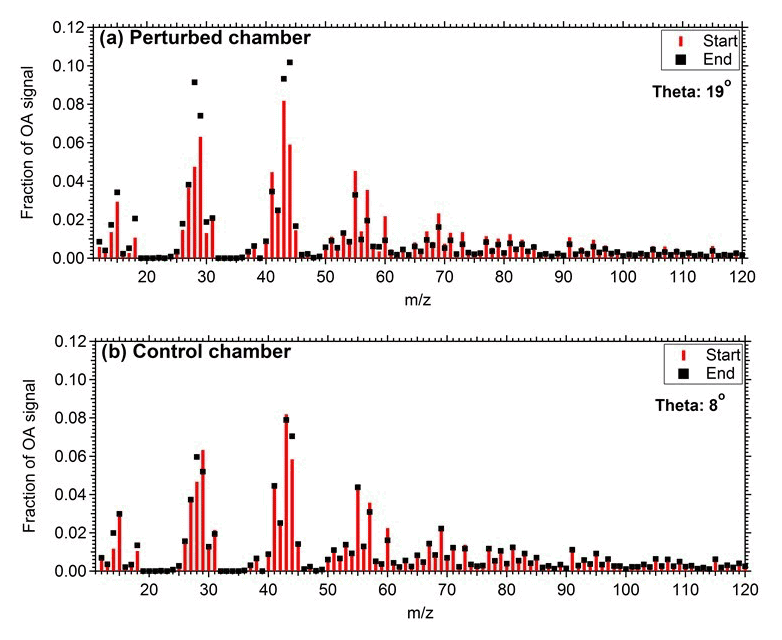
Figure 2Mass spectra of OA during Exp. 1 in the (a) perturbed chamber and (b) control chamber at the start of the experiment (after the filling process) and at the end of the experiment.
The O:C in the control chamber remained practically constant during Exp. 1, with a value close to 0.4 (Fig. 3). This suggests that there was relatively low chemical activity in this chamber. This is consistent with the small change in the OA mass spectrum. This activity could be due to the existing O3 and any produced NO3 in the control chamber. On the contrary, in the perturbed chamber, after the injection of ozone, the O:C increased rapidly, reaching 0.52 after 30 min. At the end of the experiment, the O:C in the perturbed chamber reached a value of 0.61, similar to the measured ambient value at around 03:00 LT.
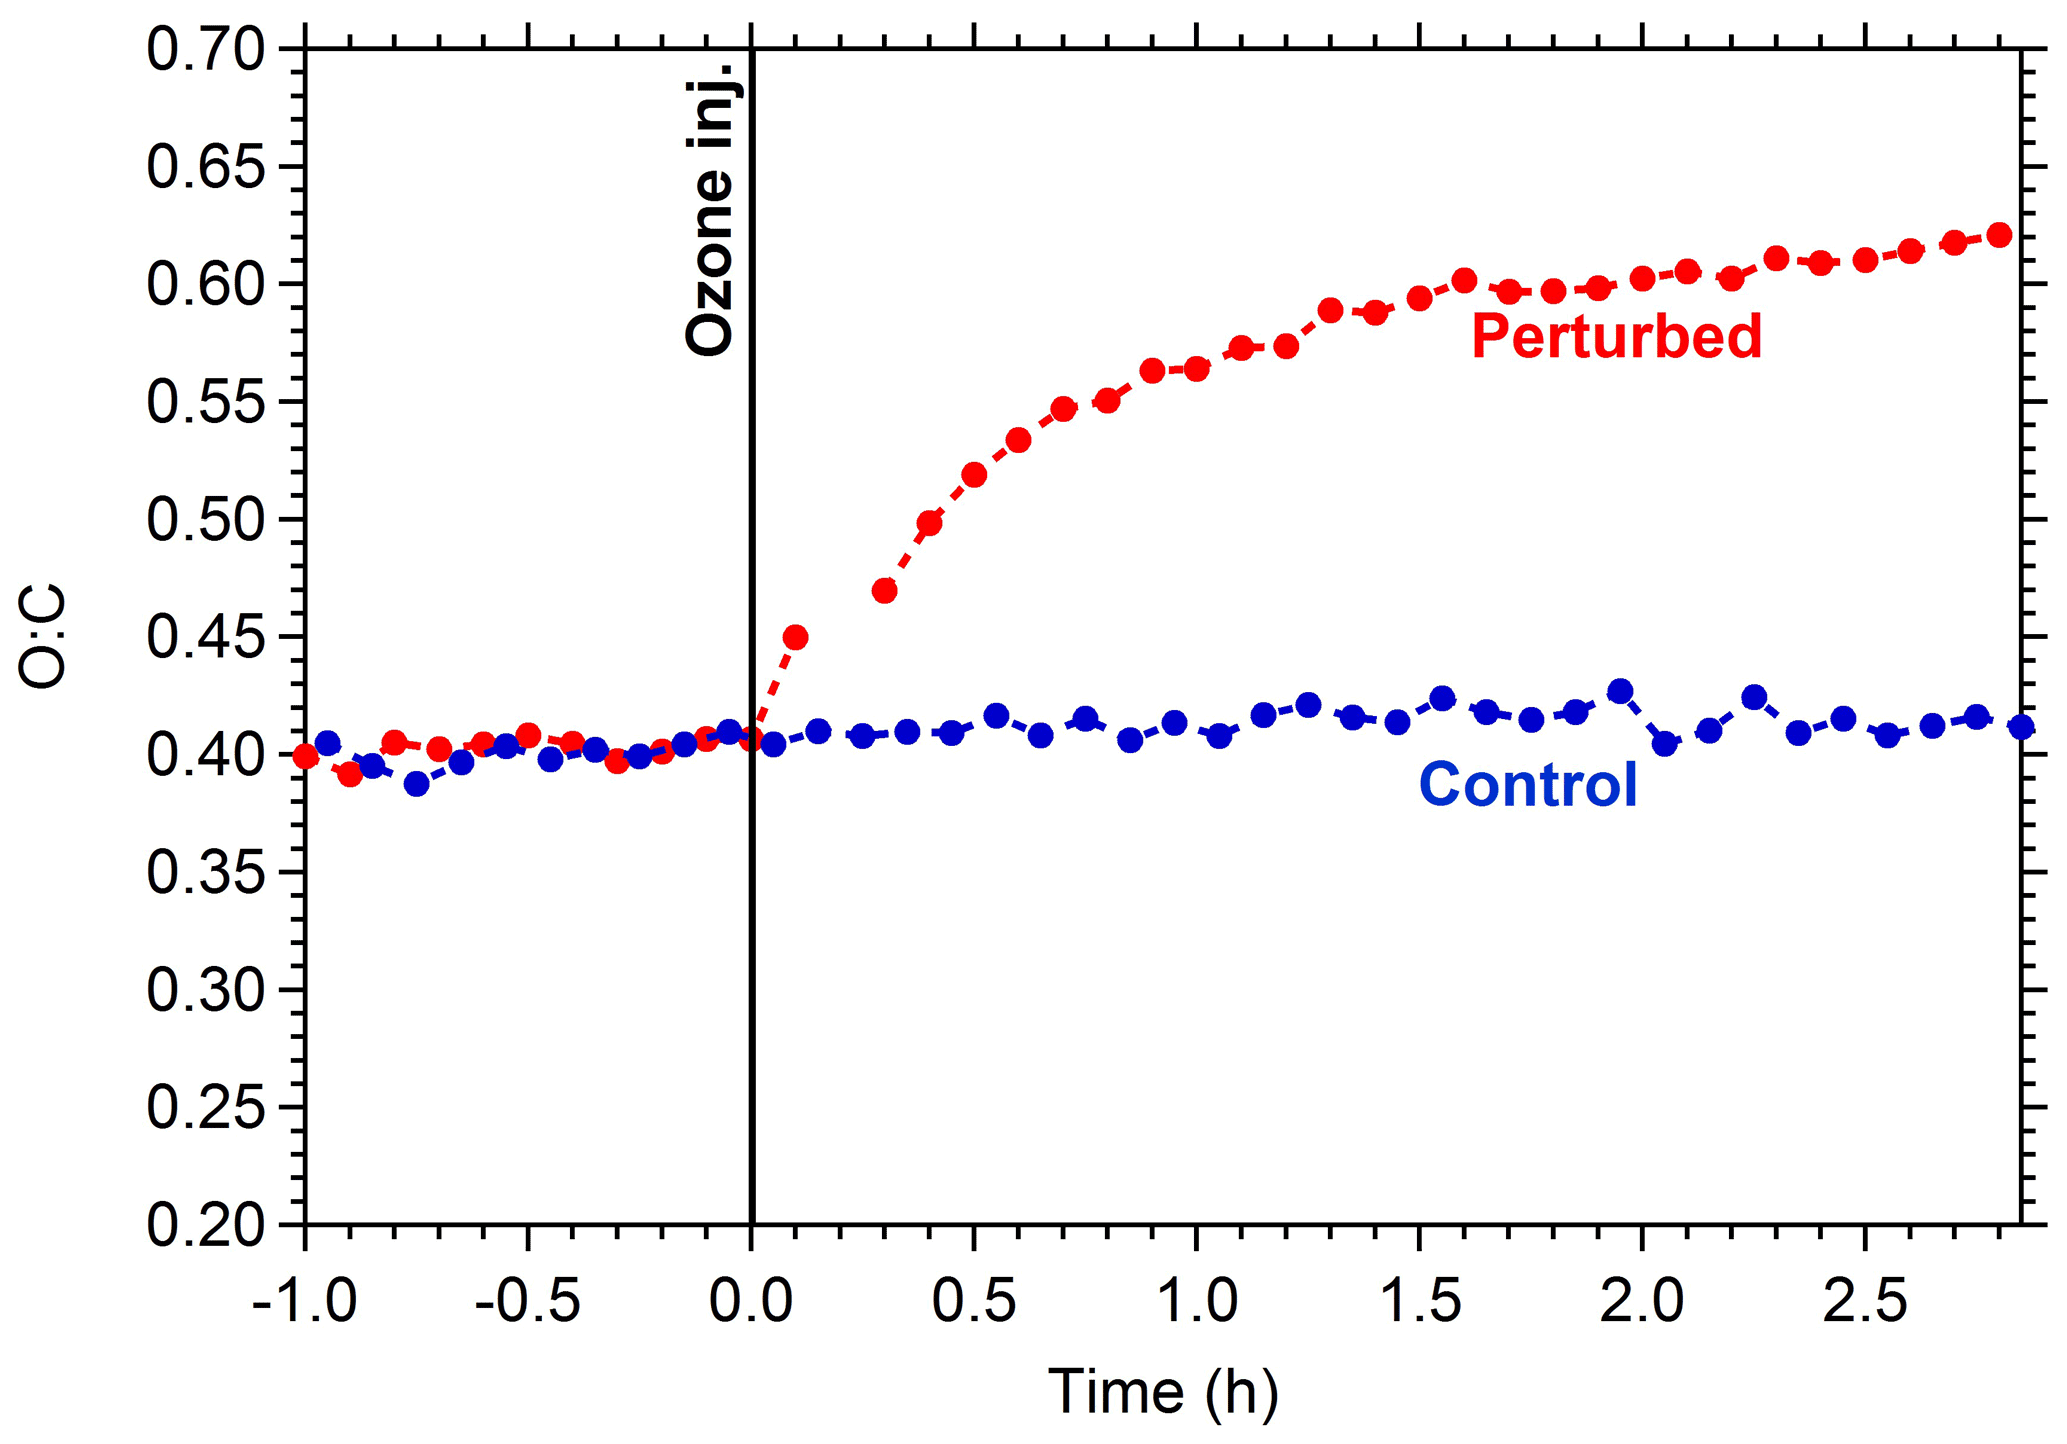
Figure 3Oxygen-to-carbon ratio of the OA in the perturbed (red line) and the control chamber (blue line) during Exp. 1.
To calculate the mass spectrum of the produced OA in the perturbed chamber, we used a simple mass balance approach. Details about this method can be found in Jorga et al. (2020). Concisely, assuming that the main processes in the chamber are losses of particles to the chamber walls and SOA formation, we estimate the initial (before the injection of ozone) and produced OA mass spectra. Using the size-dependent particle loss rate constant measured at the end of each experiment, the concentration of the preexisting OA as a function of time can be calculated. The preexisting OA concentration in the perturbation chamber decreased from approximately 30 to 12 µg m−3 during Exp. 1 (Fig. 4). Additional information about the particle loss correction approach, together with the size dependence of the particle loss rate constants for Exp. 1 (Fig. S3), can be found in the Supplement. The produced SOA that remains suspended in the chamber is then the difference between the total measured and the preexisting or “initial” OA (Fig. 4). The maximum concentration of the produced SOA was 23 µg m−3, but it was gradually reduced to 15 µg m−3 due to the particle losses to the walls. With the concentrations of the preexisting OA and the produced SOA both suspended in the chamber (these are the actual concentrations not corrected for wall losses), the AMS spectra that correspond to the sum of the two, the spectrum of the produced SOA, can be estimated. Figure 5 shows the resulting spectra for the produced SOA both for Exp. 1 and the average SOA spectra for all the experiments. The similarity of the spectra supports our choice of Exp. 1 as representative of the rest.
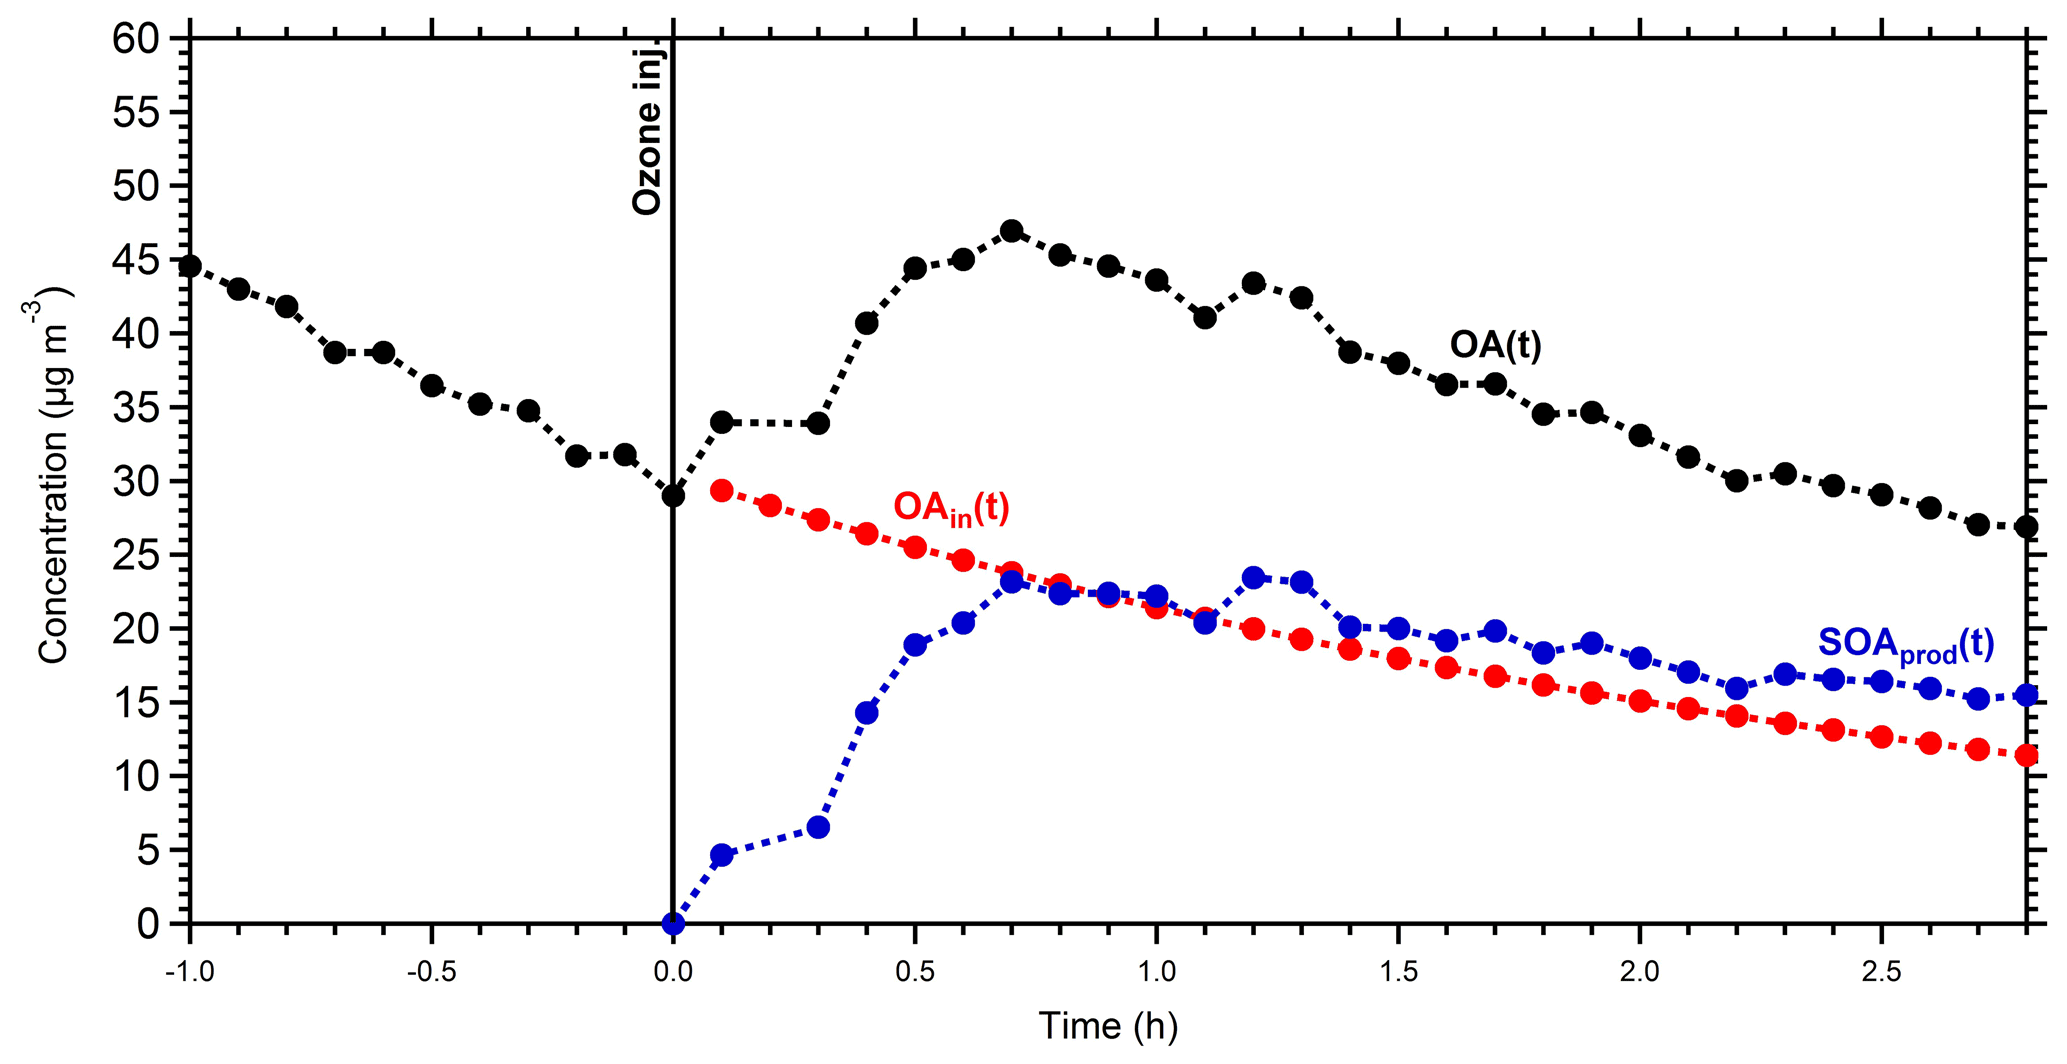
Figure 4Mass concentration of the measured OA (black points), the initial OA (red points), and the produced SOA (blue points) in the perturbed chamber in Exp. 1. All concentrations refer to the suspended aerosol in the chamber and do not include the material deposited on the chamber walls.
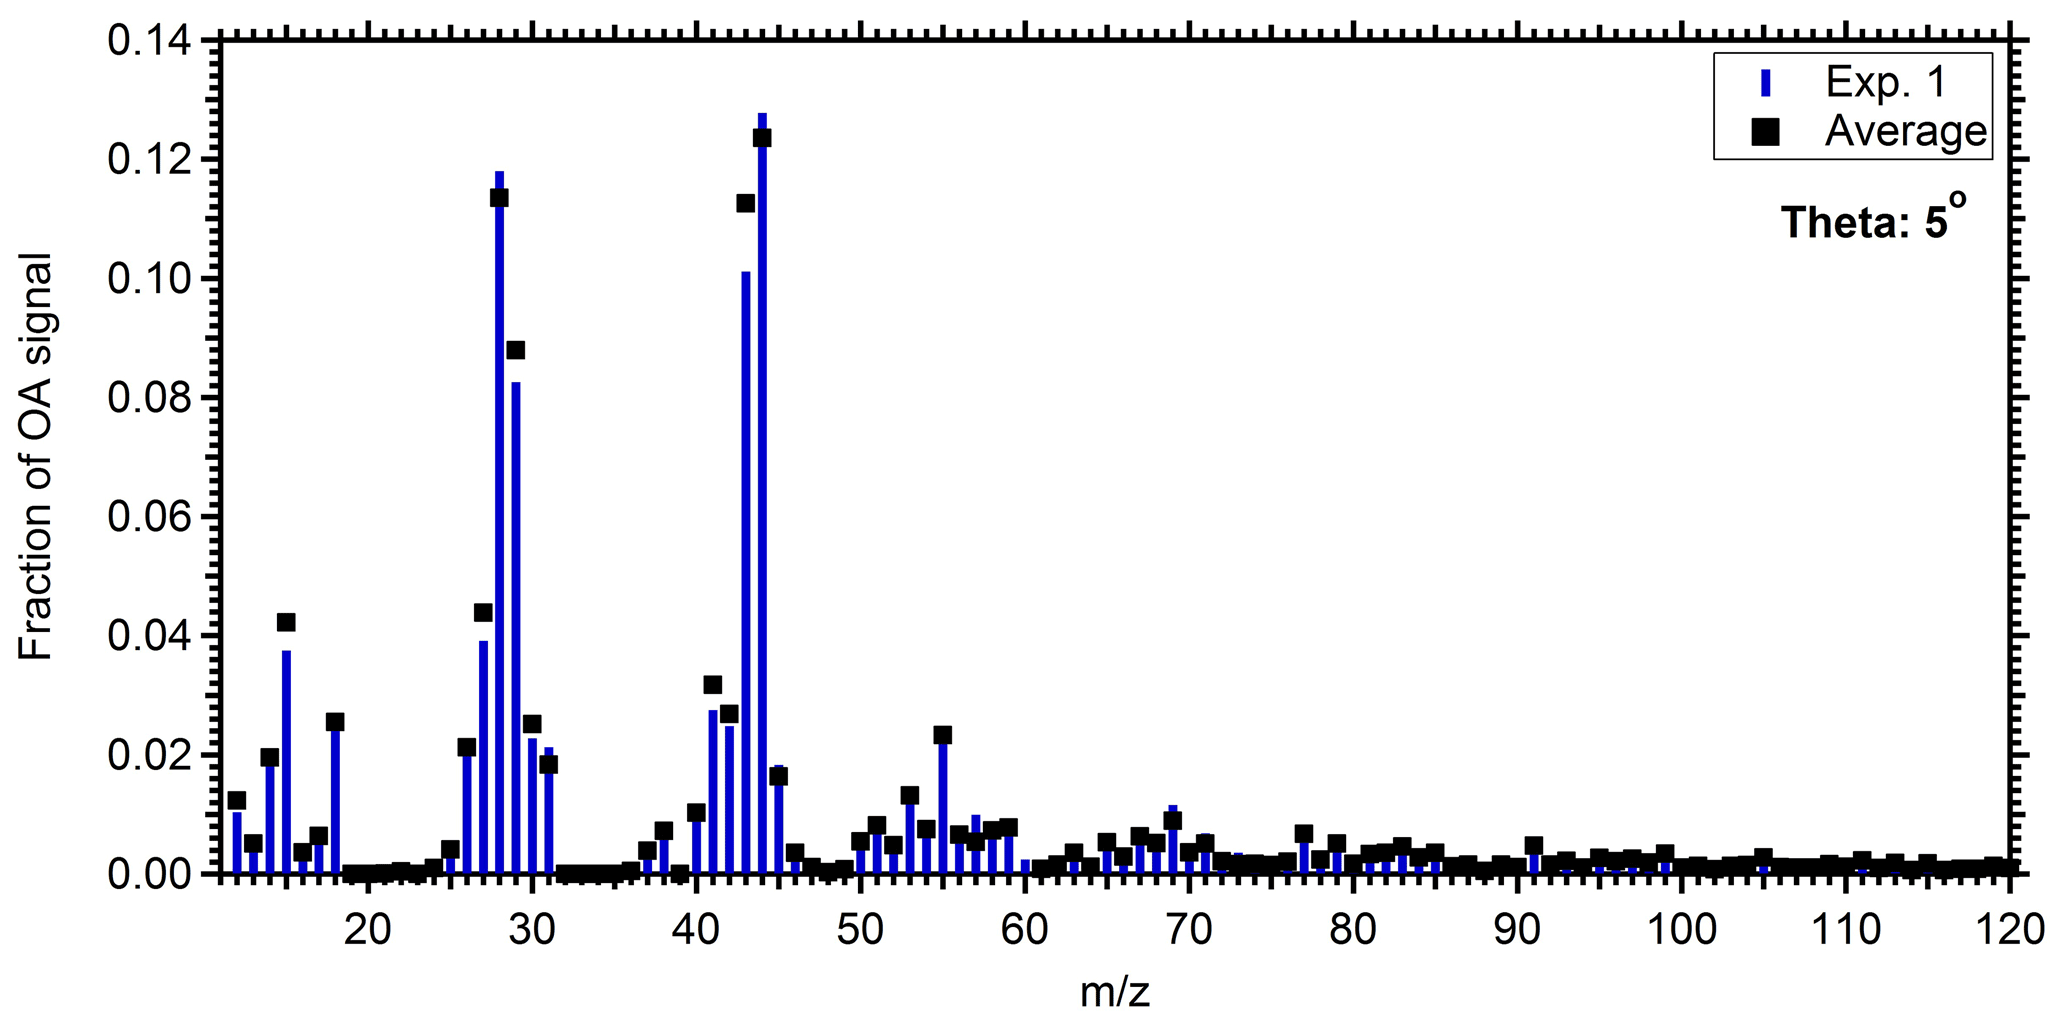
Figure 5Mass spectrum of the produced SOA in the perturbed chamber for Exp. 1 (blue bars) and the average spectrum of the produced SOA in all experiments (black squares).
Our estimation of the produced SOA levels is based on the mass balance approach of Jorga et al. (2020) and not on the yields and concentration reduction of individual VOCs. Given the uncertainties in the concentrations and the yields of the various VOCs and IVOCs in this complex system, this is a more accurate estimate. We assume that the main process responsible for the reduction in the initial OA is loss of particles to the walls, and that the loss of particle mass by evaporation and then loss of the vapors to the walls is negligible. The accuracy of this assumption can be confirmed by the change in the OA in the reference chamber (Fig. 1a). The small change in the particle wall-loss-corrected OA concentration (less than 7 %) supports our assumption. If evaporation and vapor wall loss were important processes, then the corresponding concentration in the reference chamber would be decreasing significantly. This is one of the advantages of our approach using ambient air. The evaporation of the bbOA after its emission has already taken place in the atmosphere. Therefore, the SOA production that we measure does account for the SVOCs that have moved to the gas phase as the bbOA becomes diluted in the atmosphere. The changes in the reference chamber illustrate well the changes that continue to happen in the system without our acceleration of the chemistry.
The produced OA mass spectra from the perturbed chamber were compared with the produced OA factor from the dark aging of biomass burning emissions in the laboratory (Kodros et al., 2020). Although the present study deals with emissions from multiple biomass burning sources and fuels in a complex air mixture and varying conditions compared to the laboratory work (that used specific biomass burning emissions under idealized conditions), a comparison can provide us with information about the consistency of the two studies. Kodros et al. (2020) performed chamber experiments in which they exposed residential biomass burning emissions from a residential wood stove to NO2 and O3 under different RH conditions. Here, we compare the produced OA from a medium RH (approximately 45 %) experiment with those of the ambient perturbation experiments that had similar RH. The θ angle between the produced OA from perturbation Exp. 1 and the one from the laboratory chamber experiment was 11∘, indicating a considerable degree of similarity (Fig. 6). The comparison of our results with the work of Kodros et al. (2020) can also be viewed as an independent test of the validity of our assumption that most of the SOA formed in our experiments was indeed due to biomass burning. This previous study used only biomass burning emissions; therefore, there is no doubt that their results represent biomass burning SOA (bbSOA). The good comparison of the produced SOA spectra in the two studies both strengthens our argument (that we mainly observe bbSOA formation) and also strengthens the argument of Kodros et al. (2020, that their laboratory results are a reasonable representation of realistic atmospheric processing of biomass burning emissions).
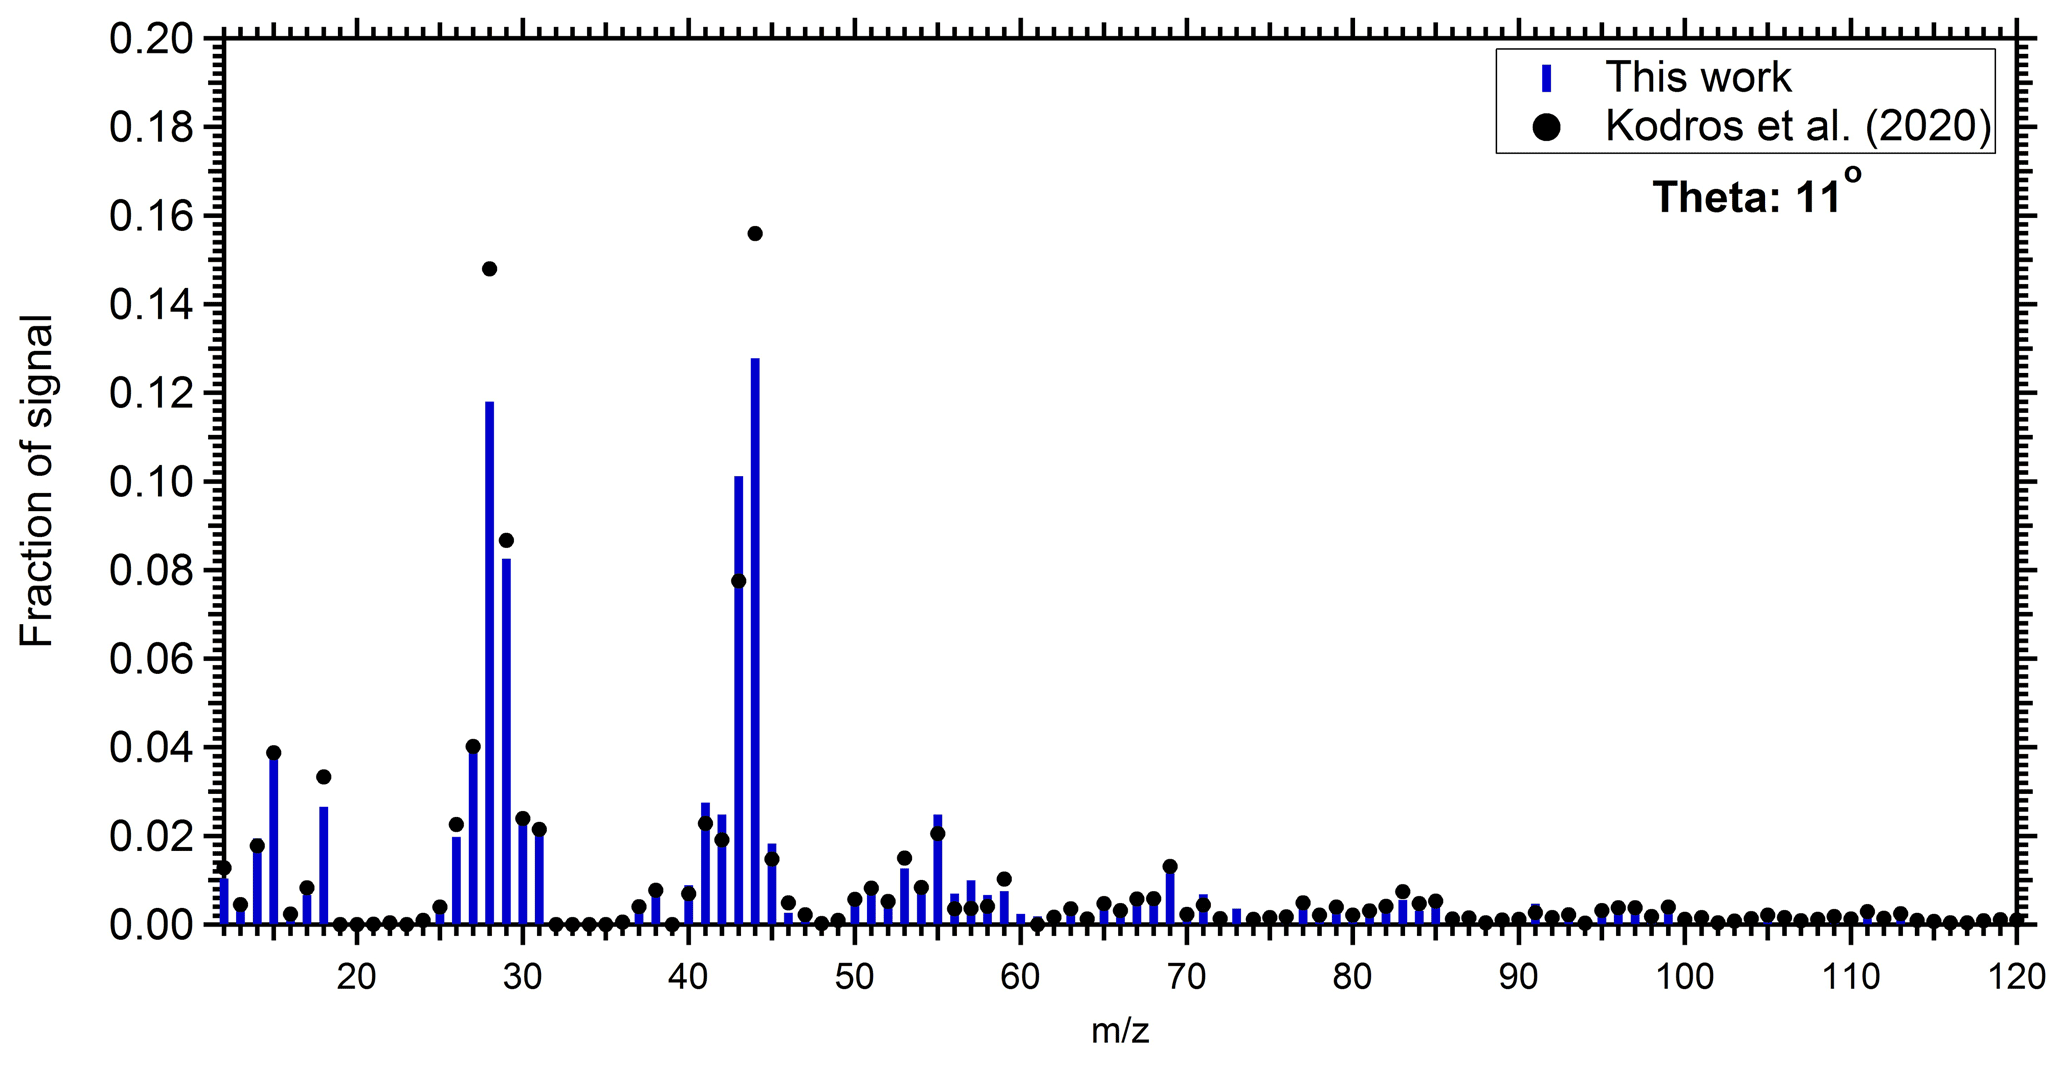
Figure 6Comparison of the produced SOA mass spectra in the perturbed chamber during Exp. 1 (blue bars), and the produced SOA estimated during the chamber experiments of nocturnal aging of biomass burning emissions (Kodros et al., 2020; black circles).
The produced OA was also compared with the ambient oxygenated organic aerosol (OOA) factor identified from the PMF analysis of the ambient data. The θ angle between the ambient OOA in Patras from winter 2020 and the produced OA from Exp. 1 was 10∘. Similarities were also observed in the produced OA and OOA from cities around the world during winter periods. For Exp. 1, the θ angle was in the range of 9–18∘ (Table S2) when compared with OOA factors from Fresno, USA (Ge et al., 2012), Barcelona, Spain (Mohr et al., 2012), Paris, France (Crippa et al., 2013), Bologna, Italy (Gilardoni et al., 2016), Athens, Greece (Florou et al., 2017), and Xi'an/Beijing, China (Elser et al., 2016). The contribution of biomass burning to the measured OA in the above field studies ranged from 16 % (Fresno, USA) up to 70 % (Patras and Athens, Greece). The OOA, as viewed by the PMF analysis of the AMS spectra, has, most of the time, little information about its source. Therefore, this similarity just strengthens our argument that the SOA produced in our experiments was rather realistic. We further compared the AMS spectrum of the SOA produced in this study with the spectra of the SOA produced during daytime oxidation of biomass burning emissions in the laboratory (Kodros et al., 2020). There are notable differences in the two spectra, with θ angles approaching 30∘.
3.3 Results of other experiments
The rapid OA production observed during Exp. 1 was also observed in all the other experiments, with approximately 75 % of the produced OA formed in the first hour after the ozone injection. The injected ozone levels in the other experiments, excluding Exp. 1, ranged from 65 to 220 ppb. Figure 7 shows the produced OA (including organic nitrates) in all the perturbation experiments. In all experiments, the majority of secondary aerosol nitrate was organic, representing 55 %–85 % of the total produced nitrate. Taking into account the organic nitrates, the initial SOA formation rate in the perturbed chamber in the conducted experiments was on average 10 µg m−3 h−1, ranging from 1 to 30 µg m−3 h−1.
An increase in the O:C in the perturbed chamber was observed in all experiments, with an average increase from the initial O:C of 45 %. At the same time, the O:C in the control chamber remained within 6 % of the initial value. Table S3 summarizes the OA enhancement and the initial and final O:C in the perturbed chamber in the conducted experiments.
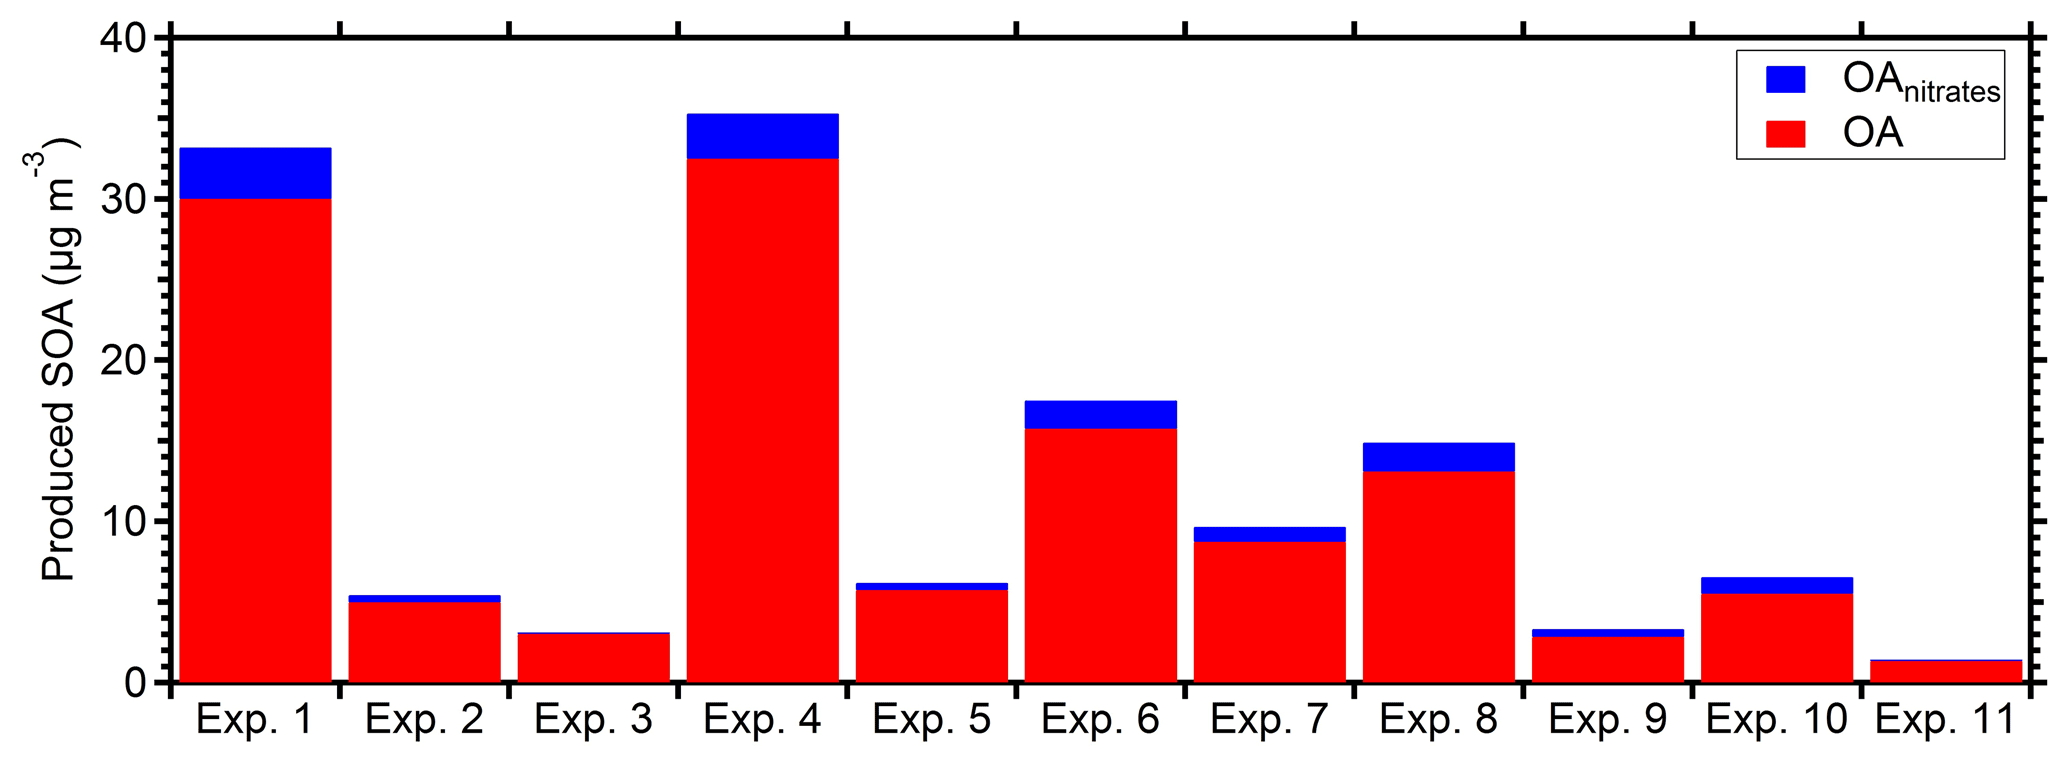
Figure 7Produced OA (red bars) and the estimated organic nitrate (blue bars) in the perturbed chamber for the 11 perturbation experiments. All values have been corrected for wall losses and the AMS collection efficiency.
The mass spectra of the produced OA in the perturbed chamber were similar to that of Exp. 1, with the major values being 28, 29, 43, 44, 55, and 69 (Fig. 5). The θ angle between the different produced OA spectra in the perturbed experiments was less than 14∘, suggesting similarities between the produced OA from the different perturbation experiments. The θ angle between the produced OA mass spectra in the perturbed chamber and the one from Kodros et al. (2020) was in the range of 9–16∘, suggesting similarity of the results of the two studies, even if one relied on a single fuel burned in a single stove and the other on a mixture of emissions from thousands of fireplaces and heating stoves. Another possible explanation for the difference between the two studies is the presence of non-biomass burning emissions in the urban ambient air that could contribute to the SOA formation.
3.4 NO3 and OH radical levels
Based on the decay of d9-butanol after the injection of ozone, the OH concentration was in the range of 0.2–0.4×10⁶ molecule cm−3 in the perturbation chamber, suggesting that the addition of ozone and reactions with organic vapors were not producing significant OH levels. Given the sunlight in Greece even during the winter, these levels correspond to less than 10 % of the daytime OH in the area during that wintertime period. Despite the relatively low OH in the perturbation chamber, its corresponding reactions with the various VOCs present do contribute to the observed chemical changes. The characteristic reaction times with the OH of some of the VOCs present (toluene, xylenes, isoprene, monoterpenes, and phenol) that could contribute to SOA formation ranged from approximately 9 to 160 h, suggesting that these reactions had a small contribution to the rapid SOA formation observed during the first 30 min of a typical experiment (Fig. 1). The corresponding OH concentrations in the control chamber were practically zero and below the detection levels of the d9-butanol approach. Measurements of the OH levels were only possible when the PTR-MS was available (Exps. 9–11), but the results were pretty consistent. Some OH production is also expected in the ambient atmosphere as the ozone mixes in the nighttime boundary layer from aloft, so these reactions are taking place, albeit slowly, in the ambient atmosphere too.
Nitrate radical concentrations above the detection level of a few parts per trillion were only measured in the perturbed chamber after the ozone injection. Overall, NO3 radical measurements were not available during 4 out of the 11 experiments, but in 2 experiments (Exps. 3 and 10) the NO3 concentrations were below the instrument's detection limit. The maximum NO3 radical concentrations in the perturbed chamber ranged from 3 to 25 ppt, with the highest observed during Exp. 8 (Table S3). In this experiment, before the ozone injection, the NO3 levels in both chambers were below the detection limit of the instrument, while after the injection (t=0 h), the concentration of NO3 started to increase (Fig. S4). In Exp. 8, there were 44 ppb of NOx initially, and 150 ppb of O3 were injected. Approximately 15 µg m−3 of OA was formed in 2.5 h after the perturbation, with close to 2 µg m−3 of the OA formed being organic nitrate. The O:C reached a value of 0.6 at the end of this experiment.
The measured NO3 concentrations, along with the low concentrations of OH in the perturbed chamber, suggest that the reactions of VOCs with NO3 radicals and potentially ozone were the major source of SOA production.
3.5 Factors affecting the SOA production
The highest produced SOA was observed, as expected, in experiments that had high initial OA and VOC levels. Experiments 1, 4, and 6 had the highest measured initial VOC levels among the conducted experiments (close to 150 µg m−3; Table 1). Although only a fraction of the VOCs present in the atmosphere were measured by the PTR-MS in this work, these measurements provide an indication of the SOA formation potential of the corresponding air masses. We could not identify a strong link between the small variations in the speciation of the initial VOCs and the SOA or the organic nitrate formed. This is probably due to the fact that we quantified only a small fraction of the VOCs and IVOCs that serve as SOA precursors in the system.
The absolute concentration of SOA formed was also affected by the levels of NO present. Experiments with low initial NO, less than 5 ppb (Exps. 2, 3, 5, 9, and 11), had the lowest SOA production. The lowest NO3 radical concentrations were also observed in those experiments. This is due to the low NOx availability in the atmosphere during these experiments. These low NOx levels result in low NO3 levels in the perturbed chamber, and therefore, together with the relatively low VOC levels, during the same periods, lead to low SOA production. Figure 8 shows the correlation between the concentration of NO3 radicals and the produced organic nitrate levels in the perturbed chamber. The good correlation (R2=0.79) supports the strong link between the NO3 chemistry occurring in the perturbed chamber and the corresponding SOA production. This correlation is driven by the results of two experiments with high NO3 radical levels and high organic nitrate concentrations in the particulate phase. This suggests that the oxidant levels (mainly NO3) produced after reactions of ozone with the preexisting NOx are affecting the levels of SOA formed under these conditions significantly. We estimated an R2=0.66 between the formed SOA and the levels of NO3 in the perturbed chamber (Fig. S5).
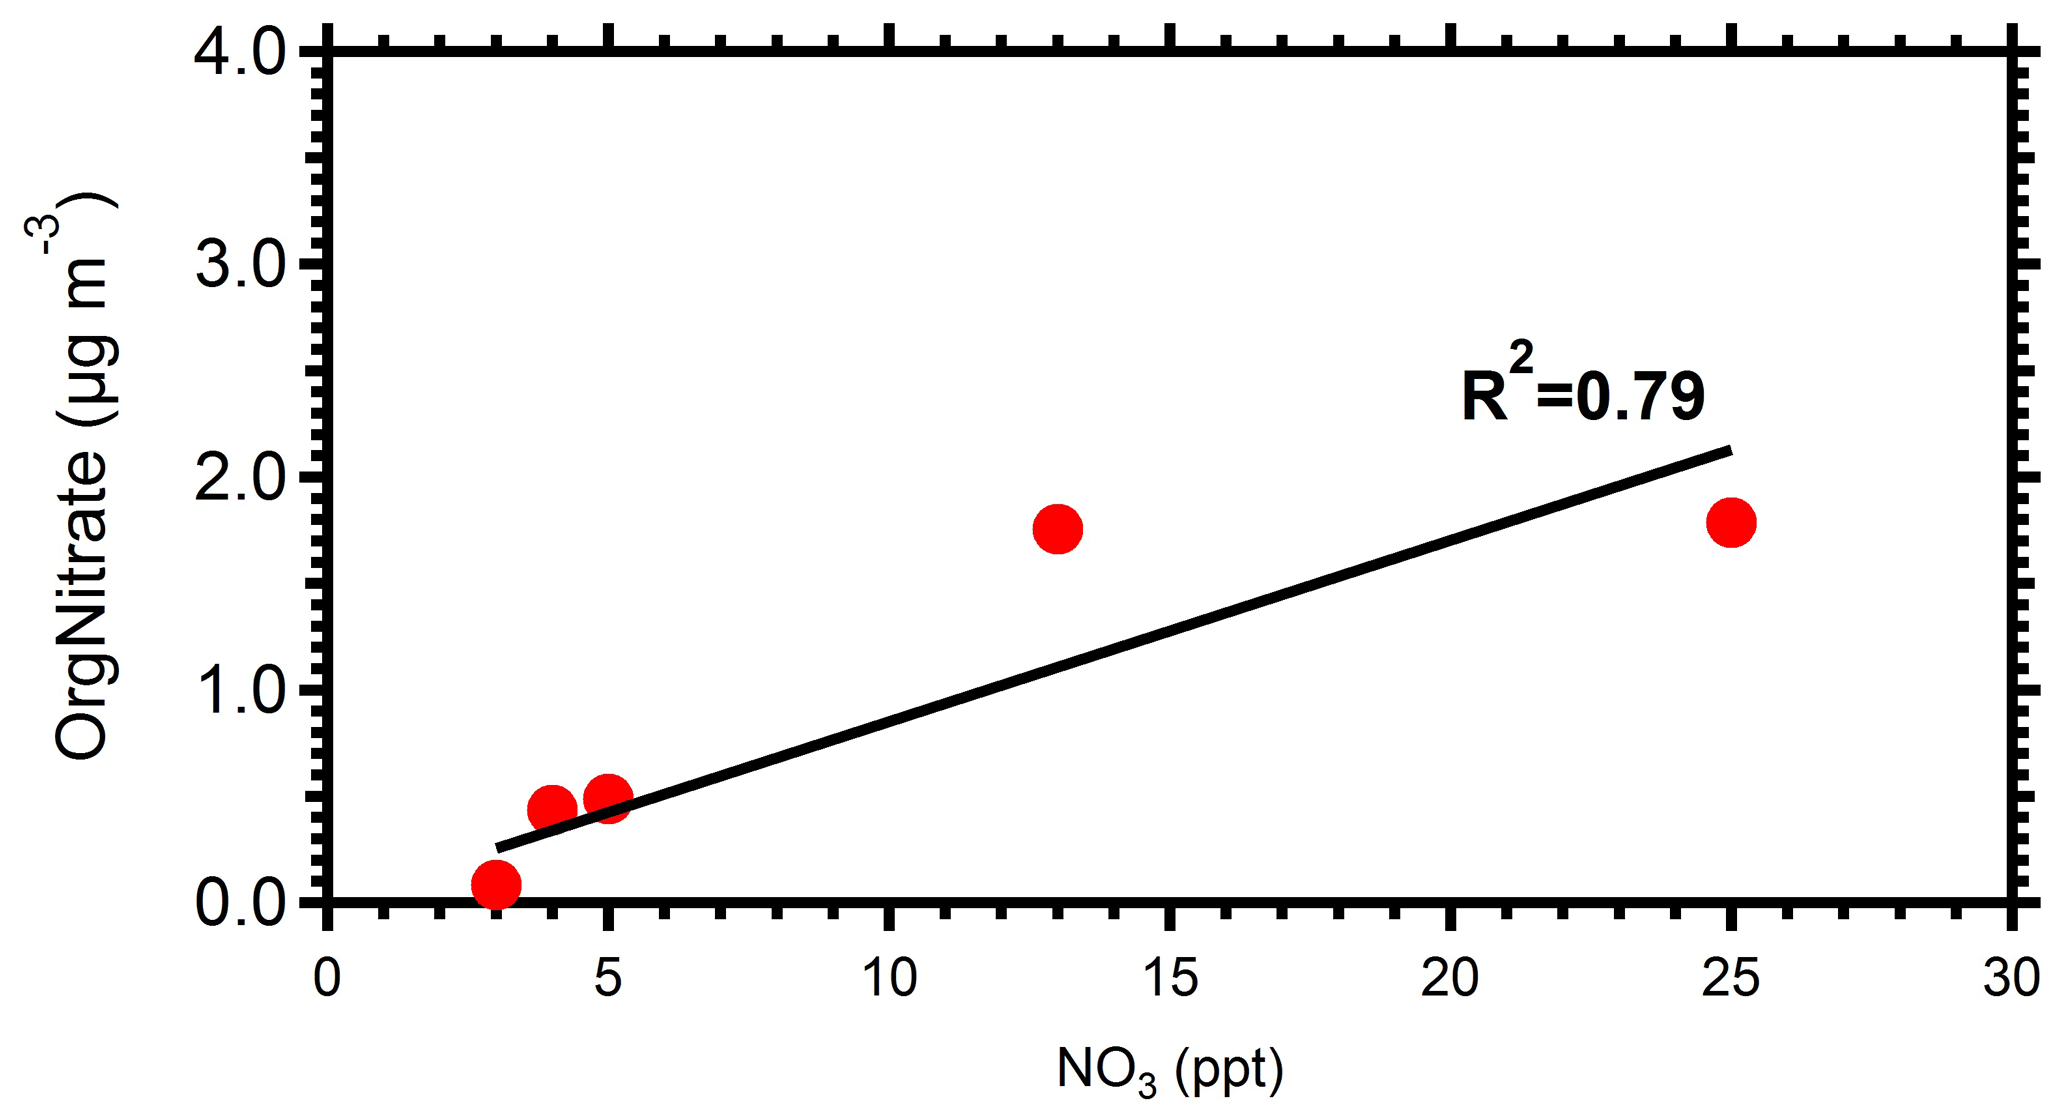
Figure 8Correlation between NO3 radicals with the organic nitrate formed in the perturbed chamber.
In this work, we studied the nighttime aging of urban wintertime air, strongly influenced by biomass burning emissions in Patras, Greece. Using a dual-chamber system and ambient air as a starting point, we injected additional ozone in only one chamber to accelerate nitrate radical production via reactions with the preexisting NOx. The other chamber was used as a reference, mainly as a safeguard against potential experimental artifacts. The novelty of this experimental approach is that it allowed the quantification of the nighttime chemical transformations of realistic biomass burning emissions from thousands of sources and multiple fuels after they had been diluted and mixed with ambient air. Our experiments took place during periods in which biomass burning was responsible for 70 %, on average, of the ambient OA, and therefore, the biomass burning emissions were the dominant source of VOCs and IVOCs.
After the addition of ozone, rapid SOA formation was observed in the perturbed chamber with the additional OA formed reaching up to 35 µg m−3. The SOA formed increased the preexisting OA by 20 %–70 %. Most of the secondary nitrate formed was organic nitrate and, in some cases, reached up to 85 % of the total aerosol nitrate. On average, 10 % of the total OA formed was organic nitrate. The organic aerosol formation was rapid, with 75 % of the produced OA formed in the first hour after the ozone injection. The organic aerosol content in the control chamber remained within 10 % of the initial levels, suggesting limited chemical oxidation without the addition of ozone in these timescales. These results strongly suggest that significant secondary OA can be formed even during the nighttime of winter periods through the chemical processing of biomass burning emissions.
The O:C of organic aerosol increased rapidly in the perturbed chamber following the ozone injection. In 2–3 h of reactions, a 40 %–50 % increase in the O:C was observed, while the OA O:C in the control chamber remained within approximately 5 % of the initial value. The produced OA mass spectra showed similarities with the produced OA factor from dark aging biomass burning experiments under laboratory conditions, pointing towards the important role of biomass burning emissions in the OA formed in a winter urban environment. Furthermore, the produced SOA mass spectra were quite similar to those of ambient oxygenated OA factors found in urban areas during winter periods in which the fresh bbOA contributed 15 %–70 % of the OA.
Nitrate radicals were observed only in the perturbed chamber and only after the ozone injection. Their levels reached up to 25 ppt. The low and steady levels of hydroxyl radical in the perturbed chamber, along with the high characteristic reactions times of the measured VOCs with the OH compared to the duration of the experiments, indicates that reactions with nitrate radicals and ozone were responsible for the SOA formation and the change in the OA composition.
Data related to this article are available upon request to the corresponding author. The data will be available on the EUROCHAMP–2020 website.
The supplement related to this article is available online at: https://doi.org/10.5194/acp-21-15337-2021-supplement.
SDJ, KF, CK, JKK, and CV conducted the experiments and collected and analyzed the data. SNP and AN conceived and directed the study. MC, AF, and BPV provided the IBB-CEAS. SDJ and SNP wrote the paper, with inputs from all co-authors.
The contact author has declared that neither they nor their co-authors have any competing interests.
Publisher’s note: Copernicus Publications remains neutral with regard to jurisdictional claims in published maps and institutional affiliations.
This article is part of the special issue “Simulation chambers as tools in atmospheric research (AMT/ACP/GMD inter-journal SI)”. It is not associated with a conference.
We thank Angeliki Papalou and the University of Peloponnese for providing the space for our experiments.
This research has been supported by the European Research Council, H2020 European Research Council (PyroTRACH; grant no. 726165), and the Horizon 2020 Framework Programme, H2020 Societal Challenges (EUROCHAMP–2020; grant no. 730997).
This paper was edited by Drew Gentner and reviewed by two anonymous referees.
Ahern, A. T., Robinson, E. S., Tkacik, D. S., Saleh, R., Hatch, L. E., Barsanti, K. C., Stockwell, C. E., Yokelson, R. J., Presto, A. A., Robinson, A. L., Sullivan, R. C., and Donahue, N. M.: Production of secondary organic aerosol during aging of biomass burning smoke from fresh fuels and its relationship to VOC precursors, J. Geophys. Res., 124, 3583–3606, 2019.
Akagi, S. K., Yokelson, R. J., Wiedinmyer, C., Alvarado, M. J., Reid, J. S., Karl, T., Crounse, J. D., and Wennberg, P. O.: Emission factors for open and domestic biomass burning for use in atmospheric models, Atmos. Chem. Phys., 11, 4039–4072, https://doi.org/10.5194/acp-11-4039-2011, 2011.
Akherati, A., He, Y., Coggon, M. M., Koss, A. R., Hodshire, A. L., Sekimoto, K., Warneke, C., De Gouw, J., Yee, L., Seinfeld, J. H., Onasch, T. B., Herndon, S. C., Knighton, W. B., Cappa, C. D., Kleeman, M. J., Lim, C. Y., Kroll, J. H., Pierce, J. R., and Jathar, S. H.: Oxygenated aromatic compounds are important precursors of secondary organic aerosol in biomass-burning emissions, Environ. Sci. Technol., 54, 8568–8579, 2020.
Alfarra, M. R., Prevot, A. S. H., Szidat, S., Sandradewi, J., Weimer, S., Lanz, V. A., Schreiber, D., Mohr, M., and Baltensperger, U.: Identification of the mass spectral signature of organic aerosols from wood burning emissions, Environ. Sci. Technol., 41, 5770–5777, 2007.
Andreae, M. O. and Merlet, P.: Emission of trace gases and aerosols from biomass burning, Global Biogeochem Cy., 15, 955–966, 2001.
Barmet, P., Dommen, J., DeCarlo, P. F., Tritscher, T., Praplan, A. P., Platt, S. M., Prévôt, A. S. H., Donahue, N. M., and Baltensperger, U.: OH clock determination by proton transfer reaction mass spectrometry at an environmental chamber, Atmos. Meas. Tech., 5, 647–656, https://doi.org/10.5194/amt-5-647-2012, 2012.
Bond, T. C., Streets, D. G., Yarber, K. F., Nelson, S. M., Woo, J. H., and Klimont, Z.: A technology-based global inventory of black and organic carbon emissions from combustion, J. Geophys. Res., 109, D14203, https://doi.org/10.1029/2003JD003697, 2004.
Bougiatioti, A., Stavroulas, I., Kostenidou, E., Zarmpas, P., Theodosi, C., Kouvarakis, G., Canonaco, F., Prévôt, A. S. H., Nenes, A., Pandis, S. N., and Mihalopoulos, N.: Processing of biomass-burning aerosol in the eastern Mediterranean during summertime, Atmos. Chem. Phys., 14, 4793–4807, https://doi.org/10.5194/acp-14-4793-2014, 2014.
Brown, S. S., deGouw, J. A., Warneke, C., Ryerson, T. B., Dubé, W. P., Atlas, E., Weber, R. J., Peltier, R. E., Neuman, J. A., Roberts, J. M., Swanson, A., Flocke, F., McKeen, S. A., Brioude, J., Sommariva, R., Trainer, M., Fehsenfeld, F. C., and Ravishankara, A. R.: Nocturnal isoprene oxidation over the Northeast United States in summer and its impact on reactive nitrogen partitioning and secondary organic aerosol, Atmos. Chem. Phys., 9, 3027–3042, https://doi.org/10.5194/acp-9-3027-2009, 2009.
Brown, S. S., Dubé, W. P., Bahreini, R., Middlebrook, A. M., Brock, C. A., Warneke, C., de Gouw, J. A., Washenfelder, R. A., Atlas, E., Peischl, J., Ryerson, T. B., Holloway, J. S., Schwarz, J. P., Spackman, R., Trainer, M., Parrish, D. D., Fehshenfeld, F. C., and Ravishankara, A. R.: Biogenic VOC oxidation and organic aerosol formation in an urban nocturnal boundary layer: aircraft vertical profiles in Houston, TX, Atmos. Chem. Phys., 13, 11317–11337, https://doi.org/10.5194/acp-13-11317-2013, 2013.
Bruns, E. A., El Haddad, I., Slowik, J. G., Kilic, D., Klein, F., Baltensperger, U., and Prévôt, A. S. H.: Identification of significant precursor gases of secondary organic aerosols from residential wood combustion, Sci. Rep., 6, 27881, https://doi.org/10.1038/srep27881, 2016.
Canagaratna, M. R., Jimenez, J. L., Kroll, J. H., Chen, Q., Kessler, S. H., Massoli, P., Hildebrandt Ruiz, L., Fortner, E., Williams, L. R., Wilson, K. R., Surratt, J. D., Donahue, N. M., Jayne, J. T., and Worsnop, D. R.: Elemental ratio measurements of organic compounds using aerosol mass spectrometry: characterization, improved calibration, and implications, Atmos. Chem. Phys., 15, 253–272, https://doi.org/10.5194/acp-15-253-2015, 2015.
Capes, G., Johnson, B., McFiggans, G., Williams, P. I., Haywood, J., and Coe, H.: Aging of biomass burning aerosols over West Africa: Aircraft measurements of chemical composition, microphysical properties, and emission ratios, J. Geophys. Res., 113, 1–13, 2008.
Chen, J. and Venables, D. S.: A broadband optical cavity spectrometer for measuring weak near-ultraviolet absorption spectra of gases, Atmos. Meas. Tech., 4, 425–436, https://doi.org/10.5194/amt-4-425-2011, 2011.
Crippa, M., DeCarlo, P. F., Slowik, J. G., Mohr, C., Heringa, M. F., Chirico, R., Poulain, L., Freutel, F., Sciare, J., Cozic, J., Di Marco, C. F., Elsasser, M., Nicolas, J. B., Marchand, N., Abidi, E., Wiedensohler, A., Drewnick, F., Schneider, J., Borrmann, S., Nemitz, E., Zimmermann, R., Jaffrezo, J.-L., Prévôt, A. S. H., and Baltensperger, U.: Wintertime aerosol chemical composition and source apportionment of the organic fraction in the metropolitan area of Paris, Atmos. Chem. Phys., 13, 961–981, https://doi.org/10.5194/acp-13-961-2013, 2013.
Decker, Z. C. J., Zarzana, K. J., Coggon, M., Min, K. E., Pollack, I., Ryerson, T. B., Peischl, J., Edwards, P., Dubé, W. P., Markovic, M. Z., Roberts, J. M., Veres, P. R., Graus, M., Warneke, C., De Gouw, J., Hatch, L. E., Barsanti, K. C., and Brown, S. S.: Nighttime chemical transformation in biomass burning plumes: A box model analysis initialized with aircraft observations, Environ. Sci. Technol., 53, 2529–2538, 2019.
Elser, M., Huang, R.-J., Wolf, R., Slowik, J. G., Wang, Q., Canonaco, F., Li, G., Bozzetti, C., Daellenbach, K. R., Huang, Y., Zhang, R., Li, Z., Cao, J., Baltensperger, U., El-Haddad, I., and Prévôt, A. S. H.: New insights into PM2.5 chemical composition and sources in two major cities in China during extreme haze events using aerosol mass spectrometry, Atmos. Chem. Phys., 16, 3207–3225, https://doi.org/10.5194/acp-16-3207-2016, 2016.
Farmer, D. K., Matsunaga, A., Docherty, K. S., Surratt, J. D., Seinfeld, J. H., Ziemann, P. J., and Jimenez, J. L.: Response of an aerosol mass spectrometer to organonitrates and organosulfates and implications for atmospheric chemistry, Proc. Natl. Acad. Sci., 107, 6670–6675, 2010.
Favez, O., El Haddad, I., Piot, C., Boréave, A., Abidi, E., Marchand, N., Jaffrezo, J.-L., Besombes, J.-L., Personnaz, M.-B., Sciare, J., Wortham, H., George, C., and D'Anna, B.: Inter-comparison of source apportionment models for the estimation of wood burning aerosols during wintertime in an Alpine city (Grenoble, France), Atmos. Chem. Phys., 10, 5295–5314, https://doi.org/10.5194/acp-10-5295-2010, 2010.
Florou, K., Papanastasiou, D. K., Pikridas, M., Kaltsonoudis, C., Louvaris, E., Gkatzelis, G. I., Patoulias, D., Mihalopoulos, N., and Pandis, S. N.: The contribution of wood burning and other pollution sources to wintertime organic aerosol levels in two Greek cities, Atmos. Chem. Phys., 17, 3145–3163, https://doi.org/10.5194/acp-17-3145-2017, 2017.
Ford, B., Val Martin, M., Zelasky, S. E., Fischer, E. V., Anenberg, S. C., Heald, C. L., and Pierce, J. R.: Future fire impacts on smoke concentrations, visibility, and health in the contiguous United States, GeoHealth, 2, 229–247, 2018.
Fountoukis, C., Megaritis, A. G., Skyllakou, K., Charalampidis, P. E., Denier van der Gon, H. A. C., Crippa, M., Prévôt, A. S. H., Fachinger, F., Wiedensohler, A., Pilinis, C., and Pandis, S. N.: Simulating the formation of carbonaceous aerosol in a European Megacity (Paris) during the MEGAPOLI summer and winter campaigns, Atmos. Chem. Phys., 16, 3727–3741, https://doi.org/10.5194/acp-16-3727-2016, 2016.
Fouqueau, A., Cirtog, M., Cazaunau, M., Pangui, E., Zapf, P., Siour, G., Landsheere, X., Méjean, G., Romanini, D., and Picquet-Varrault, B.: Implementation of an incoherent broadband cavity-enhanced absorption spectroscopy technique in an atmospheric simulation chamber for in situ NO3 monitoring: characterization and validation for kinetic studies, Atmos. Meas. Tech., 13, 6311–6323, https://doi.org/10.5194/amt-13-6311-2020, 2020.
Fuller, G. W., Tremper, A. H., Baker, T. D., Yttri, K. E. and Butterfield, D.: Contribution of wood burning to PM10 in London, Atmos. Environ., 87, 87–94, 2014.
Ge, X., Setyan, A., Sun, Y., and Zhang, Q.: Primary and secondary organic aerosols in Fresno, California during wintertime: Results from high resolution aerosol mass spectrometry, J. Geophys. Res., 117, D19301, https://doi.org/10.1029/2012JD018026, 2012.
Gilardoni, S., Massoli, P., Paglione, M., Giulianelli, L., Carbone, C., Rinaldi, M., Decesari, S., Sandrini, S., Costabile, F., Gobbi, G. P., Pietrogrande, M. C., Visentin, M., Scotto, F., Fuzzi, S., and Facchini, M. C.: Direct observation of aqueous secondary organic aerosol from biomass-burning emissions, Proc. Natl. Acad. Sci., 113, 10013–10018, 2016.
Hartikainen, A., Yli-Pirilä, P., Tiitta, P., Leskinen, A., Kortelainen, M., Orasche, J., Schnelle-Kreis, J., Lehtinen, K. E. J., Zimmermann, R., Jokiniemi, J., and Sippula, O.: Volatile organic compounds from logwood combustion: Emissions and transformation under dark and photochemical aging conditions in a smog chamber, Environ. Sci. Technol., 52, 4979–4988, 2018.
Hennigan, C. J., Miracolo, M. A., Engelhart, G. J., May, A. A., Presto, A. A., Lee, T., Sullivan, A. P., McMeeking, G. R., Coe, H., Wold, C. E., Hao, W.-M., Gilman, J. B., Kuster, W. C., de Gouw, J., Schichtel, B. A., Collett Jr., J. L., Kreidenweis, S. M., and Robinson, A. L.: Chemical and physical transformations of organic aerosol from the photo-oxidation of open biomass burning emissions in an environmental chamber, Atmos. Chem. Phys., 11, 7669–7686, https://doi.org/10.5194/acp-11-7669-2011, 2011.
Jolleys, M. D., Coe, H., McFiggans, G., Taylor, J. W., O'Shea, S. J., Le Breton, M., Bauguitte, S. J.-B., Moller, S., Di Carlo, P., Aruffo, E., Palmer, P. I., Lee, J. D., Percival, C. J., and Gallagher, M. W.: Properties and evolution of biomass burning organic aerosol from Canadian boreal forest fires, Atmos. Chem. Phys., 15, 3077–3095, https://doi.org/10.5194/acp-15-3077-2015, 2015.
Jorga, S. D., Kaltsonoudis, C., Liangou, A., and Pandis, S. N.: Measurement of formation rates of secondary aerosol in the ambient urban atmosphere using a dual smog chamber system, Environ. Sci. Technol., 54, 1336–1343, 2020.
Kaltsonoudis, C., Jorga, S. D., Louvaris, E., Florou, K., and Pandis, S. N.: A portable dual-smog-chamber system for atmospheric aerosol field studies, Atmos. Meas. Tech., 12, 2733–2743, https://doi.org/10.5194/amt-12-2733-2019, 2019.
Kaltsonoudis, C., Florou, K., Kodros, J., Jorga, S., Vasilakopoulou, C., Baliaka, C., Aktypis, A., Nenes, A., and Pandis, S.: Contribution of residential wood burning to wintertime air pollution in an urban area, EGU General Assembly 2021, online, 19–30 Apr 2021, EGU21-10670, https://doi.org/10.5194/egusphere-egu21-10670, 2021.
Kodros, J. K., Papanastasiou, D. K., Paglione, M., Masiol, M., Squizzato, S., Florou, K., Skyllakou, K., Kaltsonoudis, C., Nenes, A., and Pandis, S. N.: Rapid dark aging of biomass burning as an overlooked source of oxidized organic aerosol, Proc. Natl. Acad. Sci., 52, 33028–33033, 2020.
Kostenidou, E., Pathak, R. K., and Pandis, S. N.: An algorithm for the calculation of secondary organic aerosol density combining AMS and SMPS data, Aerosol. Sci. Tech., 41, 1002–1010, 2007.
Kostenidou, E., Lee, B. H., Engelhart, G. J., Pierce, J. R., and Pandis, S. N.: Mass spectra deconvolution of low, medium, and high volatility biogenic secondary organic aerosol, Environ. Sci. Technol., 43, 4884–4889, 2009.
Mohr, C., DeCarlo, P. F., Heringa, M. F., Chirico, R., Slowik, J. G., Richter, R., Reche, C., Alastuey, A., Querol, X., Seco, R., Peñuelas, J., Jiménez, J. L., Crippa, M., Zimmermann, R., Baltensperger, U., and Prévôt, A. S. H.: Identification and quantification of organic aerosol from cooking and other sources in Barcelona using aerosol mass spectrometer data, Atmos. Chem. Phys., 12, 1649–1665, https://doi.org/10.5194/acp-12-1649-2012, 2012.
O'Dell, K., Ford, B., Fischer, E. V., and Pierce, J. R.: Contribution of Wildland-Fire Smoke to US PM2.5 and Its Influence on Recent Trends, Environ. Sci. Technol., 53, 1797–1804, 2019.
Orphal, J., Fellows, C. E., and Flaud, P.-M.: The visible absorption spectrum of NO3 measured by high-resolution Fourier transform spectroscopy, J. Geophys. Res., 108, 4077, https://doi.org/10.1029/2002JD002489, 2003.
Ortega, A. M., Day, D. A., Cubison, M. J., Brune, W. H., Bon, D., de Gouw, J. A., and Jimenez, J. L.: Secondary organic aerosol formation and primary organic aerosol oxidation from biomass-burning smoke in a flow reactor during FLAME-3, Atmos. Chem. Phys., 13, 11551–11571, https://doi.org/10.5194/acp-13-11551-2013, 2013.
Robinson, A. L., Subramanian, R., Donahue, N. M., Bernardo-Bricker, A., and Rogge, W. F.: Source apportionment of molecular markers and organic aerosol. 2. Biomass smoke, Environ. Sci. Technol., 40, 7811–7819, 2006.
Tkacik, D. S., Robinson, E. S., Ahern, A., Saleh, R., Stockwell, C., Veres, P., Simpson, I. J., Meinardi, S., Blake, D. R., Yokelson, R. J., Presto, A. A., Sullivan, R. C., Donahue, N. M., and Robinson, A. L.: A dual-chamber method for quantifying the effects of atmospheric perturbations on secondary organic aerosol formation from biomass burning emissions, J. Geophys. Res., 122, 6043–6058, 2017.
Tsimpidi, A. P., Karydis, V. A., Pozzer, A., Pandis, S. N., and Lelieveld, J.: ORACLE (v1.0): module to simulate the organic aerosol composition and evolution in the atmosphere, Geosci. Model Dev., 7, 3153–3172, https://doi.org/10.5194/gmd-7-3153-2014, 2014.
Vakkari, V., Beukes, J. P., Dal Maso, M., Aurela, M., Josipovic, M., and van Zyl, P. G.: Major secondary aerosol formation in southern African open biomass burning plumes, Nat. Geosci., 11, 580–583, 2018.
Vandaele, A. C., Hermans, C., Simon, P. C., Carleer, M., Colin, R., Fally, S., Mérienne, M. F., Jenouvrier, A., and Coquart, B.: Measurements of the NO2 absorption cross-section from 42 000 cm−1 to 10 000 cm−1 (238–1000 nm) at 220 K and 294 K., J. Quant. Spectrosc. Radiat. Transf., 59, 171–184, 1998.
Venables, D. S., Gherman, T., Orphall, J., Wenger, J. C., and Ruth, A. A.: High sensitivity in situ monitoring of NO3 in an atmospheric simulation chamber using Incoherent Broadband Cavity-Enhanced Absorption Spectroscopy, Environ. Sci. Technol., 40, 6758–6763, 2006.
Ventrillard-Courtillot, I., Sciamma O'Brien, E., Kassi, S., Méjean, G., and Romanini, D.: Incoherent broad-band cavity-enhanced absorption spectroscopy for simultaneous trace measurements of NO2 and NO3 with a LED source, Appl. Phys., 101, 661–669, 2010.
Wang, N., Jorga, S. D., Pierce, J. R., Donahue, N. M., and Pandis, S. N.: Particle wall-loss correction methods in smog chamber experiments, Atmos. Meas. Tech., 11, 6577–6588, https://doi.org/10.5194/amt-11-6577-2018, 2018.
Watson, J. G.: Visibility: Science and regulation, J. Air. Waste. Manage., 52, 628–713, 2002.
Yu, J., Cocker, D. R., Griffin, R. J., Flagan, R. C., and Seinfeld, J. H.: Gas-phase ozone oxidation of monoterpenes: Gaseous and particulate products, J. Atmos. Chem., 34, 207–258, 1999.
Zhao, D. F., Kaminski, M., Schlag, P., Fuchs, H., Acir, I.-H., Bohn, B., Häseler, R., Kiendler-Scharr, A., Rohrer, F., Tillmann, R., Wang, M. J., Wegener, R., Wildt, J., Wahner, A., and Mentel, Th. F.: Secondary organic aerosol formation from hydroxyl radical oxidation and ozonolysis of monoterpenes, Atmos. Chem. Phys., 15, 991–1012, https://doi.org/10.5194/acp-15-991-2015, 2015.