the Creative Commons Attribution 4.0 License.
the Creative Commons Attribution 4.0 License.
 | 08 Oct 2021
Scattering and absorption cross sections of atmospheric gases in the ultraviolet–visible wavelength range (307–725 nm)
Quanfu He
Zheng Fang
Ofir Shoshanim
Steven S. Brown
Accurate Rayleigh scattering and absorption cross sections of atmospheric gases are essential for understanding the propagation of electromagnetic radiation in planetary atmospheres. Accurate extinction cross sections are also essential for calibrating high-finesse optical cavities and differential optical absorption spectroscopy and for accurate remote sensing. In this study, we measured the scattering and absorption cross sections of carbon dioxide, nitrous oxide, sulfur hexafluoride, oxygen, and methane in the continuous wavelength range of 307–725 nm using broadband cavity-enhanced spectroscopy (BBCES). The experimentally derived Rayleigh scattering cross sections for CO2, N2O, SF6, O2, and CH4 agree with refractive index-based calculations, with a difference of (0.4 ± 1.2) %, (−0.6 ± 1.1) %, (0.9 ± 1.4) %, (2.8 ± 1.2) %, and (0.9 ± 2.2) %, respectively. The O2–O2 collision-induced absorption and absorption by methane are obtained with high precision at the 0.8 nm resolution of our BBCES instrument in the 307–725 nm wavelength range. New dispersion relations for N2O, SF6, and CH4 were derived using data in the UV–vis wavelength range. This study provides dispersion relations for refractive indices, n-based Rayleigh scattering cross sections, and absorption cross sections based on more continuous and more extended wavelength ranges than available in the current literature.
- Article
(8588 KB) - Full-text XML
-
Supplement
(1273 KB) - BibTeX
- EndNote


The dominant interactions of gas-phase molecules with light in Earth's atmosphere can be divided into absorption, where the light energy is converted to internal energy and generally (at atmospheric pressures) transferred to the surrounding environment either as heat or as photoemission, and light scattering, where the gases redistribute the light energy in the atmosphere. The knowledge of light extinction (scattering + absorption) by gases is essential for predicting the radiative transfer in the atmospheres of the Earth and other planets. In addition, the light extinction by gases is widely used for determining the effective optical pathlength of high-finesse optical cavities that measure trace gases and aerosols (Washenfelder et al., 2008, 2013; Wilmouth and Sayres, 2019; Jordan et al., 2019) and for differential optical absorption spectroscopy (DOAS) to infer information about the light extinction properties of aerosols and clouds in the open atmosphere (Baidar et al., 2013; Platt and Stutz, 2008).
The interaction of light with a wavelength much larger than the size of a molecule/particle gives rise to the scattering of light, which is known as Rayleigh scattering (Strutt, 1899). Rayleigh scattering accounts for scattering, local field effects (Lorentz–Lorenz) (Strutt, 1920), and depolarization from the non-sphericity of molecule/particles (King correction factor) (King and Eve, 1923; Strutt, 1918). For a gas with known refractive index (nν) and King correction factor (Fk(ν)), the wavelength-dependent Rayleigh scattering cross section (σν cm2 molec.−1) can be calculated as follows (Sneep and Ubachs, 2005):
where N is the number density of the gas (molec. cm−3) and ν is the wavenumber of the light (cm−1). Note that the cross section contains the gas number density but is not in fact dependent on the number density since the refractive index also appears in the expression. This n-based method is an advantageous approach for calculating Rayleigh scattering cross sections, but it is vital to note that the accuracy of the calculated cross sections depends on the experimentally determined refractive indices and the King correction factors. In particular, caution should be exercised when applying a dispersion formula derived from measurements in one wavelength region to calculate Rayleigh scattering cross sections in a different wavelength range.
Direct experimental measurement of Rayleigh scattering cross sections is essential given the potential uncertainties in n-based calculations. While measurements of the King correction factors and refractive index for gases are well known from the literature (Cuthbertson and Cuthbertson, 1932; Leonard, 1974; Strutt, 1920; Vukovic et al., 1996; Hohm, 1993), there are only a few direct measurements of Rayleigh scattering cross sections (Fuchs et al., 2009; He et al., 2018; Ityaksov et al., 2008a, b; Jordan et al., 2019; Naus and Ubachs, 2000; Sneep and Ubachs, 2005; Thalman and Volkamer, 2013; Thalman et al., 2014, 2017; Wilmouth and Sayres, 2019, 2020), especially measurements with a continuous spectrum from ultraviolet to visible.
Rayleigh scattering cross-section measurements were previously performed at a single wavelength (e.g., 458, 532, 632.8 nm) using nephelometry (Shardanand and Rao, 1977) and cavity ring-down spectroscopy (CRDS) (Ityaksov et al., 2008a, b; Naus and Ubachs, 2000; Sneep and Ubachs, 2005; He et al., 2018). More recently, advanced broadband cavity-enhanced spectroscopy (BBCES) was used to determine the Rayleigh scattering cross sections of gases such as Ar, CO2, O2, SF6, and CH4. The BBCES technique enables the measurement of Rayleigh scattering cross sections over a broad wavelength range. Thalman et al. (2014) performed measurements over selected wavelength regions between 350 and 660 nm using six BBCES cavities for N2, Ar, and O2. The BBCES systems were calibrated with He and N2 using Rayleigh scattering cross sections calculated using their refractive index and from cavity ring-down measurements, respectively. They found a good agreement with n-based values to within 0.2 ± 0.4 %. Recent studies using BBCES with 30 nm spectral range were also used for Rayleigh scattering cross-section measurement in the UV wavelength region and demonstrated excellent agreement with n-based values for Ar and CO2 (Wilmouth and Sayres, 2020, 2019). Recently, Rayleigh scattering cross sections for CO2 were measured using BBCES at visible wavelengths between 400 and 650 nm, and agreement with n-based values was within 2.4 % on average. To the best of our knowledge, there are no direct continuous wavelength measurements of extinction cross sections of gases that covers the ultraviolet spectrum across the entire visible range (300–725 nm) as shown in Table 1. Recently, Wilmouth and Sayres (2020) combined refractive index data in the UV region (264–297 and 333–363 nm) and at several single wavelengths in the visible, and they derived the dispersion relation of refractive index for SF6 and CH4 applicable in the wavelength range of 250–650 nm. However, more data in the visible range are needed in order to further validate these dispersion relations.
Table 1Refractive index and King correction factors for calculating Rayleigh scattering cross sections and available measurements in the wavelength range of 300–725 nm. Measurements for He and N2 are not summarized in this table.
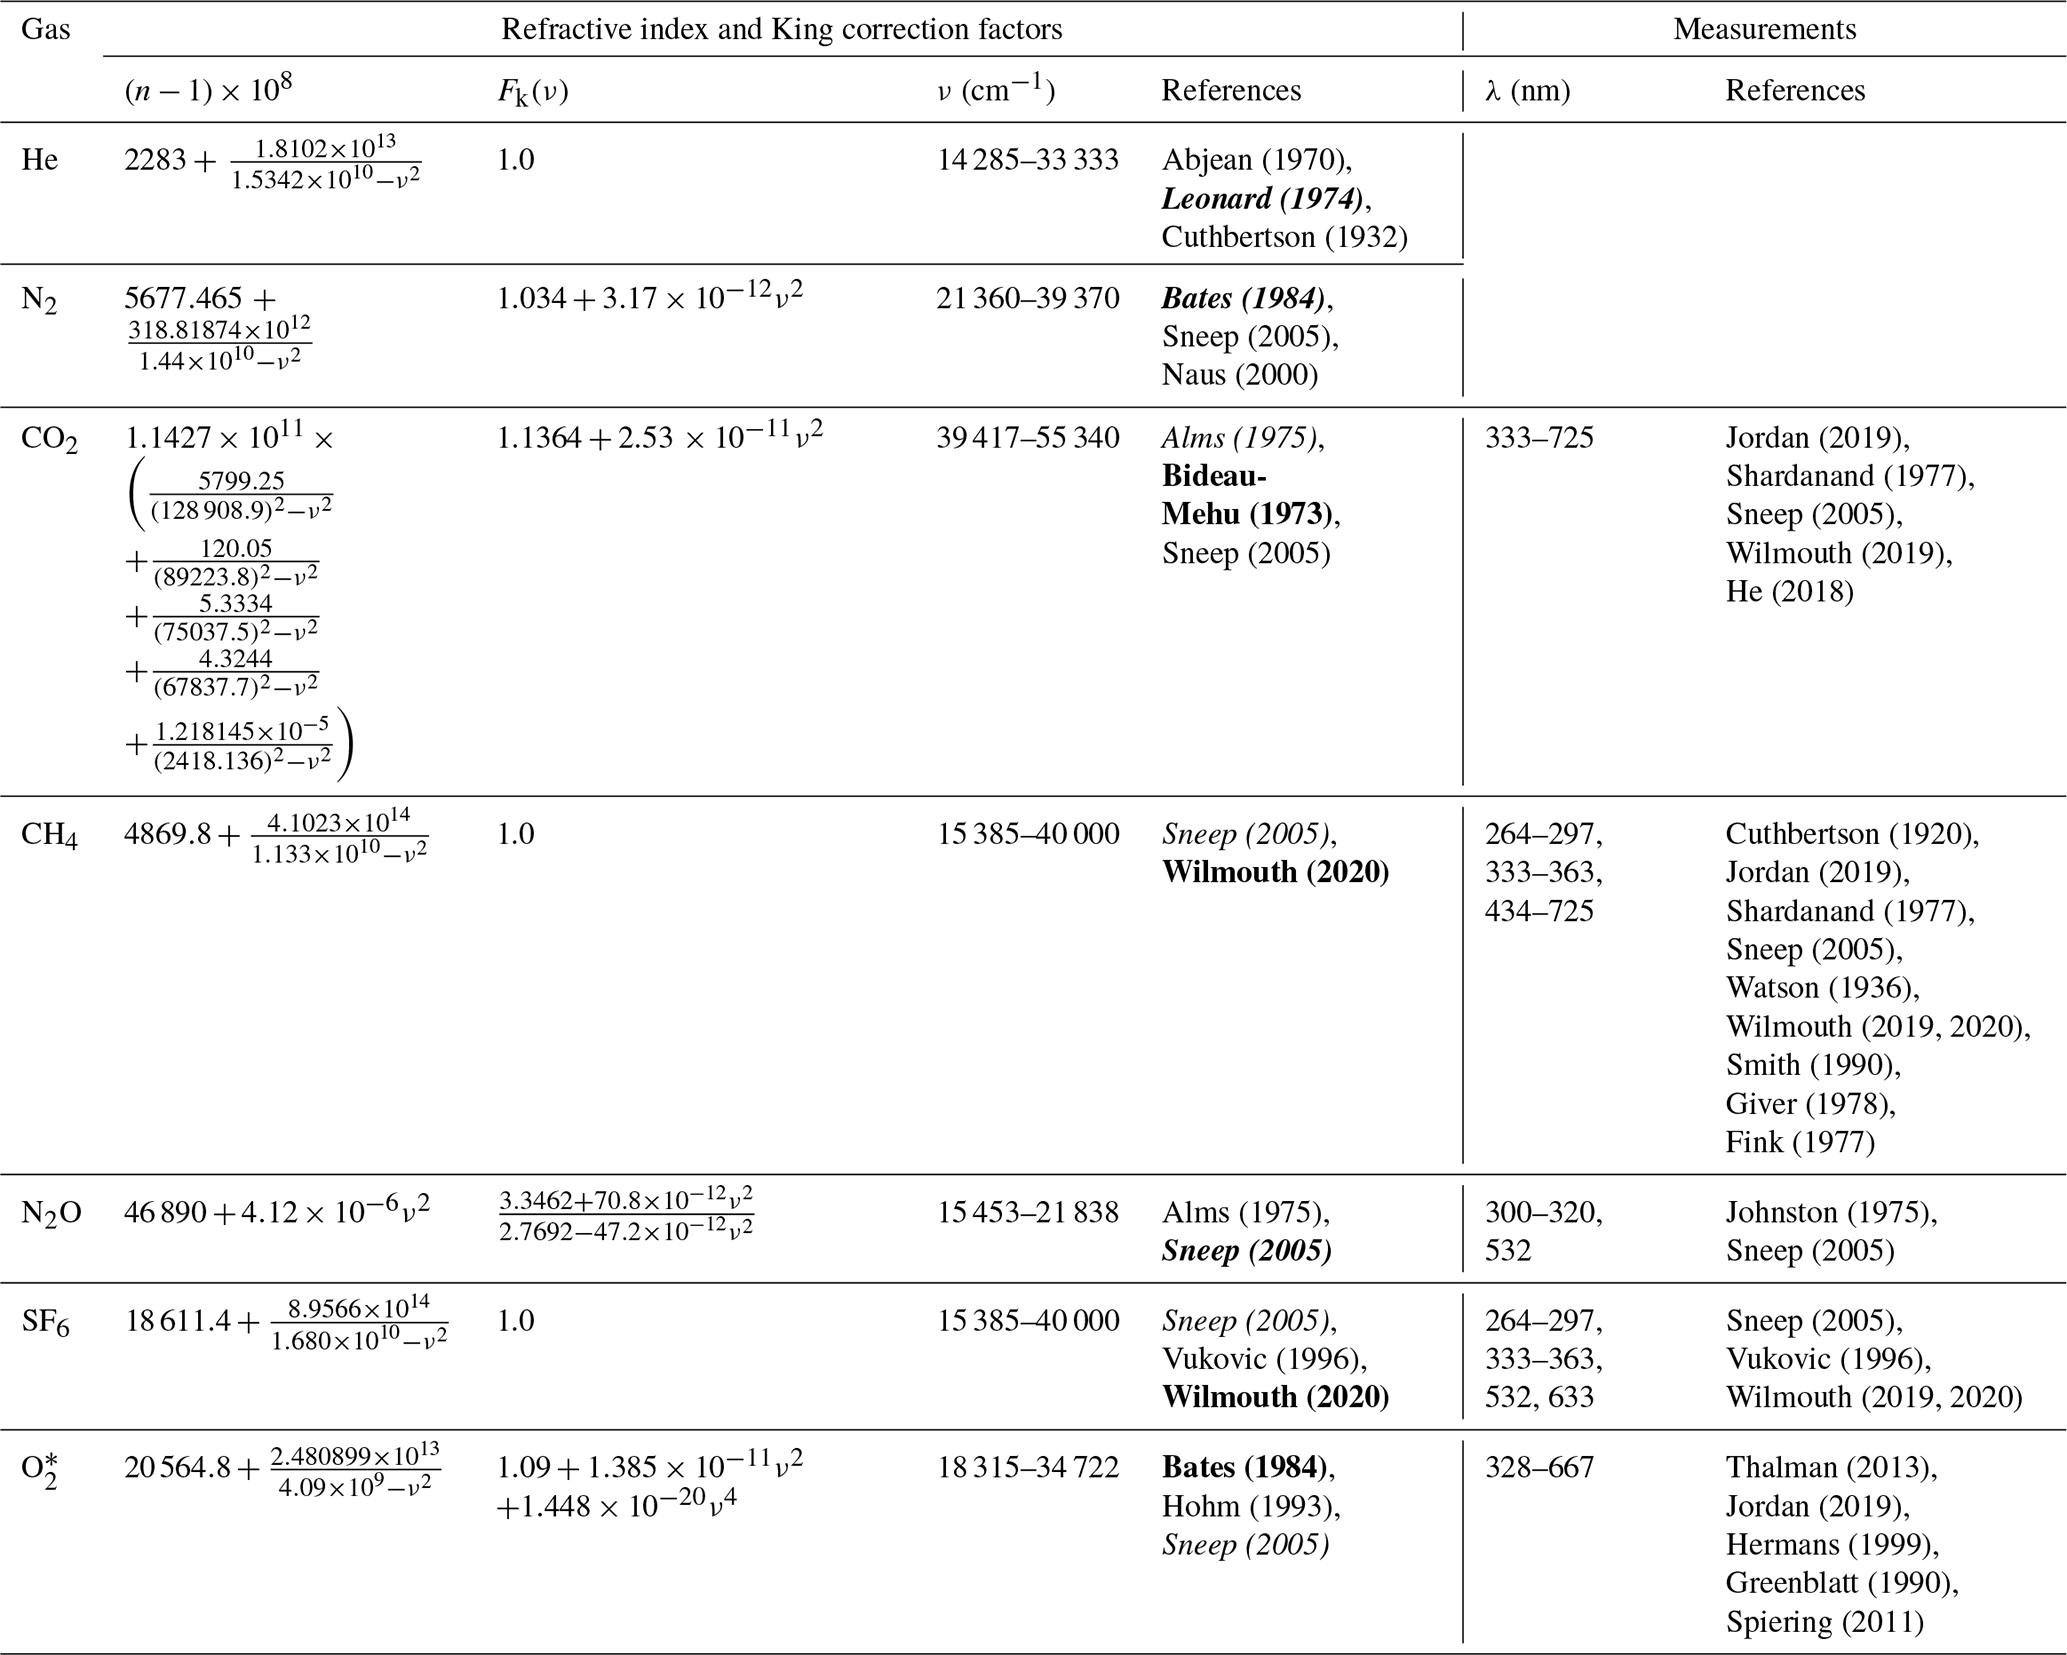
Unless noted, the refractive index is scaled to 288.15 K and 1013.25 hPa. N = 2.546899 × 10¹⁹ molec. cm−3. Due to limited space, only the first name of each reference is shown in the table. The references in bold and italics describe the formulation of refractive index and King correction factor for n-based calculation, respectively. * The refractive index was obtained at 273.15 K and 1013.25 hPa. N = 2.68678 × 10¹⁹ molec. cm−3 is used in Eq. (1).
In this study, we used a recently developed BBCES instrument to measure the extinction cross sections of CO2, N2O, SF6, O2, and CH4 continuously across the wavelength region 307–725 nm. All of the measurements were done at a single pressure to eliminate effects due to alignment. This requires the use of two gases with different Rayleigh cross sections for the calibration of the BBCES instrument since the reference state is not vacuum. In this study, He and N2 were used to calibrate the system. By using the n-based calculated Rayleigh scattering cross sections of He and N2 to calibrate the path length of the optical cavity, the other cross sections can be determined relative to the difference between these two gases. We report high-accuracy Rayleigh scattering cross sections for all five gases and compared our results with previous n-based values. New dispersion relations for N2O, SF6, and CH4 are derived by incorporating data obtained by this study, extinction cross section data in the deep UV, and previously available scattering cross section data in the visible wavelength range.
2.1 Extinction measurement using BBCES
The BBCES systems used in this study are analogous to our previous studies (He et al., 2018; Washenfelder et al., 2016; Bluvshtein et al., 2016). Briefly, our BBCES instrument consists of two channels, one in the UV range (BBCESUV, 307–350 nm) and one in the UV–vis range (BBCESVis, 338–725 nm). The two channels of the BBCES instrument share a laser-driven Xenon arc lamp source (LDLS EQ-99CAL, Energetiq Technology, Inc., MA, USA) coupled with a high-transmission UV–vis optical fiber from which the light is collimated and focused (BBFIBERX-600-1M, Energetiq Technology, Inc., MA, USA). The light source was purged with high-purity N2 and cooled by an aluminum block (with 15∘ circulating water inside) to maintain stable optical power output. The UV light from the fiber was reflected by a low-pass dichroic mirror and filtered (Schott Glass WG310 and UG11) into the BBCESUV channel, which has a cavity with two 2.5 cm diameter, 1 m radius of curvature mirrors, with a manufacturer's reported reflectivity of 0.9995 (per pass loss = 500 parts per million, ppm) at the nominal center wavelength of 330 nm (Advanced Thin Films, Boulder, USA). The transmitted UV–vis light from the beam splitter was reflected and filtered (Schott Glass WG345 and Edmund Optics 15–261) into the BBCESVis channel consisting of two 2.5 cm, 1 m radius of curvature mirrors (FiveNine Optics, USA) with a manufacturer's reported reflectivity above 0.9993 (loss < 700 ppm); see Fig. S1. The light emerging through the rear mirror of the cavity was focused using a 0.1 cm f/2 fiber collimator (74-UV, Ocean Optics, Dunedin, FL, USA) into a high-transmission UV–vis optical fiber which directs the light into a high-performance spectrometer (QE Pro, Ocean Insight, USA). Before gas measurement, the wavelength of the spectrometer was calibrated using an HG-1 mercury argon calibration light source (Ocean Insight, USA) within the wavelength range of 302.15–727.29 nm. During these experiments, a 300 line mm−1 grating and a 200 µm entrance slit width were used. The charge-coupled device (CCD) array is a back-illuminated detector with 1024 × 56 pixels (Hamamatsu S7031-1006, Japan) thermo-electrically cooled to −10∘ to reduce thermal noise. Individual spectra at a wavelength resolution of 0.8 nm were acquired with 3.0 s integration time, and a total of 150 spectra were recorded during each measurement.
During the extinction measurements, the entire 94.0 ± 0.1 cm pathlength between the mirrors was filled with He, N2, CO2, N2O, SF6, or CH4. The gases were obtained from several vendors (Airgas, Linde) with the following purities: He, 99.995 %; N2, 99.999 %; N2O, 99.999 %; CO2, 99.999 %; SF6, 99.999 %; CH4, 99.9995 %.
The reflectivity of the mirrors (R(λ)) can be determined as a function of wavelength (λ) by taking into account the difference in the extinction due to known literary data of the Rayleigh scattering coefficient () by two different gases such as N2 () and He () (Washenfelder et al., 2008).
where d is the length of the cavity filled by the gas. Igas is the light intensity measured by filling the cavity with high-purity N2 () and He (IHe(λ)). Rayleigh scattering () is the combined product of the Rayleigh scattering cross section (σ) and the gas number density (N) during the measurements. Rayleigh scattering cross sections of N2 and He were calculated using the data in Table 1. Figure S1 shows typical examples of light intensity when the BBCES cavities are filled with pure N2. Reflectivity measurements were repeated every three sample measurements to track the stability of the system.
Once the reflectivity is determined, it is possible to calculate the wavelength-dependent extinction cross sections of other gases (σ(λ)) as follows:
where N is the number density of the gas during the measurements, and Igas(λ) is the light intensity when a target gas fills the cavity. During our experiments, the purge flow of the high-reflection mirrors was shut down to ensure that the cavity was filled with target gas completely. To measure the extinction cross sections of CO2, N2O, and SF6, the cavity is filled with pure target gas. Mass-flow-controller-controlled O2 CH4 flow was mixed with He in a 2 m Teflon tube ( in.) to generate a gas mixture with total flow rate of 500 mL min−1. For O2 experiments, measurements were performed for O2+ He mixtures by varying the O2 percentage between 10 % and 100 % with a 10 % step. The CH4 measurements were performed for CH4+ He mixtures with CH4 percentage ranges between 10 % and 100 % with a 10 % step. Additional measurements were also performed for 15 %, 25 %, 35 %, and 45 % CH4.
2.2 Extinction measurements using cavity ring-down spectroscopy (CRDS) at 404 nm and 662 nm
To obtain independent measurements for the extinction cross sections and to cross validate the BBCES technique, we conducted CRD measurements at two fixed wavelengths of 404 and 662 nm. CRDS is a highly sensitive technique and uses a different measurement principle than BBCES. The CRDS setup measured the decay rate of light due to extinction rather than an absolute absorbance (as in the BBCES instrument) and thus was immune to shot-to-shot source light fluctuations. A detailed description of the CRD method for light extinction measurement can be found in Bluvshtein et al. (2016) and He et al. (2018). Briefly, diode lasers (110 mW 404 nm diode laser, iPulse, Toptica Photonics, Munich, Germany; 120 mW 662 nm diode laser, HL6545MG, Thorlabs Inc., NJ, USA) were used as the light source of these CRDS instrument. The 404 and 662 nm lasers were modulated at 1383 and 500 Hz with a 50 % duty cycle. The diode lasers were optically isolated by quarter waveplates ( λ) and polarizing beam splitters to prevent damage to the laser head by back reflections from the highly reflective CRDS mirror. The back-reflected light beam was directed into a photodiode, which serves as an external trigger source. Light transmitted through the back mirror of the cavity was collected by an optical fiber and detected by a photomultiplier tube (PMT), which sampled at a rate of 10 to 100 MHz. The time-dependent intensity data were acquired with a 100 MHz card (PCI-5122, National Instruments, USA) and processed by data acquisition software in LabVIEW. An exponential curve was fitted to each intensity decay data set (Fig. S2). Over 1000 decay time measurements were monitored and averaged on a second basis. The residual of the fit for the averaged intensity decay was obtained and further normalized to the averaged intensity. The derived relative residuals (Fig. S2) showed no apparent structure with other time constants, validating the application of CRDS as a good measure of extinction. The resultant 1 Hz decay time was averaged over one measurement duration of 5 min with standard error as the measurement uncertainty.
All of the CRDS measurements were performed under room temperature and pressure downstream from the BBCES instrument. The gas temperature (K-type thermocouple) and cavity pressure (precision pressure transducer, Honeywell International Inc., MN, USA) were recorded between the two cavities for gas number density (N) calculation. During the CRDS measurements, the full cavity was filled with the investigated gases (He, CO2, N2O, SF6, O2, CH4, or gas mixtures (O2+ He and CH4+ He)). The extinction cross section (σ(λ)) of the studied gas was measured relative to that of He and was calculated by Eq. (4):
where L is the total length of the cavity (l), c is the speed of light, and τgas and τHe are the ring-down time of the cavity when it is filled by target gas or by the reference gas, He.
2.3 Data processing
For comparison, the scattering cross sections of the gases investigated in this study were also calculated with Eq. (1) based on the refractive index and the King correction factors available in the literature that are listed in Table 1. The King correction factors were taken as unity for mono-atomic molecules and spherical molecules (with regards to the depolarization) but deviate for non-spherical molecules. For the 307–725 nm wavelength range of this study, the n-based calculated Rayleigh scattering cross sections from largest to smallest are SF6 (Sneep and Ubachs, 2005; Wilmouth and Sayres, 2020), N2O (Sneep and Ubachs, 2005), CO2 (Alms et al., 1975; Bideau-Mehu et al., 1973), CH4 (Sneep and Ubachs, 2005; Wilmouth and Sayres 2020), N2 (Bates, 1984), O2 (Bates, 1984; Sneep and Ubachs, 2005), and He (Abjean et al., 1970; Cuthbertson and Cuthbertson, 1932). Additionally, the refractive indices of SF6, N2O, and CH4 were calculated based on Eq. (1) using cross-section results from this study and the King correction factors listed in Table 1. Our measurements were performed under ∼ 295 K and ∼ 1020 hPa. However, the calculated refractive indices were scaled to 288.15 K and 1013.25 hPa as in previous studies (Sneep and Ubachs, 2005; Wilmouth and Sayres, 2020).
The extinction of O2+ He mixtures () consists of the extinction by O2 () and He (αHe), and the O2–O2 collision-induced absorption (). The extinction of O2 and He is a combined product of extinction cross section (σgas) and gas number density (Ngas). Thus can be described with the following equation:
where and NHe are the number density of the O2 and He in the cavities. Performing a second-order polynomial fit to the extinction obtained by the BBCES system with respect to the gas number density thus yields the extinction cross section of O2 and the O2–O2 collision-induced absorption (CIA) cross section.
In addition to the results from second-order polynomial fitting, we also used data from pure O2 measurement to calculate the extinction by O2 and by CIA of O2–O2. The real refractive index of O2 () derived from extinction data measured in the wavelength regions where there is no absorption was fitted using the generalized expression of . Based on the refractive index, the scattering cross sections of O2 in the wavelength range of 307–725 nm were further calculated. By subtracting the scattering cross section of O2 from the measured total extinction, we derived the CIA of O2–O2. However, the O2 absorption bands at 580, 630, and 690 nm overlap with those of O2–O2 collisions. Additional corrections are thus needed to split the absorption by O2 and O2–O2 collision, which is out of the scope of this study.
Methane has weak vibrational overtone absorption in the UV–vis wavelength range that is comparable to or greater than its Rayleigh scattering. Previous high-resolution spectroscopy studies have identified smooth and unstructured absorption bands across the UV–visible range (Giver, 1978; Smith et al., 1990). The spectral features are substantially broader than 0.8 nm; thus the absorption by CH4 can be measured by our BBCES system. The measured extinction coefficients of CH4+ He mixtures () are linearly correlated with the number concentration of CH4 () as described by the following equation:
A linear fit was used for deriving the extinction cross section of CH4. The absorption between 300 and 400 nm is negligible as compared to the Rayleigh scattering. Thus extinction data in this UV wavelength range were used to calculate the real part of the refractive index of CH4, which was further fitted utilizing the expression of . By applying this dispersion relation, the Rayleigh scattering cross sections in the entire wavelength range of 307–725 nm were derived. Finally, the CH4 absorption cross sections were calculated by subtraction of the scattering cross section from the extinction cross section.
2.4 Error propagation for extinction measurements
The uncertainty for BBCES measurements can be assessed by the propagation of the errors associated with the measurements. The Rayleigh scattering cross section of N2 is validated up to 468 nm with an uncertainty of 1 %. Rayleigh scattering cross section measurements by CRDS agree well with those calculated from the refractive index with relative difference within 1 % in the wavelength range of 468–650 nm (Naus and Ubachs, 2000; Thalman et al., 2014). Thus, an uncertainty of 1 % was assigned for the N2 Rayleigh scattering cross section in the wavelength range of 307–725 nm. Each parameter (temperature, pressure, light intensity) was measured 150 times for each gas. The standard deviation of the measurements (< 0.3 %) is combined with the uncertainties in the pressure (± 0.3 %), temperature (± 0.1 %), the Rayleigh cross section uncertainties for N2 (± 1 %) as well as uncertainty in the measurements of the spectral signal by the spectrometer (≪0.2 %) to get an overall relative uncertainty for the effective pathlength curve of ± 1.1 %. This uncertainty is further propagated to the target gas by consideration of the uncertainties of pressure (± 0.3 %), temperature (± 0.1 %), and spectral intensity (≪0.2 %) of the target gas measurements, as well as the standard deviation of the measurements (< 1.2 %). The overall 1σ uncertainty of the gas extinction cross section is within 1.7 %. The precision of the mass flow controllers is 0.5 mL min−1. When the total flow rate is 500 mL min−1, the resulting uncertainty in the gas concentration (10 %–100 %) varies from 0 %–1.0 %. Thus, the overall 1σ uncertainty of extinction coefficients measured for CH4+ He and O2+ He varies from 1.1 % to 1.5 %. The detailed wavelength-dependent uncertainties were calculated due to the wavelength dependence of the spectral intensity. Moreover, due to the highly structured reflectivity curve of the high-reflection mirrors, additional uncertainty could be introduced, and this uncertainty cannot be quantified in this study.
3.1 Performance of the optical system
The reflectivity of the cavity mirrors, measured across the entire range using the difference in Rayleigh scattering of N2 and He, was very stable throughout the experiments. The measured mirrors reflectivity curves are shown in Fig. S1. The mean peak reflectivity of the BBCESUV mirrors was 0.999328 ± 0.000006 (672 ± 6 ppm) at 330 nm, with a corresponding effective optical pathlength of 1.40 ± 0.01 km. The reflectivity curve of the BBCESVis is much more structured, with reflectivity ranging between 0.999224 ± 0.000010 and 0.9999550 ± 0.0000006 (776 ± 10 ppm > loss > 45 ± 0.6 ppm) over a wide wavelength range of 338–725 nm. The reflectivity of the BBCESVis is much higher than that of our previous system (He et al., 2018) and also covers a much broader wavelength range. Thus the effective pathlength of the BBCESVis varies between 1.3 and 20.4 km, guaranteeing a high sensitivity of the extinction measurement.
3.2 Rayleigh scattering cross sections of CO2, N2O, and SF6
Figure 1 shows the extinction cross sections of CO2, N2O, and SF6 measured by the BBCES system. The extinction cross sections of these gases monotonically decrease with increasing wavelength, and no absorption (i.e., no structured extinction larger than the smoothly varying Rayleigh curve) is observed in the wavelength range of 307–725 nm, indicating that the measured extinction is due solely to the Rayleigh scattering of these gases. The wavelength-dependent relative standard deviations of the measurements for each gas are shown in Fig. 1d. The mean 1σ uncertainty of the reported cross sections for all three gases across the 307–725 nm wavelength range is 1.2 %–1.3 % for CO2, 1.2 %–1.7 % for N2O, and 1.2 %–1.4 % for SF6. As mentioned above, the derived uncertainty originates predominantly from the uncertainty in the N2 Rayleigh scattering cross section. Uncertainty in the Rayleigh cross sections of each gas varies with wavelength and generally tracks the light intensity spectra, which is a combined product of light source spectrum and the mirror reflectivity profile. The uncertainty is much higher when the transmitted light intensity is low (Fig. S1).

Figure 1Rayleigh scattering cross sections of CO2 (a), SF6 (b), and N2O (c). Panel (d) shows the relative standard deviations as a function of wavelength for each gas. The relative difference in the cross sections obtained by our measurements and calculations from the refractive index are displayed in panel (e). Panel (f) shows the relative difference after fitting (σ=AλB).
The BBCES-system-measured Rayleigh scattering cross sections for these three gases agree well with those obtained by our CRDS system operating at 404 nm and 662 nm, with deviations smaller than 0.9 %. Table 2 lists the Rayleigh scattering cross sections at several wavelengths obtained by the BBCES measurements (Exp) and by the calculations using the refractive index and Fk(ν) values from Table 1 (n-based). The relative differences between these two sets of results are within 1.4 %.
Table 2The Rayleigh scattering cross sections (10−27 cm2) calculated from the refractive index (n-based) and obtained from BBCES system (Exp) of selected wavelengths.
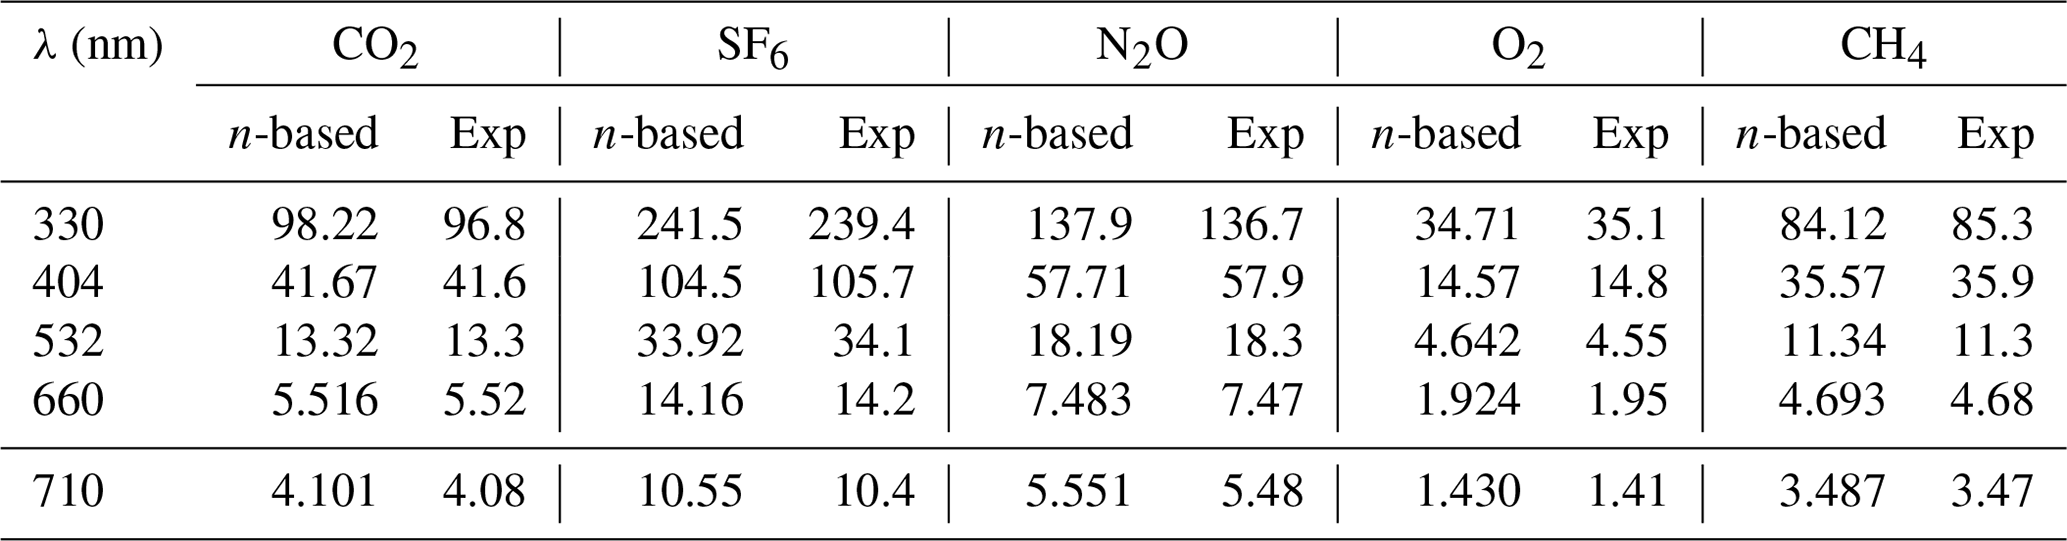
Figure 1a–c show a comparison of the measured Rayleigh scattering cross sections for CO2, N2O, and SF6 with n-based calculations and with previous experimental results from the literature. There are a few measurements for the Rayleigh scattering cross sections for CO2 which cover a wide spectral range (Jordan et al., 2019; Shardanand and Rao, 1977; Sneep and Ubachs, 2005; Wilmouth and Sayres, 2019, 2020; He et al., 2018). There are fewer Rayleigh scattering measurements for N2O and SF6 in the studied wavelength range. The measured Rayleigh scattering cross sections for CO2, N2O, and SF6 are in excellent agreement with n-based calculations. The wavelength-dependent differences of our experimentally derived Rayleigh scattering cross sections with n-based calculations are shown in Fig. 1e. The mean ratios of our measurements to the n-based values for the entire wavelength range of 307–725 nm are 1.00 ± 0.01, 0.99 ± 0.01, and 1.01 ± 0.01 for CO2, N2O, and SF6, respectively. The relative difference between our measurements and the n-based values are (0.4 ± 1.2) %, (−0.6 ± 1.1) %, and (0.9 ± 1.4) % (mean ± SD) for CO2, N2O, and SF6, respectively. Variability of the relative difference is due to structure in the mirror reflectivity that does not fully cancel. The wavelength-dependent Rayleigh scattering cross section is generally described in the form of , where σ and λ are the cross section and the wavelength. In this study, the measured values and the n-based data were both fit to this function. The relative difference between these two fitted functions is shown in Fig. 1f. That would be a measure of the uncertainty comparing smooth functions to smooth functions. The relative differences were (0.5 ± 0.5) %, (−0.4 ± 0.3) %, and (0.9 ± 0.2) % (mean ± SD), for CO2, N2O, and SF6, respectively. The mean values of the relative difference obtained from the fitting function are close to that obtained from the measurements. However, the variabilities are much smaller, which may be related to the cancellation of the influence by the structured mirror reflectivity. Notably, while our results for N2O agree well with the n-based calculations, previous results obtained by CRDS at 532 nm (Sneep and Ubachs, 2005) and by absorption spectroscopy in the wavelength of 300–315 nm (Bates and Hays, 1967) do not agree well with the n-based calculations. The measurements between 300 and 315 nm were first published by Bates and Hays (1967), who obtained the results from a doctoral thesis. However, the results from our BBCES system are in good agreement with the n-based calculations and with experimental results from independent CRDS measurements, thus increasing the confidence in our measured values.
3.3 Scattering and absorption cross sections of O2
The UV–vis spectra of gas-phase molecular oxygen are characterized by discrete structured absorption bands due to the electronic transition () of O2 monomer, broader unstructured CIA of O2–O2, and structured dimer bands from the bound van der Waals O2 dimer (Newnham and Ballard, 1998). Under atmospheric conditions, the O2–O2 CIA bands are frequently described as “O4” bands, although absorption by O2 dimer is thought to be significant only under very-low-temperature conditions (Thalman and Volkamer, 2013; Long and Ewing, 1973). Within the wavelength range investigated in this work, the molecular oxygen B band at 688 nm (), γ overtone band at 629 nm (), and δ overtone band at 580 nm () overlap with O2–O2 CIA bands of and , respectively. These absorption bands can only be resolved by a high-resolution spectroscopic technique. Absorption cross sections of the B, γ, and δ bands were convoluted from the HITRAN database (Gordon et al., 2017) by considering the temperature, pressure, and wavelength resolution of the instrument. The wings of the oxygen lines also show a quadratic dependence on the pressure due to pressure broadening. However, due to the minimal O2 absorption contribution below 680 nm and the low instrument wavelength resolution, the extinction cross section of the O2 monomer can be treated as linearly correlated with the O2 concentration. Moreover, the O2–O2 CIA cross section is correlated with the square of the O2 concentration. Therefore, these cross sections can be retrieved from measurements at different O2 concentrations. Due to the discrete structured absorption bands and the wavelength resolution of the instrument, the range of absorption cross sections spans several orders of magnitude within the spectral response of the instrument, limiting the relevance of the absorption cross sections for other researchers. These results are not further discussed here. However, the data for broader unstructured CIA of O2–O2 are still useful for various applications.
Figure 2 shows the wavelength-dependent extinction coefficients of O2+ He mixtures. He was used in these experiments to minimize extinction contributions from Rayleigh scattering. Nine absorption peaks centered at 344 (CIA), 360 (CIA), 380 (CIA), 446 (CIA), 477 (CIA), 532 (CIA), 577 (δ overtone and CIA), 629 (γ overtone and CIA), and 688 nm (B band and CIA) were observed in the wavelength range of 307–725 nm. The absorption coefficients of the central wavelengths for the first eight peaks increase non-linearly with O2 concentration, while that of the 688 nm peak increases in a more linear manner, indicating that the O2 B band absorption dominates the last absorption peak, while the other peaks are mostly associated with CIA of O2–O2.
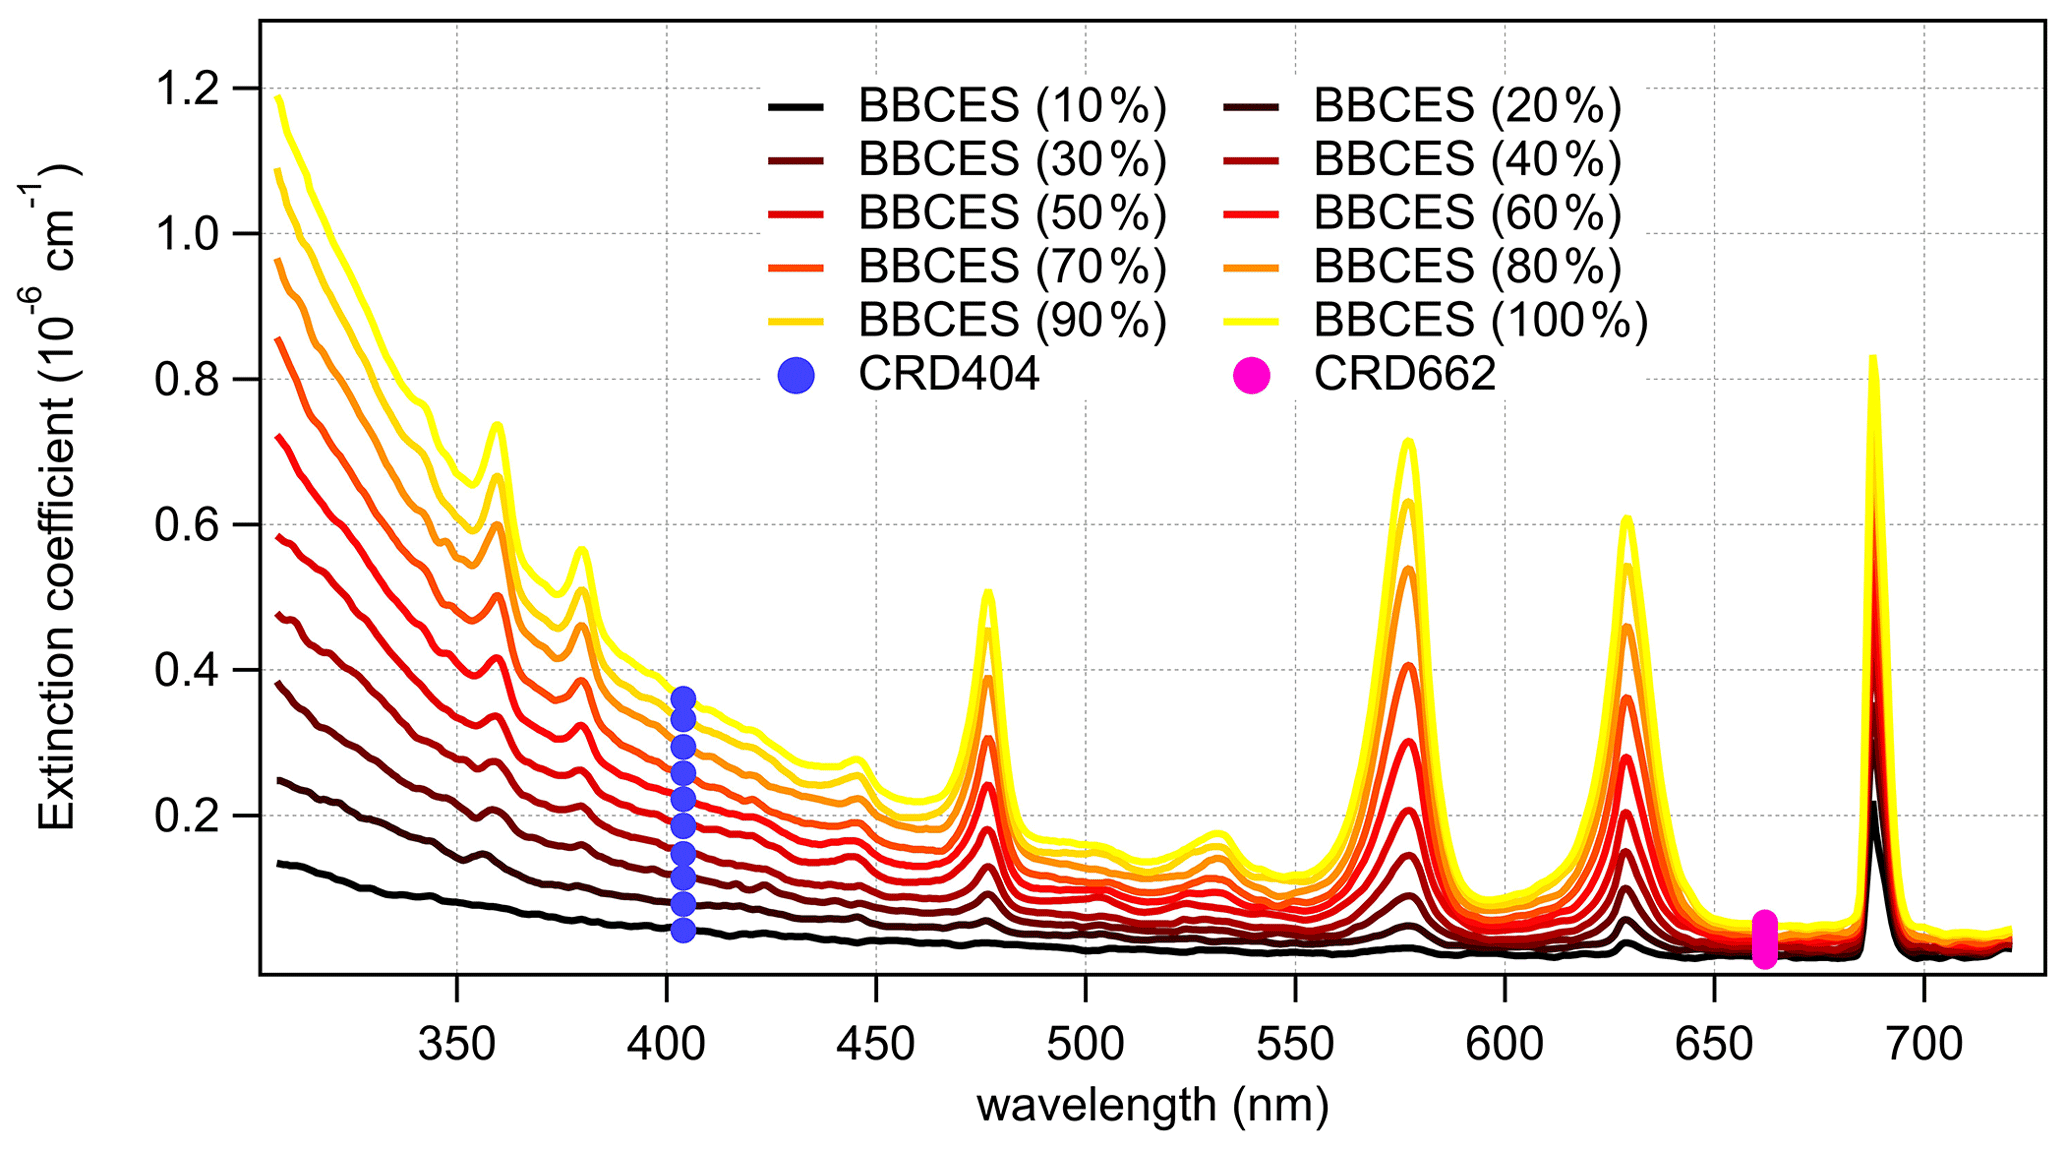
Figure 2Wavelength-dependent extinction coefficients of O2+ He mixtures as a function of O2 concentration. The colored lines represent the extinction coefficients measured by BBCES system, and markers represent results from CRDS setup.
The extinction coefficients obtained by the BBCES system correlated well with those measured by the CRD setup, with slopes of 0.990 (R2=0.9994) and 0.993 (R2=0.9996) at the wavelengths of 404 and 662 nm, respectively (Fig. 3). This excellent agreement between the instruments further substantiates the BBCES measurements and suggests that the accuracy of the BBCES instrument at these two wavelengths is better than estimated in the error propagation above, where the N2 refractive index was the largest uncertainty. As explained in the data processing section, the measured extinction coefficients were fitted with a second-order polynomial (selected wavelengths at the peaks of the CIA absorption bands are shown in Fig. 4). At 476.7, 577.2, and 629.2 nm, the absorption is from the CIA of O2–O2. The fit generates positive values matching the absorption cross section of O2–O2 CIA. At 687.7 nm where strong B-band absorption appears, the fit yields a small negative coefficient for O2–O2 CIA.
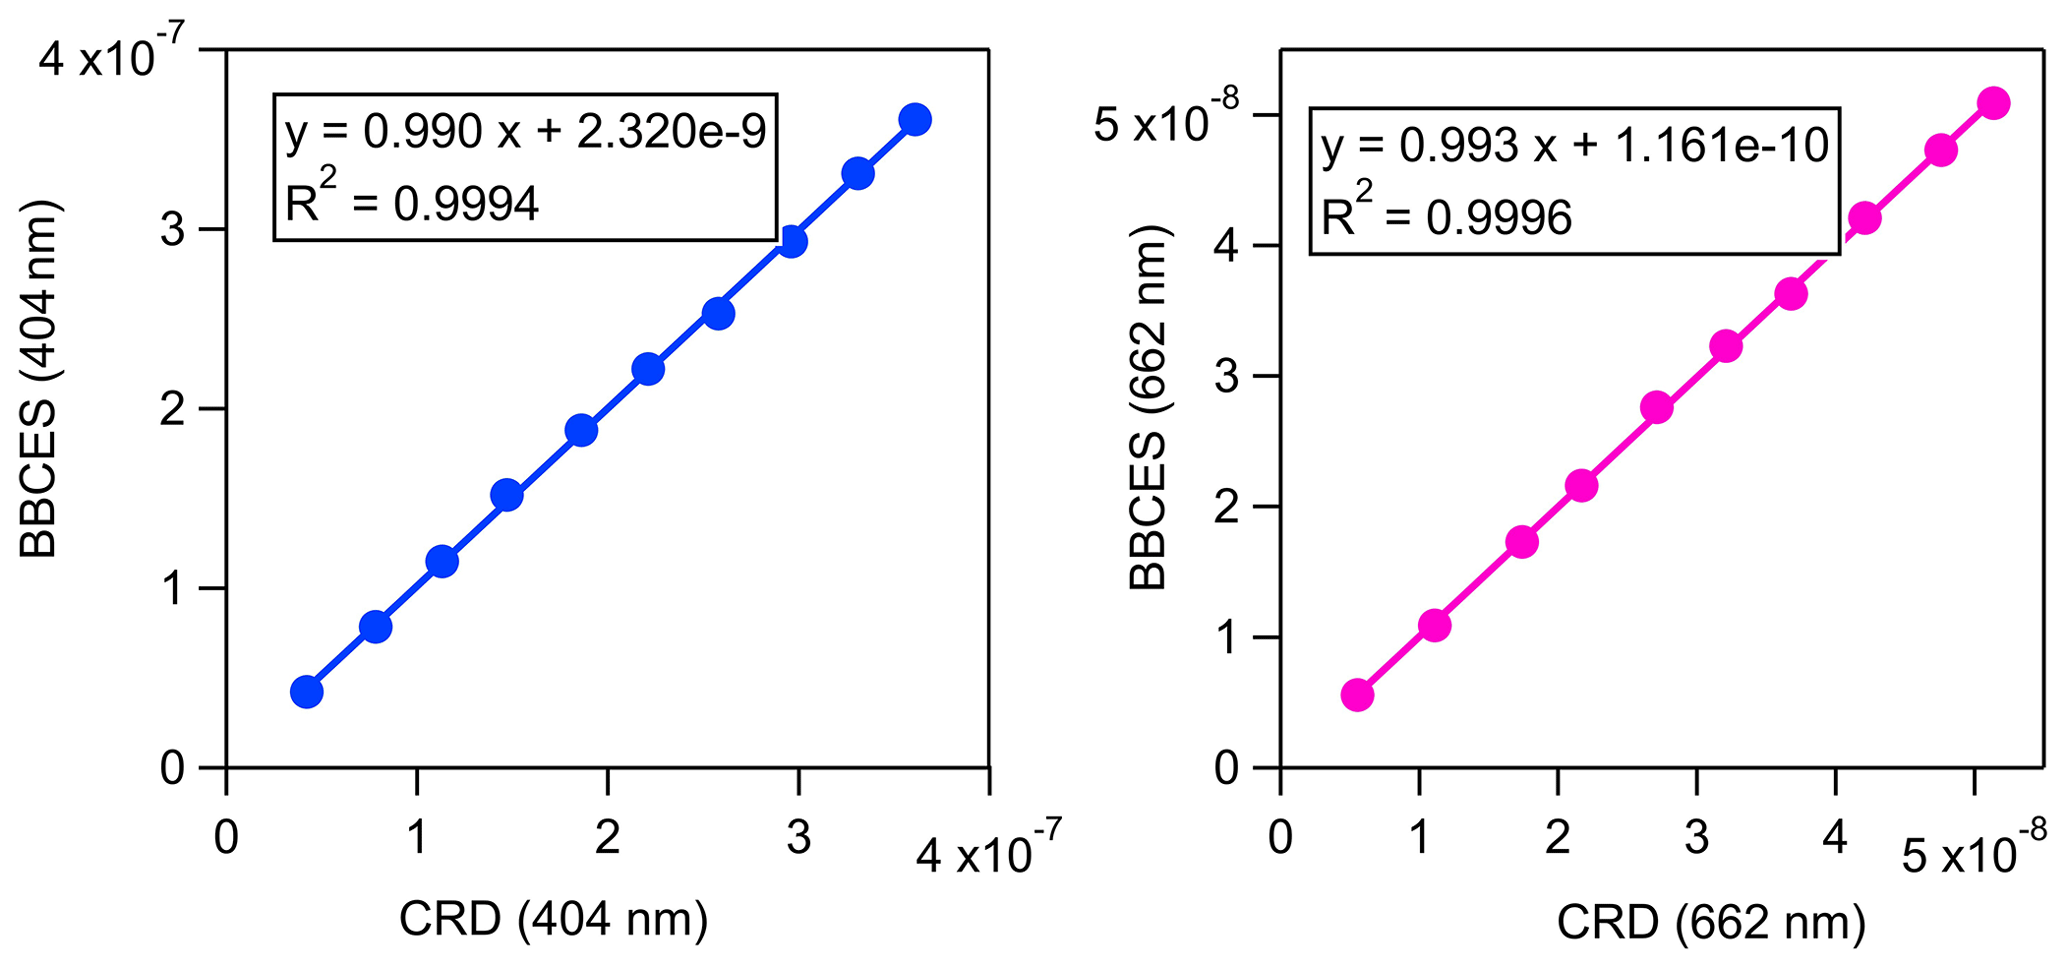
Figure 3Correlations between the extinction coefficients (unit, cm−1) measured by the BBCES system and CRDS setup.
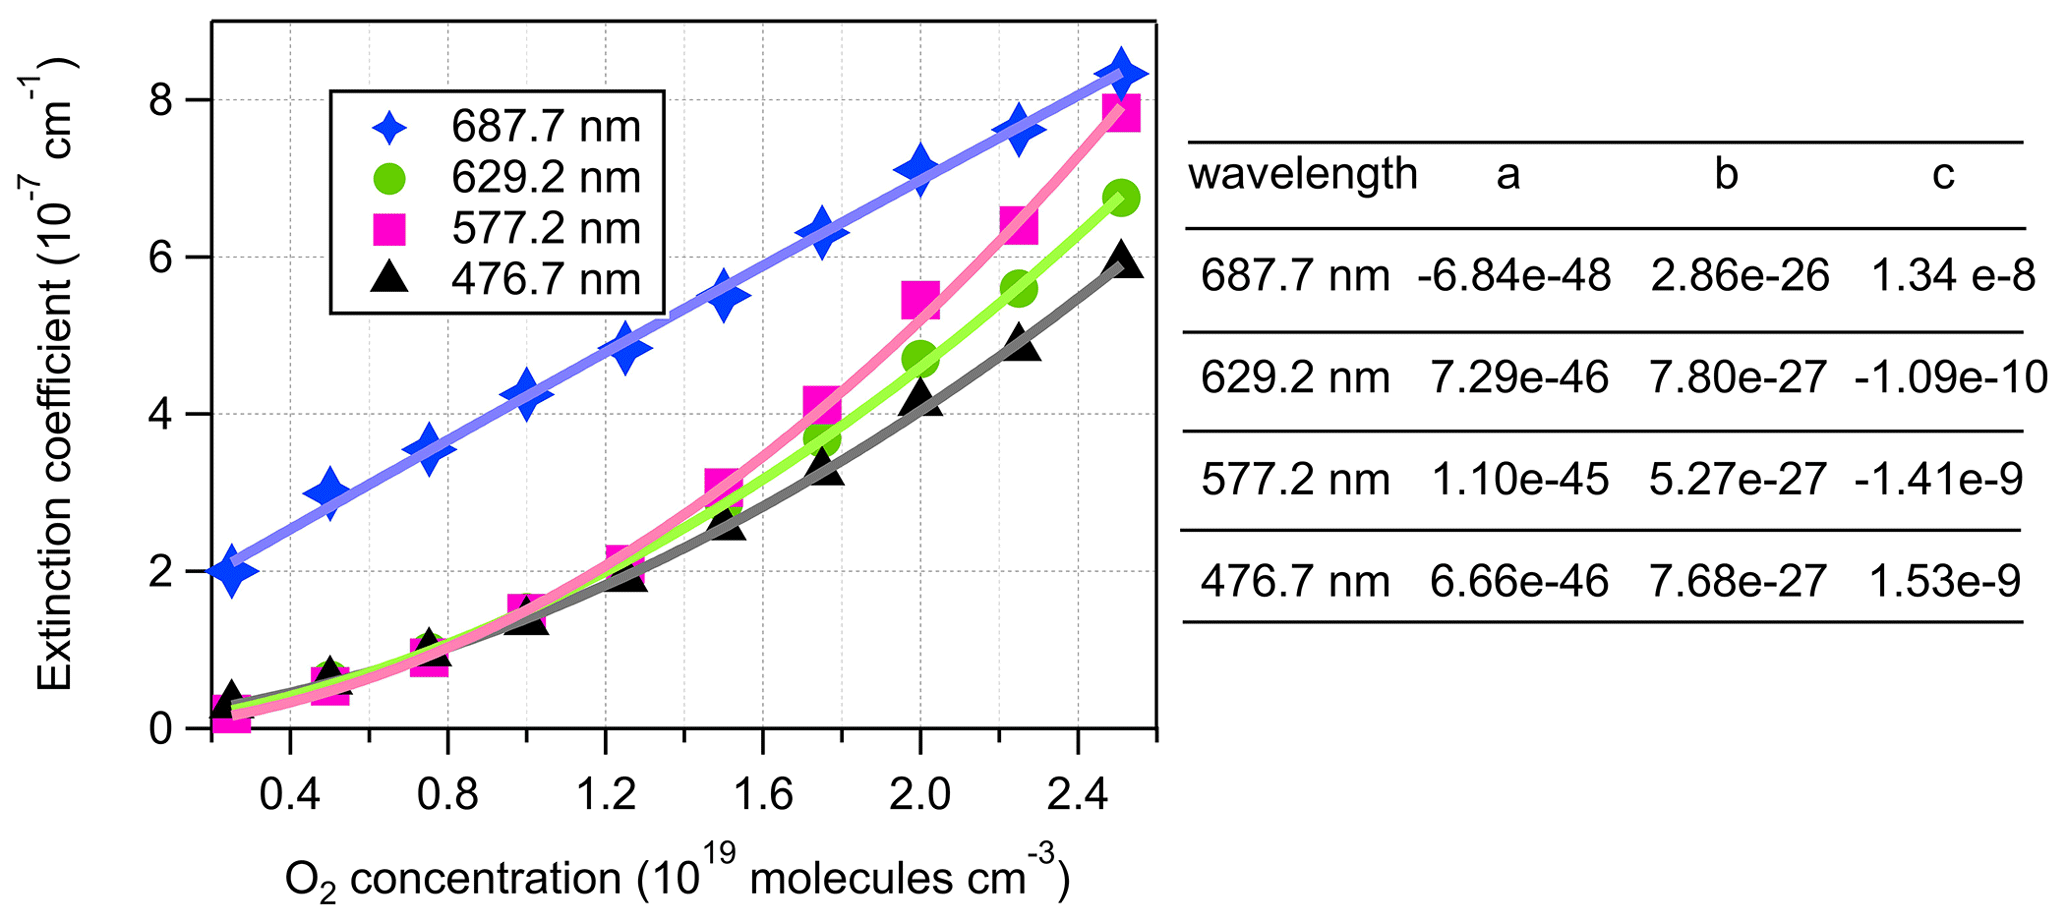
Figure 4Second-order polynomial fit of extinction coefficients measured by the BBCES system. The O2 concentration-dependent extinction coefficients are contributed by the extinction coefficients of O2 (), He (σHe), and the O2–O2 CIA cross sections ().
Figure 5a shows the extinction cross section measured for 100 % O2. These results agree well with previously reported results by Jordan et al. (2019). For wavelengths where no absorption is detected, the measured extinction cross sections agree well with n-based calculations. Figure 5b–c show the determined extinction cross sections for molecular O2 and the absorption cross sections of O2–O2 CIA. For wavelength ranges without O2 bands, our extinction cross sections agree well with the n-based values with an average deviation of (2.8 ± 1.2) %. The absorption cross sections for O2–O2 CIA derived in this study mostly agree well with literature data from Thalman and Volkamer (2013). The differences are within 1.1 % at 477, 532, 577, and 629 nm, but larger deviations were found at 344 (4.2 %), 360 (−29 %), 380 (−21 %), and 446 (4.2 %) nm. These absorption bands are the lowest intensity bands and therefore have the largest relative uncertainties in either measurement. Moreover, the absorptions at 344, 360, 380, and 446 nm contribute a much smaller fraction of the extinction as compared to that of 477, 532, 577, and 630 nm. Thus larger discrepancies were observed during the apportionment of absorption from extinction.
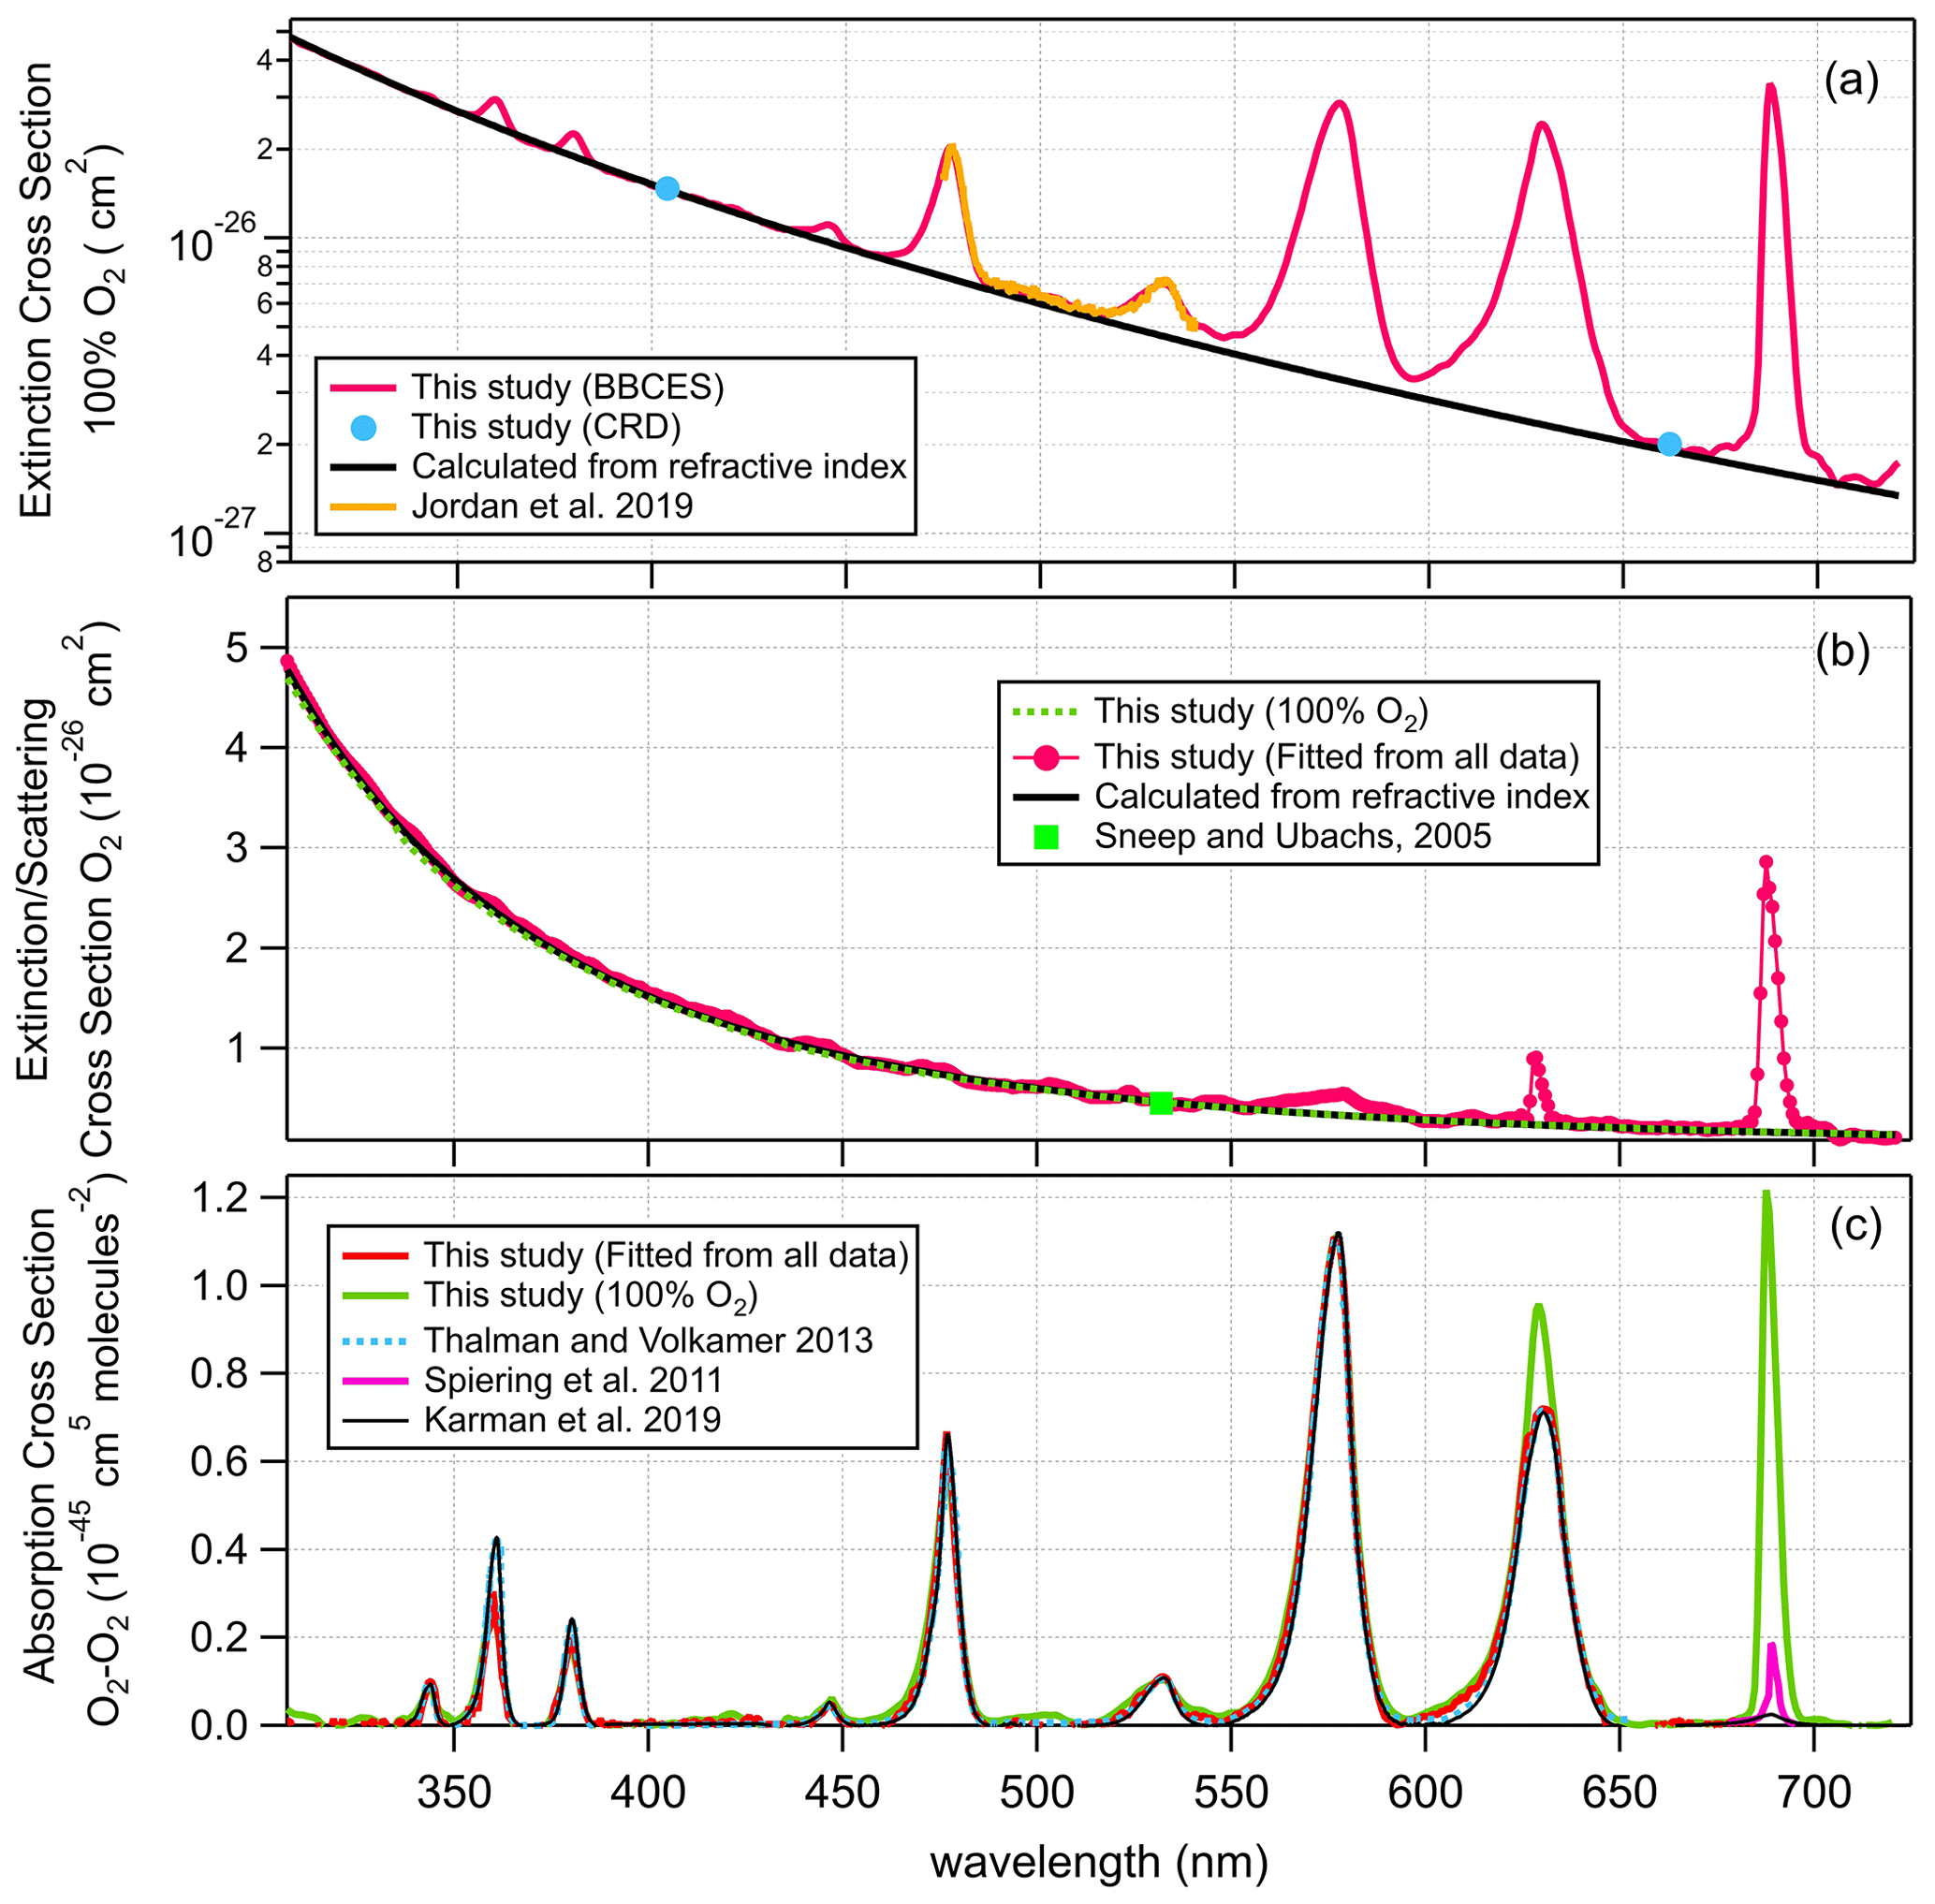
Figure 5Wavelength-dependent extinction cross sections of 100 % O2 (a), extinction cross sections of O2 (b), and O2–O2 CIA cross section (c).
The Rayleigh scattering cross sections of molecular O2 derived from the 100 % O2 measurement agree well with n-based calculations with an average difference of 1.2 %. CIA of O2–O2 calculated from this single measurement matches the results from the fitting method. Due to strong absorption from the O2 B band and γ overtone band, this method cannot derive the cross sections of CIA of O2–O2 at 630 and 688 nm.
3.4 The scattering and absorption cross sections of CH4
CH4 has weak absorption in the UV–vis wavelength range, and these bands dominate the photographic spectra of planets such as Uranus and Neptune (Adel and Slipher, 1934). Figure 6 presents the wavelength-dependent extinction coefficients of CH4+ He mixtures. A total of 11 absorption bands were detected in the wavelength range of 307–725 nm. The extinction coefficients increase as a function of increasing CH4 concentration. Extinction coefficients obtained by the BBCES system correlated well with those measured in parallel by the CRDS instrument, with slopes of 1.002 (R2=0.9999) and 0.99 (R2=0.999) at the wavelengths of 404 and 662 nm (Fig. S3). The excellent agreement between these three systems further supports the accuracy of BBCES extinction measurements over a wide working range. The measured extinction coefficients were linearly fit against the CH4 number concentration. Figure 7 shows the fitted curves at five selected wavelengths. The extinction coefficients have a linear correlation with CH4 concentration (R2>0.9988) without exception. The calculated slopes represent the extinction cross sections of CH4 and also indicate a wide dynamic range of our BBCES system.
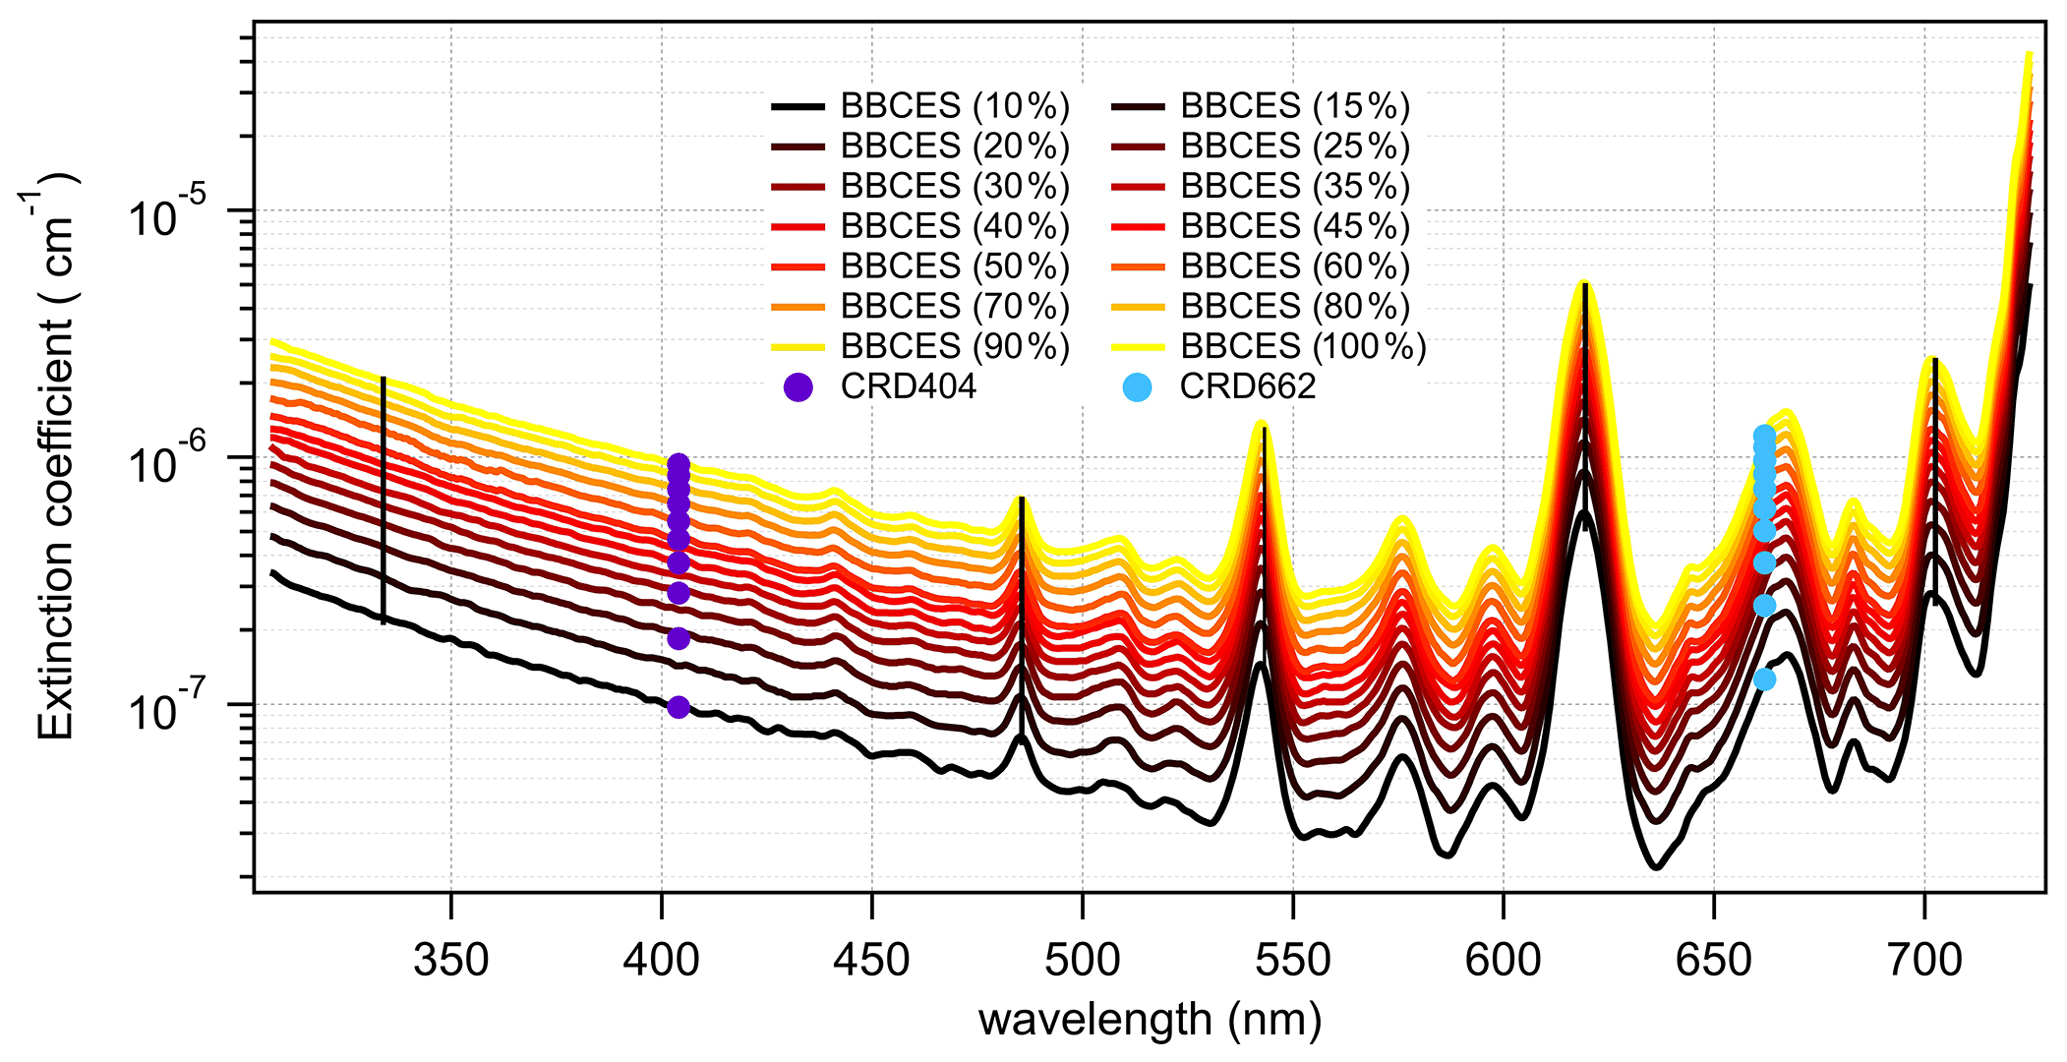
Figure 6Wavelength-dependent extinction coefficients of CH4+ He mixtures as a function of CH4 mixing ratio. The colored lines represent extinction coefficients obtained from BBCES system and markers represent results from CRDS setup. Measurements were performed with CH4 percentage within 10 % and 100 % with a 10 % step. Moreover, BBCES measurements were also performed for 15 %, 25 %, 35 %, and 45 % CH4. The number concentration of 100 % methane was 2.50143 × 10¹⁹ molec. cm−3. Data at selected wavelengths (vertical lines) are shown in Fig. 7.
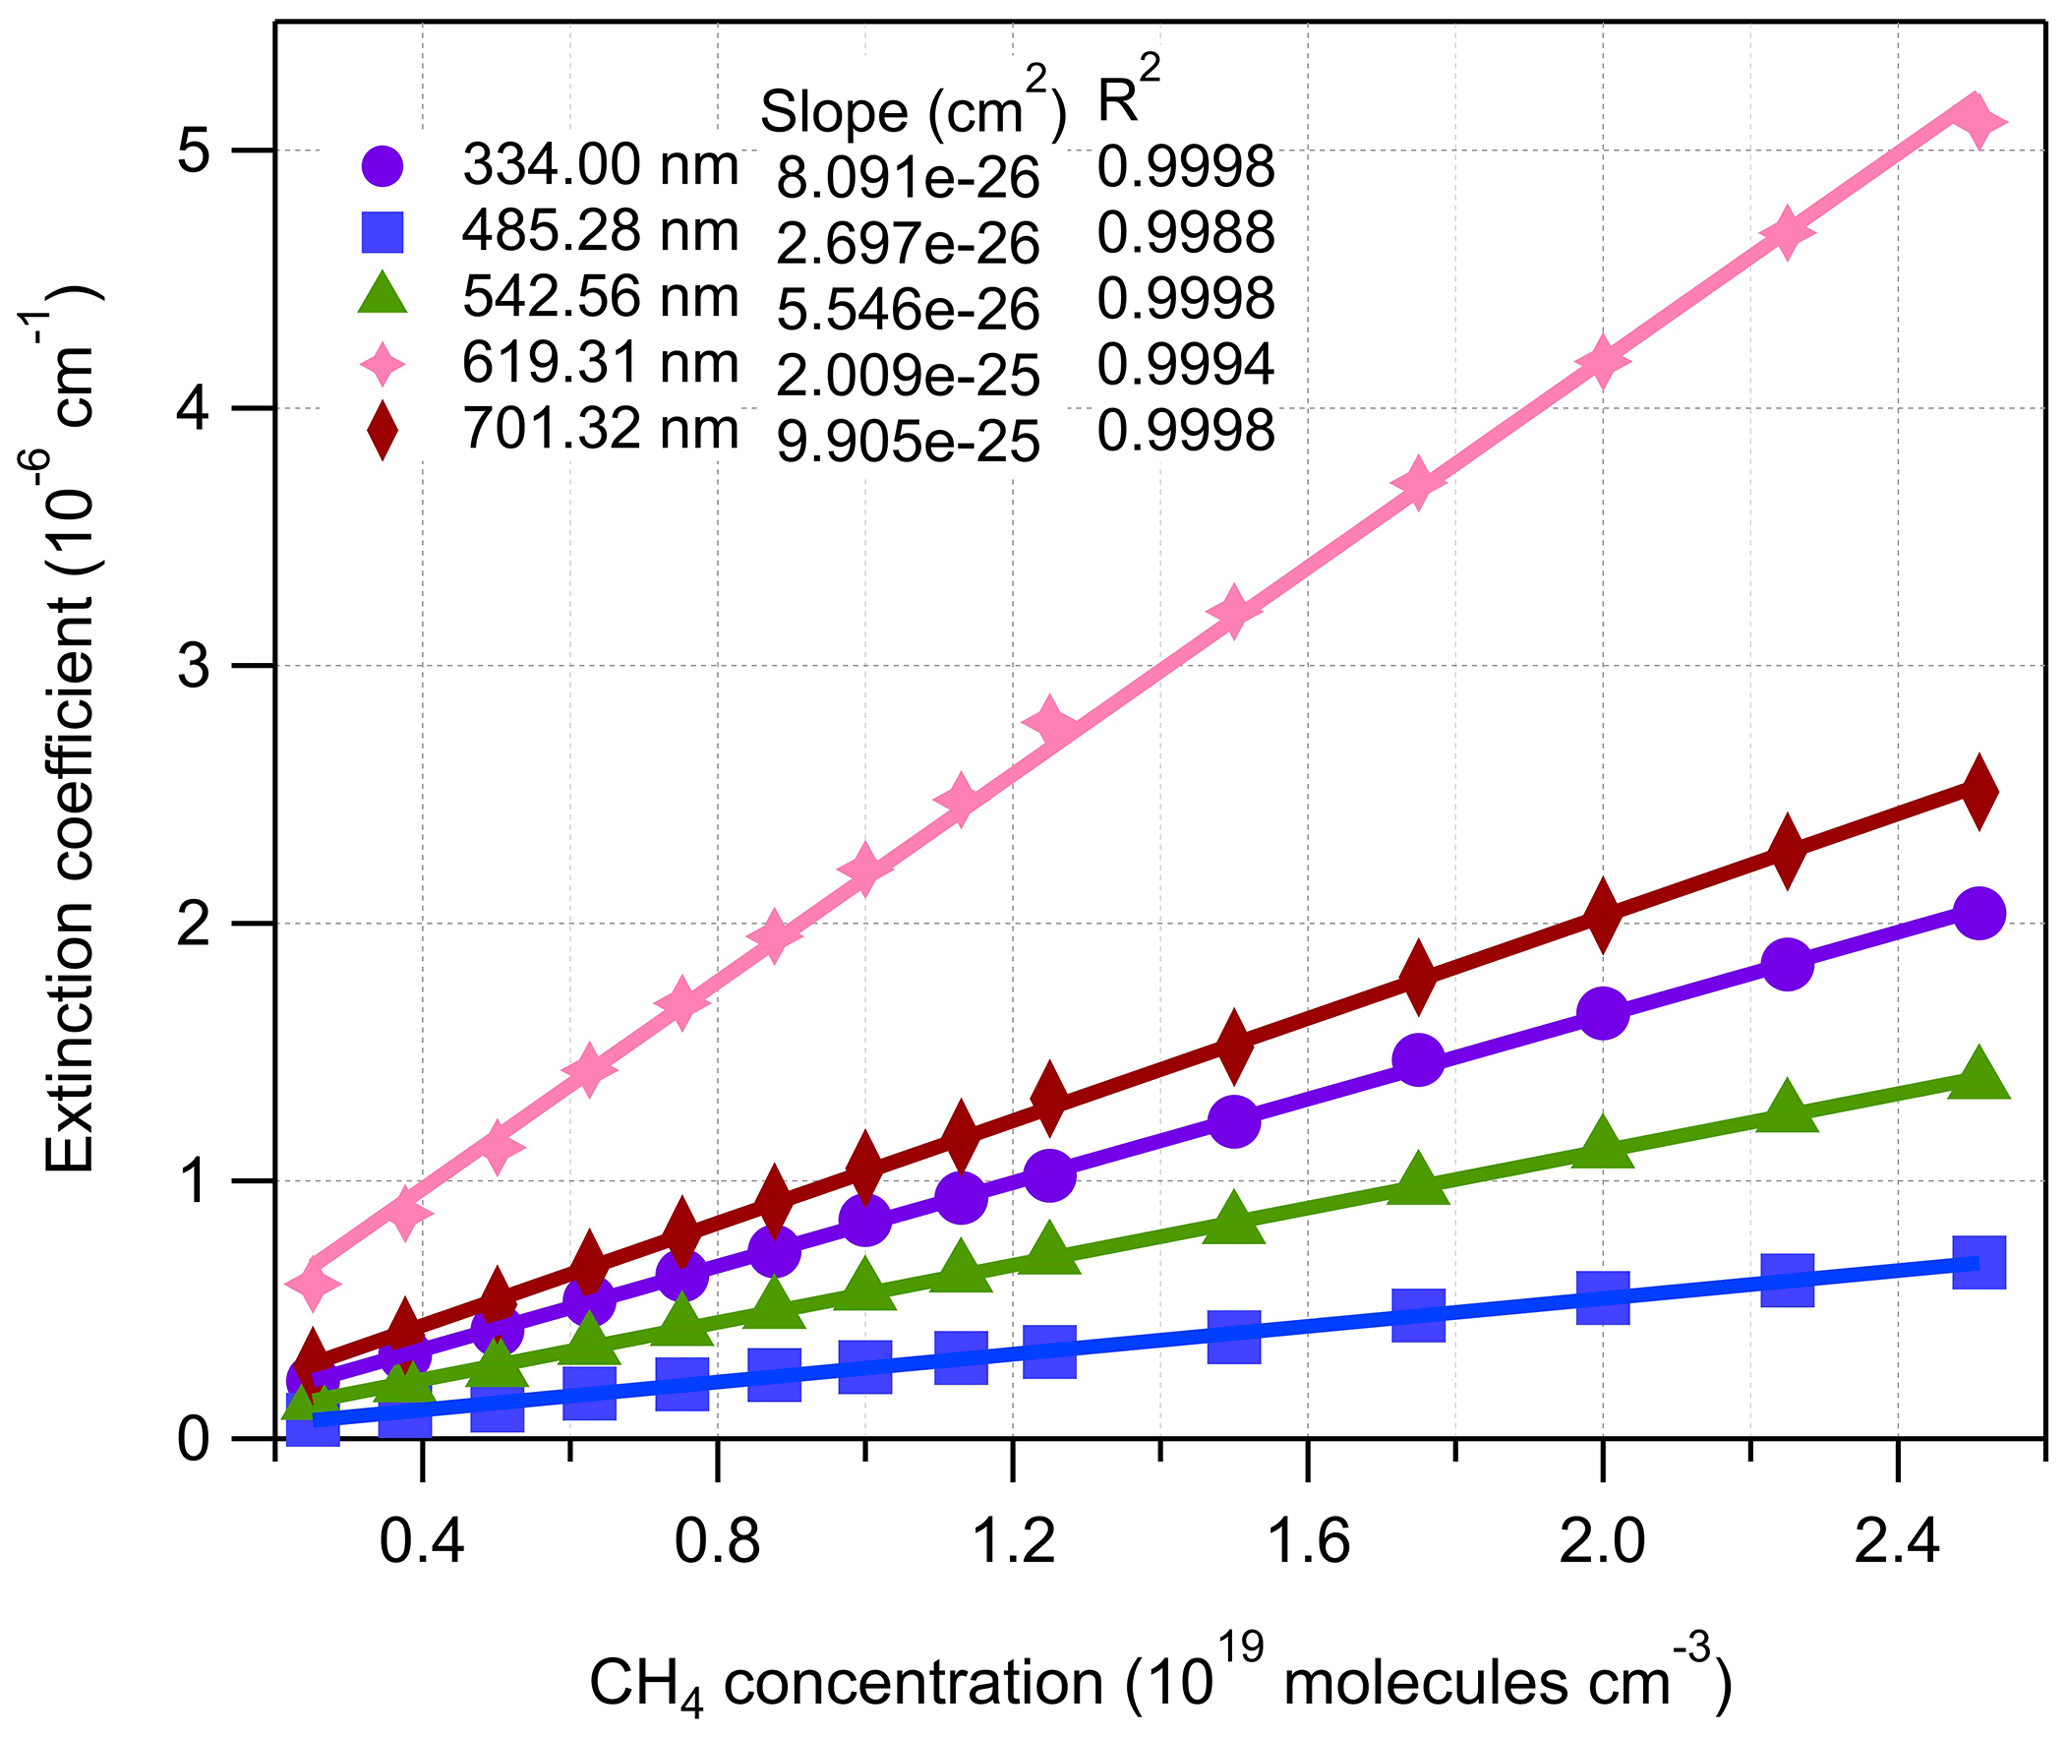
Figure 7The relationship between BBCES-system-measured extinction coefficients of CH4+ He mixtures and CH4 concentration. The selected wavelengths were located in Fig. 6 by vertical lines.
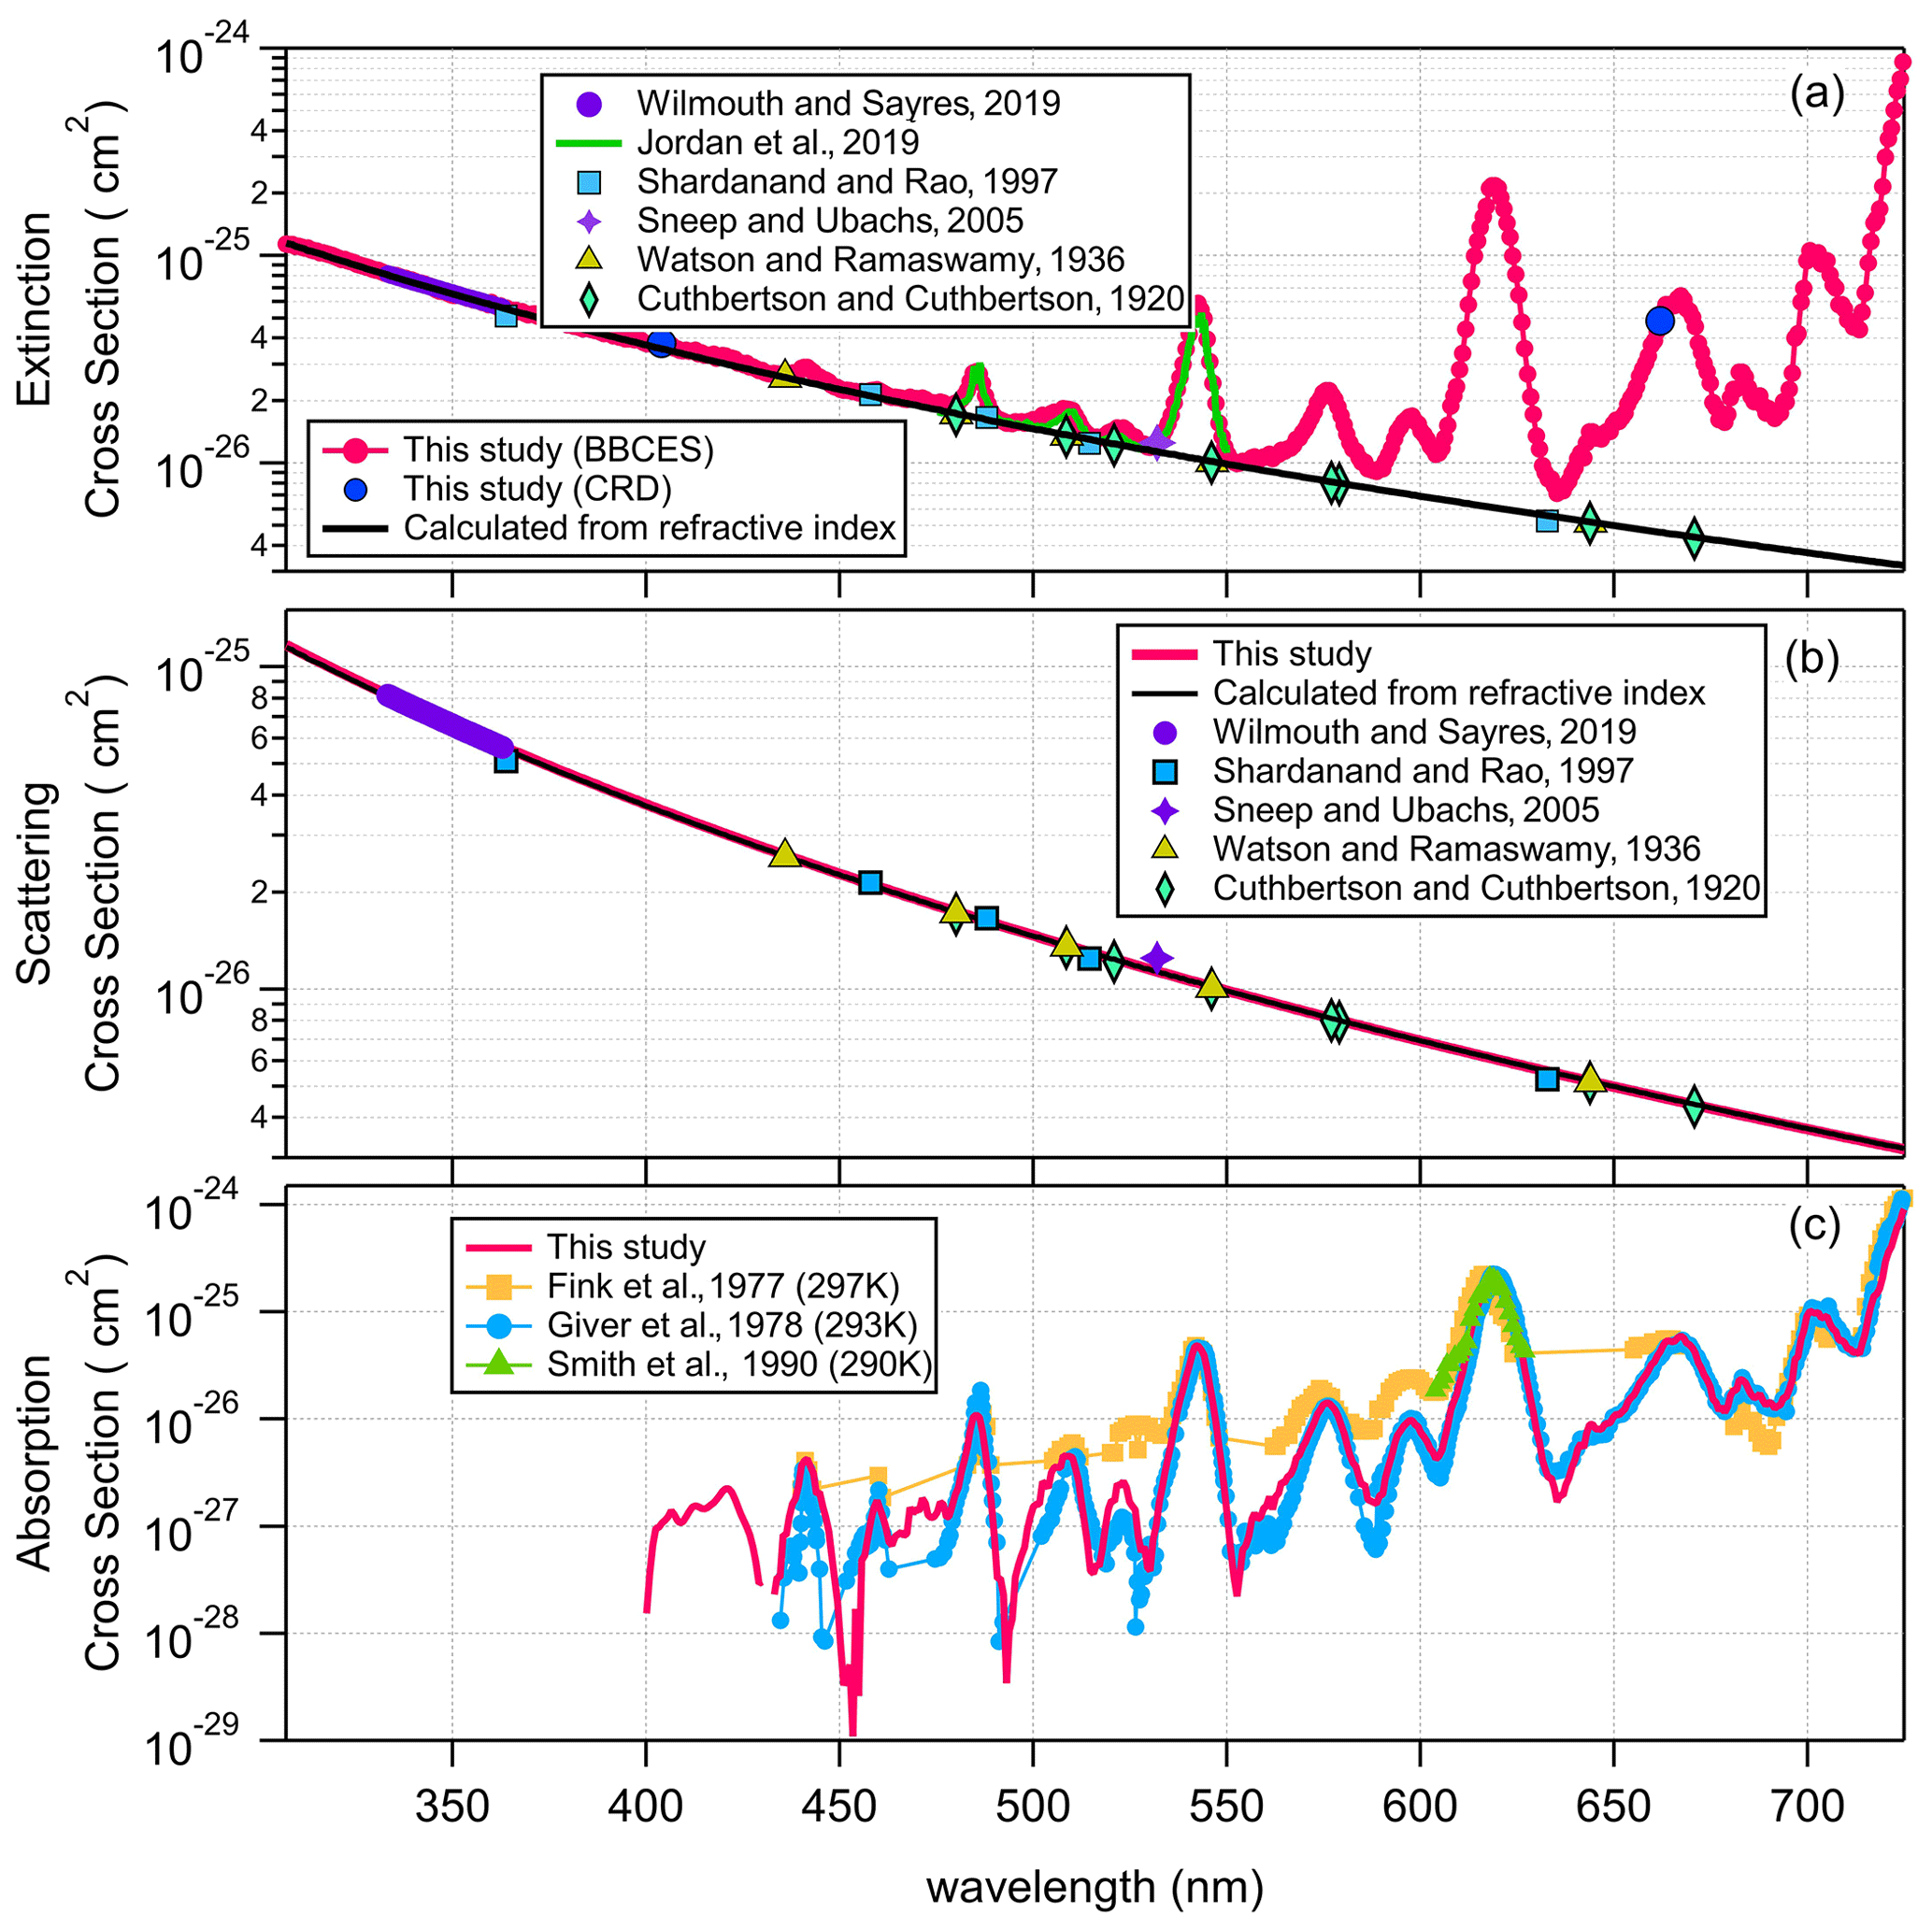
The extinction cross sections for CH4 retrieved from concentration-dependent measurements are plotted in Fig. 8a. BBCES results from this study agree well with results from previous studies using BBCES (Jordan et al., 2019; Wilmouth and Sayres, 2019) and CRDS (Sneep and Ubachs, 2005). Previous studies using a nephelometer (Shardanand and Rao, 1977) and interferometer (Cuthbertson and Cuthbertson, 1920; Watson et al., 1936) obtained the scattering cross sections and the refractive index of CH4. The BBCES instrument measures the extinction cross section. For wavelengths where extinction is dominated by Rayleigh scattering (< 475 nm), our BBCES results agree well with the results from nephelometer and interferometer measurements. In this study, the refractive index of CH4 was calculated using the extinction data in the wavelength range of 307–400 nm. The calculated refractive index was fitted to the general expression:
As shown in Fig. 8b, our calculated scattering cross sections are in good agreement with those derived from the newest refractive index developed by Wilmouth and Sayres (2020) (Table 2), with an average difference of (0.9 ± 2.2) %. The absorption cross section, which is the difference between the total extinction and the Rayleigh scattering cross section, is shown in Fig. 8c. At most spectral ranges, our results are in better agreement with the results from previous studies by Giver (1978) and Smith et al. (1990). For example, the difference as compared to the results from Giver (1978) at 542, 576.4, 598, 619, 665.7, and 703.6 nm is 4.0 % on average. At several wavelength regions (e.g., 520–536, 580–605 nm), the results from Fink et al. (1977) differ from all of the other studies. In the wavelength range of 400–725 nm, absorption contributes up to 99.7 % of the CH4 extinction.
3.5 Dispersion relations for N2O, SF6, and CH4
SF6. Wilmouth and Sayres (2020) found that their measured Rayleigh scattering cross sections for SF6 in the ultraviolet range were lower than those from the n-based expression of Sneep and Ubachs (2005). They generated the dispersion formula for SF6 from the combined fit using refractive index data in the wavelength range of 264–297 and 333–363 nm by Wilmouth and Sayres (2020, 2019) and direct refractive index measurement at 632.99 nm (Vukovic et al., 1996) (Fig. 9a). In our study, the refractive index of SF6 in the wavelength range of 307–725 nm was calculated from the measured Rayleigh scattering cross section. The calculated refractive index was scaled to 288.15 K and 1013.25 hPa to be consistent with past studies. To constrain the dispersion formula when extrapolated over a broad wavelength range, we employed an fit of the form to our data and the data used by Wilmouth and Sayres (2020) for fitting. All data points were weighted equally. The resulting dispersion relation for SF6 in the wavelength range of 264–725 nm is
N2O. Sneep and Ubachs (2005) derived the refractive index based on polarizability measurements using interferometer at five single wavelengths (457.9, 488, 514.5, 568.2, 647.1 nm) by Alms et al. (1975). In this study, we calculated the refractive index of N2O from the Rayleigh scattering cross sections in the wavelength range of 307–725 for 288.15 K and 1013.25 hPa. Based on this refractive index data set, the dispersion relation (Eq. 9) for N2O was retrieved for a much broader wavelength range (Fig. 9b) compared to that generated by Sneep and Ubachs (2005).
CH4. The previous study by Wilmouth and Sayres (2019) has shown that their measured Rayleigh scattering cross sections for CH4 are in substantial disagreement (22 %) with those calculated from the refractive index recommended by Sneep and Ubachs (2005). Sneep and Ubachs (2005) formulated the refractive index of CH4 based on interferometric measurements at wavelengths of 325, 543.5, 594.1, 612, and 633 nm by Hohm (Hohm, 1993). However, the Rayleigh scattering cross sections calculated from Sneep and Ubachs (2005) are much higher than all the measured values listed in Fig. 9c. Using equally weighted Rayleigh scattering cross sections data sets in the wavelength range of 264–297, 333–363 nm (Wilmouth and Sayres, 2019, 2020), 307–400 nm from this study, and single wavelength measurements that are not impacted by absorption (Cuthbertson and Cuthbertson, 1920; Watson et al., 1936), we derived the dispersion formula for the refractive index of CH4 in the combined UV–visible range (Fig. 9c) as follows:
The calculated Rayleigh scattering cross sections using the dispersion relations derived in this study were compared with those derived from previously recommended formulations listed in Table 1 (Fig. 9). The difference increases significantly towards the longer wavelength in the region of 320–725 nm (Fig. S4). The average deviations are 0.1 %, 0.9 %, and 0.1 % for SF6, N2O, and CH4, respectively. The fit performed by this study combines the data set used by Wilmouth and Sayres and the data acquired by this study. These small deviations support that our data acquired by the BBCES at a wide range agree well with literature data. Notably, the difference for N2O is more significant than for the other two gases. This study uses refractive index data in the continuous wavelength ranges of 307–725 nm to derive the dispersion relation, while the formulation for N2O in Table 1 is derived by Sneep and Ubachs (2005) based on polarizability measurements at five single wavelengths. For the formulation of the refractive index of CH4, Wilmouth and Sayres (2020) weighted the data sets from Watson and Ramaswamy (1936) and Cuthbertson and Cuthbertson (1920) equally but gave more weight to their UV measurements when deriving the formulation of the refractive index. In this study, all the CH4 data set were weighted equally. The derived dispersion relation agrees very well with that from Wilmouth and Sayres (2020), as shown in Fig. 9c–d.

Figure 9Real refractive index (n) for SF6 (a), N2O (b), and CH4 (c). Comparison of refractive index from this work with previous studies (Cuthbertson and Cuthbertson, 1920; Naus and Ubachs, 2000; Shardanand and Rao, 1977; Sneep and Ubachs, 2005; Vukovic et al., 1996; Watson et al., 1936; Wilmouth and Sayres, 2019, 2020) over the wavelength range of 264–725 nm. The green line represents the dispersion relation given in Table 1. The black line represents the dispersion relation given in Eqs. (8)–(10) derived from a fit to our data and references results. The shading represents 1σ uncertainty of the n. The n values for Shardanand and Rao (1977), Sneep and Ubachs (2005), and Naus and Ubachs (2000) were calculated from their reported Rayleigh scattering cross sections. Refractive index data from Sneep and Ubachs (2005) are not used in the fitting since these results are away from others. Data from Shardanand and Rao (1977) are not used due to large uncertainties. All of the data sets are equally weighted during fitting. Panel (d) is a close-up view of panel (c) in the wavelength range of 264–363 nm.
The structure in derived refractive indices that arises from the residual structure in the reflectivity curves is a limitation. However, the agreement between the CRDS data and the BBCES data at 405 and 662 nm is 0.24 % and 0.8 %, with both values well within the stated uncertainty of the BBCES data. CRDS is an absolute method that does not suffer from the apparent artifact due to the structured mirror reflectivity. Moreover, the large number of data points in the BBCES data easily compensates for the uncertainty in the structured mirror reflectivity when fitting a smooth function to the data. Figures S5–S7 show the refractive index fit using our raw BBCES data and a series of fits to more highly averaged data. As the averaging increases, the apparent structure in the data decreases, but the fit does not change.
Rayleigh scattering cross sections between 307 and 725 nm were determined for CO2, N2O, SF6, O2, and CH4 by simultaneous BBCES and CRDS measurements. Extinction coefficients obtained by the BBCES system show high consistency with those measured by parallel CRDS instruments at 404 and 662 nm (Figs. 3 and S3), demonstrating that the BBCES measurements provide results with both a wide wavelength range and high accuracy. Comparison of our measurements with the n-based calculations for these gases in the entire wavelength range of this study yields excellent agreement with relative differences of (0.4 ± 1.2) %, (−0.6 ± 1.1) %, (0.9 ± 1.4) %, (2.8 ± 1.2) %, and (0.9 ± 2.2) % for CO2, N2O, SF6, O2, and CH4, respectively. The O2–O2 CIA cross sections obtained from the BBCES measurements are compared with those published by Thalman and Volkamer (2013). The relative differences are within 1.1 % at 477, 532, 577, and 630 nm. Larger relative differences occur at the weak bands at 344 (4.2 %), 360 (−29 %), 380 (−21 %), and 446 (4.2 %) nm. The absorption cross sections of CH4 in the wavelength range of 400–725 nm agree well with those documented by Giver (1978).
Rayleigh scattering cross sections of CO2 determined using BBCES system and CRDS instruments in this study and in other studies have shown that the refractive index recommended by Sneep and Ubachs (2005) is suitable for use in the wavelength range of 307–725 nm. By incorporating the refractive index data from previous studies, we developed new dispersion relations for the refractive index of N2O (307–725 nm), SF6 (264–725 nm), and CH4 (264–671 nm). The derived dispersion relations for SF6 and CH4 agree well with those provided by Wilmouth and Sayres (2020).
Previous studies measured the Rayleigh scattering and absorption cross sections of CO2, N2O, O2, SF6, and CH4 at narrow spectral ranges or single wavelengths. In this study, we used BBCES system that covers the broad wavelength range of 307–725 nm to measure total extinction (the sum of absorption and scattering). The measurements validate that refractive index-based methods for calculating Rayleigh extinction cross sections are accurate and provide new fits over more continuous and extended wavelength ranges than available in the literature to constrain such methods. The Rayleigh scattering cross sections reported here are useful in several applications. These include calibration standards based on extinction for optically based instruments, such as those designed for aerosol optical properties measurements or trace gas concentrations in the field (Jordan et al., 2019; Min et al., 2016; Bluvshtein et al., 2017), especially when high-refractive-index gases are used for improved calibration. They will also improve the accuracy of Rayleigh scattering parameterizations for major greenhouse gases in Earth's atmosphere, CO2, CH4, and N2O. Accurate quantitative measurements of Rayleigh scattering coefficients and absorption cross sections of atmospheric gases such as molecular N2, O2, CO2, and the CIA of O2–O2 cross sections in the UV–NIR range are of particular importance for the application of Rayleigh lidar systems, especially at the Nd:YAG laser harmonics 1064, 532, and 366 nm. These systems analyze the molecular backscattering contributions to the lidar's attenuated backscatter signals to retrieve the atmospheric profile of aerosols and clouds in the planetary boundary layer (Tomasi et al., 2005; Herron, 2007). Recent NASA satellite missions have also aimed to measure global carbon dioxide concentrations with high precision (0.25 %) (Drouin et al., 2017). These CO2 global missions use the O2–O2 CIA underneath the structured O2 A band (760 nm) to evaluate the solar radiation double pathlength in the Earth's atmosphere and to determine the atmospheric pressure. The measurements in this study validate the existing literature on the extinction of O2 collision complexes and molecular oxygen bands and can be used for calibration purposes in both remote sensing and in situ spectroscopic applications in the atmosphere. In the future, gas extinction measurements at extended wavelengths (near-infrared) and for additional gases (e.g., N2) will improve the spectroscopic applications in atmospheric studies. We also note that while acquiring data at a broad wavelength range quickly using a single BBCES instrument, uncertainties were also observed in the wavelength ranges where the mirror reflectivity changed significantly. However, with appropriate averaging, this can be minimized without compromising the accuracy. There is a tradeoff between obtaining data at a wide wavelength range and ensuring high-accuracy data. New mirrors with a smoother reflectivity curve will improve the performance of the BBCES instrument.
Data are available upon request from the corresponding author (yinon.rudich@weizmann.ac.il).
The supplement related to this article is available online at: https://doi.org/10.5194/acp-21-14927-2021-supplement.
QH, SSB, and YR designed this study. QH, ZF, and OS conducted the experiments. QH prepared the draft and all of the co-authors reviewed it and provided comments.
The authors declare that they have no conflict of interest.
Publisher’s note: Copernicus Publications remains neutral with regard to jurisdictional claims in published maps and institutional affiliations.
Quanfu He is supported by the Koshland Foundation and the Center for Planetary Sciences, Weizmann Institute of Science. Zheng Fang is supported by the SAERI initiative of the Weizmann Institute of Science.
This research has been supported by the US-Israel Binational Science Foundation (grant no. 2016093).
This paper was edited by Andreas Richter and reviewed by Andreas Richter and two anonymous referees.
Abjean, R., Mehu, A., and A, J.: Interferometric measurement of refraction indices of helium and neon in ultra violet, C. R. Acad. Sci. B Phys., 271, p. 835, 1970.
Adel, A. and Slipher, V. M.: The Constitution of the Atmospheres of the Giant Planets, Phys. Rev., 46, 902–906, https://doi.org/10.1103/PhysRev.46.902, 1934.
Alms, G. R., Burnham, A. K., and Flygare, W. H.: Measurement of the dispersion in polarizability anisotropies, J. Chem. Phys., 63, 3321–3326, https://doi.org/10.1063/1.431821, 1975.
Baidar, S., Oetjen, H., Coburn, S., Dix, B., Ortega, I., Sinreich, R., and Volkamer, R.: The CU Airborne MAX-DOAS instrument: vertical profiling of aerosol extinction and trace gases, Atmos. Meas. Tech., 6, 719–739, https://doi.org/10.5194/amt-6-719-2013, 2013.
Bates, D. R. and Hays, P. B.: Atmospheric nitrous oxide, Plan. Space Sci., 15, 189–197, https://doi.org/10.1016/0032-0633(67)90074-8, 1967.
Bates, R. D.: Rayleigh scattering by air, Planet Space Sci., 32, 785–790, https://doi.org/10.1016/0032-0633(84)90102-8, 1984;
Bideau-Mehu, A., Guern, Y., Abjean, R., and Johannin-Gilles, A.: Interferometric determination of the refractive index of carbon dioxide in the ultraviolet region, Opt. Commun., 9, 432–434, https://doi.org/10.1016/0030-4018(73)90289-7, 1973.
Bluvshtein, N., Flores, J. M., Segev, L., and Rudich, Y.: A new approach for retrieving the UV–vis optical properties of ambient aerosols, Atmos. Meas. Tech., 9, 3477–3490, https://doi.org/10.5194/amt-9-3477-2016, 2016.
Bluvshtein, N., Lin, P., Flores, J. M., Segev, L., Mazar, Y., Tas, E., Snider, G., Weagle, C., Brown, S. S., Laskin, A., and Rudich, Y.: Broadband optical properties of biomass-burning aerosol and identification of brown carbon chromophores, J. Geophys. Res.-Atmos., 122, 5441–5456, https://doi.org/10.1002/2016JD026230, 2017.
Cuthbertson, C. and Cuthbertson, M.: On the refraction and dispersion of carbon dioxide, carbon monoxide, and methane, P. R. Soc. Lond. A, 97, 152–159, https://doi.org/10.1098/rspa.1920.0020, 1920.
Cuthbertson, C. and Cuthbertson, M.: The refraction and dispersion of neon and helium, P. R. Soc. Lond. A, 135, 40–47, https://doi.org/10.1098/rspa.1932.0019, 1932.
Drouin, B. J., Benner, D. C., Brown, L. R., Cich, M. J., Crawford, T. J., Devi, V. M., Guillaume, A., Hodges, J. T., Mlawer, E. J., Robichaud, D. J., Oyafuso, F., Payne, V. H., Sung, K., Wishnow, E. H., and Yu, S.: Multispectrum analysis of the oxygen A-band, J. Quant. Spectrosc. Ra., 186, 118–138, https://doi.org/10.1016/j.jqsrt.2016.03.037, 2017.
Fink, U., Benner, D. C., and Dick, K. A.: Band model analysis of laboratory methane absorption spectra from 4500 to 10 500 Å, J. Quant. Spectrosc. Ra., 18, 447–457, https://doi.org/10.1016/0022-4073(77)90077-2, 1977.
Fuchs, H., Dube, W. P., Lerner, B. M., Wagner, N. L., Williams, E. J., and Brown, S. S.: A Sensitive and Versatile Detector for Atmospheric NO2 and NOx Based on Blue Diode Laser Cavity Ring-Down Spectroscopy, Environ. Sci. Technol., 43, 7831–7836, https://doi.org/10.1021/es902067h, 2009.
Giver, L. P.: Intensity measurements of the CH4 bands in the region 4350 Å to 10,600 Å, J. Quant. Spectrosc. Ra., 19, 311–322, https://doi.org/10.1016/0022-4073(78)90064-X, 1978.
Gordon, I. E., Rothman, L. S., Hill, C., Kochanov, R. V., Tan, Y., Bernath, P. F., Birk, M., Boudon, V., Campargue, A., Chance, K. V., Drouin, B. J., Flaud, J. M., Gamache, R. R., Hodges, J. T., Jacquemart, D., Perevalov, V. I., Perrin, A., Shine, K. P., Smith, M. A. H., Tennyson, J., Toon, G. C., Tran, H., Tyuterev, V. G., Barbe, A., Császár, A. G., Devi, V. M., Furtenbacher, T., Harrison, J. J., Hartmann, J. M., Jolly, A., Johnson, T. J., Karman, T., Kleiner, I., Kyuberis, A. A., Loos, J., Lyulin, O. M., Massie, S. T., Mikhailenko, S. N., Moazzen-Ahmadi, N., Müller, H. S. P., Naumenko, O. V., Nikitin, A. V., Polyansky, O. L., Rey, M., Rotger, M., Sharpe, S. W., Sung, K., Starikova, E., Tashkun, S. A., Auwera, J. V., Wagner, G., Wilzewski, J., Wcisło, P., Yu, S., and Zak, E. J.: The HITRAN2016 molecular spectroscopic database, J. Quant. Spectrosc. Ra., 203, 3–69, https://doi.org/10.1016/j.jqsrt.2017.06.038, 2017.
Greenblatt, G. D., Orlando, J. J., Burkholder, J. B., and Ravishankara, A. R.: Absorption measurements of oxygen between 330 and 1140 nm, J. Geophys. Res.-Atmos., 95, 18577–18582, https://doi.org/10.1029/JD095iD11p18577, 1990.
He, Q., Bluvshtein, N., Segev, L., Meidan, D., Flores, J. M., Brown, S. S., Brune, W., and Rudich, Y.: Evolution of the Complex Refractive Index of Secondary Organic Aerosols during Atmospheric Aging, Environ. Sci. Technol., 52, 3456–3465, https://doi.org/10.1021/acs.est.7b05742, 2018.
Hermans, C., Vandaele, A. C., Carleer, M., Fally, S., Colin, R., Jenouvrier, A., Coquart, B., and Mérienne, M.-F.: Absorption cross-sections of atmospheric constituents: NO2, O2, and H2O, Environ. Sci. Pollut. Res., 6, 151–158, https://doi.org/10.1007/BF02987620, 1999.
Herron, J. P.: Rayleigh-Scatter Lidar Observations at USU's Atmospheric Lidar Observatory (Logan, UT) – Temperature Climatology, Temperature Comparisons with MSIS, and Noctilucent Clouds, Doctor of Philosophy (PhD), Utah State University, All Graduate Theses and Dissertations, Logan, UT, USA, 2007.
Hohm, U.: Experimental determination of the dispersion in the mean linear dipole polarizability α (ω) of small hydrocarbins and evaluation of Cauchy moments between 325 nm and 633 nm, Mol. Phys., 78, 929–941, https://doi.org/10.1080/00268979300100621, 1993.
Ityaksov, D., Linnartz, H., and Ubachs, W.: Deep-UV Rayleigh scattering of N2, CH4 and SF6, Mol. Phys., 106, 2471–2479, https://doi.org/10.1080/00268970802570334, 2008a.
Ityaksov, D., Linnartz, H., and Ubachs, W.: Deep-UV absorption and Rayleigh scattering of carbon dioxide, Chem. Phys. Lett., 462, 31–34, https://doi.org/10.1016/j.cplett.2008.07.049, 2008b.
Johnston, H. S. and Selwyn, G. S.: New cross sections for the absorption of near ultraviolet radiation by nitrous oxide (N2O), Geophys. Res. Lett., 2, 549–551, https://doi.org/10.1029/GL002i012p00549, 1975.
Jordan, N., Ye, C. Z., Ghosh, S., Washenfelder, R. A., Brown, S. S., and Osthoff, H. D.: A broadband cavity-enhanced spectrometer for atmospheric trace gas measurements and Rayleigh scattering cross sections in the cyan region (470–540 nm), Atmos. Meas. Tech., 12, 1277–1293, https://doi.org/10.5194/amt-12-1277-2019, 2019.
King, L. V. and Eve, A. S.: On the complex anisotropic molecule in relation to the dispersion and scattering of light, P. R. Soc. Lond. A, 104, 333–357, https://doi.org/10.1098/rspa.1923.0113, 1923.
Leonard, P. J.: Refractive indices, Verdet constants, and Polarizabilities of the inert gases, At. Data Nucl. Data Tables, 14, 21–37, https://doi.org/10.1016/s0092-640x(74)80028-8, 1974.
Long, C. A. and Ewing, G. E.: Spectroscopic investigation of van der Waals molecules, I. The infrared and visible spectra of (O2)2, J. Chem. Phys., 58, 4824–4834, https://doi.org/10.1063/1.1679066, 1973.
Min, K. E., Washenfelder, R. A., Dube, W. P., Langford, A. O., Edwards, P. M., Zarzana, K. J., Stutz, J., Lu, K., Rohrer, F., Zhang, Y., and Brown, S. S.: A broadband cavity enhanced absorption spectrometer for aircraft measurements of glyoxal, methylglyoxal, nitrous acid, nitrogen dioxide, and water vapor, Atmos. Meas. Tech., 9, 423–440, https://doi.org/10.5194/amt-9-423-2016, 2016.
Naus, H. and Ubachs, W.: Experimental verification of Rayleigh scattering cross sections, Opt. Lett., 25, 347–349, https://doi.org/10.1364/OL.25.000347, 2000.
Newnham, D. A. and Ballard, J.: Visible absorption cross sections and integrated absorption intensities of molecular oxygen (O2 and O4), J. Geophys. Res.-Atmos., 103, 28801–28815, https://doi.org/10.1029/98JD02799, 1998.
Platt, U. and Stutz, J.: Differential Optical Absorption Spectroscopy, in: Physics of Earth and Space Environments, Springer Berlin Heidelberg, Berlin/Heidelberg, Germany, 2008.
Shardanand, S. and Rao, A. D. P.: Absolute Rayleigh scattering cross sections of gases and freons of stratospheric interest in the visible and ultraviolet regions, NASA Technical Note, Washington, D.C., USA, 1977.
Smith, W. H., Conner, C. P., and Baines, K. H.: Absorption-Coefficients for the 6190 a CH4-Band between 290∘ K and 100∘ K with Application to Uranus Atmosphere, Icarus, 85, 58–64, https://doi.org/10.1016/0019-1035(90)90103-G, 1990.
Sneep, M. and Ubachs, W.: Direct measurement of the Rayleigh scattering cross section in various gases, J. Quant. Spectrosc. Ra., 92, 293–310, https://doi.org/10.1016/j.jqsrt.2004.07.025, 2005.
Spiering, F. R., Kiseleva, M. B., Filippov, N. N., van Kesteren, L., and van der Zande, W. J.: Collision-induced absorption in the O2 B-band region near 670 nm, Phys. Chem. Chem. Phys., 13, 9616–9621, https://doi.org/10.1039/C1CP20403C, 2011.
Strutt, J. W.: XXXIV. On the transmission of light through an atmosphere containing small particles in suspension, and on the origin of the blue of the sky, London, Edinburgh Dublin, Philos. Mag. J. Sci., 47, 375–384, https://doi.org/10.1080/14786449908621276, 1899.
Strutt, R. J.: The light scattered by gases: its polarisation and intensity, P. R. Soc. Lond. A, 95, 155–176, https://doi.org/10.1098/rspa.1918.0057, 1918.
Strutt, R. J.: A re-examination of the light scattered by gases in respect of polarisation, I.-Experiments on the common gases, P. R. Soc. Lond. A, 97, 435–450, https://doi.org/10.1098/rspa.1920.0044, 1920.
Thalman, R. and Volkamer, R.: Temperature dependent absorption cross-sections of O2–O2 collision pairs between 340 and 630 nm and at atmospherically relevant pressure, Phys. Chem. Chem. Phys., 15, 15371–15381, https://doi.org/10.1039/C3CP50968K, 2013.
Thalman, R., Zarzana, K. J., Tolbert, M. A., and Volkamer, R.: Rayleigh scattering cross-section measurements of nitrogen, argon, oxygen and air, J. Quant. Spectrosc. Ra., 147, 171–177, https://doi.org/10.1016/j.jqsrt.2014.05.030, 2014.
Thalman, R., Zarzana, K. J., Tolbert, M. A., and Volkamer, R.: Erratum to “Rayleigh scattering cross-section measurements of nitrogen, argon, oxygen and air” J. Quant. Spectrosc. Radiat. Transf., 147 (2014) 171–177, J. Quant. Spectrosc. Ra., 189, 281–282, https://doi.org/10.1016/j.jqsrt.2016.12.014, 2017.
Tomasi, C., Vitale, V., Petkov, B., Lupi, A., and Cacciari, A.: Improved algorithm for calculations of Rayleigh-scattering optical depth in standard atmospheres, Appl. Opt., 44, 3320–3341, https://doi.org/10.1364/AO.44.003320, 2005.
Vukovic, D., Woolsey, G. A., and Scelsi, G. B.: Refractivities of and at wavelengths of 632.99 and 1300 nm, J. Phys. D, 29, 634–637, https://doi.org/10.1088/0022-3727/29/3/023, 1996.
Washenfelder, R. A., Langford, A. O., Fuchs, H., and Brown, S. S.: Measurement of glyoxal using an incoherent broadband cavity enhanced absorption spectrometer, Atmos. Chem. Phys., 8, 7779–7793, https://doi.org/10.5194/acp-8-7779-2008, 2008.
Washenfelder, R. A., Flores, J. M., Brock, C. A., Brown, S. S., and Rudich, Y.: Broadband measurements of aerosol extinction in the ultraviolet spectral region, Atmos. Meas. Tech., 6, 861–877, https://doi.org/10.5194/amt-6-861-2013, 2013.
Washenfelder, R. A., Attwood, A. R., Flores, J. M., Zarzana, K. J., Rudich, Y., and Brown, S. S.: Broadband cavity-enhanced absorption spectroscopy in the ultraviolet spectral region for measurements of nitrogen dioxide and formaldehyde, Atmos. Meas. Tech., 9, 41–52, https://doi.org/10.5194/amt-9-41-2016, 2016.
Watson, H. E. and Ramaswamy, K. L.: The refractive index dispersion and polarization of gases, P. R. Soc. Lond. Ser. A, 156, 144–157, https://doi.org/10.1098/rspa.1936.0140, 1936.
Wilmouth, D. M. and Sayres, D. S.: Rayleigh scattering cross sections of argon, carbon dioxide, sulfur hexafluoride, and methane in the UV-A region using Broadband Cavity Enhanced Spectroscopy, J. Quant. Spectrosc. Ra., 234, 32–39, https://doi.org/10.1016/j.jqsrt.2019.05.031, 2019.
Wilmouth, D. M. and Sayres, D. S.: Determination of Rayleigh scattering cross sections and indices of refraction for Ar, CO2, SF6, and CH4 using BBCES in the ultraviolet, J. Quant. Spectrosc. Ra., 255, 107224, https://doi.org/10.1016/j.jqsrt.2020.107224, 2020.