the Creative Commons Attribution 4.0 License.
the Creative Commons Attribution 4.0 License.
 | 01 Oct 2021
Assessing the potential efficacy of marine cloud brightening for cooling Earth using a simple heuristic model
A simple heuristic model is described to assess the potential for increasing solar reflection by augmenting the aerosol population below marine low clouds, which nominally leads to increased cloud droplet concentration and albedo. The model estimates the collective impact of many point source particle sprayers, each of which generates a plume of injected particles that affects clouds over a limited area. A look-up table derived from simulations of an explicit aerosol activation scheme is used to derive cloud droplet concentration as a function of the sub-cloud aerosol size distribution and updraft speed, and a modified version of Twomey's formulation is used to estimate radiative forcing. Plume overlap is accounted for using a Poisson distribution, assuming idealized elongated cuboid plumes that have a length driven by aerosol lifetime and wind speed, a width consistent with satellite observations of ship track broadening, and a depth equal to an assumed boundary layer depth. The model is found to perform favorably against estimates of brightening from large eddy simulation studies that explicitly model cloud responses to aerosol injections over a range of conditions. Although the heuristic model does not account for cloud condensate or coverage adjustments to aerosol, in most realistic ambient remote marine conditions these tend to augment the Twomey effect in the large eddy simulations, with the result being a modest underprediction of brightening in the heuristic model.
The heuristic model is used to evaluate the potential for global radiative forcing from marine cloud brightening as a function of the quantity, size, and lifetime of salt particles injected per sprayer and the number of sprayers deployed. Radiative forcing is sensitive to both the background aerosol size distribution in the marine boundary layer into which particles are injected and the assumed updraft speed. Given representative values from the literature, radiative forcing sufficient to offset a doubling of carbon dioxide is possible but would require spraying 50 % or more of the ocean area. This is likely to require at least 104 sprayers to avoid major losses of particles due to near-sprayer coagulation. The optimal dry diameter of injected particles, for a given salt mass injection rate, is 30–60 nm. A major consequence is that the total salt emission rate (50–70 Tg yr−1) required to offset is a factor of five lower than the emissions rates required to generate significant forcing in previous studies with climate models, which have mostly assumed dry diameters for injected particles in excess of 200 nm. With the lower required emissions, the salt mass loading in the marine boundary layer for is dominated by natural salt aerosol, with injected particles only contributing ∼ 10 %. When using particle sizes optimized for cloud brightening, the aerosol direct radiative forcing is shown to make a minimal contribution to the overall radiative forcing.
- Article
(6584 KB) - Full-text XML
- BibTeX
- EndNote


Marine low clouds reflect solar radiation and cool the Earth as a result (Hartmann and Short, 1980; Ramanathan et al., 1989). The solar radiation reflected by marine low clouds (albedo) increases with the amount of liquid water they contain and as the size of cloud droplets decreases (Stephens, 1978). Twomey (1974, 1977) showed that, for a fixed liquid water path (LWP), cloud albedo increases with the concentration of cloud droplets (Nd). Thus anthropogenic aerosol pollution increases cloud albedo and cools climate. A total of 4 decades of subsequent research has established the “Twomey effect” as being the largest contributor to the overall cooling impact of aerosols on climate (Zelinka et al., 2014; Bellouin et al., 2020).
In recent decades, evidence showing cloud macrophysical adjustments to aerosol increases has mounted. Albrecht (1989) suggested that reduced droplet sizes would lead to suppressed collision–coalescence, greater retention of water, and an augmentation of the Twomey effect. Modeling and observations both show precipitation suppression by aerosol in warm clouds (Ackerman et al., 2004; Sorooshian et al., 2010; Terai et al., 2015), and yet observations of ship tracks (Coakley and Walsh, 2002; Toll et al., 2019), pollution plumes (Toll et al., 2019; Trofimov et al., 2020), and large-scale shipping lanes (Diamond et al., 2020) reveal LWP reductions in the mean. Modeling has shown that aerosols can cause both positive and negative LWP adjustments (Ackerman et al., 2004; Wood, 2007), with the sign of the change dependent on meteorological and aerosol conditions. Reduced LWP stems from increased cloud-top entrainment of dry free-tropospheric air due to smaller cloud droplets and/or turbulent invigoration of the boundary layer caused by suppressed precipitation (Wang et al., 2003; Ackerman et al., 2004; Bretherton et al., 2007; Wood, 2007). A recent paper by Glassmeier et al. (2021) illustrates that the sign of LWP adjustments depends not only on the meteorological conditions but also on the number of aerosol particles, which cause positive adjustments when the aerosol number is small, and precipitation suppression increases the condensate retention. Negative adjustments are found when the aerosol number is large, due to the aforementioned entrainment drying. Studies using shipping and land-based pollution sources suggest that mean LWP decreases may offset the Twomey response to a degree that ranges from 3 % (Trofimov et al., 2020) to perhaps 20 % (Toll et al., 2019; Diamond et al., 2020). LWP adjustments in low clouds are poorly handled in large-scale models (Malavelle et al., 2017), which almost universally show LWP increases in simulations of anthropogenic aerosol impacts (Lohmann and Feichter, 2005; Isaksen et al., 2009; Bellouin et al., 2020). Global models also tend to show cloud cover increases in response to aerosol, but these appear to be small compared with the Twomey responses and LWP adjustments (Zelinka et al., 2014). Cloud cover adjustments are difficult to constrain using observations (e.g., Gryspeerdt et al., 2016; Possner et al., 2018).
The high sensitivity of cloud albedo to aerosol increases led Latham (1990) to speculate that cloud albedo could potentially be increased deliberately by augmenting the number of aerosol particles ingested into them. This is commonly known as marine cloud brightening (MCB), and it has been an increasing focus of research as a potential climate intervention strategy for over a decade (e.g., Latham et al., 2008, 2012; Jones et al., 2009; Rasch et al., 2009; Alterskjær et al., 2012; National Research Council, 2015; Ahlm et al., 2017; Stjern et al., 2018). MCB involves spraying small solution drops containing sea salt into the marine boundary layer (MBL), increasing the concentration of cloud condensation nuclei. This ideally results in a higher concentration of cloud droplets and more reflective clouds. Any large-scale deployment of MCB would involve many point source injections from seagoing vessels distributed over the ocean (Salter et al., 2008). Essentially, such a deployment can be thought of as a deliberate augmentation of the natural experiment currently being conducted by the fleet of commercial ships (∼ 60 000) that are currently emitting aerosol and precursor gases over the world's oceans (Eyring et al., 2010). Thus, we can draw on the study of ship tracks and shipping lanes to provide insights regarding the potential efficacy of MCB.
A ship track is a brightened curvilinear feature in a marine cloud deck caused by the emission of particles and their precursors from an individual ship (Conover, 1966). These tracks provide dramatic evidence that cloud reflectivity can increase when particles are released into the MBL. However, ship tracks are insufficient for estimating the large-scale radiative forcing possible. The global increase in reflected shortwave radiation from discernible ship tracks has been estimated from satellite observations to be ∼ 4–6 × 10⁻⁴ W m−2 (Schreier et al., 2007), which is 2–3 orders of magnitude smaller than climate model estimates of the total effect of shipping emissions of aerosol and aerosol precursors, which range from 0.06–0.6 W m−2 (Capaldo et al., 1999; Lauer et al., 2007; Eyring et al., 2010; Peters et al., 2012; Partanen et al., 2013). The most easily discernible ship tracks form in very shallow MBLs (Durkee et al., 2000). These type I ship tracks tend to occur in MBLs with particularly low concentrations of background aerosol (Hindman et al., 1994; Ackerman et al., 1995) in which turbulent mixing is weak because drizzle depletes liquid water and precludes strong cloud top radiative cooling. A more common type of ship track (type II) tends to be more readily discernible using near-infrared rather than visible satellite imagery (Coakley et al., 1987), highlighting the smaller droplets in the track. The MBLs in which type II ship tracks form tend to be somewhat deeper, more well mixed, and strongly driven by cloud-top cooling. Ship track albedo perturbations in these cases tend to be weaker than in type I tracks. Large eddy simulations of deep stratocumulus-topped MBLs indicate that albedo can be increased substantially by injected aerosol emissions, even when a clear track is not discernible (Possner et al., 2018). In Durkee et al. (2000), no ship tracks were detected in MBLs deeper than 800 m, but Possner et al. (2020) show that over 80 % of all stratocumulus-topped MBLs over the oceans are deeper than 800 m, where surface emissions can increase cloud albedo, but tracks may not be easy to detect.
An alternative to observational studies of individual ship tracks is to quantify the mean radiative forcing over a heavily trafficked area to assess the aggregate effect of shipping. Diamond et al. (2020) was able to discern a corridor of enhanced mean Nd in clouds above a shipping lane that traverses the SE Atlantic subtropical stratocumulus deck. In this corridor, an increase in reflected diurnal–seasonal mean shortwave radiation of 2 W m−2 was observed associated with an increase in Nd of ∼ 5 cm−3, which is consistent with expectations from the Twomey effect. Cloud adjustments were found to be relatively small, with reduced cloud LWP in the shipping lane offsetting ∼ 20 % of the Twomey effect and a small cloud fraction increase augmenting the Twomey effect by ∼ 10 %. Although the radiative forcing would need to be somewhat stronger for MCB to offset a significant fraction of the radiative forcing from increased greenhouse gases, the lack of major canceling cloud adjustments points to the potential for regional albedo enhancement using MCB. In this case, the aerosols (from ship emissions) were inadvertently brightening clouds; aerosols of a size and concentration that target intentional cloud brightening would very likely have a larger impact on cloud albedo and radiative forcing.
Climate models demonstrate the potential for producing a globally significant radiative forcing from MCB. These studies fall into the following two broad categories: (i) studies in which Nd (or droplet effective radius re) in some fraction of the marine low cloud population is altered to some specified value to increase cloud albedo, and (ii) studies that achieve cloud albedo changes by increasing the surface aerosol source and treating the aerosol activation process, leading to changes in Nd. The latter studies involve a more complete treatment of the chain of causality that links aerosol emissions to brightening, while the former studies can be carried out without explicit representation of the aerosol–cloud interaction processes.
Seeded regions in studies with specified Nd or re perturbations have increased Nd to different levels, i.e., 375 cm−3 in Jones et al. (2009), 1000 cm−3 in Rasch et al. (2009) and Baughman et al. (2012), and both 375 and 1000 cm−3 in Latham et al. (2008). In Bala et al. (2011), the cloud effective radius is instead decreased from 14 to 11.5 µm for all marine liquid clouds, which is approximately equivalent to increasing Nd by 80 %. Stjern et al. (2018) increase Nd by 50 % in all marine low clouds. Because cloud albedo increases scale with the ratio of perturbed (seeded) to unperturbed Nd (Sect. 2.1), these changes represent a wide diversity in terms of how much a seeded cloud is brightened in each study. Very different fractions of the available ocean are seeded in different studies, ranging from 1.0 %, 1.6 %, 2.1 %, and 4.7 % of the ocean area in Jones et al. (2009), 9 % in Baughman et al. (2012), 20 %, 30 %, 40 %, and 70 % in Rasch et al. (2009), and the entire ocean in Bala et al. (2011). Jones et al. (2009) achieved a forcing of −1 W m−2 despite only perturbing 4.7 % of the ocean surface, but perturbed regions had extensive low clouds. Rasch et al. (2009) went further and identified the albedo susceptibility (change in albedo upon increasing Nd to 1000 cm−3) for each grid box on a seasonal basis. The most susceptible 20 %, 30 %, 40 %, and 70 % of the boxes were then used as seeding regions. The wide range of different areas seeded and in the strength of the Nd perturbation where the seeding occurs makes it difficult to intercompare the effectiveness of the seeding across studies.
Climate model studies in which an aerosol surface source is added as a proxy for deliberate spraying have also been shown to produce globally significant radiative forcing (Ahlm et al., 2017), with values in some studies more than offsetting those from doubling CO2 (e.g., Alterskjær et al., 2012). Such studies introduce several additional degrees of freedom into the experimental design. A comprehensive representation of the aerosol life cycle is needed, as is an aerosol activation parameterization to predict Nd as a function of the aerosol size distribution in the MBL. As studies with aerosol activation schemes and/or parcel models have shown, Nd is sensitive primarily to the concentration of aerosol in the accumulation mode (particles with dry diameters around 50–200 nm) but is also sensitive to updraft speed and to small concentrations of coarse-mode aerosol, which reduce the peak supersaturation in an updraft and lower the fraction of smaller aerosols activated (Ghan et al., 1998; McFiggans et al., 2006).
An additional aerosol surface source from an MCB sprayer can, in principle, be tailored to consist of particles of a specific diameter. Connolly et al. (2014) explored the optimal particle size given the energy constraints on particle production, which primarily scales with the mass of salt injected, and found that sodium chloride particles with a modal diameter in the range 30–90 nm are optimal. Climate model studies, to date, have typically introduced injected particles with modal diameters that are several times as large as this (Alterskjær et al., 2012; Ahlm et al., 2017), which implies that these models likely require much larger salt mass emissions than may be required if smaller particles are injected. Only Partanen et al. (2012) have tested the sensitivity to injecting particles with a modal dry diameter of 100 nm and found the same brightening as in a base case with 200 nm diameter particles but with ∼ 5 times less mass injected. Consideration of total salt mass injected is important not only from the perspective of the energy required to produce particles but also because major increases in sodium chloride aerosol mass could potentially alter natural chemical cycles in the MBL (Horowitz et al., 2020).
This study describes a simple heuristic model that predicts the global radiative forcing from MCB using physical principles to determine the collective impact of plumes from many point source sprayers distributed over the oceans on Nd and cloud albedo. The model is designed to facilitate easy experimentation on the factors controlling MCB, including details of the unperturbed aerosol size distribution, the number concentration, size and residence time of injected particles, the number of sprayers, and the fraction of the ocean over which sprayers are deployed. Section 2 describes the heuristic model in detail, and Sect. 3 tests the model using comparisons with high-resolution, small-domain large eddy simulation models into which point source injections are introduced. Section 4 uses the heuristic model to examine factors controlling global radiative forcing from MCB and critically examines some assumptions made in previous climate model studies. Finally, Sect. 5 discusses implications of the results and suggests pathways for future study, and Sect. 6 provides conclusions.
2.1 Radiative forcing from aerosol-cloud interactions
Central to the model is Twomey's formulation for the susceptibility of cloud albedo αc to an increase in Nd assuming no cloud adjustments (Twomey, 1977), viz.
Integrating Eq. (1) gives an expression for the increase in cloud albedo Δαc caused by an increase in Nd, as follows:
where is the ratio of the droplet concentration in seeded vs. unperturbed clouds. It is worth noting that Eq. (2) is rather insensitive to αc, such that Δαc varies by only ∼ 10 % as αc changes from 0.3–0.7. Thus, the key sensitivity in Eq. (2) is to the value of rN.
To estimate the top-of-atmosphere (TOA) albedo for the same cloud requires a conversion to account for the absorption and scattering of solar radiation by the atmosphere above cloud. We follow the approach by Diamond et al. (2020; Eq. 17) and multiply the cloud albedo change by an atmospheric correction factor ϕatm as follows:
where TFT and αFT are the transmissivity and albedo of the free troposphere only. The more variable of these two parameters is TFT, which depends upon free-tropospheric water vapor. Here, we assume a value of TFT=0.8, consistent with values over dry regions of the Tropics and midlatitudes from the CERES-SYN product (Doelling et al., 2013). Free-tropospheric albedo is less variable, and we here assume a value of αFT=0.06 (also consistent with CERES-SYN). For typical cloud albedos αc in the range 0.25 to 0.75, ϕatm ranges from 0.66 to 0.70; for simplicity, we herein assume ϕatm=0.70. We estimate TOA indirect radiative forcing as , where F⊙ is the mean incoming solar irradiance averaged over day and night. Here, we assume a value of F⊙ equal to the global mean solar irradiance W m−2. Geographical variation in insolation is not considered.
2.2 Regions where sprayers operate
Marine cloud brightening, by definition, would only be deployed over the fraction of Earth covered by ocean. We further restrict this area to minimize the likelihood that plumes will intersect land areas. This is done by summing up the ocean area of those 10×10∘ latitude/longitude boxes that contain less than 10 % land area. The choice of boxes with 10∘ on a side is made because plumes are of the order of 1000 km in length (see Sect. 2.4). This limits the eligible fraction of Earth's surface for spraying, focean, to 0.54. We then assume that sprayers are confined to operate within some specified fraction fspray () of this eligible area. If fspray is chosen to be less than unity, it is assumed that sprayed regions will be those with the highest climatological unobstructed low cloud cover. To determine the mean low cloud cover for the sprayed subregions flow, climatological monthly mean low cloud fractions are determined using MODIS Terra and Aqua level 3 liquid cloud fractions (years 2006–2010) for 10×10∘ boxes. As fspray decreases, the fraction of the ocean sprayed has a greater coverage of low clouds. If fspray is chosen to be very small, spraying would occur only in regions with the highest climatological monthly mean cloud cover (∼ 68 %). The MODIS data are well fitted with the following empirically determined expression:
2.3 Expression for global radiative forcing associated with MCB
Cloud condensate and coverage adjustments to injected aerosol are assumed to be zero, so MCB indirect radiative forcing arises only from the Twomey effect. In sprayed areas without low clouds, injected particles can exert a direct radiative forcing. The direct radiative forcing from injected aerosol in cloud-free regions between clouds is quantitatively estimated (see Sect. 2.7), but increasing direct radiative forcing is not a goal of the injection design. The global mean shortwave radiative forcing ΔF from MCB aerosol–cloud interactions is written as follows:
To give a “back of the envelope” assessment of the potential for MCB, we take focean=0.54, assume fspray=1, and use Eq. (4) to set flow=0.33. If cloud albedo is increased by Δαc=0.01, then ΔF = −0.41 W m−2. Alternatively, it would take a cloud albedo increase of Δαc=0.09 to produce a radiative forcing of −3.7 W m−2, which would balance the longwave radiative forcing from doubling CO2. Figure 1 shows ΔF as a function of rN for different values of fspray and αc. Using Eq. (2), if we assume αc=0.56 (Bender et al., 2011, finds TOA cloud albedos of 0.35 to 0.42 for overcast stratocumulus in the major subtropical stratocumulus, Sc, decks, which must be corrected to cloud albedos with Eq. 3), then the ratio of seeded to unseeded cloud droplet concentration ( would need to be 3.0 to produce a forcing with a magnitude equal to . Assuming the entire ocean area could be seeded (focean=0.7; fspray=1), we find a value of rN=2.4, which is in the range of Nd increases over the ocean (2.10–2.85) that were needed to counter CO2 doubling in an analysis of three variants on a climate model (Slingo, 1990). If only half of the eligible ocean area is seeded (i.e., fspray=0.5), then rN would need to be at least 7 to counter CO2 doubling (Fig. 1). Stjern et al. (2018) analyzed an ensemble of different climate models in which Nd for all marine low clouds is increased by 50 % (rN=1.5) as a proxy for MCB and found an ensemble mean W m−2. Based on Fig. 1, and scaling the forcing to include the entire ocean, Eq. (5) produces a very similar forcing W m−2. This is also consistent with the models in Stjern et al. (2018) having small cloud adjustments overall so that the overwhelming bulk of the forcing is from the Twomey effect.
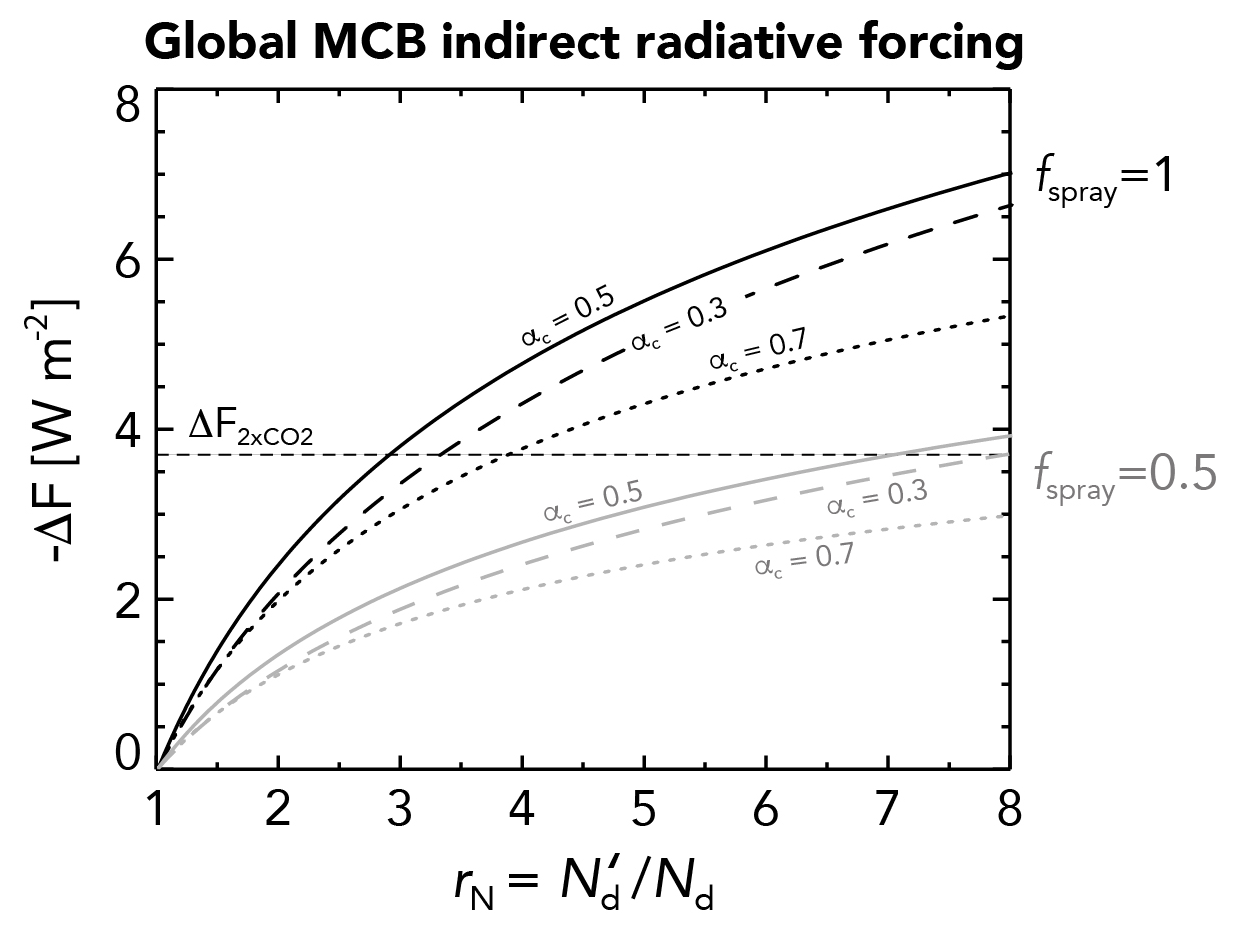
Figure 1Global radiative forcing from marine cloud brightening (MCB) ΔF as a function of the ratio of the perturbed to unperturbed (background) cloud droplet concentration . Curves are shown for the case where sprayers are deployed over all eligible ocean regions (fspray=1; black lines) and where sprayers are deployed over only 50 % of these areas (fspray=0.5; gray lines) for unperturbed cloud albedos αc ranging from 0.3–0.7. The fraction of the Earth's surface area eligible for seeding is focean=0.54, and the atmospheric correction factor is ϕatm=0.7.
2.4 Aerosol delivery and plume/track configuration
Any practical MCB deployment would be unable to produce uniform increases in Nd because seeding is necessarily discrete in nature rather than being distributed evenly. It is impractical to deploy sprayers at every point over the ocean; in practice, any deployment would likely consist of an array of floating particle injection systems distributed throughout regions where low clouds occur. To extend the heuristic model to account for this, assumptions are made about the spatiotemporal extent of the region affected by a single sprayer. Sprayers are assumed to be stationary so that air masses pass over them at the rate of the near-surface wind speed U0, which is taken as 7 m s−1, i.e., the mean value over oceans (Archer and Jacobson, 2005). Each sprayer injects sodium chloride particles continuously with a salt mass rate . Injected particles have a lognormal size distribution with geometric mean dry diameter (GMD) Ds and geometric standard deviation (GSD) S. The total number of particles sprayed per second from each sprayer is then as follows:
where ρs is the density of solid sodium chloride (2160 kg m−3). The volume into which particles are emitted increases with time as the plume expands to fill the depth of the MBL and widens horizontally. The timescale for vertical dispersion through the depth of the MBL is 10–20 min (Chosson et al., 2008), as evidenced by the fact that, in ship tracks, brightened clouds become evident typically 10–20 km downwind of the responsible ship. As satellite data readily show, ship tracks from commercial shipping are narrower close to the emitting ship and broaden downstream (Durkee et al., 2000). After rapid vertical dispersion through the MBL, dilution primarily occurs through lateral diffusion. Entrainment of lower-concentration free-tropospheric air also dilutes the plume but at a slower rate. The lateral track broadening rate is highly variable but is parameterized using the Heffter (1965) broadening rate K=1.85 km h−1 (see Fig. 7 in Durkee et al., 2000). This rate is broadly consistent with large eddy simulations of horizontal tracer spread in the cloudy MBL (Wang et al., 2011).
It has been proposed that a spray system to inject salt particles could derive the salt from sea water droplets (Salter et al., 2008; Cooper et al., 2014). Sea water is substantially more dilute than the equilibrium size of solution droplets at the surface (see, e.g., Hoffman and Feingold, 2021), and so there is some concern that cooling from the evaporation of water from equilibrating droplets may hinder or prevent the vertical mixing of injected particles. Reducing any negative buoyancy is an engineering challenge that may be addressed by increasing the turbulent mixing of the particle-laden plume with surrounding air and/or adding some thermal energy to the particle plume. This issue is beyond the scope of this study, and we herein assume the injected particles mix readily throughout the depth of the MBL. We also note that the additional water vapor introduced into the lower MBL from the evaporating sea water is negligible compared with the natural surface evaporative water flux and, thus, will have no impact on the MBL moisture budget.
Injected particles in the model have a characteristic residence e-folding timescale τres. This residence time incorporates several processes influencing particle lifetime, including removal by coalescence scavenging, scavenging by clouds and aerosol particles, and dry deposition. The value of τres varies with meteorological conditions, cloud, and precipitation properties and is also expected to be somewhat size dependent. In regions of marine stratocumulus values of τres of 2–3 d are consistent with estimates of precipitation scavenging (Wood et al., 2012), and τres=2 d is used as standard.
After a time t, the particles injected at time t=0 have moved a distance x=U0t. Considering both dilution and removal processes, given a plume width W(t)=Kt and assuming dispersion through the entire MBL depth h, the injected particle concentration Ns(t) at time t is as follows:
The wind speed and residence time define a length scale (Lt=U0τres) that effectively determines the streamwise length scale over which the particle concentration is affected by spraying. The area over the Earth's surface perturbed by each sprayer A is then determined by multiplying this length scale by a characteristic track width Wt, i.e., . A linearly widening plume/track will expand to a width Kτres over the lifetime of the particles.
To estimate radiative forcing, the injected particle concentration Ns(t) is added to an assumed background aerosol over the entire track area and over the depth h of the MBL. Aerosol activation to form cloud droplets is carried out for the background aerosol and for the perturbed (background + injected) aerosol using an assumed updraft speed. Section 2.6 provides details of the activation scheme and the aerosol physical and chemical properties. The ratio of the perturbed to background cloud Nd from the activation scheme is used in the calculation of radiative forcing (Eqs. 2 and 5).
Figure 2 shows results from the model for a laterally spreading track, along with injected particle concentration and additional reflected shortwave from cloud brightening as a function of time/distance downstream of a point source sprayer. The heuristic model assumes an elongated cuboid plume (fixed width, height, and length), with the plume length Lt=U0τres and plume width taken to be the width of the linearly expanding plume at time , i.e., . The (time-independent) number concentration Ns1 of injected aerosol particles in the cuboid plume is as follows:
It is relatively straightforward to show that the overall injected particle concentration integrated over time is the same for the laterally spreading track (Eq. 7) and the cuboid track (Eq. 8). Although the reflected solar energy from the two tracks is not identical (Fig. 2c), the values are found to be close. A heuristic model track reflects slightly less than a spreading track for a given spray rate, with the difference growing as the magnitude of the Nd perturbation increases.
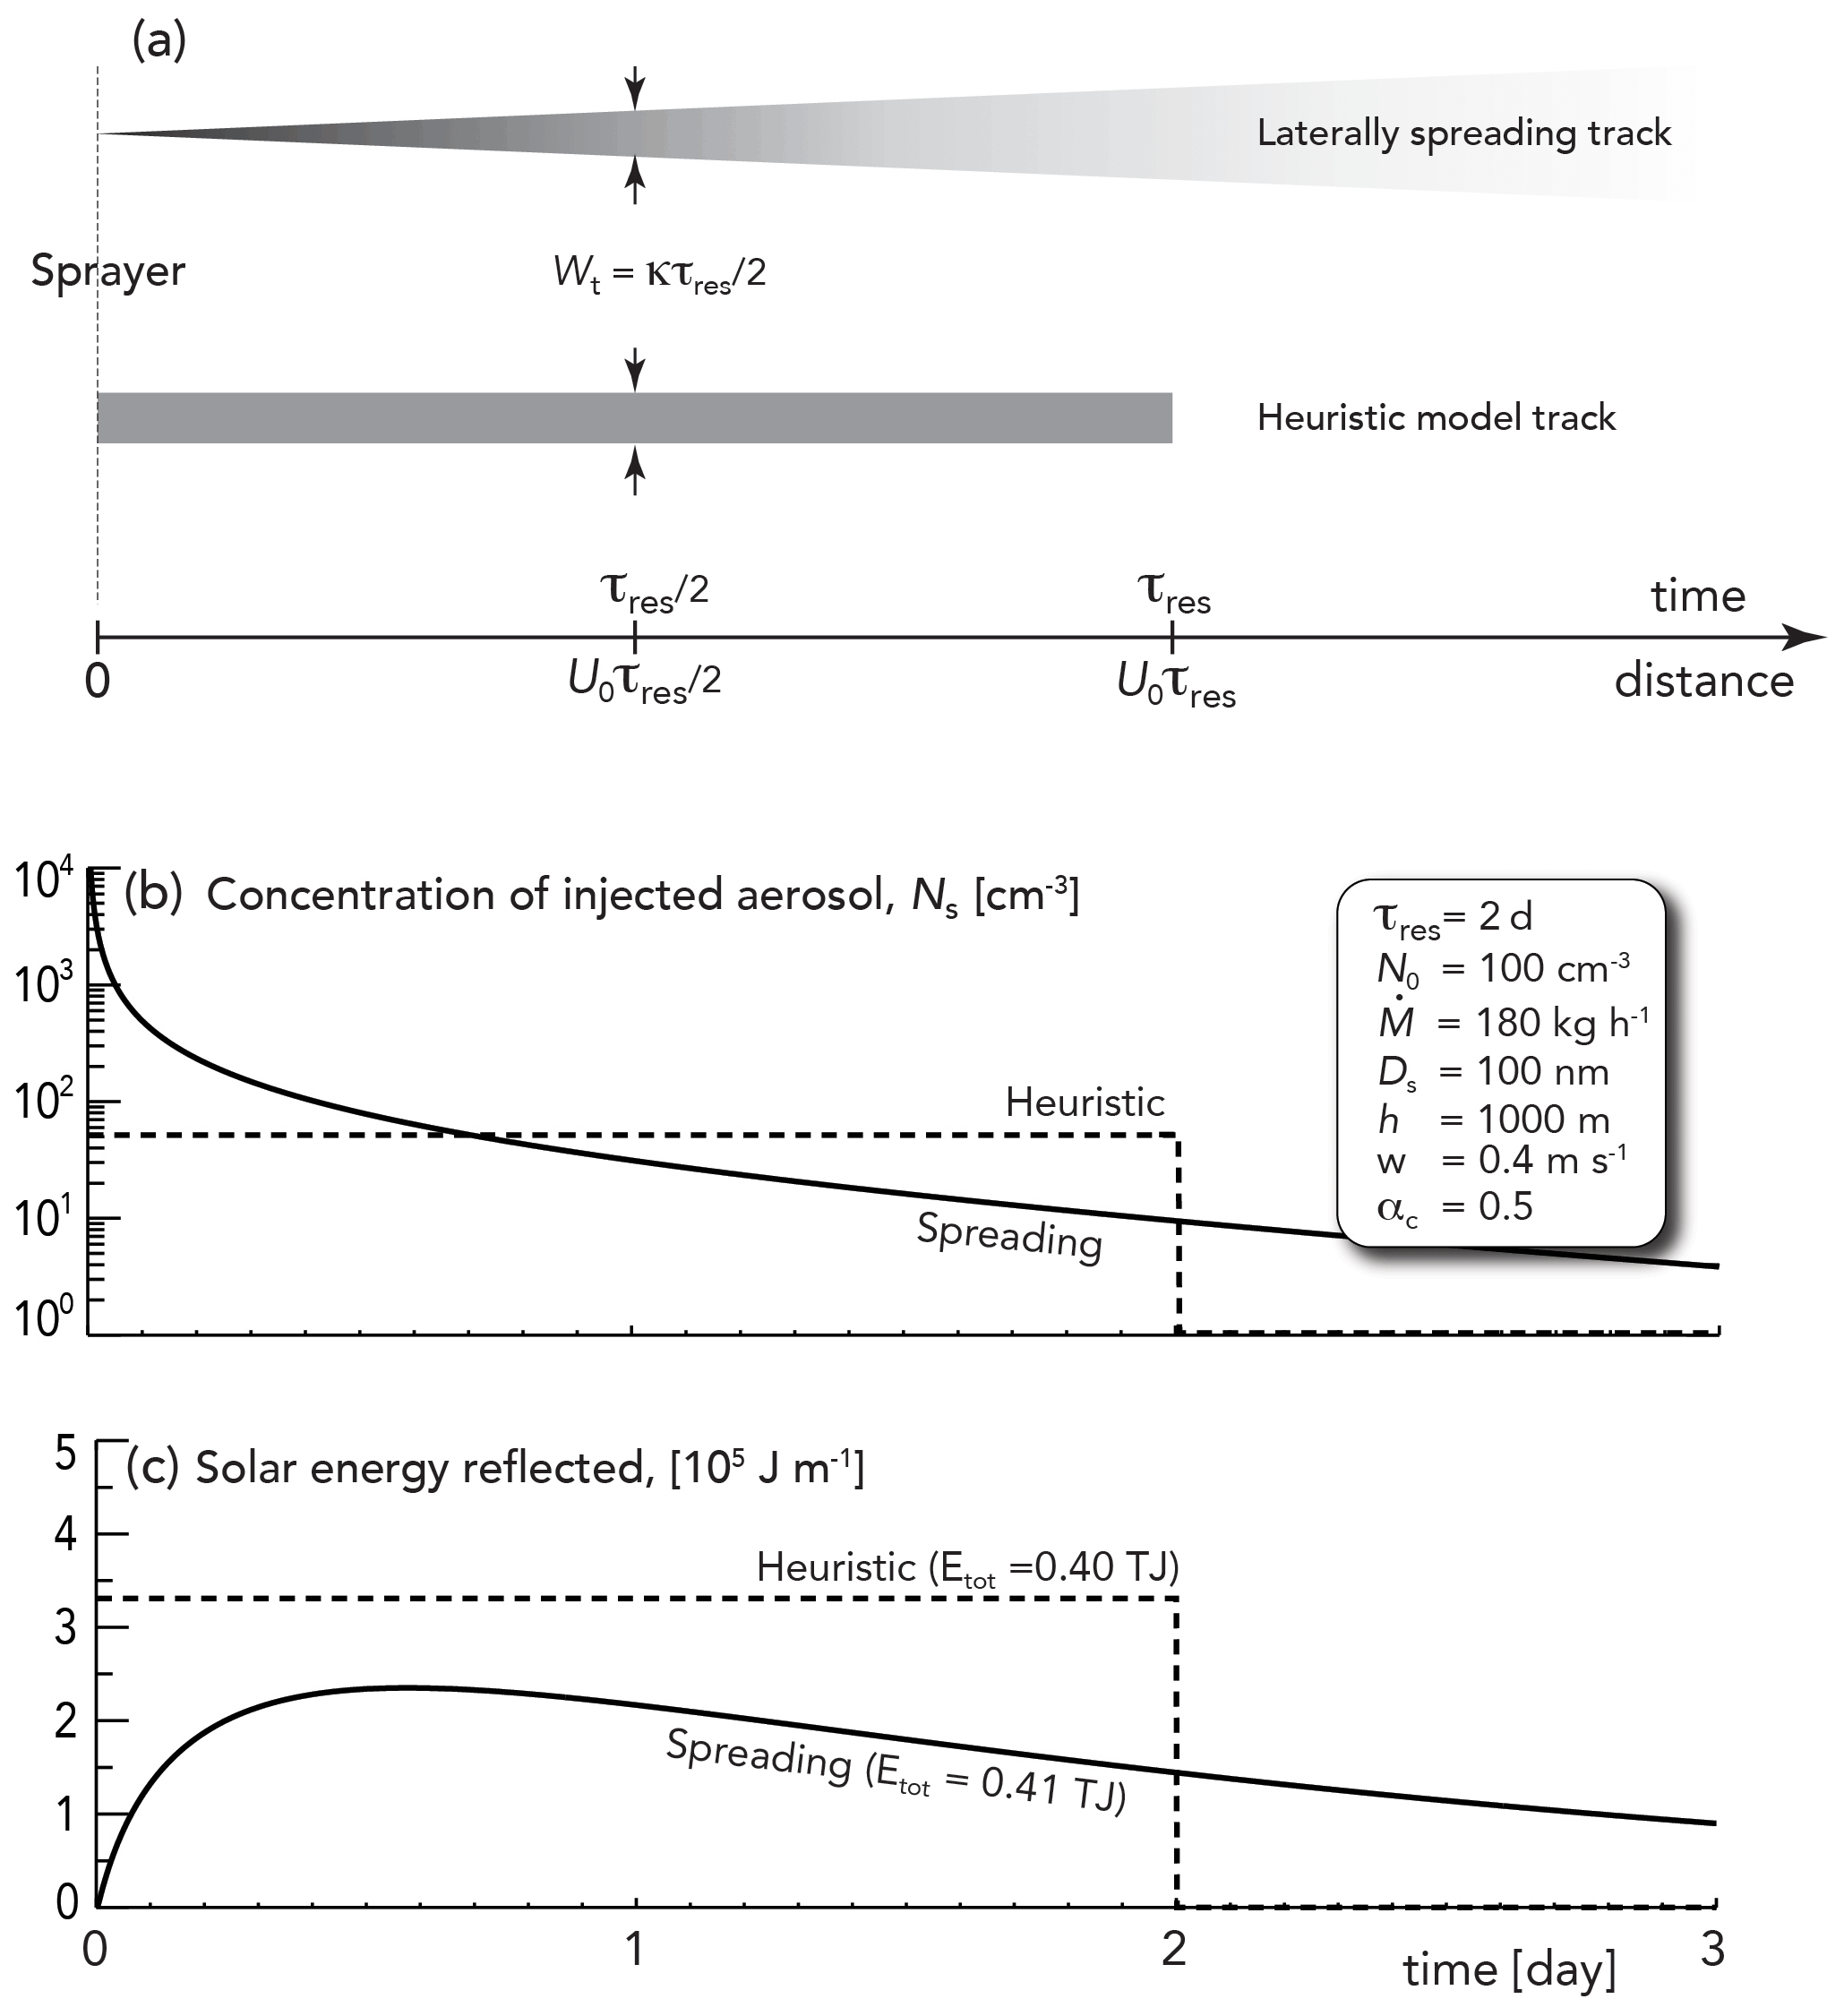
Figure 2(a) Plan view of a realistic laterally spreading plume/track (top), and the track assumed in the heuristic model, as a function of time/distance downstream of the sprayer. The shading qualitatively indicates the injected particle concentration. (b) Injected aerosol concentration as a function of time for the two plume types, given the spray injection information in the box. A residence time τres=2 d and a widening rate K=1.85 km h−1 are assumed, and the model is run out to 10 d to capture the total reflected solar radiation for the spreading plume. (c) Additional reflected solar radiation per meter length of track from aerosol–cloud interactions for the two plume types. The total additional reflected energy Etot from the two plumes is very similar. In this case, approximately 43 % of the energy reflected from the spreading plume occurs for times t>τres.
Experimentation with different spray, background aerosol, and cloud configurations shows that the reflected sunlight for the cuboid track is within 5 % of that for the spreading track for number spray rates s−1, with the cuboid model track being slightly less reflective. As increases, the ratio of the additional energy reflected by the spreading track to that from the cuboid track increases steadily, reaching 1.2 for s−1 and 1.5 for s−1, with the exact value dependent upon the background aerosol. As the magnitude of the aerosol number perturbation increases, an increasing fraction of the energy reflected occurs at times t>τres in the spreading plume. The albedo response in the cuboid track is relatively saturated due to the high aerosol/droplet concentrations (see Fig. 1), so the diluted but widespread aerosol in the spreading plume later on is more efficient at brightening. As we show in the discussion, coagulation losses during the high concentrations near to the sprayer are likely to be large for particle spray rates much greater than ∼ 1016 s−1. The cuboid tracks are, thus, a sufficiently accurate representation of reality for us to use them in the heuristic model, and this simplifies the treatment of overlapping tracks.
2.5 Overlapping tracks
Given the plume dimensions for the heuristic model tracks, we estimate that the number of (nonoverlapping) tracks required to cover the 54 % of the ocean eligible for spraying (∼ 1.98 × 10¹⁴ m2), assuming Wt=44 km, τres=2 d, and U0=7 m s−1 (i.e., Lt≈1200 km; At=5.28 × 10¹⁰ m2) is 5300. If this number of sprayers was to be deployed either randomly or uniformly, then overlapping tracks would be unavoidable because air mass trajectories are not constant in time. Monte Carlo simulations were conducted, placing Nt randomly oriented or aligned rectangular tracks at random over a large domain of area A. The probability p(n) of n tracks overlapping in the domain is well predicted by a Poisson distribution as follows:
where is the mean track density, i.e., the mean number of superimposed tracks (Fig. 3). Although not shown, p(n) is insensitive to both the track aspect ratio () and whether the tracks are aligned with their long sides in one direction or are randomly oriented.
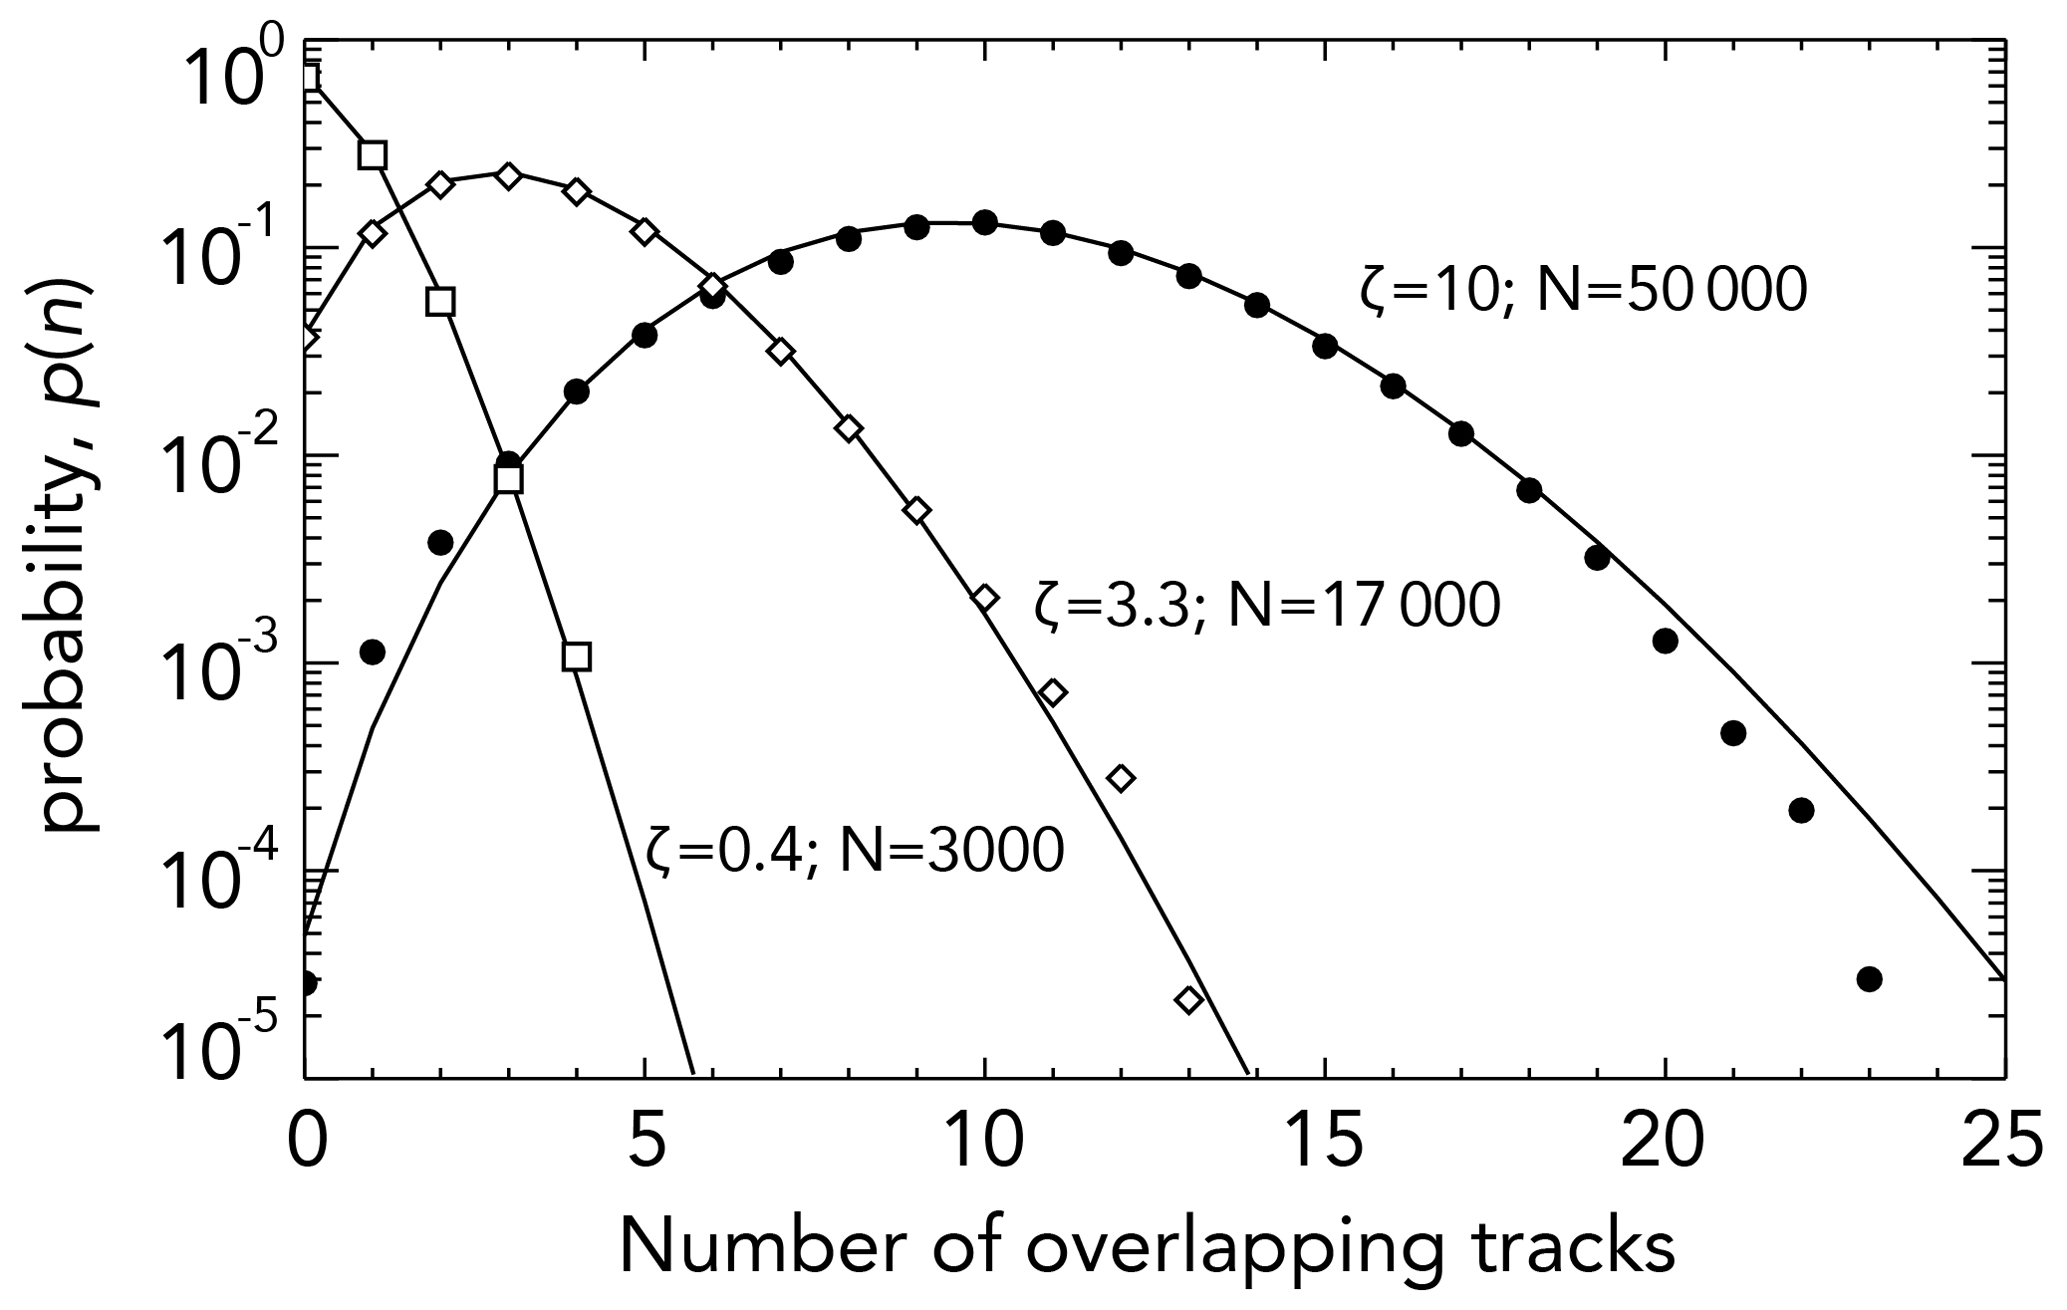
Figure 3Probability density functions p(n) derived from the Monte Carlo simulations of overlapping rectangular tracks for three values of the mean track density ζ (0.4, 3.3, and 10). For the simulations, a domain of size 4000 × 4000 km is modeled, using a 4000 × 4000 array, and tracks of length 1200 km and width 44 km (see Sect. 2.5) are placed randomly in relation to the array, assuming periodic boundary conditions. The long dimension of each track is randomly set to be parallel to the i or j direction of the box. Poisson distributions (Eq. 8) are shown correspondingly, based on the mean track densities, and represent an excellent fit to the data. The track densities ζ=0.4, 3.3, and 10 correspond to a total number of ships, if spraying were to take place over the entire eligible ocean region of ∼ 3000, ∼ 17 000, and ∼ 50 000, respectively.
The use of the Poisson distribution makes it straightforward to account for track overlap in the heuristic model; the injected particle concentration Ns at any given location is an integer multiple n(n≥0) of the single-track value Ns1 from Eq. (8) as follows:
where the probability of n is given by Eq. (9). For low mean track densities ζ, the most likely value of n is zero (Fig. 3), and the ratio of the standard deviation to the mean value of n is high. A Poisson distribution has equal mean and variance, so the relative spatial heterogeneity of Ns, i.e., the ratio of the standard deviation to the mean track density, decreases as . Because of the concave relationship between Δαc and Ns (see, e.g., Carslaw et al., 2013), a more homogeneous distribution of Ns over the seeded area will yield a radiative forcing with a larger magnitude for the same mean value of Ns.
2.6 Aerosol activation and physical and chemical properties
Aerosol activation to form cloud droplets is treated using a five-dimensional look-up table derived from over 6000 numerical Lagrangian parcel model simulations (see the Appendix). In comparing with those, using the Abdul-Razzak and Ghan (2000) quasi-analytical activation scheme (henceforth ARG), we find significant differences that indicate a major underprediction of Nd with the ARG scheme when injected dry particle diameters are smaller than ∼ 200 nm (see the Appendix and also Sect. 4.2), and so we use the look-up table to treat activation in the heuristic model.
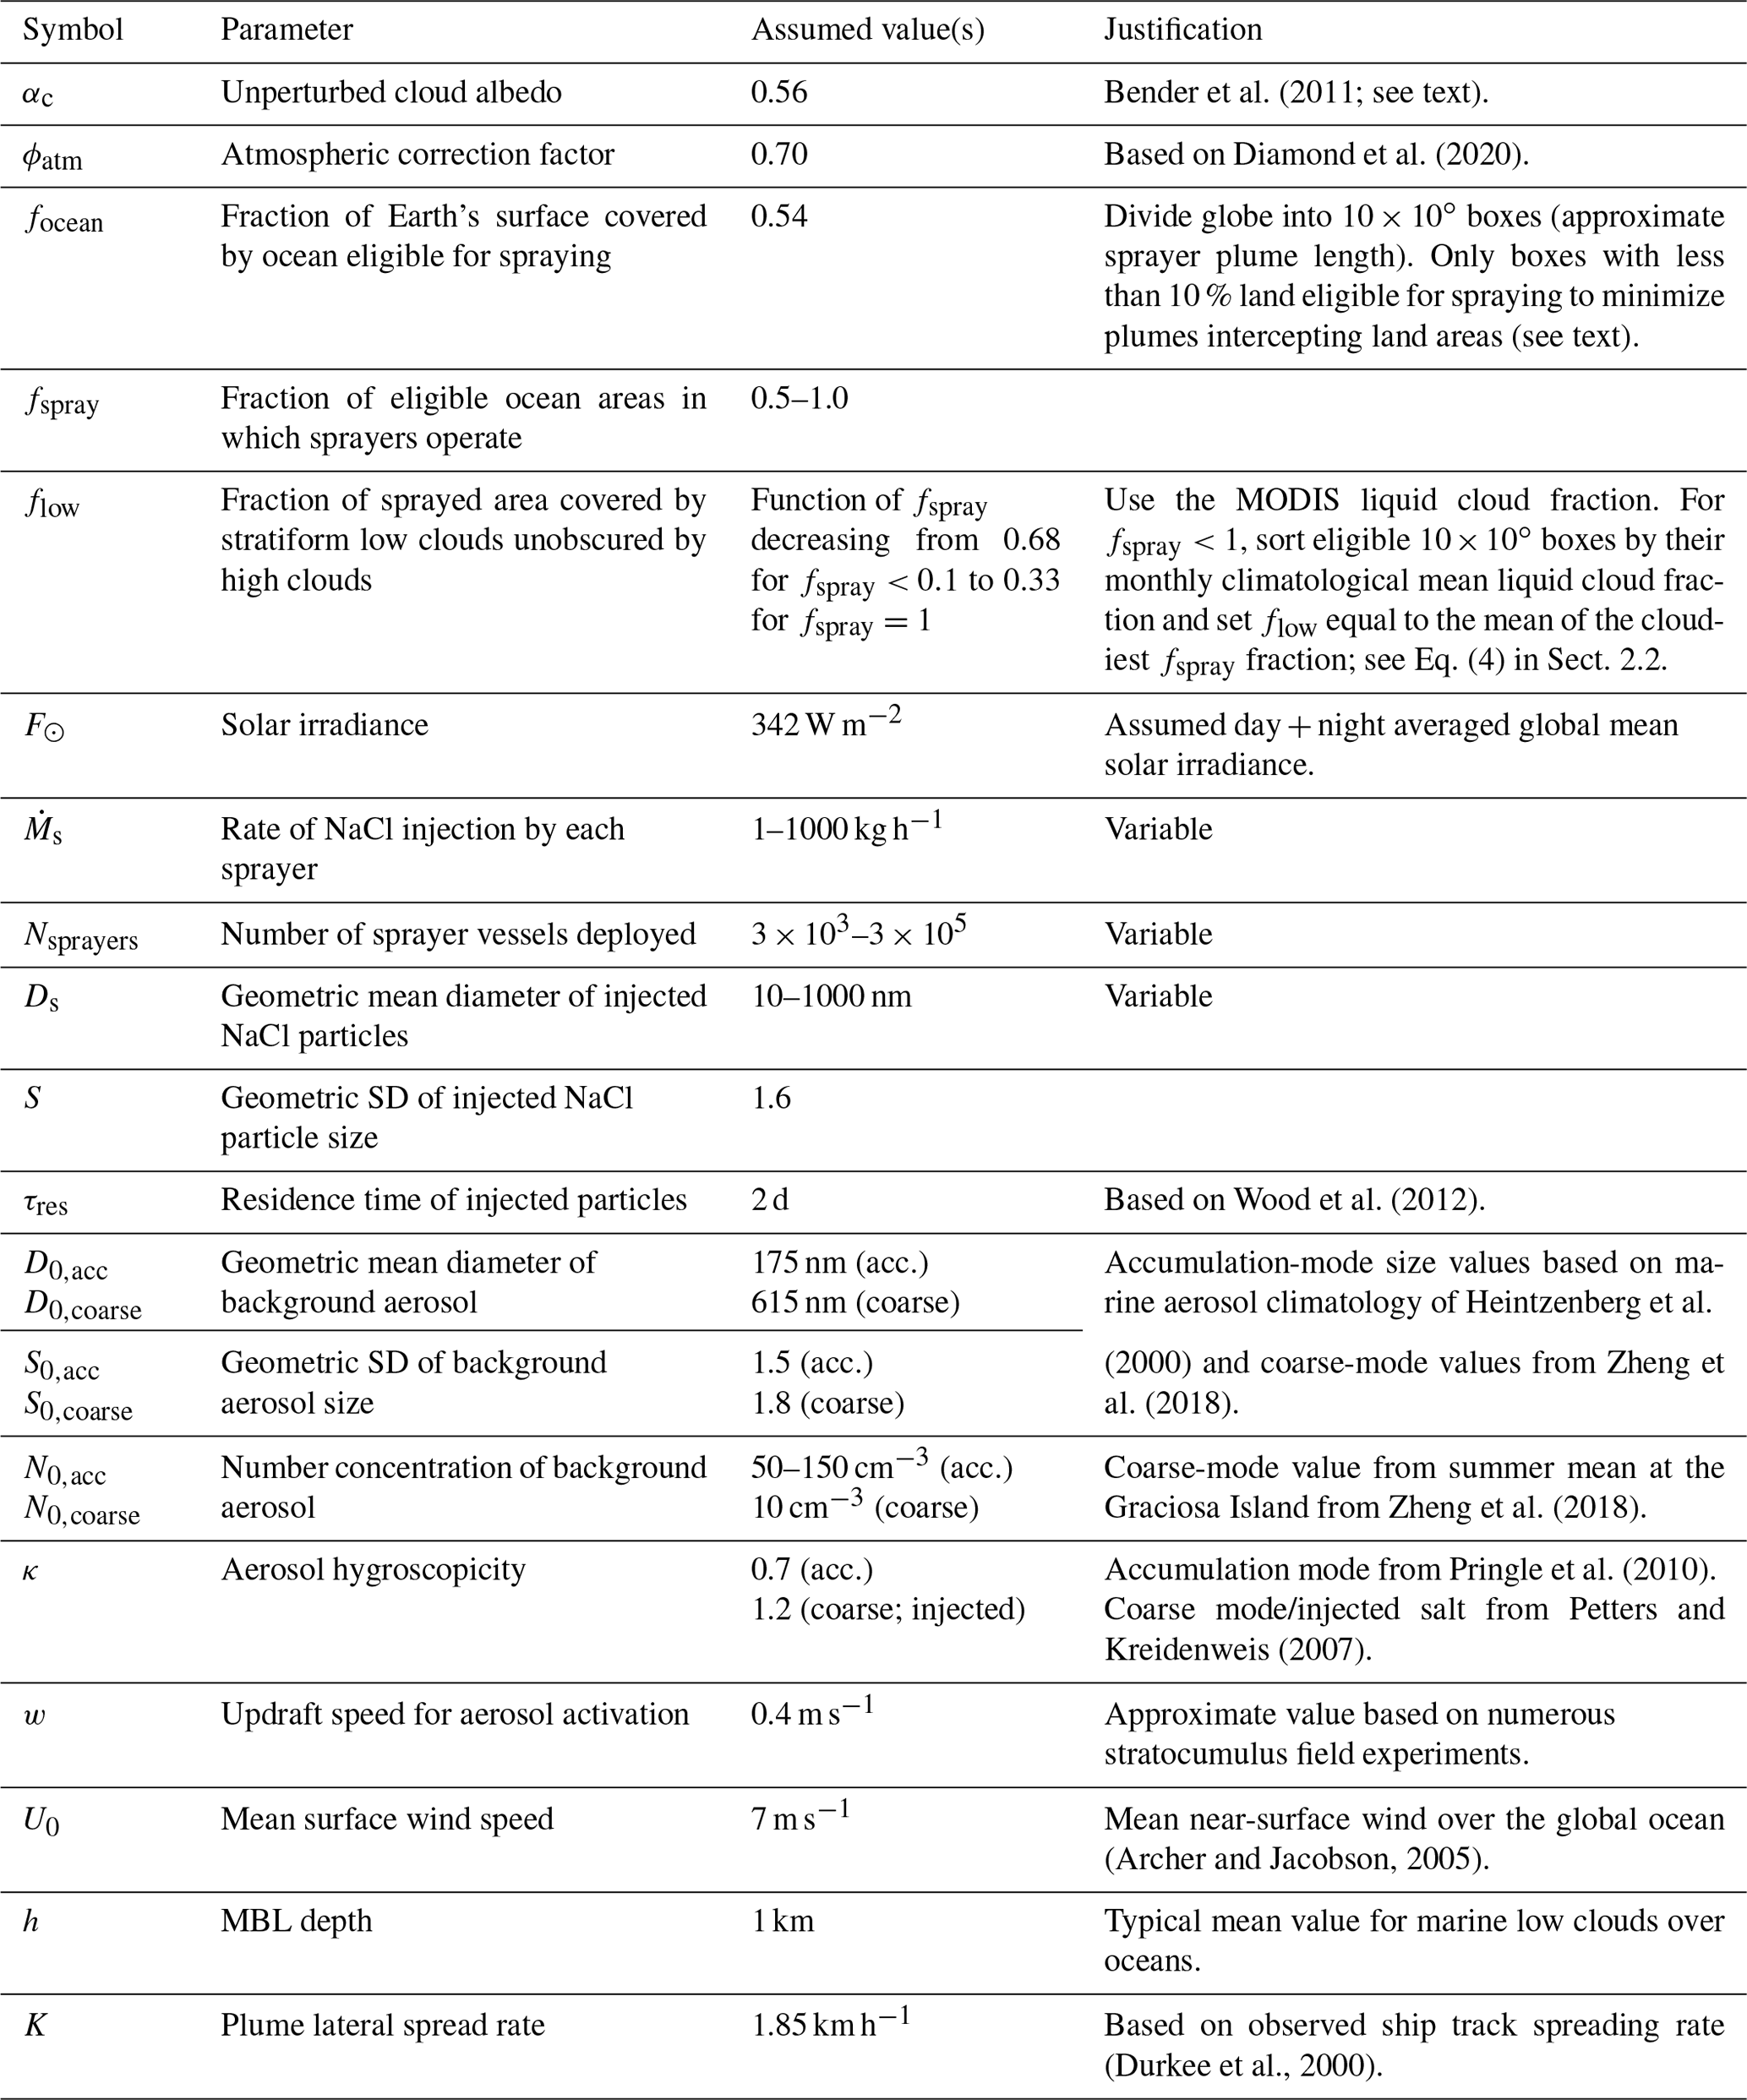
The aerosol size distributions used are the same for each activation approach. The background (unperturbed) aerosol particles are assumed to comprise lognormal accumulation and coarse modes. Accumulation-mode size values ( nm; ) are taken from the synthesis of marine accumulation-mode measurements by Heintzenberg et al. (2000). Measured marine accumulation-mode number concentrations N0,acc vary considerably over the ocean, and the impacts of this on brightening are explored in Sect. 4.2. Although there is significant variability in the composition of marine cloud condensation nuclei (CCN), studies tend to find that the accumulation-mode aerosol in the unpolluted MBL consists of a mixture of sulfate, sea salt, and organic species. Different assessments of the hygroscopicity parameter (κ; from Petters and Kreidenweis, 2007) of CCN in the MBL provide a significant diversity of values, from values as low as 0.45 (Wex et al., 2010) to ∼ 0.7 (Andreae and Rosenfeld 2008). Here, we use the mean marine value of 0.7 from the model study of Pringle et al. (2010) for the unperturbed accumulation mode. The background coarse mode is lognormal, with GMD nm and GSD taken from summertime measurements at Graciosa island in the Azores (Zheng et al., 2018). The presence of the coarse mode suppresses the peak supersaturation in the updraft, increasing the minimum size of the particles that are activated, reducing the activated fraction (Ghan et al., 1998). This is explored further in Sect. 4.2. Injected aerosols are sodium chloride (κ=1.2; Petters and Kreidenweis, 2007), distributed lognormally with GMD Ds and GSD S, where Ds is allowed to vary and S=1.6. Table 1 provides a summary of the assumed aerosol properties used. A recent study suggests that the other inorganic species in sea salt render it slightly less hygroscopic than pure sodium chloride (κ=1.1; Zieger et al., 2017). Testing showed that the results of this study are largely insensitive to small variations in κ.
Table 1Parameters used in the heuristic model and their assumed values. Note: SD – standard deviation; acc. – accumulation.
For most of the analysis presented in this study, a fixed updraft speed of w=0.4 m s−1 is assumed in the activation scheme. This is broadly representative of updrafts in the stratocumulus-topped MBL (Nicholls and Leighton, 1986; Wood, 2005; Bretherton et al., 2010; Zheng et al., 2016). Sensitivity to updraft speed is explored in Sect. 4.3. For simplicity, the temperature and pressure are set to be 280 K and 925 hPa, respectively, but the results are not highly sensitive to these values.
2.7 Aerosol direct radiative forcing
The heuristic model is also used to produce rough estimates of the aerosol direct radiative forcing from the injected aerosol. We assume direct forcing only in clear-sky regions. In an analogous formulation to Eq. (5), we estimate the global mean direct radiative forcing as follows:
where fclear is the clear-sky fraction in the regions where sprayers operate, AODspray is the aerosol optical thickness (550 nm) of injected particles, and E is the clear-sky radiative forcing efficiency. We use W m−2 AOD−1, which is the average over oceans for several models in the AeroCom study of Schulz et al. (2006). In this study, direct effects are only estimated for the case where fspray=1, i.e., sprayers operate in all eligible regions of the oceans, and so fclear=0.32 is taken as the complement of the total cloud cover during the daytime over the global oceans from Hahn and Warren (2007). To estimate AODspray, the injected aerosol lognormal size distribution (accounting for overlapping tracks as discussed in Sect. 2.5) is used to estimate extinction σspray at 550 nm, using the Mie code of Bohren and Huffman (1998). A mean relative humidity in clear-sky MBLs of 80 % is used to set a hygroscopic diameter growth factor for sodium chloride of 2.0 from Tang (1996). The assumed MBL depth h = 1 km (Table 1) is used to determine AODspray=hσspray. Direct forcing estimates are presented in Sect. 4.4.
Several existing studies in the literature have used large eddy simulations (LESs) to explore the impacts of salt aerosol injections on marine low cloud microphysical and macrophysical properties and albedo. In contrast to climate models, LES explicitly resolves the turbulent dynamics responsible for aerosol distribution through the MBL, including ingestion into clouds, in addition to determining cloud macrophysical responses to aerosol resulting from changes in precipitation and mixing with the free troposphere. Although it is not currently possible to run LESs with domain sizes large enough to examine regional and global MCB, their faithful representation of injections into domains on scales of a few tens to a few hundred kilometers can provide important insights into the potential efficacy of MCB.
The heuristic model framework is adapted to account for the limited LESs domain size to test its predictions. This also allows a quantitative intercomparison of the LES results, which is needed because there is a considerable diversity in the domain sizes, spray rates, and particle sizes, as well as in the unperturbed cloud states, boundary layer depths, simulation durations, and in the way in which injections have been introduced into the domains across the different LES studies to date (see Table 2). Each LES experiment consisted of an unperturbed (control) case with no particle injections, and a case with particle injections. A total of 18 different injection simulation experiments are extracted from five studies.
Table 2Large eddy simulation studies included in this study. Information included in this table focused on highlighting diversity in injected particles and domain size.
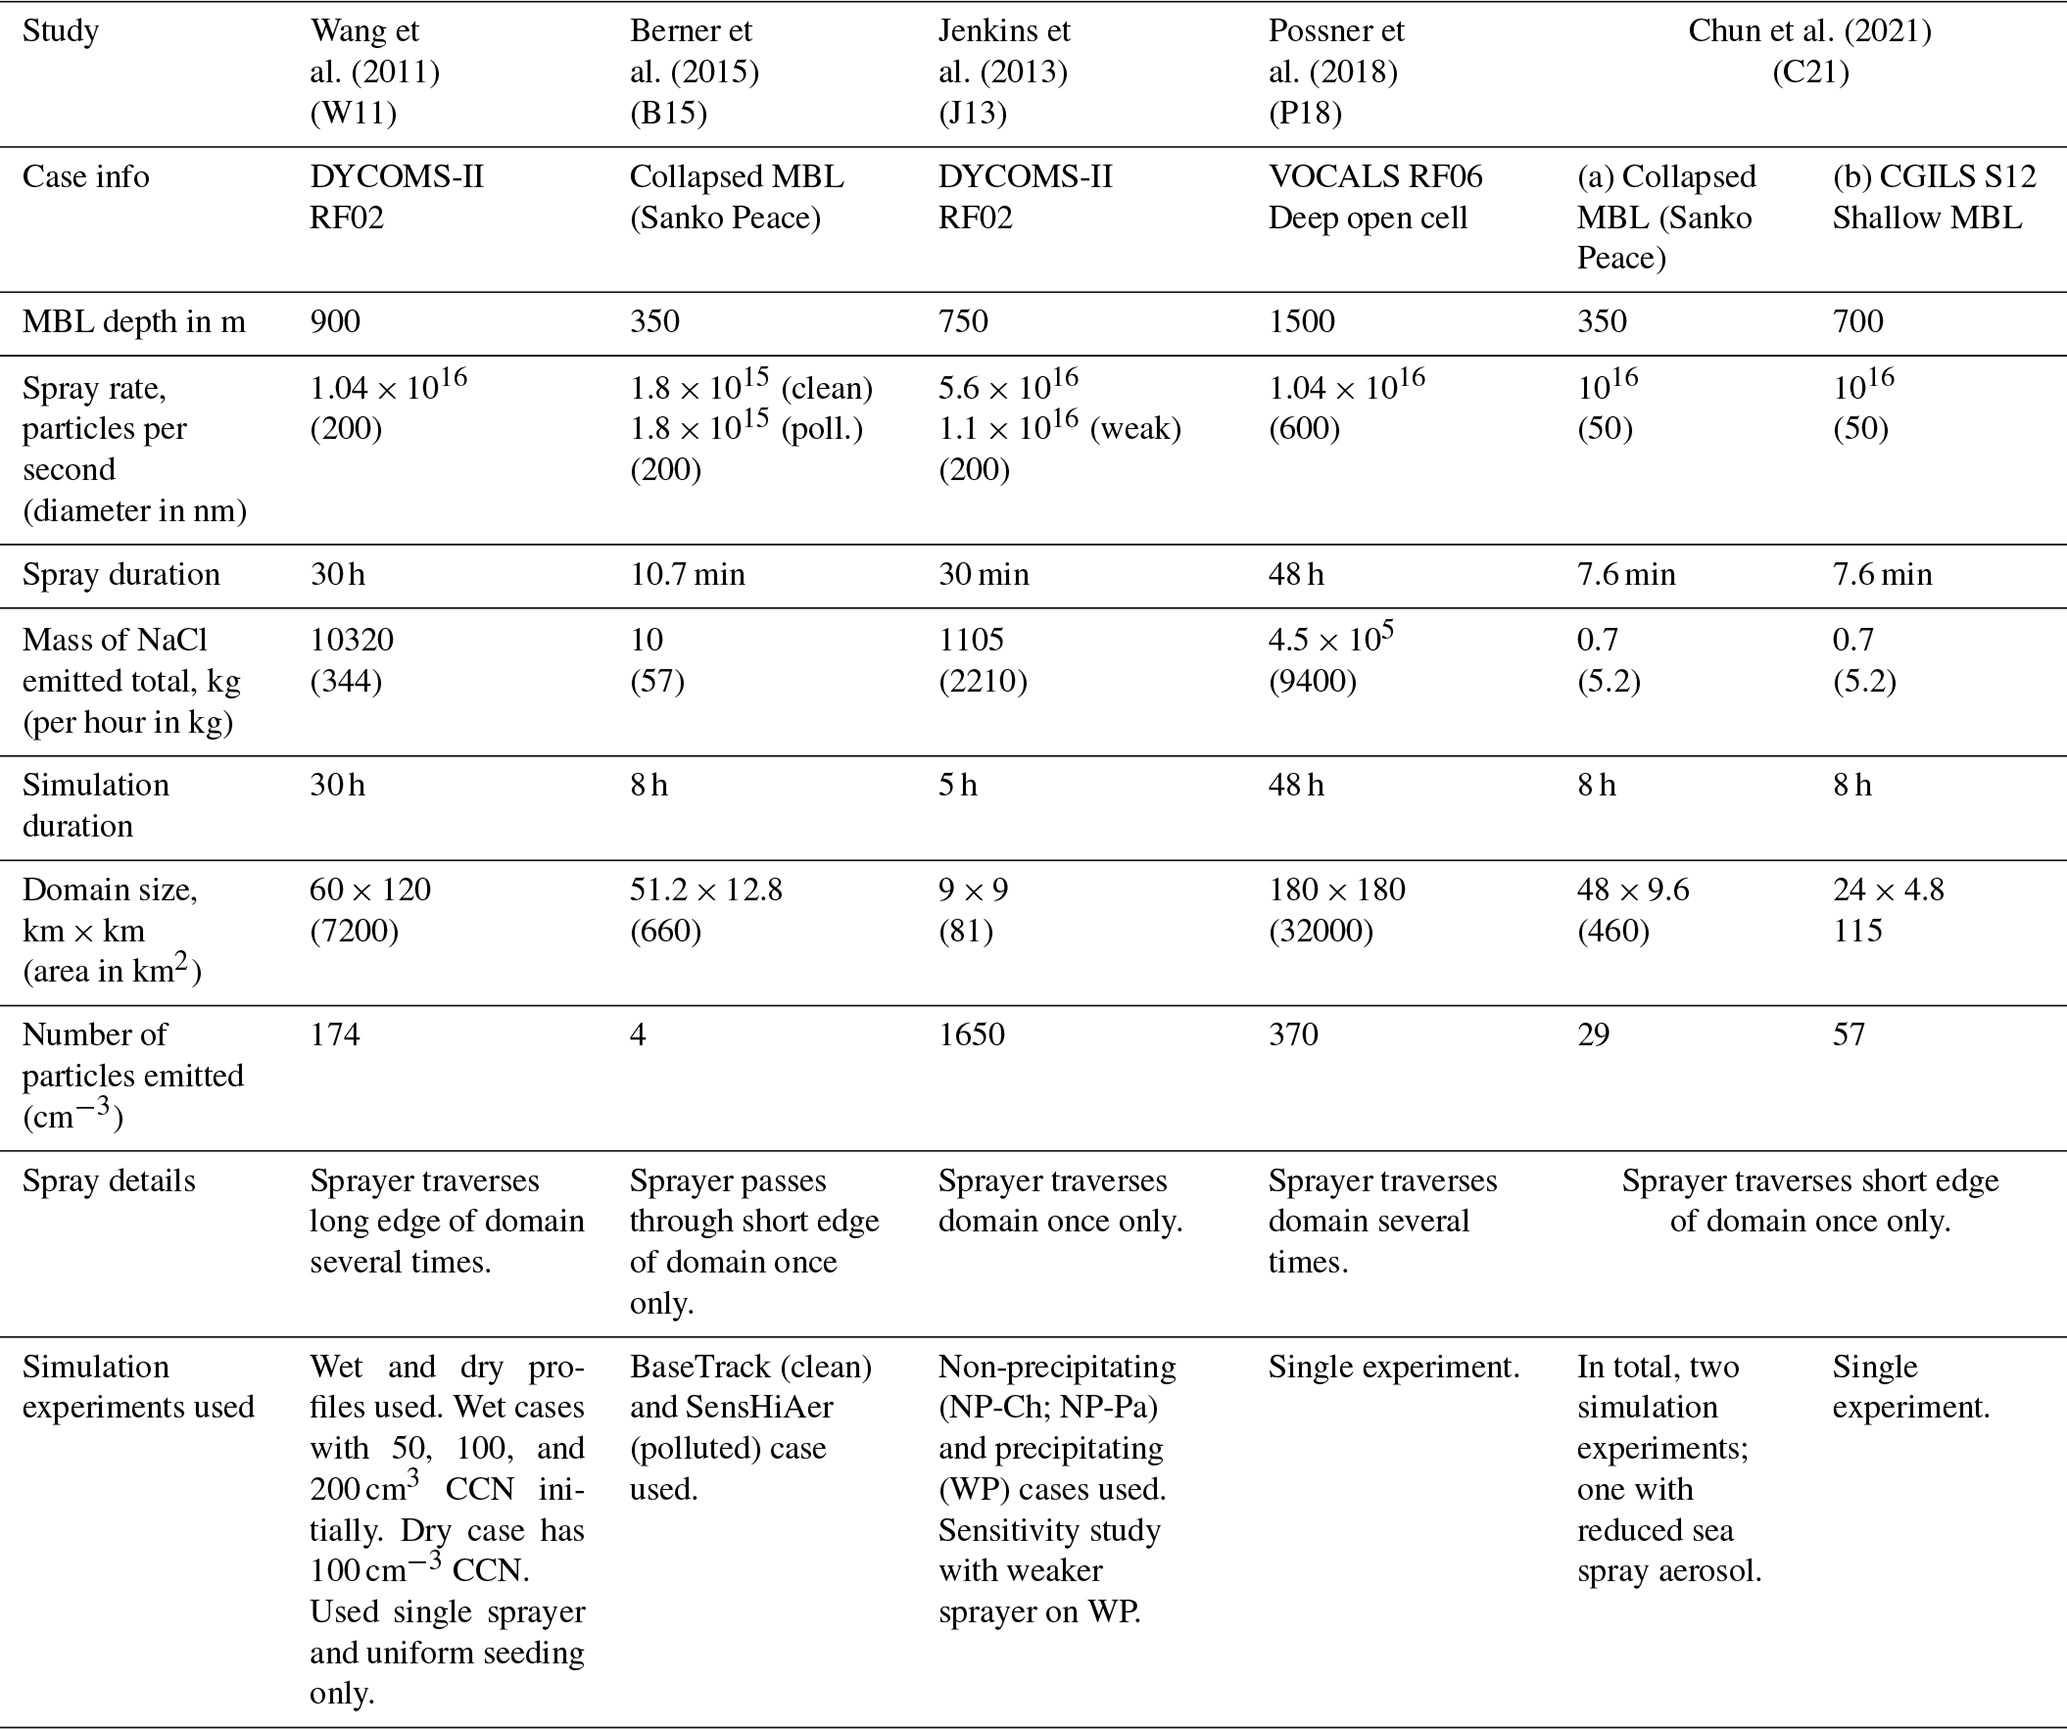
Radiative forcing driven by particle injections is estimated for the LES case studies using albedo changes given in the various papers. Unless otherwise stated, heuristic model parameters are those in Table 1. Diurnal mean insolation is assumed. Where appropriate, cloud albedo changes are corrected to the TOA using a fixed value of ϕatm (Eq. 3; Table 1) consistent with that used in the heuristic model. The heuristic model uses a fixed value for unperturbed cloud albedo (Table 1), but the MBL depth is set to the value for each of the LES cases (Table 2). In several of the cases, the sprayer passes through the model domain multiple times, and in other cases the track does not extend over the entire domain. For the heuristic model predictions, we use the Poisson distribution approach (Sect. 2.5) as follows. The duration of the LES experiment in each case is used to determine the track width using the track spreading rate K used in the heuristic model (Table 1), and the ship speed through the domain is used in place of the wind speed to determine the track length by multiplying by the duration of the simulation. The track area is then computed as the product of the width and length, and this is divided by the LES domain size to obtain a mean track density, which is used to obtain a Poisson distribution of overlapping tracks (Eq. 9). This distribution is used in the heuristic model. In some of the LES experiments, track density is less than unity, but in cases with relatively long durations and/or small domains, it considerably exceeds unity. Wang et al. (2011; henceforth W11) also included a simulation where the same rate is injected uniformly over the model domain as a comparison experiment against a point source sprayer. This is represented in the heuristic model by assuming many (weaker) sprayers operating in the domain.
Unperturbed (control case) aerosol size distributions for the heuristic model comprise an accumulation mode with distribution parameters from Table 1 (which are close to those assumed in the LES studies) and concentrations are adjusted to produce unperturbed Nd values reported in the various studies with a fixed 0.4 m s−1 updraft (i.e., the standard value used in the heuristic model). Jenkins et al. (2013, henceforth J13), used a bin aerosol scheme rather than a modal scheme. Including an additional coarse mode with modal diameter 500 nm, GSD of 1.8, and concentration of 10 cm−3, which we found represents a fairly good match to the size distributions shown in J13, made less than a 10 % difference in the radiative forcing predicted by the heuristic model. No coarse mode is included in the heuristic model for the other cases because none was included in the LESs.
Figure 4 presents results from the comparison of the LESs and the heuristic model. Overall, the radiative forcing in the LESs correlates quite well (r=0.62) with predictions from the heuristic model (Fig. 4a), but the heuristic model underestimates the magnitude of the LES forcing by ∼ 30 % in the median. This underestimation is greatest when the unperturbed value of Nd is low (Fig. 4b). There is little bias for cases with Nd∼50 cm−3, but there is underprediction of ∼ 2 for Nd∼10 cm−3 and an overprediction of brightening for high Nd cases. The sensitivity of the heuristic model brightening bias to unperturbed Nd (Fig. 4b) is not driven by a model failure to represent the Twomey effect, as the heuristic model's ability to predict domain mean perturbed Nd is excellent (r=0.91, Fig. 4c), with only a 25 % overestimate in the median. This would lead to a small (∼ 10 %) overprediction of Twomey forcing magnitude. Instead, the heuristic model underprediction at low Nd occurs because particle injection into very clean MBLs often leads to increases in liquid water path (LWP), cloud cover, or both. In these cases, the Twomey effect is augmented by cloud adjustments that result in stronger brightening, and this is not represented in the heuristic model. The reasons for the overprediction of brightening for high Nd cases is unknown and warrants further attention using more LES studies.
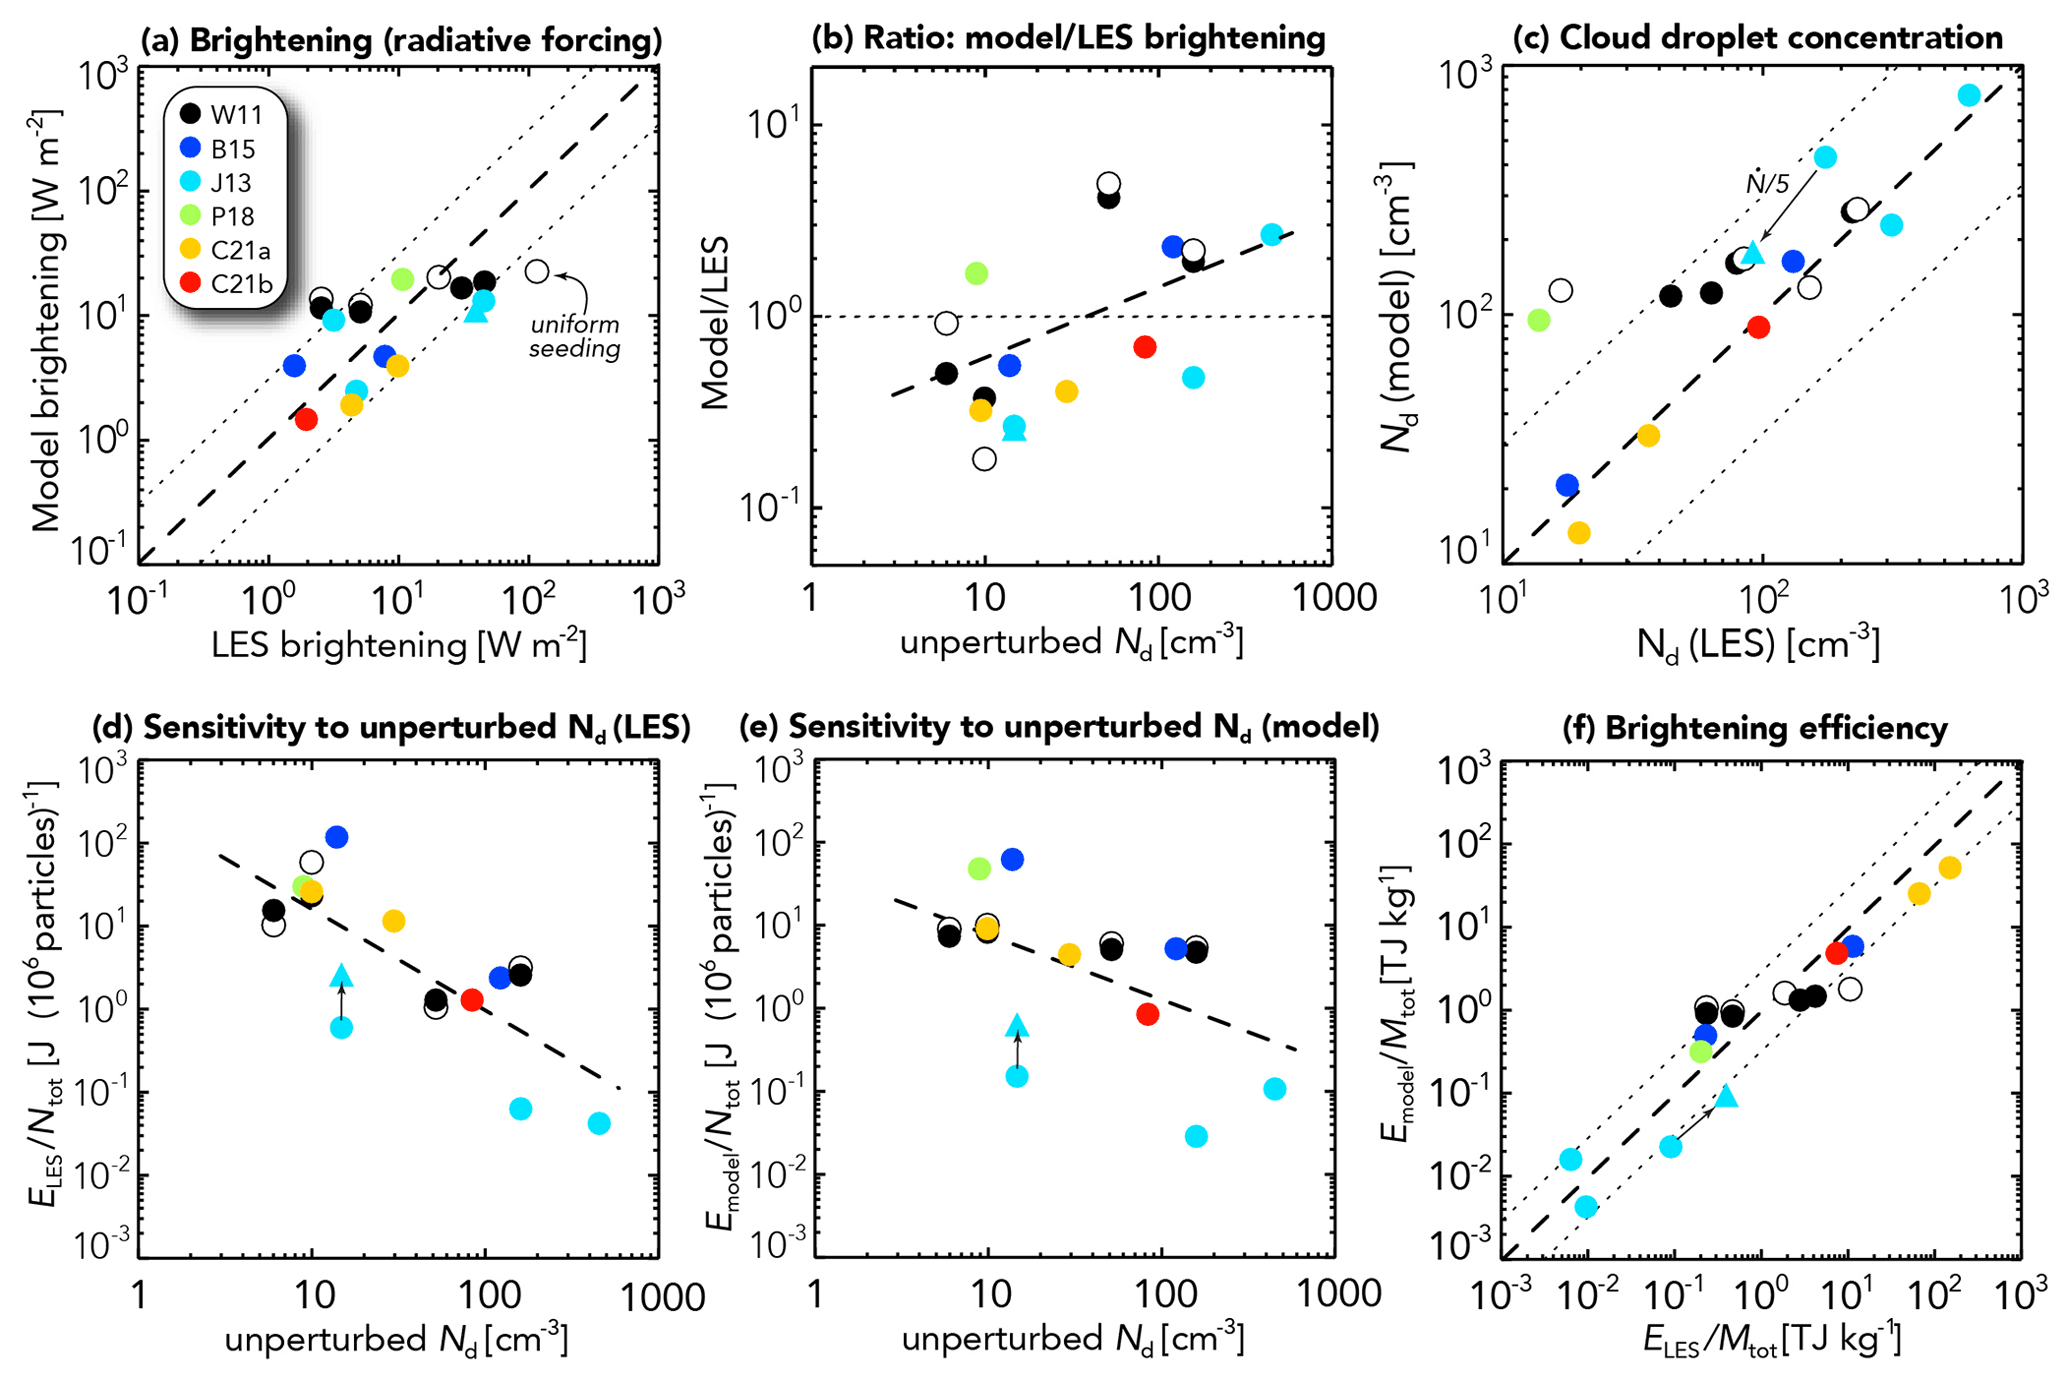
Figure 4Comparison of heuristic model and LES results. Each color indicates a different study (see Table 2 for details). For W11, open circles indicate cases with uniform seeding across the domain. (a) Brightening (radiative forcing) for the LES and heuristic model. The dashed line indicates agreement, and dotted lines represent factor of 3 differences. (b) Ratio of the brightening in the heuristic model to that in the LESs plotted against the droplet concentration in the unperturbed case Nd. The dashed line shows the linear least squares fit to the data. (c) Modeled vs. LES cloud droplet concentration, given the injection rates and particle size distribution employed in the model (see the text). The sensitivity of the normalized forcing (expressed as joules per injected particle) to the unperturbed Nd for (d) the LES experiments is shown. (e) The heuristic model with lines representing least squares fits to the data. (f) The brightening efficiency expressed as the energy reflected over the course of the simulation experiments per mass of salt injected. For J13, the triangle indicates a reduced injection rate by a factor of 5, with the arrows connecting the simulation experiments with full and reduced injection rates.
Forcing normalized by the total number of particles injected helps to account for the different quantities of particles injected in different studies and provides a useful metric of brightening obtained per particle injected. The LES results show a remarkably strong dependence of this on the unperturbed Nd (Fig. 4d), with a factor of 20 less brightening as unperturbed Nd increases from 10 to 100 cm−3. Although the heuristic model underpredicts (overpredicts) brightening in the clean (polluted) cases, there is still a strong decrease (∼ factor 10) in the brightening as unperturbed Nd increases (Fig. 4e), as anticipated from the Twomey formulation (Eq. 2). In Fig. 4d and e, J13 stands out as an anomaly, with a much weaker per-particle brightening compared with the other models. This appears to be because the injection rates used were greater than needed. An experiment with the precipitating case with an injection rate reduced by a factor of 5 (cyan triangles in Fig. 4d and e) leads to less than a 15 % reduction in brightening, implying asymptotic brightening as injection rates are increased and little benefit from the high spray rates used in most of the cases in J13.
It is instructive to compare the brightening obtained per mass of salt injected, and Fig. 4f highlights just how wide a spread there is in this quantity. The most efficient brightening is obtained in the Chun et al. (2021) cases with the smallest injected particles (Fig. 4f). For reasons discussed in the introduction, if a forcing can be achieved by injecting less salt mass, then this is desirable; so understanding the optimal size and concentration of injected particles to achieve a required forcing should be a focus for LES studies. These issues are explored further for the heuristic model in Sect. 4.
To synthesize the findings reported here, it should be noted that all the LES studies surveyed show some level of brightening when aerosol injections are introduced. The brightening achieved in the LES experiments, which is here expressed as an equivalent diurnal mean, ranged from ∼ 1–100 W m−2, with mean of 17 W m−2 and a median of 7 W m−2. The median unperturbed cloud Nd (29 cm−3) across all the cases here is somewhat lower than satellite estimates of average values for low clouds over the global oceans (40–90 cm−3; Bennartz, 2007). We also used the approach of Bennartz (2007) to derive a pdf (probability distribution function) of estimated Nd for all marine low clouds from MODIS data and found a median value of 50 cm−3. Thus, we might anticipate that the clouds simulated in the LES cases have a somewhat greater susceptibility to brightening than the average marine cloud. The brightening in the deepest MBL case here (P11) does not stand out as being anomalously weak compared with similarly clean cases, although no clear track is produced in the simulated cloud field (Possner et al., 2018). It is important to stress, however, that several low cloud systems (e.g., self-aggregated cumulus and midlatitude stratus) that contribute significantly to low cloud cover over the global oceans are not represented in the LES cases in the literature to date. The LES cases also do not provide sufficient constraints on how brightening changes with injection rate and injected particle size across the different meteorological conditions. Another consideration is that almost all the LES studies examine responses that take place within the first day after injection. As Fig. 2 suggests, a significant fraction of the reflected energy likely takes place between 1–3 d after injection. However, studies suggest that cloud adjustments to aerosol may change significantly over timescales of hours to a few days (Wood, 2007; Gryspeerdt et al., 2021; Glassmeier et al., 2021), resulting in changes on longer timescales that may, in some cases, offset some of the Twomey brightening. Thus, although the LES simulations here provide some validation of the heuristic model, there is a need for many more simulations to test its sensitivities under the full range of meteorological, background aerosol, and aerosol injection scenarios.
The heuristic model is next used to estimate the global radiative forcing for MCB under different assumptions regarding the number of sprayers and the rate and size of the injected particles. The sensitivity of the forcing to the properties of the background aerosol and updraft speed is also explored.
4.1 Sprayer number and injection rate
Figure 5 presents results as a function of the number of sprayers Nsprayers and the salt mass injection rate per sprayer . For this case, injected particles have Ds=100 nm, and spraying occurs over all eligible ocean areas (focean=0.54 and fspray=1 in Eq. 5). A background accumulation-mode aerosol concentration cm−3 is assumed, representative of conditions over the open oceans (Heintzenberg et al., 2000), and a representative coarse mode is included (Sect. 2.6 and Table 1). Other parameters are set to the values provided in Table 1 and discussed in Sect. 2. The assumed MBL depth of 1000 m is representative of typical conditions in which stratiform marine low clouds occur. A global mean radiative forcing magnitude of 1–4 W m−2 can be achieved, with forcing generally increasing as total salt mass injection rates increase from ∼ 10 to ∼ 60 Tg yr−1 (Fig. 5a). As the total injection rate increases beyond 100 Tg yr−1, there are somewhat diminishing returns in terms of further brightening, and −ΔF reaches ∼ 5–8 W m−2 for an injection rate of 1000 Tg yr−1. The reduced sensitivity as more particles are injected is driven by increased competition for water vapor in the updraft, resulting in a decreasing fraction of injected aerosols activated to form droplets (Fig. 5b; dotted contours). When the injected aerosol concentration is less than a few hundred particles per cubic centimeter, such competition for vapor is relatively modest, and the activated fraction exceeds 70 %, but this reduces to only 30 %–40 % at injection rates of 300 Tg yr−1.
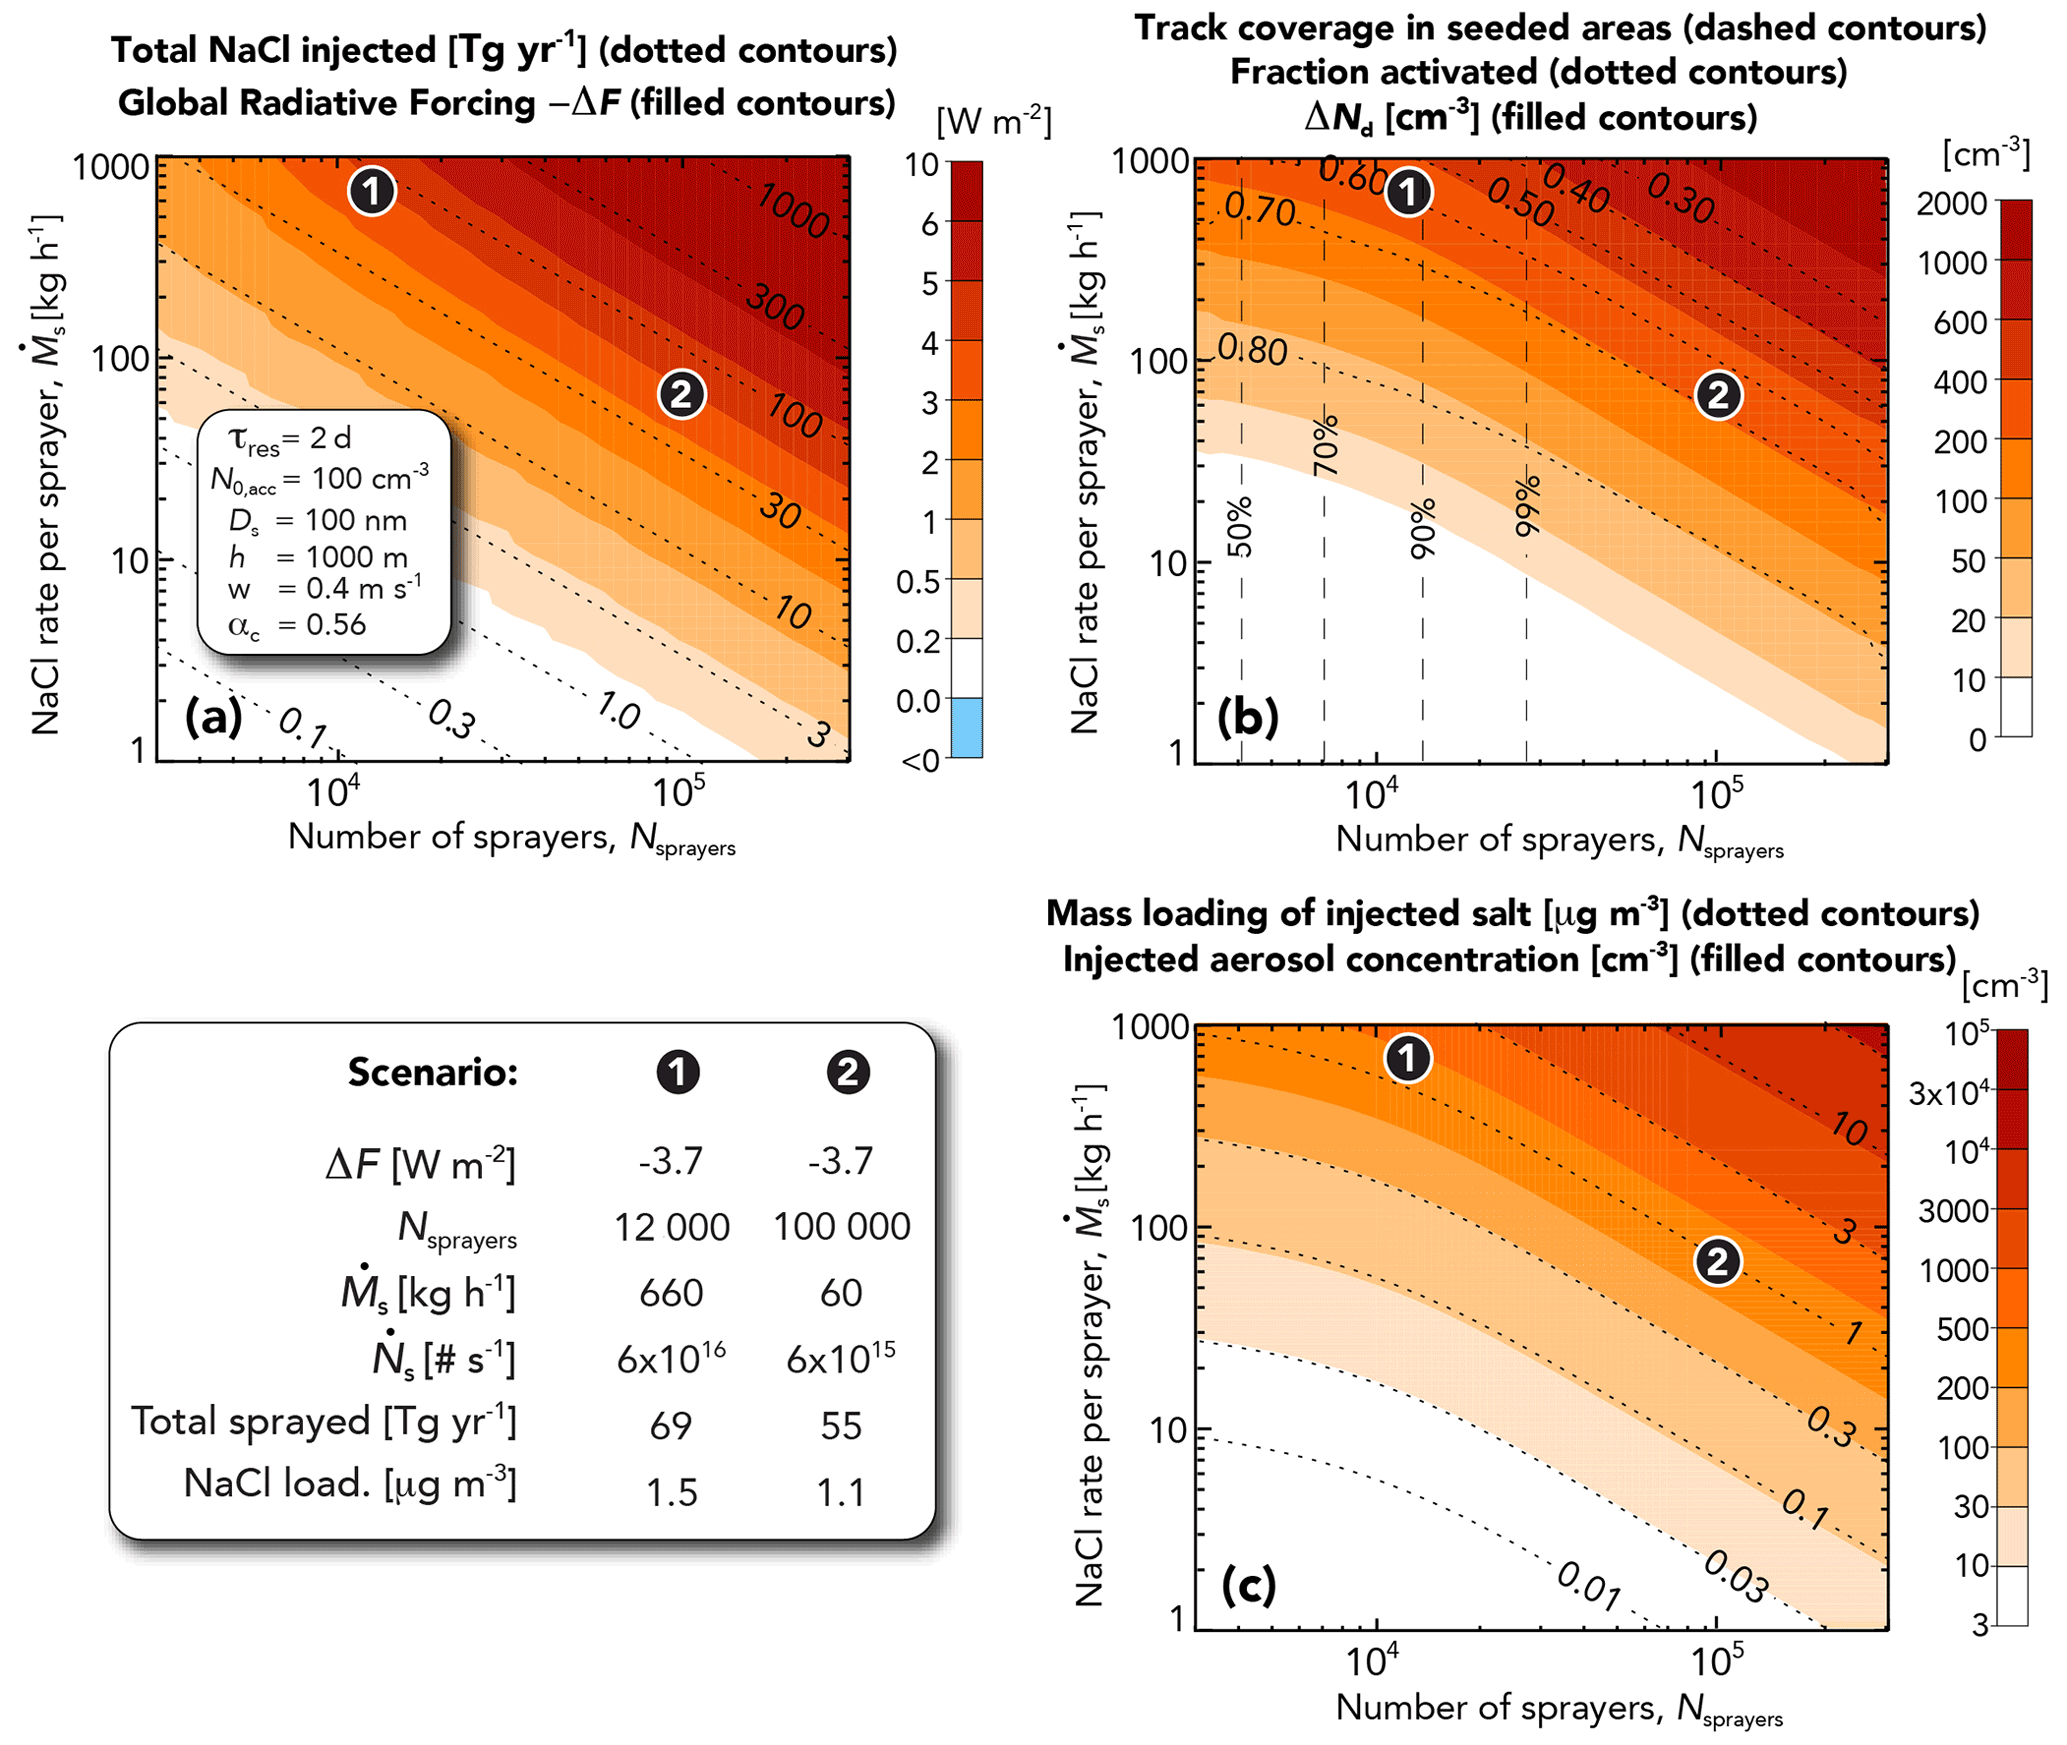
Figure 5(a) Global mean radiative forcing ΔF (colors) and total flux of sodium chloride (dotted contours) from MCB applied to all eligible ocean areas (54 % of Earth's surface) as a function of the number of sprayers Nsprayers and the salt mass injection rate for each sprayer. (b) Increase in cloud droplet concentration ΔNd (colors), mean fraction of aerosol activated in tracks (dotted contours), and track coverage (dashed contours). (c) Injected aerosol number concentration in tracks (colors) and mean mass loading in the MBL of injected salt (dotted contours). The inset of panel (a) shows the key model parameters, with others as seen in Table 1. The two scenarios, (1) and (2), which each produce sufficient forcing to offset doubled CO2, are highlighted. Scenario (2) has a higher number of sprayers but a lower rate of particles injected per sprayer.
Given that −ΔF increases approximately as a function of total mass injection rate for mass injection rates of <50 Tg yr−1 (Fig. 5a), roughly the same forcing can be achieved either with a smaller number of high throughput sprayers, or a larger number of somewhat weaker sprayers. Scenario (1) in Fig. 5 has Nsprayers = 12 000, each injecting 6×10¹⁶ particles per second, for a total mass injection rate of 69 Tg yr−1; this achieves the same forcing (−3.7 W m−2) as scenario (2), which has Nsprayers=105, each injecting 6×10¹⁵ particles per second, for a total mass injection rate of 55 Tg yr−1. As we discuss in Sect. 5.1, particle spray rates approaching 1017 s−1 will likely result in significant particle losses due to high concentrations in the near field of the spray system, and so we consider scenario (1) to be close to the upper end of the injection rates that are likely to be feasible. From this, it may reasonably be concluded that, if MCB were ever to be used to achieve a radiative forcing close to that needed to offset a doubling of CO2, considerably more sprayers would be needed than are assumed in the estimate from Salter et al. (2008), where only ∼ 4500 spray vessels were assumed. The need for a greater number of sprayers in the heuristic model is primarily because of overlapping plumes which reduce effectiveness by introducing heterogeneity into the injected particle spatial distribution. Plume overlap is not accounted for in Salter et al. (2008), where each sprayer uniformly increases the particle concentration over an area of 7.7×10¹⁰ m2. Our assumed track area is m2 (Sect. 2.5), which is quite similar to this, but our plumes overlap. The effect of plume overlap is demonstrated by noting that scenario (1), with fewer sprayers than scenario (2), requires ∼ 25 % more injected mass to achieve the same forcing. If we set Nsprayers to the number that would cover the ocean if there were no overlaps (5300; Sect. 2.5), the heuristic model would require over twice as much mass to produce a forcing sufficient to offset 2×CO2 as in the Nsprayers=105 case because the track coverage (fraction of the seeded area with at least one overlapping track) in seeded areas only marginally exceeds 50 % (Fig. 5b; dashed lines). Thus, almost half of the eligible ocean area remains unperturbed in this case, requiring increases in Nd to offset doubled CO2 in the perturbed clouds that are harder to achieve (see Fig. 1). Figure 6 (black curves) shows −ΔF for different values of Nsprayers plotted as a function of the total salt mass injection rate to further illustrate the need for a high number of sprayers to minimize the total mass of salt that needs to be injected to achieve a given forcing.
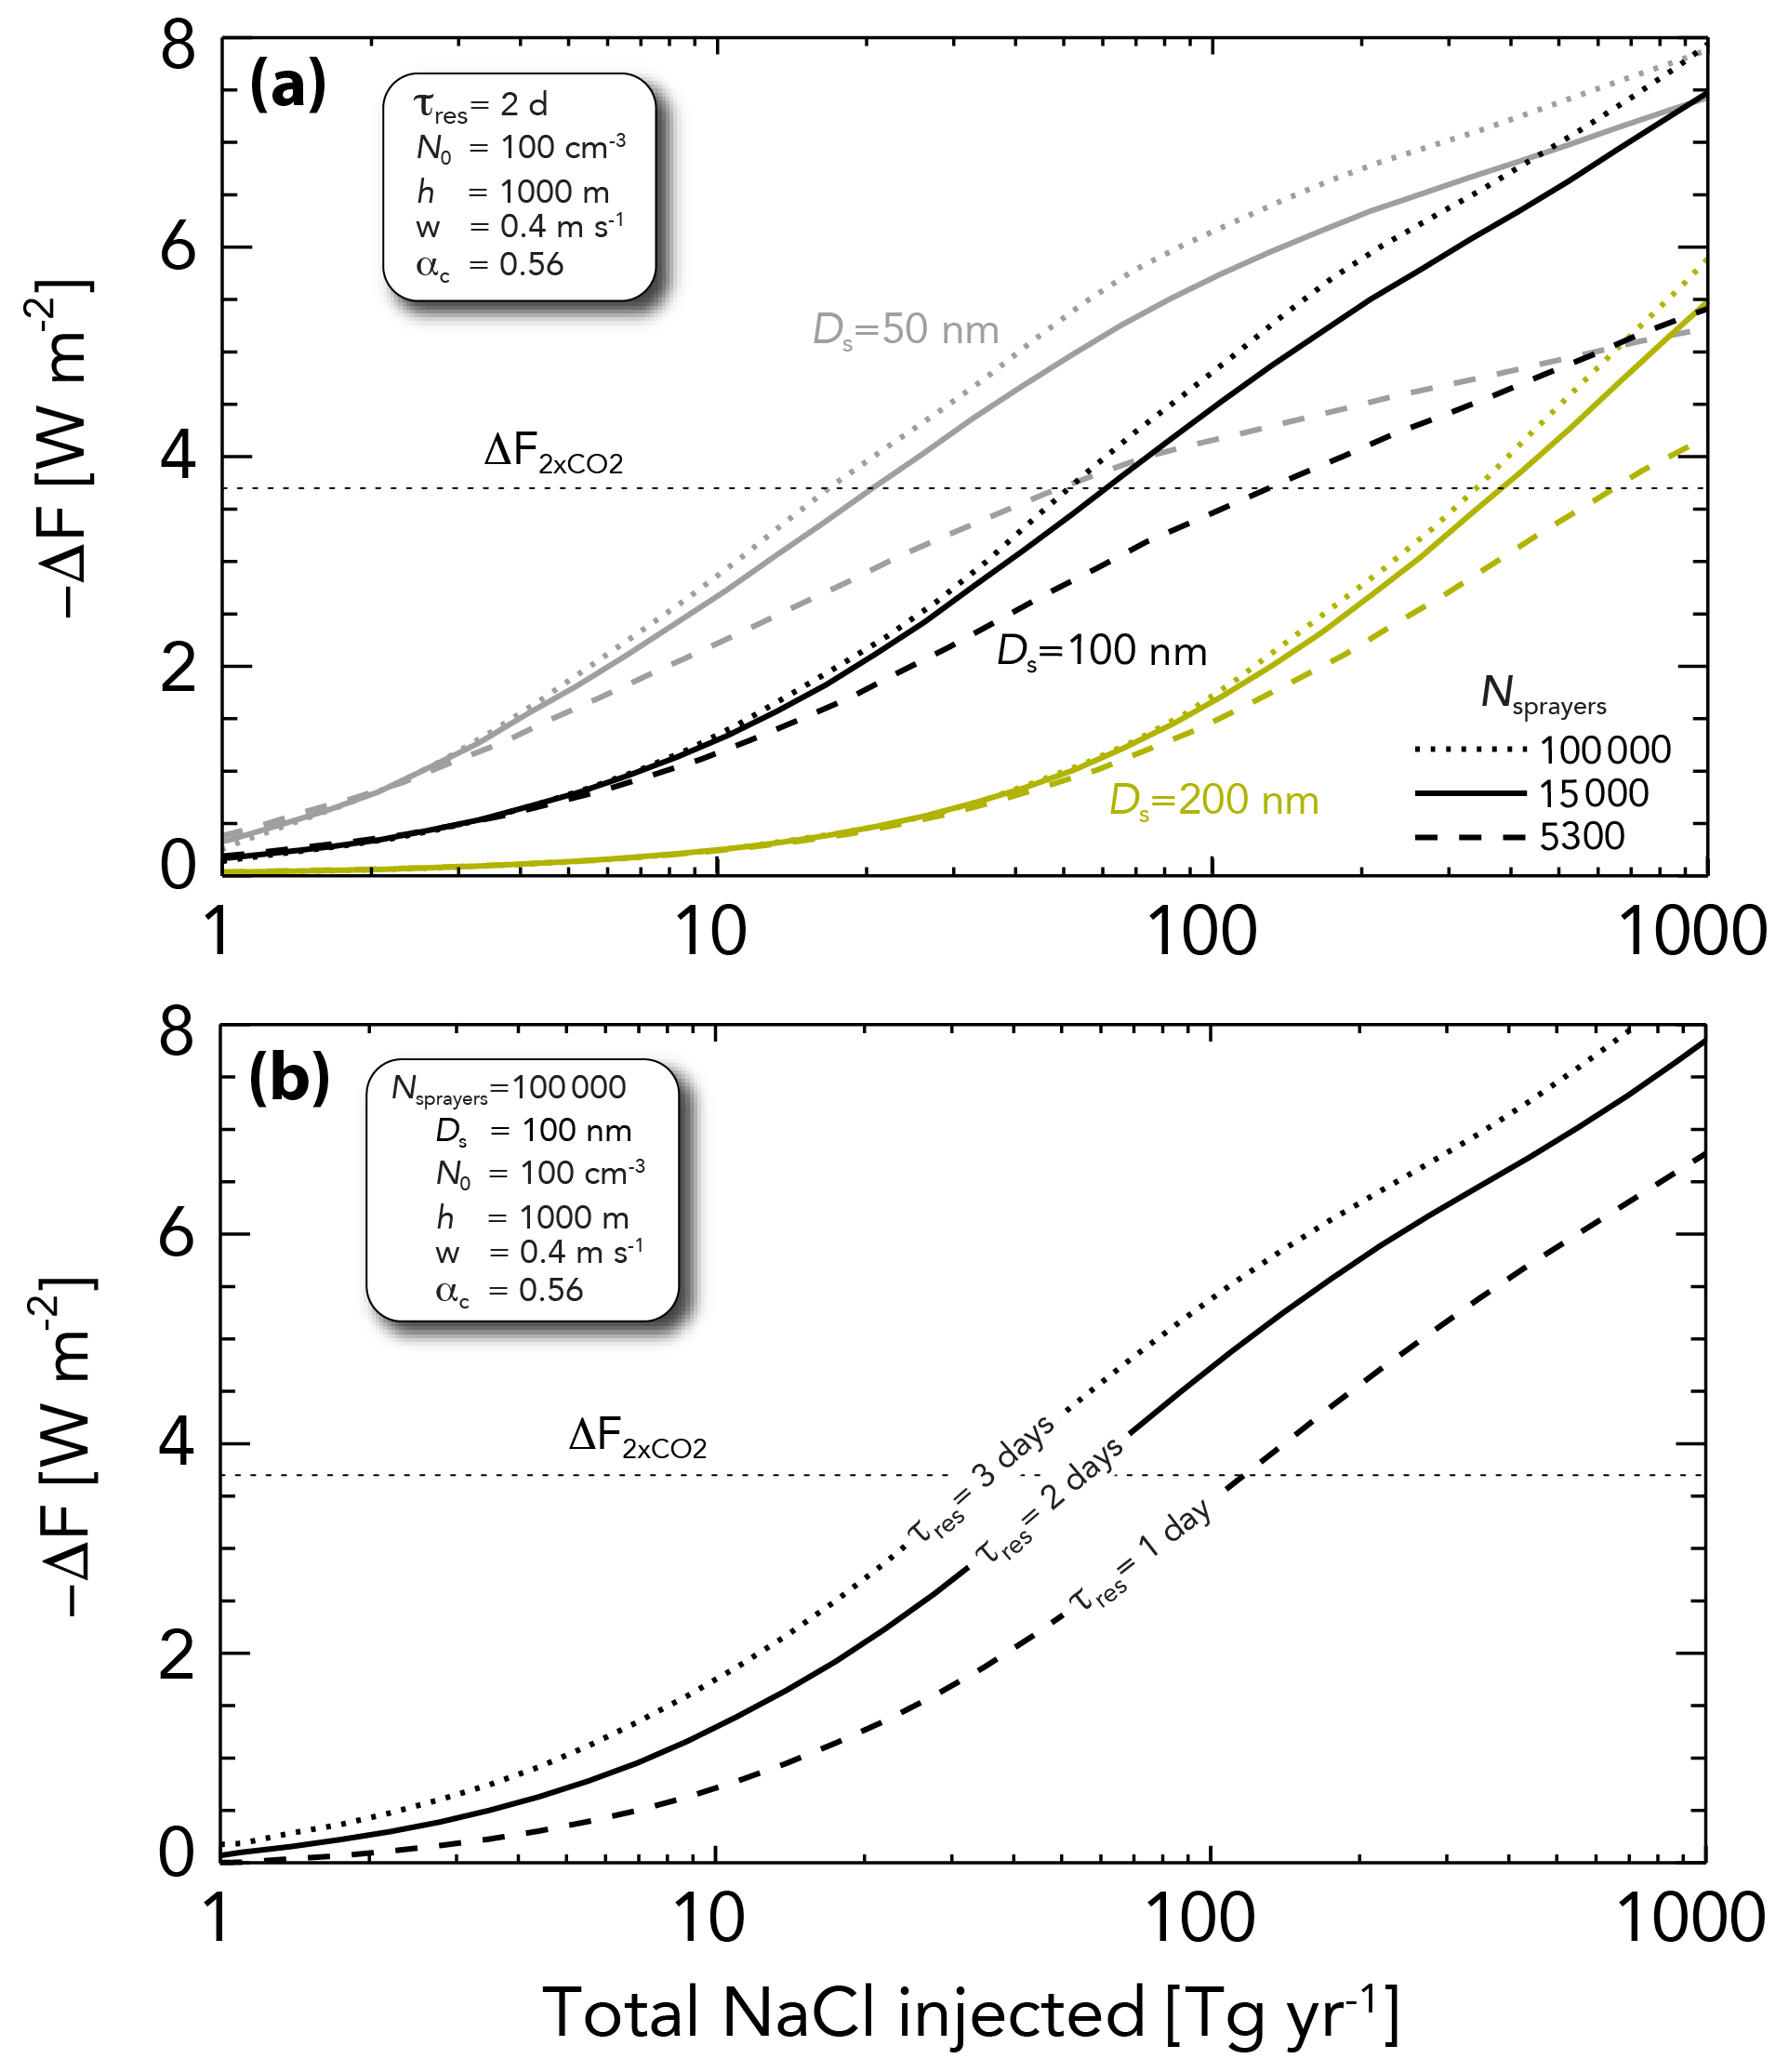
Figure 6Radiative forcing as a function of the total (global) rate of salt mass injection for (a) three sprayer numbers (Nsprayers=5300, 15 000, and 120 000) and for geometric mean spray diameters Ds of 50 nm (gray), 100 nm (black), and 200 nm (yellow). (b) Forcing for Nsprayers = 120 000 and Ds=100 nm as a function of injected particle lifetime. All other parameters are the same as those used in Fig. 5.
A key result from the heuristic model, for Ds ∼ 100 nm, is that the forcing to offset doubled CO2 should be achievable with a total salt mass injection rate of ∼ 50–70 Tg yr−1. This is much lower than the natural sea salt flux, which studies suggest ranges from 3000 to > 10 000 Tg yr−1 (Textor et al., 2006; Grythe et al., 2014). The residence time of natural sea spray particles is considerably shorter than the lifetime (τres=2 d) of the injected salt particles because sea spray particles have a much larger mean size. Thus, a perhaps more useful comparison is to examine the mass loading of the injected salt particles, which increases from 0.1 to 1 µg m−3 as the forcing magnitude increases from 1 to 4 W m−2 (Fig. 5c). The coarse-mode aerosol assumed in the model (Table 1) has a mass loading of 12.7 µg m−3, which is broadly representative of typical salt loadings in the MBL (5–20 µg m−3; Jaeglé et al., 2011). Thus, the mass loading of injected particles required to deliver a significant radiative forcing is a relatively small fraction (∼ 10 %) of the natural salt burden in the atmosphere. This is not the case with existing climate model studies of MCB, where much higher salt mass injection rates have been required in order to provide a globally significant radiative forcing. The reasons for this are explored the next section.
It is worth comparing the results from the heuristic model with estimates of radiative forcing from commercial shipping. Total SO2 emissions from shipping are ∼ 10 Tg yr−1 (see Lauer et al., 2007). Assuming this is all converted into sulfate, this equates to a mass of 15 Tg SO4 yr−1. Introducing injections of 15 Tg NaCl yr−1 would yield a Twomey radiative forcing of ∼ 1.5–2.0 W m−2 for Ds=100 nm (Fig. 6a). This represents a considerably higher efficacy (forcing per mass of solute) for MCB compared with commercial shipping. Although sea salt is slightly more hygroscopic than sulfate, it is unlikely that composition differences explain the greater efficacy. On the other hand, observations show that the modal diameter of accumulation-mode particles over the oceans, which consist mostly of sulfate, tend to be closer to 200 nm diameter than to 100 nm diameter (e.g., Heintzenberg et al., 2000). Although commercial ships do emit a considerable number of small Aitken particles (e.g., Hobbs et al., 2000), one would expect considerable growth into the accumulation mode over the lifetime of the emitted SO2. One hypothesis to explain the greater efficacy of MCB is that commercial shipping emissions result in larger accumulation-mode particles. Injection rates of 15 Tg yr−1 of NaCl particles with Ds=200 nm would yield a radiative forcing of only 0.5 W m−2 (Fig. 6a), a value within the range of estimates of forcing from marine shipping (0.06–0.6 W m−2; see the introduction). Additionally, shipping emissions are much more concentrated geographically than those from our heuristic model (assuming fspray=1), which reduces efficacy. A more thorough treatment of the effects of geographical heterogeneity of sulfate from commercial shipping is beyond the scope of this study.
4.2 Impacts of variations in injected aerosol size and lifetime and background aerosol concentrations
A key unresolved question concerns what size of injected particles produces the most effective brightening. Prior studies using LES and climate models have used relatively large particles with modal dry diameters exceeding 200 nm. Although particles of this size serve as very effective CCN, it is important to take into consideration the overall mass injection rate, which determines the energetic requirements for particle generation and impacts on atmospheric chemistry (see the introduction). For the sprayer number and injection rate from scenario 2 (Sect. 4.1; Fig. 5) the optimal geometric mean diameter Ds of injected particles is 30–60 nm (Fig. 7a). This optimal size range is consistent with the parcel modeling of Connolly et al. (2014) and is relatively insensitive to the background accumulation-mode aerosol concentration N0,acc. For fixed mass injection rate, injected aerosol concentration increases as the inverse third power of Ds (Eqs. 5 and 7). For large injected particles (Ds ∼ 200 nm), most of the injected particles are activated (Fig. 7b), but each particle has a large mass, and so the overall mass injection rate required to produce a given forcing is roughly 5 times higher with Ds=200 nm than it is with Ds=100 nm (Fig. 6a), which is quantitatively consistent with the GCM (global climate model) sensitivity tests in Partanen et al. (2012). We find that 40 % more forcing can be achieved per mass injected if Ds is further decreased from 100 to 50 nm (Fig. 7a). With Ds in this optimal range in terms of forcing per mass injected, although the activated fraction is quite low, the gain in the added aerosol concentration counters this. This occurs up to a point where competition for vapor draws down supersaturation, and there is a reduction in the number of injected particles that have critical supersaturations sufficiently low to activate. When Ds is smaller than ∼ 40 nm, Nd begins to decrease again (Fig. 7b). The saturation effect of adding very small particles is also demonstrated by the gray lines in Fig. 6a, which show forcing as function of total salt mass injection rate for Ds=50 nm. For low mass injection rates (<10 Tg yr−1), these very small injected particles produce twice as much brightening as particles with Ds=100 nm. At higher rates, exceeding ∼ 50 Tg yr−1, brightening increases very modestly.
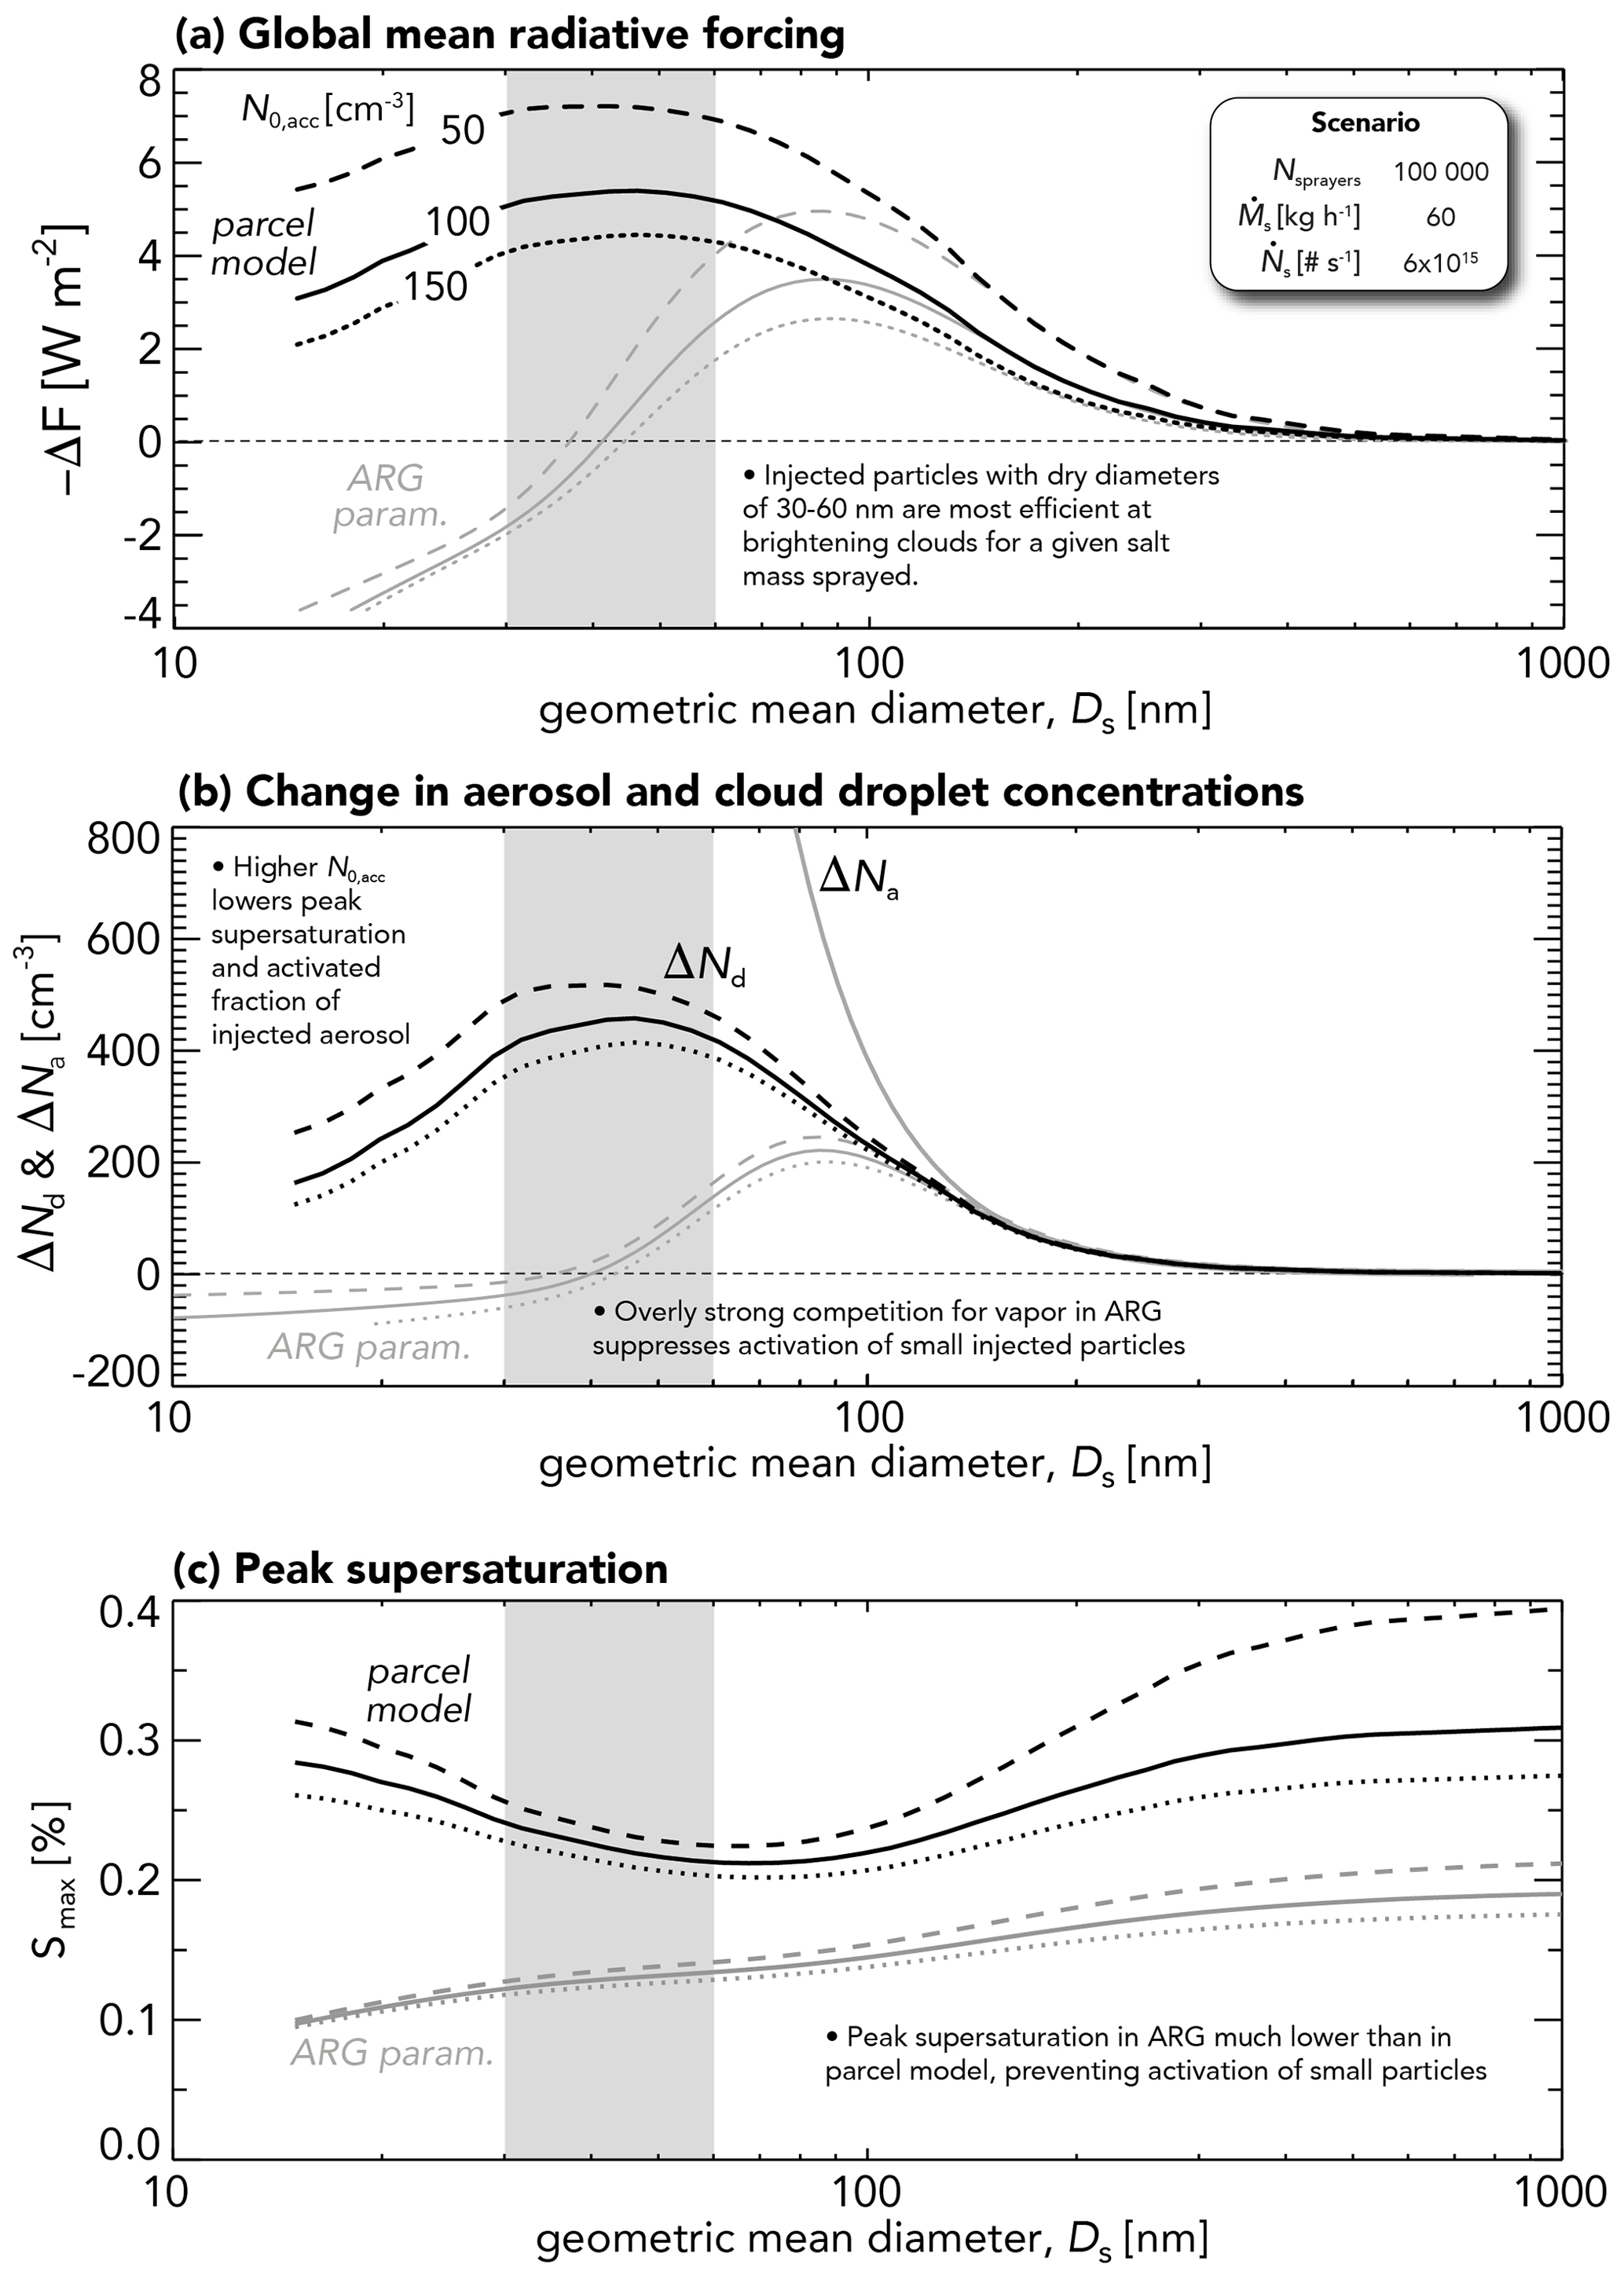
Figure 7(a) Global mean radiative forcing −ΔF for a fixed salt mass spray rate (based on scenario 2; see the legend) as a function of injected particle geometric mean diameter Ds for three unperturbed accumulation-mode aerosol concentrations , 100, and 150 cm−3. Black curves show the results from the parcel model and gray curves from the ARG parameterization. (b) Change in mean cloud droplet concentration ΔNd and aerosol concentration ΔNa in regions where sprayers are operating. (c) Peak supersaturation in the updraft. The gray shaded box indicates the most effective range of Ds.
We find a major discrepancy between the parcel model activation used here and that estimated using the ARG parameterization. For Ds larger than 100 nm, droplet concentrations from ARG are in general agreement with those from the parcel model (Fig. 7b), but as the injected particle size decreases, ARG is unable to activate enough droplets. A significant tendency to underpredict activation fraction has been noted in several prior studies (Ghan et al., 2011; Connolly et al., 2014), and Simpson et al. (2014) found a systematic underprediction of peak supersaturations estimated with ARG, which we confirmed with the parcel model (Fig. 7c). This upshot of this issue is that, whereas we find that a maximum in brightening for Ds=40 nm, the competition for vapor in ARG is so strong that it prevents activation of almost all injected particles, and so the forcing is close to zero (Fig. 7a). It will, therefore, be very important to ensure that activation schemes used in climate modeling for MCB are sufficiently accurate to represent the unusual size distributions that would be needed for effective implementation of MCB.
Alterskjær and Kristjánsson (2013; henceforth AK13) used a climate model with ARG as its activation scheme and found that injected Aitken-mode particles (Ds=44 nm) produced a strong negative ΔF at the lowest injection rate used (48.2 Tg yr−1) but a positive ΔF for injection rates exceeding this. The behavior is consistent with our findings using the ARG scheme but is not consistent with the results from the parcel model, where brightening continues to increase with injected mass for particles of this size (Fig. 7a), and there is no cloud darkening (positive ΔF). AK13 also conducted a sensitivity study in which peak supersaturations were fixed at 0.2 % and found that the sign of the forcing changed from weakly positive to strongly negative. We find that the suppression of peak supersaturation as Ds decreases is similarly strong in the parcel model and the ARG parameterization for Ds>30 nm (Fig. 7c), implying that additional competition for vapor from the injected particles is not the main reason for the reduced activation fraction in ARG. Instead, it is the general underprediction of peak supersaturation in ARG occurring at all values of Ds that is the main reason for its inability to activate small Aitken particles. Indeed, the fixed supersaturation of 0.2 % in the AK13 sensitivity test is quite similar to that in the parcel model (Fig. 7c), and much higher than that for the ARG parameterization, showing that the use of ARG in AK13 is leading to misleading results regarding the efficacy of injecting Aitken-mode particles.
Although the optimal geometric mean diameter Ds of injected particles is 30–60 nm (Fig. 7a), there are other reasons against injecting very small Aitken-sized particles, including near-field coagulation and a higher loss rate to Brownian scavenging by cloud droplets. The former is explored in Sect. 5.1. The timescale for Brownian scavenging of injected aerosol in a cloud-topped MBL scales with (Seinfeld and Pandis, 2003) and also decreases inversely with . For realistic liquid water contents, it can be shown that under MCB (i.e., Nd of a few hundred cubic centimeters) for Ds=60 nm, the timescale for particle losses to Brownian scavenging by cloud droplets is ∼ 4 d but falls to only ∼ 1 d for Ds=30 nm.
There is strong sensitivity of forcing to injected particle residence time τres (Fig. 6b). A longer τres increases the area of each sprayer track in proportion to (since both track width and length are proportional to τres; see Sect. 2.4), but the injected particle concentration over that area scales as (Eq. 7). For the scenario of many overlapping tracks (Nsprayers=105), the total salt mass required to produce a given forcing scales with (Fig. 6b). Thus, the lifetime of injected particles is a key determinant of MCB efficacy, warranting further study.
Higher background droplet concentration lowers a cloud's albedo susceptibility (; Twomey, 1977; Platnick and Twomey, 1994). In addition, the increase in droplet concentration ΔNd with injection is also reduced when N0,acc is higher (Fig. 7b). This occurs because peak supersaturation is reduced when the background particles are more numerous, and so a lower fraction of the injected aerosol is activated. This results in a forcing that scales more weakly with N0,acc than would be expected based solely on the albedo susceptibility. As N0,acc increases from 50 to 150 cm−3, the albedo susceptibility decreases by a factor of 3, and yet the magnitude of the radiative forcing (e.g., for Ds=50 nm) decreases by less than a factor of 2.
The presence of a coarse mode in the unperturbed state imposes a relatively modest decrease in the effectiveness of aerosol injections in brightening clouds. For Ds in the range 50–100 nm, the realistic background coarse-mode concentration ( cm−3) used throughout this study results in a forcing that is less than 10 % smaller than in the absence of a coarse mode (Fig. 8), and the effect is weaker for larger Ds. Coarse-mode concentrations vary with wind speed and can reach values of ∼ 20–50 cm−3 at high wind speeds (Zheng et al., 2018). As Fig. 8 shows, it is only at concentrations well in excess of 10 cm−3 (mass loadings well more than 10 µg m−3) that there would be significant limits to brightening due to the coarse mode. It is important that MCB spray technology does not introduce a significant number of coarse-mode particles, as these will reduce brightening. However, it should be noted that the coarse-mode mass loadings required to produce a significant dampening of forcing are considerably more than those required to produce brightening using ∼ 100 nm particles.
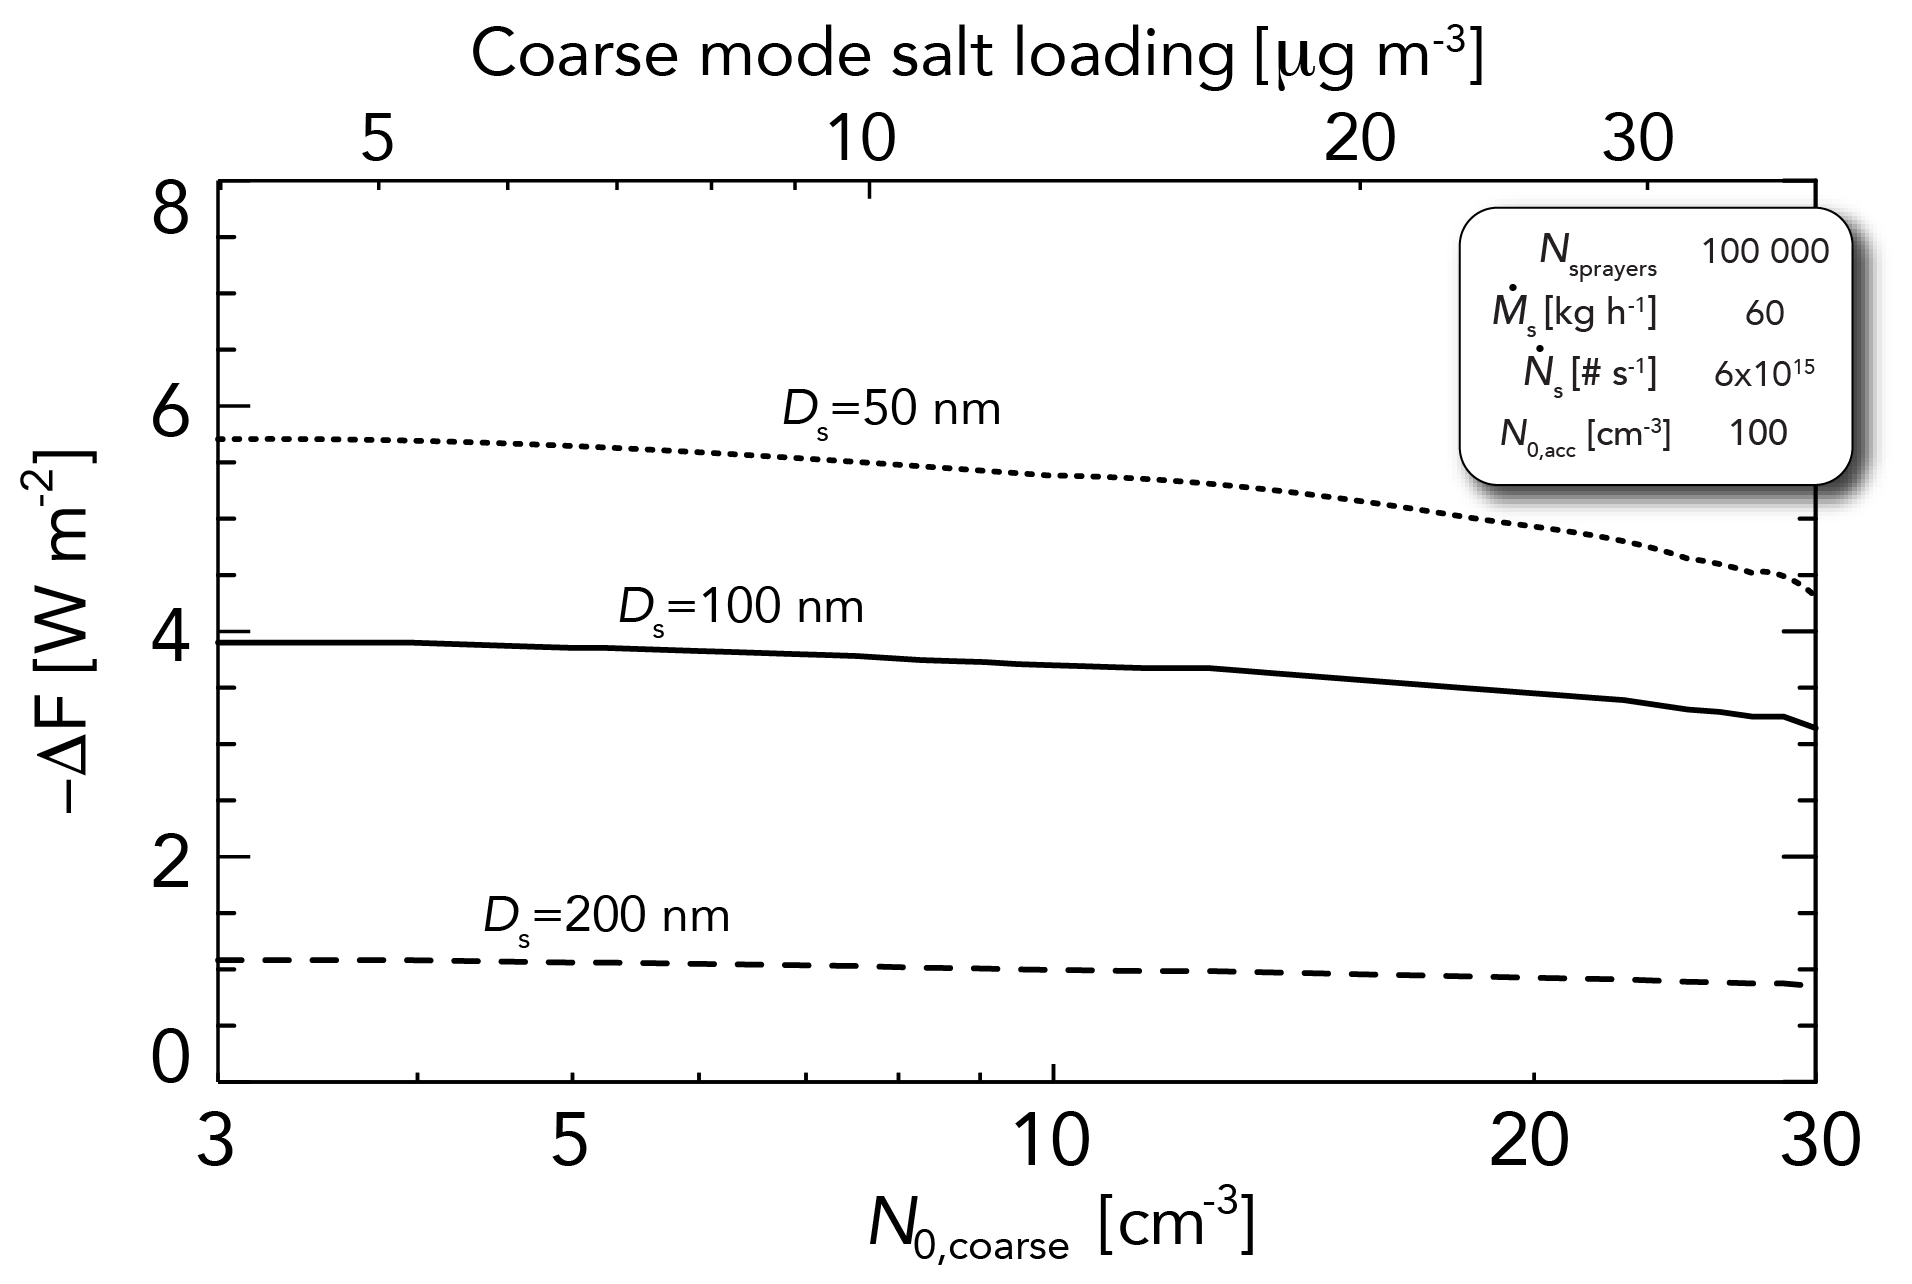
Figure 8Global mean radiative forcing −ΔF for a fixed salt mass spray rate (based on scenario 2; see the legend) as a function of background coarse-mode aerosol concentration N0,coarse for three injected particle sizes (Ds=50, 100, and 200 nm). The equivalent salt mass loading in the coarse mode is indicated by the top axis.
4.3 Sensitivity to updraft speed
Updraft speed w is a key determinant of the peak supersaturation during the activation process in updrafts (Sect. 2.6). A single value (w=0.4 m s−1) is assumed for the results shown in this study, but note that the sensitivity of ΔF to w is strongly dependent upon the injected particle size (Fig. 9a), with sensitivity decreasing strongly as Ds increases. The sensitivity is related to Nd (Fig. 9b), which itself depends upon the peak supersaturation in the updraft (Fig. 9c) and the size distribution of injected and unperturbed aerosol particles. Note that the suppression in peak supersaturation for the perturbed case compared with the unperturbed case is stronger for Ds=100 nm than it is for Ds=200 nm but falls no further for Ds=50 nm. Smaller and more numerous particles have a greater surface area and therefore remove vapor more rapidly, but kinetic limitations on growth rates restrict the continuation of this when Ds falls much below 100 nm. For the mass spray rates assumed here (scenario 2; see Sect. 4.1), almost all injected particles activate in updrafts exceeding 0.3 m s−1 when Ds = 200 nm (Fig. 9b). The suppression of peak supersaturation is relatively modest in this case (Fig. 9c). For Ds=100 nm, the forcing magnitude increase with w is stronger because the increase with w is stronger. However, it should be noted that, for Ds=100 nm, the forcing magnitude only increases by 30 % over the range m s−1, indicating relatively weak sensitivity to updraft speed overall. The greatest sensitivity to w occurs for the smallest injected particles (Ds=50 nm), where the forcing increases by 80 % over the range m s−1. This reflects the fact that the greatest sensitivity of to increasing peak supersaturation will occur when the critical supersaturation of the modal diameter (where the greatest number of particles lies) is close to the peak supersaturation. A 50 nm diameter salt particle has a critical supersaturation of 0.25 % (e.g., Petters and Kreidenweis, 2007), which is similar to the peak supersaturation at w=0.4 m s−1 (Fig. 9c). Given that activation in real MBL clouds occurs in a spectrum of updrafts (e.g., Snider et al., 2003), this result would caution against the use of injected particles that are too small to increase Nd in the majority of clouds seeded.
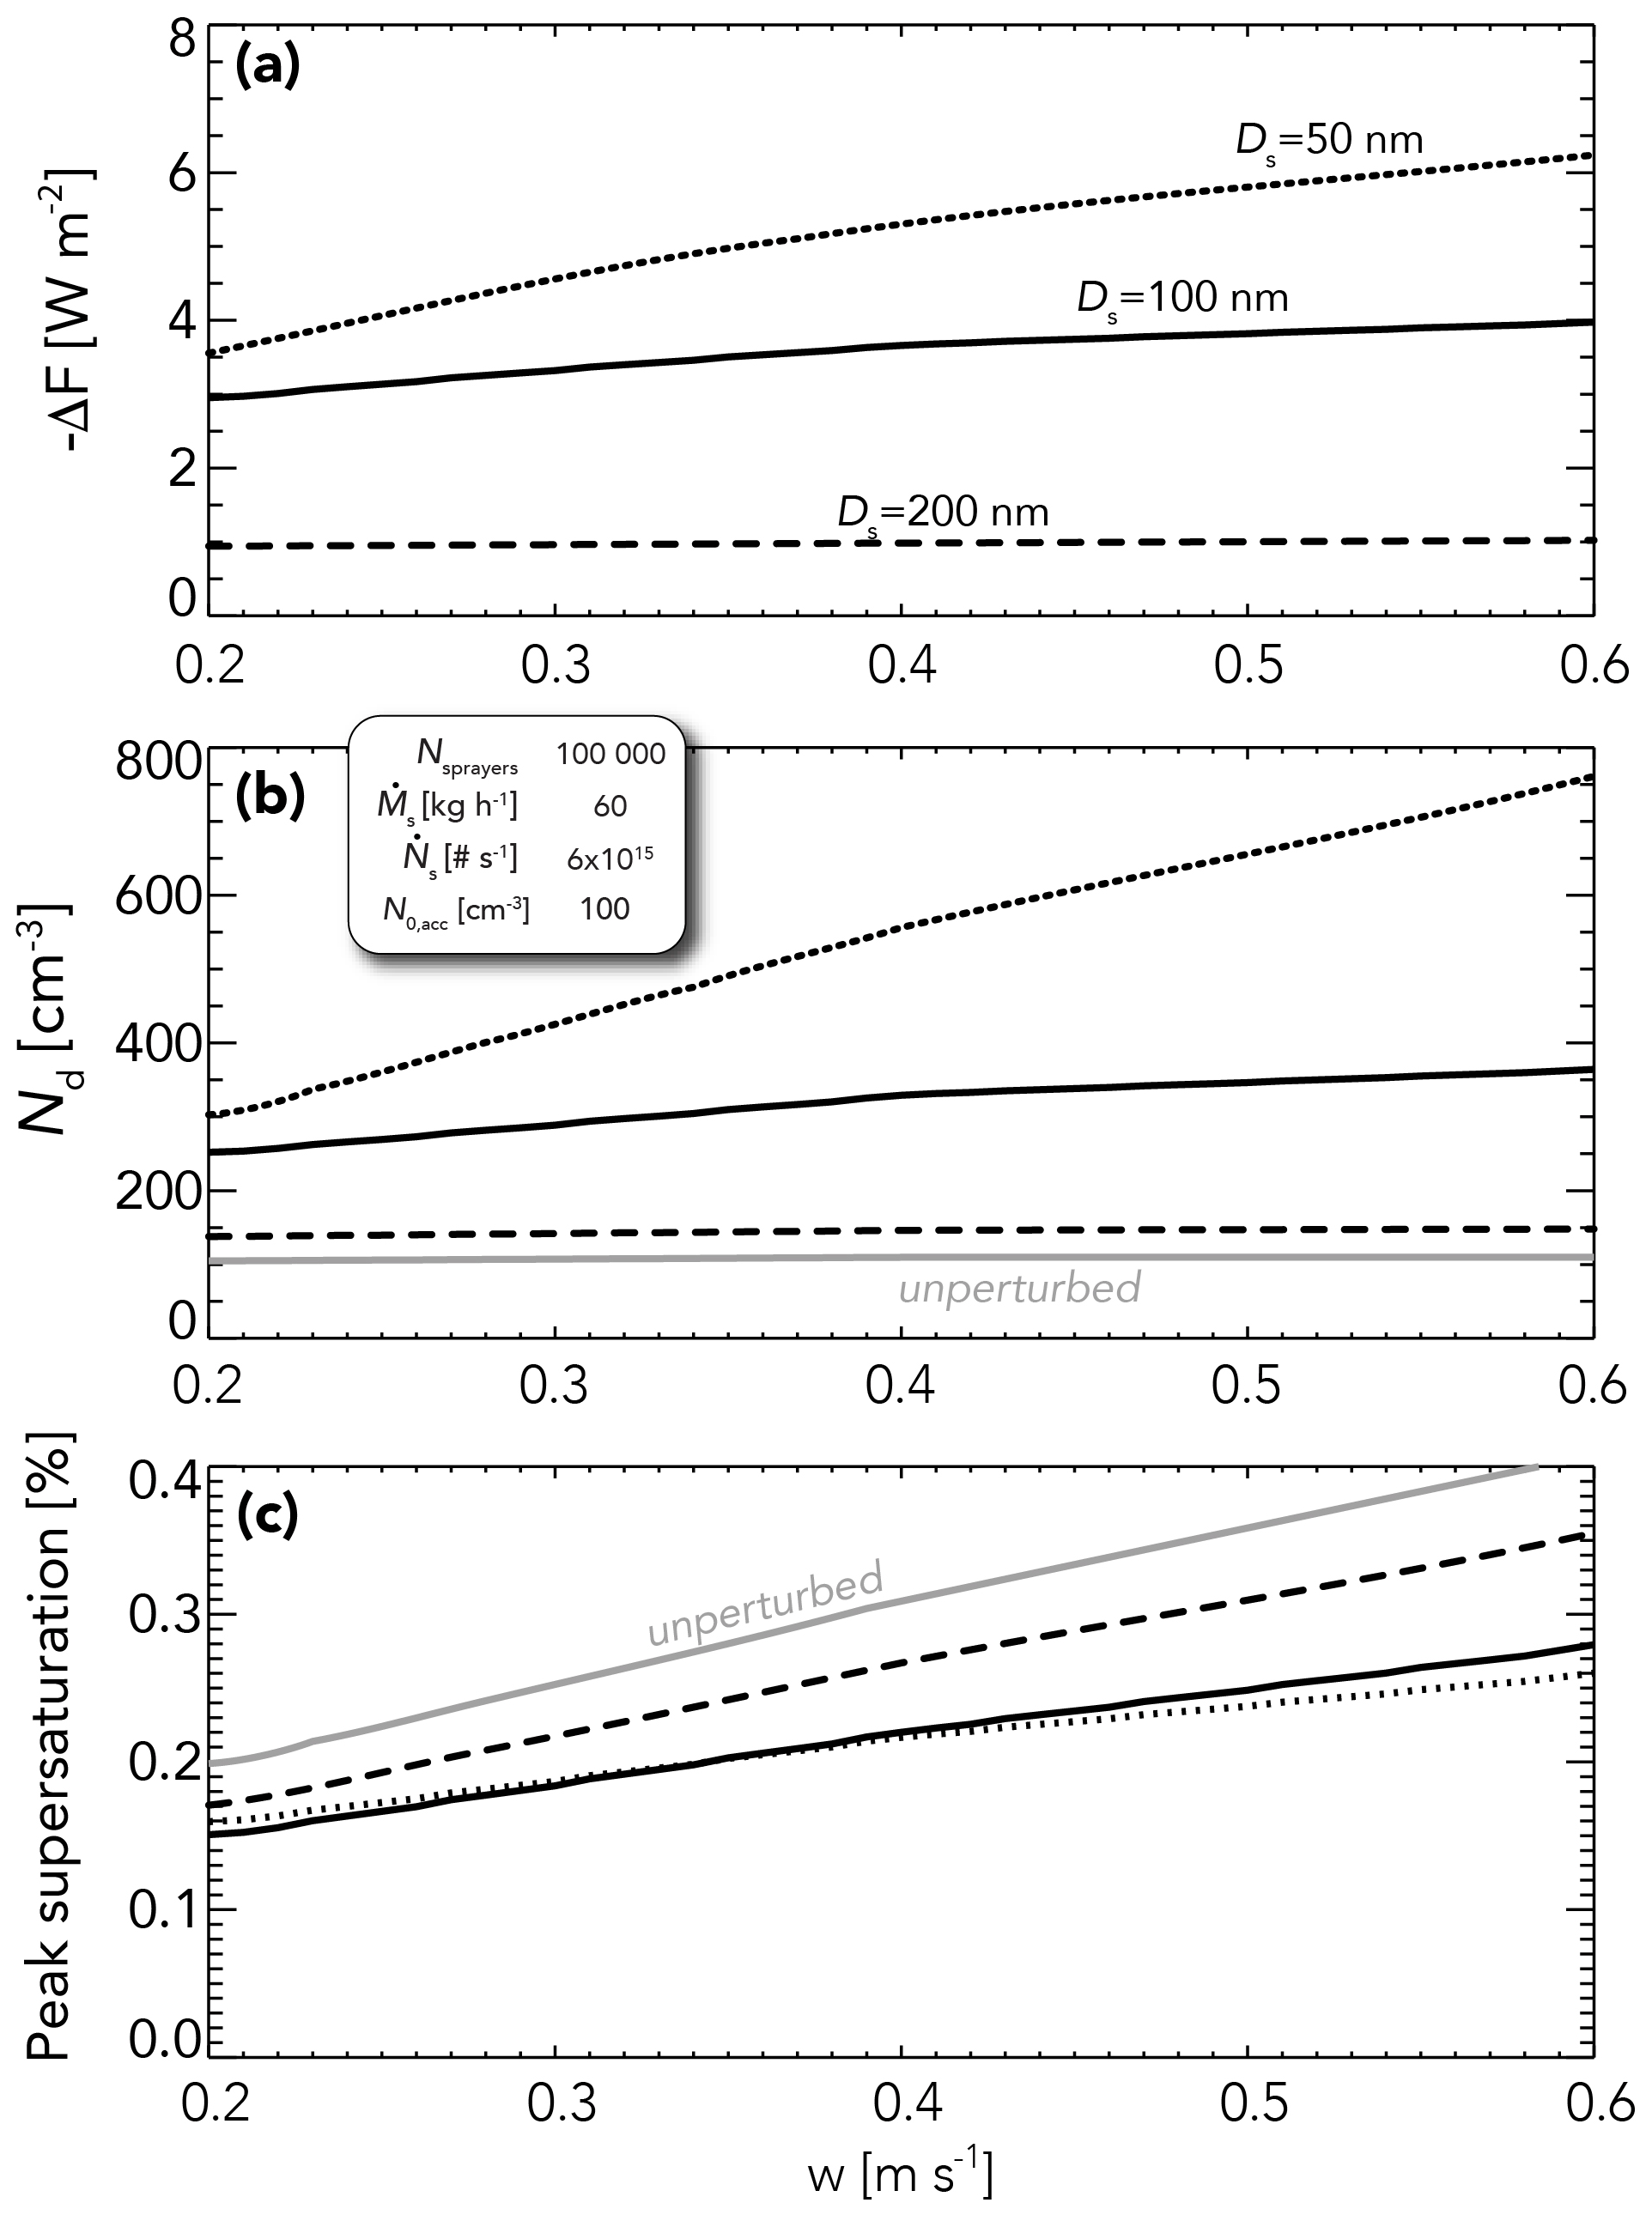
Figure 9Impact of assumed updraft speed on (a) global mean radiative forcing −ΔF. (b) Cloud droplet concentration Nd. (c) Peak supersaturation during activation for a fixed salt mass spray rate (based on scenario 2; see the legend). Results for injected particle sizes (Ds=50, 100, and 200 nm) are shown. Panels (b) and (c) also show the values for the unperturbed case.
4.4 Direct radiative forcing
A recent study with three climate models found that direct forcing from injected salt aerosol may compete with or even exceed the indirect forcing in magnitude (Ahlm et al., 2017). We demonstrated (Sect. 4.2) that injecting particles with sizes Ds = 30–60 nm produces the greatest brightening for a given salt mass injected, and a forcing to offset doubled CO2 can be achieved with injection rates below 100 Tg yr−1 (dashed circle; Fig. 10a). These optimal particle sizes are much smaller than the dry modal diameters of 200, 260, and 880 nm for injected particles in the models used for the GeoMIP assessment of Ahlm et al. (2017). The magnitude of the heuristic model global direct forcing ΔFdirect (Sect. 2.7) is very small (<0.5 W m−2) for total salt mass injection rates of <100 Tg yr−1 (Fig. 10b). Indeed, generating W m−2 requires an order of magnitude greater mass injection rate than it does to produce the same forcing from MCB (compare Fig. 10a and b). Partanen et al. (2012) found a very small contribution of direct radiative forcing with Ds=100 nm because the same indirect forcing in this case was achieved with ∼ 5 times less injected mass than their case (5 × GEO) with Ds=200 nm, wherein direct forcing constituted about 30 % of the forcing.
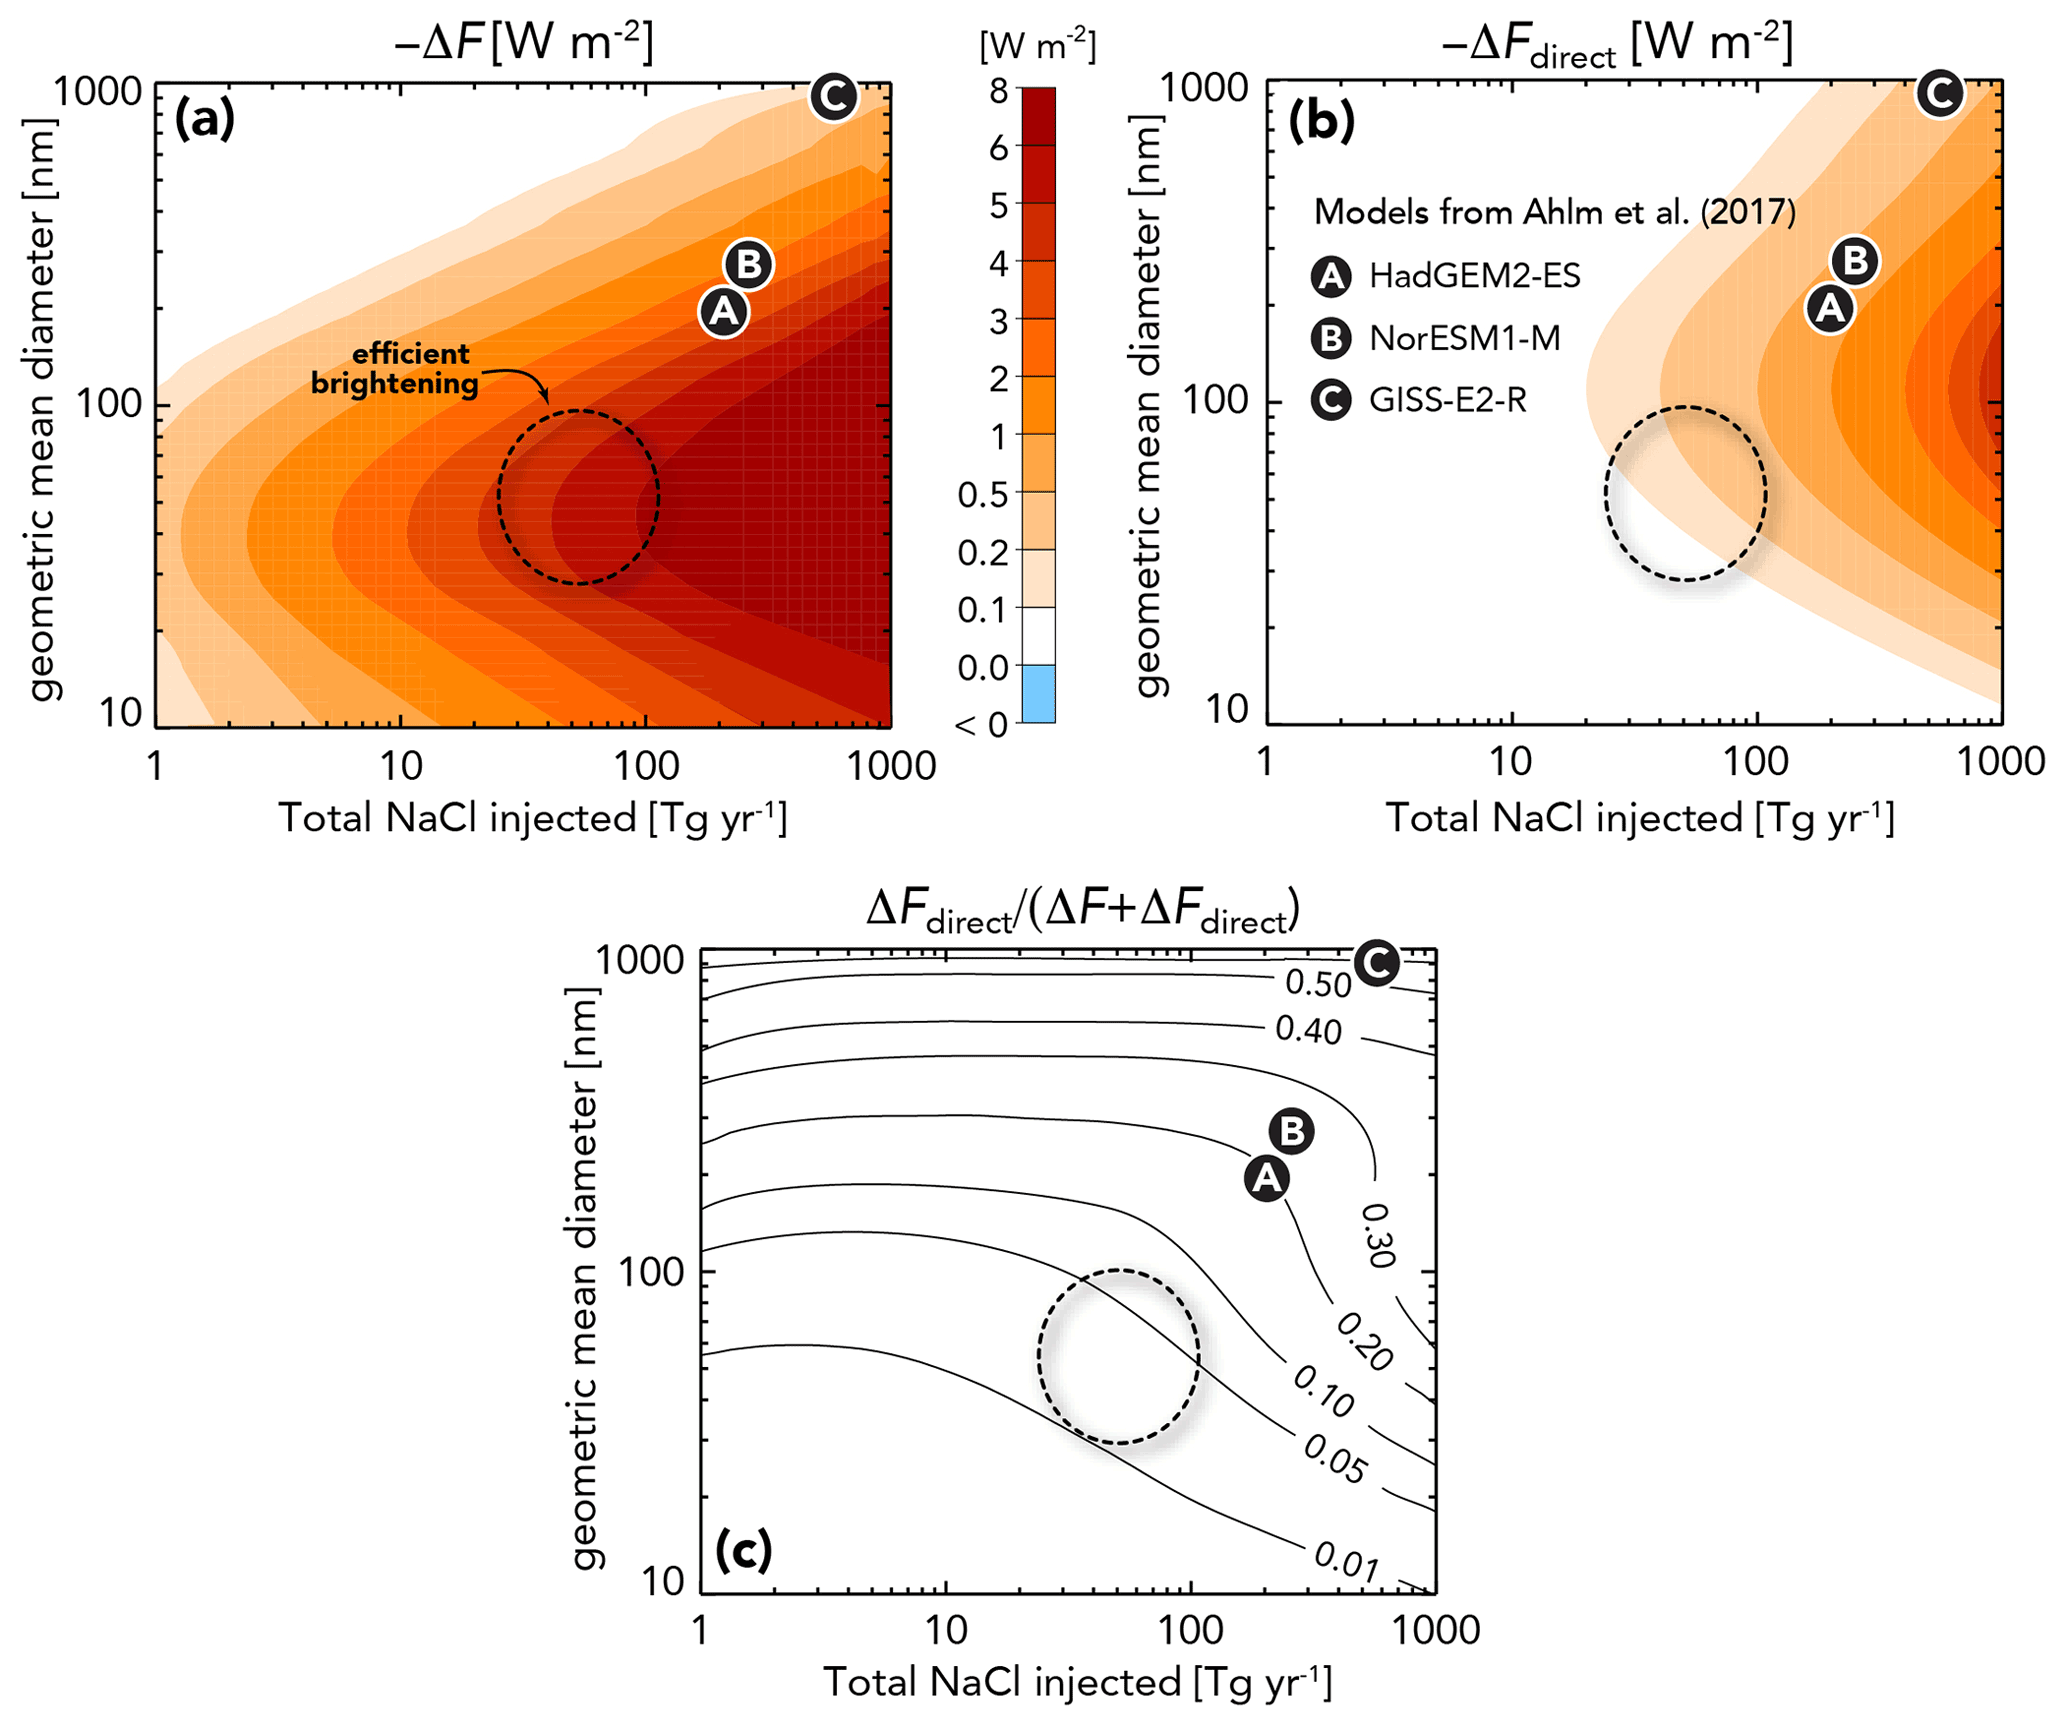
Figure 10Global mean radiative forcing from (a) aerosol–cloud interactions (i.e., marine cloud brightening) ΔF. (b) Direct radiative forcing of injected aerosol, ΔFdirect. (c) Ratio of direct to total radiative forcing, plotted as a function of the total salt injection rate, and the geometric mean diameter Ds of the injected aerosol. The number of sprayers, Nsprayers = 100 000, and all other parameters are the same as scenario 2 (see Fig. 5 and Sect. 4.1). The three models used in Ahlm et al. (2017) are shown (see the legend in panel b), although it should be noted that, for these models, injections were confined to the tropical belt (30∘ S–30∘ N).
The dry size Ds to maximize the direct forcing, for a given mass injection rate, is ∼ 110 nm (Fig. 10b), which is around twice as large as the optimal size for MCB. As we have seen (Figs. 6 and 7), producing significant cloud brightening for the Ds values in the models in Ahlm et al. (2017) requires much higher mass injection, and this leads to significant direct radiative forcing. Indeed, for Ds=880 nm, the brightening efficiency (Fig. 7) is so low that we would expect very little brightening for spray rates of several hundred teragrams per year (hereafter Tg yr−1), which is consistent with the very small increases in Nd for the model that injected particles of this size, despite an injection rate of 590 Tg yr−1. In conclusion, the results here demonstrate that marine cloud brightening is not very effective without clouds when consideration is given to the injection rates/sizes required to produce a significant radiative forcing from aerosol–cloud interactions.
The heuristic model results presented here, together with the assessment of LES studies, have implications that may help guide future work to test the concept of MCB to cool the Earth. Broadly speaking, these implications fall into the following three categories: guidance for the engineering development of particle injection (sprayer) systems, guidance for the design of climate model simulations to evaluate the feasibility of regional and global marine cloud brightening, and suggestions for future LES modeling.
5.1 Sprayer development considerations
The results presented in Sect. 4.1 suggest that, to produce global radiative forcing from MCB that offsets a significant fraction of the forcing from doubling CO2, many sprayers will be required. To keep the number to below ∼ 105, particle number injection rates of ∼ 1016 s−1 will be needed. Similar forcing can be achieved with fewer sprayers, but this will necessitate higher . This implies very high particle concentrations in the near field of the spray system. Taking the spray system to be a collection of nozzles arranged over some area, A0, spraying into an airflow, vflow, then the initial particle concentration N0 in the immediate wake of the sprayer is . The approach in Turco and Yu (1997) is used to model the downstream particle concentration, assuming a fixed coagulation kernel based on a particle diameter d=100 nm and vflow=10 m s−1. The coagulation kernel is not strongly dependent upon particle diameter for this size range (see Fig. 13.5 in Seinfeld and Pandis, 2003), so variations in injected dry size and the degree of hygroscopic swelling do not have major impacts. It is worth noting that seawater droplets ultimately yielding dry diameters in the effective range for MCB may be significantly larger and may coagulate somewhat more slowly. We consider a diluting slender plume based on the Gaussian plume dispersion, which yields a plume cross sectional area (and thus volume) that evolves with time t as . Here and tdil=1.2 s, with , where the plume widths at distance x downstream of the sprayer in the cross-wind and vertical directions are and , respectively. The constants Ry, ry, Rz, and rz are those for neutral stability conditions from Klug (1969), as reproduced in Table 18.3 of Seinfeld and Pandis (2003). Numerical simulations had to be performed because the solution does not allow for analytical integration.
Results of the coagulation–dilution calculations (Fig. 11a) indicate that there are relatively weak particle losses from coagulation until particle injection rates exceed ∼ 1016 s−1, above which loss rates grow sharply. Without dilution, there are large losses within the first 100 s for rates exceeding 1015 s−1, and for rates approaching 1017 s−1, most of the losses occur within the first 10 s. Dilution immediately downstream of the spray system is therefore most important for particle survival. The volume profile for these simulations is shown in Fig. 11b. We assume that particle concentration within the expanding plume is uniform, which is somewhat unrealistic because the edges of the plume will become more diluted at a faster rate than those in the center. A multi-shelled Gaussian plume model was employed in Stuart et al. (2013), and this appears to result in somewhat weaker loss rates than what we find, but the same general dependencies were found. There is a somewhat weaker dependence of the fraction of particles remaining on A0 than might be imagined (Fig. 11c), given that A0 determines the initial concentration of particles, and loss rates scale with N2. This is because it takes longer for turbulent eddies to penetrate a wider plume and mix ambient air into the plume core, so that larger A0 is associated with a longer dilution timescale tdil.
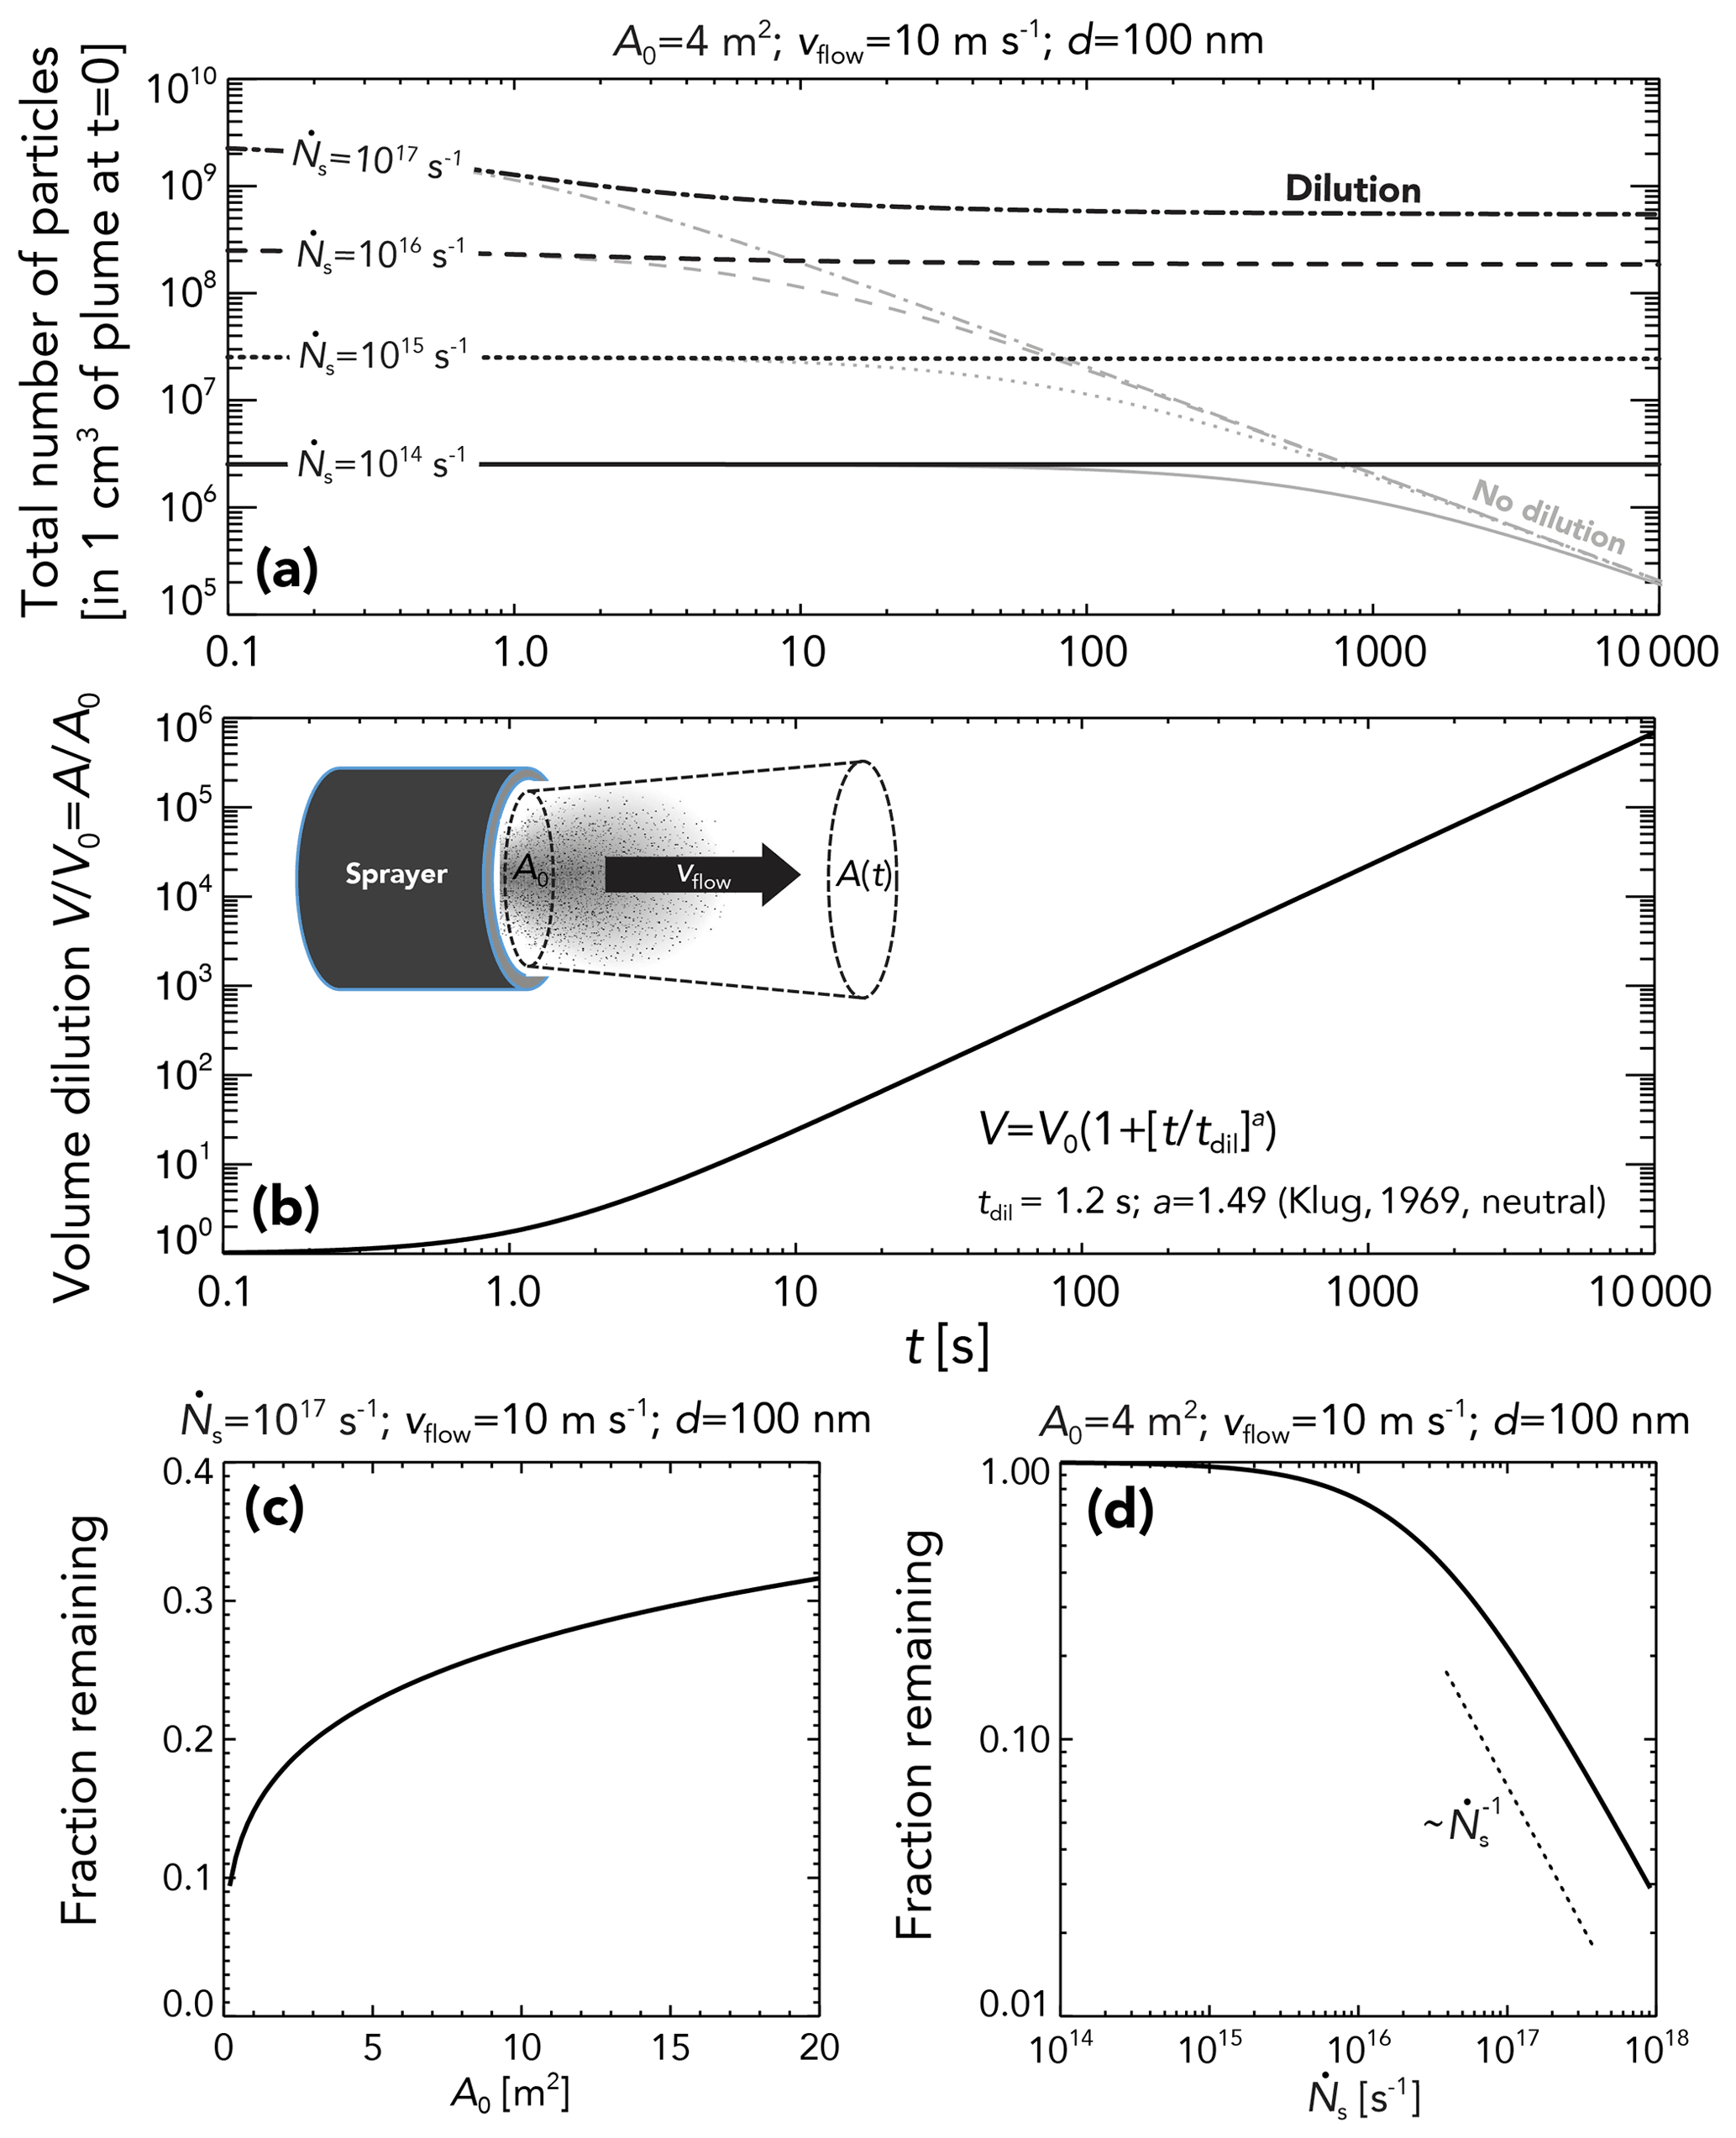
Figure 11Effects of coagulation on the concentration of particles at time t downstream of a hypothetical sprayer system with cross-sectional area A=4 m−2 and flow rate of air across the sprayer vflow=10 m s−1. Here, a single particle diameter d=100 nm is assumed, and solutions follow Turco and Yu (1997). (a) Particle concentrations with dilution proceeding according to the dispersion rates for neutral conditions are from Klug (1969), as reproduced in Seinfeld and Pandis (2006; their Table 18.3). Concentrations in the absence of plume dilution are shown for comparison (gray), indicating major losses and eventual asymptotic solution. (b) The ratio of volume V to initial volume V0 increases super-linearly with time with a dilution timescale tdil=1.2 s. (c) Fraction of particles remaining at t = 10 000 s as a function of initial plume cross-sectional area A0 for spray rate s−1. (d) Fraction of particles remaining at t = 10 000 s as a function of for A0=4 m2. The dotted line shows the scaling such that the fraction remaining decreases at the same rate as increases, i.e., there is no increase in far-field particle concentration with increasing sprayer output.
The strong dependence of coagulation losses on (Fig. 11d) indicates that, as rates approach 1017 s−1, the fraction of particles remaining decreases as rapidly as increases, which essentially means no increase in the far-field concentration as injection rates are further increased. Because this is not strongly sensitive to A0 (Fig. 11c), this imposes a limit (∼ 5 × 10¹⁶ s−1) on the maximum rate of particles that a ship-deployable spray system can provide to the far-field environment. Recall that the spray scenario to offset doubled CO2 forcing with 15 000 ships discussed in Sect. 4.1 requires a number injection rate that is at this upper limit of feasibility. More rapid dilution than can be provided by boundary layer turbulence may be possible in the first few seconds downstream of the spray system if the initial flow rate can be increased, but more sophisticated fluid and aerosol dynamics modeling will be required to determine the maximum far-field injection rates that a sprayer can provide.
5.2 Climate modeling
The results of this study have implications for both types of climate modeling MCB studies discussed in the introduction, namely those that fix Nd at some value in seeded regions and those that attempt to model aerosol–cloud interactions using salt aerosol injection.
The results presented in Sect. 4.1 demonstrate that there are diminishing returns on increasing Nd as spray rate increases (e.g., Fig. 5b). Producing cloud droplet concentrations of 1000 cm−3 is possible but requires mass injection rates approaching 1000 Tg yr−1 (compare Fig. 5a and b). Locally high mass injection rates would reduce the fractional area of the ocean required for spraying (see next paragraph), but it should be borne in mind that increasing Nd to 1000 cm−3, as has been done in some climate modeling studies (e.g., Rasch et al., 2009; Baughman et al., 2012), would increase the Brownian scavenging rate of interstitial injected aerosol and reduce the overall particle residence time τres, resulting in a reduced forcing (see Sect. 4.2; Fig. 6b). Increasing Nd from 300 to 1000 cm−3 reduces the Brownian scavenging timescale by a factor of over 2 (Seinfeld and Pandis 2003), suggesting that attempting to implement MCB with very high droplet concentrations may not be practical.
Several previous climate model studies have seeded a relatively small fraction of the ocean area. Jones et al. (2009) set = 375 cm−3 in three regions that total only 4.7 % of the ocean and achieved W m−2. The unperturbed Nd is not known for this study, so it is not possible to predict the Twomey forcing for this case using the heuristic model, but for fspray=0.1, a peak forcing of −1.4 W m−2 is achievable (Fig. 12), but achieving a forcing magnitude in excess of 1 W m−2 requires a mean Nd of over 800 cm−3 (rN∼8) in the seeded area. One can only conclude that either the unperturbed Nd in Jones et al. (2009) was very low, or that the model produced significant positive cloud adjustments that augmented the Twomey effect. Figure 12 suggests that global forcing magnitudes greater than ∼ 4 W m−2 from the Twomey effect alone are only likely to be possible if ∼ 50 % of the eligible ocean area (∼ 40 % of the total ocean area) is seeded.
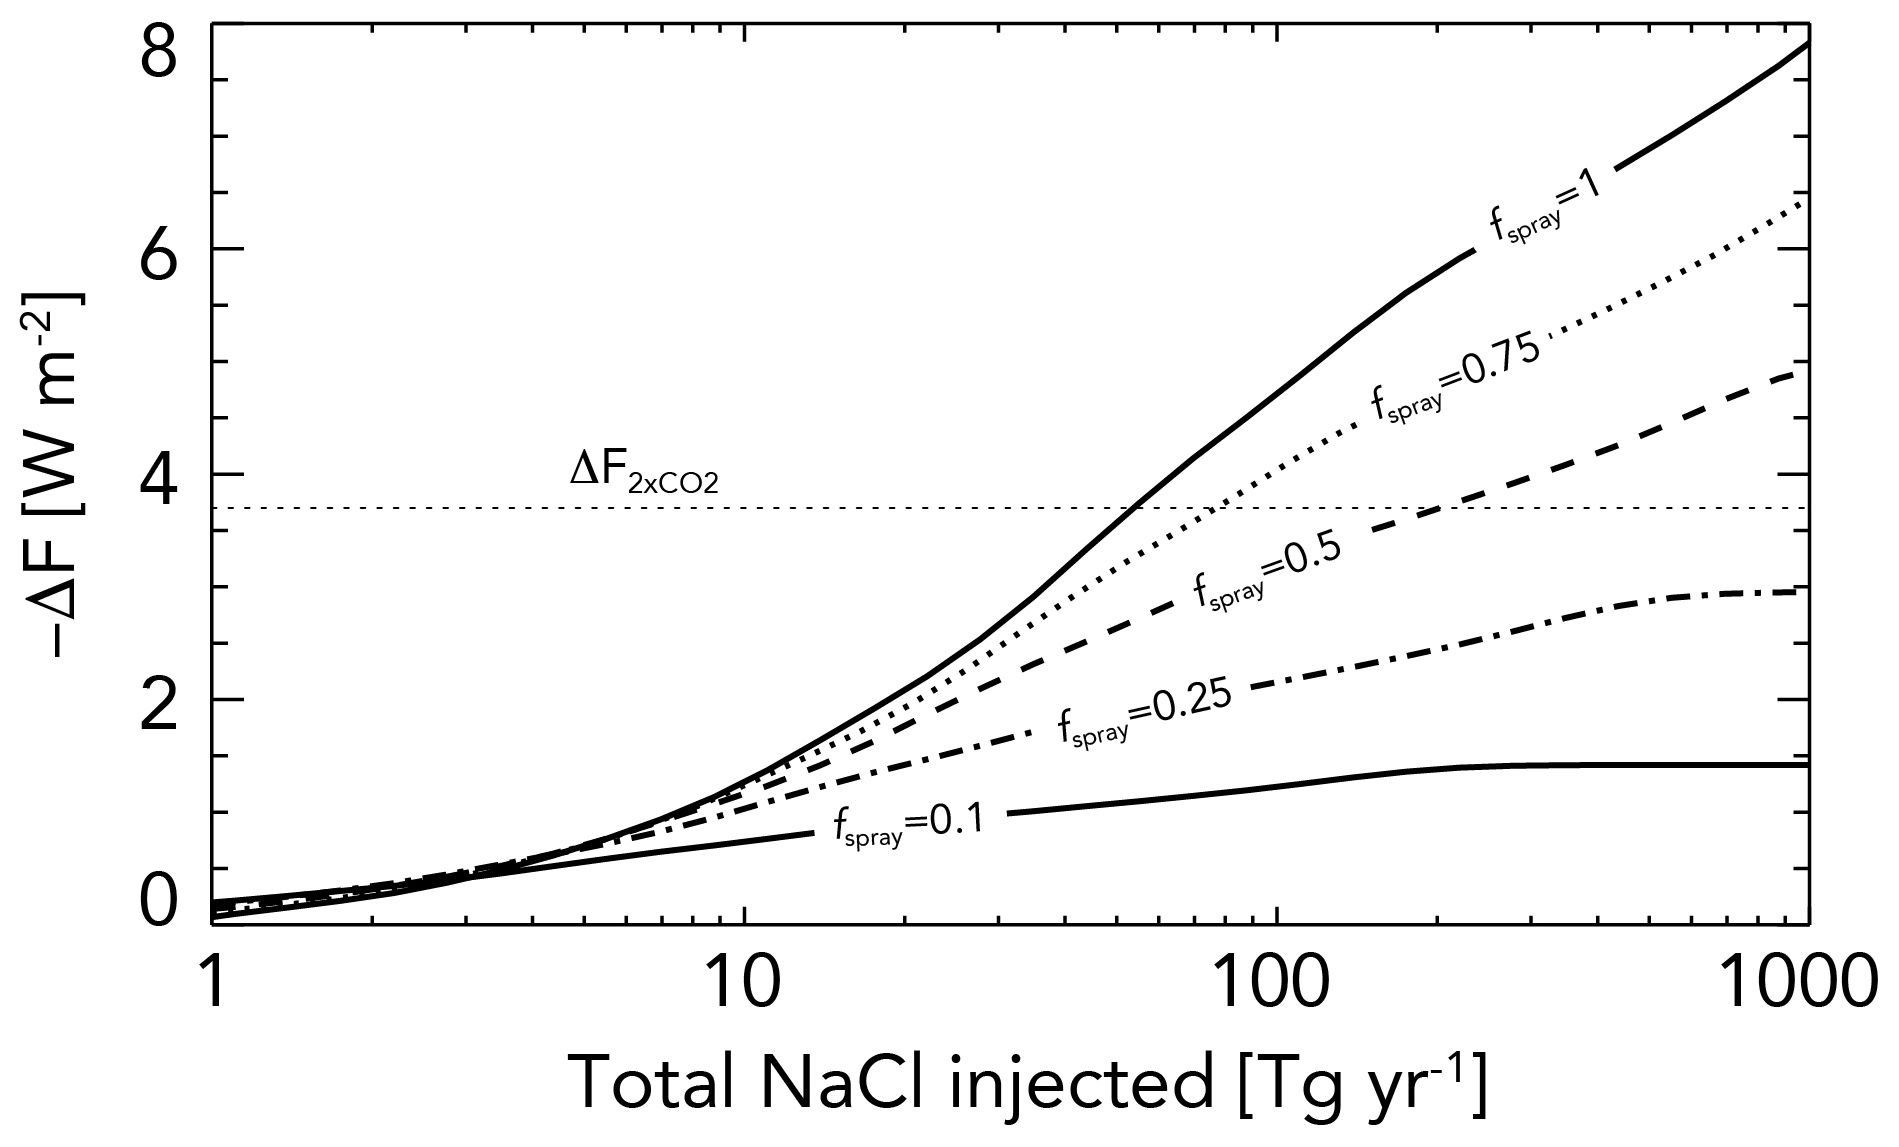
Figure 12Sensitivity of the radiative forcing to different fractions fspray of the eligible ocean where sprayers operate. Forcing is shown as a function of the total (global) rate of salt mass injection. The mass injected per sprayer is the same as that for scenario 2 (Sect. 4.1 and Fig. 5), and the sprayer density is the same in each case, i.e., the number of sprayers is proportional to fspray and is 100 000 for fspray=1. The geometric mean spray diameters are Ds=100 nm, and the background is cm−3. All other parameters are the same as those used in Fig. 5.
Climate modeling to investigate MCB by injecting surface salt sources has typically injected particles with Ds of 200 nm or greater (Alterskjær et al., 2012, 2013; Ahlm et al., 2017). The heuristic model sensitivity to injected particle size presented in Sect. 4.2 indicates that Ds=200 nm is inefficient (Fig. 7), requiring mass spray rates 5 times higher than for Ds=100 nm and over an order of magnitude higher than for Ds=50 nm (Fig. 6). This has led to mass spray rates in existing MCB studies of hundreds of Tg yr−1 (Ahlm et al., 2017), and these high mass spray rates produce significant direct radiative forcing (Ahlm et al., 2017). Our results suggest that smaller injected particles can yield global radiative forcing of −1 to −4 W m−2 with very little direct radiative forcing. Providing meaningful global radiative forcing using the aerosol direct effect is an extremely inefficient use of salt particles. We therefore suggest that future climate modeling should focus on smaller injected particles to build on the sensitivity study in Partanen et al. (2012). This may challenge some models because a dedicated injection particle mode independent of the model's accumulation mode will be required, and accurate treatment of activation for such cases is a major issue (see Sect. 4.2 and the Appendix).
5.3 Challenges for LES modeling
One notable feature of existing LES studies designed to test the sensitivity of albedo to particle injections (Sect. 3) is that all existing simulation experiments show some degree of brightening, although some do show cloud cover or condensate adjustments that partly offset the Twomey effect. In most cases, especially very clean conditions, cloud adjustments significantly augment Twomey brightening. No LES studies in the literature show domain-wide cloud adjustments that completely offset Twomey brightening. However, predicting cloud adjustments accurately is a challenge, even for LES models; some models do not represent the physical processes needed to produce the correct adjustments. Such processes include size-dependent droplet evaporation, which requires an estimation of supersaturation (many LESs assume saturation adjustment; see Wang et al., 2003) and sedimentation–entrainment feedback (e.g., Bretherton et al., 2007). Tests to establish the importance of these processes for determining susceptibility to particle injections are incomplete. In addition, existing LES studies represent only a small subset of possible meteorological conditions, focusing primarily upon shallow MBLs that are probably more susceptible to aerosol injections. Studies examining the susceptibility to particle injections of deeper trade wind MBLs, including aggregated shallow convective systems, need to be conducted to establish the efficacy of MCB in these regions.
It should be noted that most LES cases to test MCB are of insufficient duration to examine the responses at timescales longer than the injected particle residence time τres, which suggests that longer simulations will be necessary to evaluate the true radiative forcing from injections. Furthermore, no LES studies to date have attempted to constrain the injected particle residence time τres, which is a key determinant of MCB forcing (Sect. 4.2; Fig. 6b). The dependence of τres on precipitation, entrainment, in-cloud Brownian scavenging, and other factors warrants exploration using LESs. In addition, there are several potentially important feedbacks involving aerosol residence time that are ideal for study using LESs. First, it is well understood that MBL precipitation is a major sink of CCN (Wood et al., 2012; Zheng et al., 2018; Wang et al., 2021). Residence time is expected to be shorter in precipitating MBLs, and suppression of precipitation by high Nd in seeded clouds will increase τres (Wood et al., 2012), but increased cloud surface area will increase Brownian scavenging of injected particles, reducing τres. Precipitation suppression will also impact the background aerosol properties, including potentially increasing the concentration of coarse mode and giant CCN that may counter some of the Nd-driven precipitation suppression (Feingold et al., 1999). These feedback processes may affect aerosol residence time and MCB forcing in ways not accounted for in current analyses. Finally, deficiencies in some activation schemes used in LESs are likely to be a significant issue hindering accurate representation of the effects of injected particles smaller than 100 nm (Sect. 4.2; Appendix; Connolly et al., 2014), so it will be important to ensure that LES models can handle the activation process faithfully.
This study presents a simple heuristic model to produce useful quantitative estimates of the radiative forcing from the Twomey effect driven by salt particle injections over the global oceans (marine cloud brightening – MCB). The model includes a treatment of individual sprayer plumes and their overlap, and so it can be used to explore brightening as a function of the number of sprayers. Brightening is predicted using Twomey's albedo susceptibility given predicted increases in Nd from an activation look-up table derived using Lagrangian parcel modeling that incorporates both background and injected aerosol particle size distributions. Parameters for the model are constrained with observations of cloud cover and Nd from satellites, along with aerosol properties from syntheses of in situ observations. The model performs reasonably well in estimating the cloud brightening from a number of large eddy simulations (LESs) reported in the literature, although the LES cases tend to produce more brightening for clean unperturbed states and less for polluted states, likely because of cloud adjustments (changes in cloud cover and/or liquid water path in response to aerosols) that are not included in the heuristic model. The heuristic model is then used to estimate global radiative forcing from MCB and its sensitivity to injected particle spray rates and particle sizes. The key conclusions of the work are as follows.
Radiative forcing to offset doubled CO2 can be achieved with global mean salt spray rates of ∼ 50–70 Tg yr−1. This is much lower than the natural sea salt flux and much lower than spray rates used in global models, which have injected larger particles than are needed to efficiently brighten clouds. To produce this radiative forcing, a large number of sprayers (104–105) will be required to operate over the majority of the 54 % of the Earth's surface that is over ocean and remote from land.
Injected particles with geometric mean dry diameters of 30–60 nm are most efficient at brightening clouds for a fixed mass of salt injected.
There is no evidence for marine cloud darkening (positive radiative forcing) using the parcel-model-based activation scheme, although the Abdul-Razzak and Ghan (2000) parameterization incorrectly shows that this occurs for very high concentrations of small injected particles due to excessive competition for water vapor.
Competition for vapor effectively limits the maximum possible magnitude of radiative forcing from MCB to approximately 8 W m−2 for salt spray rates less than 1000 Tg yr−1, assuming all ocean regions are seeded. This assumes that negative cloud adjustments remain relatively small compared with the Twomey effect.
Heuristic model radiative forcing estimates are mostly within a factor of 3 of those from LESs, across a range of different spray and unperturbed conditions.
Brightening in the heuristic model and the LES decreases strongly with the aerosol/droplet concentrations in the unperturbed clouds, so it is critical to better understand and model the seasonal and geographical variations in these parameters in order to identify optimal locations and times for particle injections and to predict radiative forcing.
For injected particles with geometric mean dry diameters of ∼ 100 nm or more, there is relatively weak sensitivity to updraft speed for values larger than 0.2 m s−1.
Direct radiative forcing from injected particles is very small for mass injection rates less than 100 Tg yr−1. MCB is far less effective without clouds when consideration is given to the quantity of salt that must be injected.
To determine aerosol activation, an explicit Lagrangian parcel model is used to construct a five-dimensional look-up table that predicts peak supersaturation and the concentration of activated aerosol (cloud droplet concentration Nd) as a function of updraft speed w, the concentration Ns, and geometric mean dry diameter c of the injected particles, respectively, and the unperturbed particle concentrations of accumulation-mode N0,acc and coarse-mode N0,coarse particles. All other aerosol size and hygroscopicity parameters are fixed at their values in Table 1. The temperature and pressure are fixed at 280 K and 900 hPa, respectively. The Lagrangian parcel model is initialized just below cloud base, with a saturation ratio of 0.99, and is integrated to a height of 50 m above the saturation level. Particles are determined to be activated if they have reached a diameter of 2 µm at this height. Split time-stepping is used to render the integration stable for the very small sizes of some of the injected particles. The discretization of the dry size distribution is set for each case to provide an accurate estimate of the number of activated droplets. Parcel model simulations are produced for all 6468 permutations of the values of the five input parameters shown in Table A1. The injected particle concentrations Ns are set to be a function of Ds, such that the overall mass of injected particles is the same for a given value of the scaling factor (Table A1). A scaling factor of unity corresponds to an injected-mode mass loading of 1.2 µg mg−1. For the look-up table, basic linear interpolation in five dimensions is used to determine the droplet concentration and peak supersaturation for any given set of input variables w, Ds, Ns, N0,acc, and N0,coarse.
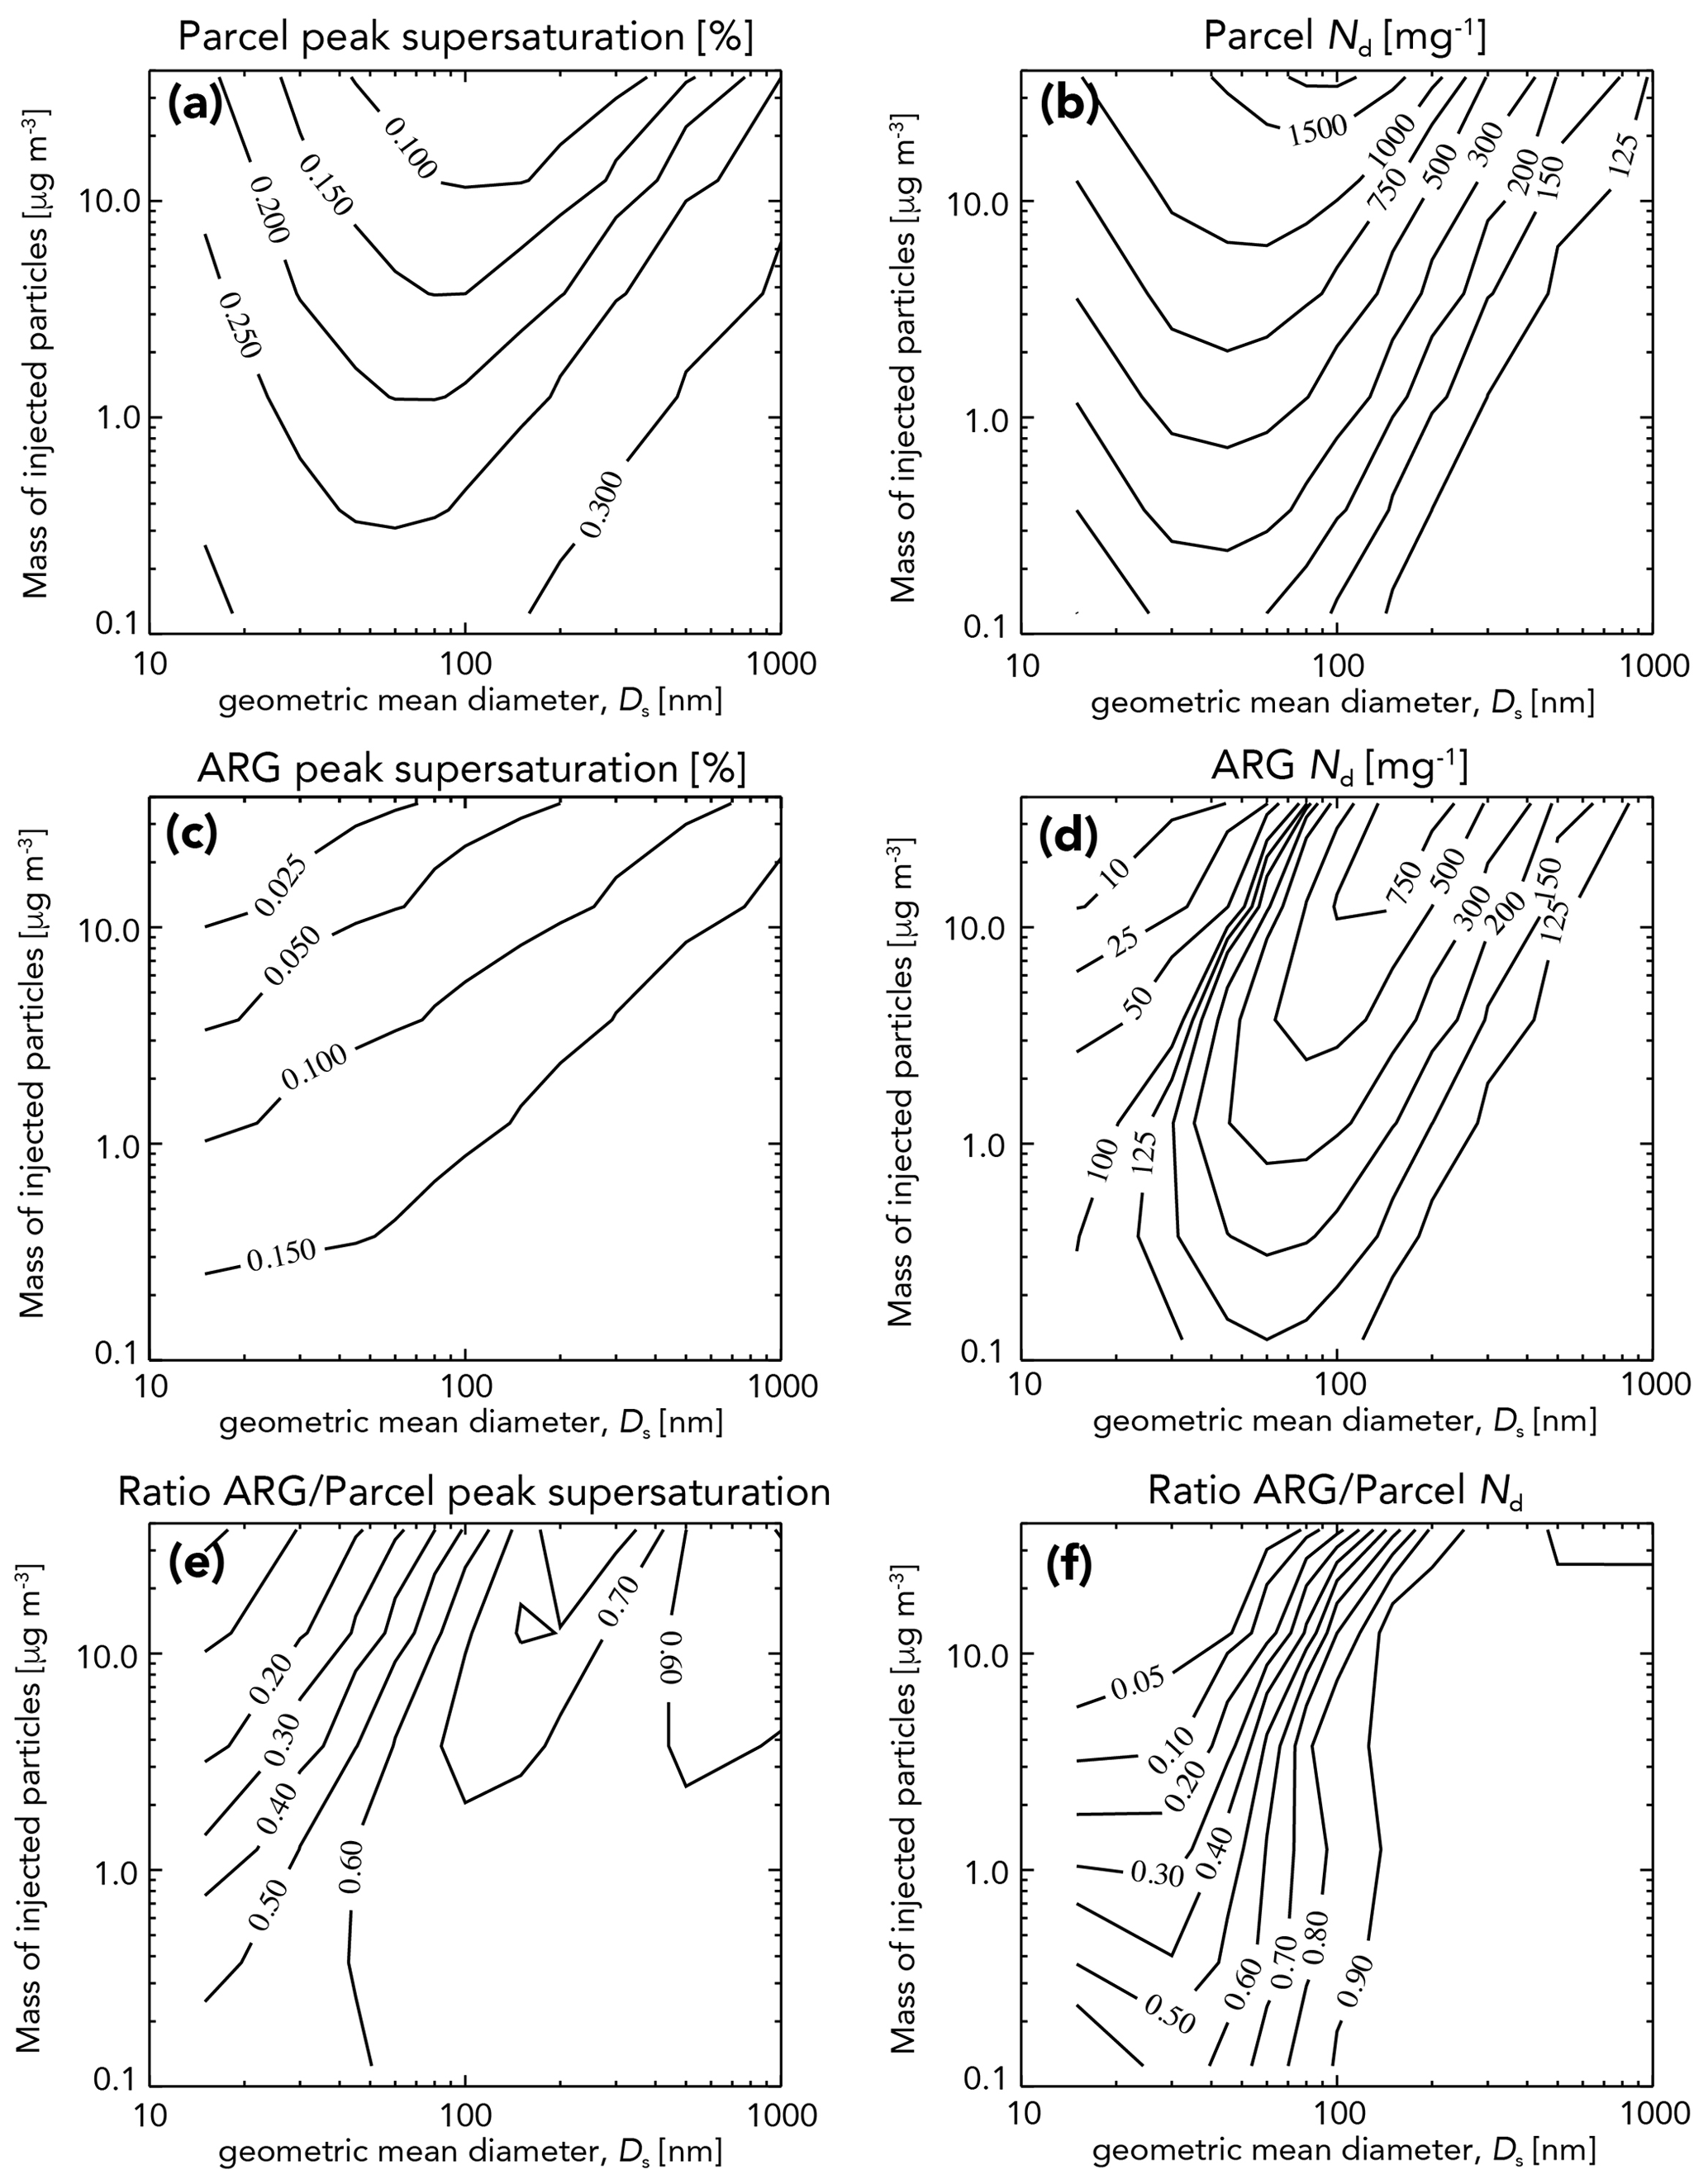
Figure A1Comparison of the parcel model and ARG peak supersaturations (a, c, e) and activated cloud droplet concentrations Nd (b, d, f) as a function of the injected particle geometric mean diameter Ds and the mass loading of injected particles. The other parameters are set as w=0.4 m s−1, mg−1, and mg−1 (base values used throughout the paper). Panels (a)–(b) show results from the parcel model, panels (c)–(d) from ARG, and panels (e)–(f) are the ratio of ARG to the parcel model.
Table A1Parameter values used to construct the activation look-up table.
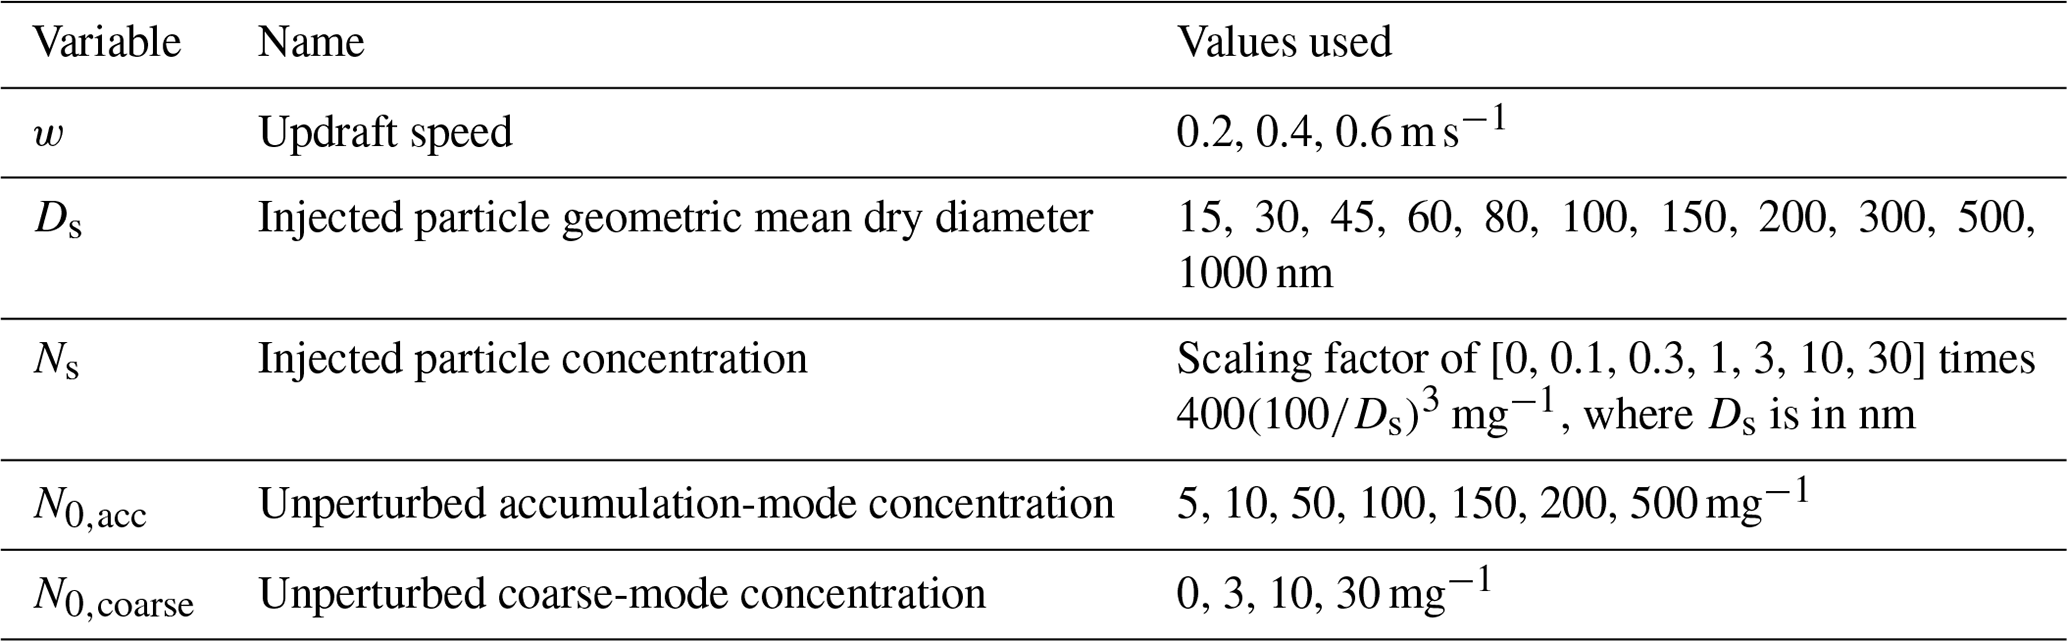
Figure A1 provides a comparison between the parcel model results and the ARG parameterization. In general, ARG significantly underpredicts the peak supersaturation (Fig. A1a, c, and e) in all cases. Despite this, there is good agreement between the parcel model and ARG droplet concentrations for Ds>200 nm. For this size range, the injected particles have critical supersaturations small enough that, despite the underprediction of peak supersaturation in ARG, it is sufficiently high to activate most injected particles. However, as Ds falls below 200 nm, the underprediction of peak supersaturation in ARG has increasingly severe consequences, and this is exacerbated at the highest mass loadings. For Ds=50 nm, ARG Nd is only around 50 % of that in the parcel model, and this underprediction falls rapidly as Ds falls further. Based on these findings, we conclude that the biases in ARG are too large for this parameterization to produce useful results.
All code and data used in this study are available on request from the author.
The author declares that there is no conflict of interest.
Publisher’s note: Copernicus Publications remains neutral with regard to jurisdictional claims in published maps and institutional affiliations.
This article is part of the special issue “Resolving uncertainties in solar geoengineering through multi-model and large-ensemble simulations (ACP/ESD inter-journal SI)”. It is not associated with a conference.
LESs were performed at the University of Washington by Peter Blossey and Je-Yun Chun, with assistance from Matthew Wyant. Sarah Doherty, Phil Rasch, Kelly Wanser, Tom Ackerman, Peter Blossey, Matthew Wyant, Ehsan Erfani, Je-Yun Chun, Armand Neukermans, Chris Bretherton, Gary Cooper, Sean Garner, Kate Murphy, Paul Connolly, and Michael Diamond are thanked for the discussions that have helped to frame and improve this work.
Support for this work was provided by the National Oceanographic and Atmospheric Administration (NOAA) award (grant no. NA20OAR4320271), an Earth's Radiation Budget program grant (NOAA CPO Climate & CI grant no. 03-01-07-001), and from Lowercarbon, the Pritzker Innovation Fund, and SilverLining, through the Marine Cloud Brightening Project.
This paper was edited by Michael Schulz and reviewed by two anonymous referees.
Abdul-Razzak, H. and Ghan, S. J.: A parameterization of aerosol activation: 2. Multiple aerosol types, J. Geophys. Res.-Atmos., 105, 6837–6844, 2000.
Ackerman, A. S., Toon, O. B., and Hobbs, P. V.: Numerical modeling of ship tracks produced by injections of cloud condensation nuclei into marine stratiform clouds, J. Geophys. Res., 100, 7121–7133, https://doi.org/10.1029/95JD00026, 1995.
Ackerman, A. S., Kirkpatrick, M. P., Stevens, D. E., and Toon, O. B.: The impact of humidity above stratiform clouds on indirect aerosol climate forcing, Nature, 432, 1014–1017, https://doi.org/10.1038/nature03174, 2004.
Ahlm, L., Jones, A., Stjern, C. W., Muri, H., Kravitz, B., and Kristjánsson, J. E.: Marine cloud brightening – as effective without clouds, Atmos. Chem. Phys., 17, 13071–13087, https://doi.org/10.5194/acp-17-13071-2017, 2017.
Albrecht, B. A.: Aerosols, Cloud Microphysics, and Fractional Cloudiness, Science, 245, 1227–1230, https://doi.org/10.1126/science.245.4923.1227, 1989.
Alterskjær, K., Kristjánsson, J. E., and Seland, Ø.: Sensitivity to deliberate sea salt seeding of marine clouds – observations and model simulations, Atmos. Chem. Phys., 12, 2795–2807, https://doi.org/10.5194/acp-12-2795-2012, 2012.
Alterskjær, K. and Kristjánsson, J. E.: The sign of the radiative forcing from marine cloud brightening depends on both particle size and injection amount, Geophys. Res. Lett., 40, 210–215, https://doi.org/10.1029/2012GL054286, 2013.
Andreae, M. O. and Rosenfeld, D.: Aerosol–cloud–precipitation interactions. Part 1. The nature and sources of cloud-active aerosols, Earth-Sci. Rev., 89, 13–41, https://doi.org/10.1016/j.earscirev.2008.03.001, 2008.
Archer, C. L. and Jacobson, M. Z.: Evaluation of global wind power, J. Geophys. Res., 110, D12110, https://doi.org/10.1029/2004JD005462, 2005.
Bala, G., Caldeira, K., Nemani, R., Cao, L., Ban-Weiss, G., and Shin, H.-J.: Albedo enhancement of marine clouds to counteract global warming: Impacts on the hydrological cycle, Clim. Dynam., 37, 915–931, https://doi.org/10.1007/s00382-010-0868-1, 2011.
Baughman, E., Gnanadesikan, A., Degaetano, A., and Adcroft, A.: Investigation of the Surface and Circulation Impacts of Cloud-Brightening Geoengineering, J. Climate, 25, 7527–7543, https://doi.org/10.1175/JCLI-D-11-00282.1, 2012.
Bellouin, N., Quaas, J., Gryspeerdt, E., Kinne, S., Stier, P., Watson-Parris, D., Boucher, O., Carslaw, K. S., Christensen, M., Daniau, A.-L., Dufresne, J.-L., Feingold, G., Fiedler, S., Forster, P., Gettelman, A., Haywood, J. M., Lohmann, U., Malavelle, F., Mauritsen, T., … Stevens, B.: Bounding Global Aerosol Radiative Forcing of Climate Change, Rev. Geophys., 58, e2019RG000660. https://doi.org/10.1029/2019RG000660, 2020.
Bender, F. A.-M., Charlson, R. J., Ekman, A. M. L., and Leahy, L. V.: Quantification of Monthly Mean Regional-Scale Albedo of Marine Stratiform Clouds in Satellite Observations and GCMs, J. Appl. Meteorol. Clim., 50, 2139–2148, https://doi.org/10.1175/JAMC-D-11-049.1, 2011.
Bennartz, R.: Global assessment of marine boundary layer cloud droplet number concentration from satellite, J. Geophys. Res., 112, D02201, https://doi.org/10.1029/2006JD007547, 2007.
Berner, A. H., Bretherton, C. S., and Wood, R.: Large eddy simulation of ship tracks in the collapsed marine boundary layer: a case study from the Monterey area ship track experiment, Atmos. Chem. Phys., 15, 5851–5871, https://doi.org/10.5194/acp-15-5851-2015, 2015.
Bohren, C. F. and Huffman, D. R.: Absorption and scattering of light by small particles, Wiley, New York, 544 pp., 1998.
Bretherton, C. S., Blossey, P. N., and Uchida, J.: Cloud droplet sedimentation, entrainment efficiency, and subtropical stratocumulus albedo. Geophys. Res. Lett., 34, L03813, https://doi.org/10.1029/2006GL027648, 2007.
Bretherton, C. S., Wood, R., George, R. C., Leon, D., Allen, G., and Zheng, X.: Southeast Pacific stratocumulus clouds, precipitation and boundary layer structure sampled along 20∘ S during VOCALS-REx, Atmos. Chem. Phys., 10, 10639–10654, https://doi.org/10.5194/acp-10-10639-2010, 2010.
Capaldo, K., Corbett, J. J., Kasibhatla, P., Fischbeck, P., and Pandis, S. N.: Effects of ship emissions on sulphur cycling and radiative climate forcing over the ocean, Nature, 400, 743–746, https://doi.org/10.1038/23438, 1999.
Carslaw, K. S., Lee, L. A., Reddington, C. L., Pringle, K. J., Rap, A., Forster, P. M., Mann, G. W., Spracklen, D. V., Woodhouse, M. T., Regayre, L. A., and Pierce, J. R.: Large contribution of natural aerosols to uncertainty in indirect forcing, Nature, 503, 67–71, https://doi.org/10.1038/nature12674, 2013.
Chosson, F., Paoli, R., and Cuenot, B.: Ship plume dispersion rates in convective boundary layers for chemistry models, Atmos. Chem. Phys., 8, 4841–4853, https://doi.org/10.5194/acp-8-4841-2008, 2008.
Chun, J.-Y., Wood, R., Blossey, P., and Wyant, M.: Large eddy simulations of salt tracks in shallow marine boundary layers: sensitivity to injected particle size, in preparation, 2021.
Coakley, J. A., Bernstein, R. L., and Durkee, P. A.: Effect of Ship-Stack Effluents on Cloud Reflectivity, Science, 237, 1020–1022, 1987.
Coakley Jr., J. A. and Walsh, C. D.: Limits to the aerosol indirect radiative effect derived from observations of ship tracks, J. Atmos. Sci., 59, 668–680, 2002.
Connolly, P. J., McFiggans, G. B., Wood, R., and Tsiamis, A.: Factors determining the most efficient spray distribution for marine cloud brightening, Philos. T. R. Soc. A, 372, 20140056, https://doi.org/10.1098/rsta.2014.0056, 2014.
Conover, J. H.: Anomalous Cloud Lines, J. Atmos. Sci., 23, 778–785, https://doi.org/10.1175/1520-0469(1966)023<0778:ACL>2.0.CO;2, 1966.
Cooper, G., Foster, J., Galbraith, L., Jain, S., Neukermans, A., and Ormond, B.: Preliminary results for salt aerosol production intended for marine cloud brightening, using effervescent spray atomization, Philos. T. R. Soc. A, 372, 20140055, https://doi.org/10.1098/rsta.2014.0055, 2014.
Diamond, M. S., Director, H. M., Eastman, R., Possner, A., and Wood, R.: Substantial Cloud Brightening from Shipping in Subtropical Low Clouds, AGU Advances, 1, e2019AV000111, https://doi.org/10.1029/2019AV000111, 2020.
Doelling, D. R., Loeb, N. G., Keyes, D. F., Nordeen, M. L., Morstad, D., Nguyen, C., Wielicki, B. A., Young, D. F., and Sun, M.: Geostationary Enhanced Temporal Interpolation for CERES Flux Products, J. Atmos. Ocean. Tech., 30, 1072–1090, https://doi.org/10.1175/JTECH-D-12-00136.1, 2013.
Durkee, P. A., Chartier, R. E., Brown, A., Trehubenko, E. J., Rogerson, S. D., Skupniewicz, C., Nielsen, K. E., Platnick, S., and King, M. D.: Composite ship track characteristics, J. Atmos. Sci., 57, 2542–2553, 2000.
Eyring, V., Isaksen, I. S. A., Berntsen, T., Collins, W. J., Corbett, J. J., Endresen, O., Grainger, R. G., Moldanova, J., Schlager, H., and Stevenson, D. S.: Transport impacts on atmosphere and climate: Shipping, Atmos. Environ., 44, 4735–4771, https://doi.org/10.1016/j.atmosenv.2009.04.059, 2010.
Feingold, G., Cotton, W. R., Kreidenweis, S. M., and Davis, J. T.: The impact of giant cloud condensation nuclei on drizzle formation in stratocumulus: Implications for cloud radiative properties, J. Atmos. Sci., 56, 4100–4117, 1999.
Ghan, S. J., Guzman, G., and Abdul-Razzak, H.: Competition between sea salt and sulfate particles as cloud condensation nuclei, J. Atmos. Sci., 55, 3340–3347, https://doi.org/10.1175/1520-0469(1998)055<3340:CBSSAS>2.0.CO;2, 1998.
Ghan, S. J., Abdul-Razzak, H., Nenes, A., Ming, Y., Liu, X., Ovchinnikov, M., Shipway, B., Meskhidze, N., Xu, J., and Shi, X.: Droplet nucleation: Physically-based parameterizations and comparative evaluation, J. Adv. Model. Earth Sy., 3, M10001, https://doi.org/10.1029/2011MS000074, 2011.
Glassmeier, F., Hoffmann, F., Johnson, J. S., Yamaguchi, T., Carslaw, K. S., and Feingold, G.: Aerosol-cloud-climate cooling overestimated by ship-track data, Science, 371, 485–489, https://doi.org/10.1126/science.abd3980, 2021.
Gryspeerdt, E., Quaas, J., and Bellouin, N.: Constraining the aerosol influence on cloud fraction, J. Geophys. Res.-Atmos., 121, 3566–3583, https://doi.org/10.1002/2015JD023744, 2016.
Gryspeerdt, E., Goren, T., and Smith, T. W. P.: Observing the timescales of aerosol–cloud interactions in snapshot satellite images, Atmos. Chem. Phys., 21, 6093–6109, https://doi.org/10.5194/acp-21-6093-2021, 2021.
Grythe, H., Ström, J., Krejci, R., Quinn, P., and Stohl, A.: A review of sea-spray aerosol source functions using a large global set of sea salt aerosol concentration measurements, Atmos. Chem. Phys., 14, 1277–1297, https://doi.org/10.5194/acp-14-1277-2014, 2014.
Hahn, C. J. and Warren, S. G.: A Gridded Climatology of Clouds over Land (1971–1996) and Ocean (1954–2008) from Surface Observations Worldwide, Numeric Data Package NDP-026E, 2007 (updated 2009), CDIAC, Department of Energy, Oak Ridge, Tennessee, available at: https://cdiac.ess-dive.lbl.gov/epubs/ndp/ndp026e/ndp026e.html (last access: 30 September 2021), 2007.
Hartmann, D. L. and Short, D. A.: On the Use of Earth Radiation Budget Statistics for Studies of Clouds and Climate, J. Atmos. Sci., 37, 1233–1250, https://doi.org/10.1175/1520-0469(1980)037<1233:OTUOER>2.0.CO;2, 1980.
Heffter, J. L.: The Variation of Horizontal Diffusion Parameters with Time for Travel Periods of One Hour or Longer, J. Appl. Meteorol., 4, 153–156, https://doi.org/10.1175/1520-0450(1965)004<0153:TVOHDP>2.0.CO;2, 1965.
Heintzenberg, J., Covert, D. C., and Van Dingenen, R.: Size distribution and chemical composition of marine aerosols: A compilation and review, Tellus B, 52, 1104–1122, 2000.
Hindman, E. E., Porch, W. M., Hudson, J. G., and Durkee, P. A.: Ship-produced cloud lines of 13 July 1991, Atmos. Environ., 28, 3393–3403, https://doi.org/10.1016/1352-2310(94)00171-G, 1994.
Hobbs, P. V., Garrett, T. J., Ferek, R. J., Strader, S. R., Hegg, D. A., Frick, G. M., Hoppel, W. A., Gasparovic, R. F., Russell, L. M., Johnson, D. W., O'Dowd, C., Durkee, P. A., Nielsen, K. E., and Innis, G.: Emissions from ships with respect to their effects on clouds, J. Atmos. Sci., 57, 2570–2590, 2000.
Hoffmann, F. and Feingold, G.: Cloud Microphysical Implications for Marine Cloud Brightening: The Importance of the Seeded Particle Size Distribution, J. Atmos. Sci., https://doi.org/10.1175/JAS-D-21-0077.1, online first, 2021.
Horowitz, H. M., Holmes, C., Wright, A., Sherwen, T., Wang, X., Evans, M., Huang, J., Jaeglé, L., Chen, Q., Zhai, S., and Alexander, B.: Effects of Sea Salt Aerosol Emissions for Marine Cloud Brightening on Atmospheric Chemistry: Implications for Radiative Forcing, Geophys. Res. Lett., 47, e2019GL085838, https://doi.org/10.1029/2019GL085838, 2020.
Isaksen, I. S. A., Granier, C., Myhre, G., Berntsen, T. K., Dalsøren, S. B., Gauss, M., Klimont, Z., Benestad, R., Bousquet, P., Collins, W., Cox, T., Eyring, V., Fowler, D., Fuzzi, S., Jöckel, P., Laj, P., Lohmann, U., Maione, M., Monks, P., Prevot, A. S. H., Raes, F., Richter, A., Rognerud, B., Schulz, M., Shindell, D., Stevenson, D. S., Storelvmo, T., Wang, W.-C., van Weele, M., Wild, M., and Wuebbles, D.: Atmospheric composition change: Climate–Chemistry interactions, Atmos. Environ., 43, 5138–5192, https://doi.org/10.1016/j.atmosenv.2009.08.003, 2009.
Jaeglé, L., Quinn, P. K., Bates, T. S., Alexander, B., and Lin, J.-T.: Global distribution of sea salt aerosols: new constraints from in situ and remote sensing observations, Atmos. Chem. Phys., 11, 3137–3157, https://doi.org/10.5194/acp-11-3137-2011, 2011.
Jenkins, A. K. L., Forster, P. M., and Jackson, L. S.: The effects of timing and rate of marine cloud brightening aerosol injection on albedo changes during the diurnal cycle of marine stratocumulus clouds, Atmos. Chem. Phys., 13, 1659–1673, https://doi.org/10.5194/acp-13-1659-2013, 2013.
Jones, A., Haywood, J., and Boucher, O.: Climate impacts of geoengineering marine stratocumulus clouds, J. Geophys. Res., 114, D10106, https://doi.org/10.1029/2008JD011450, 2009.
Klug, W.: A method for determining diffusion conditions from synoptic observations, Staub-Reinhalt. Luft, 29, 14–20, 1969.
Latham, J.: Control of global warming?, Nature, 347, 339–340, https://doi.org/10.1038/347339b0, 1990.
Latham, J., Rasch, P., Chen, C.-C., Kettles, L., Gadian, A., Gettelman, A., Morrison, H., Bower, K., and Choularton, T.: Global Temperature Stabilization via Controlled Albedo Enhancement of Low-Level Maritime Clouds, Philos. T. R. Soc. A, 366, 1882, 3969–3987, https://doi.org/10.1098/rsta.2008.0137, 2008.
Latham, J., Bower, K., Choularton, T., Coe, H., Connolly, P., Cooper, G., Craft, T., Foster, J., Gadian, A., Galbraith, L., Iacovides, H., Johnston, D., Launder, B., Leslie, B., Meyer, J., Neukermans, A., Ormond, B., Parkes, B., Rasch, P., Rush, J., Salter, S., Stevenson, T., Wang, H., Wang, Q., and Wood, R.: Marine cloud brightening, Philos. T. R. Soc. A, 370, 4217–4262, https://doi.org/10.1098/rsta.2012.0086, 2012.
Lauer, A., Eyring, V., Hendricks, J., Jöckel, P., and Lohmann, U.: Global model simulations of the impact of ocean-going ships on aerosols, clouds, and the radiation budget, Atmos. Chem. Phys., 7, 5061–5079, https://doi.org/10.5194/acp-7-5061-2007, 2007.
Lohmann, U. and Feichter, J.: Global indirect aerosol effects: a review, Atmos. Chem. Phys., 5, 715–737, https://doi.org/10.5194/acp-5-715-2005, 2005.
Malavelle, F. F., Haywood, J. M., Jones, A., Gettelman, A., Clarisse, L., Bauduin, S., Allan, R. P., Karset, I. H. H., Kristjánsson, J. E., Oreopoulos, L., Cho, N., Lee, D., Bellouin, N., Boucher, O., Grosvenor, D. P., Carslaw, K. S., Dhomse, S., Mann, G. W., Schmidt, A., Coe, H., Hartley, M. E., Dalvi, M., Hill, A. A., Johnson, B. T., Johnson, C. E., Knight, J. R., O'Connor, F. M., Partridge, D. G., Stier, P., Myhre, G., Platnick, S., Stephens, G. L., Takahashi, H., and Thordarson, T.: Strong constraints on aerosol–cloud interactions from volcanic eruptions, Nature, 546, 485–491, https://doi.org/10.1038/nature22974, 2017.
McFiggans, G., Artaxo, P., Baltensperger, U., Coe, H., Facchini, M. C., Feingold, G., Fuzzi, S., Gysel, M., Laaksonen, A., Lohmann, U., Mentel, T. F., Murphy, D. M., O'Dowd, C. D., Snider, J. R., and Weingartner, E.: The effect of physical and chemical aerosol properties on warm cloud droplet activation, Atmos. Chem. Phys., 6, 2593–2649, https://doi.org/10.5194/acp-6-2593-2006, 2006.
National Research Council: Climate Intervention: Reflecting Sunlight to Cool Earth, The National Academies Press, Washington, DC, https://doi.org/10.17226/18988, 2015.
Nicholls, S. and Leighton, J.: An observational study of the structure of stratiform cloud sheets: Part I. Structure, Q. J. Roy. Meteor. Soc., 112, 431–460, 1986.
Partanen, A.-I., Kokkola, H., Romakkaniemi, S., Kerminen, V.-M., Lehtinen, K. E. J., Bergman, T., Arola, A., and Korhonen, H.: Direct and indirect effects of sea spray geoengineering and the role of injected particle size, J. Geophys. Res.-Atmos., 117, D02203, https://doi.org/10.1029/2011JD016428, 2012.
Partanen, A. I., Laakso, A., Schmidt, A., Kokkola, H., Kuokkanen, T., Pietikäinen, J.-P., Kerminen, V.-M., Lehtinen, K. E. J., Laakso, L., and Korhonen, H.: Climate and air quality trade-offs in altering ship fuel sulfur content, Atmos. Chem. Phys., 13, 12059–12071, https://doi.org/10.5194/acp-13-12059-2013, 2013.
Peters, K., Stier, P., Quaas, J., and Graßl, H.: Aerosol indirect effects from shipping emissions: sensitivity studies with the global aerosol-climate model ECHAM-HAM, Atmos. Chem. Phys., 12, 5985–6007, https://doi.org/10.5194/acp-12-5985-2012, 2012.
Petters, M. D. and Kreidenweis, S. M.: A single parameter representation of hygroscopic growth and cloud condensation nucleus activity, Atmos. Chem. Phys., 7, 1961–1971, https://doi.org/10.5194/acp-7-1961-2007, 2007.
Platnick, S. and Twomey, S.: Determining the Susceptibility of Cloud Albedo to Changes in Droplet Concentration with the Advanced Very High Resolution Radiometer, J. Appl. Meteorol., 33, 334–347, https://doi.org/10.1175/1520-0450(1994)033<0334:DTSOCA>2.0.CO;2, 1994.
Possner, A., Wang, H., Wood, R., Caldeira, K., and Ackerman, T. P.: The efficacy of aerosol–cloud radiative perturbations from near-surface emissions in deep open-cell stratocumuli, Atmos. Chem. Phys., 18, 17475–17488, https://doi.org/10.5194/acp-18-17475-2018, 2018.
Possner, A., Eastman, R., Bender, F., and Glassmeier, F.: Deconvolution of boundary layer depth and aerosol constraints on cloud water path in subtropical stratocumulus decks, Atmos. Chem. Phys., 20, 3609–3621, https://doi.org/10.5194/acp-20-3609-2020, 2020.
Pringle, K. J., Tost, H., Pozzer, A., Pöschl, U., and Lelieveld, J.: Global distribution of the effective aerosol hygroscopicity parameter for CCN activation, Atmos. Chem. Phys., 10, 5241–5255, https://doi.org/10.5194/acp-10-5241-2010, 2010.
Ramanathan, V., Cess, R. D., Harrison, E. F., Minnis, P., Barkstrom, B. R., Ahmad, E., and Hartmann, D.: Cloud-Radiative Forcing and Climate: Results from the Earth Radiation Budget Experiment, Science, 243, 57–63, https://doi.org/10.1126/science.243.4887.57, 1989.
Rasch, P. J., Latham, J., and Chen, C.-C.: Geoengineering by Cloud Seeding: Influence on Sea Ice and Climate System, Environ. Res. Lett., 4, 045112, https://doi.org/10.1088/1748-9326/4/4/045112, 2009.
Salter, S., Sortino G., and Latham, J.: Sea-going hardware for the cloud albedo method of reversing global warming, Philos. T. R. Soc. A, 366, 2989–4006, 2008.
Schreier, M., Mannstein, H., Eyring, V., and Bovensmann, H.: Global ship track distribution and radiative forcing from 1 year of AATSR data, Geophys. Res. Lett., 34, L17814, https://doi.org/10.1029/2007GL030664, 2007.
Schulz, M., Textor, C., Kinne, S., Balkanski, Y., Bauer, S., Berntsen, T., Berglen, T., Boucher, O., Dentener, F., Guibert, S., Isaksen, I. S. A., Iversen, T., Koch, D., Kirkevåg, A., Liu, X., Montanaro, V., Myhre, G., Penner, J. E., Pitari, G., Reddy, S., Seland, Ø., Stier, P., and Takemura, T.: Radiative forcing by aerosols as derived from the AeroCom present-day and pre-industrial simulations, Atmos. Chem. Phys., 6, 5225–5246, https://doi.org/10.5194/acp-6-5225-2006, 2006.
Seinfeld, J. H. and Pandis, S. N.: Atmospheric Chemistry and Physics: From Air Pollution to Climate Change, 2nd Edn., John Wiley and Sons, Inc., Hoboken, New Jersey, 1203 pp., 2003.
Simpson, E., Connolly, P., and McFiggans, G.: An investigation into the performance of four cloud droplet activation parameterisations, Geosci. Model Dev., 7, 1535–1542, https://doi.org/10.5194/gmd-7-1535-2014, 2014.
Slingo, A.: Sensitivity of the Earth's radiation budget to changes in low clouds, Nature, 343, 49–51, https://doi.org/10.1038/343049a0, 1990.
Snider, J. R., Guibert, S., Brenguier, J.-L., and Putaud, J.-P.: Aerosol activation in marine stratocumulus clouds: 2. Köhler and parcel theory closure studies, J. Geophys. Res.-Atmos., 108, 8629, https://doi.org/10.1029/2002JD002692, 2003.
Sorooshian, A., Feingold, G., Lebsock, M. D., Jiang, H., and Stephens, G. L.: Deconstructing the precipitation susceptibility construct: Improving methodology for aerosol-cloud precipitation studies, J. Geophys. Res., 115, D17201, https://doi.org/10.1029/2009JD013426, 2010.
Stephens, G. L.: Radiation Profiles in Extended Water Clouds. I: Theory, J. Atmos. Sci., 35, 2111–2122, https://doi.org/10.1175/1520-0469(1978)035<2111:RPIEWC>2.0.CO;2, 1978.
Stjern, C. W., Muri, H., Ahlm, L., Boucher, O., Cole, J. N. S., Ji, D., Jones, A., Haywood, J., Kravitz, B., Lenton, A., Moore, J. C., Niemeier, U., Phipps, S. J., Schmidt, H., Watanabe, S., and Kristjánsson, J. E.: Response to marine cloud brightening in a multi-model ensemble, Atmos. Chem. Phys., 18, 621–634, https://doi.org/10.5194/acp-18-621-2018, 2018.
Stuart, G. S., Stevens, R. G., Partanen, A.-I., Jenkins, A. K. L., Korhonen, H., Forster, P. M., Spracklen, D. V., and Pierce, J. R.: Reduced efficacy of marine cloud brightening geoengineering due to in-plume aerosol coagulation: parameterization and global implications, Atmos. Chem. Phys., 13, 10385–10396, https://doi.org/10.5194/acp-13-10385-2013, 2013.
Tang, I. N.: Chemical and size effects of hygroscopic aerosols on light scattering coefficients, J. Geophys. Res.-Atmos., 101, 19245–19250, https://doi.org/10.1029/96JD03003, 1996.
Textor, C., Schulz, M., Guibert, S., Kinne, S., Balkanski, Y., Bauer, S., Berntsen, T., Berglen, T., Boucher, O., Chin, M., Dentener, F., Diehl, T., Easter, R., Feichter, H., Fillmore, D., Ghan, S., Ginoux, P., Gong, S., Grini, A., Hendricks, J., Horowitz, L., Huang, P., Isaksen, I., Iversen, I., Kloster, S., Koch, D., Kirkevåg, A., Kristjansson, J. E., Krol, M., Lauer, A., Lamarque, J. F., Liu, X., Montanaro, V., Myhre, G., Penner, J., Pitari, G., Reddy, S., Seland, Ø., Stier, P., Takemura, T., and Tie, X.: Analysis and quantification of the diversities of aerosol life cycles within AeroCom, Atmos. Chem. Phys., 6, 1777–1813, https://doi.org/10.5194/acp-6-1777-2006, 2006.
Terai, C. R., Wood, R., and Kubar, T. L.: Satellite estimates of precipitation susceptibility in low-level marine stratiform clouds, J. Geophys. Res.-Atmos., 120, 8878–8889, https://doi.org/10.1002/2015JD023319, 2015.
Toll, V., Christensen, M., Quaas, J., and Bellouin, N.: Weak average liquid-cloud-water response to anthropogenic aerosols, Nature, 572, 51–55, https://doi.org/10.1038/s41586-019-1423-9, 2019.
Trofimov, H., Bellouin, N., and Toll, V.: Large-Scale Industrial Cloud Perturbations Confirm Bidirectional Cloud Water Responses to Anthropogenic Aerosols, J. Geophys. Res.-Atmos., 125, e2020JD032575, https://doi.org/10.1029/2020JD032575, 2020.
Turco, R. P. and Yu, F.: Aerosol invariance in expanding coagulating plumes, Geophys. Res. Lett., 24, 1223–1226, https://doi.org/10.1029/97GL01092, 1997.
Twomey, S.: Pollution and the planetary albedo, Atmos. Environ., 8, 1251–1256, 1974.
Twomey, S.: The Influence of Pollution on the Shortwave Albedo of Clouds, J. Atmos. Sci., 34, 1149–1152, https://doi.org/10.1175/1520-0469(1977)034<1149:TIOPOT>2.0.CO;2, 1977.
Wang, H., Rasch, P. J., and Feingold, G.: Manipulating marine stratocumulus cloud amount and albedo: a process-modelling study of aerosol-cloud-precipitation interactions in response to injection of cloud condensation nuclei, Atmos. Chem. Phys., 11, 4237–4249, https://doi.org/10.5194/acp-11-4237-2011, 2011.
Wang, S., Wang, Q., and Feingold, G.: Turbulence, condensation, and liquid water transport in numerically simulated nonprecipitating stratocumulus clouds, J. Atmos. Sci., 60, 262–278, 2003.
Wang, Y., Xia, W., Liu, X., Xie, S., Lin, W., Tang, Q., Ma, H.-Y., Jiang, Y., Wang, B., and Zhang, G. J.: Disproportionate control on aerosol burden by light rain, Nat. Geosci., 14, 72–76, https://doi.org/10.1038/s41561-020-00675-z, 2021.
Wex, H., McFiggans, G., Henning, S., and Stratmann, F.: Influence of the external mixing state of atmospheric aerosol on derived CCN number concentrations, Geophys. Res. Lett., 37, L10805, https://doi.org/10.1029/2010GL043337, 2010.
Wood, R.: Drizzle in Stratiform Boundary Layer Clouds. Part I: Vertical and Horizontal Structure, J. Atmos. Sci., 62, 3011–3033, https://doi.org/10.1175/JAS3529.1, 2005.
Wood, R.: Cancellation of Aerosol Indirect Effects in Marine Stratocumulus through Cloud Thinning, J. Atmos. Sci., 64, 2657–2669, https://doi.org/10.1175/JAS3942.1, 2007.
Wood, R., Leon, D., Lebsock, M., Snider, J., and Clarke, A. D.: Precipitation driving of droplet concentration variability in marine low clouds, J. Geophys. Res.-Atmos., 117, D19210, https://doi.org/10.1029/2012JD018305, 2012.
Zelinka, M. D., Andrews, T., Forster, P. M., and Taylor, K. E.: Quantifying components of aerosol-cloud-radiation interactions in climate models, J. Geophys. Res.-Atmos., 119, 7599–7615, https://doi.org/10.1002/2014JD021710, 2014.
Zheng, G., Wang, Y., Aiken, A. C., Gallo, F., Jensen, M. P., Kollias, P., Kuang, C., Luke, E., Springston, S., Uin, J., Wood, R., and Wang, J.: Marine boundary layer aerosol in the eastern North Atlantic: seasonal variations and key controlling processes, Atmos. Chem. Phys., 18, 17615–17635, https://doi.org/10.5194/acp-18-17615-2018, 2018.
Zheng, Y., Rosenfeld, D., and Li, Z.: Quantifying cloud base updraft speeds of marine stratocumulus from cloud top radiative cooling, Geophys. Res. Lett., 43, 11407–11413, https://doi.org/10.1002/2016GL071185, 2016.
Zieger, P., Väisänen, O., Corbin, J. C., Partridge, D. G., Bastelberger, S., Mousavi-Fard, M., Rosati, B., Gysel, M., Krieger, U. K., Leck, C., Nenes, A., Riipinen, I., Virtanen, A., and Salter, M. E.: Revising the hygroscopicity of inorganic sea salt particles, Nat. Commun., 8, 15883, https://doi.org/10.1038/ncomms15883, 2017.
- Abstract
- Introduction
- Heuristic model description
- Comparison of heuristic model with large eddy simulations
- Global forcing estimates from the heuristic model
- Implications for future work to test marine cloud brightening
- Conclusions
- Appendix A: Parcel model emulator
- Code and data availability
- Competing interests
- Disclaimer
- Special issue statement
- Acknowledgements
- Financial support
- Review statement
- References