the Creative Commons Attribution 4.0 License.
the Creative Commons Attribution 4.0 License.
 | 28 Sep 2021
Polycyclic aromatic hydrocarbons (PAHs) and their nitrated and oxygenated derivatives in the Arctic boundary layer: seasonal trends and local anthropogenic influence
Tatiana Drotikova
Alena Dekhtyareva
Roland Kallenborn
Alexandre Albinet
A total of 22 polycyclic aromatic hydrocarbons (PAHs), 29 oxy-PAHs, and 35 nitro-PAHs (polycyclic aromatic compounds, PACs) were measured in gaseous and particulate phases in the ambient air of Longyearbyen, the most populated settlement in Svalbard, the European Arctic. The sampling campaign started in the polar night in November 2017 and lasted for 8 months until June 2018, when a light cycle reached a sunlit period with no night. The transport regimes of the near-surface, potentially polluted air masses from midlatitudes to the Arctic and the polar boundary layer meteorology were studied. The data analysis showed the observed winter PAC levels were mainly influenced by the lower-latitude sources in northwestern Eurasia, while local emissions dominated in spring and summer. The highest PAC concentrations observed in spring, with PAH concentrations a factor of 30 higher compared to the measurements at the closest background station in Svalbard (Zeppelin, 115 km distance from Longyearbyen), were attributed to local snowmobile-driving emissions. The lowest PAC concentrations were expected in summer due to enhanced photochemical degradation under the 24 h midnight sun conditions and inhibited long-range atmospheric transport. In contrast, the measured summer concentrations were notably higher than those in winter due to the harbour (ship) emissions.
- Article
(2546 KB) - Full-text XML
-
Supplement
(2007 KB) - BibTeX
- EndNote


Polycyclic aromatic hydrocarbons (PAHs) are toxic and carcinogenic compounds (International Agency for Research on Cancer, 2010; Kim et al., 2013) released into the atmosphere primarily through incomplete combustion of fossil fuels and biomass (Ravindra et al., 2008). PAHs react with several atmospheric oxidants and form toxic oxygenated and nitrated PAH derivatives (oxy-PAHs and nitro-PAHs; Clergé et al., 2019; WHO, 2003; Bolton et al., 2000; Idowu et al., 2019; IARC, 2012), which can also be present in primary emissions (Keyte et al., 2013; Bandowe and Meusel, 2017; Walgraeve et al., 2010; Abbas et al., 2018). PAHs, nitro- and oxy-PAHs (polycyclic aromatic compounds, PACs) are semi-volatile compounds partitioning between gaseous and particulate phases in response to ambient pressure and temperature and thus have different photolysis rates and long-range atmospheric transport (LRAT) potentials (Mulder et al., 2019; Tomaz et al., 2016; Albinet et al., 2007, 2008; Keyte et al., 2013; Nalin et al., 2016; Huang et al., 2014; Odabasi et al., 1999; Shahpoury et al., 2016). Once emitted in the atmosphere, PACs are subjected to dry and wet deposition with different efficiencies depending on compound physical properties (e.g. vapour pressure, water solubility, polarity, particle size and mass), ambient conditions (e.g. air temperature, wind speed, atmospheric stratification), and precipitation intensity (Keyte et al., 2013; Lei and Wania, 2004; Shahpoury et al., 2018). The PACs that escape the listed sink processes disperse via LRAT to remote places, including the Arctic.
The Arctic region is a receptor of gas- and particulate-phase pollution from diverse source regions at lower latitudes. However, the lower troposphere of the high Arctic is in general well isolated from the rest of the atmosphere due to the very cold air masses located in this region (Bozem et al., 2019), which build the so-called polar dome with the Arctic front as its boundary, formed by the surfaces of constant potential temperature (Klonecki, 2003; AMAP, 2015). Air masses inside and outside the polar dome have different chemical compositions (Klonecki, 2003; Bozem et al., 2019; Willis et al., 2019), confirming the barrier function of the dome. Only the air masses cooled to similar low potential temperatures to those within the polar dome area can penetrate it (Klonecki, 2003).
During the winter and early spring the Arctic front can move as far south as 40∘ N with its greatest extent over cold areas of northern Eurasia (AMAP, 2015). It allows a direct low-level transport of air masses from the areas located north of the Arctic front (within the polar dome) to the Arctic lower troposphere. This pathway provides the most rapid (about 10–15 d; Stohl, 2006) and efficient pollution delivery to the high Arctic lower troposphere due to low wet scavenging and absence of photochemical degradation processes during the winter polar night, which lasts for about 3.5 months. The average precipitation amount per month is only 14–57 mm during winter and spring in different European Arctic areas (Hanssen-Bauer et al., 2019).
At polar sunrise, the number of oxidants significantly increases in the Arctic troposphere (Barrie and Platt, 1997; Atlas et al., 2003; Simpson et al., 2007; Monks, 2000). Direct photolysis and reactions with atmospheric oxidants (e.g. hydroxyl and nitrate radicals, ozone, nitrogen dioxide) in the gas phase, as well as heterogeneous (gas–particle) reactions, are the dominant loss processes for most PAHs. PAHs' lifetimes towards photochemical degradation range between 1 h and 14 d (Keyte et al., 2013). In the Arctic, the atmospheric reactions play a significant role during spring as other sink processes, wet and dry deposition, are limited due to rare precipitation and low vertical turbulence of stably stratified cold air. This may cause the buildup of nitro- and oxy-PAHs though nitro-PAHs degrade quickly (lifetimes of both particulate- and gaseous-phase compounds range between 6 min and 3 h; Reisen and Arey, 2005; Fan et al., 1996) by direct photolysis even under cold conditions. A similar outcome may be presumed for oxy-PAHs based on their photolysis and photochemical degradation rates (Miet et al., 2014; Kameda, 2018; Ringuet et al., 2012; Matsuzawa, 2000).
At the same time, the Arctic front starts receding during spring, and by summer, it has significantly retreated northward to about 73.5∘ N at longitudes between 134 and 17∘ W according to recent estimates (Bozem et al., 2019), though the front is not symmetrical. This means potential air pollution sources are located south of the Arctic front barrier. Also, the wintertime atmospheric transport of air masses from northern Eurasia, promoted by a seasonal intensification of Siberian high and Icelandic low systems, weakens in summer due to a change in land–sea temperature contrasts. Consequently, in summer, the LRAT path to the Arctic shifts to a cleaner one, from the North Atlantic Ocean (Stohl, 2006) with no significant potentially impacting PAC sources along the LRAT route. The summer LRAT to the Arctic is a slow process, as uplifted (at source or at the Arctic front) emissions are transported to the higher troposphere with further descent into the Arctic lower troposphere from above through radiative cooling (about 1 K d−1; Klonecki, 2003). Descent from the upper troposphere to the near-ground layer typically takes several weeks (AMAP, 2015). This is a long time of exposure to 24 h midnight sun Arctic summer conditions. PACs may significantly degrade (Singh et al., 2017; Kameda, 2018; Matsuzawa, 2000; Cvrčková and Ciganek, 2005; Cvrčková et al., 2006; Ringuet et al., 2012). Furthermore, the lifting of polluted air masses at lower latitudes is typically associated with cloud formation and precipitation (AMAP, 2015) by which soluble and particle-associated PACs can be scavenged from the atmosphere before entering the Arctic dome as well as within the Arctic (Willis et al., 2018).
Thereby, the Arctic front location and permeability, the large-scale circulation in the Arctic, available solar radiation, and the precipitation regime affect the magnitude of PACs' LRAT to the Arctic lower troposphere, enhancing transport during winter and inhibiting it during summer (Klonecki, 2003; Stohl, 2006; Bozem et al., 2019), when local regional sources become more important and differ across the Arctic (Wang et al., 2010; Stohl, 2006; Keegan et al., 2014; Berthiaume et al., 2020). It also depends on the Arctic oscillation mode (Eckhardt et al., 2003; Madonna et al., 2014; Stohl et al., 2002), weather along the transport pathway (sea ice extent, air and ocean temperatures as they influence phase partitioning and vertical turbulence), primary emissions strength at lower latitudes, and local high Arctic meteorological conditions.
The Svalbard archipelago (74–81∘ N, 10–35∘ E) is the northernmost land in the European Arctic. Due to its location relative to the low-pressure systems in the Norwegian Sea (Hanssen-Bauer et al., 2019), Svalbard frequently receives air masses from Eurasia. Svalbard is located at the gateway of both atmospheric and oceanic heat transport into the central Arctic (Serreze et al., 2007) as the Gulf Stream and the North Atlantic cyclone track are along its west coast. The region has experienced its greatest temperature increase during the last 3 decades (Nordli et al., 2014; Isaksen et al., 2016), and it is the warmest location in the Arctic above 76∘ N latitude (Wickström, 2020) with consequently one of the most visible changes associated with Arctic amplification (Hanssen-Bauer et al., 2019; Isaksen et al., 2016; van Pelt et al., 2016; Onarheim et al., 2014; Dahlke et al., 2020; Wickström et al., 2020a). Thus, Svalbard is currently identified as an epicentre of climate change and perhaps the main receiver of air pollution from high-latitude Eurasian sources.
PAHs are chemicals of emerging concern in the Arctic (Balmer and Muir, 2017). Their occurrence has been monitored at several Arctic stations for over 30 years (Yu et al., 2019; Balmer et al., 2019), including one in Svalbard (Zeppelin station, Ny-Ålesund; 78∘58′ N, 11∘53′ E; 474 m a.s.l.). Located on the mountaintop, the station is often above a temperature inversion layer, making it ideal for LRAT pollution observations with minimal influence of near-ground pollution plumes (Eckhardt et al., 2013). On the other hand, local source emissions are often not detected at this elevation and are systematically considered negligible though their emissions may significantly contribute to Arctic air pollution (Eckhardt et al., 2013; Aliabadi et al., 2015; Ferrero et al., 2016; Law et al., 2017; Schmale et al., 2018). Thus, the primary purpose of this work was to quantify the occurrence of 86 PACs in the high Arctic lower troposphere, including PAHs, as well as nitro- and oxy-PAHs (a list of the compounds and abbreviations is available in Tables S1–S3), which are not yet included in the circum-Arctic monitoring programmes. This study was performed over 8 months in Svalbard, 115 km southwest of Ny-Ålesund, in the most populated town of Longyearbyen. During this period, seasonal changes were observed in terms of ambient temperature, absolute humidity, surface albedo, prevailing wind direction, air mass inflow, chemical composition of the troposphere, precipitation type and intensity, and cloud height and thickness, as well as an extreme shift from polar night conditions to a completely sunlit period and a seasonal variation in human activities. The detailed objectives in this work were to investigate the PACs' seasonal variations in concentrations and substance patterns and study the potential influence of local anthropogenic emissions on them, as the air samples (gaseous and particulate phases) were collected within the boundary layer.
2.1 Sampling site
The study was performed in the Arctic town of Longyearbyen (78.22∘ N, 15.65∘ E) on the west coast of Svalbard (Fig. S1) from November 2017 to June 2018. As a result of the high-latitude location, the sun in Longyearbyen remains below the horizon between late October and mid-February (polar night). On the contrary, it does not set between mid-April and the end of August (midnight sun or polar day; Fig. S2).
Longyearbyen is the largest populated place among the northernmost settlements, with about 2400 permanent residents (Statistics Norway, 2020) and a seasonal increase due to tourism, mainly in spring and summer. The local coal-fired power plant (30 771 t yr−1 of coal and 419 t yr−1 of diesel consumption (Miljødirektoratet, 2018)) and car traffic (1558 vehicles (Statistics Norway, 2018)) are the main permanent local sources of PAC/anthropogenic emissions (Drotikova et al., 2020), while snowmobiles (2135 vehicles (Statistics Norway, 2018)) and marine (718 local boats (Statistics Norway, 2018) and 345 cruise ships (Kystdatahuset, 2018)) traffic are seasonal. There is no local waste incineration and wood burning registered in the town.
Svalbard's topography is predominantly mountainous. The prevailing wind direction over the archipelago is from the eastern sector as a consequence of Svalbard's location relative to the low-pressure systems in the Norwegian Sea (Isaksen et al., 2016). Influenced by local orography, it creates the predominant southeasterly winds in Longyearbyen. Sampling equipment was installed on the roof of the University Centre in Svalbard (UNIS, 25 m a.s.l.), which is considered to represent near-surface air pollution. UNIS is located in Adventdalen (Advent Valley in English), 300 m from Adventfjørden, and surrounded by mountaintops primarily below 1000 m (Fig. S1c). Considering the southeasterly prevailing wind direction and katabatic winds from the glaciers Longyearbreen and Larsbreen, nearly all year round UNIS is located downwind of the town (600 m distance) and the two main gateways (Adventdalen and Longyeardalen – Longyear Valley in English) that are largely used for snowmobile driving during winter and spring. In summer, the wind direction can temporarily change to northwesterly (Dekhtyareva et al., 2016; Niedźwiedź, 2013), making the UNIS position downwind of the coal-burning power plant (1 km distance from UNIS) and the harbour (5 km distance from UNIS). UNIS is also surrounded by paved roads that are used by cars all year round (Fig. S1c).
2.2 Sample collection
Particulate and gaseous PACs were collected on quartz fibre filters (QFFs; pre-burnt at 450 ∘C for 6 h; ∅=103 mm; no binder; Munktell Ahlstrom, Finland) and polyurethane foams (PUFs; Soxhlet pre-cleaned in toluene for 24 h followed by 24 h acetone wash; ∅=65 mm; L=100 mm; Klaus Ziemer GmbH, Germany), respectively, using a high-volume air sampler (TISCH-1000-BLXZ, Tisch Environmental Inc., USA). On average, 370 m−3 of ambient air was collected over 24 h per sample (Table S4). Meteorological parameters, including ambient temperature, atmospheric pressure, wind speed and direction, relative humidity, and UV radiation, were recorded at Gruvefjellet (78∘12′ N, 15∘37′ E; 464 m a.s.l.) and Adventdalen (78∘12′ N, 15∘49′ E; 15 m a.s.l.) automatic weather stations at a 2.6 and 4.6 km distance from the sampling site, respectively (Table S6).
A total of 31 samples (31 QFFs and 31 PUFs) and 8 field blanks were collected. All samples were kept intact inside the sampling unit after collection. In order to reduce the risk of post-collection contamination, the unit was sealed in two plastic bags for transportation to the lab, where samples were removed from the unit, sealed with layers of aluminium foil, and stored airtightly in two plastic bags. Samples were kept frozen at −20 ∘C until sent to the French National Institute for Industrial Environment and Risks (Ineris, France) by express delivery using cool, insulated containers, and then they were stored at −10 ∘C until analysis.
2.3 Atmospheric stability, boundary layer height (BLH), and LRAT evaluation
The atmospheric layer between the Adventdalen (17 m a.s.l.) and Gruvefjellet (466 m a.s.l.) weather stations was studied. The potential temperatures θ at 17 and 466 m a.s.l. heights were calculated following Wallace and Hobbs (2006):
where T is temperature [K], p is pressure [mbar], and k=0.286 is a gas constant derived from the Poisson equation. The average temperature inversion strength (TIS) [K], expressed as the potential temperature difference θ466−θ17, was evaluated (Arya, 1999).
Turbulence probability (atmospheric stratification) within the atmospheric layer of 449 m thickness between the stations was assessed via the bulk Richardson number (Ribulk):
where Tv is the average virtual potential temperature between the two stations and Δz, Δθv, and ΔU are the differences in height, virtual potential temperature, and wind speed at the two stations, respectively (Wallace and Hobbs, 2006). As the layer is thick, likely some sharp gradients of temperature and wind speed in the subregions of this layer are averaged out; a thus higher value of critical Ribulk was used to assess the probability of turbulence. The turbulence probability decreases linearly as the value of Ribulk increases from 0.25 to 10.25 (Stull, 1988). The Ribulk value of 5.25 was used to indicate a probability of turbulent mixing within the layer between the two stations, i.e. stable stratification, of less than 50 %.
ERA5 data have been utilized to investigate the synoptic-scale meteorological conditions and BLH over Svalbard for the measurement period. ERA5 is the global reanalysis data set with an hourly output frequency and the horizontal and vertical resolutions of 31 km and 137 levels, respectively (Copernicus C3S, 2017; Hersbach et al., 2020). BLH in the ERA5 data set is based on Ribulk calculations for the specific vertical layer and surface. The values of Ri superior to 0.25 indicate stable stratification, and the BLH is diagnosed where the Ribulk exceeds this critical value (ECMWF, 2017).
An extended version of the FLEXPART air parcel trajectory data set of Läderach and Sodemann (2016) and Fremme and Sodemann (2019) was used to study the LRAT of pollutants to the measurement sites. FLEXPART V8.2 is a 3-dimensional Lagrangian particle dispersion model driven with the meteorological data from the European Centre for Medium-Range Weather Forecasts (ECMWF) ERA-Interim reanalysis (Stohl et al., 2005; Dee et al., 2011) with a spatial resolution of approximately 80 km and temporal resolution of 6 h. The current FLEXPART data set contains the horizontal and vertical position of 5 million air parcels that represent the global atmosphere.
The 10 d backward trajectories have been extracted from the data set. The trajectories' points corresponding to the first day of the simulation were not considered since most of them were over the Svalbard region. The trajectories start at the height between 0 and 500 m above the ground in the region covering both Ny-Ålesund and Longyearbyen (from 77.5 to 79.5∘ N and from 10 to 20∘ E). The number of trajectories starting in this vertical layer in the data set varied from 1395 to 4659 per season (Table S5). To investigate the LRAT of air pollutants from mid-latitudes to Svalbard, only the trajectories that reach latitudes below 70∘ N and end up below the local BLH were considered. The air masses that fit these criteria are potential sources of long-range air pollution to the Arctic from ground-based emissions at the lower latitudes. Additionally, in order to assess atmospheric pollutants' possible removal via precipitation, the specific humidity was extracted at each time step along the trajectories. The specific humidity reduction on a value of Δq>0.1 g kg−1 at the consecutive time steps indicates the removal of water vapour from air masses and precipitation events (Läderach and Sodemann, 2016). The precipitation from the air parcels with temperatures above (below) 0 ∘C was considered rainfall (snowfalls).
2.4 Analytical procedures
A detailed description of the analytical protocols used has been published previously (Tomaz et al., 2016; Albinet et al., 2006, 2013, 2014; Srivastava et al., 2018). Slight modifications have been applied here. In brief, a known amount of several surrogates (6-methylchrysene, three deuterated oxy-PAHs, including benzo[a]anthracene-7,12-dione-d4 (98 %, TRC, Canada) to quantify the heavier oxy-PAHs, and seven deuterated nitro-PAHs) were added to the samples prior to extraction. Gaseous-phase PACs were extracted from PUF samples with acetone (two cycles of 80 ∘C, 100 bar, 5 min heat time, 15 min static time) using pressurized liquid extraction (ASE 350, Thermo Scientific, USA). Sample extracts were then reduced under a nitrogen stream to a volume of about 200 µL (TurboVap II, Zymark, USA) and adjusted to 1 mL with acetonitrile. A fraction (900 µL) was dedicated to the PAH analyses, while another (100 µL) was used for nitro- and oxy-PAH quantification. Particulate-phase PACs were extracted from a 47 mm diameter QFF sample punch applying a QuEChERS (quick, easy, cheap, effective, rugged, and safe)-like method with 7 mL acetonitrile (Albinet et al., 2013, 2014). The 2 and 3.5 mL of supernatant were then reduced to near dryness under a nitrogen stream and reconstituted into 500 and 100 µL of acetonitrile for PAH and nitro-/oxy-PAH analyses, respectively. The PUF and QFF extracts dedicated to the analysis of oxy- and nitro-PAHs were purified by solid-phase extraction before analysis: first with neutral alumina (Al2O3, 500 mg, Macherey-Nagel, Germany) and then with unmodified silica gel (SiOH, 500 mg, Macherey-Nagel, Germany). All the extract volumes were then reduced to near dryness under a gentle nitrogen stream, reconstituted with acetonitrile (100 µL for PUFs and 50 µL for QFFs) and spiked with a known number of two labelled internal standards prior to further analysis.
The 22 PAHs were analysed by ultra-high-performance liquid chromatography (UHPLC) with fluorescence detection (UHPLC-fluorescence; Dionex UltiMate 3000, Thermo Scientific, USA) using a C18 UHPLC column (Zorbax Eclipse PAH, , Agilent, USA; 3 µL injected). Gas chromatography in combination with negative ion chemical ionization mass spectrometry (GC-NICI/MS) under single ion monitoring (SIM) mode (Agilent 7890A GC coupled to 5975C MS, Agilent Technologies, USA) was used to quantify 35 nitro-PAHs and 29 oxy-PAHs. The compounds were separated on a Rxi-PAH column (, Restek, USA). A total of 1 µL of the purified extracts was injected into the pulsed splitless mode for analysis. In addition, elemental carbon (EC) and organic carbon (OC) were measured on dedicated 1.5 cm2 filter punches using a Sunset Laboratory analyser according to the EUSAAR-2 thermal protocol (Cavalli et al., 2010; CEN, 2017).
2.5 Quality assurance and quality control
In order to evaluate the background contamination related to sample collection and analysis, PUF and QFF field (n=8) and laboratory (n=6) blanks were performed. Low contamination of laboratory blanks was confirmed. Field blank contamination higher than 30 % of the seasonal average concentrations was determined for 2,2′-biphenyldicarboxaldehyde, 2,3-naphthalenedicarboxylic anhydride, and 1,8-naphthalic anhydride for the gaseous phase. These compounds, in this phase, were excluded from the results. No blank correction was performed for the concentration calculations. Samples showing PAC concentrations below the limit of quantification (LOQ) were replaced by LOQ 2 for further calculations. The instrumental LOQ was defined as the lowest concentration of the compound that can be determined for a signal-to-noise ratio . This evaluation was performed using the lowest-concentration standard solution.
Acceptable PAC surrogate recoveries were obtained and ranged between 53 %–120 %. Quality of the PAH analyses was assessed following the European Committee for Standardization (CEN) standard procedures EN 15549:2008 and TS 16645:2014 (CEN, 2008, 2014). In addition, Ineris routinely participates in national and European PAH analytical inter-comparison biannual exercises. The last exercise results were in good agreement with reference values, including those for the QuEChERS extraction (Verlhac et al., 2015; Bailleul and Albinet, 2018).
The analytical procedures were also validated (n=3) using NIST standard reference material (SRM 1649b, urban dust). The obtained results were in good agreement with NIST-certified (Table S8), reference, or indicative PAC values and those previously reported in the literature for oxy- and nitro-PAHs (Albinet et al., 2013, 2014) as reference concentration values in SRM do not exist for several compounds.
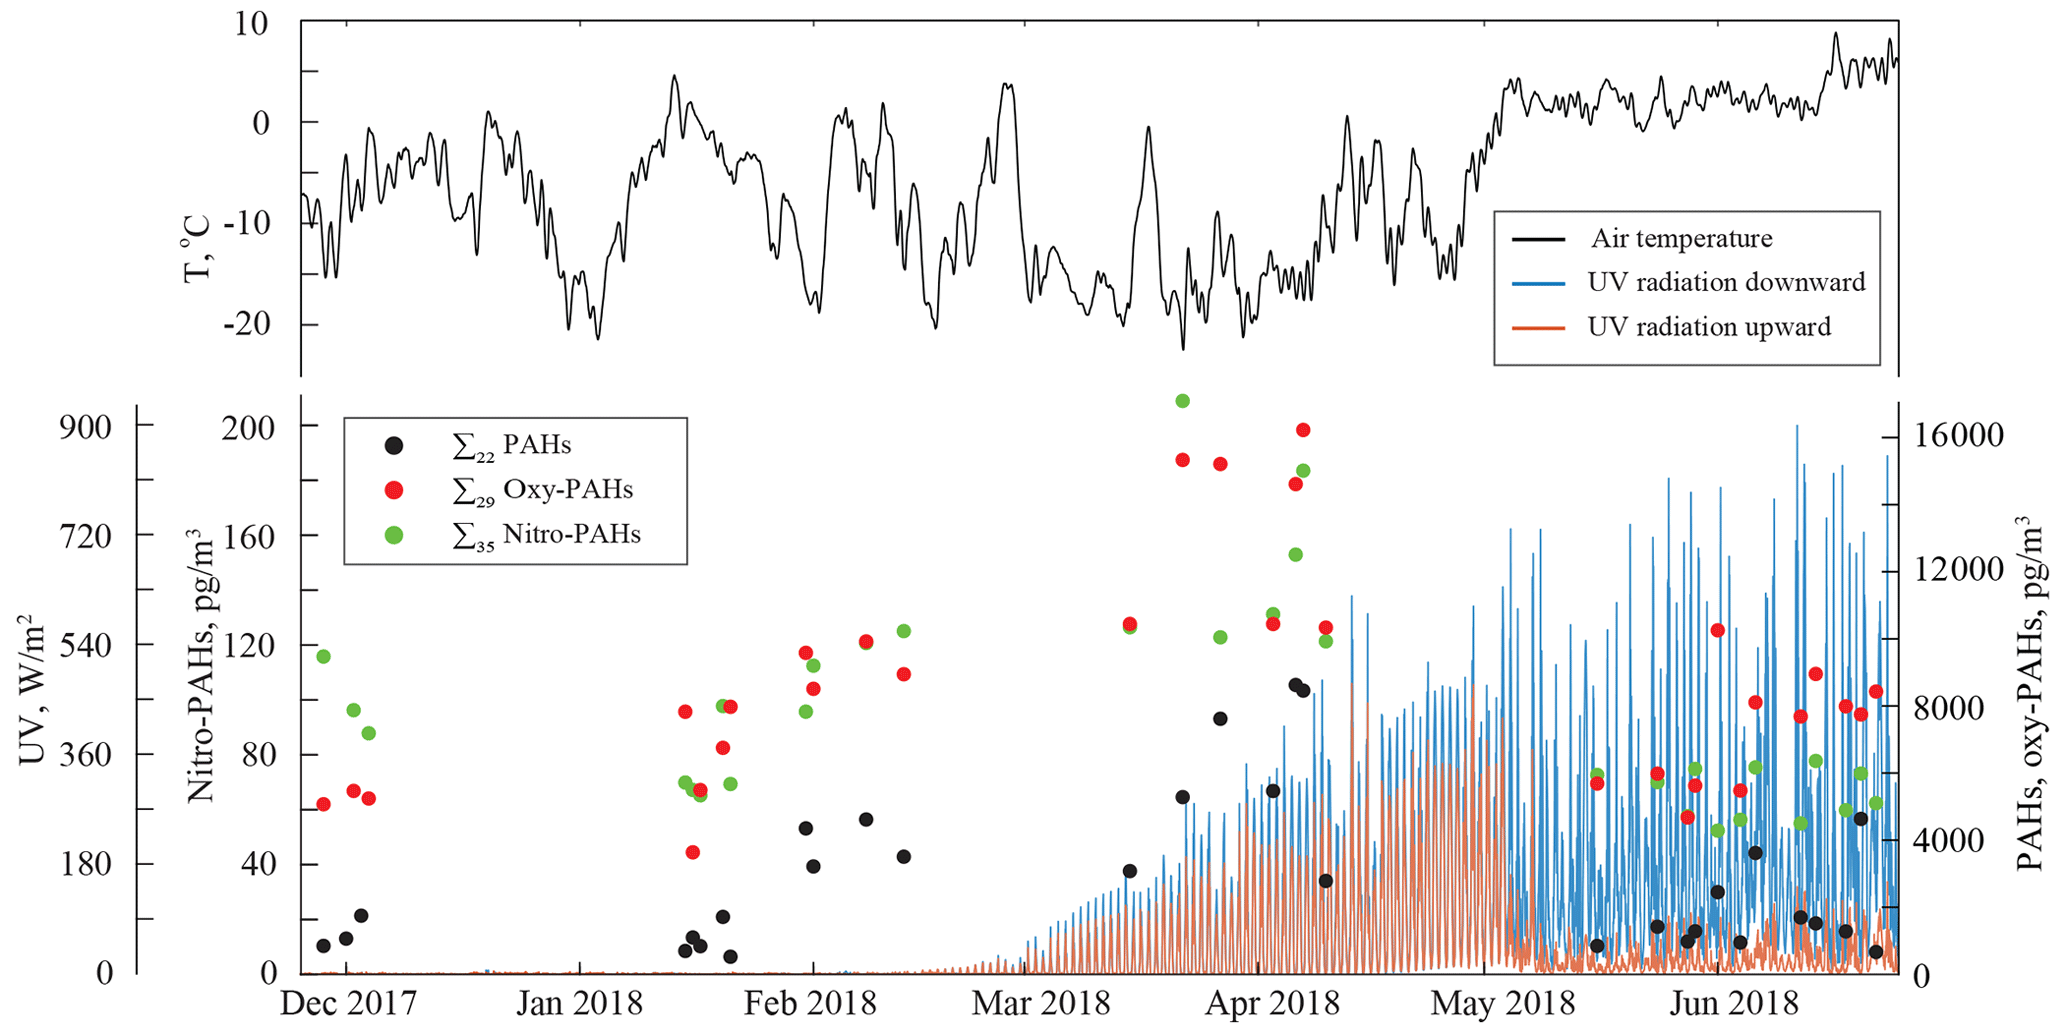
Figure 1Atmospheric temperature, UV radiation, and daily total (gaseous + particulate) concentrations of Σ22 PAHs, Σ29 oxy-PAHs, and Σ35 nitro-PAHs in the urban air of Longyearbyen.
3.1 Seasonal variations
Individual PAH and oxy- and nitro-PAH, as well as OC and EC, average concentrations measured in the ambient air of Longyearbyen are presented in Tables S1–S3, and daily values are presented graphically in Fig. 1. Large seasonal variations were observed for all the PACs, and the ∑20 PAH concentration trend was found to differ from the long-term observations at the background station at Zeppelin mountain (Fig. S3) in Ny-Ålesund, Svalbard, located 115 km northwest of Longyearbyen. To explain the PAC concentration trends found here, the measurement data set was divided into four periods (P1–P4) based on weather and light conditions (Fig. S2) and potential sources as follows: November to January (dark winter, P1), February (twilight winter, P2), March to April (daylight spring, P3), and May to June (polar day summer, P4). The full details on sample grouping and weather conditions are outlined in the Supplement (Tables S4 and S6).
3.1.1 Winter and spring cold P1–P3 periods
The winter season (P1–P2) is characterized by the most considerable weather fluctuations due to the large-scale temperature and pressure gradients between midlatitudes and the Arctic (Sjöblom, 2010). During the sampling period the temperatures ranged from −18 to +4 ∘C, being −5 ∘C on average. In winter, the Arctic weather is strongly controlled by extratropical cyclones, commonly referred to as low-pressure systems, which are at their strongest and most frequent in December–February (Zhang et al., 2004) and have demonstrated an increasing tendency in the areas around Svalbard over the last few decades (Wickström et al., 2020b). These cyclones are the main atmospheric heat source to the Arctic in winter (Fig. S4), and they are also associated with high winds and precipitation (Wickström, 2020). Such inflows from southern latitudes interrupt the Arctic atmosphere thermal stability and cause the BLH fluctuations (Fig. 2). The southeasterly wind was observed during all the sampling days in the cold P1–P3 periods (Fig. S5a). Thus, the sampling site was upwind of the coal-burning emissions at the power plant in winter and spring (Fig. S1c).
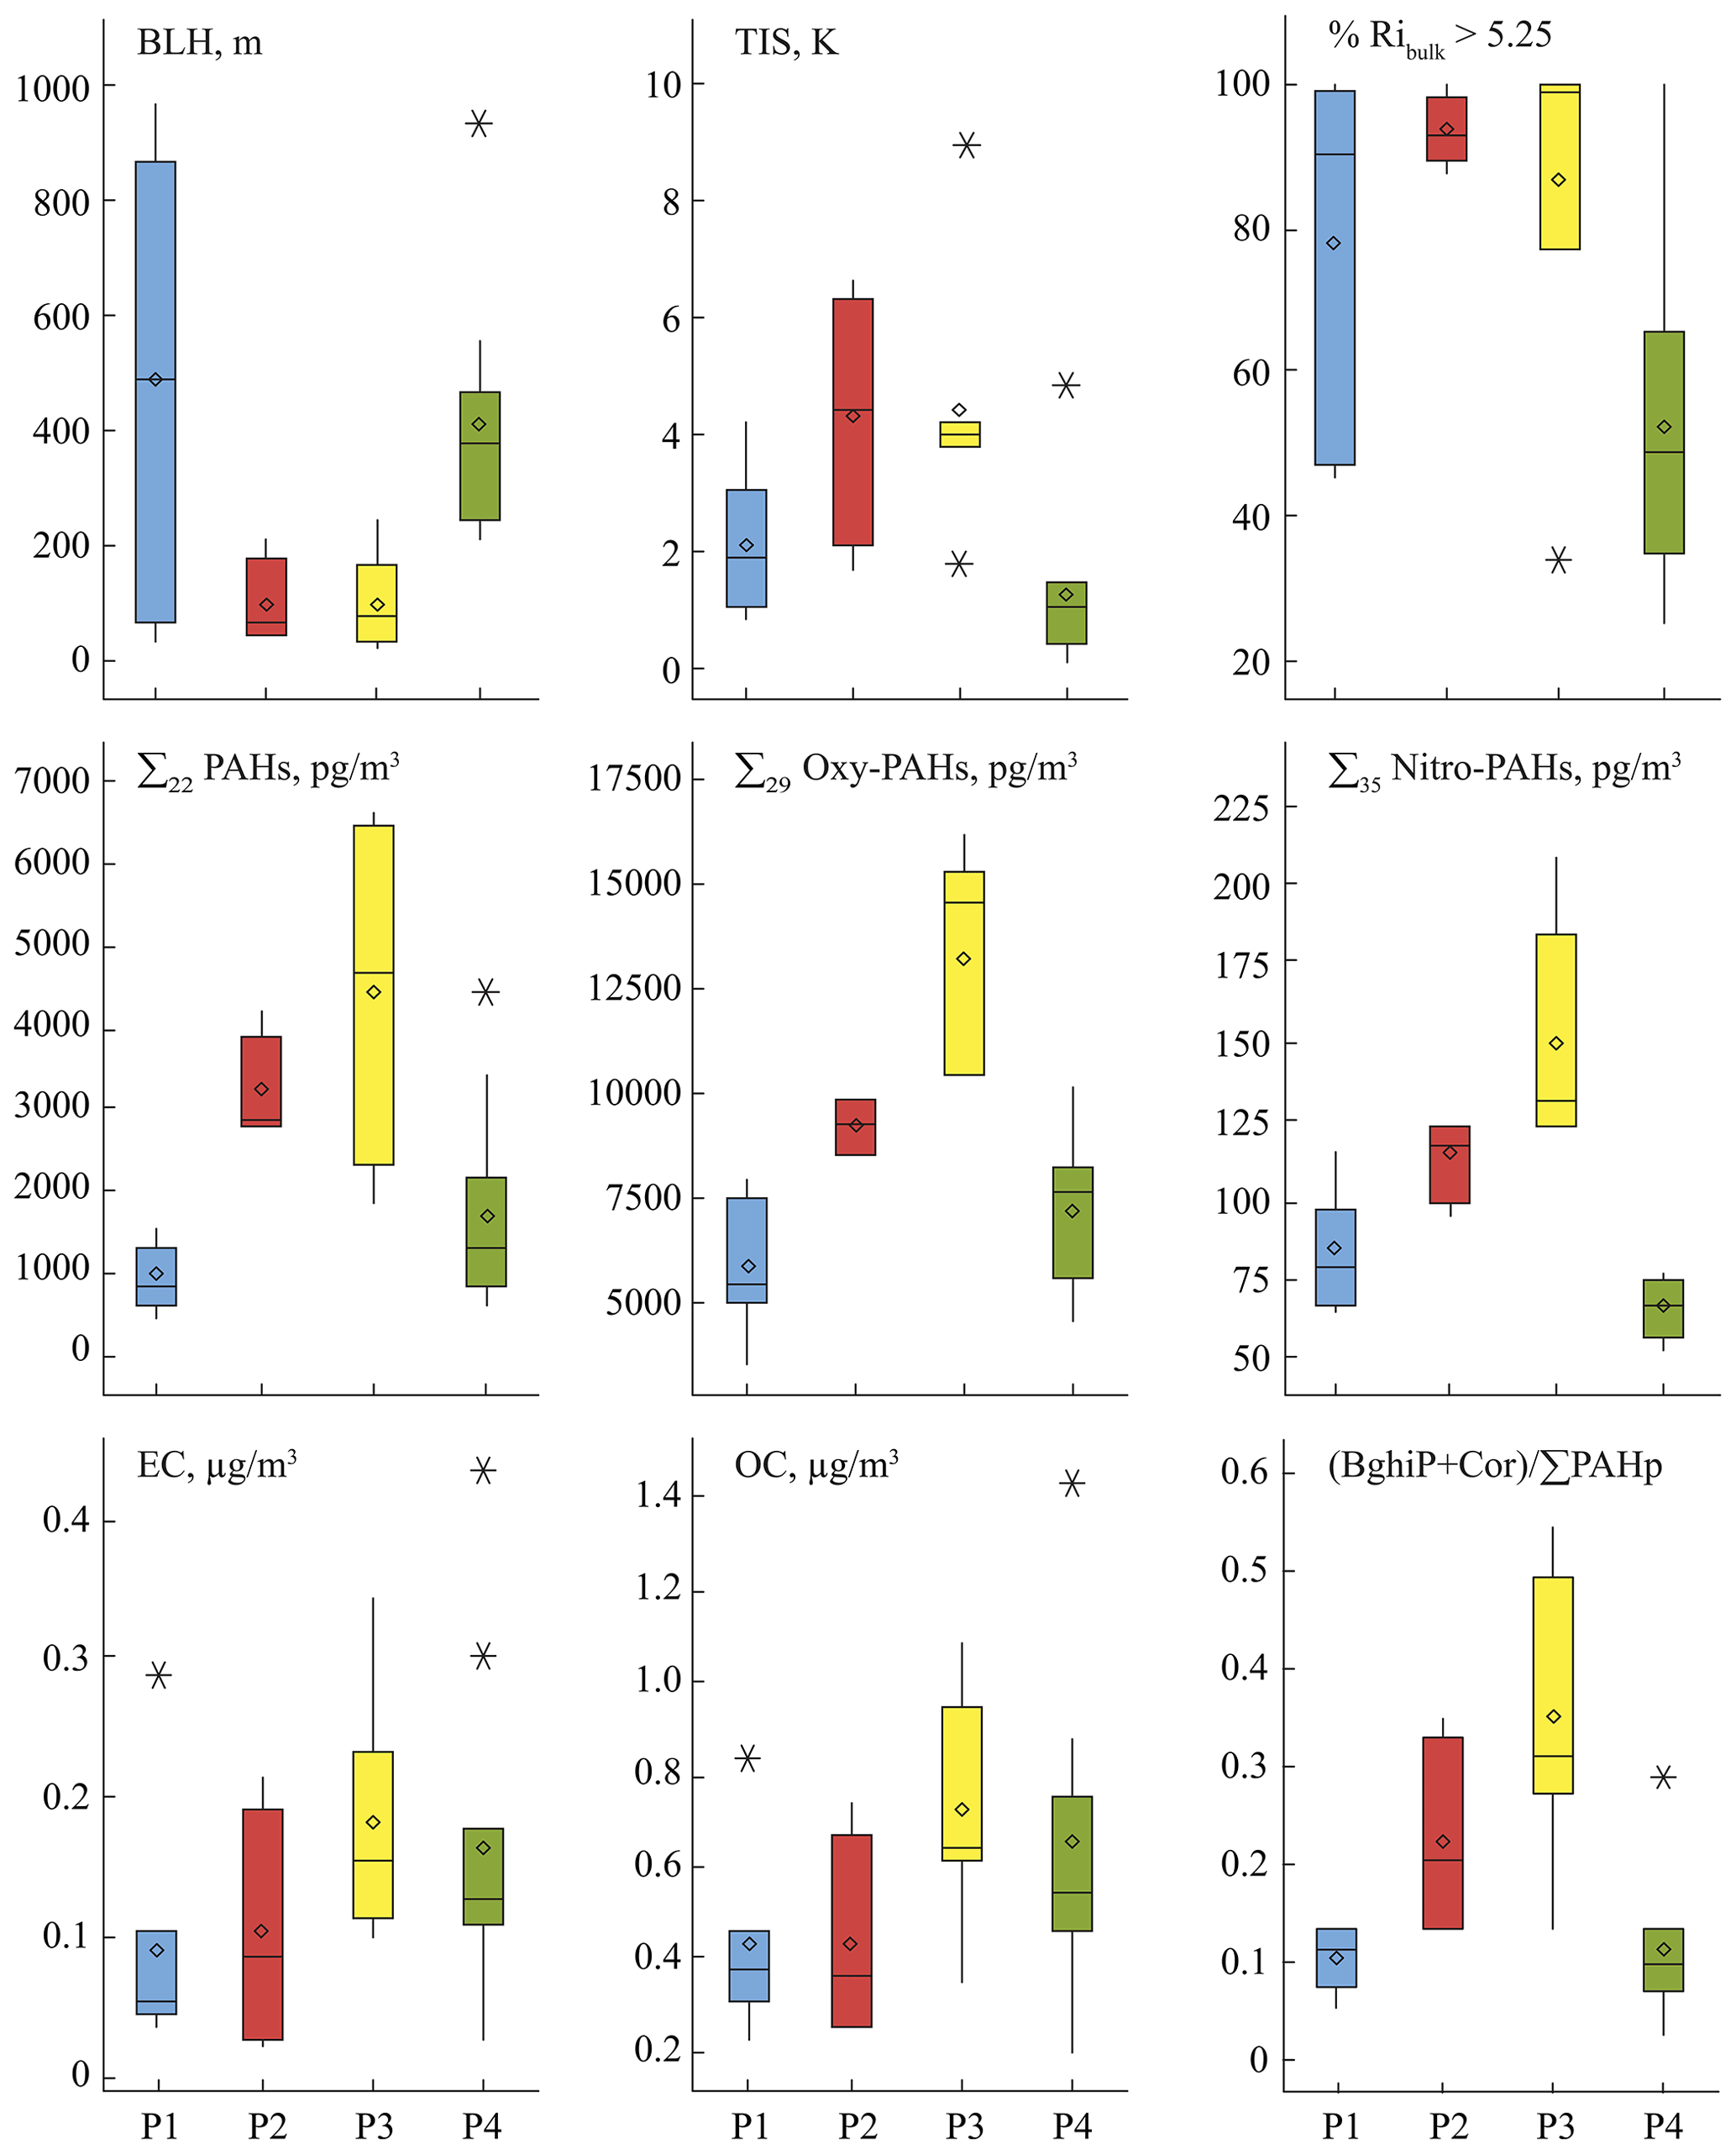
Figure 2Box plots of atmospheric characteristics (boundary layer height BLH, thermal inversion strength TIS, bulk Richardson number Ribulk as characteristic of thermal stability of air layer); summed PAC (G + P), EC, and OC concentrations; and the gasoline emissions PAH diagnostic ratio values ((BghiP + Cor) ∑PAHp). Data are for the November–January (P1; n=8), February (P2; n=4), March–April (P3; n=7), and May–June (P4; n=12) periods. The boxes represent the 25th and 75th percentiles of the data. The lines in the boxes and diamond symbols represent the median and the mean, respectively. All the outliers beyond the whiskers are shown individually.
The average P1 winter ∑22 PAH total (gaseous and particulate, G + P) concentrations were 1068±449 pg m−3. The level of ∑29 oxy-PAHs (5934±1480 pg m−3) was about 6-fold higher than PAHs, while ∑35 nitro-PAHs (84±19 pg m−3) were an order of magnitude lower. As discussed earlier, the LRAT of pollutants to the Arctic lower troposphere is maximum in winter, and the PAH multidecadal monitoring data from the Zeppelin station reflect this trend well (Fig. S3 and Yu et al., 2019). The measured PAH concentrations in Longyearbyen were similar (about 19 % higher) to those detected at the Zeppelin station (Table S7), confirming LRAT of anthropogenic pollutants as a dominant source of PAHs in the Arctic air during winter. According to the 10 d back-trajectory analysis, the transported air masses in winter mainly originated from the European sector, including the areas of Scandinavia, northern Europe, western Russia, and the West Siberian plain (Fig. 3a). Compared to the winter 2018 PAH levels in the background continental air in northern Finland (Pallas, Matorova station; 68∘00′ N, 24∘14′ E; 340 m a.s.l.), from where the air masses are frequently delivered, the Longyearbyen PAH concentrations are a factor of 2 lower (Table S7), which may give us a rough estimation of the PAHs' LRAT efficiency though it largely depends on the weather along the transport pathway, as discussed earlier.
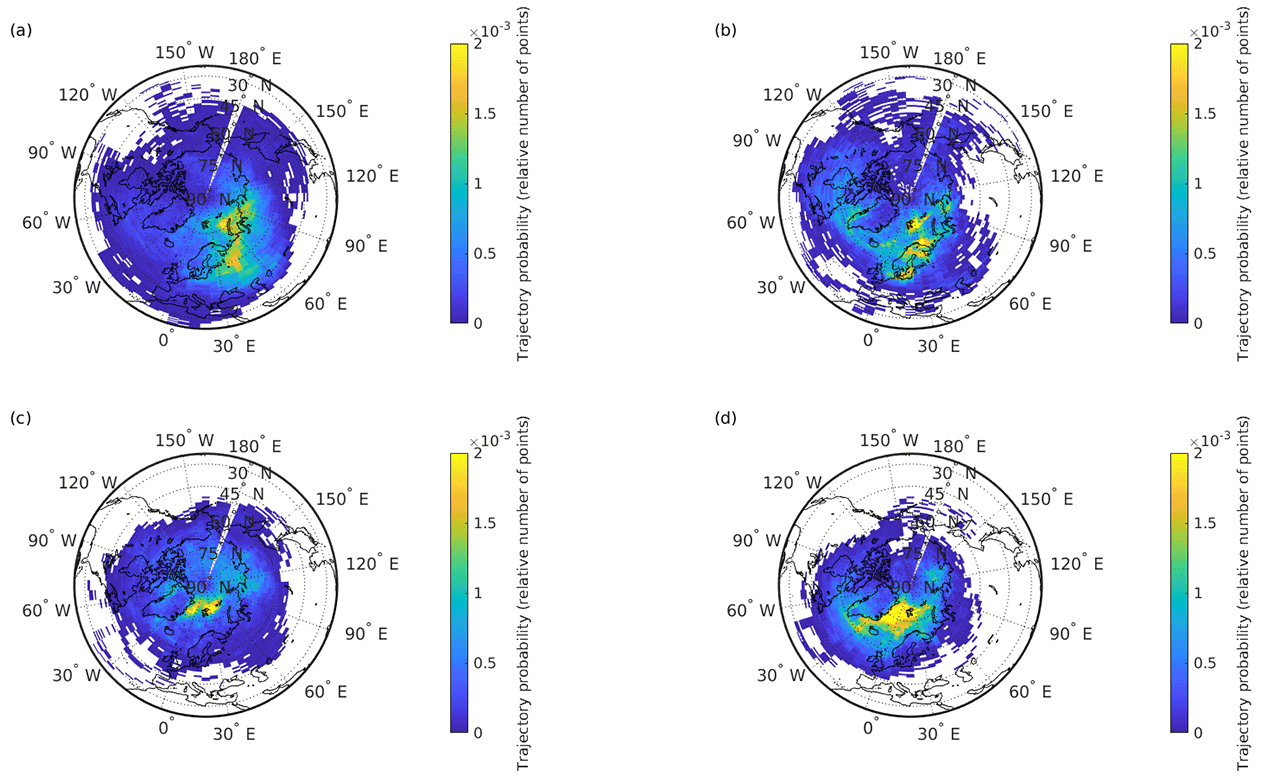
Figure 3The 10 d backward trajectory probability maps for the air masses originating from a source area boundary layer and arriving at 0–500 m above the region of interest in Svalbard. The trajectories' points corresponding to the first day of the simulation are not considered since most of the points for this day are over the Svalbard region. Data are for the November–January P1 (a), February P2 (b), March–April P3 (c), and May–June P4 (d) periods.
At the end of January, the Longyearbyen area starts receiving sunlight. This promotes photochemical processes and notably PAC degradation. As a consequence, a factor of 5 lower PAH concentrations were measured at the Zeppelin station in spring compared to the winter levels (Table S7), also in agreement with earlier studies (Singh et al., 2017; Halsall et al., 1997; Fu et al., 2009). In contrast, a double concentration of ∑86 PACs (13 277±1295 pg m−3) was detected in Longyearbyen air in February (P2), and even higher levels (19 281±4876 pg m−3) were found during the March-to-April period P3. A pronounced increase in concentrations was revealed for most of the compounds. Compared to the winter levels, a 6-fold increase was detected for ∑22 PAHs (5902±2421 pg m−3), and 2-fold-higher concentrations of ∑29 oxy-PAHs (13 229±2681 pg m−3) and ∑35 nitro-PAHs (150±34 pg m−3) were determined in spring P3. These levels are about 1 order of magnitude lower than the average European urban and suburban PAC concentrations measured during cold seasons (Tomaz et al., 2016; Albinet et al., 2008), though the difference is less pronounced with the annual levels in background air (Nežiková et al., 2020): the sum spring concentrations of PAHs (n=15) and high-molecular-weight (HMW) oxy-PAHs (n=4) were about a factor of 2 lower, while low-molecular-weight (LMW) oxy-PAHs (n=4) and the sum nitro-PAHs (n=15) were in a similar range to up to 1 order of magnitude higher. Several individual PAC concentrations increased by a factor of 2 to 525 (depending on the compound) compared to the winter levels, and several of them significantly exceeded (more than twice) the annual mean urban levels in central Europe (Tables S1 to S3; Tomaz et al., 2016; Albinet et al., 2008). As for the Arctic scale, the ∑20 PAH concentrations measured at UNIS were a factor of 30 higher than those at the Zeppelin background station (oxy- and nitro-PAHs are not monitored at the station; Table S7). Such a large difference implies a significant contribution of local emissions to the overall PAC levels in Longyearbyen as the UNIS and Zeppelin stations have similar air masses transport from lower latitudes. According to the backward trajectory probability analysis, in spring, the source regions shifted from east to west and significantly northward: from continental locations in Russia and Europe (P1–P2; Fig. 3a–b) to marine ones over the North Atlantic (Fig. 3c), mainly from the area north of the 75 ∘ N latitude with no significant PAC sources. Thus, the influence of local emissions might be prevailing in spring.
Regional high Arctic weather conditions established by spring favour pollution accumulation in the near-ground air layer. Continuous radiative cooling of snow-covered surfaces during several months of the polar night results in low temperatures at the ground, which creates thermally very stable air stratification. The median values of Ribulk for P2 and P3 periods were significantly higher than 5.25 (Fig. 2), indicating reduced vertical air mixing (Stull, 1988). Strong temperature inversions were frequent during this period with a median TIS of about 4.5 K. The inversion events were the most persistent in spring due to typical sustained cold ambient temperatures ( ∘C on average) in March and April (P3). The estimated BLHs were as low as 100±79 m with a minimum of 19 m under calm (1.9 m s−1 wind as the median), cold (−15.4 ∘C) conditions (Table S6). Thus, the spring near-ground PAC concentrations were greatly influenced by local emissions, which were frequently trapped beneath an inversion layer, and their dilution was limited to a very shallow volume of cold air under suppressed vertical mixing conditions. In addition, for secondary species such as nitro- and oxy-PAHs, secondary formation processes could also occur during these periods and might be promoted by such meteorological conditions. This will be further discussed in a forthcoming article.
Similarly to PACs, about 2-fold-higher EC and OC concentrations were measured in P2 and P3 periods (Fig. 2 and Table S1), and the peak values were found on weekends and during the Easter holidays. This highlights that a large part of OC was probably related to primary combustion emissions in these periods, although secondary processes (formation of secondary organic aerosols) may occur (Hallquist et al., 2009; Heald and Kroll, 2020; Jimenez et al., 2009; Kroll and Seinfeld, 2008). The coal-burning emissions from the power plant were upwind during all the sampling days. Thus, this source probably had no impact on the concentrations and patterns observed. Car traffic intensity is quite steady through winter to spring (P1–P3), and the same emission intensities are presumed as those of similarly cold ambient temperatures during these periods. However, significantly higher values of the ratio (BghiP + Cor) ∑PAHp, representative of gasoline emissions (sum of filter concentrations of 12 PAHs mainly present in the particulate phase (PAHp), from benzo[a]anthracene to coronene according to our observations; Table S1) (Marchand et al., 2004; Albinet et al., 2007) were noticed during and after the polar sunrise (P2 and P3, respectively) compared to in the winter period P1 (Fig. 2). Human activities increase greatly with the sun's return. The town residents already start driving snowmobiles predominantly for recreational purposes during the twilight period P2. This is also the main attraction for tourists, the number of which significantly increases during the spring period P3 (about 16 000 hotel guest nights monthly are registered in March and April; Statistics Norway, 2016) when the greatest number of snowmobiles (2135 vehicles; Statistics Norway, 2018) are in use.
The Longyearbyen snowmobile park predominantly consists of four-stroke engine touring vehicles (60–150 hp, ca. 45–112 kW) and a small number (about 10 %) of two-stroke modern (sport models) and old snowmobiles (registered before 2010). All the snowmobiles are gasoline driven (10–20 L per 100 km; NS-EN 228 Norwegian standard winter gasoline 95 no. 2 with up to 15 % MTBE (methyl tert-butyl ether); Jøran Storø, LNS Spitsbergen, personal communication, 2020) with an addition of synthetic oil (about 2 L per 100 km) for two-stroke engines. Snowmobile emissions constitute a significant source of carbon monoxide, nitrogen oxides (NOx), particles, aldehydes, and a large number of aromatic hydrocarbons (Sive et al., 2003; Bishop et al., 2001; Shively et al., 2008; Zhou et al., 2010; GYC, 2011); further, several studies have confirmed significant contamination of snow along a snowmobile track by PAHs (McDaniel and Zielinska, 2014; Rhea et al., 2005; Oanh et al., 2019). Due to potentially hazardous consequences related to the emissions, the use of snowmobiles is regulated and controlled in the USA with the summed hydrocarbons and carbon monoxide emission limits of 15 and 90 g kW h−1, respectively (U.S. NPS, 2015). Significantly higher concentrations of numerous aromatic hydrocarbons were measured in Longyearbyen air in spring 2007 caused by snowmobile driving (Reimann et al., 2009). The last decade's shift from two- to four-stroke snowmobile engines, including in Svalbard, has reduced CO emissions. However, the recent inventory of 2017–2021 production year snowmobiles (499–1056 cm3 engine displacement; EPA, 2020) still shows emissions of hydrocarbons (and probably PACs) up to an order of magnitude higher from two-stroke modern sleds, the small number of which in Longyearbyen can cause severe air pollution (Reimann et al., 2009). In conclusion, the results obtained here highlighted a strong impact of the snowmobile emissions on the ambient air PAC concentration levels observed.
3.1.2 Summer P4 period
The Arctic lower troposphere's summer composition is primarily controlled by local Arctic weather conditions and local anthropogenic and natural emission sources due to a less efficient LRAT mechanism and enhanced sink processes for PACs. The influence of the midlatitude emissions is more pronounced at higher altitudes because the summer atmospheric transport is directed to the higher troposphere (Klonecki, 2003; Stohl, 2006; Bozem et al., 2019). The Arctic age of summer air near the surface north of 75∘ N is 13–17 d (Stohl, 2006), and the estimated travel time for gaseous pollutants is about 3 weeks (Bozem et al., 2019) while particles are efficiently scavenged by wet precipitation (Willis et al., 2018, and Table S5). Thus, local emissions are of great importance in summer in the high Arctic.
Increased incoming solar radiation (24 h of sunlight) and warmer ambient temperatures are the most notable changes in the high-latitude summer. During the sampling period P4 the temperatures ranged from −0.1 to +9.3 ∘C with an average value of +3.6 ∘C on the sampling days. Loss of land-based snow cover and retreat of sea ice decrease surface albedo, which consequently creates the dominance of downward short-wave radiation in contrast to the spring period P3 (Fig. 1). Moreover, large areas of open ocean and increased solar insolation create relatively high atmospheric humidity. It allows the formation of low-level liquid-containing clouds (Browse et al., 2012), which are ubiquitous in the Arctic during summer (Lawson et al., 2001; Cesana et al., 2012). These low-level clouds and fogs produce frequent drizzle, which leads to efficient removal of particle-associated (Browse et al., 2012) and gaseous-phase water-soluble pollutants, including the PACs (Lei and Wania, 2004; Shahpoury et al., 2018). Thereby, the Arctic troposphere during summer is generally cleaner than in winter (AMAP, 2006; Stohl et al., 2007) and is often considered pristine (Browse et al., 2012; Garrett et al., 2010). The 2-decade atmospheric measurements at several high Arctic monitoring stations confirm that PAH concentrations throughout the year are minimal during summers (Yu et al., 2019). The summer PAH levels are usually 1–2 orders of magnitude lower than in winter and often close to detection limits (Table S7 and Yu et al., 2019; Prevedouros et al., 2004; Singh et al., 2017). Nonetheless, summer ∑22 PAHs concentrations (1779±1210 pg m−3) measured in Longyearbyen air were about 67 % higher than the winter P1 levels (Table S1). For individual PAHs, the largest differences (concentrations ≥2 times higher in summer) were observed for phenanthrene, 1- and 2-methylnaphthalene, pyrene, acenaphthene, and chrysene while other compounds showed comparable concentrations in both seasons. The ∑29 oxy-PAH (7219±1692 pg m−3) concentrations were 22 % higher, while the levels of ∑35 nitro-PAHs (66±9 pg m−3) were 22 % lower (Tables S2–S3) during P4 compared to winter P1. The PAH levels observed in Longyearbyen were a factor of 19 higher compared to levels measured at the Zeppelin background station during the same period of summer 2018 (Table S7), stressing the predominant contribution of the local anthropogenic emissions. Due to the town's lower demand for electricity and central heating during brighter and warmer midnight sun conditions, coal-burning emissions at the power plant decrease (Bøckman, 2019) as do car traffic emissions (Statistics Norway, 2016), also because of preferences for biking and walking within the town. Meanwhile, boat traffic increases dramatically, mainly due to tourist cruises (about 53 000 vessel passengers during the summer season; Statistics Norway, 2016) and cargo delivery, and can significantly contribute to the local air pollution (Eckhardt et al., 2013; Zhan et al., 2014; Law et al., 2017; Ferrero et al., 2016).
Due to the town's coastal location and the summer-specific land–sea thermal gradient, the northwesterly winds become frequent during summer. These winds are characterized by lower velocity (4.0 m s−1 as the median) compared to winds that are southeasterly (7.4 m s−1 as the median), the annual prevailing wind direction (Table S6). About half of the P4 period air samples were collected under northwesterly wind conditions (Fig. S5c) when the sampling site was downwind of the coal power plant and the harbour (Fig. S1c and d). The Flu (Flu + Pyr) coal combustion diagnostic ratio value of 0.81±0.09 was found to be similar to previously reported values (Drotikova et al., 2020) with low variability over the entire summer sampling period P4, indicating steady contamination from the power plant. Also, the power plant plumes are emitted at high elevation (95 m a.s.l.) and a short distance from UNIS (about 800 m) and thus might not be easily detectable at the UNIS sampling site due to higher BLH, less frequent thermal inversion events, increased air layers' convection, and generally windy conditions during summer (4.9 m s−1 during P4 sampling days). However, about 29 %–88 % higher ∑86 PAC, EC, and OC concentrations were detected on the days with a northwesterly wind, and the harbour emissions seemed likely responsible for it as substantial air pollution can be caused by ship emissions when ships are docked and during port manoeuvering (Huang et al., 2018a). Moreover, these summer PAC concentrations (measured during the P4 period of May to June 2018) were found to be about 3-fold higher than those reported previously for the autumn (measured during the period of late August to September 2018; Drotikova et al., 2020), when ship traffic in the fjord was already notably lower as the sailing season was close to its end. The average (n=5) concentrations when the wind blew from the southeast direction (from Adventdalen; n=5) were for ∑22 PAHs 1116±278, for ∑29 oxy-PAHs 6557±1821, and for ∑35 nitro-PAHs 65±10 pg m−3 and likely mainly influenced by local car traffic. On average, a factor of 2 and 1.2 higher concentrations of ∑22 PAHs (2253±1416 pg m−3) and ∑29 oxy-PAHs (7691±1553 pg m−3), respectively, were measured on the days with northwesterly wind (from the harbour; n=7). The ∑35 nitro-PAH (66±10 pg m−3) level did not change markedly. The maximum summer concentrations (∑22 PAHs = 4633, ∑29 oxy-PAHs = 10 256, and ∑35 nitro-PAHs = 75 pg m−3) were found downwind of the harbour when the source strength (summed total tonnage of ships registered in the harbour during the sampling hours) was maximal and hourly median wind speed varied between 1.8 and 5.7 m s−1. Dispersal of ship plumes and their visibility at a fixed measurement point are dependent not only on the source strength but also on the atmospheric stability, wind velocity, and turbulence intensity (Contini et al., 2011). Higher local air pollution by ship emissions and its accumulation can be expected at lower wind speeds, similarly to in the summer 2009 case study in Ny-Ålesund, Svalbard (Eckhardt et al., 2013).
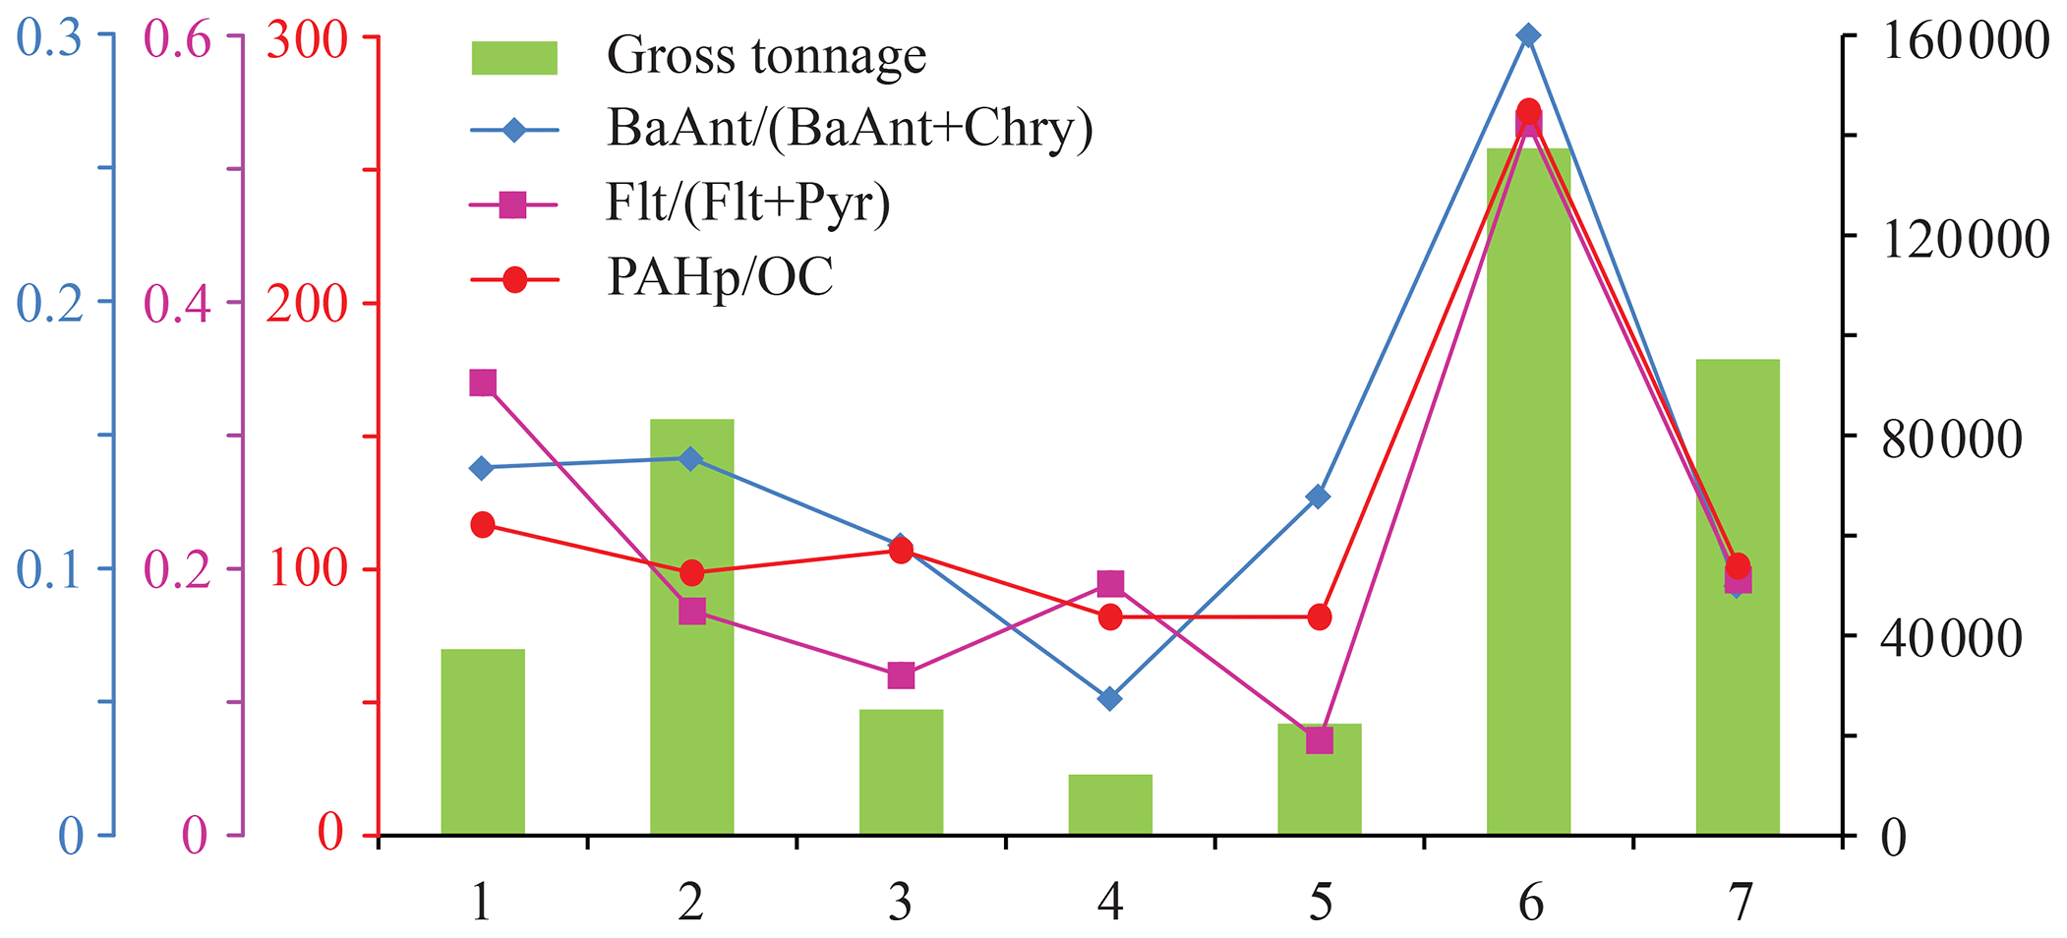
Figure 4Correlations of the diagnostic ratios and the sum gross tonnage (dimensionless) of vessels arriving and departing the harbour of Longyearbyen during sampling hours on the summer period P4 days when the UNIS station was downwind of the harbour (n=7).
To further highlight ship emissions' influence, only samples collected when the moderate wind (4.0 m s−1 as the median) blew from the northwesterly sector (292–313∘; n=7) were considered (Fig. 4). The total (arrival + departure) gross tonnage of vessels (Kystdatahuset, 2018) was used as an indicator of local ship traffic. A correspondence was found between the summed total tonnage of ships registered in the harbour during the sampling hours and the Flt (Flt + Pyr) and BaAnt (BaAnt + Chry) diagnostic ratios, providing clear evidence of the harbour emissions' contribution (Zhang et al., 2019; Drotikova et al., 2020). A factor of 4 higher concentrations of the PAHp were measured on the days with northwesterly wind compared to the days when wind blew from a southeast direction, which is also in agreement with a recent study on ship emissions in the harbour of Longyearbyen (Dekhtyareva, 2019). Such a large increase in particle-associated PAHs also suggests the harbour being the predominant influence as only about 6 % of the power plant total PAC emissions (gaseous + particulate phases) were associated with the particulate phase (Drotikova et al., 2020). Finally, a good correlation of the PAHp OC ratio values with the summed vessels' total tonnage was also found (Fig. 4), highlighting a higher content of PAHs in OC under such a harbour influence.
As a last piece of evidence indicating a significant influence from the harbour, the OC EC ratio values ranged between 2.5 and 7.4 (3.6 as the median) on the selected days. Marine fuel quality and engine operating conditions cause large variation in OC and EC emissions. OC EC ratio values between 2 and 5 are often detected for low- and high-power diesel-operated vessel plumes, while the higher values are typical of heavy-fuel-oil engine emissions (Zhang et al., 2019, 2020; Sippula et al., 2014), as well as of the ship emissions at low-speed manoeuvering during the harbour departure and arrival (Zhang et al., 2016; Sippula et al., 2014; Huang et al., 2018b). Furthermore, a plot of the daily OC EC ratio values versus total tonnage demonstrates the ratio increasing with the tonnage (Fig. S6).
3.2 PAC chemical profiles and source influences
3.2.1 PAH profiles
Phenanthrene, fluorene, naphthalene, benzo[a]anthracene, and 1-methylnaphthalene accounted for 76±8 % of total PAHs measured in Longyearbyen. Phenanthrene was the predominant compound in all the periods (P1–P4) and accounted for about 30 % on average, being higher in summer. The contribution of naphthalene varied from 5 % to 24 %, with a higher proportion in the spring period P3. This compound is not included in further discussion as it is not source-specific.
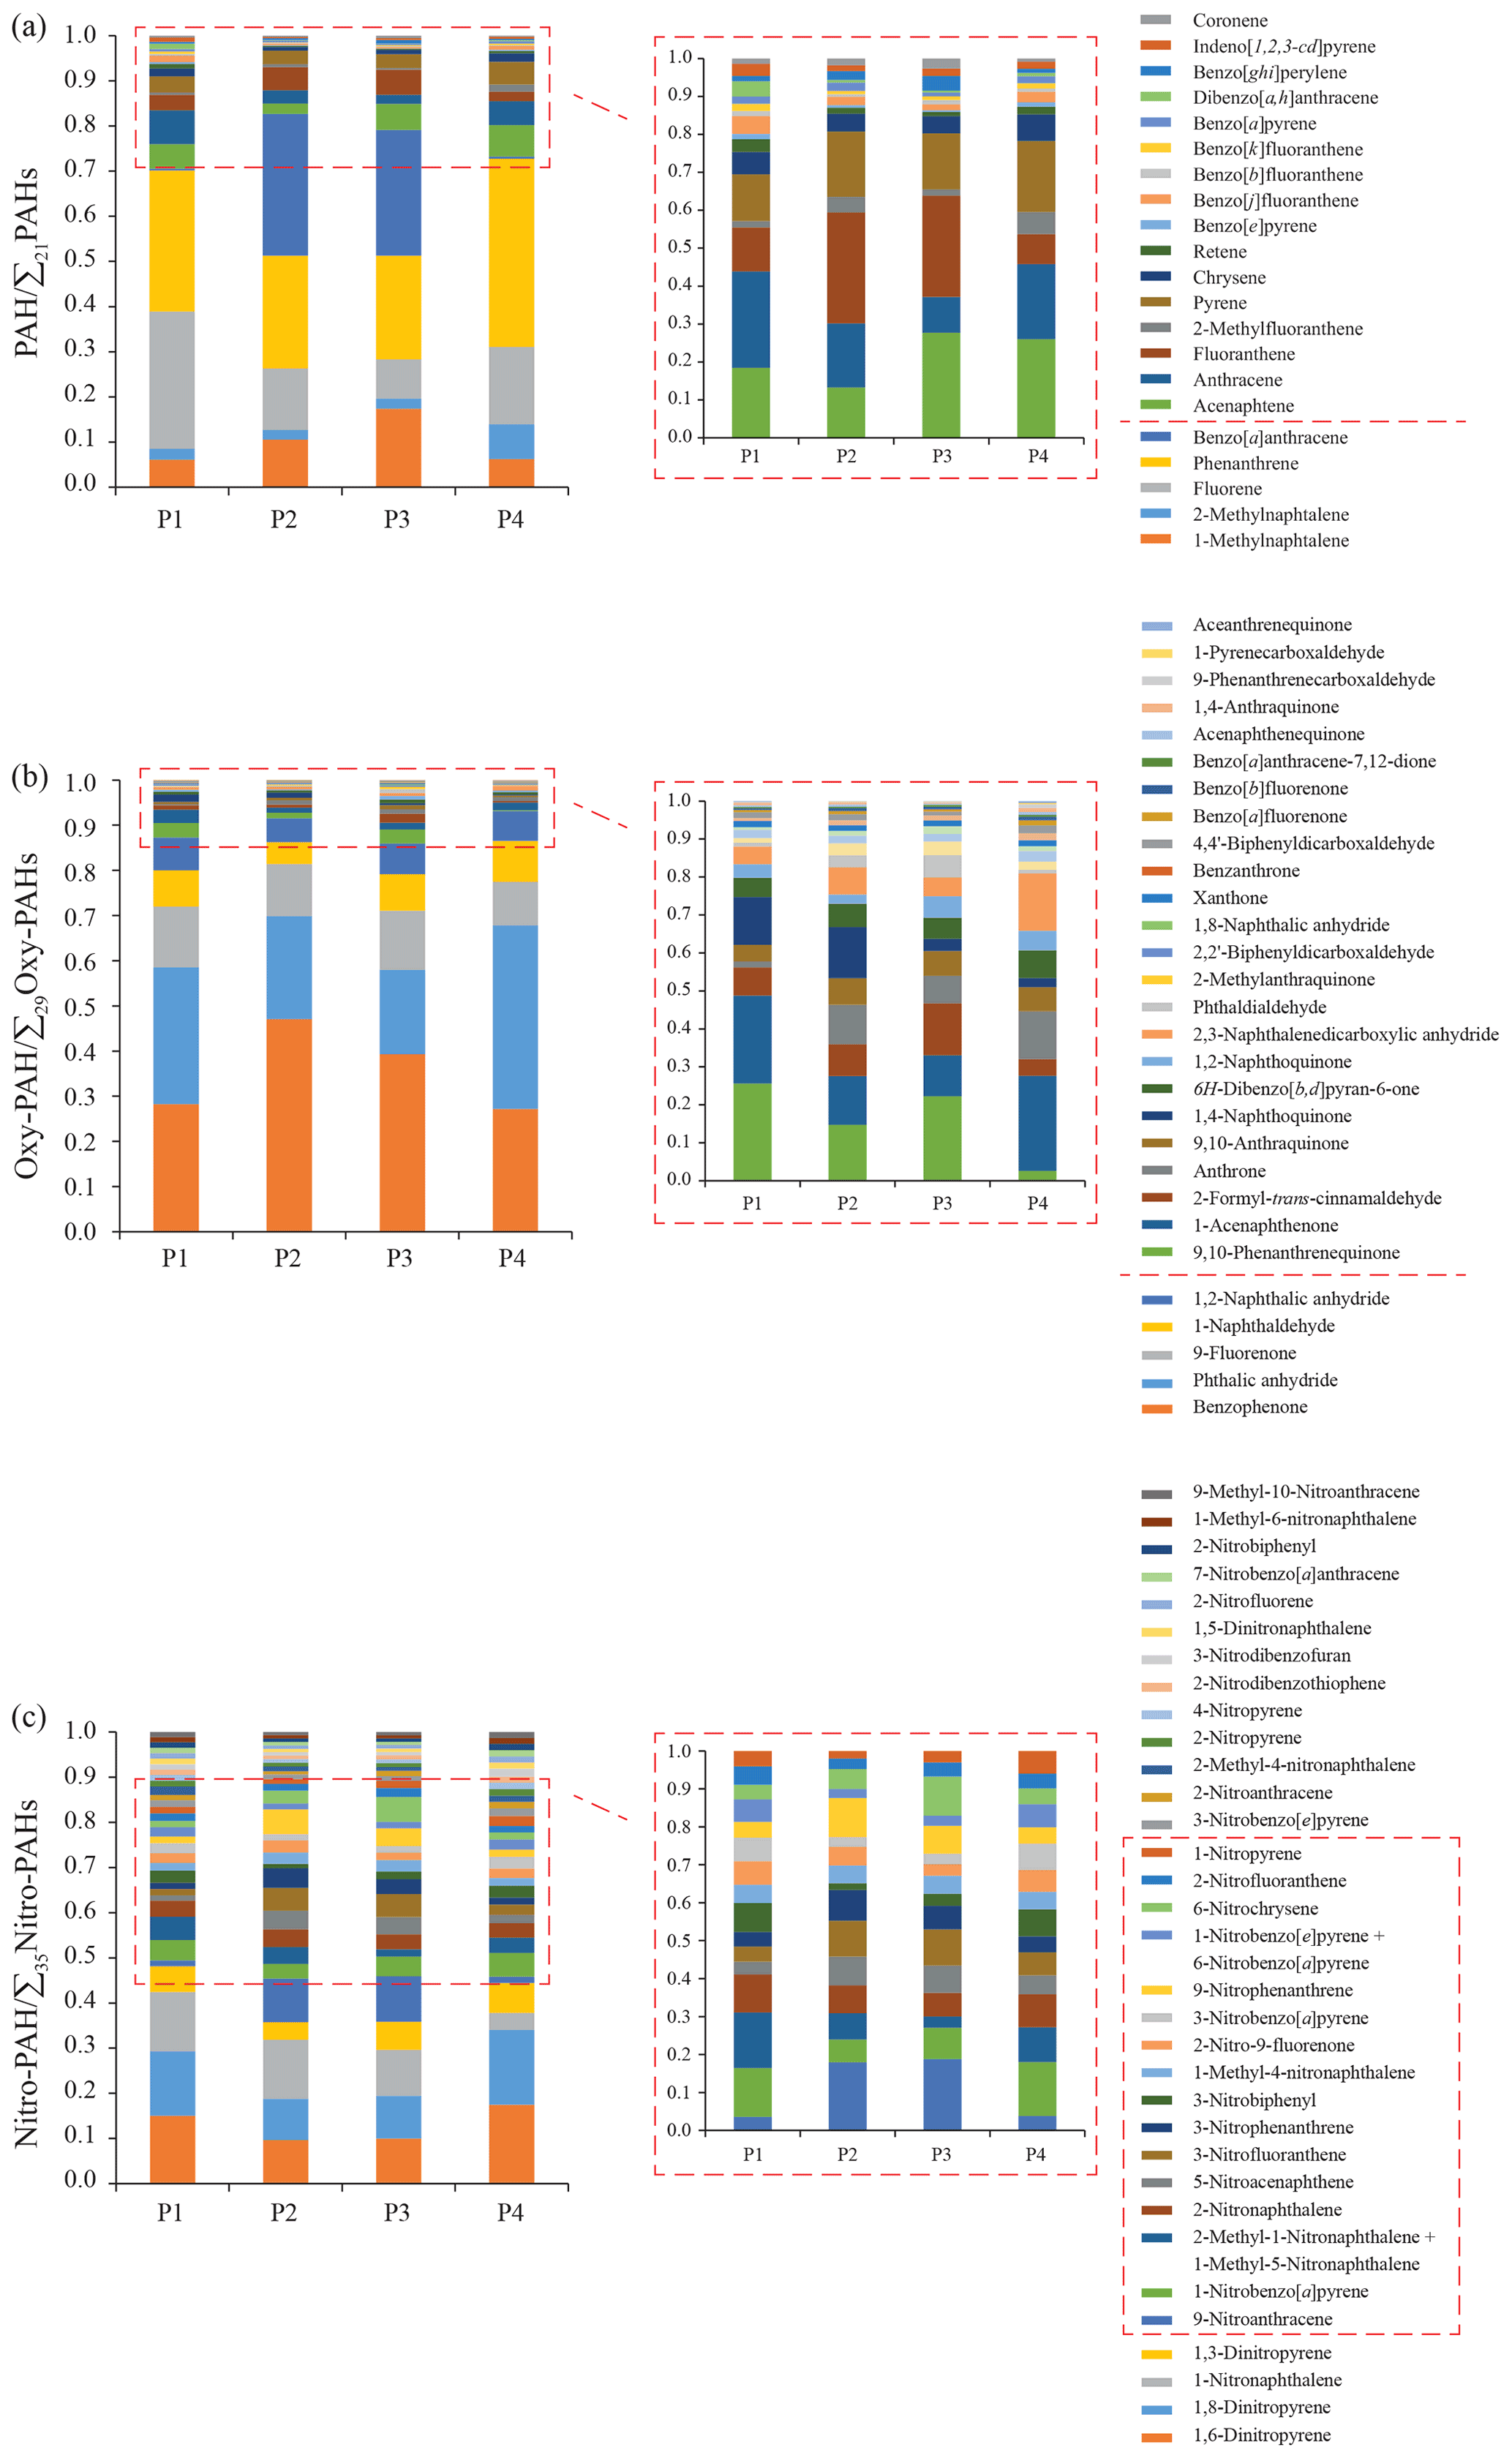
Figure 5Average chemical profiles based on the total (gaseous + particulate phases) individual concentrations of PAHs (a), oxy-PAHs (b), and nitro-PAHs (c) for the November–January (P1; n=8), February (P2; n=4), March–April (P3; n=7), and May–June (P4; n=12) periods. Further details can be found in the Supplement (Fig. S7–S11).
The resulting winter profile P1 (Fig. 5a) was dominated by phenanthrene and fluorene (60 %) with a smaller contribution of about 8 % of anthracene, which was the highest compared to the other periods. Anthracene is one of the most reactive PAHs (Keyte et al., 2013). Its higher proportion in winter may indicate accumulation of anthracene due to a lower level of atmospheric oxidants under dark conditions during the P1 period.
The twilight P2 and spring P3 profiles were strongly influenced by benzo[a]anthracene and 1-methylnaphthalene, accounting for 40 % of the total PAH relative compositions with a higher proportion on weekends and public holidays, when snowmobile traffic is increased. Comparing the PAH spring weekend profiles (n=7) with the rest of the cold-period day profiles (P1–P3; n=12) confirmed a significant increase in the benzo[a]anthracene proportion caused by snowmobiling, as well as the higher contribution of 1-methylnaphthalene, fluoranthene, acenaphthene, and coronene to the total PAH profile (Fig. S7). Overall, benzo[a]anthracene, phenanthrene, and 1-methylnaphthalene accounted for 68 % of the average PAH profile of these days with known high snowmobile traffic. The predominance of phenanthrene and methylated PAHs in snow samples contaminated by snowmobile emissions has previously being reported (McDaniel and Zielinska, 2014), although the contribution of 2-methylnaphthalene and 2-methylfluoranthene in the present study was found to be negligible. Different engine technologies and fuel quality may have been responsible for this.
Like in winter, phenanthrene and fluorene were the predominant compounds of the summer PAH profile P4 and accounted for 59 % of it. The proportion of 2-methylnaphthalene was found to be higher in summer. The summer profile represents an average picture of two sample groups collected under different wind conditions (direction) and thus influenced by different sources, though car traffic is similar (Fig. S1c). To investigate the source-specific emissions, profiles of the days with northwesterly wind (n=7) were compared with those samples collected when wind was from Adventdalen (southeasterly wind; n=5). The difference between the average profiles was mainly driven by the significantly higher contribution of fluoranthene, 2-methylfluoranthene, and chrysene on the days with northwesterly wind from the harbour and the coal power plant (Fig. S8). As specified above, increased air convection in summer, the sampling site's proximity to the power plant, and its almost exclusively gaseous emissions mean that the ground-level emissions from the harbour are more detectable at UNIS than the high-elevation power plant plumes. Our assumption is supported by frequent reports of fluoranthene and chrysene as major PAHs in ship emissions (Huang et al., 2018b; Zhang et al., 2019; Zhao et al., 2020, 2019) and an absence of contribution changes of phenanthrene, fluorene, and pyrene, the predominant compounds emitted from the power plant (Drotikova et al., 2020).
3.2.2 Oxy-PAH profiles
Benzophenone, phthalic anhydride, 9-fluorenone, 1-naphthaldehyde, and 1,2-naphthalic anhydride were the predominant substances and accounted for 89±4 % of the total oxy-PAHs in all periods (Fig. 5b). The main changes in the profiles were caused by a 16 % increased contribution of benzophenone in spring and a 17 % higher proportion of phthalic anhydride in summer. Among the minor compounds (ranging from 25 to 400 pg m−3) accounting for about 10 % of the total oxy-PAH profile, higher proportions of 2,3-naphthalenedicarboxylic anhydride and anthrone were found in summer. Detailed analysis of the average summer profiles based on different prevailing wind directions (Fig. S9) did not reveal any primary local source influence. This may indicate the secondary formation of phthalic anhydride, 2,3-naphthalenedicarboxylic anhydride, and anthrone from PAH photochemical reactions (Keyte et al., 2013; Chan et al., 2009; Perraudin et al., 2007; Bunce et al., 1997; Lee and Lane, 2009). A higher contribution of 9-fluorenone, 1-naphthaldehyde, 1-acenaphthenone, 6H-dibenzo[b,d]pyran-6-one, 9,10-anthraquinone, 2-methylanthraquinone, and benzanthrone to the total oxy-PAH summer profile was discovered on days with northwesterly wind (Fig. S9). Several of these compounds have previously been detected in the ship plumes (Zhao et al., 2020; Czech et al., 2017; Sippula et al., 2014). Note that 9-fluorenone and 9,10-anthraquinone are the main oxy-PAHs emitted after the local coal burning at the plant (Drotikova et al., 2020).
For the twilight P2 and spring P3 periods, a higher contribution of several oxy-PAHs was found on weekends and public holidays, namely benzophenone, 9,10-phenanthrenequinone, 2-formyl-trans-cinnamaldehyde, anthrone, 9,10-anthraquinone, and benzanthrone (Fig. S10a), and the greatest increases in proportion were found among the minor compounds 1,2-naphthoquinone, phthaldialdehyde, 2-methylanthraquinone, and 1,8-naphthalic anhydride (ranging from 33 to 102 pg m−3; Fig. S10b). These changes seemed likely to be caused by higher human activities and mostly snowmobile driving, as mentioned above. The use of oxidation catalysts as part of four-stroke snowmobile exhaust after-treatment (Meldrum, 2017) may lead to efficient oxidation of parent PAHs and consequent formation of their oxygenated derivatives.
3.2.3 Nitro-PAH profiles
1-Nitronaphthalene and dinitropyrenes accounted for 40±5 % of total nitro-PAHs in all periods (Fig. 5c). The contribution of 1-nitronaphthalene decreased in summer while it increased for 1-nitrobenzo[a]pyrene. Different wind directions did not cause notable changes to the P4 summer profile.
The twilight P2 and spring P3 period profiles differ greatly from the winter P1 and summer P4 total nitro-PAH relative compositions. The P2 and P3 profiles were enhanced by higher proportions of 9-nitroanthracene, 6-nitrochrysene, 3-nitrophenanthrene, 5-nitroacenaphthene, and 3-nitrofluoranthene. A study of daily profiles of the entire cold period (P1–P3) showed evident pattern changes with a significantly greater contribution of the listed nitro-PAHs during non-work days (Fig. S11). No scientific studies on PAC emissions from snowmobiles have been reported yet. Nonetheless, snowmobile driving is a well-documented major source of a list of aromatic hydrocarbons (Zhou et al., 2010; Reimann et al., 2009; Eriksson et al., 2003; Shively et al., 2008), and PAHs were detected in snow along snowmobile tracks (McDaniel and Zielinska, 2014; Rhea et al., 2005; Oanh et al., 2019). Moreover, a factor of 3 higher NOx emissions from snowmobiles compared to gasoline-driven cars in Svalbard are reported by the Norwegian Climate and Pollution Agency (Vestreng et al., 2009) with the main contribution from four-stroke snowmobiles. Modern-technology snowmobiles have a significant side effect of high production of NOx (Ray et al., 2012) due to oxidation reactions in exhaust after-treatment (Aubin et al., 2017). A recent field survey by Dekhtyareva (2019) in Svalbard also confirmed enhanced NOx emissions from snowmobiles. Excess of NOx during combustion drives nitration of PAHs producing nitrated PAH derivatives via electrophilic substitution (Ringuet et al., 2012; Heeb et al., 2008; Carrara and Niessner, 2011; Carrara et al., 2010; Hu et al., 2013; Keyte et al., 2013). Note that pattern changes of the daily total nitro-PAH profiles were the most easily applicable to recognize snowmobile emissions compared to PAHs and oxy-PAHs, and 9-nitroanthracene, 6-nitrochrysene, 3-nitrophenanthrene, 5-nitroacenaphthene, and 3-nitrofluoranthene seem to have strong specificity to the source.
LRAT is believed to play a predominant role in Arctic air pollution. Different seasonal mechanisms of air masses' transport to the Arctic lower troposphere determine the annual trend of remote sources' contribution with its maximum in winter and minimum in summer. The results obtained here from air samples collected within a polar boundary layer at an urban site revealed the importance of anthropogenic emissions within the Arctic, which caused a different seasonal trend of PAC concentrations.
While the winter PAC levels were found to be mainly influenced by the northwestern Eurasian emissions, the highest concentrations, with levels comparable to and even exceeding the European annual mean levels, were measured in spring, the coldest period in the high Arctic. Low BLH, suppressed vertical mixing (stable stratification), and frequent thermal inversions facilitated the accumulation of near-ground emissions during spring. This period coincided with a significant increase in local human activities following the several months of winter darkness. Simultaneously, the LRAT was dislocated to be mainly from the area north of the 75∘ N latitude in the North Atlantic Ocean, with no significant PAC sources. The pollution was primarily attributed to local snowmobile-related emissions, resulting in PAH concentrations a factor of 30 higher compared to the Zeppelin background station data. In addition, no typical pristine Arctic summer conditions were observed in Longyearbyen air. The PAC summer levels outreached the winter ones, while they are usually an order of magnitude lower as reported from background stations. Under inhibited LRAT and enhanced PAC photochemical degradation (24 h sun) conditions during summer, these elevated levels indicated fresh local emissions. The PAC, OC, and EC levels depended on wind direction and were found to correlate with the local marine traffic. When the wind blew from the harbour, the average PAC concentrations were up to 2 times higher.
To date, these are the most comprehensive data on the phase-separated concentrations of non-monitored emerging contaminants in the Arctic, like oxy- and nitro-PAHs. These results provide insights into their global fate, persistence in a cold environment (Röhler et al., 2020), and LRAT potential. Moreover, the here-reported study allows the influence of the middle-latitude sources (LRAT) to be distinguished from local sources. This knowledge is essential for authorities working on national and regional regulatory monitoring and remediation strategies and might further provide confidence for choosing new candidates to be routinely measured (Wong et al., 2021) in densely populated areas and in the Arctic (Röhler et al., 2020). As increased shipping, industrial development, and further urbanization of local settlements are predicted to substantially increase in the Arctic due to climate change and declining sea ice cover, it is crucial to stay alert to the levels of the emerging contaminants primarily emitted after fossil fuel burning such as the PACs.
The data set used in this paper is included in the Supplement, and further information is available from the corresponding authors at tatiana.drotikova@unis.no and alexandre.albinet@ineris.fr.
The supplement related to this article is available online at: https://doi.org/10.5194/acp-21-14351-2021-supplement.
TD, RK, and AA designed the study. TD conducted and performed the fieldwork. AA led and validated the chemical analyses. AD produced the meteorological data and assisted in their interpretation. RK provided academic guidance and contributed to the paper preparation. TD and AA interpreted the data and wrote the manuscript with inputs from all co-authors.
The authors declare that they have no conflict of interest.
Publisher's note: Copernicus Publications remains neutral with regard to jurisdictional claims in published maps and institutional affiliations.
The authors thank Valérie Minguet, Arnaud Papin, Ahmad El-Masri, Faustina Fuvel, and Serguei Stavrovski (Ineris) for sample preparation and EC OC and PAC analyses. They acknowledge the Norwegian national archive NorStore (project NS9054K) for the trajectory data retrieved in this study, as well as ECMWF for the ERA5 meteorological data, and personally acknowledge Michael Sprenger (ETH Zurich) for the support in providing the data. They also acknowledge the Swedish EPA and Katarina Hansson (IVL Swedish Environmental Research Institute) for the PAH concentration data monitored at the Pallas (Finland) station and Pernilla Bohlin-Nizzetto and Karl Espen Yttri (NILU) for the PAH, EC, and OC data from the Zeppelin (Svalbard) station. This research was financially supported by UNIS and the French Ministry of Environment.
This paper was edited by Ralf Ebinghaus and reviewed by two anonymous referees.
Abbas, I., Badran, G., Verdin, A., Ledoux, F., Roumié, M., Courcot, D., and Garçon, G.: Polycyclic aromatic hydrocarbon derivatives in airborne particulate matter: sources, analysis and toxicity, Environ. Chem. Lett., 1–37, https://doi.org/10.1007/s10311-017-0697-0, 2018.
Albinet, A., Leoz-Garziandia, E., Budzinski, H., and ViIlenave, E.: Simultaneous analysis of oxygenated and nitrated polycyclic aromatic hydrocarbons on standard reference material 1649a (urban dust) and on natural ambient air samples by gas chromatography–mass spectrometry with negative ion chemical ionisation, J. Chromatogr. A, 1121, 106–113, https://doi.org/10.1016/j.chroma.2006.04.043, 2006.
Albinet, A., Leoz-Garziandia, E., Budzinski, H., and Viilenave, E.: Polycyclic aromatic hydrocarbons (PAHs), nitrated PAHs and oxygenated PAHs in ambient air of the Marseilles area (South of France): Concentrations and sources, Sci. Total Environ., 384, 280–292, https://doi.org/10.1016/j.scitotenv.2007.04.028, 2007.
Albinet, A., Leoz-Garziandia, E., Budzinski, H., Villenave, E., and Jaffrezo, J. L.: Nitrated and oxygenated derivatives of polycyclic aromatic hydrocarbons in the ambient air of two French alpine valleys. Part 1: Concentrations, sources and gas/particle partitioning, Atmos. Environ., 42, 43–54, https://doi.org/10.1016/j.atmosenv.2007.10.009, 2008.
Albinet, A., Tomaz, S., and Lestremau, F.: A really quick easy cheap effective rugged and safe (QuEChERS) extraction procedure for the analysis of particle-bound PAHs in ambient air and emission samples, Sci. Total Environ., 450–451, 31-38, https://doi.org/10.1016/j.scitotenv.2013.01.068, 2013.
Albinet, A., Nalin, F., Tomaz, S., Beaumont, J., and Lestremau, F.: A simple QuEChERS-like extraction approach for molecular chemical characterization of organic aerosols: application to nitrated and oxygenated PAH derivatives (NPAH and OPAH) quantified by GC–NICIMS, Anal. Bioanal.Chem., 406, 3131–3148, https://doi.org/10.1007/s00216-014-7760-5, 2014.
Aliabadi, A. A., Staebler, R. M., and Sharma, S.: Air quality monitoring in communities of the Canadian Arctic during the high shipping season with a focus on local and marine pollution, Atmos. Chem. Phys., 15, 2651–2673, https://doi.org/10.5194/acp-15-2651-2015, 2015.
AMAP: AMAP Assessment 2006: Acidifying Pollutants, Arctic Haze, and Acidification in the Arctic, Oslo, Norway, xii+112 pp., 2006.
AMAP: AMAP Assessment 2015: Black carbon and ozone as Arctic climate forcers, Arctic Monitoring and Assessment Programme (AMAP), Oslo, Norway, 116 pp., 2015.
Arya, S. P.: Air Pollution and Dispersion Meteorology, Oxford University Press, New York, 310 pp., 1999.
Atlas, E. L., Ridley, B. A., and Cantrell, C. A.: The tropospheric ozone production about the spring equinox (TOPSE) experiment: introduction, J. Geophys. Res.-Atmos., 108, 8353, https://doi.org/10.1029/2002JD003172, 2003.
Aubin, C.-P., Girard, E., Langlois, P.-O., Lebreux, Y., and Verner, G.: 4-Stroke IDI Turbocharged Diesel Snowmobile Design, The Clean Snowmobile Challenge 2017 Conference, March 2017, Ann Arbor, Michigan, United States, 2017.
Bailleul, S. and Albinet, A.: Interlaboratory comparison for the analysis of PAHs in ambient air (2018), LCSQA, available at: https://www.lcsqa.org/fr/rapport/interlaboratory-comparison-analysis-pah-ambient-air-2018 (last access: 14 September 2021), 2018.
Balmer, J. and Muir, D.: Polycyclic aromatic hydrocarbons (PAHs), in: AMAP Assessment 2016: Chemicals of emerging Arctic concern, edited by: Hung, H., Letcher, R., and Yu, Y., Arctic Monitoring and Assessment Programme (AMAP), Oslo, Norway, 219–238, 2017.
Balmer, J. E., Hung, H., Yu, Y., Letcher, R. J., and Muir, D. C. G.: Sources and environmental fate of pyrogenic polycyclic aromatic hydrocarbons (PAHs) in the Arctic, Emerging Contaminants, 5, 128–142, https://doi.org/10.1016/j.emcon.2019.04.002, 2019.
Bandowe, B. A. M. and Meusel, H.: Nitrated polycyclic aromatic hydrocarbons (nitro-PAHs) in the environment – A review, Sci. Total Environ., 581–582, 237–257, https://doi.org/10.1016/J.SCITOTENV.2016.12.115, 2017.
Barrie, L. and Platt, U.: Arctic tropospheric chemistry: an overview, Tellus B, 49, 450–454, https://doi.org/10.3402/tellusb.v49i5.15984, 1997.
Berthiaume, A., Galarneau, E., and Marson, G.: Polycyclic aromatic compounds (PACs) in the Canadian environment: Sources and emissions, Environ. Pollut., 116008, https://doi.org/10.1016/j.envpol.2020.116008, 2020.
Bishop, G. A., Morris, J. A., and Stedman, D. H.: Snowmobile contributions to mobile source emissions in Yellowstone National Park, Environ. Sci. Technol., 35, 2874–2881, https://doi.org/10.1021/es010513l, 2001.
Bøckman, R.: Fremtidens energiutfordringer på Svalbard, Longyearbyen Lokalstyre, Norway, available at: http://www.uit.no (last access: 28 January 2020), 10 pp., 2019 (in Norwegian).
Bolton, J. L., Trush, M. A., Penning, T. M., Dryhurst, G., and Monks, T. J.: Role of Quinones in Toxicology, Chem. Res. Toxicol., 13, 135–160, https://doi.org/10.1021/tx9902082, 2000.
Bozem, H., Hoor, P., Kunkel, D., Köllner, F., Schneider, J., Herber, A., Schulz, H., Leaitch, W. R., Aliabadi, A. A., Willis, M. D., Burkart, J., and Abbatt, J. P. D.: Characterization of transport regimes and the polar dome during Arctic spring and summer using in situ aircraft measurements, Atmos. Chem. Phys., 19, 15049–15071, https://doi.org/10.5194/acp-19-15049-2019, 2019.
Browse, J., Carslaw, K. S., Arnold, S. R., Pringle, K., and Boucher, O.: The scavenging processes controlling the seasonal cycle in Arctic sulphate and black carbon aerosol, Atmos. Chem. Phys., 12, 6775–6798, https://doi.org/10.5194/acp-12-6775-2012, 2012.
Bunce, N. J., Liu, L., Zhu, J., and Lane, D. A.: Reaction of Naphthalene and Its Derivatives with Hydroxyl Radicals in the Gas Phase, Environ. Sci. Technol., 31, 2252–2259, https://doi.org/10.1021/es960813g, 1997.
Carrara, M. and Niessner, R.: Impact of a NO2-regenerated diesel particulate filter on PAH and NPAH emissions from an EURO IV heavy duty engine, J. Environ. Monit., 13, 3373–3379, https://doi.org/10.1039/C1EM10573F, 2011.
Carrara, M., Wolf, J.-C., and Niessner, R.: Nitro-PAH formation studied by interacting artificially PAH-coated soot aerosol with NO2 in the temperature range of 295–523 K, Atmos. Environ., 44, 3878–3885, https://doi.org/10.1016/j.atmosenv.2010.07.032, 2010.
Cavalli, F., Viana, M., Yttri, K. E., Genberg, J., and Putaud, J.-P.: Toward a standardised thermal-optical protocol for measuring atmospheric organic and elemental carbon: the EUSAAR protocol, Atmos. Meas. Tech., 3, 79–89, https://doi.org/10.5194/amt-3-79-2010, 2010.
CEN: European Commitee for Standardization, EN-15549: 2008 – Air Quality – Standard Method for the Measurement of the Concentration of Benzo[a]pyrene in Air, CEN, Brussels, Belgium, available at: https://shop.bsigroup.com/ProductDetail?pid=000000000030142046 (last access: 14 September 2021), 2008.
CEN: European Commitee for Standardization, TS-16645: 2014 – Ambient Air – Method for the Measurement of Benz[a]anthracene, Benzo[b]fluoranthene, Benzo[j]fluoranthene, Benzo[k]fluoranthene, Dibenz[a,h]anthracene, Indeno[1,2,3-cd]pyrene and Benzo[ghi]perylene, CEN, Brussels, Belgium, available at: https://shop.bsigroup.com/ProductDetail?pid=000000000030277467 (last access: 14 September 2021), 2014.
CEN: European Commitee for Standardization, EN-16909: 2017 – Ambient air – Measurement of elemental carbon (EC) and organic carbon (OC) collected on filters, CEN, Brussels, Belgium, 2017.
Cesana, G., Kay, J., Chepfer, H., English, J., and De Boer, G.: Ubiquitous low-level liquid-containing Arctic clouds: New observations and climate model constraints from CALIPSO-GOCCP, Geophys. Res. Lett., 39, L20804, https://doi.org/10.1029/2012GL053385, 2012.
Chan, A. W. H., Kautzman, K. E., Chhabra, P. S., Surratt, J. D., Chan, M. N., Crounse, J. D., Kürten, A., Wennberg, P. O., Flagan, R. C., and Seinfeld, J. H.: Secondary organic aerosol formation from photooxidation of naphthalene and alkylnaphthalenes: implications for oxidation of intermediate volatility organic compounds (IVOCs), Atmos. Chem. Phys., 9, 3049–3060, https://doi.org/10.5194/acp-9-3049-2009, 2009.
Clergé, A., Le Goff, J., Lopez, C., Ledauphin, J., and Delépée, R.: Oxy-PAHs: occurrence in the environment and potential genotoxic/mutagenic risk assessment for human health, Crit. Rev. Toxicol., 1–27, https://doi.org/10.1080/10408444.2019.1605333, 2019.
Contini, D., Gambaro, A., Belosi, F., De Pieri, S., Cairns, W. R. L., Donateo, A., Zanotto, E., and Citron, M.: The direct influence of ship traffic on atmospheric PM2.5, PM10 and PAH in Venice, J. Environ. Manage., 92, 2119–2129, https://doi.org/10.1016/j.jenvman.2011.01.016, 2011.
Copernicus C3S: Copernicus Climate Change Service (C3S), ERA5: Fifth generation of ECMWF atmospheric reanalyses of the global climate, Copernicus Climate Change Service Climate Data Store (CDS), 2017.
Cvrčková, O. and Ciganek, M.: Photostability of polycyclic aromatic hydrocarbons (PAHs) and nitrated polycyclic aromatic hydrocarbons (NPAHs) in dichloromethane and isooctane solutions, Polycyclic Aromat. Compd., 25, 141–156, https://doi.org/10.1080/10406630590922166, 2005.
Cvrčková, O., Ciganek, M., and Šimek, Z.: Anthracene, chrysene, their nitro- and methyl-derivatives photostability in isooctane, Polycyclic Aromat. Compd., 26, 331–344, https://doi.org/10.1080/10406630601028221, 2006.
Czech, H., Stengel, B., Adam, T., Sklorz, M., Streibel, T., and Zimmermann, R.: A chemometric investigation of aromatic emission profiles from a marine engine in comparison with residential wood combustion and road traffic: Implications for source apportionment inside and outside sulphur emission control areas, Atmos. Environ., 167, 212–222, https://doi.org/10.1016/j.atmosenv.2017.08.022, 2017.
Dahlke, S., Hughes, N. E., Wagner, P. M., Gerland, S., Wawrzyniak, T., Ivanov, B., and Maturilli, M.: The observed recent surface air temperature development across Svalbard and concurring footprints in local sea ice cover, Int. J. Climatol., 40, 5246–5265, https://doi.org/10.1002/joc.6517, 2020.
Dee, D. P., Uppala, S. M., Simmons, A. J., Berrisford, P., Poli, P., Kobayashi, S., Andrae, U., Balmaseda, M. A., Balsamo, G., Bauer, P., Bechtold, P., Beljaars, A. C. M., van de Berg, L., Bidlot, J., Bormann, N., Delsol, C., Dragani, R., Fuentes, M., Geer, A. J., Haimberger, L., Healy, S. B., Hersbach, H., Hólm, E. V., Isaksen, L., Kållberg, P., Köhler, M., Matricardi, M., McNally, A. P., Monge-Sanz, B. M., Morcrette, J.-J., Park, B.-K., Peubey, C., de Rosnay, P., Tavolato, C., Thépaut, J.-N., and Vitart, F.: The ERA-Interim reanalysis: configuration and performance of the data assimilation system, Q. J. Roy. Meteor. Soc., 137, 553–597, https://doi.org/10.1002/qj.828, 2011.
Dekhtyareva, A.: On local and long-range transported air pollution in Svalbard, Phylosophiae Doctor, University in Tromsø, UiT The Arctic University of Norway, Tromsø, Norway, 2019.
Dekhtyareva, A., Edvardsen, K., Holmén, K., Hermansen, O., and Hansson, H. C.: Influence of local and regional air pollution on atmospheric measurements in Ny-Ålesund, International Journal of Sustainable Development and Planning, 11, 578–587, https://doi.org/10.2495/sdp-v11-n4-578-587, 2016.
Drotikova, T., Ali, A. M., Halse, A. K., Reinardy, H. C., and Kallenborn, R.: Polycyclic aromatic hydrocarbons (PAHs) and oxy- and nitro-PAHs in ambient air of the Arctic town Longyearbyen, Svalbard, Atmos. Chem. Phys., 20, 9997–10014, https://doi.org/10.5194/acp-20-9997-2020, 2020.
Eckhardt, S., Stohl, A., Beirle, S., Spichtinger, N., James, P., Forster, C., Junker, C., Wagner, T., Platt, U., and Jennings, S. G.: The North Atlantic Oscillation controls air pollution transport to the Arctic, Atmos. Chem. Phys., 3, 1769–1778, https://doi.org/10.5194/acp-3-1769-2003, 2003.
Eckhardt, S., Hermansen, O., Grythe, H., Fiebig, M., Stebel, K., Cassiani, M., Baecklund, A., and Stohl, A.: The influence of cruise ship emissions on air pollution in Svalbard – a harbinger of a more polluted Arctic?, Atmos. Chem. Phys., 13, 8401–8409, https://doi.org/10.5194/acp-13-8401-2013, 2013.
ECMWF: European Centre for Medium-Range Weather Forecasts. PART IV: PHYSICAL PROCESSES, in: IFS Documentation CY43R3, IFS Documentation, ECMWF, 221 pp., 2017.
EPA: United States Environmental Protection Agency, Annual Certification Data for Vehicles, Engines, and Equipment, available at: https://www.epa.gov/compliance-and-fuel-economy-data/annual-certification-data-vehicles-engines-and-equipment, last access: 22 November 2020.
Eriksson, K., Tjärner, D., Marqvardsen, I., and Järvholm, B.: Exposure to benzene, toluene, xylenes and total hydrocarbons among snowmobile drivers in Sweden, Chemosphere, 50, 1343–1347, https://doi.org/10.1016/S0045-6535(02)00808-1, 2003.
Fan, Z., Kamens, R. M., Hu, J., Zhang, J., and McDow, S.: Photostability of Nitro-Polycyclic Aromatic Hydrocarbons on Combustion Soot Particles in Sunlight, Environ. Sci. Technol., 30, 1358–1364, https://doi.org/10.1021/es9505964, 1996.
Ferrero, L., Cappelletti, D., Busetto, M., Mazzola, M., Lupi, A., Lanconelli, C., Becagli, S., Traversi, R., Caiazzo, L., Giardi, F., Moroni, B., Crocchianti, S., Fierz, M., Močnik, G., Sangiorgi, G., Perrone, M. G., Maturilli, M., Vitale, V., Udisti, R., and Bolzacchini, E.: Vertical profiles of aerosol and black carbon in the Arctic: a seasonal phenomenology along 2 years (2011–2012) of field campaigns, Atmos. Chem. Phys., 16, 12601–12629, https://doi.org/10.5194/acp-16-12601-2016, 2016.
Fremme, A. and Sodemann, H.: The role of land and ocean evaporation on the variability of precipitation in the Yangtze River valley, Hydrol. Earth Syst. Sci., 23, 2525–2540, https://doi.org/10.5194/hess-23-2525-2019, 2019.
Fu, P., Kawamura, K., and Barrie, L. A.: Photochemical and Other Sources of Organic Compounds in the Canadian High Arctic Aerosol Pollution during Winter-Spring, Environ. Sci. Technol., 43, 286–292, https://doi.org/10.1021/es803046q, 2009.
Garrett, T., Zhao, C., and Novelli, P.: Assessing the relative contributions of transport efficiency and scavenging to seasonal variability in Arctic aerosol, Tellus B, 62, 190–196, https://doi.org/10.1111/j.1600-0889.2010.00453.x, 2010.
GYC: Greater Yellowstone Coalition. Existing Research and Data Regarding the Status of Air Quality in the Greater Yellowstone Ecosystem: A Bibliography, edited by: Hettinger, K., 2011.
Hallquist, M., Wenger, J. C., Baltensperger, U., Rudich, Y., Simpson, D., Claeys, M., Dommen, J., Donahue, N. M., George, C., Goldstein, A. H., Hamilton, J. F., Herrmann, H., Hoffmann, T., Iinuma, Y., Jang, M., Jenkin, M. E., Jimenez, J. L., Kiendler-Scharr, A., Maenhaut, W., McFiggans, G., Mentel, Th. F., Monod, A., Prévôt, A. S. H., Seinfeld, J. H., Surratt, J. D., Szmigielski, R., and Wildt, J.: The formation, properties and impact of secondary organic aerosol: current and emerging issues, Atmos. Chem. Phys., 9, 5155–5236, https://doi.org/10.5194/acp-9-5155-2009, 2009.
Halsall, C. J., Barrie, L. A., Fellin, P., Muir, D., Billeck, B., Lockhart, L., Rovinsky, F. Y., Kononov, E. Y., and Pastukhov, B.: Spatial and temporal variation of polycyclic aromatic hydrocarbons in the Arctic atmosphere, Environ. Sci. Technol., 31, 3593–3599, https://doi.org/10.1021/es970342d, 1997.
Hanssen-Bauer, I., Førland, E., Hisdal, H., Mayer, S., Sandø, A. B., and Sorteberg, A.: Climate in Svalbard 2100 – a knowledge base for climate adaptation. NCCS report no. 1/2019, Norway, 105 pp., 2019.
Heald, C. L. and Kroll, J. H.: The fuel of atmospheric chemistry: Toward a complete description of reactive organic carbon, Sci. Adv., 6, eaay8967, https://doi.org/10.1126/sciadv.aay8967, 2020.
Heeb, N. V., Schmid, P., Kohler, M., Gujer, E., Zennegg, M., Wenger, D., Wichser, A., Ulrich, A., Gfeller, U., Honegger, P., Zeyer, K., Emmenegger, L., Petermann, J.-L., Czerwinski, J., Mosimann, T., Kasper, M., and Mayer, A.: Secondary effects of catalytic diesel particulate filters: conversion of PAHs versus formation of nitro-PAHs, Environ. Sci. Technol., 42, 3773–3779, https://doi.org/10.1021/es7026949, 2008.
Hersbach, H., Bell, B., Berrisford, P., Hirahara, S., Horányi, A., Muñoz-Sabater, J., Nicolas, J., Peubey, C., Radu, R., Schepers, D., Simmons, A., Soci, C., Abdalla, S., Abellan, X., Balsamo, G., Bechtold, P., Biavati, G., Bidlot, J., Bonavita, M., De Chiara, G., Dahlgren, P., Dee, D., Diamantakis, M., Dragani, R., Flemming, J., Forbes, R., Fuentes, M., Geer, A., Haimberger, L., Healy, S., Hogan, R. J., Hólm, E., Janisková, M., Keeley, S., Laloyaux, P., Lopez, P., Lupu, C., Radnoti, G., de Rosnay, P., Rozum, I., Vamborg, F., Villaume, S., and Thépaut, J.-N.: The ERA5 global reanalysis, Q. J. Roy. Meteor. Soc., 146, 1999–2049, https://doi.org/10.1002/qj.3803, 2020.
Hu, S., Herner, J. D., Robertson, W., Kobayashi, R., Chang, M. C. O., Huang, S.-M., Zielinska, B., Kado, N., Collins, J. F., Rieger, P., Huai, T., and Ayala, A.: Emissions of polycyclic aromatic hydrocarbons (PAHs) and nitro-PAHs from heavy-duty diesel vehicles with DPF and SCR, J. Air Waste Manage. Assoc., 63, 984–996, https://doi.org/10.1080/10962247.2013.795202, 2013.
Huang, B., Liu, M., Bi, X., Chaemfa, C., Ren, Z., Wang, X., Sheng, G., and Fu, J.: Phase distribution, sources and risk assessment of PAHs, NPAHs and OPAHs in a rural site of Pearl River Delta region, China, Atmos. Pollut. Res., 5, 210–218, https://doi.org/10.5094/APR.2014.026, 2014.
Huang, C., Hu, Q., Li, Y., Tian, J., Ma, Y., Zhao, Y., Feng, J., An, J., Qiao, L., Wang, H., Jing, S. a., Huang, D., Lou, S., Zhou, M., Zhu, S., Tao, S., and Li, L.: Intermediate Volatility Organic Compound Emissions from a Large Cargo Vessel Operated under Real-World Conditions, Environ. Sci. Technol., 52, 12934–12942, https://doi.org/10.1021/acs.est.8b04418, 2018a.
Huang, C., Hu, Q., Wang, H., Qiao, L., Jing, S. a., Wang, H., Zhou, M., Zhu, S., Ma, Y., Lou, S., Li, L., Tao, S., Li, Y., and Lou, D.: Emission factors of particulate and gaseous compounds from a large cargo vessel operated under real-world conditions, Environ. Pollut., 242, 667–674, https://doi.org/10.1016/j.envpol.2018.07.036, 2018b.
IARC: International Agency for Research on Cancer. Some Chemicals Present in Industrial and Consumer Products, Food and Drinking-water, available at: http://monographs.iarc.fr/ENG/Monographs/vol101/index.php (last access: 14 September 2021), 2012.
Idowu, O., Semple, K. T., Ramadass, K., O'Connor, W., Hansbro, P., and Thavamani, P.: Beyond the obvious: Environmental health implications of polar polycyclic aromatic hydrocarbons, Environ. Int., 123, 543–557, https://doi.org/10.1016/j.envint.2018.12.051, 2019.
International Agency for Research on Cancer: Some non-heterocyclic polycyclic aromatic hydrocarbons and some related exposures, available at: http://monographs.iarc.fr/ENG/Monographs/vol92/mono92.pdf (last access: 14 September 2021), 2010.
Isaksen, K., Nordli, Ø., Førland, E. J., Łupikasza, E., Eastwood, S., and Niedźwiedź, T.: Recent warming on Spitsbergen – Influence of atmospheric circulation and sea ice cover, J. Geophys. Res.-Atmos., 121, 11913–11931, https://doi.org/10.1002/2016JD025606, 2016.
Jimenez, J. L., Canagaratna, M. R., Donahue, N. M., Prevot, A. S. H., Zhang, Q., Kroll, J. H., DeCarlo, P. F., Allan, J. D., Coe, H., Ng, N. L., Aiken, A. C., Docherty, K. S., Ulbrich, I. M., Grieshop, A. P., Robinson, A. L., Duplissy, J., Smith, J. D., Wilson, K. R., Lanz, V. A., Hueglin, C., Sun, Y. L., Tian, J., Laaksonen, A., Raatikainen, T., Rautiainen, J., Vaattovaara, P., Ehn, M., Kulmala, M., Tomlinson, J. M., Collins, D. R., Cubison, M. J., Dunlea, J., Huffman, J. A., Onasch, T. B., Alfarra, M. R., Williams, P. I., Bower, K., Kondo, Y., Schneider, J., Drewnick, F., Borrmann, S., Weimer, S., Demerjian, K., Salcedo, D., Cottrell, L., Griffin, R., Takami, A., Miyoshi, T., Hatakeyama, S., Shimono, A., Sun, J. Y., Zhang, Y. M., Dzepina, K., Kimmel, J. R., Sueper, D., Jayne, J. T., Herndon, S. C., Trimborn, A. M., Williams, L. R., Wood, E. C., Middlebrook, A. M., Kolb, C. E., Baltensperger, U., and Worsnop, D. R.: Evolution of Organic Aerosols in the Atmosphere, Science, 326, 1525–1529, https://doi.org/10.1126/science.1180353, 2009.
Kameda, T.: Atmospheric Reactions of PAH derivatives: Formation and Degradation, in: Polycyclic Aromatic Hydrocarbons: Environmental Behavior and Toxicity in East Asia, edited by: Hayakawa, K., Springer Singapore, Singapore, 75–91, 2018.
Keegan, K. M., Albert, M. R., McConnell, J. R., and Baker, I.: Climate change and forest fires synergistically drive widespread melt events of the Greenland Ice Sheet, P. Natl. Acad. Sci. USA, 111, 7964–7967, 2014.
Keyte, I. J., Harrison, R. M., and Lammel, G.: Chemical reactivity and long-range transport potential of polycyclic aromatic hydrocarbons – a review, Chem. Soc. Rev., 42, 9333–9391, https://doi.org/10.1039/C3CS60147A, 2013.
Kim, K.-H., Jahan, S. A., Kabir, E., and Brown, R. J. C.: A review of airborne polycyclic aromatic hydrocarbons (PAHs) and their human health effects, Environ. Int., 60, 71–80, https://doi.org/10.1016/j.envint.2013.07.019, 2013.
Klonecki, A.: Seasonal changes in the transport of pollutants into the Arctic troposphere-model study, J. Geophys. Res., 108, 8367, https://doi.org/10.1029/2002jd002199, 2003.
Kroll, J. H. and Seinfeld, J. H.: Chemistry of secondary organic aerosol: Formation and evolution of low-volatility organics in the atmosphere, Atmos. Environ., 42, 3593–3624, https://doi.org/10.1016/j.atmosenv.2008.01.003, 2008.
Kystdatahuset: Longyearbyen port traffic as of 2018, available at: https://kystdatahuset.no/ (last access: 5 June 2020), 2018.
Law, K. S., Roiger, A., Thomas, J. L., Marelle, L., Raut, J.-C., Dalsøren, S., Fuglestvedt, J., Tuccella, P., Weinzierl, B., and Schlager, H.: Local Arctic air pollution: Sources and impacts, Ambio, 46, 453–463, https://doi.org/10.1007/s13280-017-0962-2, 2017.
Lawson, R. P., Baker, B. A., Schmitt, C. G., and Jensen, T.: An overview of microphysical properties of Arctic clouds observed in May and July 1998 during FIRE ACE, J. Geophys. Res.-Atmos., 106, 14989–15014, https://doi.org/10.1029/2000JD900789, 2001.
Lee, J. Y. and Lane, D. A.: Unique products from the reaction of naphthalene with the hydroxyl radical, Atmos. Environ., 43, 4886–4893, https://doi.org/10.1016/j.atmosenv.2009.07.018, 2009.
Lei, Y. D. and Wania, F.: Is rain or snow a more efficient scavenger of organic chemicals?, Atmos. Environ., 38, 3557–3571, https://doi.org/10.1016/j.atmosenv.2004.03.039, 2004.
Läderach, A. and Sodemann, H.: A revised picture of the atmospheric moisture residence time, Geophys. Res. Lett., 43, 924–933, https://doi.org/10.1002/2015GL067449, 2016.
Madonna, E., Wernli, H., Joos, H., and Martius, O.: Warm Conveyor Belts in the ERA-Interim Dataset (1979–2010). Part I: Climatology and Potential Vorticity Evolution, J. Climate, 27, 3–26, https://doi.org/10.1175/jcli-d-12-00720.1, 2014.
Marchand, N., Besombes, J. L., Chevron, N., Masclet, P., Aymoz, G., and Jaffrezo, J. L.: Polycyclic aromatic hydrocarbons (PAHs) in the atmospheres of two French alpine valleys: sources and temporal patterns, Atmos. Chem. Phys., 4, 1167–1181, https://doi.org/10.5194/acp-4-1167-2004, 2004.
Matsuzawa, S.: Photodegradation of some Oxygenated Polycyclic Aromatic Hydrocarbons, Polycyclic Aromat. Compd., 21, 331–339, https://doi.org/10.1080/10406630008028543, 2000.
McDaniel, M. and Zielinska, B.: Polycyclic Aromatic Hydrocarbons in the Snowpack and Surface Water in Blackwood Canyon, Lake Tahoe, CA, as Related to Snowmobile Activity, Polycyclic Aromat. Compd., 35, 102–119, https://doi.org/10.1080/10406638.2014.935449, 2014.
Meldrum, J.: Optimization of a Direct-Injected 2-Stroke Cycle Snowmobile, in: Clean Snowmobile Challenge: 1 the Early Years, 4-Stroke Engines Make Their Debut, SAE, USA, 1–14, 2017.
Miet, K., Albinet, A., Budzinski, H., and Villenave, E.: Atmospheric reactions of 9,10-anthraquinone, Chemosphere, 107, 1–6, https://doi.org/10.1016/J.CHEMOSPHERE.2014.02.050, 2014.
Miljødirektoratet: Longyearbyen power plant coal and diesel consumption as of 2018, available at: https://www.norskeutslipp.no/no/Diverse/Virksomhet/?CompanyID=5115 (last access: 12 November 2020), 2018.
Monks, P. S.: A review of the observations and origins of the spring ozone maximum, Atmos. Environ., 34, 3545–3561, https://doi.org/10.1016/S1352-2310(00)00129-1, 2000.
Mulder, M. D., Dumanoglu, Y., Efstathiou, C., Kukučka, P., Matejovičová, J., Maurer, C., Přibylová, P., Prokeš, R., Sofuoglu, A., Sofuoglu, S. C., Wilson, J., Zetzsch, C., Wotawa, G., and Lammel, G.: Fast Formation of Nitro-PAHs in the Marine Atmosphere Constrained in a Regional-Scale Lagrangian Field Experiment, Environ. Sci. Technol., 53, 8914–8924, https://doi.org/10.1021/acs.est.9b03090, 2019.
Nalin, F., Golly, B., Besombes, J.-L., Pelletier, C., Aujay-Plouzeau, R., Verlhac, S., Dermigny, A., Fievet, A., Karoski, N., Dubois, P., Collet, S., Favez, O., and Albinet, A.: Fast oxidation processes from emission to ambient air introduction of aerosol emitted by residential log wood stoves, Atmos. Environ., 143, 15–26, https://doi.org/10.1016/j.atmosenv.2016.08.002, 2016.
Nežiková, B., Degrendele, C., Bandowe, B. A. M., Holubová Šmejkalová, A., Kukučka, P., Martiník, J., Mayer, L., Prokeš, R., Přibylová, P., Klánová, J., and Lammel, G.: Three years of atmospheric concentrations of nitrated and oxygenated polycyclic aromatic hydrocarbons and oxygen heterocycles at a central European background site, Chemosphere, 128738, https://doi.org/10.1016/j.chemosphere.2020.128738, 2020.
Niedźwiedź, T.: The atmospheric circulation, Climate and Climate Change at Hornsund, Svalbard. The Publishing House of Gdynia Maritime University, Gdynia, 2013.
Nordli, Ø., Przybylak, R., Ogilvie, A. E. J., and Isaksen, K.: Long-term temperature trends and variability on Spitsbergen: the extended Svalbard Airport temperature series, 1898–2012, Polar Res., 33, 21349, https://doi.org/10.3402/polar.v33.21349, 2014.
Oanh, P. K., Kazushi, N., Yoshie, N., Tatsuya, T., Yusuke, F., Miho, A., Toshimitsu, S., Kenji, K., Hideaki, M., Hien, T. O. T., and Norimichi, T.: Concentrations of polycyclic aromatic hydrocarbons in Antarctic snow polluted by research activities using snow mobiles and diesel electric generators, Bull. Glaciol. Res., 37, 23–30, https://doi.org/10.5331/bgr.19A02, 2019.
Odabasi, M., Vardar, N., Sofuoglu, A., Tasdemir, Y., and Holsen, T. M.: Polycyclic aromatic hydrocarbons (PAHs) in Chicago air, Sci. Total Environ., 227, 57–67, https://doi.org/10.1016/S0048-9697(99)00004-2, 1999.
Onarheim, I. H., Smedsrud, L. H., Ingvaldsen, R. B., and Nilsen, F.: Loss of sea ice during winter north of Svalbard, Tellus A, 66, 23933, https://doi.org/10.3402/tellusa.v66.23933, 2014.
Perraudin, E., Budzinski, H., and Villenave, E.: Identification and quantification of ozonation products of anthracene and phenanthrene adsorbed on silica particles, Atmos. Environ., 41, 6005–6017, https://doi.org/10.1016/j.atmosenv.2007.03.010, 2007.
Prevedouros, K., Brorström-Lundén, E., J. Halsall, C., Jones, K. C., Lee, R. G. M., and Sweetman, A. J.: Seasonal and long-term trends in atmospheric PAH concentrations: evidence and implications, Environ. Pollut., 128, 17–27, https://doi.org/10.1016/j.envpol.2003.08.032, 2004.
Ravindra, K., Sokhi, R., and Vangrieken, R.: Atmospheric polycyclic aromatic hydrocarbons: Source attribution, emission factors and regulation, Atmos. Environ., 42, 2895–2921, https://doi.org/10.1016/j.atmosenv.2007.12.010, 2008.
Ray, J. D., Bishop, G., Schuchmann, B., Frey, C., Sandu, G., and Graver, B.: Yellowstone Over-snow Vehicle Emission Tests–2012: Preliminary Report, Natural Resource Technical Report NPS/NRPC/ARD/NRTR – 2012, National Park Service, Fort Collins, Colorado, 36 pp., 2012.
Reimann, S., Kallenborn, R., and Schmidbauer, N.: Severe Aromatic Hydrocarbon Pollution in the Arctic Town of Longyearbyen (Svalbard) Caused by Snowmobile Emissions, Environ. Sci. Technol., 43, 4791–4795, https://doi.org/10.1021/es900449x, 2009.
Reisen, F. and Arey, J.: Atmospheric Reactions Influence Seasonal PAH and Nitro-PAH Concentrations in the Los Angeles Basin, Environ. Sci. Technol., 39, 64–73, https://doi.org/10.1021/es035454l, 2005.
Rhea, D. T., Gale, R. W., Orazio, C. E., Peterman, P. H., Harper, D. D., and Farag, A. M.: Polycyclic aromatic hydrocarbons in water, sediment, and snow, from lakes in Grand Teton National Park, Wyoming. Final Report, USGS-CERC-91344, US. Geological Survey, Columbia Environmental Research Center (USGS-CERC), Columbia, South Carolina, USA, 30 pp., 2005.
Ringuet, J., Albinet, A., Leoz-Garziandia, E., Budzinski, H., and Villenave, E.: Reactivity of polycyclic aromatic compounds (PAHs, NPAHs and OPAHs) adsorbed on natural aerosol particles exposed to atmospheric oxidants, Atmos. Environ., 61, 15–22, https://doi.org/10.1016/j.atmosenv.2012.07.025, 2012.
Röhler, L., Schlabach, M., Haglund, P., Breivik, K., Kallenborn, R., and Bohlin-Nizzetto, P.: Non-target and suspect characterisation of organic contaminants in Arctic air – Part 2: Application of a new tool for identification and prioritisation of chemicals of emerging Arctic concern in air, Atmos. Chem. Phys., 20, 9031–9049, https://doi.org/10.5194/acp-20-9031-2020, 2020.
Schmale, J., Arnold, S. R., Law, K. S., Thorp, T., Anenberg, S., Simpson, W. R., Mao, J., and Pratt, K. A.: Local Arctic air pollution: A neglected but serious problem, Earth's Future, 6, 1385–1412, https://doi.org/10.1029/2018ef000952, 2018.
Serreze, M. C., Barrett, A. P., Slater, A. G., Steele, M., Zhang, J., and Trenberth, K. E.: The large-scale energy budget of the Arctic, J. Geophys. Res., 112, D11122, https://doi.org/10.1029/2006jd008230, 2007.
Shahpoury, P., Lammel, G., Albinet, A., Sofuoglu, A., Dumanoğlu, Y., Sofuoglu, S. C., Wagner, Z., and Zdimal, V.: Evaluation of a Conceptual Model for Gas-Particle Partitioning of Polycyclic Aromatic Hydrocarbons Using Polyparameter Linear Free Energy Relationships, Environ. Sci. Technol., 50, 12312–12319, https://doi.org/10.1021/acs.est.6b02158, 2016.
Shahpoury, P., Kitanovski, Z., and Lammel, G.: Snow scavenging and phase partitioning of nitrated and oxygenated aromatic hydrocarbons in polluted and remote environments in central Europe and the European Arctic, Atmos. Chem. Phys., 18, 13495–13510, https://doi.org/10.5194/acp-18-13495-2018, 2018.
Shively, D. D., Pape, B. M. C., Mower, R. N., Zhou, Y., Russo, R., and Sive, B. C.: Blowing Smoke in Yellowstone: Air Quality Impacts of Oversnow Motorized Recreation in the Park, Environ. Manage., 41, 183–199, https://doi.org/10.1007/s00267-007-9036-8, 2008.
Simpson, W. R., von Glasow, R., Riedel, K., Anderson, P., Ariya, P., Bottenheim, J., Burrows, J., Carpenter, L. J., Frieß, U., Goodsite, M. E., Heard, D., Hutterli, M., Jacobi, H.-W., Kaleschke, L., Neff, B., Plane, J., Platt, U., Richter, A., Roscoe, H., Sander, R., Shepson, P., Sodeau, J., Steffen, A., Wagner, T., and Wolff, E.: Halogens and their role in polar boundary-layer ozone depletion, Atmos. Chem. Phys., 7, 4375–4418, https://doi.org/10.5194/acp-7-4375-2007, 2007.
Singh, D. K., Kawamura, K., Yanase, A., and Barrie, L. A.: Distributions of polycyclic aromatic hydrocarbons, aromatic ketones, carboxylic acids, and trace metals in Arctic aerosols: Long-range atmospheric transport, photochemical degradation/production at polar sunrise, Environ. Sci. Technol., 51, 8992–9004, https://doi.org/10.1021/acs.est.7b01644, 2017.
Sippula, O., Stengel, B., Sklorz, M., Streibel, T., Rabe, R., Orasche, J., Lintelmann, J., Michalke, B., Abbaszade, G., Radischat, C., Gröger, T., Schnelle-Kreis, J., Harndorf, H., and Zimmermann, R.: Particle Emissions from a Marine Engine: Chemical Composition and Aromatic Emission Profiles under Various Operating Conditions, Environ. Sci. Technol., 48, 11721–11729, https://doi.org/10.1021/es502484z, 2014.
Sive, B. C., Shively, D., and Pape, B.: Spatial variation of volatile organic compounds associated with snowmobile emissions in Yellowstone National Park, National Park Service, 85 pp., 2003.
Sjöblom, A.: The Ice-atmosphere boundary layer, The University Centre in Svalbard, Norway, Longyearbyen, 30 pp., 2010.
Srivastava, D., Favez, O., Bonnaire, N., Lucarelli, F., Haeffelin, M., Perraudin, E., Gros, V., Villenave, E., and Albinet, A.: Speciation of organic fractions does matter for aerosol source apportionment. Part 2: Intensive short-term campaign in the Paris area (France), Sci. Total Environ., 634, 267–278, https://doi.org/10.1016/j.scitotenv.2018.03.296, 2018.
Statistics Norway: This is Svalbard 2016. What the figures say, Statistics Norway, Oslo, Norway, 28 pp., 2016.
Statistics Norway. Registered vehicles, by region, statistical variable per year, data for 2018, available at: https://www.ssb.no/statbank/table/11823/ (last access: 5 June 2020), 2018.
Statistics Norway: Longyearbyen and Ny-Ålesund population as of 2020, available at: https://www.ssb.no/befolkning/statistikker/befsvalbard, last access: 12 November 2020.
Stohl, A.: Characteristics of atmospheric transport into the Arctic troposphere, J. Geophys. Res.-Atmos., 111, D11306, https://doi.org/10.1029/2005jd006888, 2006.
Stohl, A., Eckhardt, S., Forster, C., James, P., and Spichtinger, N.: On the pathways and timescales of intercontinental air pollution transport, J. Geophys. Res.-Atmos., 107, ACH 6-1–ACH 6-17, https://doi.org/10.1029/2001JD001396, 2002.
Stohl, A., Forster, C., Frank, A., Seibert, P., and Wotawa, G.: Technical note: The Lagrangian particle dispersion model FLEXPART version 6.2, Atmos. Chem. Phys., 5, 2461–2474, https://doi.org/10.5194/acp-5-2461-2005, 2005.
Stohl, A., Berg, T., Burkhart, J. F., Fjǽraa, A. M., Forster, C., Herber, A., Hov, Ø., Lunder, C., McMillan, W. W., Oltmans, S., Shiobara, M., Simpson, D., Solberg, S., Stebel, K., Ström, J., Tørseth, K., Treffeisen, R., Virkkunen, K., and Yttri, K. E.: Arctic smoke – record high air pollution levels in the European Arctic due to agricultural fires in Eastern Europe in spring 2006, Atmos. Chem. Phys., 7, 511–534, https://doi.org/10.5194/acp-7-511-2007, 2007.
Stull, R. B.: An introduction to boundary layer meteorology, Kluwer Academic Publishers, Dordrecht, the Netherlands, 1988.
Tomaz, S., Shahpoury, P., Jaffrezo, J.-L., Lammel, G., Perraudin, E., Villenave, E., and Albinet, A.: One-year study of polycyclic aromatic compounds at an urban site in Grenoble (France): Seasonal variations, gas/particle partitioning and cancer risk estimation, Sci. Total Environ., 565, 1071–1083, https://doi.org/10.1016/j.scitotenv.2016.05.137, 2016.
U.S. NPS: National Park Service, Best Available Technology (BAT) Snowmobiles as of December 15th, 2015, available at: https://www.nps.gov/yell/planyourvisit/newbatlist.htm (last access: 30 December 2020), 2015.
van Pelt, W. J. J., Kohler, J., Liston, G. E., Hagen, J. O., Luks, B., Reijmer, C. H., and Pohjola, V. A.: Multidecadal climate and seasonal snow conditions in Svalbard, J. Geophys. Res.-Earth Surf., 121, 2100–2117, https://doi.org/10.1002/2016JF003999, 2016.
Verlhac, S., Albinet, A., Cabillic, J., Lalère, B., and Fallot, C.,: European Interlaboratory Comparison for the analysis of PAHs in ambient air (2015), LCSQA, available at: https://www.lcsqa.org/fr/rapport/2015/ineris/european-interlaboratory-comparison-for-the-analysis-of-pah-in-ambient-air (last access: 14 September 2021), 2015.
Vestreng, V., Kallenborn, R., and Økstad, E.: Norwegian Arctic climate: climate influencing emissions, scenarios and mitigation options at Svalbard, Klima- og forurensningsdirektoratet [Climate and Pollution Agency], Oslo, Norway, 56 pp., 2009.
Walgraeve, C., Demeestere, K., Dewulf, J., Zimmermann, R., and Van Langenhove, H.: Oxygenated polycyclic aromatic hydrocarbons in atmospheric particulate matter: Molecular characterization and occurrence, Atmos. Environ., 44, 1831–1846, https://doi.org/10.1016/j.atmosenv.2009.12.004, 2010.
Wallace, J. M. and Hobbs, P. V.: Atmospheric science: an introductory survey, Elsevier, 2006.
Wang, R., Tao, S., Wang, B., Yang, Y., Lang, C., Zhang, Y., Hu, J., Ma, J., and Hung, H.: Sources and Pathways of Polycyclic Aromatic Hydrocarbons Transported to Alert, the Canadian High Arctic, Environ. Sci. Technol., 44, 1017–1022, https://doi.org/10.1021/es902203w, 2010.
WHO: The World Health Organization, Environmental health criteria 229, Selected nitro- and nitro-oxy-polycyclic aromatic hydrocarbons, 511, available at: http://whqlibdoc.who.int/ehc/WHO_EHC_229.pdf (last access: 14 September 2021), 2003.
Wickström, S.: Warmer and wetter winters over the high-latitude North Atlantic: an atmospheric circulation perspective, Doctoral thesis, UiB, The University of Bergen, Bergen, Norway, 2020.
Wickström, S., Jonassen, M. O., Cassano, J. J., and Vihma, T.: Present Temperature, Precipitation, and Rain-on-Snow Climate in Svalbard, J. Geophys. Res.-Atmos., 125, e2019JD032155, https://doi.org/10.1029/2019JD032155, 2020a.
Wickström, S., Jonassen, M. O., Vihma, T., and Uotila, P.: Trends in cyclones in the high-latitude North Atlantic during 1979–2016, Q. J. Roy. Meteor. Soc., 146, 762–779, https://doi.org/10.1002/qj.3707, 2020b.
Willis, M. D., Leaitch, W. R., and Abbatt, J. P. D.: Processes controlling the composition and abundance of Arctic aerosol, Rev. Geophys., 56, 621–671, https://doi.org/10.1029/2018rg000602, 2018.
Willis, M. D., Bozem, H., Kunkel, D., Lee, A. K. Y., Schulz, H., Burkart, J., Aliabadi, A. A., Herber, A. B., Leaitch, W. R., and Abbatt, J. P. D.: Aircraft-based measurements of High Arctic springtime aerosol show evidence for vertically varying sources, transport and composition, Atmos. Chem. Phys., 19, 57–76, https://doi.org/10.5194/acp-19-57-2019, 2019.
Wong, F., Hung, H., Dryfhout-Clark, H., Aas, W., Bohlin-Nizzetto, P., Breivik, K., Mastromonaco, M. N., Lundén, E. B., Ólafsdóttir, K., Sigurðsson, Á., Vorkamp, K., Bossi, R., Skov, H., Hakola, H., Barresi, E., Sverko, E., Fellin, P., Li, H., Vlasenko, A., Zapevalov, M., Samsonov, D., and Wilson, S.: Time Trends Of Persistent Organic Pollutants (Pops) And Chemicals Of Emerging Arctic Concern (Ceac) In Arctic Air From 25 Years Of Monitoring, Sci. Total Environ., 775, 145109, https://doi.org/10.1016/j.scitotenv.2021.145109, 2021.
Yu, Y., Katsoyiannis, A., Bohlin-Nizzetto, P., Brorström-Lundén, E., Ma, J., Zhao, Y., Wu, Z., Tych, W., Mindham, D., Sverko, E., Barresi, E., Dryfhout-Clark, H., Fellin, P., and Hung, H.: Polycyclic aromatic hydrocarbons not declining in Arctic air despite global emission reduction, Environ. Sci. Technol., 53, 2375–2382, https://doi.org/10.1021/acs.est.8b05353, 2019.
Zhan, J., Gao, Y., Li, W., Chen, L., Lin, H., and Lin, Q.: Effects of ship emissions on summertime aerosols at Ny-Alesund in the Arctic, Atmos. Pollut. Res., 5, 500–510, https://doi.org/10.5094/apr.2014.059, 2014.
Zhang, F., Chen, Y., Tian, C., Lou, D., Li, J., Zhang, G., and Matthias, V.: Emission factors for gaseous and particulate pollutants from offshore diesel engine vessels in China, Atmos. Chem. Phys., 16, 6319–6334, https://doi.org/10.5194/acp-16-6319-2016, 2016.
Zhang, F., Chen, Y., Cui, M., Feng, Y., Yang, X., Chen, J., Zhang, Y., Gao, H., Tian, C., Matthias, V., and Liu, H.: Emission factors and environmental implication of organic pollutants in PM emitted from various vessels in China, Atmos. Environ., 200, 302–311, https://doi.org/10.1016/j.atmosenv.2018.12.006, 2019.
Zhang, F., Guo, H., Chen, Y., Matthias, V., Zhang, Y., Yang, X., and Chen, J.: Size-segregated characteristics of organic carbon (OC), elemental carbon (EC) and organic matter in particulate matter (PM) emitted from different types of ships in China, Atmos. Chem. Phys., 20, 1549–1564, https://doi.org/10.5194/acp-20-1549-2020, 2020.
Zhang, X., Walsh, J. E., Zhang, J., Bhatt, U. S., and Ikeda, M.: Climatology and Interannual Variability of Arctic Cyclone Activity: 1948–2002, J. Clim., 17, 2300–2317, https://doi.org/10.1175/1520-0442(2004)017<2300:CAIVOA>2.0.CO;2, 2004.
Zhao, J., Zhang, Y., Wang, T., Sun, L., Yang, Z., Lin, Y., Chen, Y., and Mao, H.: Characterization of PM2.5-bound polycyclic aromatic hydrocarbons and their derivatives (nitro-and oxy-PAHs) emissions from two ship engines under different operating conditions, Chemosphere, 225, 43–52, https://doi.org/10.1016/j.chemosphere.2019.03.022, 2019.
Zhao, J., Zhang, Y., Chang, J., Peng, S., Hong, N., Hu, J., Lv, J., Wang, T., and Mao, H.: Emission characteristics and temporal variation of PAHs and their derivatives from an ocean-going cargo vessel, Chemosphere, 249, 126194, https://doi.org/10.1016/j.chemosphere.2020.126194, 2020.
Zhou, Y., Shively, D., Mao, H., Russo, R. S., Pape, B., Mower, R. N., Talbot, R., and Sive, B. C.: Air Toxic Emissions from Snowmobiles in Yellowstone National Park, Environ. Sci. Technol., 44, 222–228, https://doi.org/10.1021/es9018578, 2010.