the Creative Commons Attribution 4.0 License.
the Creative Commons Attribution 4.0 License.
 | 24 Sep 2021
Exploring the composition and volatility of secondary organic aerosols in mixed anthropogenic and biogenic precursor systems
Aristeidis Voliotis
Yunqi Shao
Thomas J. Bannan
Carl J. Percival
Spyros N. Pandis
M. Rami Alfarra
Gordon McFiggans
Secondary organic aerosol (SOA) formation from mixtures of volatile precursors may be influenced by the molecular interactions of the components of the mixture. Here, we report measurements of the volatility distribution of SOA formed from the photo-oxidation of o-cresol, α-pinene, and their mixtures, representative anthropogenic and biogenic precursors, in an atmospheric simulation chamber. The combination of two independent thermal techniques (thermal denuder, TD, and the Filter Inlet for Gases and Aerosols coupled to a high-resolution time-of-flight chemical ionization mass spectrometer, FIGAERO-CIMS) to measure the particle volatility, along with detailed gas- and particle-phase composition measurements, provides links between the chemical composition of the mixture and the resultant SOA particle volatility. The SOA particle volatility obtained by the two independent techniques showed substantial discrepancies. The particle volatility obtained by the TD was wider, spanning across the LVOC and SVOC range, while the respective FIGAERO-CIMS derived using two different methods (i.e. calibrated Tmax and partitioning calculations) was substantially higher (mainly in the SVOC and IVOC, respectively) and narrow. Although the quantification of the SOA particle volatility was challenging, both techniques and methods showed similar trends, with the volatility of the SOA formed from the photo-oxidation of α-pinene being higher than that measured in the o-cresol system, while the volatility of the SOA particles of the mixture was between those measured at the single-precursor systems. This behaviour could be explained by two opposite effects, the scavenging of the larger molecules with lower volatility produced in the single-precursor experiments that led to an increase in the average volatility and the formation of unique-to-the-mixture products that had higher O:C, MW, and, consequently, lower volatility compared to those derived from the individual precursors. We further discuss the potential limitations of FIGAERO-CIMS to report quantitative volatilities and their implications for the reported results, and we show that the particle volatility changes can be qualitatively assessed, while caution should be taken when linking the chemical composition to the particle volatility. These results present the first detailed observations of SOA particle volatility and composition in mixed anthropogenic and biogenic systems and provide an analytical context that can be used to explore particle volatility in chamber experiments.
- Article
(1142 KB) - Full-text XML
- Companion paper 2
- Companion paper 3
- Companion paper 4
-
Supplement
(1260 KB) - BibTeX
- EndNote


Aerosol particles are ubiquitous in the atmosphere, with substantial impacts on climate (Ramanathan et al., 2001) and human health (Lelieveld et al., 2015; Brunekreef and Holgate, 2002). These particles may contain a wide variety of compounds, with the organic fraction contributing up to 90 % of the mass in the submicron size range (Jimenez et al., 2009). The majority of this fraction is comprised of secondary organic aerosol (SOA) (Kanakidou et al., 2005; Hallquist et al., 2009; Shrivastava et al., 2017). SOA is formed by the oxidation of volatile organic compounds (VOCs) in the atmosphere. These reactions result in a variety of products that can be more or less volatile than their precursors, depending on the underlying chemical processes in the gas and/or condensed phase (Donahue et al., 2012). The less volatile products of these reactions tend to partition to pre-existing particles and/or nucleate to form new particles. SOA-containing particles can substantially affect climate due to their optical properties (Moise et al., 2015) and their ability to act as cloud condensation nuclei (CCN) (McFiggans et al., 2006), while their potential adverse effects on human health have recently drawn attention (Chowdhury et al., 2018; Kramer et al., 2016). Our current mechanistic understanding and the resulting SOA representation in predictive models remain inadequate (Shrivastava et al., 2017; McFiggans et al., 2019), leading to a significant uncertainty in the assessment of their impacts.
The analytical limitations in the characterization and detection of all oxidation products as well as the complexity of the ever-evolving atmosphere (Isaacman-VanWertz et al., 2018) make the understanding of the SOA behaviour challenging. Atmospheric simulation chambers have been employed as a tool to study the formation and aging of SOA under simplified conditions (Burkholder et al., 2017). The oxidation of biogenic VOC (bVOC), and particularly terpenes, has been studied extensively in chamber experiments, mainly as a result of their large contribution to global emissions (Spracklen et al., 2011) and their strong SOA formation potential (Lee et al., 2006). Although anthropogenic VOC (aVOC) emissions contribute less to the global emissions (Goldstein and Galbally, 2007) than the respective biogenic ones (Aiken et al., 2009), at a regional scale their relative emissions may be substantially higher; therefore, they have been widely studied as SOA precursors in chamber experiments (Baltensperger et al., 2005; Wyche et al., 2009). These experiments have shown that both biogenic and anthropogenic VOC oxidation can yield hundreds or thousands of products that are highly reactive and have a wide range of volatilities (Hallquist et al., 2009).
The SOA volatility is strongly dependent on the molecular weight of the compounds (Li et al., 2016) and their functionality (and, to a lesser extent, the activity coefficients) (McFiggans et al., 2010; Barley et al., 2009; Topping et al., 2011). Condensed-phase reactions may further alter the SOA volatility (Kroll and Seinfeld, 2008). Therefore, the chemical reactions in both the gas and condensed phases determine the aerosol volatility and thereby the partitioning of the species between the two phases and their subsequent transformation pathways.
Recently, the formation of highly oxygenated organic molecules (HOMs), defined as organic compounds with at least six oxygen atoms through the autoxidation of peroxy radicals (RO2) (Bianchi et al., 2019), has been shown to be a critical process affecting the growth of newly formed particles (Tröstl et al., 2016; Stolzenburg et al., 2018). The fate of RO2, which can participate in autoxidation or other explicit termination reactions such as RO2+HO2, RO2+NO, and RO2 cross-reactions, has a determinant role in the SOA formation and volatility (Schervish and Donahue, 2020).
Chamber studies have mainly focused on studying the SOA formation and their resultant properties from a single VOC precursor. Recently, however, McFiggans et al. (2019) showed that upon mixing bVOC precursors, the SOA formation is governed by the molecular interactions of the products. Specifically, it was shown that upon mixing a high- and low-yield bVOC (α-pinene and isoprene, respectively), the overall SOA formation was suppressed due to i) the hydroxyl radical (OH) scavenging by the lower-yield isoprene and ii) due to product scavenging. In the second process, it was surmised that the peroxy radical (RO2) oxidation products of isoprene were scavenging the highly oxygenated RO2 oxidation products (HOM-RO2) of the α-pinene, leading to higher-volatility products. This demonstrates that product interactions in mixed-precursor systems may alter the product distribution, with consequent implications for the SOA formation and properties.
In this work, we extend the system studied by McFiggans et al. (2019; i.e. α-pinene and isoprene) with the investigation of the interactions of an aVOC with the two bVOCs. We selected ortho-cresol (hereafter o-cresol), a product of toluene oxidation and also a directly emitted aromatic species, as a representative aVOC. In each system, the initial concentrations of the reactants were adjusted to have equal reactivity towards OH at the beginning of each experiment such that the mixtures were initially iso-reactive towards the dominant oxidant in the system. o-cresol is a convenient choice, enabling similar concentrations of VOC to be used in initially iso-reactive mixtures, owing to its relatively high reactivity with OH and moderate SOA yield (Atkinson, 2000; Henry et al., 2008). This choice of precursors and contributory reactivities enabled investigation of SOA formation with mixed systems containing low-, moderate-, and high-yield precursors (i.e. isoprene; 0 %–4 %; Carlton et al. (2009), o-cresol; 7 %–12 %; Smith et al. (1998); and α-pinene; 20 %–30 %; Eddingsaas et al. (2012a), respectively) with equal initial chances of reacting with the dominant oxidant and equal contributions of first-generation oxidation products. This paper focuses on exploring the ability of the available tools to investigate the SOA particle composition and volatility using the α-pinene and o-cresol subsets of the system as a proof of concept. Subsequent papers will focus on the SOA formation dynamics and other aspects of the binary and ternary mixtures.
The SOA particle volatility in single-precursor systems has been investigated based on the aerosol evaporation after heating (Lopez-Hilfiker et al., 2015; Donahue et al., 2006) by isothermal dilution (Yli-Juuti et al., 2017) or a combination of the two (Louvaris et al., 2017; Cain et al., 2020). Previous works have shown that the oxidation of α-pinene results in low-volatility and semi-volatile components (Zhang et al., 2015), while extremely low-volatility material could be formed from oligomerization reactions (Lopez-Hilfiker et al., 2015). On the other hand, the oxidation of aromatic compounds has recently been shown to proceed through rapid, multiple generations of OH oxidation, resulting in more oxygenated and less volatile material compared to that derived from biogenic precursors (Garmash et al., 2020; Wang et al., 2020). The effect of mixing anthropogenic and biogenic compounds has been investigated to a much lesser extent, with their outcomes being inconclusive. Some studies suggest that the SOA formation could be enhanced (e.g. Shilling et al., 2013) or suppressed (e.g. Ahlberg et al., 2017) in such mixtures. Further, to our knowledge, there is much less information regarding the composition and volatility changes in mixtures of anthropogenic and biogenic precursors.
In this study, we employ two independent thermal techniques (thermal denuder and FIGAERO coupled to a high-resolution time-of-flight chemical ionization mass spectrometer), and we aim to provide the first observational quantification of the volatility of SOA formed from the mixing of an aVOC and a bVOC precursor with modest and high yields, respectively. Additionally, we use detailed gas- and particle-phase composition measurements to contextualize our volatility estimations and identify potential chemical drivers that may influence the SOA particle volatility in such mixtures. We further aim to investigate the ability of the instrumentation used to explore the SOA particle volatility and discuss any potential implications from the interpretation of their results.
2.1 Manchester Aerosol Chamber
The experiments were conducted at the University of Manchester Aerosol Chamber (MAC) facility (Alfarra et al., 2012; Shao et al., 2021). The MAC is an 18 m3 fluorinated ethylene propylene (FEP) bag mounted on three rectangular frames, enclosed in a temperature and relative humidity (RH) controlled housing, operating as a batch reactor. The central frame is fixed, whereas the lower and upper frames are free to move, allowing the bag to collapse and expand as chamber air volume changes, maintaining atmospheric pressure without dilution. Light is generated by a series of halogen lamps (Solux 50 W/4700 K, Solux MR16, USA) and two 6 kW xenon arc lamps (XBO 6000 W/HSLA OFR, Osram) over the range of 290–800 nm. Quartz glass filters were used in front of each arc lamp to reduce the radiation flux below 300 nm and mimic the atmospheric radiation spectrum as closely as possible. The photolysis rate of NO2 (), as computed from steady-state actinometry experiments, was 0.11–0.18 min−1. The O3 formed by NO2 photolysis was itself photolysed in the moist chamber atmosphere ( %) to yield an OH concentration from primary production, as calculated by the decay rate of solely OH-reacting VOCs (e.g. toluene, o-cresol), of around 1×10⁶ molecules cm−3. Liquid VOC precursors (α-pinene and o-cresol; Sigma Aldrich, GC grade ≥99.99 % purity) were added to the chamber by injecting the desired amount into a heated glass bulb and transferred into the chamber using a gentle electronic capture device-grade N4.8 (purity 99.998 %) nitrogen (hereafter ECD N2) stream. Seed particles were nebulized using an aerosol generator (Topaz model ATM 230) from aqueous solutions of ammonium sulfate (Puratonic, 99.999 % purity). NOx concentration was controlled by adding the desired amount of NO2 from a cylinder using ECD N2 as a carrier gas. All the reactants (VOC, NOx, and seed) were introduced to the chamber at a high flow rate (∼3 m3 min−1) during the final fill cycle, resulting in rapid mixing (see Sect. 2.2). The mixing and temperature control throughout the experiment was effected through the use of conditioned air circulated at a high flow rate around the chamber housing, continually agitating the chamber walls without physical contact.
2.2 Experimental procedure
The experiments conducted in this study were representative of “daytime” photo-oxidation in the presence of O3 and OH. This study, as also described above, is part of a broader project investigating SOA derived from mixtures of precursors with distinct yields and properties. Here, we focus on the α-pinene and o-cresol system, as representative biogenic and anthropogenic VOC precursor sources (Hallquist et al., 2009; Schwantes et al., 2017), both with appreciable SOA, yield (7 %–30 %; e.g. Henry et al., 2008; Eddingsaas et al., 2012a). To study the effect of mixing anthropogenic and biogenic precursors on SOA particle volatility, two types of experiments were conducted: (a) single-precursor experiments, where the photo-oxidation of each precursor was studied individually, and (b) mixture experiments, where both precursors were added to the chamber simultaneously. Since o-cresol is practically unreactive towards O3 within our experimental timescales and because α-pinene's lifetime with respect to OH is shorter than towards O3 at the expected oxidant concentrations in our experiment (5.2 vs. 6.3 h; Atkinson, 2000), the concentrations of the reactants were selected based on the reactivity of each precursor with OH. As such, each VOC has equal initial chances of reacting with the dominant oxidant in the mixture experiments, while the overall initial reactivity (defined as the product of the VOC concentration and the reaction rate coefficient with OH; Eq. 1) in both single-precursor and mixture experiments was the same. The ozone concentration at the beginning of each experiment was zero. Ozone is however formed rapidly from the photolysis of NO2 after the lights are turned on to establish a photostationary state and then continuously produced through the oxidation of VOCs in the presence of NOx (Atkinson, 2000). Therefore, our systems are “iso-reactive” at the beginning of each experiment, though not necessarily thereafter. All the experiments were conducted under modest NOx conditions (VOCNOx 6±2 ppbppb) by adding NO2 and moderate RH and temperature conditions (50 %±5 % and 24±2 ∘C, respectively). Ammonium sulfate seed particles (53±12 µg m−3) were added to provide a medium for condensation of the condensable VOC oxidation products to successfully compete with the walls to reduce the influence of vapour wall losses and also to suppress nucleation (Zhang et al., 2014). The initial experimental conditions are summarized in Table 1.
where CVOC,i is the concentration of each VOC () in the system and kOH,i is the reaction rate coefficient of each VOC towards OH ().
Each experiment was comprised of a common set of procedures shown in Fig. S5a in the Supplement. Briefly:
- i.
The “pre-experiment” procedure entailed flushing of the chamber with clean air at a high flow rate (∼3 m3 min−1) for ∼1.5 h.
- ii.
The “chamber stabilization” was established subsequently by leaving the chamber with clean air without reactants. This phase lasted for ∼1 h and the established baselines that were subtracted from the measurements.
- iii.
The “dark unreactive” phase commenced after the addition of the VOC precursor(s), NO2, and seed aerosol to the chamber in the dark. In order to ensure rapid and effective mixing, MAC was partly flushed to an approximate one-third of its volume, and all the reactants were subsequently added to the chamber while filling with clean air to its maximum capacity (i.e. final fill cycle). During this period (also ∼1 h), the initial conditions of the chamber were established.
- iv.
The “experiment” phase commenced when the chamber lights were turned on, initiating the photo-oxidation and consequent SOA formation. Each “experiment” phase lasted for ∼6 h.
- v.
A “post-experiment” cleaning procedure normally comprised the high flow-rate flushing of the chamber with clean air for ∼1.5 h, subsequently filling with a high concentration of O3 (≥1 ppm) and soaking overnight to oxidize any remaining O3-reacting gas-phase organic species. It should be further noted that within the experimental campaign an intensive cleaning procedure was conducted periodically (at least once per week). In this procedure, the chamber was filled with high concentrations of O3 (≥1 ppm) and water vapour (RH≥70 %), and the chamber was illuminated for at least 4 h after the quartz filters were removed in front of the arc lamps to maximize the jO(1D) and thereby the OH levels. The chamber was then flushed for 1.5 h with high flow-rate clean air (3 m3 min−1). All the results given below correspond to the “experiment” phase only.
As shown in Table 1, a number of repeat experiments were conducted for each system in order to increase confidence in the validity of our results as well as to overcome technical difficulties due to instrument failures over certain experiments (see Table S1 in the Supplement). The repeat experiments showed good agreement, as is depicted in the maximum SOA masses (Table 1) as well as from the relatively low standard deviations of the average values within each system for a number of parameters such as the carbon and oxygen number distributions, the sum thermograms, and the mass fraction remaining (see Figs. S1–S4 in the Supplement). In the sections below, three experiments were randomly chosen as characteristic, Experiments 2, 6, and 10 (Table 1) to represent the single α-pinene, single o-cresol, and mixed VOC, respectively.
Table 1Summary of the initial conditions for each of the experiments conducted in this study.
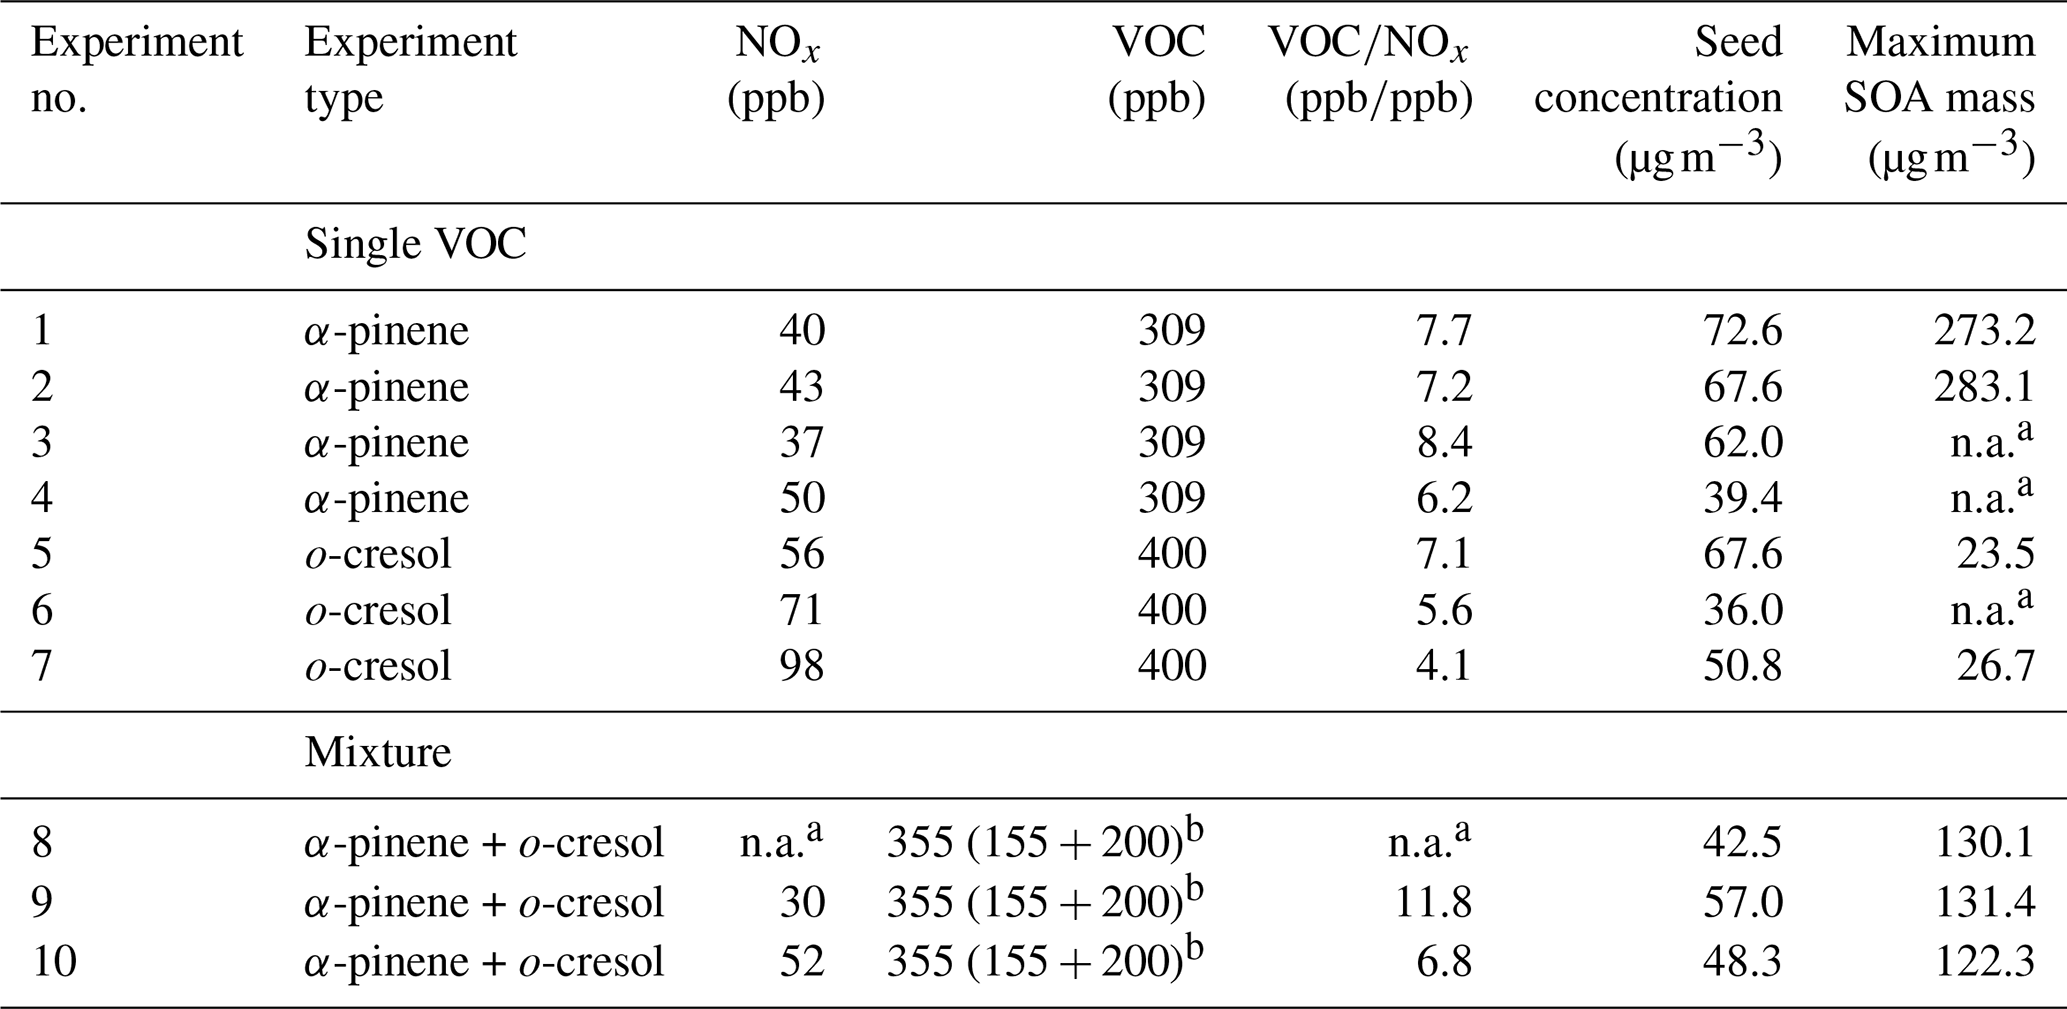
a n.a. values correspond to corresponding instrument failures on the day of the experiment. b Sum of the VOC added in the mixture of the individual concentrations of α-pinene and o-cresol added are shown in the brackets, respectively.
2.3 Instrumentation
2.3.1 TD-AMS/SMPS
A scanning mobility particle sizer (SMPS; DMA 3081 and CPC 3776, TSI Inc., USA) was used to measure aerosol size distributions in the range of 10–670 nm, operating at 0.3 L min−1 (1:10 sample/sheath flow). The non-refractory aerosol chemical composition and mass were measured by a high-resolution time-of-flight aerosol mass spectrometer (HR-ToF-AMS, ARI Inc., USA; hereafter HR-AMS) (DeCarlo et al., 2006), sampling at 0.1 L min−1. The HR-AMS was calibrated regularly using previously published procedures (Jimenez et al., 2003; Allan et al., 2004). Briefly, a series of calibrations using monodisperse ammonium nitrate and sulfate particles (350 nm) were conducted within the experimental campaign. An average ionization efficiency of ammonium nitrate was estimated at ions molecule−1. Based on the ion balance of ammonium nitrate and ammonium sulfate in these calibrations, specific relative ionization efficiencies (RIEs) were determined for and as 3.57±0.02 and 1.28±0.01, respectively. The RIEs for all organics were set to the default value (i.e. 1.4; Alfarra et al., 2004). A real-time collection efficiency (CE) was applied to the data of each experiment by comparing the HR-AMS total mass with the total mass from the SMPS multiplied by an effective density, based on the organic/inorganic ratio from the HR-AMS, assuming densities of 1.77 and 1.4 g cm−3 for the inorganic and organic fractions, respectively. The CE for ammonium sulfate, determined in the “dark unreactive” period, was found to be ∼0.3–0.5, in line with previous findings (Alfarra et al., 2004), and the more SOA condensed, the CE increased to reach almost unity (i.e. ∼0.9–1.1), also in line with previous observations (Matthew et al., 2008).
The TD unit employed here was designed based on the recommendations of Fuentes and McFiggans (2012). Briefly, the sample flow enters and exits the TD unit via a cylindrical 0.12 m-long and 36.6 mm inner diameter (ID) stainless-steel compartment. The heating section, which is placed in a housing with insulating material, has a length of 0.51 m and an ID of 151 mm, and its temperature is controlled by four proportional–integral–derivative (PID) controllers (Watlow EZ-ZONE). A cooling section with a length of 0.2 m and an ID of 20 mm allows the sample to cool down to ambient temperature with minimal re-condensation (Fuentes and McFiggans, 2012). In our configuration, the TD operated at temperatures ranging from 30 to 90 ∘C in 12 steps and the HR-AMS and SMPS sampling alternated between the bypass (BP) and TD every 4 and 6 min, respectively, using a three-way electronic valve. The alternating sampling through the TD unit was initialized at the final 2 h of each experiment, where minimal changes in the aerosol composition over time are expected (i.e. SOA formation rate < wall loss rate). The resulting mass fraction remaining (MFR) in each temperature step was calculated as the ratio of the organics mass (measured by the HR-AMS, hereafter SOA mass) passing through the TD to the average bypass concentration obtained before and after each step. The sample flow rate through the TD and BP was adjusted to 1 L min−1, resulting in an average residence time of the aerosol in the heating section of 31 s, using a vacuum line and a mass flow controller. All the TD data were corrected for particle losses, based on characterization experiments conducted using sodium chloride particles and the SMPS unit to measure the total mass losses for each temperature step.
2.3.2 FIGAERO-ToF-CIMS
Near-real-time gas and particle composition was measured using the Filter Inlet for Gas and Aerosols (FIGAERO; Aerodyne Research Inc.) (Lopez-Hilfiker et al., 2014) coupled to an iodine high-resolution time-of-flight chemical ionization mass spectrometer (Lee et al., 2014) (hereafter FIGAERO-CIMS). Briefly, the FIGAERO manifold allows the determination of both the particle and gas phases by collecting particles on the membrane filter while sampling the gas phase. After a period of time, the deposited aerosol is thermally desorbed using ultra-high-purity (UHP) N2 as a carrier gas. In our setting, particles were sampled from the middle of the chamber through a 2 m long, -inch stainless-steel tube at 1 sL min−1 and deposited on a PTFE filter (Zefluor, 2.0 µm pore size). The flow over the filter was continually monitored by an MKS mass flow metre (MFM) after the sample passed over the filter to ensure a known volume is sampled in each cycle. The gas phase was sampled through a separate line, using a 2 m long, -inch PTFE tubing (Sulyok et al., 2002; Mittal et al., 2013) at 1 sL min−1 that results in a sample residence time of s. This gas-phase sample flow was again constantly measured at MFM at the exhaust of the IMR pump which included the reagent ion flows. The instrument was run in negative-ion mode with a I− reagent ion in all the experiments. The reagent ions were produced by passing a mix of CH3I and UHP N2 over a 210Po radioactive source and passed directly into the IMR.
FIGAERO-CIMS was operated in cyclic mode with 30 min of gas sampling and simultaneous particle collection, followed by 15 min of thermal desorption from ambient to 200 ∘C (temperature ramp period) and then kept constant at the maximum temperature for another 10 min (i.e. soak period) to ensure that all the remaining organic mass was evaporated. Last, FIGAERO was cooled down to ambient temperature within 10 min (i.e. cooling period). An example of the FIGAERO cycle is shown in Fig. S5b and c. In order to account for any potential instrument contamination during the gas-phase sampling, the instrument was flushed with UHP N2 for a period of 0.2 min every 2 min, and thus a gas-phase instrument background value was regularly established. The signal over each background cycle was averaged and was subtracted from the nearest-in-time measurements.
As a result of the low organic particle concentration in the first hours of the o-cresol experiment and for comparison with the concurrent TD measurements, all the results shown by FIGAERO-CIMS here correspond to the data obtained during the last cycle of FIGAERO in each experiment.
It should be noted that quantification from FIGAERO-CIMS in both the particle and gas phases remains challenging as a result of a lack of available standards and the experimental limitations (Riva et al., 2019). Despite a number of studies attempting to constrain those limitations (Lopez-Hilfiker et al., 2016a; Aljawhary et al., 2013), significant challenges remain. Therefore, here, we assumed uniform instrument sensitivity across the whole range of the detected products, and an assessment of the impact of increased sensitivity to particular functional group additions on the reported results is discussed in Sect. 4.3.
2.4 Data analysis
2.4.1 FIGAERO-ToF-CIMS
The FIGAERO-CIMS data were analysed using the Tofware package in Igor Pro (v. 3.2.1., Wavemetrics©) (Stark et al., 2015). The peak fitting was conducted in the region of 190–550 , where the vast majority of the total signal occurred (>70 %, excluding the reagent ions; I−, , , and ). The mass-to-charge calibration was performed in the range of 127–380 using four known masses, I−, CH2O2I−, , and , and the resulting calibration error was within 3 ppm. Initially we sorted all the remaining unit mass resolution (UMR) peaks based on their contribution to the total signal, and we began the HR peak identification in descending order, until ≥80 % of the total signal was assigned. All the elemental formulas were assigned to the HR spectrum according to their mass defect, within ∼6 ppm error. The remaining unidentified individual UMR peaks made minor contributions to the total signal (≤0.3 %), and no possible formulas were available within a reasonable fitting error (i.e. ≤6 ppm), while 30 %–50 % of it had a low signal-to-noise ratio (). In this work, only the species with assigned formulas were considered. Further, note that only the particle-phase data collected during the temperature ramp were considered here as the integration of the data requires a linear increase in the desorption temperature (e.g. Buchholz et al., 2020).
The gas-phase data obtained during the “instrument background” mode (see Sect. 2.3 and Fig. S5b) were averaged in the background cycle and subtracted from the nearest-in-time measurements. To account for any potential background gas-phase species in the chamber, the gas-phase sampling data obtained during the “chamber stabilization” phase were also subtracted from the data obtained during the “experiment” phase (see Sect. 2.2 and Fig. S5). For the particle-phase data, a similar procedure was followed. In certain cases, a high initial particle-phase signal was observed as it was carried out from the gas-phase sampling, with a desorption profile not being evident (see Fig. S5c; example nos. 1 and 4). This is likely the result of the instrument being contaminated by the high levels of “sticky” compounds measured during the gas-phase sampling. In other cases, the high initial particle-phase signal was depleted within several seconds, and a desorption profile was evident (see Fig. S5c; examples 2, 3, and 5). To correct for these interferences, a corresponding particle-phase “instrument background” period was assumed. We selected the 60th–90th second of each desorption cycle as a particle-phase “instrument background” period (Fig. S5c) because (i) the desorption temperature was still at ambient levels (<22 ∘C; Fig. S6b in the Supplement), implying that the thermal desorption process had not yet started, and (ii) this period avoided the “noisy” signal that appeared during the first 10–15 s of each desorption cycle produced by the IMR pressure change due to the actuator shifting position (Fig. S6a). The average signal of the particle-phase “instrument background” period was then subtracted from the raw desorption data, and the resultant thermograms (signal vs. desorption temperature) were integrated using the trapezoid rule. Subsequently, the integrated area of each peak measured during the FIGAERO-CIMS desorption cycle during the “dark unreactive” phase (see Sect. 2.2 and Fig. S5a) was subtracted from the data to remove any seed and/or filter effect. All the subsequent analysis presented in this work contains the background-corrected data.
To identify the products that were uniquely formed in the mixed VOC systems as well as those that uniquely correspond to either precursor in the mixed system, we compared the products identified in single-precursor experiments to those of the mixture as follows. First, the compounds with the same assigned formulas that were found in all systems (i.e. both single-precursor and mixture) were classified as “common”. Subsequently, the remaining products that were found in each single-precursor system and in the mixed system were classified as unique products of either precursor in the mixture. All the remaining products, which were not found in either a single-precursor system nor were classified as “common”, were classified as “initially unique to the mixture”. Finally, in order to take into account any potential products which were not identified in single experiments but still uniquely correspond to either of the two precursors and were potentially miscounted as “unique-to-the-mixture” products, we compared the products categorized as “unique-to-the-mixture” with the Master Chemical Mechanism (MCM v3.2; Saunders et al., 2003; Jenkin et al., 2003). More specifically, the products initially classified as “unique-to-the-mixture” were compared with the product lists of α-pinene and o-cresol found in the MCM, and any products that were found to uniquely match any of the records or were found to be common to all lists were subsequently moved to the corresponding individual precursors or common lists. The above procedure is shown schematically in Fig. S7 in the Supplement.
2.4.2 Volatility retrieval from TD-AMS
The mass fraction remaining (MFR) data obtained from the HR-AMS were used to calculate the volatility distributions of the bulk SOA. The volatility distributions here were expressed as effective saturation concentrations at 298 K (C∗, µg m−3) bins in the volatility basis set (VBS) framework (Donahue et al., 2006) and were calculated by the algorithm of Karnezi et al. (2014). Briefly, the approach uses the thermodynamic mass transfer model of Riipinen et al. (2010) to fit the MFR measurements of the thermodenuder selecting appropriate volatility distributions and effective enthalpies of vaporization. The model neglects any temperature gradients in the TD and assumes a monodisperse aerosol population, equal to the mean volumetric diameter. The inputs of the model, in addition to the MFR measurements, were the average residence time in the heating section (31 s), the length of the heating section (0.51 m), the average volumetric diameter of the particles entering the TD (calculated from SMPS data for the bypass line), and the average total mass concentration bypassing the TD and the SOA density (assumed to be 1.4 g cm−3). The volatility distribution was expressed in six volatility bins spanning from to 2 µg m−3.
2.4.3 Volatility retrieval from FIGAERO-CIMS
In this work, we have estimated the SOA particle volatility from the products identified in FIGAERO-CIMS using two different approaches: (i) using explicit instrument calibrations similar to those described in Bannan et al. (2019) and (ii) based on the gas-to-particle ratio of each individual product and the absorptive partitioning theory.
Briefly, in the former approach, the compound's maximum desorption temperature (Tmax) in FIGAERO-CIMS can be related to their enthalpy of vaporization (Lopez-Hilfiker et al., 2014). After a series of calibrations with compounds with known vapour pressures (Vp), such as the homologous series of polyethylene glycol (PEG) (Krieger et al., 2018), a Tmax–Vp relation can be established (Fig. S8 in the Supplement). In such a way, the vapour pressure of each individual compound could be estimated based on their Tmax and subsequently can be converted to effective saturation concentration, expressed in logarithmically spaced bins (log 10C∗) as follows (Pankow, 1994):
where MWi is the molecular weight of each individual, i, compound (g mol−1), Vp,i is the estimated vapour pressure of each compound from the Tmax vs. Vp calibrations (Pa), αi is the activity coefficient (here assumed to be 1), R is the universal gas constant (), and T is the temperature (K).
It should be noted that recent studies have shown that the filter loading as well as the delivery of the calibrant in FIGAERO (e.g. syringe injection vs. atomising solutions) may affect the Tmax and thereby the volatility estimations (Ylisirniö et al., 2021). Our instrument was rebuilt after the campaign, and consequently calibrations at only one filter loading with the syringe method were available. The implications of this for our results are discussed in Sect. 4.1.
In the latter approach, the fraction of each identified product in the particle phase (i.e. partitioning coefficient, fp,i) was calculated based on
where Particlei and Gasi are the integrated signals of each compound in the particle and gas phases, normalized to their sampling volume (i.e. ions m−3), respectively. The effective saturation concentration of each product () was calculated based on the absorptive partitioning theory using the total absorptive mass concentration (Ctot) obtained by the HR-AMS and the fp,i as follows (Donahue et al., 2006):
Owing to the considerable variability in the sum thermograms (i.e. sum of the thermograms of each individual elemental formula) in the o-cresol experiments (Fig. S3), the volatilities derived from FIGAERO-CIMS are shown here as averages from all the available experiments in each system (see Sects. 3 and 4).
3.1 Gas- and particle-phase composition
Figure 1 shows the average carbon oxidation state () against the number of carbon atoms (nC) of all the products identified in characteristic experiments for each system (experiment nos. 2, 6, and 10; Table 1). In the mixed VOC experiment, the products that corresponded to either precursor, the common ones and those that were classified as unique to the mixture, are indicated with different symbols. Note that the was calculated as , where H:C is the oxygen-to-hydrogen ratio, according to Kroll et al. (2011). Although Priestley et al. (2021) have shown that there is some uncertainty in the calculations of for the N-containing compounds, for simplicity, this effect was neglected here.
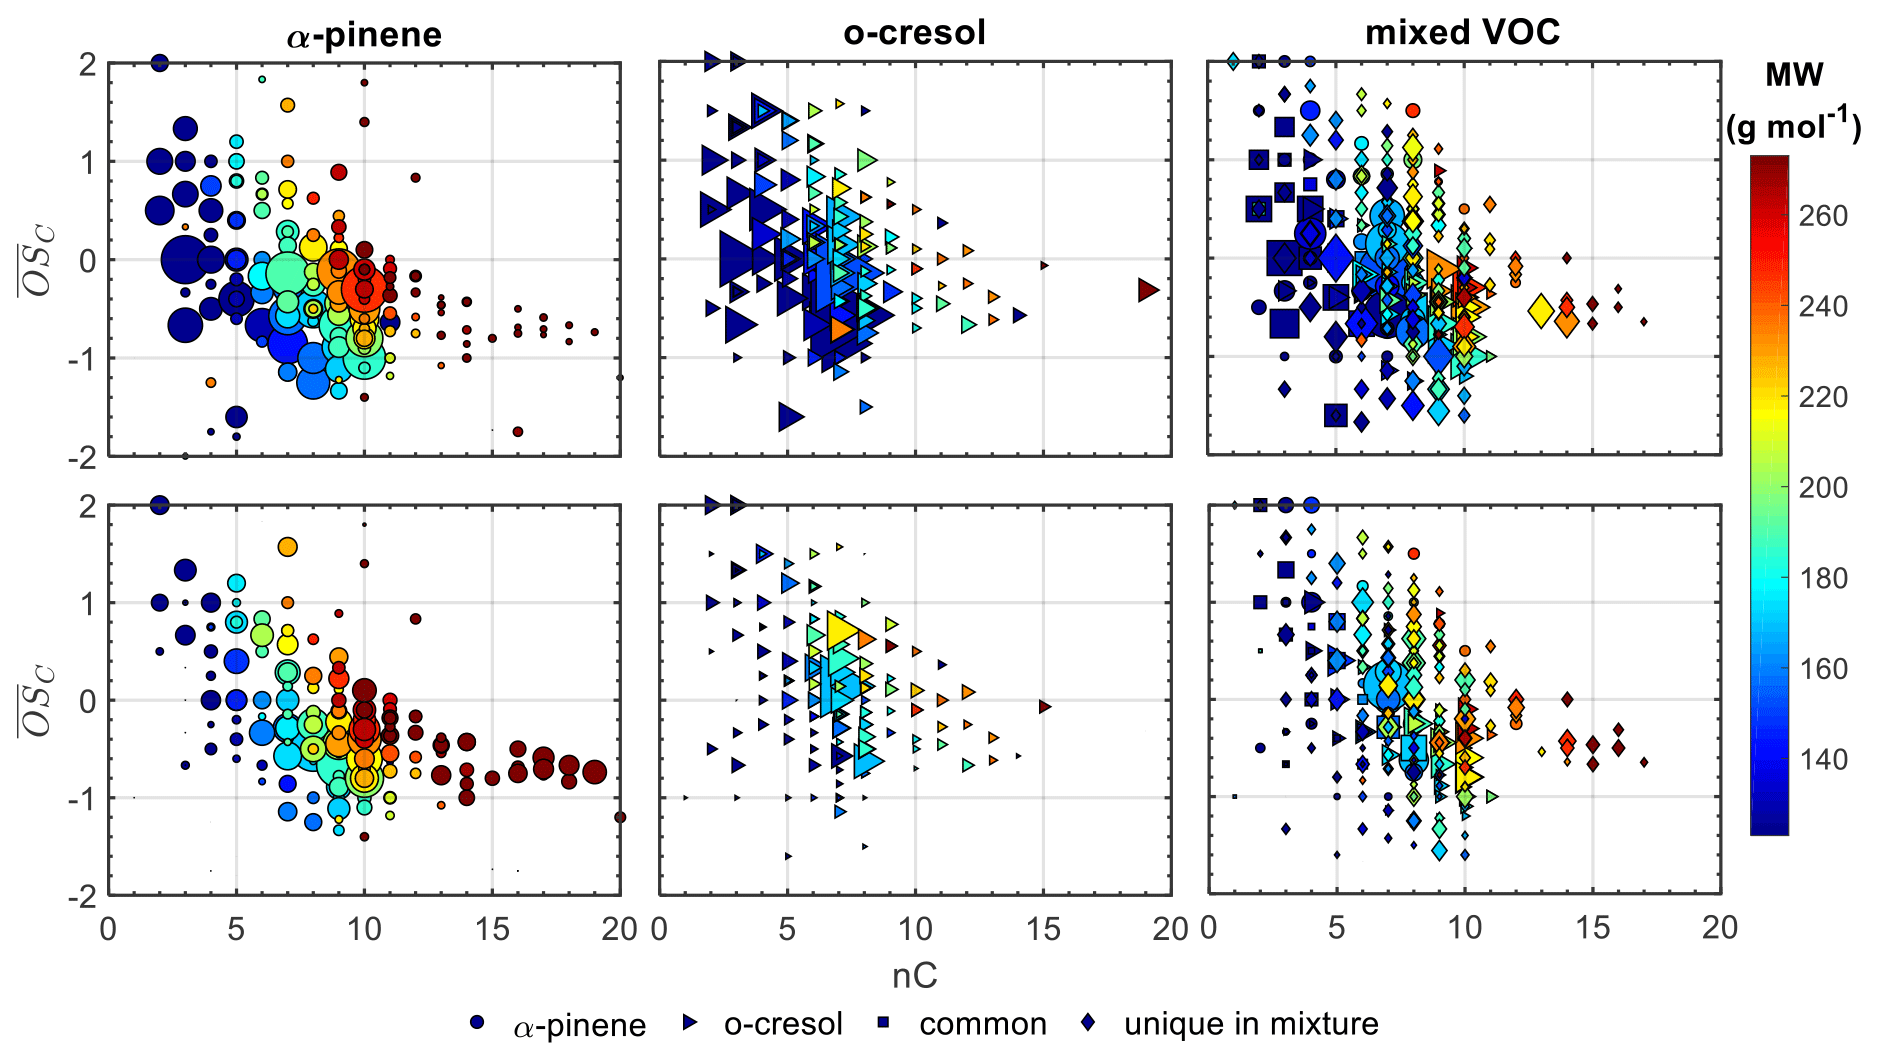
Figure 1Gas (top panels) and particle (bottom panels) average carbon oxidation states () against carbon number (nC) for all the products identified in characteristic experiments for each system (experiment nos. 2, 6, and 10; Table 1). In all the experiments the products from each precursor are represented by different symbols, while in the mixed VOC experiment, the products that were common and unique to the mix are also shown. The symbols are sized based on the square root of their signal intensity and are coloured based on their MW.
In all systems and in both the gas and particle phases, the observed increasing with the decrease in the nC shows evidence of processes derived from radical initiation, propagation, and termination reactions (Hallquist et al., 2009). However, each individual precursor system exhibited distinct features. For example, in the α-pinene single-precursor system, most of the products identified by FIGAERO-CIMS in both the gas and particle phases had the same or fewer carbon atoms than the parent molecule (81 % and 73 % of the total signal in each phase, respectively; for clarity, see Fig. S1). More specifically, in the particle phase, the highest contribution was found for products with nC=10 having between −1.1 and 0.1 and in the gas phase for products with nC=7 and –1. In contrast, in the o-cresol single-precursor system, the vast majority of the identified products in either phase showed a narrow distribution centred around the carbon number of the precursor (i.e. nC=7; Fig. S1). This can be associated with the large signal contribution of two individual products in each phase, assigned as C7H8O2 (50 %) and C7H7NO4 (36 %–40 %) in the gas and particle phases, respectively (Fig. S9 in the Supplement). These products are likely the result of H abstraction and subsequent OH addition and nitration, respectively, suggesting that they are early-generation products. The high contributions of these early-generation products can be associated with the fact that the VOC precursors were not fully consumed within our experimental time frames (Fig. S10 in the Supplement), likely due to the high VOC:OH. As a result, it may be expected that they continuously formed for the duration of the experiment. Alternatively, the strong signal contributions of these products might indicate that our technique is particularly sensitive to these products. In the particle phase of both single-precursor systems, a greater fraction of the signal is associated with products with more carbon atoms than each precursor compared to the respective gas-phase contributions.
In both the gas and particle phases in the mixed VOC system, the largest fraction of the total signal was found for products with nC=7 and in the range of –1.3. In the gas phase, the remaining signal was distributed in the region of nC=4–10 and –2, with stronger contributions at nC=5 with –1.4 and at nC=10 with –0.5. Correspondingly, in the particle phase, the products with nC=8 with –1.3 and nC=10 with –0.5 contributed considerably to the total particle-phase signal. Unlike the single-precursor systems, the contributions of products with more than 10 carbon atoms and –0.5 were not substantially different between the gas and particle phases (Fig. S1).
Most of the products that were common between all systems had low carbon numbers (nC<5) and varying (−0.6–2.5), accounting for a higher fraction of the total gas- than particle-phase signal (18 % vs. 8 %; Fig. S1). In both phases, o-cresol products appeared to have higher contributions to the total gas/particle signal of the mixed VOC system than those derived from the α-pinene, with the majority of the signal being dominated by products with seven carbon atoms and –0.7, similarly to the single-precursor system. The products that were classified as unique products of the mixture accounted for approximately the same fraction in both phases and were mostly found in the space of nC=5–10 and –1.6, with appreciable fractions in the nC>10 and –0.5 ranges.
Figure 2 shows the average (±1σ) O:C ratio of all the products identified in each system from FIGAERO-CIMS in the particle phase, weighted to the contribution of each product to the total particle-phase signal, along with the O:C ratio derived from the HR-AMS. Both the HR-AMS and FIGAERO-CIMS showed comparable results, with the O:C being highest in the o-cresol system (0.68 vs. 0.56, respectively), followed by the mixed VOC (0.47 vs 0.49, respectively) and the α-pinene system (0.35 vs. 0.45, respectively). Although N:C ratios might provide similarly useful information, their quantification with FIGAERO-CIMS and HR-AMS has proven challenging. In particular, the N:C quantification in FIGAERO-CIMS can be affected by the differential sensitivity of the instrument (Iyer et al., 2016), while for the HR-AMS, the extensive fragmentation, which is not readily characterized for the N-containing fragments (Farmer et al., 2010), can affect the estimated N:C.
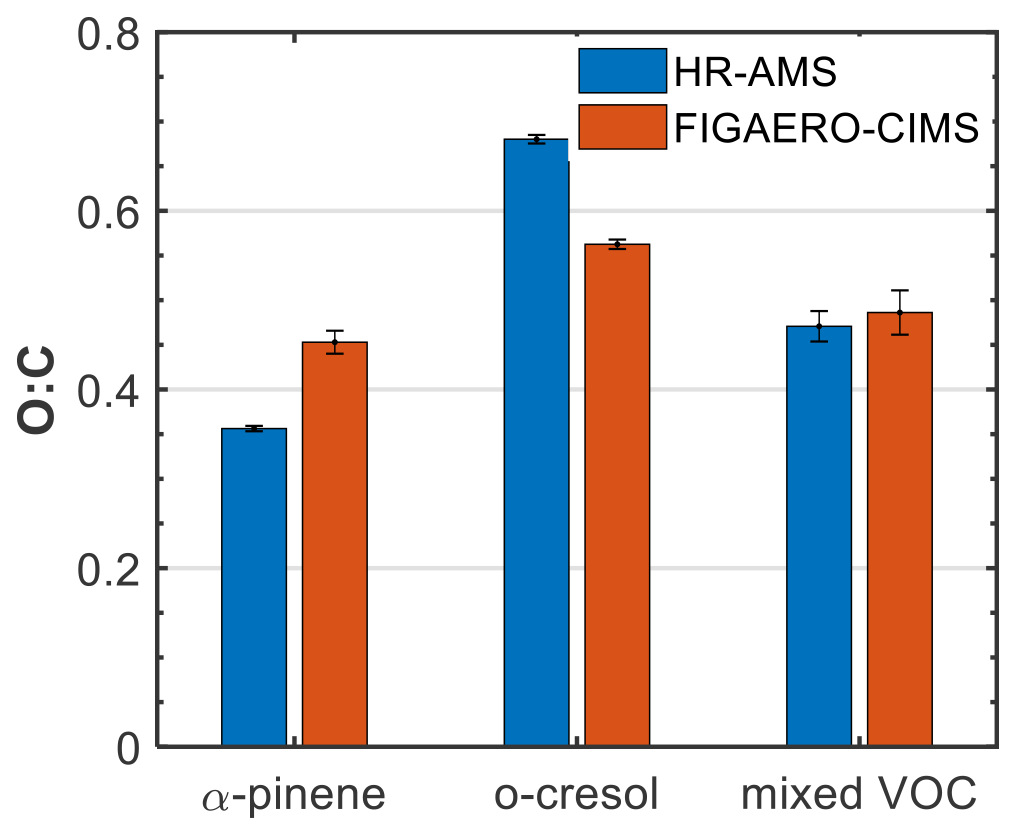
Figure 2Average (±1σ) oxygen-to-carbon (O:C) ratio for all the products identified in the particle phase from FIGAERO-CIMS and HR-AMS for each system.
3.2 SOA particle volatility
3.2.1 Insights into SOA particle volatility from FIGAERO-CIMS
Figure 3 shows the retrieved average (±1σ; n=2) volatility distributions from the products identified in FIGAERO-CIMS in each system using the calibrated Tmax and the partitioning approaches. The distributions in the mixed VOC system (Fig. 3c) show the contributions from the products of either precursor, the common products, and the products unique to the mixture in each volatility bin. The material with can be characterized as low volatility (LVOC), though it should be noted that the bin here also contains compounds with lower volatility, such as extremely LVOC (ELVOC): the material with log 10C∗ between −0.5 and 2.5 as semi-volatile (SVOC) and that with as intermediate volatile (IVOC) (Donahue et al., 2012).
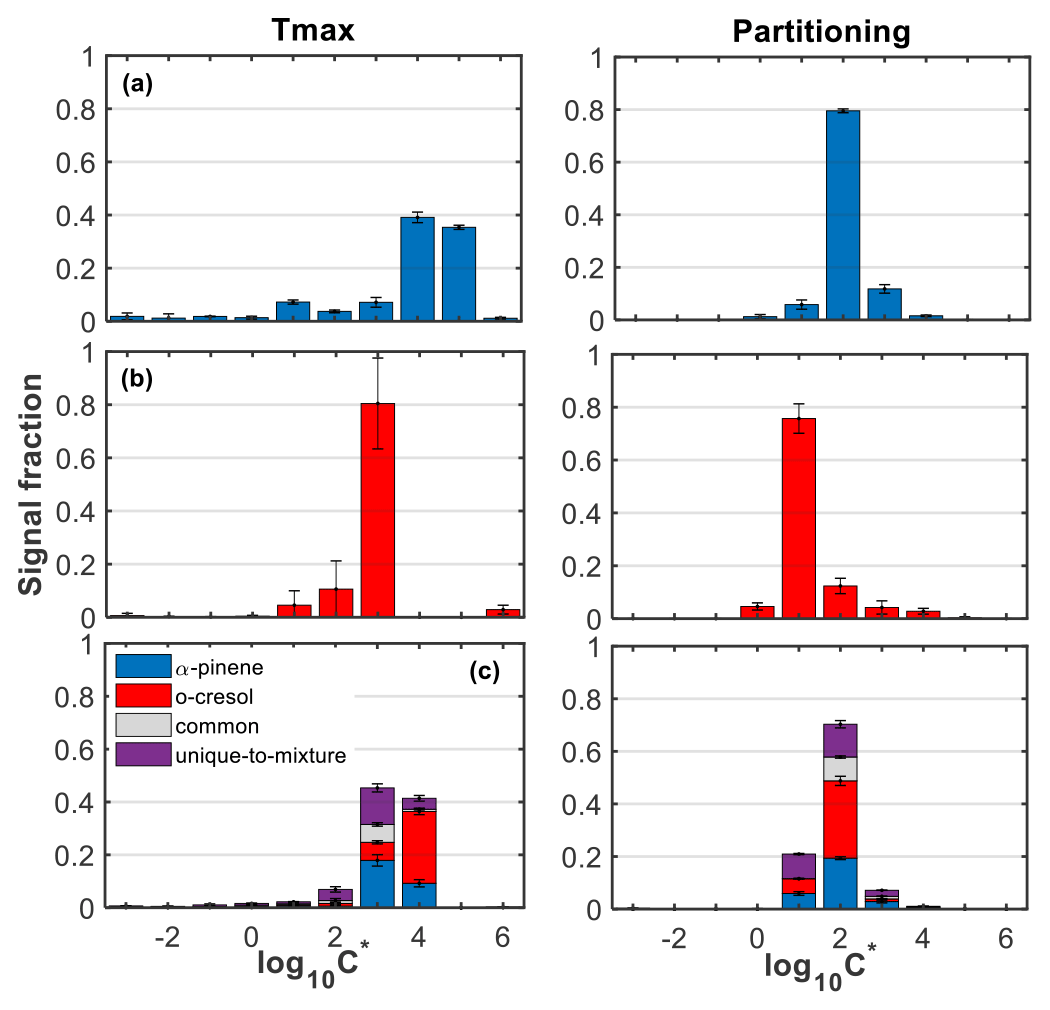
Figure 3Average (±1σ; n=2) volatility distributions as a function of the FIGAERO-CIMS total particle-phase signal in the (a) α-pinene, (b) o-cresol, and (c) mixed VOC systems using the calibrated Tmax (left panels) and partitioning approaches (right panels). The bars in the mixed system are separated to show the contributions from the products of either precursors, the common ones found in all systems, and those that were found to be unique in the mixture.
The SOA particle volatility using the calibrated Tmax approach showed that the vast majority of the particle-phase FIGAERO-CIMS signal was attributed to products with volatilities in the IVOC range, whereas using the partitioning approach, the largest fraction of the signal was attributed to the SVOC range. Characteristically, using the calibrated Tmax approach, the split between LVOC, SVOC, and IVOC was 5 %, 13 %, and 82 % for the α-pinene system, 2 %, 2 %, and 96 % for the o-cresol system, and 2 %, 14 %, and 84 % for the mixed VOC system. In contrast, using the partitioning approach, the respective fractions for the LVOC, SVOC, and IVOC were 0 %, 88 %, and 12 % in the α-pinene system, 0 %, 95 %, and 5 % for the o-cresol system, and 0 %, 90 %, and 10 % for the mixed VOC system.
In more detail, the volatility distribution in the α-pinene system from the calibrated Tmax approach showed strong contributions of products with –5, sharply decreasing to products with lower volatility (). The volatility retrieved from the partitioning approach in that system showed that the largest fraction of the signal (∼80 %) had log 10C∗ between 2 and 3. In contrast, the largest fraction of the particle-phase signal in the o-cresol system appeared to be centred in using the calibrated Tmax approach (∼80 %) and in using the partitioning approach (∼76 %). The volatility distribution derived from either approach appeared to be particularly narrow, which can be associated with high particle-phase signal contributions of the C7H7NO4 in that system (Fig. S9).
The volatility distribution of the mixed VOC system using the calibrated Tmax approach appeared to be largely composed of products with –4, with slightly higher contributions in the bin. The SOA volatility in the mixed system derived from the gas-to-particle ratio of the species had strong signal contributions of compounds with , followed by those with . The products from the photo-oxidation of o-cresol appeared to account for the largest fraction of the particle-phase signal in and 2, in the log 10C∗ space retrieved using the calibrated Tmax and partitioning approaches, respectively. Correspondingly, those derived from the α-pinene had higher contributions in and 1, respectively, while the unique products of the mixture contributed substantially in –3 and 1–2, respectively. The roducts that were found in all systems (i.e. common) showed their highest signal contributions in and in , when their log 10C∗ was derived from the calibrated Tmax and partitioning approaches, respectively.
3.2.2 Insights into the SOA particle volatility from the TD-AMS
The estimated SOA particle volatility distributions (± retrieval error) from the TD measurements for three characteristic experiments (experiment nos. 2, 6, and 10; Table 1) are presented in Fig. 4, expressed in the VBS framework. The bin with may also include the less volatile material (extremely low-volatility organic compounds) and, similarly, the bin with may also include more volatile material. The volatility distribution of the SOA formed in the α-pinene experiment indicates a higher contribution of species with compared to o-cresol and mixture experiments. Conversely, in the o-cresol and in the mixture experiments, the bins with exhibited relatively higher values compared to the single-precursor α-pinene system, suggesting a higher contribution of less volatile material. More specifically, the mass fractions of the LVOC and SVOC were 28 % and 72 % for the α-pinene SOA, 39 % and 61 % for the o-cresol SOA, and 37 % and 63 % for their mixture, respectively.
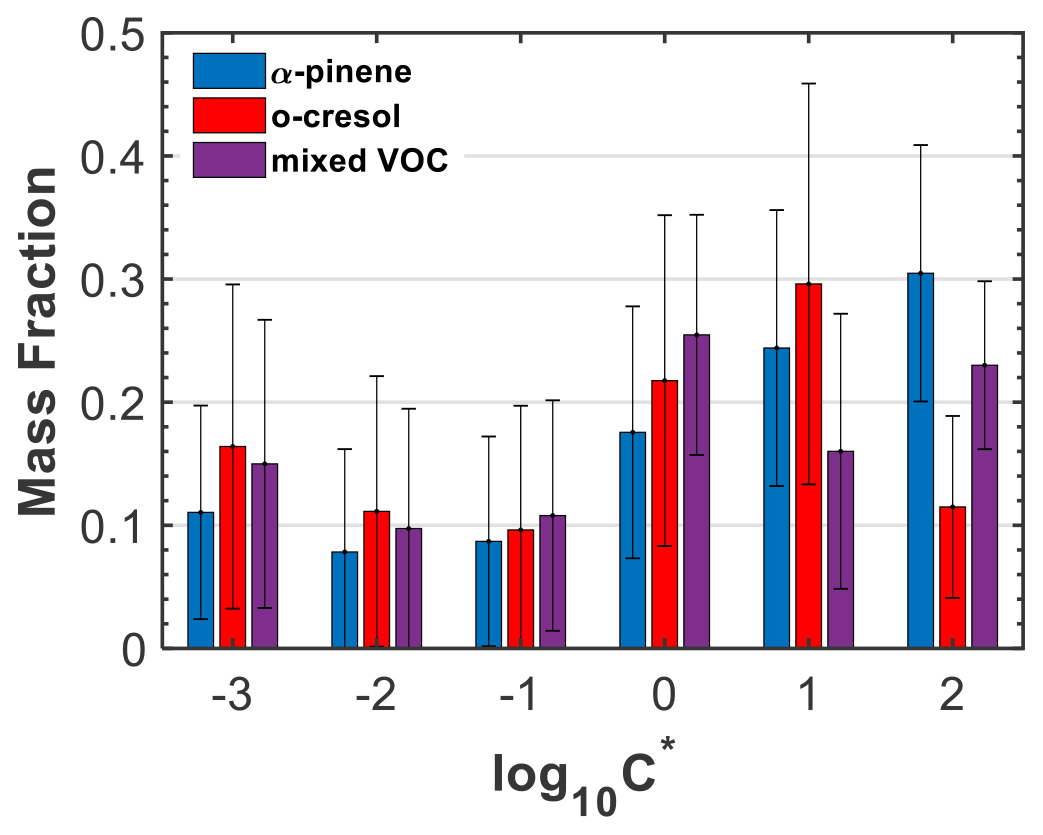
Figure 4SOA particle volatility distributions retrieved from the TD measurements for three characteristic experiments (experiment nos. 2, 6, and 10; Table 1). The error bars represent the uncertainty in the estimated values in each volatility bin.
The volatility distribution inversion algorithm employed here (Karnezi et al., 2014) can also provide the enthalpy of vaporization and the mass accommodation coefficient for each of the experiments investigated. The enthalpy of vaporization was found to be higher in the α-pinene experiment (120 kJ mol−1) and lower at the o-cresol (106 kJ mol−1). This is qualitatively consistent with the larger molecular weight of the molecules in the α-pinene SOA (Fig. 1). The mass accommodation coefficients were above 0.1 in both systems (0.36 for the α-pinene and 0.23 for the o-cresol SOA; Fig. S11 in the Supplement), suggesting only small resistances to mass transfer in the temperature range of the TD (Riipinen et al., 2010; Saleh et al., 2011). The respective values for the mixed VOC experiment were found to be intermediates of those for the individual single-precursor systems (109 kJ mol−1 and 0.27, respectively). Nonetheless, due to the corresponding uncertainties, which were % for the enthalpy of vaporization and much higher for the mass accommodation coefficient, these differences may not reflect the reality.
The relationship between the O:C and the MFR can provide indirect additional information about the volatility of the species in each system. Figure 5 shows the O:C enhancement ratio (i.e. O:C at the TD line divided by the corresponding O:C at the BP line) as a function of the particle MFR for a number of experiments in each system. The increasing O:C enhancement ratio as the MFR decreases in all systems indicates that as the temperature in the TD increases, the remaining SOA particles are less volatile and more oxygenated, consistent with previous observations in chamber experiments (e.g. Huffman et al., 2009). All systems appeared to behave similarly at low TD temperatures (<40 ∘C), with the O:C enhancement ratio being between 1 and 1.04 and MFR>80 %, implying the existence of products with similar degrees of oxygenation and similarly high volatility. However, at higher TD temperatures (>40 ∘C or MFR<0.5), each system showed distinctive features. The SOA particles from the o-cresol system showed the highest O:C enhancement ratio, reaching up to 1.16, followed by those from the mixed VOC and the α-pinene system, which exhibited similar maximum values (1.097 and 1.091, respectively). More specifically, the slope between the highest O:C enhancement ratio and the MFR was twice as high in the o-cresol system compared to the α-pinene system, whereas that of the mixed system was approximately half-way between. These results indicate that the less volatile SOA particles from the o-cresol system (MFR≤0.5) are likely more oxygenated compared to those of the α-pinene system. It should be noted however that in the o-cresol single system, the O:C enhancement ratio in this range showed high variability among the experiments, suggesting that it may not be substantially different than that of the mixed VOC system.

Figure 5O:C enhancement ratio (i.e. O:C at the TD line divided by the corresponding O:C at the BP line) as a function of the particle MFR in each system investigated.
4.1 Comparison of the SOA particle volatility estimation methods
In this work, the SOA particle volatility distribution has been estimated using two independent instrumental techniques, the TD-AMS and FIGAERO-CIMS. The TD-AMS technique can be used to derive volatility estimations for the bulk of the SOA particles, whilst FIGAERO-CIMS is able to detect a subset of the total SOA particles at varying sensitivities (Lee et al., 2014; Lopez-Hilfiker et al., 2014). In the latter technique, the estimation of the particle volatility is possible through several different approaches (e.g. Stark et al., 2017). Here, based on the available information, we estimated the SOA particle volatility in the VBS framework using a series of explicit Tmax–Vp calibrations as well as based on the gas-to-particle ratio of the compounds identified.
Substantial discrepancies were found between the two methods used to derive log 10C∗ of the compounds identified by FIGAERO (Fig. 3), with more than 1 order of magnitude difference. The estimated SOA particle volatility from the calibrated Tmax method was significantly higher compared to that estimated using the partitioning approach. The particularly high volatility estimated with this approach can be attributed to the obtained Tmax–Vp calibrations and the Tmax distribution of the compounds in each system (Figs. S8 and S12 in the Supplement). More specifically, the vast majority of the compounds identified by FIGAERO exhibited Tmax<100 ∘C, which, based on our calibrations, resulted in Pa and thereby high estimated log 10C∗. The series of Tmax–Vp calibrations were conducted in this study using the syringe method. Recently it was shown that this has the potential to shift the Tmax of the compounds to substantially higher values than calibrations using atomized solutions, which may represent more closely the evaporation of the particles in the instrument (Ylisirniö et al., 2021). Consequently, the particularly high SOA particle volatility estimated with this method here might be attributed to the selected delivery of the calibrants on FIGAERO. However, it should be further noted that an appreciable fraction of the total integrated particle signal lies at higher desorption temperatures (Fig. S3), suggesting that a considerable fraction of the ions is observed at the long “tails” but with their maximum peak being at lower temperatures. There are several reasons that may lead to this tailing effect, such as the existence of multiple isomers and/or fragments from the thermal decomposition of oligomers within each HR peak that have lower volatilities and/or a change in the evaporation behaviour due to the changing composition and thereby the activity coefficient of the sample (Schobesberger et al., 2018). There have been attempts to resolve any potential isomers/decomposition products using multi-peak fitting methods (Lutz et al., 2019) or explain the whole thermograms using positive matrix factorization (Buchholz et al., 2020); however, there is some ambiguity in the implementation and interpretation of such approaches.
In contrast, the SOA particle volatility estimated from the partitioning approach was particularly narrow (Fig. 3). The volatility distributions estimated using this approach are limited by the detection limit of the measurable gas-to-particle ratios by FIGAERO (and thereby the calculated fp), where in this study, the measured fp (Fig. S13 in the Supplement) in conjunction with the measured Ctot (Table 1) can result in differences in the log 10C∗ of 1–2 orders of magnitude in each system. Similarly narrow volatility distributions from the partitioning compared to other volatility estimation approaches from FIGAERO have also been observed previously in ambient aerosols and were attributed to signal-to-noise limitations that result in confined fp value ranges (Stark et al., 2017).
The SOA particle volatility distributions estimated from FIGAERO-CIMS using either the calibrated Tmax or the partitioning methods were narrower, and they exhibited considerably higher signal fractions of more volatile material than those estimated by the TD-AMS (Figs. 3 and 4). The SOA particle volatility retrieved from the partitioning approach showed its highest signal contributions at the same log 10C∗ bins as those observed by the TD-AMS technique, while those retrieved by the calibrated Tmax approach were more than 1 order of magnitude higher. The particularly high particle volatility obtained from FIGAERO-CIMS using the calibrated Tmax approach appears most unrealistic, given that compounds with such high volatilities (i.e. ) should be predominantly in the gas phase and cannot explain their large fraction in the particle phase (Fig. S13) at our SOA particle mass loadings. The similarity in the magnitude of the volatilities obtained from the partitioning approach with the independent TD-AMS technique might indicate that it is more realistic. The SOA particle volatility retrieved by the TD-AMS technique has previously been shown to have good agreement with the sum thermograms and is likely closer to reality (Stark et al., 2017). Similarly, here, converting the thermograms of each individual elemental formula to volatility distributions by expressing the desorption temperatures to log 10C∗ based on our Tmax–Vp relation, we obtained comparable volatility distributions to those from the TD-AMS technique (Fig. S14 in the Supplement). This suggests that sum thermograms obtained by FIGAERO-CIMS might lead to more representative qualitative volatility estimations compared to the other methods adopted here. With such an approach, however, the volatility of each individual assigned elemental formula is represented as a distribution instead of a single log 10C∗ value, and any potential artefacts from the thermal decomposition of oligomers are neglected.
The above analysis highlights that the SOA particle volatility estimation from FIGAERO-CIMS is challenging, and the results obtained might be limited based on the selected estimation approach along with any associated assumptions. Clearly, further work is needed in order to better understand the evaporation of the organics in FIGAERO-CIMS and the interpretation of the obtained results. Such an investigation is beyond the scope of the current study. However, both techniques along with the adopted volatility estimation methods showed that the SOA particles from the photo-oxidation of α-pinene were composed by more volatile material compared to those derived from the photo-oxidation of o-cresol, while those derived from the photo-oxidation of the mixture appeared to be somewhere in between. This can be further supported by the “lower-level” data obtained by each technique, i.e. the MFR in the TD (Fig. S4), the sum thermograms/Tmax distribution, and the fp in FIGAERO (Figs. S3, S12, and S13, respectively). Therefore, despite challenges in quantifying the log 10C∗, the broad agreement in the volatility trends between all the methods provides some confidence that the results presented capture the bulk SOA particle volatility changes between the systems.
Considering the above, for the rest of the paper, the volatility distributions estimated using the partitioning approach from FIGAERO will be used to link the chemical composition with the volatility.
4.2 Linking the gas and particle chemical composition to SOA volatility
The gas- and particle-phase composition, as can be obtained by FIGAERO-CIMS, can provide indications of the system chemical behaviour and thereby the potential effect on SOA volatility. Oligomerization is a process that increases the products' molar mass, decreasing their volatility while tending to maintain their . Functionalization also decreases a compound's volatility by the addition of oxygenated functional groups and thus increases their . Fragmentation (i.e. cleavage of carbon–carbon bonds) will increase component volatility due to the decrease in the product's molar mass, though in some cases the fragmented products are subsequently functionalized (e.g. O2 addition after the scission of a double bond), leading to a decrease in their vapour pressure, with the net effect on vapour pressure not immediately predictable. It should be noted that the selected VOC precursors in this study have fundamentally different structures: α-pinene is a bicyclic alkene, while o-cresol is an aromatic molecule. In α-pinene, one C=C bond can be broken by O3 without the loss of C, while the stability of the aromatic ring makes o-cresol practically unreactive towards O3. Once however the aromaticity is broken, fragmentation reactions by O3 will occur, creating smaller molecules. Based on the chemical information obtained by FIGAERO-CIMS and the volatility distribution estimations from both techniques employed, in this section, we will attempt to provide links between the systems' chemical composition and volatility.
4.2.1 Single-precursor systems
The FIGAERO-CIMS results described above indicate that fragmentation is a major process occurring in all the systems due to the significant fraction of products with lower carbon numbers than their precursors (Figs. 1 and S1). Of course, it should be noted that the interpretation of FIGAERO data is dependent on the components that are readily accessible using the chemical ionization scheme. The iodide CIMS (I−-CIMS) has a wider range of sensitivity than acetate or instruments, although each detects a subset of those components that are present at varying sensitivities (Riva et al., 2019). The I−-CIMS efficiently detects compounds in the IVOC and SVOC range, with modest carbon and oxygen numbers, while -CIMS is more sensitive towards compounds in the LVOC and ELVOC ranges, with higher carbon and oxygen numbers, such as HOM (Priestley et al., 2021). Although the development of FIGAERO coupled to I−-CIMS enabled the detection of particle-phase compounds in the LVOC/ELVOC range (Isaacman-VanWertz et al., 2017), here, we were not able to reliably identify substantial fractions of compounds with volatility in this range using either the calibrated Tmax or the partitioning approach, in contrast to the TD measurements (Figs. 3 and 4). As discussed in Sect. 4.1, the observation of lower-volatility species is likely related to the selected method to retrieve the SOA particle volatility from the instrument and any associated assumptions and limitations. Nonetheless, here, the general agreement in the volatility trends between FIGAERO-CIMS and TD-AMS might indicate that FIGAERO-CIMS can capture the changes in the SOA particle volatility across the different systems. Therefore, the quantification of the log 10C∗ might be limited by the approach presented here but may be able to provide representative trends between the systems.
Given the above, the higher fraction of compounds with lower carbon numbers than the precursors in both the gas and particle phases in the α-pinene system suggests that fragmentation is more pronounced compared to the other systems (Figs. 1 and S1), in agreement with previous findings (Eddingsaas et al., 2012a, b) and thus potentially explaining the higher fraction of more volatile products with compared to the other systems (Figs. 3 and 4). Meanwhile, the appreciable contribution of molecules with high MW (>260 g mol−1), nC (nC>10), and moderate (−1–−0.5) and their stronger presence in the particle than in the gas phase (Figs. 1 and S1; ∼6.5 % vs. 1 %, respectively) shows that gaseous- and/or condensed-phase oligomerization/dimerization reactions produced lower-volatility products (Figs. 3 and 4). This can be further observed from Fig. 6a, where the weighted median volatility for the nC>10 compounds was compared to those with nC between 5 and 10 that was . The higher median volatility () observed in the heavily fragmented products (nC<5; MW<180 g mol−1) suggests that they had higher fractions in the gas compared to the particle phase. Their broad log 10C∗ distribution and their relatively high suggest that they might originate from various pathways, including thermal decomposition processes in FIGAERO (Thornton et al., 2020). It should be noted however that these products did not contribute substantially to the total gas- and particle-phase signals (∼7.97 % and 2.07 %, respectively), and thus their effect on the overall SOA particle volatility from FIGAERO-CIMS is expected to be equivalently low.
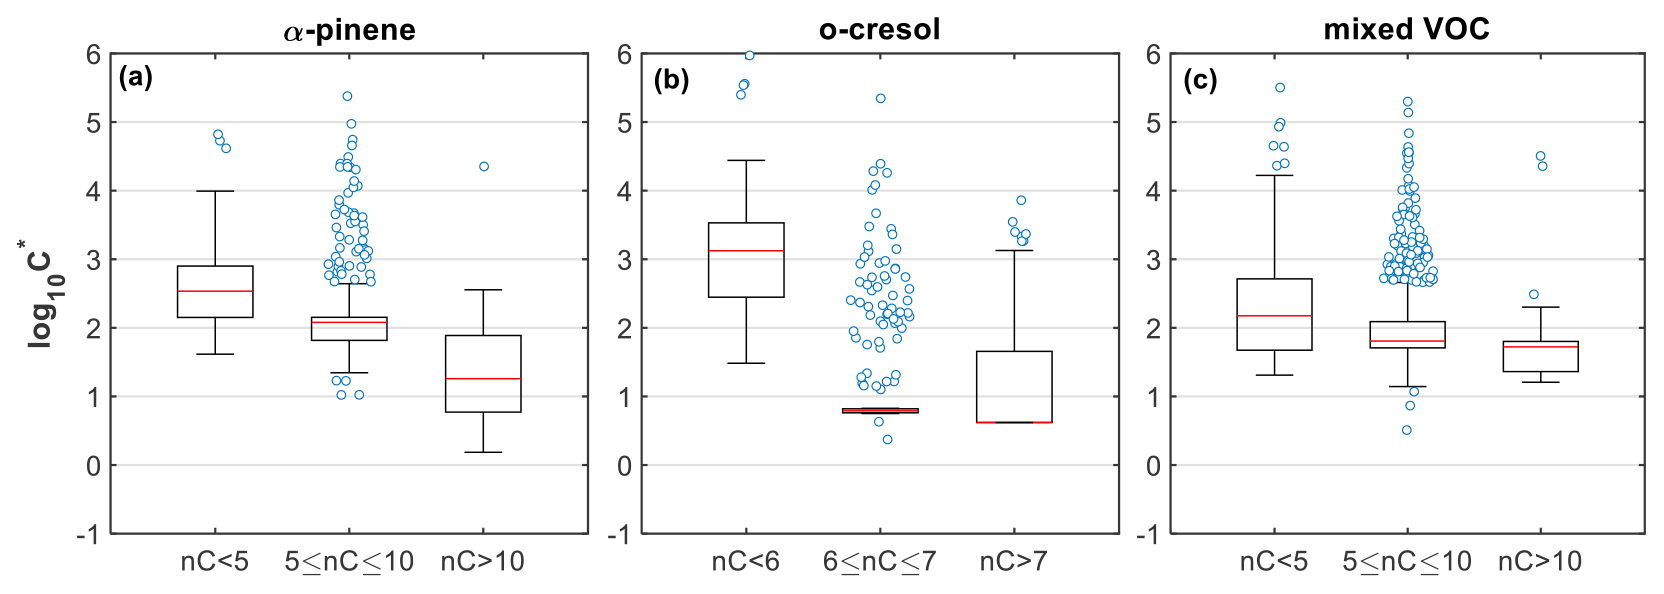
Figure 6Box plots of the estimated volatility (log 10C∗) of the products identified in the (a) α-pinene, (b) o-cresol, and (c) mixed VOC experiments (experiment nos. 2, 6, and 10, respectively), weighted to their contributions to the total particle-phase signal and grouped based on their number of carbon atoms. Red lines represent the median values, each boxes' upper and lower limits represent the 75th and 25th percentiles, respectively, while the error bars represent the minimum and maximum values. The open circles show the individual compounds that were classified as outliers, being outside the interquartile range times 1.5.
In o-cresol experiments, the dominance of products in both gas and particle phases with seven carbon atoms suggests that the OH addition pathway that mainly leads to ring-retaining products likely plays a major role in the o-cresol photo-oxidation, consistent with previous observations (Olariu et al., 2002; Schwantes et al., 2017). In nC=7, the identified products with a higher degree of functionalization () showed clearly higher contributions in the particle than in the gas phase (Fig. 1), implying that they are of relatively lower volatility. Further, the increased O:C and O:C enhancement ratio observed in this system (Figs. 2 and 3), in conjunction with recent findings suggesting that the oxidation of aromatic compounds proceeds rapidly through multiple generations of oxidation (Garmash et al., 2020; Wang et al., 2020), supports the observed higher contributions of lower-volatility material () in that system. It should be noted that the particularly narrow volatility distribution of nC=6–7 in this system and the large fraction of outliers observed (Fig. 6b) can be related to the dominance of the C7H7NO4 (Fig. S9). At the same time, the observed presence of molecules with higher nC than the precursor (nC>7), with varying (–0.8; Fig. 1) and low volatilities (median ), shows evidence of oligomerization/dimerization reactions. The considerable presence of products with fewer than six carbon atoms indicates that the oxygen addition pathway, leading to bicyclic intermediates that subsequently decompose to smaller multifunctional compounds, might be responsible (Schwantes et al., 2017). This pathway can have complex effects in both directions for the resultant SOA volatility, while the potential thermal decomposition of products in FIGAERO can possibly explain the large range of volatilities observed (Fig. 6b).
4.2.2 Mixed VOC system
Exploring the links between the SOA composition and volatility in a mixed system may provide evidence of the potential of molecular interactions to alter the SOA properties. The products identified in the mixed system here may comprise (i) products derived from the oxidation of either precursor, (ii) cross-products formed in the particle or gas phase (with sufficiently low volatility to partition to the particle phase), and (iii) individual precursor products resulting from the alteration of the oxidation mechanism of each precursor due to the interactions. It should be noted that our formula separation technique (see Sect. 2.4.1; Fig. S7) is unable to identify any new individual precursor products from (iii) that are not listed in the MCM and would classify them as unique products of the mixture.
The products derived from α-pinene and o-cresol account for the largest fraction of the gas- and particle-phase signal of the mixture at their respective nC (nC=10 and 7; Figs. 1 and S1). The oxidation products of α-pinene with modest numbers of carbon atoms (nC=5–10) found in the mixture appear to have similar volatility compared to the products in the same range of carbon atoms in the single-precursor experiments (median vs. 2.08; Figs. 6a and 7a). On the other hand, the o-cresol's products with nC=6–7 in the mixture appeared to have higher volatility compared to those at the same range in the single-precursor experiments (median vs. 0.82, respectively; Figs. 6b and 7b). A potential explanation for this discrepancy is the higher SOA mass loadings and thereby the total absorptive mass in the mixture experiments compared to the single o-cresol (Table 1) that could have favoured the partitioning of the more volatile species. However, the difference in the total mass between the two experiments after the fifth hour was relatively small (∼20 %–30 %; Fig. S15 in the Supplement) to observe differences in the volatilities expressed in logarithmic bins. Alternatively, this difference could have been caused due to sampling/measurement artefacts and/or the formation of isomers in the mixture with different volatility. Indeed, in this experiment, the C7H7NO4 exhibited much lower fp compared to the o-cresol experiment ( vs. 0.85±0.04, respectively), suggesting that the latter might be a potential cause of this discrepancy.
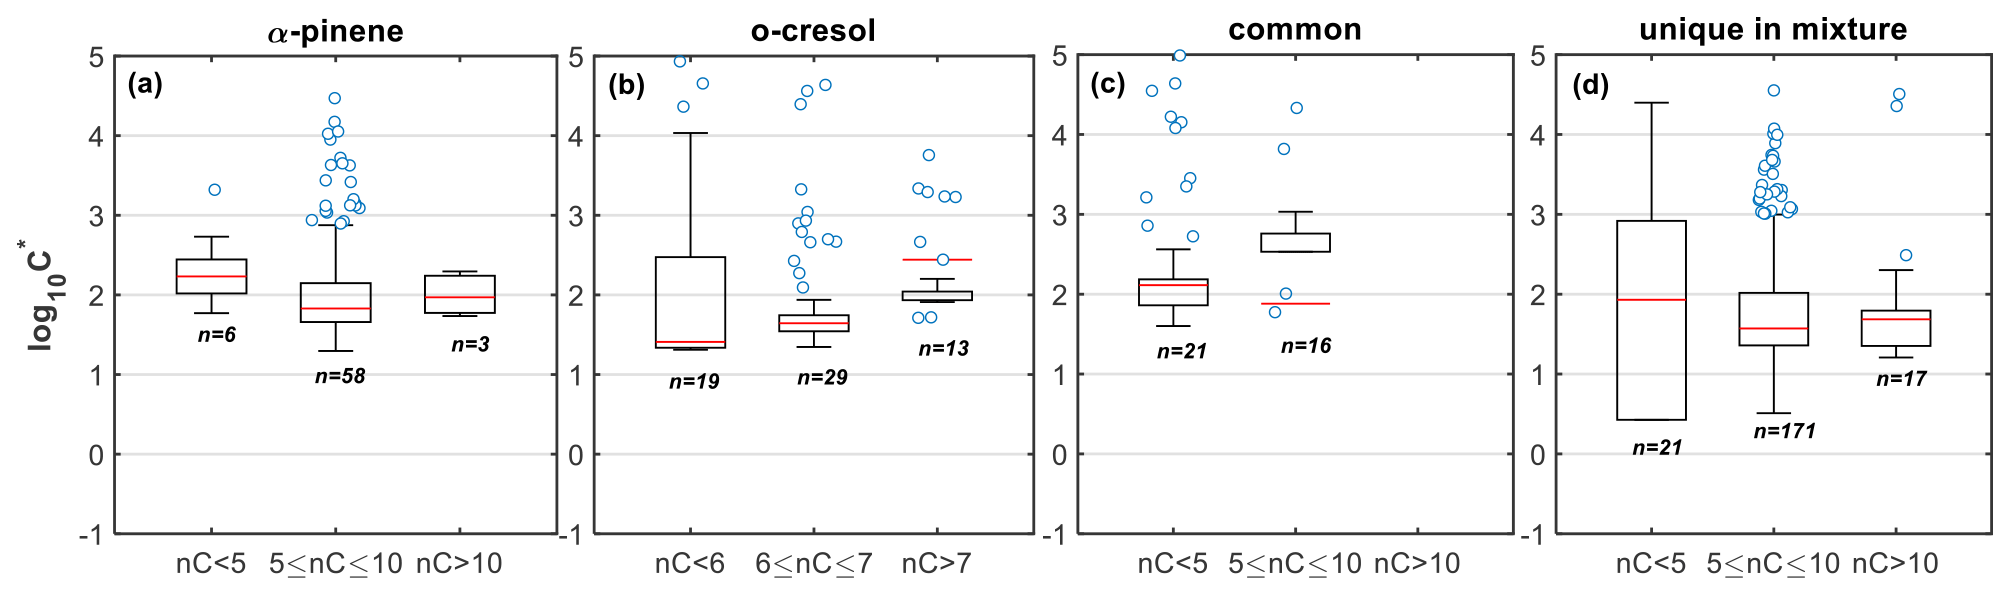
Figure 7Box plots of the estimated volatility (log 10C∗) of the products identified in the mixture and were classified as products of (a) α-pinene, (b) o-cresol, (c) common, and (d) unique to the mixture, weighted to their contributions to the total particle-phase signal and grouped based on their number of carbon atoms. Red lines represent the median values, each boxes' upper and lower limits represent the 75th and 25th percentiles, respectively, while the error bars represent the minimum and maximum values. The open circles show the individual compounds that were classified as outliers outside the interquartile range times 1.5.
The products of the mixture that were classified as common are molecules that were found in all systems (i.e. single-precursor and mixture) with the same assigned elemental formula. These products appeared to account for the largest fraction of gas- and particle-phase signals in the nC<5 range. These extensive fragmentation and/or thermal decomposition products appeared to have similar volatilities across all carbon numbers (; Fig. 7c), and their relatively low contributions to the total particle-phase signal (∼5 %) suggest that they had an equally low effect in the observed volatilities.
Interestingly, the formation of products from each individual precursor with higher numbers of carbon atoms (nC>7 and nC>10 for o-cresol and α-pinene, respectively) appeared to be substantially suppressed in both the gas and particle phases of the mixture (Figs. 1 and S1). Considering that these products were found to have lower volatilities (median ; Fig. 6c), this suppression effect might partly explain the lower fraction of lower-volatility products found in the mixture (i.e. ; Fig. 4). McFiggans et al. (2019) previously suggested that the potential suppression in the formation of α-pinene-derived higher MW compounds when it was mixed with isoprene could increase the overall volatility and partly explain the observed reduced yields in that system. Here, our observations in a different system show evidence that the high MW product scavenging has the potential to increase the overall volatility in mixed-precursor systems.
At the same time, a wealth of products unique to the mixture were identified, with their highest contributions in nC=5–10 and at varying (−1.5–2; Figs. 1 and S1). The formation of these products as well as those with nC>10 could both be attributed to processes described above for each individual VOC and/or due to the interactions between the resultant products (such as termination reactions, with R and R′ from o-cresol and α-pinene, respectively). Their similar presence in the gas and particle phases (Fig. 1) further supports their measured moderate volatility (median and ∼1.68 for the nC=5–10 and nC>10, respectively; Fig. 7d). Evidently, based on the above, the unique products of the mixture have lower volatility compared to the products of either precursor within the mixture, across all carbon numbers (Fig. 7). Neglecting the compounds with low numbers of carbon atoms (nC<5) that contribute minimally to the total particle-phase signal (∼5 %) and the common products that our technique is unable to resolve, the lower volatility of the unique-to-the-mixture product compared to the individual precursor's products in the mixture can be associated with their higher O:C, , and MW (Fig. S16 in the Supplement). This suggests that the potential molecular interactions result in larger, more functionalized products that have volatilities at the lower end of the SVOC range, decreasing the overall volatility of the mixture.
Previously, Emanuelsson et al. (2013) observed an increase in the volume fraction remaining (and thus a reduction in the volatility) in SOA formed from the mixing of various anthropogenic and biogenic precursors reacting sequentially. Here, the volatility of the SOA particles in the mixed VOC system, both from the TD and FIGAERO-CIMS, was found to be in between the volatilities obtained in the o-cresol and α-pinene single-precursor systems (Figs. 3 and 4). Based on our observations, this behaviour can be linked with the suppression of the formation of higher MW and lower-volatility products that increases the volatility of the mixture compared to the single-precursor experiments and, simultaneously, the formation of unique products with moderate/low volatilities that decrease the volatility of the mixture.
It should be noted here that in order to form adequate amounts of SOA mass required for offline analysis (discussed in separate subsequent papers), particularly high VOC concentrations (and consequently NOx) had to be used (Table 1). Previous studies have shown that the ambient OH reactivity (estimated by measurements of the OH lifetime) was between ∼10 and 116 s−1 (Whalley et al., 2016), while in our experiments it was ∼404 s−1 (product of VOC concentration with reaction rate towards OH). In the ambient atmosphere, the OH reactivity might be affected by the presence of smaller compounds (such as CO and CH4), in turn affecting the fate of RO2 and the RO2:HO2. In our setup, the particularly high concentration used is expected to promote the RO2−RO2 cross-reactions and suppress the RO2+HO2 and RO2+NO reactions (Peng and Jimenez, 2020; Schervish and Donahue, 2020), which are considered to be dominant radical termination pathways in the atmosphere. Consequently, the increased presence of unique-to-the-mixture compounds due to the interactions might partly be attributed to the selected experimental conditions. Nonetheless, our scope here is not to fully mimic the ambient atmosphere rather than explore the potential of the molecular interactions in mixtures to alter the SOA particle volatility.
4.3 Interpretation of FIGAERO-CIMS data
As has been shown here and elsewhere (e.g. Lopez-Hilfiker et al., 2016b; D'Ambro et al., 2017), linkages between the chemical composition and the particle volatility are possible using FIGAERO-CIMS, while the individual product's volatility can be inferred qualitatively (Wang and Hildebrandt Ruiz, 2018) or quantitatively within an uncertainty (e.g. Bannan et al., 2019). Here we show for the first time that the technique can be used to distinguish the SOA products derived from the oxidation of multiple precursors in environmental chambers while being able to assess the potential role of product interactions to alter the SOA particle volatility. However, some limitations may impact the results derived from the technique, such as the thermal desorption of the SOA collected in filters and the differential instrument sensitivity toward classes of compounds (Huang et al., 2018; Stark et al., 2017; Wang and Hildebrandt Ruiz, 2018; Lopez-Hilfiker et al., 2014).
We observed that the dominant o-cresol-derived product(s) with the elemental formula C7H7NO4 exhibited considerably different maximum desorption temperatures between the single-precursor and mixture systems (74.3±3 and 59.5±2 ∘C, respectively). This resulted in a different estimation of its volatility using the calibrated Tmax approach between the two systems ( and 4.0±0.1, respectively). The difference in the desorption profiles of the products in FIGAERO can be impacted by the matrix and/or saturation effects (Wang and Hildebrandt Ruiz, 2018; Ylisirniö et al., 2021; Schobesberger et al., 2018). In these studies, a positive relation of the filter loading to the maximum desorption temperature has been previously reported. However, in these systems, the total particle mass and consequently the loading of the filter in FIGAERO were considerably higher in the mixture than in the single-precursor systems (Fig. S15) and consequently cannot explain these differences. The observed shift towards lower Tmax when increasing the filter loading could possibly be attributed to the formation of isomers in the mixture that had higher volatility. This can possibly be supported by the partitioning calculations where the calculated fp was lower in the mixture than the single-precursor experiments (0.68±0.06 and 0.82±0.09, respectively) that correspondingly led to higher-volatility estimates ( and 1.0±0.3, respectively). Alternatively, the change in the SOA particle viscosity due to the mixing could have possibly affected the evaporation kinetics in FIGAERO (Buchholz et al., 2019; Schobesberger et al., 2018). Supporting that, disregarding the uncertainty of our method, the mass accommodation coefficient estimated in the o-cresol was lower compared to that in the mixed VOC system (Fig. S11), suggesting, if anything, stronger mass transfer limitations (Schobesberger et al., 2018). Further, Ylisirniö et al. (2021) observed differences in the Tmax vs. Vp calibrations between carboxylic acids and polyethylene glycol, with the former that are less viscous, to desorb at lower temperatures. Therefore, it might be worthwhile to experimentally investigate the effect of the aerosol-phase state/viscosity on the desorption profiles of the products in FIGAERO.
Recently, Hammes et al. (2019) showed that the sum of the 10 highest product signals (and any potential isomers therein) accounted for ∼50 % of the total acetate FIGAERO-CIMS signal in limonene photo-oxidation experiments. Here, in all the systems examined, we also find that >45 % of the total signal of FIGAERO-CIMS can be attributed to the top 10 elemental formulas identified (Fig. S9). In particular, in the o-cresol experiments ∼50 % and ∼40 % of the total signal in the gas and particle phases, respectively, can be attributed to a single elemental formula (C7H8O2 and C7H7NO4, respectively; Fig. S9). These results may indicate either that the aerosol composition is dominated by those few products or that the technique is overly sensitive to these compounds or a combination of both explanations.
The sum thermograms (defined as the sum of the individual product's thermograms) or, as in this study, the calibrated Tmax and the partitioning approaches, have been widely used to infer the volatility of the aerosols (e.g. Lopez-Hilfiker et al., 2015; Huang et al., 2018). However, a large fraction of the total gas- or particle-phase signal is due to as few as 10 products and any potential isomers therein (out of hundreds or thousands typically found in the mass spectra), which in turn will largely define the shape of the volatility distributions. Figure 3 shows that the volatility distribution of the o-cresol experiment is narrow, partly owing to the dominant product(s) accounting for ∼30 %–40 % of the total particle-phase signal. Figures 1 and S1 suggest that a large fraction of the total particle-phase signal of FIGAERO-CIMS in the mixed VOC system is ostensibly related to o-cresol products (33 %), with the signal from two elemental formulas dominating this fraction (C7H7NO4=26 % and C8H11NO3=3 %; Fig. S9). Therefore, caution should be exercised when attributing the contributions of individual precursor products to the mixed-precursor products, as the expression of FIGAERO-CIMS results in terms of the signal fraction can be misleading.
Previous experimental and theoretical studies showed that the sensitivity of iodide CIMS towards nitrogen-containing compounds with hydroxyl functional groups could be significant (Iyer et al., 2016; Lee et al., 2014). Considering that o-cresol oxidation largely yields OH-containing products (Schwantes et al., 2017), in conjunction with the observed particularly high contributions of N-containing products to the total signal in all o-cresol-containing experiments (Fig. S17 in the Supplement), it is likely that differential sensitivity plays a role in this apparent dominance.
Interestingly, however, each system exhibited a comparable number fraction of products containing C, H, O, and N atoms (Fig. S17b), suggesting either that the nitrogen-containing oxidation products of o-cresol actually contribute substantially to the SOA mass and/or that there is a significant differential sensitivity of the instrument towards molecules containing C, H, O, and N. Because of the lack of information regarding the iodide CIMS sensitivity towards aromatic and nitrogen-containing compounds, this cannot be directly investigated here but should be an area for future research.
The SOA particle yield from the o-cresol experiments was found to be modest (14 %±3 %) and that from the α-pinene considerably higher (27 %±4 %; Fig. S18 in the Supplement), suggesting that the observed domination of the o-cresol products in the mixed systems is unlikely. Considering the relative agreement in the volatility derived from FIGAERO-CIMS and the TD and the analysis presented above (Sects. 4.1–4.2), we can argue that the SOA particles in the mixture are composed of the products of the higher-yield precursor (i.e. α-pinene), with considerable contributions of the o-cresol-derived products as well as those derived from the mixing of the two precursors.
Many climate/air quality prediction models express SOA volatility based on single-precursor experiments and neglect the potential interactions of the molecules derived from various precursors that are emitted in the atmosphere and lead to the SOA formation (Yahya et al., 2017; Tsimpidi et al., 2018). However, an increasing number of studies show that the results obtained using single VOC precursor systems might not represent accurately the ambient atmosphere, in which hundreds of VOCs are oxidized simultaneously (McFiggans et al., 2019; Shilling et al., 2019). Here, we comprehensively investigate the SOA composition and volatility upon mixing of α-pinene and o-cresol under photo-oxidation conditions, using two independent techniques. Our experimental setup might not fully represent the real atmosphere owing to the lack of smaller organic molecules (such as CO or CH4) that may influence the radical termination pathways (Schervish and Donahue, 2020), providing however the grounds to investigate the potential of the molecular interactions to alter the SOA composition and properties in mixtures.
The two volatility estimation techniques showed substantial discrepancies in the obtained log 10C∗ values, highlighting the complexity in deriving the volatility distribution and the need for further studies to investigate the thermal evaporation of the organics. However, they all showed similar trends: the SOA particle volatility from the photo-oxidation of α-pinene had stronger contributions of higher-volatility material compared to that from the o-cresol, while the SOA particle volatility of their mixture appeared to be in between. This was further supported by the qualitative data that are used for the estimation of the volatility that is the MFR in the TD and the sum of thermograms and the partitioning coefficient distribution in FIGAERO-CIMS. The chemical information obtained enabled us to provide links between the chemical composition and volatility and showed that the extensive fragmentation that occurred in the α-pinene system probably resulted in the observed higher-volatility SOA. On the other hand, the majority of the particle-phase products from the o-cresol had six to seven carbon atoms, higher O:C, and , potentially explaining their lower volatility. Importantly, our results first show that upon mixing α-pinene and o-cresol there were two opposite effects: first, the suppression in the formation of higher MW and lower-volatility compounds derived from each individual precursor that increases the volatility of the mixture, and second, the formation of unique products in the mixture that had lower volatility, higher , O:C, and MW that decreased the volatility of the mixture. The trade-off between these two effects could be determining the overall SOA particle volatility in conditions where multiple VOC precursors react simultaneously, which in this case was found to be in between those measured in the single-precursor experiments.
There is some ambiguity in interpreting the FIGAERO-CIMS data owing to the potential shift of the thermograms due to the different filter loadings and, likely, the evaporation behaviour of the compounds in FIGAERO as well as the a priori selectivity of the instrument towards certain products defined by the instrument setup (Lee et al., 2014; Riva et al., 2019). The relative agreement however in the obtained volatility trends between our independent techniques might indicate that FIGAERO-CIMS, at least qualitatively, could capture the SOA volatility changes in mixed-precursor systems and identify corresponding changes in the SOA chemical composition.
The results presented here call for further studies to explore the mechanisms that are driving these observations. Furthermore, studies conducted on various chemical regimes and using various oxidants might improve our understanding of the importance of molecular interactions in mixtures. The formation of new products in mixtures as well as the differential contribution of each precursor's product to the particle phase imply a range of potential changes in the SOA properties and thereby their subsequent interactions of the SOA with water vapour and other particles and gases (Champion et al., 2019; Riipinen et al., 2015; Pankow et al., 2015). Further, the potential effect of mixing anthropogenic and biogenic products might significantly affect the predicted SOA radiative forcing (Gordon et al., 2016; Kelly et al., 2018).
All the data used in this study are available upon request from the corresponding authors.
The supplement related to this article is available online at: https://doi.org/10.5194/acp-21-14251-2021-supplement.
GM, MRA, AV, YW, and YS conceived the study. AV, YW, YS, and MD conducted the experiments. SNP provided the volatility retrieval algorithm. TJB provided on-site help, deploying FIGAERO-CIMS and discussing the data analysis procedure. AV conducted the data analysis and wrote the manuscript with inputs from all the co-authors.
The authors declare that they have no conflict of interest.
Publisher's note: Copernicus Publications remains neutral with regard to jurisdictional claims in published maps and institutional affiliations.
This article is part of the special issue “Simulation chambers as tools in atmospheric research (AMT/ACP/GMD inter-journal SI)”. It is not associated with a conference.
The Manchester Aerosol Chamber received funding from the European Union’s Horizon 2020 research and innovation programme under grant agreement no. 730997, which supports the EUROCHAMP2020 research programme. Aristeidis Voliotis was funded by the Presidents Doctoral Scholarship from the University of Manchester and the support from the Natural Environment Research Council (NERC) EAO Doctoral Training Partnership. M. Rami Alfarra was funded by the NERC through the UK National Centre for Atmospheric Science (NCAS). Instrumentational support was given through the NERC Atmospheric Measurement and Observational Facility (AMOF).
This research has been supported by the Natural Environment Research Council through the Doctoral Training Partnership (grant no. NE/L002469/1).
This paper was edited by Allan Bertram and reviewed by two anonymous referees.
Ahlberg, E., Falk, J., Eriksson, A., Holst, T., Brune, W. H., Kristensson, A., Roldin, P., and Svenningsson, B.: Secondary organic aerosol from VOC mixtures in an oxidation flow reactor, Atmos. Environ., 161, 210–220, https://doi.org/10.1016/j.atmosenv.2017.05.005, 2017.
Aiken, A. C., Salcedo, D., Cubison, M. J., Huffman, J. A., DeCarlo, P. F., Ulbrich, I. M., Docherty, K. S., Sueper, D., Kimmel, J. R., Worsnop, D. R., Trimborn, A., Northway, M., Stone, E. A., Schauer, J. J., Volkamer, R. M., Fortner, E., de Foy, B., Wang, J., Laskin, A., Shutthanandan, V., Zheng, J., Zhang, R., Gaffney, J., Marley, N. A., Paredes-Miranda, G., Arnott, W. P., Molina, L. T., Sosa, G., and Jimenez, J. L.: Mexico City aerosol analysis during MILAGRO using high resolution aerosol mass spectrometry at the urban supersite (T0) – Part 1: Fine particle composition and organic source apportionment, Atmos. Chem. Phys., 9, 6633–6653, https://doi.org/10.5194/acp-9-6633-2009, 2009.
Alfarra, M. R., Coe, H., Allan, J. D., Bower, K. N., Boudries, H., Canagaratna, M. R., Jimenez, J. L., Jayne, J. T., Garforth, A. A., Li, S.-M., and Worsnop, D. R.: Characterization of urban and rural organic particulate in the Lower Fraser Valley using two Aerodyne Aerosol Mass Spectrometers, Atmos. Environ., 38, 5745–5758, https://doi.org/10.1016/j.atmosenv.2004.01.054, 2004.
Alfarra, M. R., Hamilton, J. F., Wyche, K. P., Good, N., Ward, M. W., Carr, T., Barley, M. H., Monks, P. S., Jenkin, M. E., Lewis, A. C., and McFiggans, G. B.: The effect of photochemical ageing and initial precursor concentration on the composition and hygroscopic properties of β-caryophyllene secondary organic aerosol, Atmos. Chem. Phys., 12, 6417–6436, https://doi.org/10.5194/acp-12-6417-2012, 2012.
Aljawhary, D., Lee, A. K. Y., and Abbatt, J. P. D.: High-resolution chemical ionization mass spectrometry (ToF-CIMS): application to study SOA composition and processing, Atmos. Meas. Tech., 6, 3211–3224, https://doi.org/10.5194/amt-6-3211-2013, 2013.
Allan, J. D., Delia, A. E., Coe, H., Bower, K. N., Alfarra, M. R., Jimenez, J. L., Middlebrook, A. M., Drewnick, F., Onasch, T. B., Canagaratna, M. R., Jayne, J. T., and Worsnop, D. R.: A generalised method for the extraction of chemically resolved mass spectra from aerodyne aerosol mass spectrometer data, J. Aerosol. Sci., 35, 909–922, https://doi.org/10.1016/j.jaerosci.2004.02.007, 2004.
Atkinson, R.: Atmospheric chemistry of VOCs and NOx, Atmos. Environ., 34, 2063–2101, https://doi.org/10.1016/S1352-2310(99)00460-4, 2000.
Baltensperger, U., Kalberer, M., Dommen, J., Paulsen, D., Alfarra, M. R., Coe, H., Fisseha, R., Gascho, A., Gysel, M., Nyeki, S., Sax, M., Steinbacher, M., Prevot, A. S. H., Sjogren, S., Weingartner, E., and Zenobi, R.: Secondary organic aerosols from anthropogenic and biogenic precursors, Faraday Discuss., 130, 265–278, https://doi.org/10.1039/b417367h, 2005.
Bannan, T. J., Le Breton, M., Priestley, M., Worrall, S. D., Bacak, A., Marsden, N. A., Mehra, A., Hammes, J., Hallquist, M., Alfarra, M. R., Krieger, U. K., Reid, J. P., Jayne, J., Robinson, W., McFiggans, G., Coe, H., Percival, C. J., and Topping, D.: A method for extracting calibrated volatility information from the FIGAERO-HR-ToF-CIMS and its experimental application, Atmos. Meas. Tech., 12, 1429–1439, https://doi.org/10.5194/amt-12-1429-2019, 2019.
Barley, M., Topping, D. O., Jenkin, M. E., and McFiggans, G.: Sensitivities of the absorptive partitioning model of secondary organic aerosol formation to the inclusion of water, Atmos. Chem. Phys., 9, 2919–2932, https://doi.org/10.5194/acp-9-2919-2009, 2009.
Bianchi, F., Kurten, T., Riva, M., Mohr, C., Rissanen, M. P., Roldin, P., Berndt, T., Crounse, J. D., Wennberg, P. O., Mentel, T. F., Wildt, J., Junninen, H., Jokinen, T., Kulmala, M., Worsnop, D. R., Thornton, J. A., Donahue, N., Kjaergaard, H. G., and Ehn, M.: Highly Oxygenated Organic Molecules (HOM) from Gas-Phase Autoxidation Involving Peroxy Radicals: A Key Contributor to Atmospheric Aerosol, Chem. Rev., 119, 3472–3509, https://doi.org/10.1021/acs.chemrev.8b00395, 2019.
Brunekreef, B. and Holgate, S. T.: Air pollution and health, Lancet, 360, 1233–1242, https://doi.org/10.1016/S0140-6736(02)11274-8, 2002.
Buchholz, A., Lambe, A. T., Ylisirniö, A., Li, Z., Tikkanen, O.-P., Faiola, C., Kari, E., Hao, L., Luoma, O., Huang, W., Mohr, C., Worsnop, D. R., Nizkorodov, S. A., Yli-Juuti, T., Schobesberger, S., and Virtanen, A.: Insights into the O:C-dependent mechanisms controlling the evaporation of α-pinene secondary organic aerosol particles, Atmos. Chem. Phys., 19, 4061–4073, https://doi.org/10.5194/acp-19-4061-2019, 2019.
Buchholz, A., Ylisirniö, A., Huang, W., Mohr, C., Canagaratna, M., Worsnop, D. R., Schobesberger, S., and Virtanen, A.: Deconvolution of FIGAERO–CIMS thermal desorption profiles using positive matrix factorisation to identify chemical and physical processes during particle evaporation, Atmos. Chem. Phys., 20, 7693–7716, https://doi.org/10.5194/acp-20-7693-2020, 2020.
Burkholder, J. B., Abbatt, J. P. D., Barnes, I., Roberts, J. M., Melamed, M. L., Ammann, M., Bertram, A. K., Cappa, C. D., Carlton, A. G., Carpenter, L. J., Crowley, J. N., Dubowski, Y., Georges, C., Heard, D. E., Herrmann, H., Keutsch, F. N., Kroll, J. H., McNeill, V. F., Ng, N. L., Nizkorodov, S. A., Orlando, J. J., Percival, C. J., Picquet-Varrault, B., Rudich, Y., Seakins, P. W., Surratt, J. D., Tanimoto, H., Thornton, J. A., Tong, Z., Tyndall, G. S., Wahner, A., Weschler, C. J., Wilson, K. R., and Ziemann, P. J.: The Essential Role for Laboratory Studies in Atmospheric Chemistry, Environ. Sci. Technol., 51, 2519–2528, https://doi.org/10.1021/acs.est.6b04947, 2017.
Cain, K. P., Karnezi, E., and Pandis, S. N.: Challenges in determining atmospheric organic aerosol volatility distributions using thermal evaporation techniques, Aerosol Sci. Tech., 54, 941–957, https://doi.org/10.1080/02786826.2020.1748172, 2020.
Carlton, A. G., Wiedinmyer, C., and Kroll, J. H.: A review of Secondary Organic Aerosol (SOA) formation from isoprene, Atmos. Chem. Phys., 9, 4987–5005, https://doi.org/10.5194/acp-9-4987-2009, 2009.
Champion, W. M., Rothfuss, N. E., Petters, M. D., and Grieshop, A. P.: Volatility and Viscosity Are Correlated in Terpene Secondary Organic Aerosol Formed in a Flow Reactor, Environ. Sci. Tech. Let., 6, 513–519, https://doi.org/10.1021/acs.estlett.9b00412, 2019.
Chowdhury, P. H., He, Q. F., Male, T. L., Brune, W. H., Rudich, Y., and Pardo, M.: Exposure of Lung Epithelial Cells to Photochemically Aged Secondary Organic Aerosol Shows Increased Toxic Effects, Environ. Sci. Tech. Let., 5, 424–430, https://doi.org/10.1021/acs.estlett.8b00256, 2018.
D'Ambro, E. L., Lee, B. H., Liu, J., Shilling, J. E., Gaston, C. J., Lopez-Hilfiker, F. D., Schobesberger, S., Zaveri, R. A., Mohr, C., Lutz, A., Zhang, Z., Gold, A., Surratt, J. D., Rivera-Rios, J. C., Keutsch, F. N., and Thornton, J. A.: Molecular composition and volatility of isoprene photochemical oxidation secondary organic aerosol under low- and high-NOx conditions, Atmos. Chem. Phys., 17, 159–174, https://doi.org/10.5194/acp-17-159-2017, 2017.
DeCarlo, P. F., Kimmel, J. R., Trimborn, A., Northway, M. J., Jayne, J. T., Aiken, A. C., Gonin, M., Fuhrer, K., Horvath, T., Docherty, K. S., Worsnop, D. R., and Jimenez, J. L.: Field-deployable, high-resolution, time-of-flight aerosol mass spectrometer, Anal. Chem., 78, 8281–8289, https://doi.org/10.1021/ac061249n, 2006.
Donahue, N. M., Robinson, A. L., Stanier, C. O., and Pandis, S. N.: Coupled partitioning, dilution, and chemical aging of semivolatile organics, Environ. Sci. Technol., 40, 2635–2643, 2006.
Donahue, N. M., Kroll, J. H., Pandis, S. N., and Robinson, A. L.: A two-dimensional volatility basis set – Part 2: Diagnostics of organic-aerosol evolution, Atmos. Chem. Phys., 12, 615–634, https://doi.org/10.5194/acp-12-615-2012, 2012.
Eddingsaas, N. C., Loza, C. L., Yee, L. D., Chan, M., Schilling, K. A., Chhabra, P. S., Seinfeld, J. H., and Wennberg, P. O.: α-pinene photooxidation under controlled chemical conditions – Part 2: SOA yield and composition in low- and high−NOx environments, Atmos. Chem. Phys., 12, 7413–7427, https://doi.org/10.5194/acp-12-7413-2012, 2012a.
Eddingsaas, N. C., Loza, C. L., Yee, L. D., Seinfeld, J. H., and Wennberg, P. O.: α-pinene photooxidation under controlled chemical conditions – Part 1: Gas-phase composition in low- and high−NOx environments, Atmos. Chem. Phys., 12, 6489–6504, https://doi.org/10.5194/acp-12-6489-2012, 2012b.
Emanuelsson, E. U., Hallquist, M., Kristensen, K., Glasius, M., Bohn, B., Fuchs, H., Kammer, B., Kiendler-Scharr, A., Nehr, S., Rubach, F., Tillmann, R., Wahner, A., Wu, H.-C., and Mentel, Th. F.: Formation of anthropogenic secondary organic aerosol (SOA) and its influence on biogenic SOA properties, Atmos. Chem. Phys., 13, 2837–2855, https://doi.org/10.5194/acp-13-2837-2013, 2013.
Farmer, D. K., Matsunaga, A., Docherty, K. S., Surratt, J. D., Seinfeld, J. H., Ziemann, P. J., and Jimenez, J. L.: Response of an aerosol mass spectrometer to organonitrates and organosulfates and implications for atmospheric chemistry, P. Natl. Acad. Sci. USA, 107, 6670–6675, https://doi.org/10.1073/pnas.0912340107, 2010.
Fuentes, E. and McFiggans, G.: A modeling approach to evaluate the uncertainty in estimating the evaporation behaviour and volatility of organic aerosols, Atmos. Meas. Tech., 5, 735–757, https://doi.org/10.5194/amt-5-735-2012, 2012.
Garmash, O., Rissanen, M. P., Pullinen, I., Schmitt, S., Kausiala, O., Tillmann, R., Zhao, D., Percival, C., Bannan, T. J., Priestley, M., Hallquist, Å. M., Kleist, E., Kiendler-Scharr, A., Hallquist, M., Berndt, T., McFiggans, G., Wildt, J., Mentel, T. F., and Ehn, M.: Multi-generation OH oxidation as a source for highly oxygenated organic molecules from aromatics, Atmos. Chem. Phys., 20, 515–537, https://doi.org/10.5194/acp-20-515-2020, 2020.
Goldstein, A. H. and Galbally, I. E.: Known and unexplored organic constituents in the earth's atmosphere, Environ. Sci. Technol., 41, 1514–1521, 2007.
Gordon, H., Sengupta, K., Rap, A., Duplissy, J., Frege, C., Williamson, C., Heinritzi, M., Simon, M., Yan, C., Almeida, J., Trostl, J., Nieminen, T., Ortega, I. K., Wagner, R., Dunne, E. M., Adamov, A., Amorim, A., Bernhammer, A. K., Bianchi, F., Breitenlechner, M., Brilke, S., Chen, X. M., Craven, J. S., Dias, A., Ehrhart, S., Fischer, L., Flagan, R. C., Franchin, A., Fuchs, C., Guida, R., Hakala, J., Hoyle, C. R., Jokinen, T., Junninen, H., Kangasluoma, J., Kim, J., Kirkby, J., Krapf, M., Kurten, A., Laaksonen, A., Lehtipalo, K., Makhmutov, V., Mathot, S., Molteni, U., Monks, S. A., Onnela, A., Perakyla, O., Piel, F., Petaja, T., Praplanh, A. P., Pringle, K. J., Richards, N. A. D., Rissanen, M. P., Rondo, L., Sarnela, N., Schobesberger, S., Scott, C. E., Seinfeldo, J. H., Sharma, S., Sipila, M., Steiner, G., Stozhkov, Y., Stratmann, F., Tome, A., Virtanen, A., Vogel, A. L., Wagner, A. C., Wagner, P. E., Weingartner, E., Wimmer, D., Winkler, P. M., Ye, P. L., Zhang, X., Hansel, A., Dommen, J., Donahue, N. M., Worsnop, D. R., Baltensperger, U., Kulmala, M., Curtius, J., and Carslaw, K. S.: Reduced anthropogenic aerosol radiative forcing caused by biogenic new particle formation, P. Natl. Acad. Sci. USA, 113, 12053–12058, https://doi.org/10.1073/pnas.1602360113, 2016.
Hallquist, M., Wenger, J. C., Baltensperger, U., Rudich, Y., Simpson, D., Claeys, M., Dommen, J., Donahue, N. M., George, C., Goldstein, A. H., Hamilton, J. F., Herrmann, H., Hoffmann, T., Iinuma, Y., Jang, M., Jenkin, M. E., Jimenez, J. L., Kiendler-Scharr, A., Maenhaut, W., McFiggans, G., Mentel, Th. F., Monod, A., Prévôt, A. S. H., Seinfeld, J. H., Surratt, J. D., Szmigielski, R., and Wildt, J.: The formation, properties and impact of secondary organic aerosol: current and emerging issues, Atmos. Chem. Phys., 9, 5155–5236, https://doi.org/10.5194/acp-9-5155-2009, 2009.
Hammes, J., Lutz, A., Mentel, T., Faxon, C., and Hallquist, M.: Carboxylic acids from limonene oxidation by ozone and hydroxyl radicals: insights into mechanisms derived using a FIGAERO-CIMS, Atmos. Chem. Phys., 19, 13037–13052, https://doi.org/10.5194/acp-19-13037-2019, 2019.
Henry, F., Coeur-Tourneur, C., Ledoux, F., Tomas, A., and Menu, D.: Secondary organic aerosol formation from the gas phase reaction of hydroxyl radicals with m-, o- and p-cresol, Atmos. Environ., 42, 3035–3045, https://doi.org/10.1016/j.atmosenv.2007.12.043, 2008.
Huang, W., Saathoff, H., Pajunoja, A., Shen, X., Naumann, K.-H., Wagner, R., Virtanen, A., Leisner, T., and Mohr, C.: α-Pinene secondary organic aerosol at low temperature: chemical composition and implications for particle viscosity, Atmos. Chem. Phys., 18, 2883–2898, https://doi.org/10.5194/acp-18-2883-2018, 2018.
Huffman, J. A., Docherty, K. S., Mohr, C., Cubison, M. J., Ulbrich, I. M., Ziemann, P. J., Onasch, T. B., and Jimenez, J. L.: Chemically-Resolved Volatility Measurements of Organic Aerosol from Different Sources, Environ. Sci. Technol., 43, 5351–5357, https://doi.org/10.1021/es803539d, 2009.
Isaacman-VanWertz, G., Massoli, P., O'Brien, R. E., Nowak, J. B., Canagaratna, M. R., Jayne, J. T., Worsnop, D. R., Su, L., Knopf, D. A., Misztal, P. K., Arata, C., Goldstein, A. H., and Kroll, J. H.: Using advanced mass spectrometry techniques to fully characterize atmospheric organic carbon: current capabilities and remaining gaps, Faraday Discuss., 200, 579–598, https://doi.org/10.1039/C7FD00021A, 2017.
Isaacman-VanWertz, G., Massoli, P., O'Brien, R., Lim, C., Franklin, J. P., Moss, J. A., Hunter, J. F., Nowak, J. B., Canagaratna, M. R., Misztal, P. K., Arata, C., Roscioli, J. R., Herndon, S. T., Onasch, T. B., Lambe, A. T., Jayne, J. T., Su, L. P., Knopf, D. A., Goldstein, A. H., Worsnop, D. R., and Kroll, J. H.: Chemical evolution of atmospheric organic carbon over multiple generations of oxidation, Nat. Chem., 10, 462–468, https://doi.org/10.1038/s41557-018-0002-2, 2018.
Iyer, S., Lopez-Hilfiker, F., Lee, B. H., Thornton, J. A., and Kurten, T.: Modeling the Detection of Organic and Inorganic Compounds Using Iodide-Based Chemical Ionization, J. Phys. Chem. A, 120, 576–587, https://doi.org/10.1021/acs.jpca.5b09837, 2016.
Jenkin, M. E., Saunders, S. M., Wagner, V., and Pilling, M. J.: Protocol for the development of the Master Chemical Mechanism, MCM v3 (Part B): tropospheric degradation of aromatic volatile organic compounds, Atmos. Chem. Phys., 3, 181–193, https://doi.org/10.5194/acp-3-181-2003, 2003.
Jimenez, J. L., Jayne, J. T., Shi, Q., Kolb, C. E., Worsnop, D. R., Yourshaw, I., Seinfeld, J. H., Flagan, R. C., Zhang, X. F., Smith, K. A., Morris, J. W., and Davidovits, P.: Ambient aerosol sampling using the Aerodyne Aerosol Mass Spectrometer, J. Geophys. Res.-Atmos., 108, 8425, https://doi.org/10.1029/2001jd001213, 2003.
Jimenez, J. L., Canagaratna, M. R., Donahue, N. M., Prevot, A. S. H., Zhang, Q., Kroll, J. H., DeCarlo, P. F., Allan, J. D., Coe, H., Ng, N. L., Aiken, A. C., Docherty, K. S., Ulbrich, I. M., Grieshop, A. P., Robinson, A. L., Duplissy, J., Smith, J. D., Wilson, K. R., Lanz, V. A., Hueglin, C., Sun, Y. L., Tian, J., Laaksonen, A., Raatikainen, T., Rautiainen, J., Vaattovaara, P., Ehn, M., Kulmala, M., Tomlinson, J. M., Collins, D. R., Cubison, M. J., Dunlea, E. J., Huffman, J. A., Onasch, T. B., Alfarra, M. R., Williams, P. I., Bower, K., Kondo, Y., Schneider, J., Drewnick, F., Borrmann, S., Weimer, S., Demerjian, K., Salcedo, D., Cottrell, L., Griffin, R., Takami, A., Miyoshi, T., Hatakeyama, S., Shimono, A., Sun, J. Y., Zhang, Y. M., Dzepina, K., Kimmel, J. R., Sueper, D., Jayne, J. T., Herndon, S. C., Trimborn, A. M., Williams, L. R., Wood, E. C., Middlebrook, A. M., Kolb, C. E., Baltensperger, U., and Worsnop, D. R.: Evolution of Organic Aerosols in the Atmosphere, Science, 326, 1525–1529, 2009.
Kanakidou, M., Seinfeld, J. H., Pandis, S. N., Barnes, I., Dentener, F. J., Facchini, M. C., Van Dingenen, R., Ervens, B., Nenes, A., Nielsen, C. J., Swietlicki, E., Putaud, J. P., Balkanski, Y., Fuzzi, S., Horth, J., Moortgat, G. K., Winterhalter, R., Myhre, C. E. L., Tsigaridis, K., Vignati, E., Stephanou, E. G., and Wilson, J.: Organic aerosol and global climate modelling: a review, Atmos. Chem. Phys., 5, 1053–1123, https://doi.org/10.5194/acp-5-1053-2005, 2005.
Karnezi, E., Riipinen, I., and Pandis, S. N.: Measuring the atmospheric organic aerosol volatility distribution: a theoretical analysis, Atmos. Meas. Tech., 7, 2953–2965, https://doi.org/10.5194/amt-7-2953-2014, 2014.
Kelly, J. M., Doherty, R. M., O'Connor, F. M., and Mann, G. W.: The impact of biogenic, anthropogenic, and biomass burning volatile organic compound emissions on regional and seasonal variations in secondary organic aerosol, Atmos. Chem. Phys., 18, 7393–7422, https://doi.org/10.5194/acp-18-7393-2018, 2018.
Kramer, A. J., Rattanavaraha, W., Zhang, Z. F., Gold, A., Surratt, J. D., and Lin, Y. H.: Assessing the oxidative potential of isoprene-derived epoxides and secondary organic aerosol, Atmos. Environ., 130, 211–218, https://doi.org/10.1016/j.atmosenv.2015.10.018, 2016.
Krieger, U. K., Siegrist, F., Marcolli, C., Emanuelsson, E. U., Gøbel, F. M., Bilde, M., Marsh, A., Reid, J. P., Huisman, A. J., Riipinen, I., Hyttinen, N., Myllys, N., Kurtén, T., Bannan, T., Percival, C. J., and Topping, D.: A reference data set for validating vapor pressure measurement techniques: homologous series of polyethylene glycols, Atmos. Meas. Tech., 11, 49–63, https://doi.org/10.5194/amt-11-49-2018, 2018.
Kroll, J. H. and Seinfeld, J. H.: Chemistry of secondary organic aerosol: Formation and evolution of low-volatility organics in the atmosphere, Atmos. Environ., 42, 3593–3624, https://doi.org/10.1016/j.atmosenv.2008.01.003, 2008.
Kroll, J. H., Donahue, N. M., Jimenez, J. L., Kessler, S. H., Canagaratna, M. R., Wilson, K. R., Altieri, K. E., Mazzoleni, L. R., Wozniak, A. S., Bluhm, H., Mysak, E. R., Smith, J. D., Kolb, C. E., and Worsnop, D. R.: Carbon oxidation state as a metric for describing the chemistry of atmospheric organic aerosol, Nat. Chem., 3, 133–139, https://doi.org/10.1038/nchem.948, 2011.
Lee, A., Goldstein, A. H., Kroll, J. H., Ng, N. L., Varutbangkul, V., Flagan, R. C., and Seinfeld, J. H.: Gas-phase products and secondary aerosol yields from the photooxidation of 16 different terpenes, J. Geophys. Res.-Atmos., 111, D17305, https://doi.org/10.1029/2006jd007050, 2006.
Lee, B. H., Lopez-Hilfiker, F. D., Mohr, C., Kurten, T., Worsnop, D. R., and Thornton, J. A.: An Iodide-Adduct High-Resolution Time-of-Flight Chemical-Ionization Mass Spectrometer: Application to Atmospheric Inorganic and Organic Compounds, Environ. Sci. Technol., 48, 6309–6317, https://doi.org/10.1021/es500362a, 2014.
Lelieveld, J., Evans, J. S., Fnais, M., Giannadaki, D., and Pozzer, A.: The contribution of outdoor air pollution sources to premature mortality on a global scale, Nature, 525, 367–371., https://doi.org/10.1038/nature15371, 2015.
Li, Y., Pöschl, U., and Shiraiwa, M.: Molecular corridors and parameterizations of volatility in the chemical evolution of organic aerosols, Atmos. Chem. Phys., 16, 3327–3344, https://doi.org/10.5194/acp-16-3327-2016, 2016.
Lopez-Hilfiker, F. D., Mohr, C., Ehn, M., Rubach, F., Kleist, E., Wildt, J., Mentel, T. F., Lutz, A., Hallquist, M., Worsnop, D., and Thornton, J. A.: A novel method for online analysis of gas and particle composition: description and evaluation of a Filter Inlet for Gases and AEROsols (FIGAERO), Atmos. Meas. Tech., 7, 983–1001, 2014.
Lopez-Hilfiker, F. D., Mohr, C., Ehn, M., Rubach, F., Kleist, E., Wildt, J., Mentel, Th. F., Carrasquillo, A. J., Daumit, K. E., Hunter, J. F., Kroll, J. H., Worsnop, D. R., and Thornton, J. A.: Phase partitioning and volatility of secondary organic aerosol components formed from α-pinene ozonolysis and OH oxidation: the importance of accretion products and other low volatility compounds, Atmos. Chem. Phys., 15, 7765–7776, https://doi.org/10.5194/acp-15-7765-2015, 2015.
Lopez-Hilfiker, F. D., Iyer, S., Mohr, C., Lee, B. H., D'Ambro, E. L., Kurtén, T., and Thornton, J. A.: Constraining the sensitivity of iodide adduct chemical ionization mass spectrometry to multifunctional organic molecules using the collision limit and thermodynamic stability of iodide ion adducts, Atmos. Meas. Tech., 9, 1505–1512, https://doi.org/10.5194/amt-9-1505-2016, 2016a.
Lopez-Hilfiker, F. D., Mohr, C., D'Ambro, E. L., Lutz, A., Riedel, T. P., Gaston, C. J., Iyer, S., Zhang, Z., Gold, A., Surratt, J. D., Lee, B. H., Kurten, T., Hu, W. W., Jimenez, J., Hallquist, M., and Thornton, J. A.: Molecular Composition and Volatility of Organic Aerosol in the Southeastern U. S.: Implications for IEPOX Derived SOA, Environ. Sci. Technol., 50, 2200–2209, https://doi.org/10.1021/acs.est.5b04769, 2016b.
Louvaris, E. E., Karnezi, E., Kostenidou, E., Kaltsonoudis, C., and Pandis, S. N.: Estimation of the volatility distribution of organic aerosol combining thermodenuder and isothermal dilution measurements, Atmos. Meas. Tech., 10, 3909–3918, https://doi.org/10.5194/amt-10-3909-2017, 2017.
Lutz, A., Mohr, C., Le Breton, M., Lopez-Hilfiker, F. D., Priestley, M., Thornton, J. A., and Hallquist, M.: Gas to Particle Partitioning of Organic Acids in the Boreal Atmosphere, ACS Earth Space Chem., 3, 1279–1287, https://doi.org/10.1021/acsearthspacechem.9b00041, 2019.
Matthew, B. M., Middlebrook, A. M., and Onasch, T. B.: Collection Efficiencies in an Aerodyne Aerosol Mass Spectrometer as a Function of Particle Phase for Laboratory Generated Aerosols, Aerosol Sci. Tech., 42, 884–898, https://doi.org/10.1080/02786820802356797, 2008.
McFiggans, G., Artaxo, P., Baltensperger, U., Coe, H., Facchini, M. C., Feingold, G., Fuzzi, S., Gysel, M., Laaksonen, A., Lohmann, U., Mentel, T. F., Murphy, D. M., O'Dowd, C. D., Snider, J. R., and Weingartner, E.: The effect of physical and chemical aerosol properties on warm cloud droplet activation, Atmos. Chem. Phys., 6, 2593–2649, https://doi.org/10.5194/acp-6-2593-2006, 2006.
McFiggans, G., Topping, D. O., and Barley, M. H.: The sensitivity of secondary organic aerosol component partitioning to the predictions of component properties – Part 1: A systematic evaluation of some available estimation techniques, Atmos. Chem. Phys., 10, 10255–10272, https://doi.org/10.5194/acp-10-10255-2010, 2010.
McFiggans, G., Mentel, T. F., Wildt, J., Pullinen, I., Kang, S., Kleist, E., Schmitt, S., Springer, M., Tillmann, R., Wu, C., Zhao, D., Hallquist, M., Faxon, C., Le Breton, M., Hallquist, Å. M., Simpson, D., Bergström, R., Jenkin, M. E., Ehn, M., Thornton, J. A., Alfarra, M. R., Bannan, T. J., Percival, C. J., Priestley, M., Topping, D., and Kiendler-Scharr, A.: Secondary organic aerosol reduced by mixture of atmospheric vapours, Nature, 565, 587–593, https://doi.org/10.1038/s41586-018-0871-y, 2019.
Mittal, L. A., Green, D. C., Sweeney, B. P., Quincey, P. G., and Fuller, G. W.: Sampling system influence on gaseous air pollution measurements, Atmos. Environ., 79, 406–410, https://doi.org/10.1016/j.atmosenv.2013.06.051, 2013.
Moise, T., Flores, J. M., and Rudich, Y.: Optical Properties of Secondary Organic Aerosols and Their Changes by Chemical Processes, Chem. Rev., 115, 4400–4439, https://doi.org/10.1021/cr5005259, 2015.
Olariu, R. I., Klotz, B., Barnes, I., Becker, K. H., and Mocanu, R.: FT-IR study of the ring-retaining products from the reaction of OH radicals with phenol, o-, m-, and p-cresol, Atmos. Environ., 36, 3685–3697, https://doi.org/10.1016/S1352-2310(02)00202-9, 2002.
Pankow, J. F.: An absorption model of gas/particle partitioning of organic compounds in the atmosphere, Atmos. Environ., 28, 185–188, https://doi.org/10.1016/1352-2310(94)90093-0, 1994.
Pankow, J. F., Marks, M. C., Barsanti, K. C., Mahmud, A., Asher, W. E., Li, J. Y., Ying, Q., Jathar, S. H., and Kleeman, M. J.: Molecular view modeling of atmospheric organic particulate matter: Incorporating molecular structure and co-condensation of water, Atmos. Environ., 122, 400–408, https://doi.org/10.1016/j.atmosenv.2015.10.001, 2015.
Peng, Z. and Jimenez, J. L.: Radical chemistry in oxidation flow reactors for atmospheric chemistry research, Chem. Soc. Rev., 49, 2570–2616, https://doi.org/10.1039/C9CS00766K, 2020.
Priestley, M., Bannan, T. J., Le Breton, M., Worrall, S. D., Kang, S., Pullinen, I., Schmitt, S., Tillmann, R., Kleist, E., Zhao, D., Wildt, J., Garmash, O., Mehra, A., Bacak, A., Shallcross, D. E., Kiendler-Scharr, A., Hallquist, Å. M., Ehn, M., Coe, H., Percival, C. J., Hallquist, M., Mentel, T. F., and McFiggans, G.: Chemical characterisation of benzene oxidation products under high- and low-NOx conditions using chemical ionisation mass spectrometry, Atmos. Chem. Phys., 21, 3473–3490, https://doi.org/10.5194/acp-21-3473-2021, 2021.
Ramanathan, V., Crutzen, P. J., Kiehl, J. T., and Rosenfeld, D.: Atmosphere – Aerosols, climate, and the hydrological cycle, Science, 294, 2119–2124, https://doi.org/10.1126/science.1064034, 2001.
Riipinen, I., Pierce, J. R., Donahue, N. M., and Pandis, S. N.: Equilibration time scales of organic aerosol inside thermodenuders: Evaporation kinetics versus thermodynamics, Atmos. Environ., 44, 597–607, https://doi.org/10.1016/j.atmosenv.2009.11.022, 2010.
Riipinen, I., Rastak, N., and Pandis, S. N.: Connecting the solubility and CCN activation of complex organic aerosols: a theoretical study using solubility distributions, Atmos. Chem. Phys., 15, 6305–6322, https://doi.org/10.5194/acp-15-6305-2015, 2015.
Riva, M., Rantala, P., Krechmer, J. E., Peräkylä, O., Zhang, Y., Heikkinen, L., Garmash, O., Yan, C., Kulmala, M., Worsnop, D., and Ehn, M.: Evaluating the performance of five different chemical ionization techniques for detecting gaseous oxygenated organic species, Atmos. Meas. Tech., 12, 2403–2421, https://doi.org/10.5194/amt-12-2403-2019, 2019.
Saleh, R., Shihadeh, A., and Khlystov, A.: On transport phenomena and equilibration time scales in thermodenuders, Atmos. Meas. Tech., 4, 571–581, https://doi.org/10.5194/amt-4-571-2011, 2011.
Saunders, S. M., Jenkin, M. E., Derwent, R. G., and Pilling, M. J.: Protocol for the development of the Master Chemical Mechanism, MCM v3 (Part A): tropospheric degradation of non-aromatic volatile organic compounds, Atmos. Chem. Phys., 3, 161–180, https://doi.org/10.5194/acp-3-161-2003, 2003.
Schervish, M. and Donahue, N. M.: Peroxy radical chemistry and the volatility basis set, Atmos. Chem. Phys., 20, 1183–1199, https://doi.org/10.5194/acp-20-1183-2020, 2020.
Schobesberger, S., D'Ambro, E. L., Lopez-Hilfiker, F. D., Mohr, C., and Thornton, J. A.: A model framework to retrieve thermodynamic and kinetic properties of organic aerosol from composition-resolved thermal desorption measurements, Atmos. Chem. Phys., 18, 14757–14785, https://doi.org/10.5194/acp-18-14757-2018, 2018.
Schwantes, R. H., Schilling, K. A., McVay, R. C., Lignell, H., Coggon, M. M., Zhang, X., Wennberg, P. O., and Seinfeld, J. H.: Formation of highly oxygenated low-volatility products from cresol oxidation, Atmos. Chem. Phys., 17, 3453–3474, https://doi.org/10.5194/acp-17-3453-2017, 2017.
Shao, Y., Wang, Y., Du, M., Voliotis, A., Alfarra, M. R., Turner, S. F., and McFiggans, G.: Characterisation of the Manchester Aerosol Chamber facility, Atmos. Meas. Tech. Discuss. [preprint], https://doi.org/10.5194/amt-2021-147, in review, 2021.
Shilling, J. E., Zaveri, R. A., Fast, J. D., Kleinman, L., Alexander, M. L., Canagaratna, M. R., Fortner, E., Hubbe, J. M., Jayne, J. T., Sedlacek, A., Setyan, A., Springston, S., Worsnop, D. R., and Zhang, Q.: Enhanced SOA formation from mixed anthropogenic and biogenic emissions during the CARES campaign, Atmos. Chem. Phys., 13, 2091–2113, https://doi.org/10.5194/acp-13-2091-2013, 2013.
Shilling, J. E., Zawadowicz, M. A., Liu, J. M., Zaveri, R. A., and Zelenyuk, A.: Photochemical Aging Alters Secondary Organic Aerosol Partitioning Behavior, ACS Earth Space Chem., 3, 2704–2716, https://doi.org/10.1021/acsearthspacechem.9b00248, 2019.
Shrivastava, M., Cappa, C. D., Fan, J. W., Goldstein, A. H., Guenther, A. B., Jimenez, J. L., Kuang, C., Laskin, A., Martin, S. T., Ng, N. L., Petaja, T., Pierce, J. R., Rasch, P. J., Roldin, P., Seinfeld, J. H., Shilling, J., Smith, J. N., Thornton, J. A., Volkamer, R., Wang, J., Worsnop, D. R., Zaveri, R. A., Zelenyuk, A., and Zhang, Q.: Recent advances in understanding secondary organic aerosol: Implications for global climate forcing, Rev. Geophys., 55, 509–559, https://doi.org/10.1002/2016rg000540, 2017.
Smith, D. F., McIver, C. D., and Kleindienst, T. E.: Primary Product Distribution from the Reaction of Hydroxyl Radicals with Toluene at ppb NOX Mixing Ratios, J. Atmos. Chem., 30, 209–228, https://doi.org/10.1023/A:1005980301720, 1998.
Spracklen, D. V., Jimenez, J. L., Carslaw, K. S., Worsnop, D. R., Evans, M. J., Mann, G. W., Zhang, Q., Canagaratna, M. R., Allan, J., Coe, H., McFiggans, G., Rap, A., and Forster, P.: Aerosol mass spectrometer constraint on the global secondary organic aerosol budget, Atmos. Chem. Phys., 11, 12109–12136, https://doi.org/10.5194/acp-11-12109-2011, 2011.
Stark, H., Yatavelli, R. L. N., Thompson, S. L., Kimmel, J. R., Cubison, M. J., Chhabra, P. S., Canagaratna, M. R., Jayne, J. T., Worsnop, D. R., and Jimenez, J. L.: Methods to extract molecular and bulk chemical information from series of complex mass spectra with limited mass resolution, Int. J. Mass Spectrom., 389, 26–38, https://doi.org/10.1016/j.ijms.2015.08.011, 2015.
Stark, H., Yatavelli, R. L. N., Thompson, S. L., Kang, H., Krechmer, J. E., Kimmel, J. R., Palm, B. B., Hu, W. W., Hayes, P. L., Day, D. A., Campuzano-Jost, P., Canagaratna, M. R., Jayne, J. T., Worsnop, D. R., and Jimenez, J. L.: Impact of Thermal Decomposition on Thermal Desorption Instruments: Advantage of Thermogram Analysis for Quantifying Volatility Distributions of Organic Species, Environ. Sci. Technol., 51, 8491–8500, https://doi.org/10.1021/acs.est.7b00160, 2017.
Stolzenburg, D., Fischer, L., Vogel, A. L., Heinritzi, M., Schervish, M., Simon, M., Wagner, A. C., Dada, L., Ahonen, L. R., Amorim, A., Baccarini, A., Bauer, P. S., Baumgartner, B., Bergen, A., Bianchi, F., Breitenlechner, M., Brilke, S., Buenrostro Mazon, S., Chen, D., Dias, A., Draper, D. C., Duplissy, J., El Haddad, I., Finkenzeller, H., Frege, C., Fuchs, C., Garmash, O., Gordon, H., He, X., Helm, J., Hofbauer, V., Hoyle, C. R., Kim, C., Kirkby, J., Kontkanen, J., Kürten, A., Lampilahti, J., Lawler, M., Lehtipalo, K., Leiminger, M., Mai, H., Mathot, S., Mentler, B., Molteni, U., Nie, W., Nieminen, T., Nowak, J. B., Ojdanic, A., Onnela, A., Passananti, M., Petäjä, T., Quéléver, L. L. J., Rissanen, M. P., Sarnela, N., Schallhart, S., Tauber, C., Tomé, A., Wagner, R., Wang, M., Weitz, L., Wimmer, D., Xiao, M., Yan, C., Ye, P., Zha, Q., Baltensperger, U., Curtius, J., Dommen, J., Flagan, R. C., Kulmala, M., Smith, J. N., Worsnop, D. R., Hansel, A., Donahue, N. M., and Winkler, P. M.: Rapid growth of organic aerosol nanoparticles over a wide tropospheric temperature range, P. Natl. Acad. Sci. USA, 115, 9122–9127, https://doi.org/10.1073/pnas.1807604115, 2018.
Sulyok, M., Haberhauer-Troyer, C., and Rosenberg, E.: Observation of sorptive losses of volatile sulfur compounds during natural gas sampling, J. Chromatogr. A, 946, 301–305, https://doi.org/10.1016/S0021-9673(01)01541-2, 2002.
Thornton, J. A., Mohr, C., Schobesberger, S., D’Ambro, E. L., Lee, B. H., and Lopez-Hilfiker, F. D.: Evaluating Organic Aerosol Sources and Evolution with a Combined Molecular Composition and Volatility Framework Using the Filter Inlet for Gases and Aerosols (FIGAERO), Accounts Chem. Res., 53, 1415–1426, https://doi.org/10.1021/acs.accounts.0c00259, 2020.
Topping, D. O., Barley, M. H., and McFiggans, G.: The sensitivity of Secondary Organic Aerosol component partitioning to the predictions of component properties – Part 2: Determination of particle hygroscopicity and its dependence on “apparent” volatility, Atmos. Chem. Phys., 11, 7767–7779, https://doi.org/10.5194/acp-11-7767-2011, 2011.
Tröstl, J., Chuang, W. K., Gordon, H., Heinritzi, M., Yan, C., Molteni, U., Ahlm, L., Frege, C., Bianchi, F., Wagner, R., Simon, M., Lehtipalo, K., Williamson, C., Craven, J. S., Duplissy, J., Adamov, A., Almeida, J., Bernhammer, A.-K., Breitenlechner, M., Brilke, S., Dias, A., Ehrhart, S., Flagan, R. C., Franchin, A., Fuchs, C., Guida, R., Gysel, M., Hansel, A., Hoyle, C. R., Jokinen, T., Junninen, H., Kangasluoma, J., Keskinen, H., Kim, J., Krapf, M., Kürten, A., Laaksonen, A., Lawler, M., Leiminger, M., Mathot, S., Möhler, O., Nieminen, T., Onnela, A., Petäjä, T., Piel, F. M., Miettinen, P., Rissanen, M. P., Rondo, L., Sarnela, N., Schobesberger, S., Sengupta, K., Sipilä, M., Smith, J. N., Steiner, G., Tomè, A., Virtanen, A., Wagner, A. C., Weingartner, E., Wimmer, D., Winkler, P. M., Ye, P., Carslaw, K. S., Curtius, J., Dommen, J., Kirkby, J., Kulmala, M., Riipinen, I., Worsnop, D. R., Donahue, N. M., and Baltensperger, U.: The role of low-volatility organic compounds in initial particle growth in the atmosphere, Nature, 533, 527–531, https://doi.org/10.1038/nature18271, 2016.
Tsimpidi, A. P., Karydis, V. A., Pozzer, A., Pandis, S. N., and Lelieveld, J.: ORACLE 2-D (v2.0): an efficient module to compute the volatility and oxygen content of organic aerosol with a global chemistry–climate model, Geosci. Model Dev., 11, 3369–3389, https://doi.org/10.5194/gmd-11-3369-2018, 2018.
Wang, D. S. and Hildebrandt Ruiz, L.: Chlorine-initiated oxidation of n-alkanes under high-NOx conditions: insights into secondary organic aerosol composition and volatility using a FIGAERO–CIMS, Atmos. Chem. Phys., 18, 15535–15553, https://doi.org/10.5194/acp-18-15535-2018, 2018.
Wang, M., Chen, D., Xiao, M., Ye, Q., Stolzenburg, D., Hofbauer, V., Ye, P., Vogel, A. L., Mauldin, R. L., Amorim, A., Baccarini, A., Baumgartner, B., Brilke, S., Dada, L., Dias, A., Duplissy, J., Finkenzeller, H., Garmash, O., He, X.-C., Hoyle, C. R., Kim, C., Kvashnin, A., Lehtipalo, K., Fischer, L., Molteni, U., Petäjä, T., Pospisilova, V., Quéléver, L. L. J., Rissanen, M., Simon, M., Tauber, C., Tomé, A., Wagner, A. C., Weitz, L., Volkamer, R., Winkler, P. M., Kirkby, J., Worsnop, D. R., Kulmala, M., Baltensperger, U., Dommen, J., El-Haddad, I., and Donahue, N. M.: Photo-oxidation of Aromatic Hydrocarbons Produces Low-Volatility Organic Compounds, Environ. Sci. Technol., 54, 7911–7921, https://doi.org/10.1021/acs.est.0c02100, 2020.
Whalley, L. K., Stone, D., Bandy, B., Dunmore, R., Hamilton, J. F., Hopkins, J., Lee, J. D., Lewis, A. C., and Heard, D. E.: Atmospheric OH reactivity in central London: observations, model predictions and estimates of in situ ozone production, Atmos. Chem. Phys., 16, 2109–2122, https://doi.org/10.5194/acp-16-2109-2016, 2016.
Wyche, K. P., Monks, P. S., Ellis, A. M., Cordell, R. L., Parker, A. E., Whyte, C., Metzger, A., Dommen, J., Duplissy, J., Prevot, A. S. H., Baltensperger, U., Rickard, A. R., and Wulfert, F.: Gas phase precursors to anthropogenic secondary organic aerosol: detailed observations of 1,3,5-trimethylbenzene photooxidation, Atmos. Chem. Phys., 9, 635–665, https://doi.org/10.5194/acp-9-635-2009, 2009.
Yahya, K., Glotfelty, T., Wang, K., Zhang, Y., and Nenes, A.: Modeling regional air quality and climate: improving organic aerosol and aerosol activation processes in WRF/Chem version 3.7.1, Geosci. Model Dev., 10, 2333–2363, https://doi.org/10.5194/gmd-10-2333-2017, 2017.
Yli-Juuti, T., Pajunoja, A., Tikkanen, O.-P., Buchholz, A., Faiola, C., Väisänen, O., Hao, L., Kari, E., Peräkylä, O., Garmash, O., Shiraiwa, M., Ehn, M., Lehtinen, K., and Virtanen, A.: Factors controlling the evaporation of secondary organic aerosol from α-pinene ozonolysis, Geophys. Res. Lett., 44, 2562–2570, https://doi.org/10.1002/2016GL072364, 2017.
Ylisirniö, A., Barreira, L. M. F., Pullinen, I., Buchholz, A., Jayne, J., Krechmer, J. E., Worsnop, D. R., Virtanen, A., and Schobesberger, S.: On the calibration of FIGAERO-ToF-CIMS: importance and impact of calibrant delivery for the particle-phase calibration, Atmos. Meas. Tech., 14, 355–367, https://doi.org/10.5194/amt-14-355-2021, 2021.
Zhang, X., Cappa, C. D., Jathar, S. H., Mcvay, R. C., Ensberg, J. J., Kleeman, M. J., and Seinfeld, J. H.: Influence of vapor wall loss in laboratory chambers on yields of secondary organic aerosol, P. Natl. Acad. Sci. USA, 111, 5802–5807, https://doi.org/10.1073/pnas.1404727111, 2014.
Zhang, X., McVay, R. C., Huang, D. D., Dalleska, N. F., Aumont, B., Flagan, R. C., and Seinfeld, J. H.: Formation and evolution of molecular products in α-pinene secondary organic aerosol, P. Natl. Acad. Sci. USA, 112, 14168–14173, https://doi.org/10.1073/pnas.1517742112, 2015.
- Article
(1142 KB) - Full-text XML