the Creative Commons Attribution 4.0 License.
the Creative Commons Attribution 4.0 License.
 | 21 Sep 2021
Global tropospheric halogen (Cl, Br, I) chemistry and its impact on oxidants
Daniel J. Jacob
William Downs
Shuting Zhai
Viral Shah
Christopher D. Holmes
Tomás Sherwen
Becky Alexander
Mathew J. Evans
Sebastian D. Eastham
J. Andrew Neuman
Patrick R. Veres
Theodore K. Koenig
Rainer Volkamer
L. Gregory Huey
Thomas J. Bannan
Carl J. Percival
Ben H. Lee
Joel A. Thornton
We present an updated mechanism for tropospheric halogen (Cl + Br + I) chemistry in the GEOS-Chem global atmospheric chemical transport model and apply it to investigate halogen radical cycling and implications for tropospheric oxidants. Improved representation of HOBr heterogeneous chemistry and its pH dependence in our simulation leads to less efficient recycling and mobilization of bromine radicals and enables the model to include mechanistic sea salt aerosol debromination without generating excessive BrO. The resulting global mean tropospheric BrO mixing ratio is 0.19 ppt (parts per trillion), lower than previous versions of GEOS-Chem. Model BrO shows variable consistency and biases in comparison to surface and aircraft observations in marine air, which are often near or below the detection limit. The model underestimates the daytime measurements of Cl2 and BrCl from the ATom aircraft campaign over the Pacific and Atlantic, which if correct would imply a very large missing primary source of chlorine radicals. Model IO is highest in the marine boundary layer and uniform in the free troposphere, with a global mean tropospheric mixing ratio of 0.08 ppt, and shows consistency with surface and aircraft observations. The modeled global mean tropospheric concentration of Cl atoms is 630 cm−3, contributing 0.8 % of the global oxidation of methane, 14 % of ethane, 8 % of propane, and 7 % of higher alkanes. Halogen chemistry decreases the global tropospheric burden of ozone by 11 %, NOx by 6 %, and OH by 4 %. Most of the ozone decrease is driven by iodine-catalyzed loss. The resulting GEOS-Chem ozone simulation is unbiased in the Southern Hemisphere but too low in the Northern Hemisphere.
- Article
(9404 KB) - Full-text XML
-
Supplement
(215 KB) - BibTeX
- EndNote


Halogen radicals (chlorine, bromine, iodine) have a broad range of implications for tropospheric oxidant chemistry. They originate from sea salt aerosol (SSA), emitted halogen gases, and transport from the stratosphere, and they cycle rapidly with inorganic non-radical reservoirs (Platt and Hönninger, 2003; Finlayson-Pitts, 2003; Saiz-Lopez and von Glasow, 2012; Simpson et al., 2015; Wang et al., 2019). Cl, Br, and I atoms provide sinks for volatile organic compounds (VOCs), dimethylsulfide (DMS), and mercury (Atkinson, 1997; Saiz-Lopez and von Glasow, 2012; Horowitz et al., 2017). Cycling between halogen radicals and their reservoirs converts NOx to HNO3 and causes catalytic loss of ozone (von Glasow et al., 2004; Yang et al., 2005; Sherwen et al., 2016b). Reaction of Cl− with N2O5 in polluted environments at night produces ClNO2 that photolyzes in the daytime to return Cl atoms and NO2, stimulating ozone production (Osthoff et al., 2008; Roberts et al., 2008). Acid displacement of Cl− by HNO3 is a source of aerosol. Reviews by Saiz-Lopez and von Glasow (2012) and Simpson et al. (2015) describe this fundamental knowledge of tropospheric halogen chemistry in more detail.
A number of global modeling studies have explored the importance of halogen chemistry in the troposphere (von Glasow et al., 2004; Saiz-Lopez et al., 2006; Ordóñez et al., 2012; Long et al., 2014), but there remain large uncertainties in sources and chemical mechanisms. Here we present a new mechanistic description of halogen tropospheric chemistry in the GEOS-Chem global model that synthesizes previous GEOS-Chem developments (Parrella et al., 2012; Eastham et al., 2014; Schmidt et al., 2016; Sherwen et al., 2016a, b, 2017; Chen et al., 2017; Wang et al., 2019; Zhu et al., 2019) and includes a number of updates. We use the updated model to interpret recent observations of tropospheric halogens, describe halogen radical cycling, and quantify the impacts on tropospheric oxidant chemistry. Shah et al. (2021) examine the impact of our simulated Br and Cl atom concentrations in a new redox mechanism for atmospheric mercury.
We describe here our updated representation of tropospheric halogen chemistry in version 12.9 of GEOS-Chem (http://www.geos-chem.org), implemented as part of the general model mechanism for coupled ozone–NOx–VOCs–aerosol–halogen tropospheric and stratospheric chemistry. Extensive referencing will be made to Sherwen et al. (2016b), who implemented the previous representation of tropospheric halogen chemistry in GEOS-Chem (version 11-02), and to Wang et al. (2019), who described an earlier version of the mechanism implemented here. GEOS-Chem stratospheric halogen chemistry is as described by Eastham et al. (2014), and we do not discuss it further here.
Table 1Global sources and sinks of tropospheric gas-phase inorganic chlorine (Cly), bromine (Bry), and iodine (Iy)a.
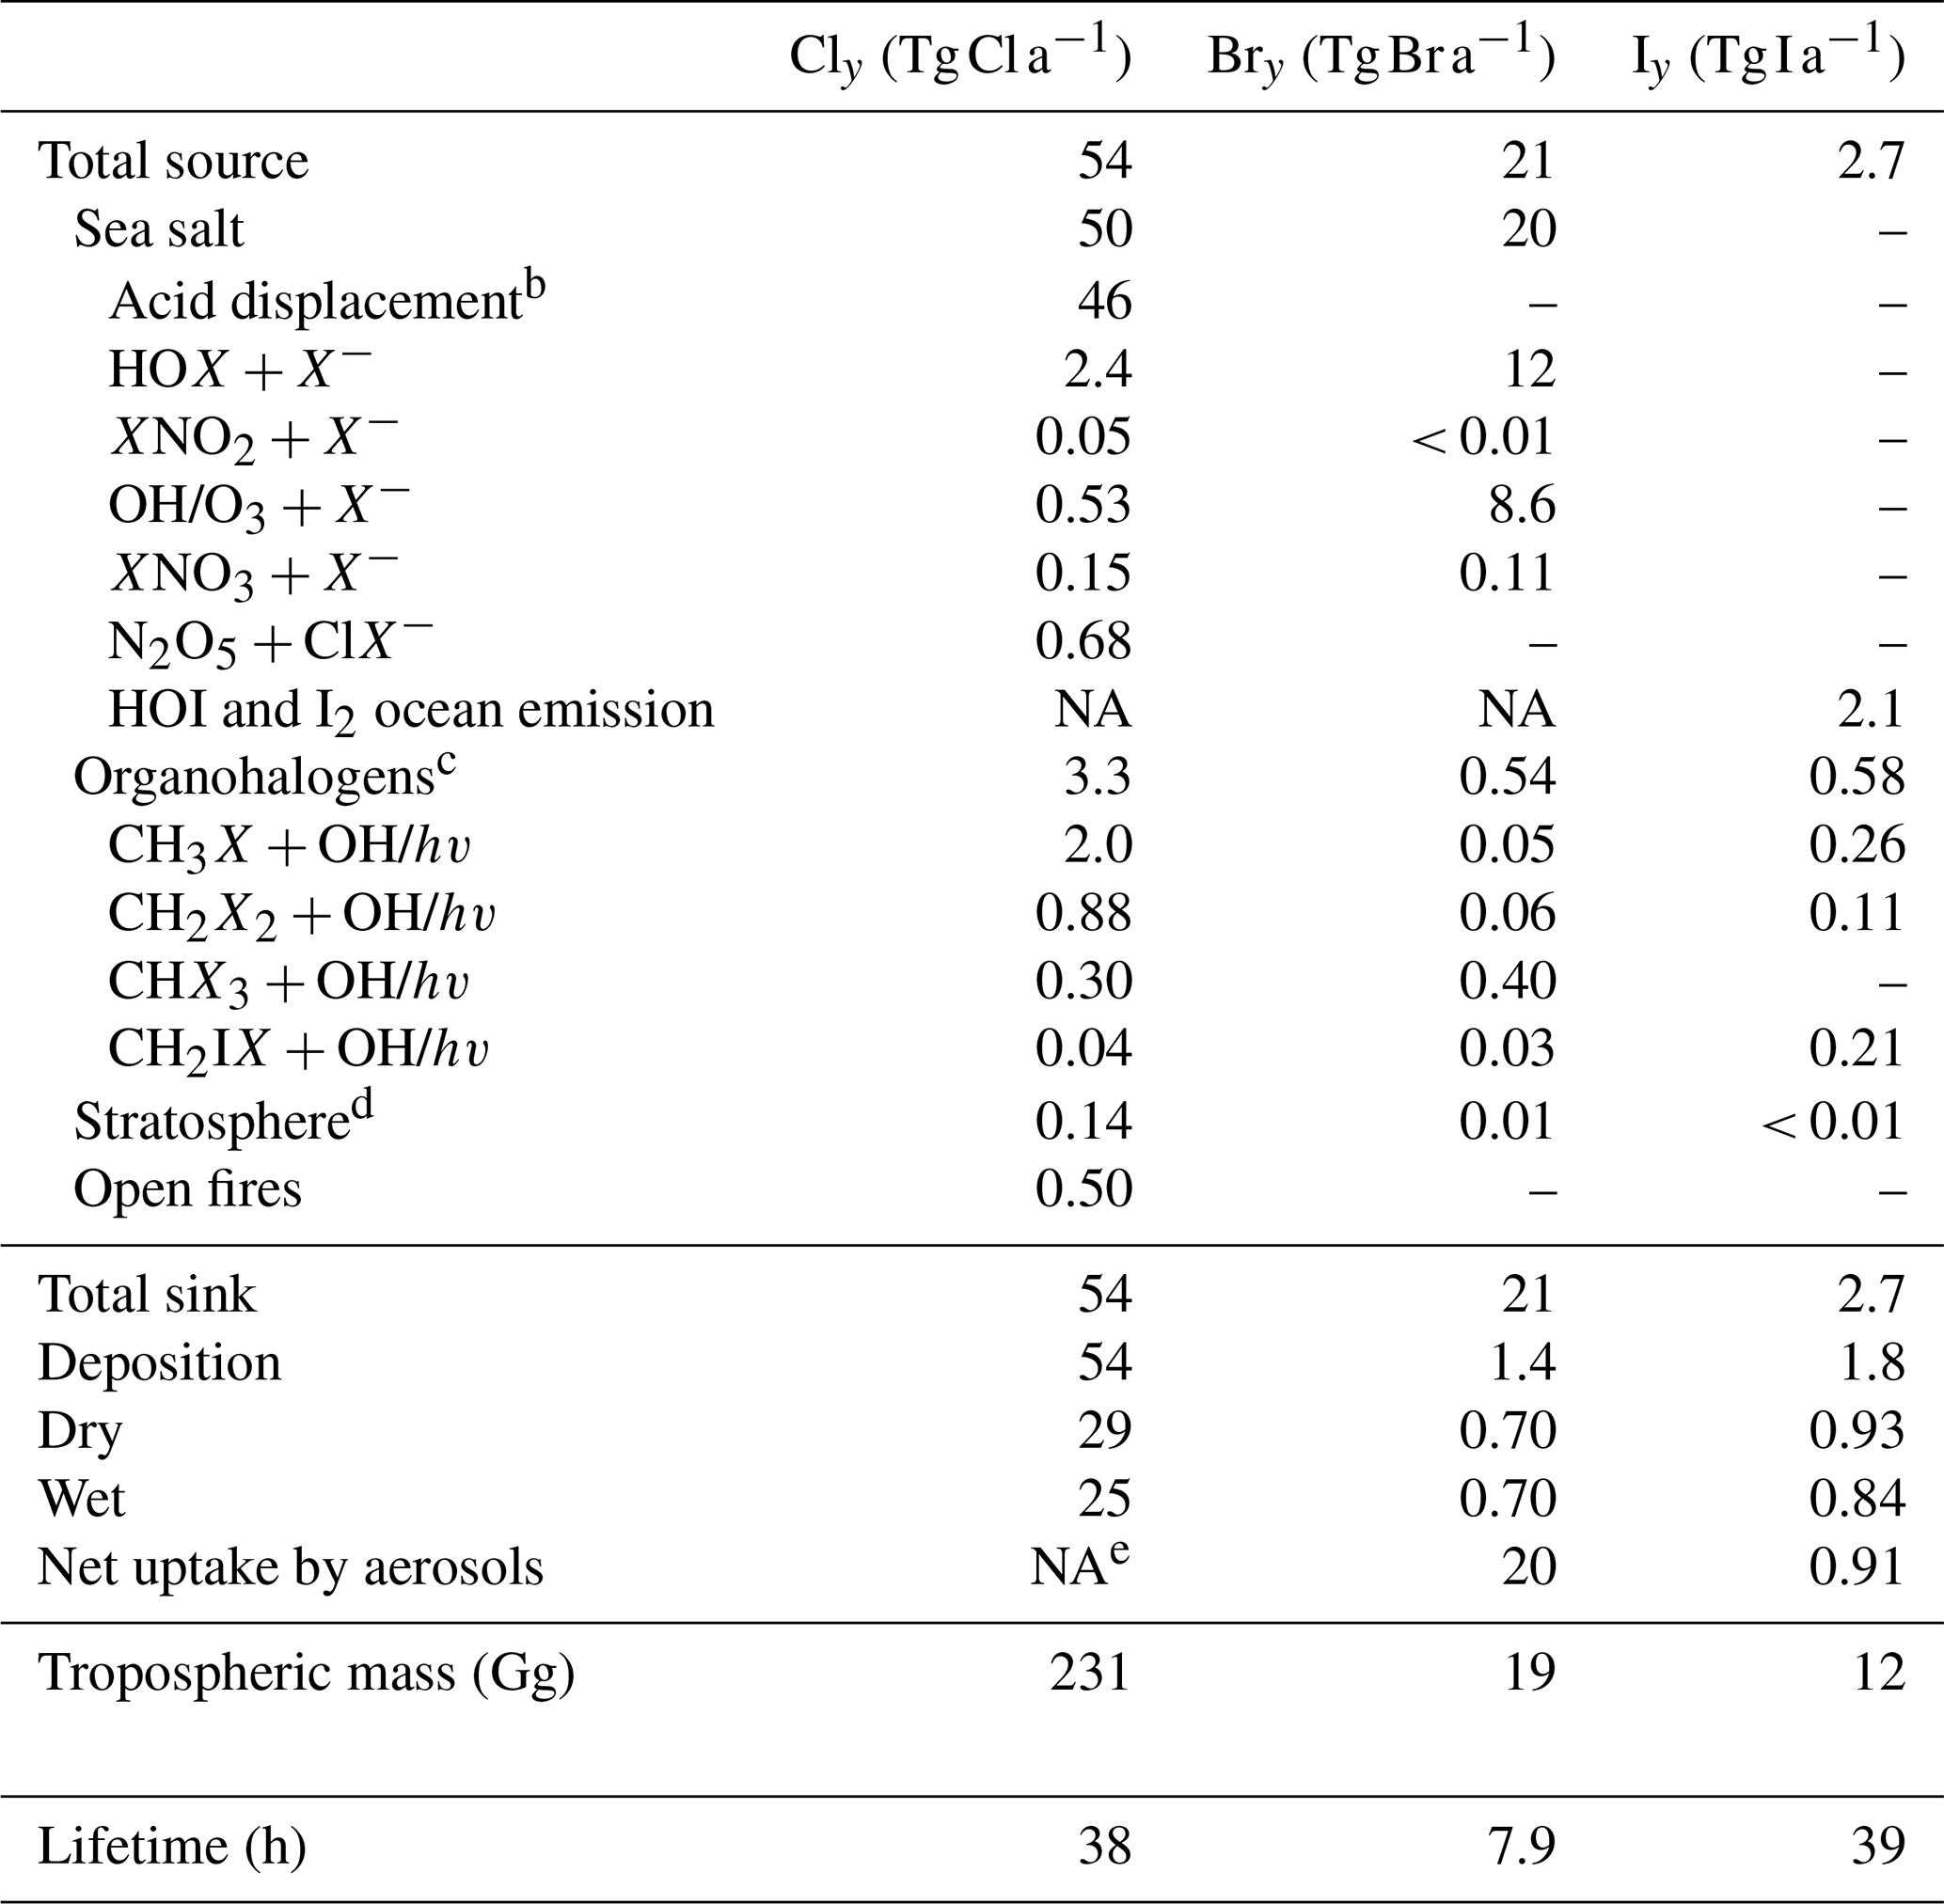
a Annual totals for 2016 computed from GEOS-Chem. Dashes indicate negligibly small terms. Gas-phase inorganic chlorine is defined as Cly ≡ Cl + 2 × Cl2 + 2 × Cl2O2 + ClNO2 + ClNO3 + ClO + ClOO + OClO + BrCl + ICl + HOCl + HCl. Gas-phase inorganic bromine is defined as Bry ≡ Br + 2 × Br2 + BrNO2 + BrNO3 + BrO + BrCl + IBr + HOBr + HBr. Gas-phase inorganic iodine is defined as Iy ≡ I + 2 × I2 + 2 × I2O2 + 2 × I2O3 + 2 × I2O4 + OIO + INO + INO2 + INO3 + IO + ICl + IBr + HOI + HI. We use X to denote any of Cl, Br, or I. b Acid displacement, significant only for HCl. The table gives the net production minus loss of HCl from acid aerosol displacement by HNO3 and H2SO4 minus HCl uptake by sea salt alkalinity. c CH2X2 and CHX3 denote unmixed halogens, such as CH2Cl2 or CHBr3. CH2IX denotes the mixed iodocarbons CH2ICl and CH2IBr. d Net stratospheric input to the troposphere. e For Cly the uptake is included as an offsetting term in the acid displacement source (footnote b). NA: not available.
2.1 Sources of tropospheric halogens
Table 1 lists the global sources and sinks of tropospheric gas-phase inorganic chlorine (Cly), bromine (Bry), and iodine (Iy) in GEOS-Chem (see Table 1 for definitions of Cly, Bry, and Iy). SSA emissions are from Jaeglé et al. (2011). Open-fire emissions of HCl are obtained by applying the emission factors from Andreae (2019) for different vegetation types to the GFED4 (Global Fire Emissions Database version 4) biomass burned inventory (van der Werf et al., 2017). The resulting global source of 0.5 Tg Cl a−1 is much smaller than in Wang et al. (2019), who used older emission factors from Lobert et al. (1999). Organohalogen gases can produce halogen radicals by oxidation and photolysis. Emissions of CH3Cl, CH2Cl2, CHCl3, and CHBr3 are implicitly treated in the model by specifying latitudinal and monthly surface air boundary conditions from CMIP6 (historical greenhouse gas concentrations for climate modeling) (Meinshausen et al., 2017). Emissions of other bromocarbons (CH3Br, CH2Br2) and iodocarbons (CH3I, CH2I2, CH2ICl, CH2IBr) are from Bell et al. (2002), Liang et al. (2010), and Ordóñez et al. (2012).
We do not include continental emissions of inorganic chlorine from anthropogenic sources (fuel combustion, waste incineration, etc.) and dust because they are highly uncertain and most likely negligible from a global perspective. The only available global emission inventory for anthropogenic HCl and Cl− is that of McCulloch et al. (1999) at 6.7 Tg Cl a−1 for 1990s, but we previously found this inventory to be too high by an order of magnitude in comparison to regional inventories and atmospheric observations (Wang et al., 2019). Analysis of deposition data by Haskins et al. (2020) finds that anthropogenic chlorine emissions have decreased by 95 % in the US since 1998, further indicating that the McCulloch et al. (1999) inventory is outdated. Our previous model comparisons to aerosol Cl− observations indicate that anthropogenic chlorine sources are important in China (Wang et al., 2020) but not in the US, where the observed Cl− concentrations can be attributed to long-range transport of SSA plus some dust influence in the southwest (Wang et al., 2019). Zhai et al. (2021), who include anthropogenic HCl emissions using the observed HCl:SO2 ratio (Lee et al., 2018), also find that anthropogenic sources of chlorine are very small over North America and western Europe. Because of this neglect of anthropogenic sources, our model results may underestimate chlorine concentrations in continental source regions.
The main global source of tropospheric Cly is mobilization of Cl− from SSA. A total of 50 (2.4 % of SSA emissions) is mobilized to Cly in the model by acid displacement and other heterogeneous reactions. This number is smaller than our previous estimate in Wang et al. (2019) (64 ), mainly due to slower ClNO2 generation from the N2O5 + Cl− reaction (Sect. 2.3). Organochlorines provide a tropospheric source of 3.3 as Cl atoms from photolysis and oxidation. Transport from the stratosphere adds 0.14 Tg Cl a−1 to tropospheric Cly. The source of Iy is estimated to be 2.7 Tg I a−1, mostly from the inorganic iodine (HOI, I2) formed from the ocean surface reaction of O3 with iodide (I−), based on Carpenter et al. (2013) and MacDonald et al. (2014) and as described by Sherwen et al. (2016b).
In GEOS-Chem versions before 12.9, SSA debromination was not included despite being known to be an important source for Bry (Sander et al., 2003). This is because SSA debromination generated excessive BrO concentrations in comparison to observations, which then drove excessive ozone depletion (Schmidt et al., 2016; Zhu et al., 2019). Revision of HOBr reactive uptake as a source of bromine radicals effectively corrects this problem (Sect. 2.2), allowing us to include mechanistically the SSA debromination source. This provides the main global source of tropospheric Bry (20 Tg Br a−1), mostly through the HOBr, HOCl, and HOI + Br− heterogeneous reactions. Bromocarbon gases contribute only 0.54 Gg Br a−1 to Bry but still dominate the Bry source in the free troposphere.
2.2 Chemical mechanism
Our tropospheric halogen chemistry mechanism synthesizes and updates previous GEOS-Chem mechanistic developments. Chlorine chemistry in GEOS-Chem was first built in Eastham et al. (2014) for the stratosphere and extended to the troposphere by Schmidt et al. (2016), with updates by Sherwen et al. (2016b, 2017) and Wang et al. (2019, 2020). Tropospheric bromine chemistry was first built by Parrella et al. (2012), with updates to heterogeneous reactions by Schmidt et al. (2016), Chen et al. (2017), Wang et al. (2019), and Zhu et al. (2019). Iodine chemistry was built by Sherwen et al. (2016a, b). Recent general model updates important for halogen chemistry include a new method of simulating cloud chemistry in partly cloudy grid cells that accounts for limitation by entrainment of air into the cloud (Holmes et al., 2019) and an improved cloud water pH calculation that considers carboxylic acids and dust alkalinity (Moch et al., 2020; Shah et al., 2020). Aqueous aerosol thermodynamics including calculation of aerosol pH and HCl–Cl− partitioning are from ISORROPIA II (Fountoukis and Nenes, 2007).
Table 2First-order reaction rate constants (kI) for HOBr heterogeneous reactions in aerosol and liquid cloud water.
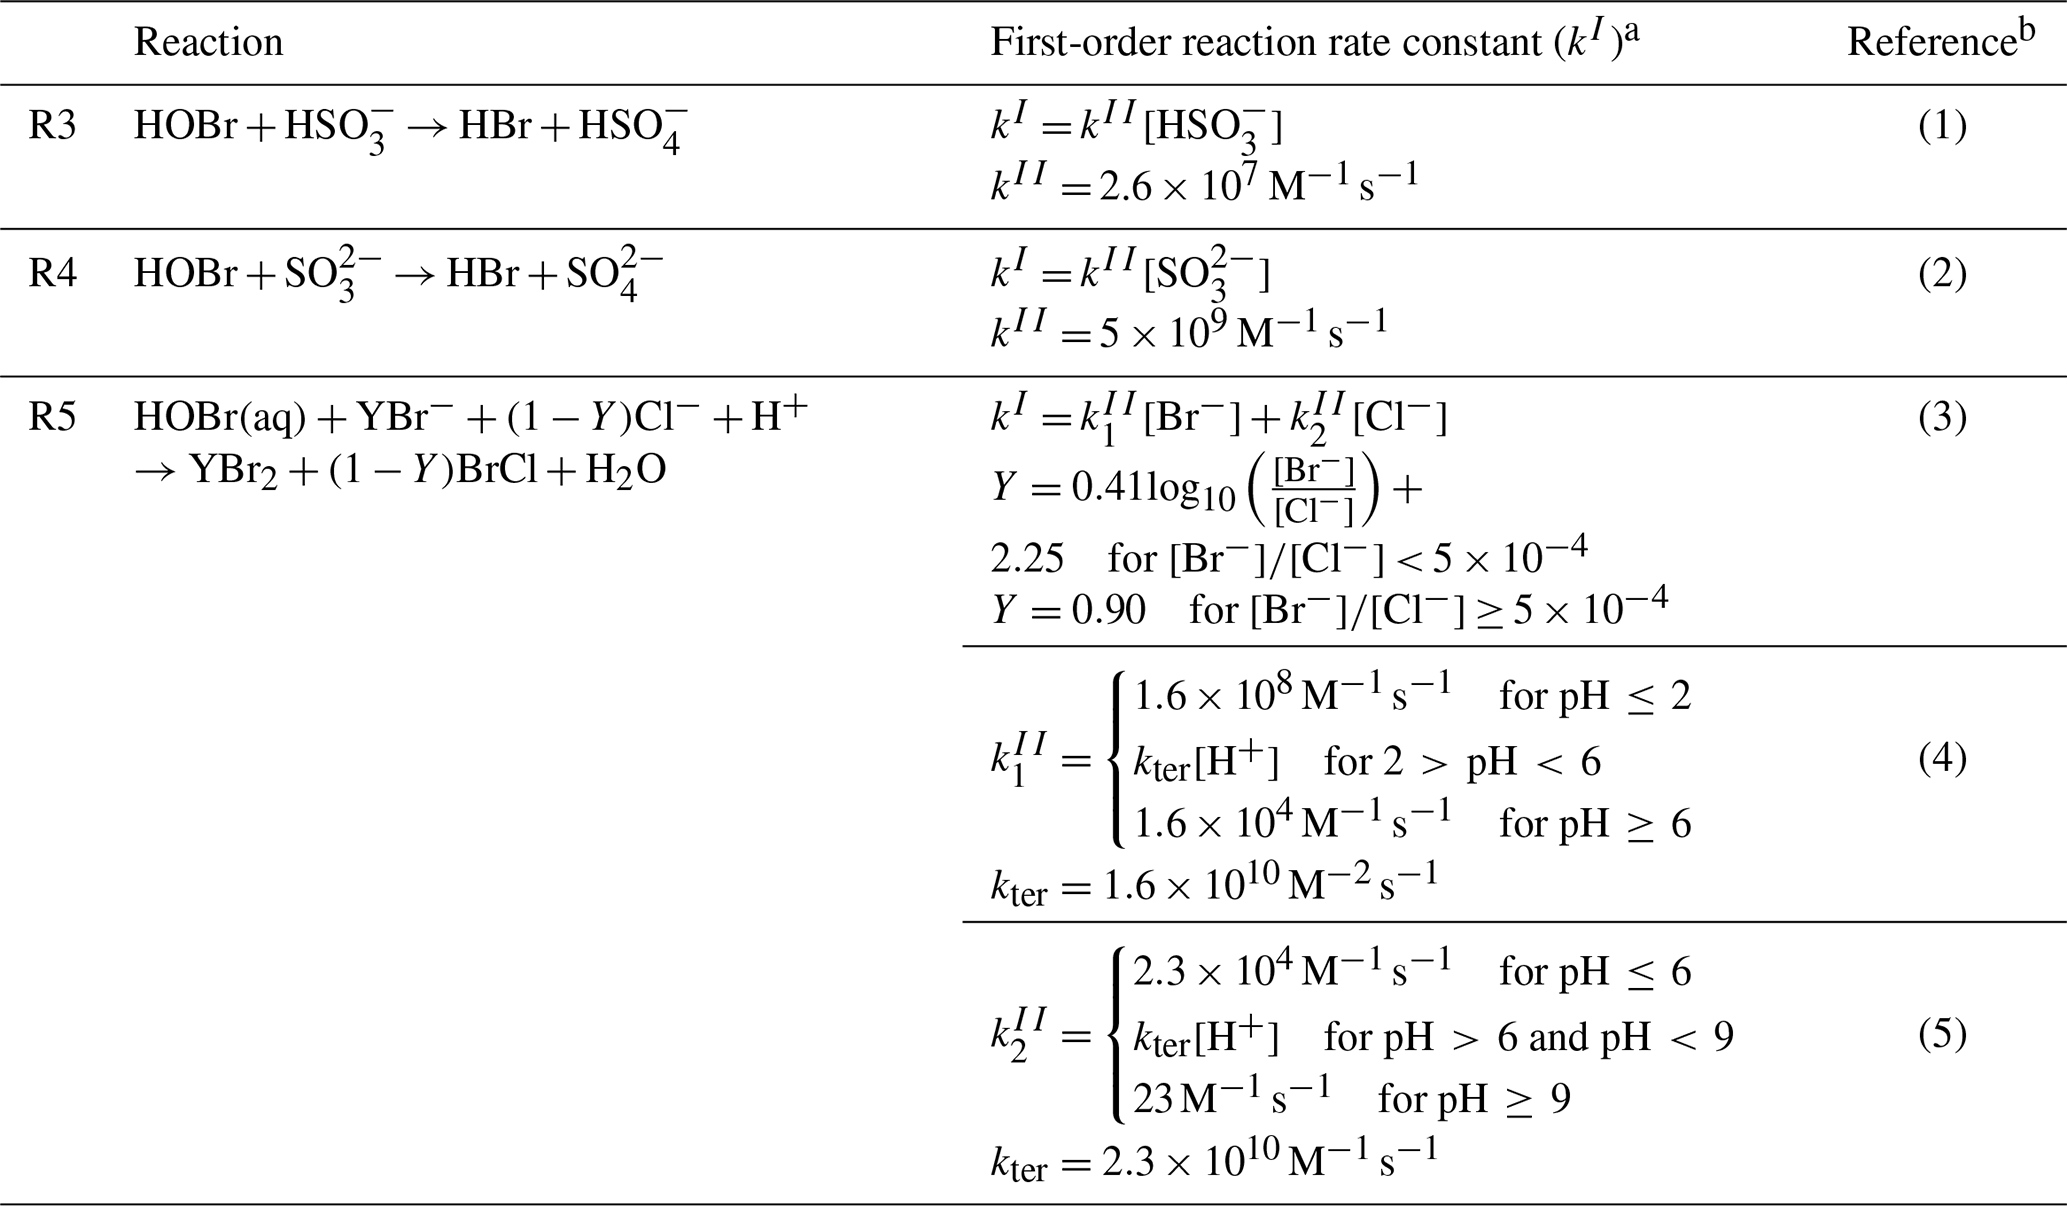
a This first-order rate constant describes the first-order HOBr loss rate , which is used in Eqs. (1)–(4) to calculate the HOBr reactive uptake coefficient γ. b References: (1) Liu and Abbatt (2020), (2) Troy and Margerum (1991), (3) Fickert et al. (1999), (4) Roberts et al. (2014), Beckwith et al. (1996; kter value), (5) Roberts et al. (2014), Liu and Margerum (2001; kter value).
We update here the reactive uptake of HOBr by aerosols and cloud droplets (Table 2). This uptake involves reactions with Br−, Cl−, and dissolved SO2 (S(IV) ≡ + ):
Reactions (R1) and (R2) with subsequent fast photolysis of Br2 and BrCl recycle bromine radicals from HOBr and further mobilize Br− and Cl− to produce new radicals. In GEOS-Chem, the rates are applied to the following stoichiometry:
where Y is the yield of Br2, and 1−Y is the yield of BrCl, which are calculated based on the laboratory study of Fickert et al. (1999) and described in Table 2.
Total reactive uptake of HOBr from Reactions (R3)–(R5) in aqueous aerosols and clouds is calculated with a standard first-order reactive uptake coefficient γ (Jacob, 2000), calculated following Ammann et al. (2013):
where HHOBr is the Henry's law constant of HOBr (Sander, 2015); T is temperature; R is the universal gas constant (8.314 ); Dl is the liquid-phase diffusion coefficient for HOBr (1.4 × 10⁻⁵ cm2 s−1); f(r,Ir) is the reacto-diffusive correction term; and kI is the first-order total reaction rate constant of HOBr from pathways (R3)–(R5), computed as a function of the concentrations of Br−, Cl−, H+, , and . After computing the overall loss of HOBr, we distribute the loss by pathways on the basis of the relative reaction rates . Reactions (R3) and (R4) are important only in clouds where high liquid water content and relatively high pH enable dissolution of SO2.
Wang et al. (2019) previously calculated based on experimental results over limited and inconsistent pH ranges (pH = 1.9–2.4 for HOBr + Br−, pH = 6.4 for HOBr + Cl−; Beckwith et al., 1996; Liu and Margerum, 2001). This generated excessive BrO concentrations in comparison to observations. Here we revise the calculation of to consider the entire range of aerosol and cloud pH, as recommended by Roberts et al. (2014), resulting in a much slower rate. We also adopt a new value for from a recent laboratory study (Liu and Abbatt, 2020), updating the upper limit of 3.2 × 10⁹ previously reported by Liu (2000). Details of these updates are in Table 2. The overall result is to have less efficient heterogeneous recycling and mobilization of bromine radicals in both aerosols and clouds.
Wang et al. (2019) found the heterogeneous reaction of HOCl with Cl− to be the dominant global tropospheric source of Cl2 in GEOS-Chem:
Here we add competing reactions between HOCl and S(IV):
with reaction rate coefficients k7 = 2.8 × 10⁵ and k8 = 7.6 × 10⁸ from Liu and Abbatt (2020) and Fogelman et al. (1989), respectively. Reactions (R7) and (R8) are relatively slow and have minor overall impact on the Cly chemistry.
Aerosol aqueous-phase reaction of N2O5 with Cl− produces ClNO2 that photolyzes in the daytime to return Cl atoms and NO2. The reaction competes with N2O5 hydrolysis, with the following first-order loss representation for N2O5:
McDuffie et al. (2018a, b) evaluated different model expressions for the reactive uptake coefficient and the ClNO2 yield φ and recommended lower values than previously used in GEOS-Chem by Wang et al. (2019) to account for the effect of organic coating of particles. We previously implemented this update in Wang et al. (2020), and it is now part of GEOS-Chem version 12.9.
We update the previous GEOS-Chem representation of IBr and ICl formation from uptake of iodine species on sea salt aerosols (Sherwen et al., 2016a) to conserve mass and be consistent with analogous reactions for uptake of bromine and chlorine:
Reaction rates are calculated using reactive uptake coefficients γ for INO3, INO2, and HOI as given by Sherwen et al. (2016a), with Reactions (R10)–(R12) taking place in acidic aerosols and Reaction (R13) taking place in alkaline aerosols.
Table 3Heterogeneous halogen reactions on ice crystalsa.

a Formulations for the reactive uptake coefficient γ are from IUPAC (Cowley et al., 2010). [ ]g denotes gas-phase concentration in units of molecules cm−3 of air; γgs is the elementary reaction probability for a gas-phase molecule colliding with the ice surface; θ is the fractional coverage of a gas species on the ice surface. KLangC is a partition coefficient in units of cubic centimeters per molecule. KLinC is a partition coefficient in units of . T is air temperature in kelvin. Nmax denotes the maximum number of available surface sites for a gas species per cubic centimeter of ice surface; c is the average gas-phase thermal velocity for the reactant; θ, KLangC, KLinC, and Nmax for each species are calculated using the same method throughout the table. Reactions (R14) and (R15) compete with each other; Reactions R18, R19, and R20 compete with each other; these competitions use branching ratios determined by the relative rates.
Additional updates to the GEOS-Chem halogen mechanism in version 12.9 include a new scheme to calculate the reactive uptake coefficients γ on ice crystals following recommendations by the International Union of Pure and Applied Chemistry (IUPAC) (Crowley et al., 2010) as listed in Table 3. We calculate the effective radius of ice crystals based on air temperature following Heymsfield et al. (2014) and Holmes et al. (2019) and increase the resulting surface area by a factor of 2.25 to account for irregular shape (Schmitt and Heymsfield, 2005). We also update BrNO3 hydrolysis to include the temperature dependence of Γ (in Eq. 1) from Deiber et al. (2004):
where T is air temperature in kelvin.
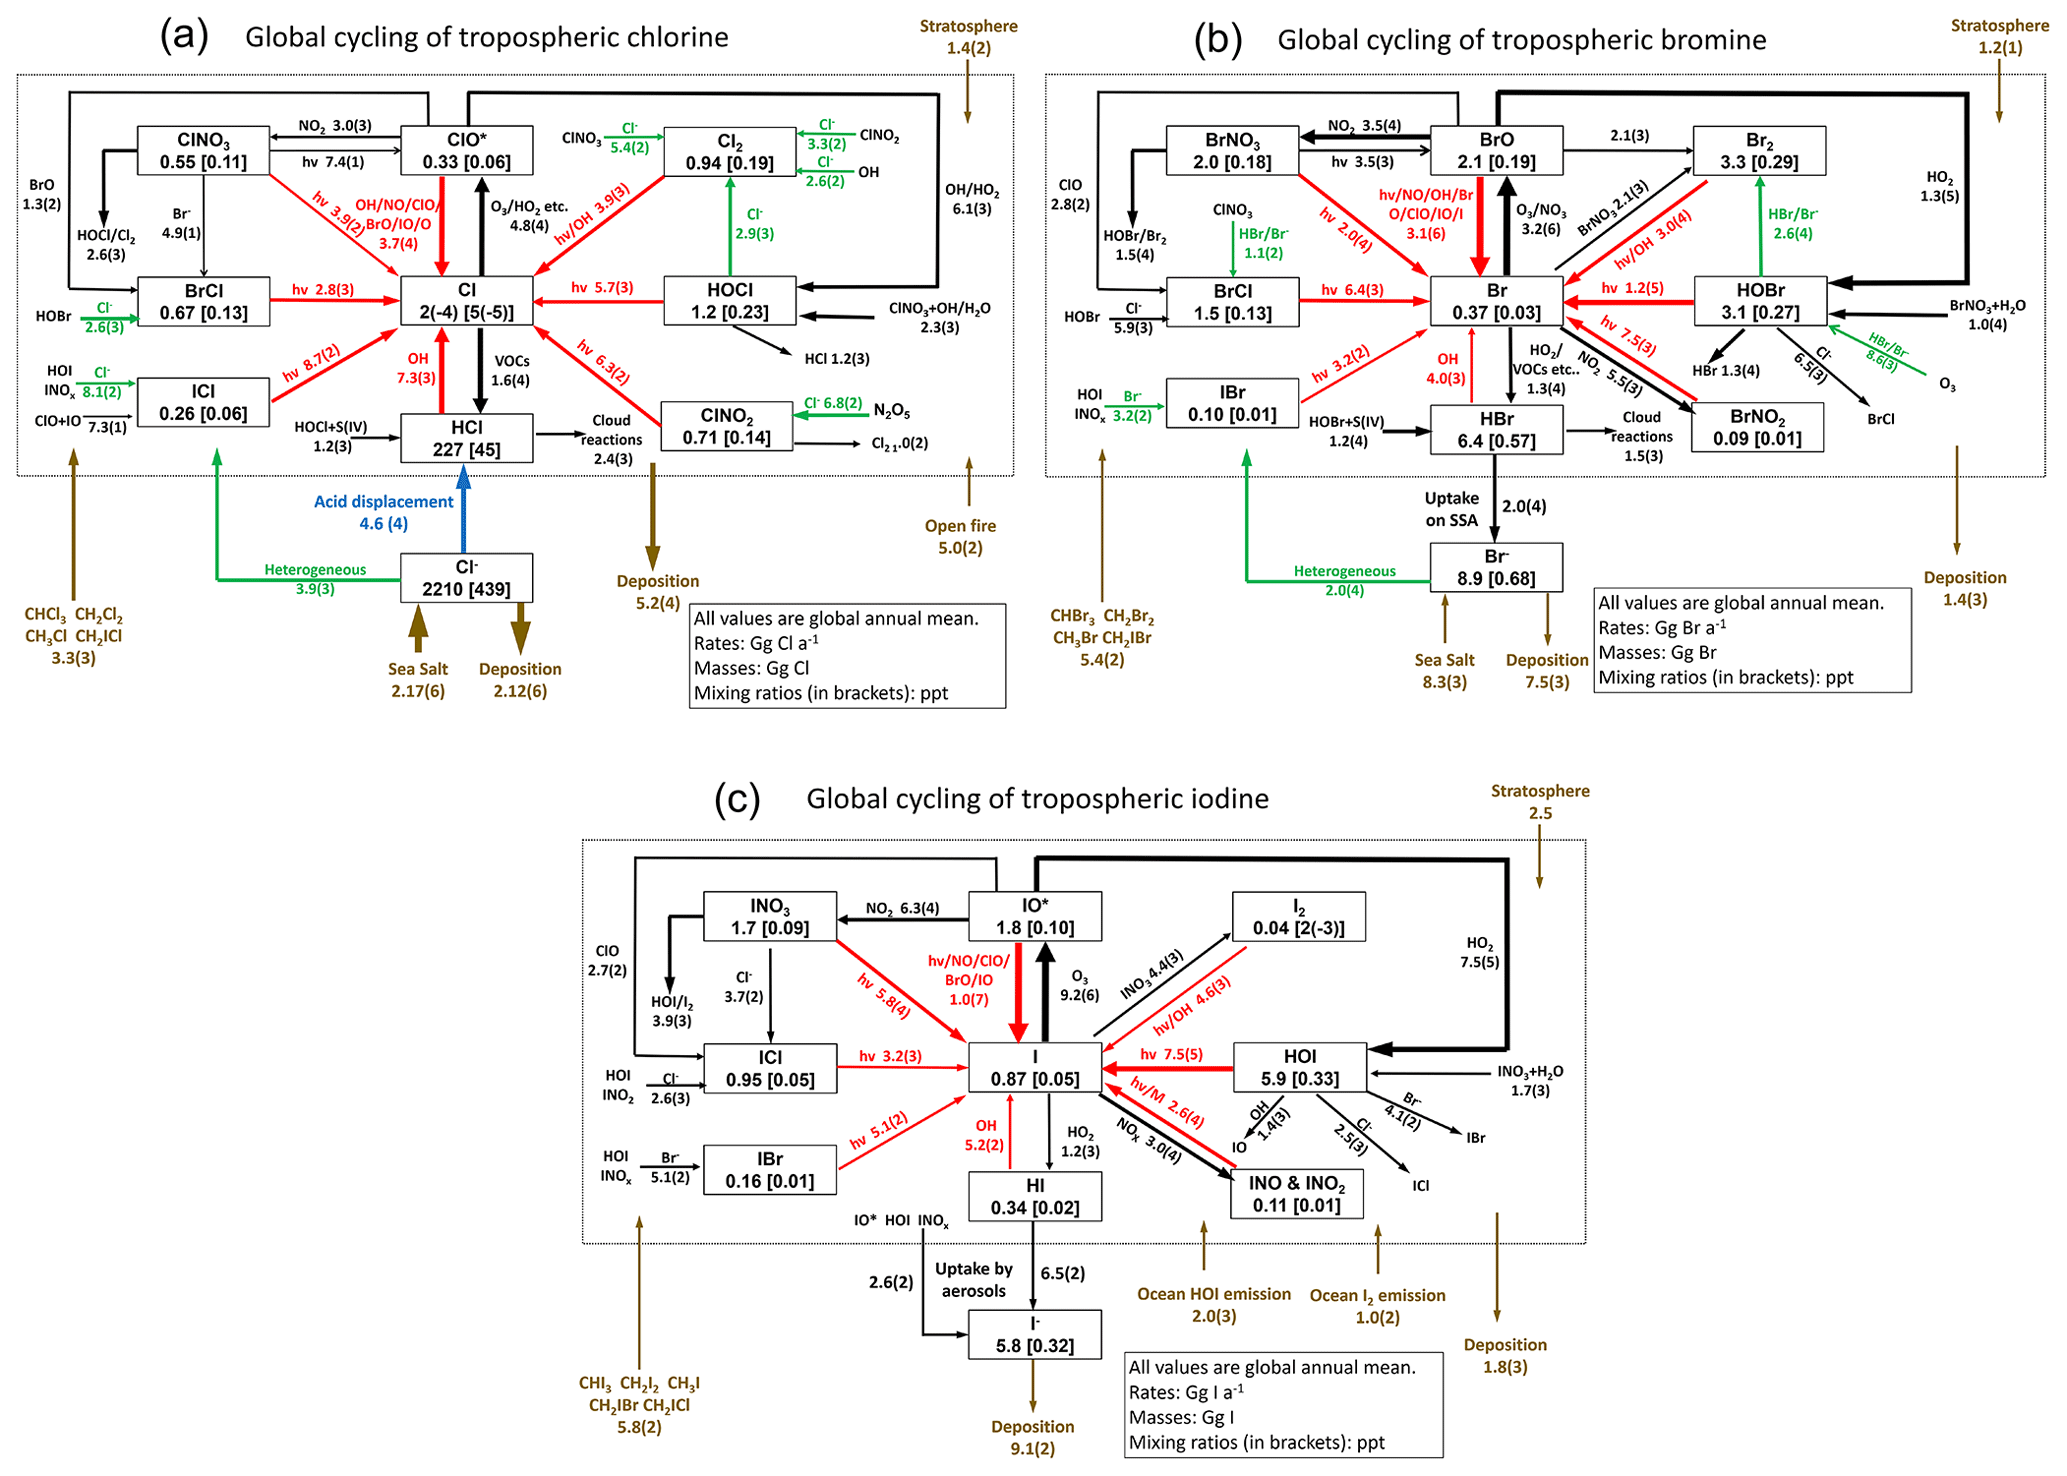
Figure 1(a) Global budget and cycling of tropospheric inorganic chlorine (Cly) in GEOS-Chem. Read 1.0(4) as 1.0 × 10⁴. Reactions producing Cl atoms are in red. Heterogeneous reactions are in green. The dotted box indicates the Cly family, and arrows into and out of that box represent general sources and sinks of Cly. Reactions with a rate of < 100 Gg Cl a−1 are not shown. ClO∗ stands for ClO + OClO + ClO2 + 2Cl2O2; most ClO∗ is present as ClO. The super-fast Cl–ClOO cycling is not included as it does not affect the Cl atom concentration. (b) Same as (a) but for tropospheric inorganic bromine (Bry). (c) Same as (a) but for tropospheric inorganic iodine (Iy). IO∗ stands for IO + OIO + 2I2O2 + 2I2O3 + 2I2O4.
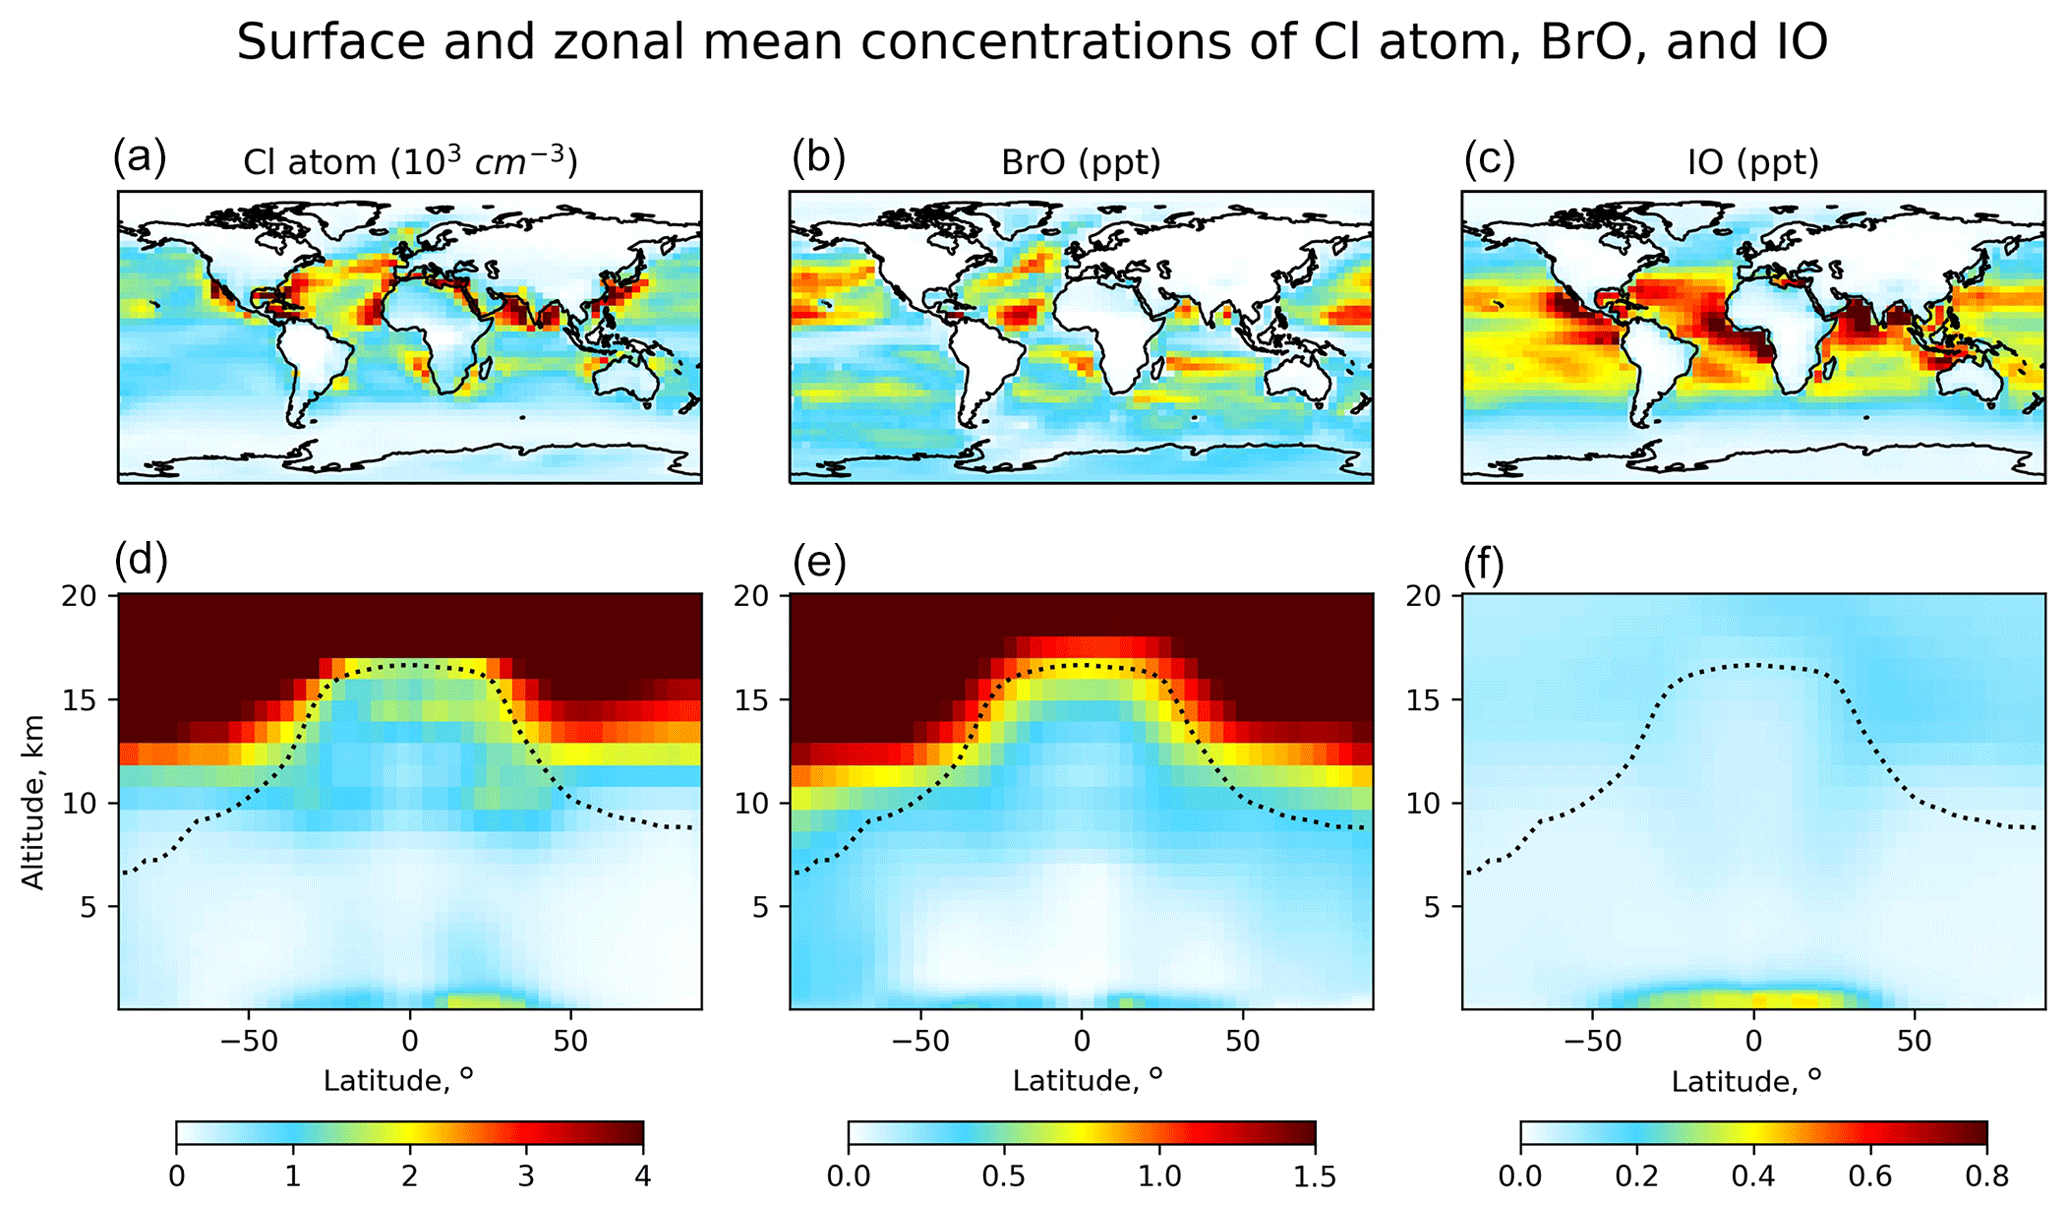
Figure 2Global distribution of annual mean GEOS-Chem number densities of Cl atoms and mixing ratios of BrO and IO. Panels (a–c) show surface air values, and panels (d–f) show zonal means as a function of latitude and altitude. Dashed lines indicate the tropopause.

Figure 3Global annual mean vertical speciation in GEOS-Chem of reactive chlorine (Cl∗ ≡ Cly − HCl), gaseous inorganic bromine (Bry), and gaseous inorganic iodine (Iy; right).
Figure 1 shows the global budgets and cycling of tropospheric inorganic chlorine (Fig. 1a), bromine (Fig. 1b), and iodine (Fig. 1c) in our model simulation. Figure 2 shows the annual mean global distributions of Cl atoms, BrO, and IO. Figure 3 shows the global mean vertical distribution of the halogen speciation for reactive chlorine (Cl∗ ≡ Cly − HCl), Bry, and Iy. GEOS-Chem is driven here by 2016 GEOS-FP (forward processing) assimilated meteorological fields from the NASA Global Modeling and Assimilation Office (GMAO) with native horizontal resolution of 0.25∘ × 0.3125∘ and 72 vertical levels from the surface to the mesosphere. Our model simulation is conducted at 4∘ × 5∘ horizontal resolution, and meteorological fields are conservatively degraded to that resolution. The simulation is conducted for 2 years (2015–2016), with the first year as spin-up for initialization.
3.1 Chlorine
The dominant global source of Cly is acid displacement from SSA to HCl. The global rate of HCl generation from acid displacement is 46 Tg Cl a−1 and close to the observationally based estimate of 50 Tg Cl a−1 by Graedel and Keene (1995). HCl is the largest reservoir of tropospheric Cly, with a global mean tropospheric mixing ratio of 45 ppt (parts per trillion). Most HCl is removed by deposition, and only a small fraction (7.3 Tg Cl a−1) reacts with OH and contributes to reactive chlorine Cl∗. Cl∗ can also be generated from Cl− and dissolved HCl in clouds and aerosols by heterogeneous reactions with principal contributions from HOBr + Cl− (2.6 Tg Cl a−1), HOCl + Cl− (1.5 Tg Cl a−1), HOI/INOx + Cl− (0.8 Tg Cl a−1), and N2O5 + Cl− (0.68 Tg Cl a−1). This heterogeneous source of 6.3 Tg Cl a−1 is lower than our previous estimate of 12 Tg Cl a−1 in Wang et al. (2019) since the updated mechanisms for HOBr + Cl− (Sect. 2.3) and N2O5 + Cl− (Sect. 2.4 and Wang et al., 2020) reactions are slower. We calculate a tropospheric lifetime of 2.3 h for Cl∗. Loss of Cl∗ is mainly through the reaction of Cl with methane (44 %) and other organic compounds.
Distributions of Cl∗ in the troposphere are generally similar to Wang et al. (2019). As shown in Fig. 2, tropospheric Cl atom concentrations are highest at the surface, reflecting the source from SSA (Fig. S1 in the Supplement), and in the upper troposphere due to transport from the stratosphere as well as cold temperature slowing down the Cl + methane reaction. In surface air, simulated Cl atom concentrations are usually highest along polluted coastlines, where the large sources of HNO3, H2SO4, and N2O5 from anthropogenic emissions drive acid displacement and ClNO2 production. Figure 3 shows the global mean vertical distribution of Cl∗ species. Boundary layer Cl∗ is dominated on a zonal mean basis by ClNO2 formed from N2O5 + Cl− in polluted air. High mixing ratios of ClNO3 in the upper troposphere are related to transport from the stratosphere and its slow hydrolysis. The BrCl mixing ratio is much lower than in the previous GEOS-Chem studies of Sherwen et al. (2016b) and of Zhu et al. (2019) (who reported a tropospheric mean mixing ratio of 0.69 ppt) because of slower update kinetics of HOBr in aerosol and cloud water.
3.2 Bromine
The largest source of Bry is from SSA debromination in the marine boundary layer (MBL), mainly contributed by HOBr + Br− and O3 + Br− producing Br2 and HOBr, respectively. Bromocarbon photochemistry dominates the source of Bry in the free troposphere. Uptake of HBr by SSA is the major sink of Bry. The global tropospheric loading of BrO in the model is 2.1 Gg Br, corresponding to a mean tropospheric mixing ratio of 0.19 ppt (0.38 ppt in daytime). This value is much lower than the most recent GEOS-Chem estimate of 8.0 Gg by Zhu et al. (2019) because of the updated HOBr heterogeneous chemistry described in Sect. 2.3. The newly added pH dependences in Table 2 decrease the rate of Reaction (R5), resulting in much slower recycling of HOBr in cloud and aerosol water. HOBr is now more likely to react with S(IV) via Reactions (R3) and (R4) than previously, forming HBr, which then gets taken up by SSA. In Zhu et al. (2019), 82 % of HOBr heterogeneous reactions were with Br− and Cl−, and only 18 % were with S(IV). Due to the update in Sect. 2.3, 59 % of HOBr heterogeneous reactions are with Br− and Cl−, and 41 % are with S(IV). The higher fraction of Bry in the form of HBr decreases the tropospheric lifetime of Bry because HBr is more water-soluble than other Bry species. We calculate tropospheric lifetimes of 7.9 h for Bry and 6.8 min for BrOx (≡ Br + BrO).
Distributions of BrO in Fig. 2 are similar to Zhu et al. (2019) except for lower mixing ratios. High surface BrO mixing ratios are usually associated with high SSA (Fig. S1). BrO mixing ratios are low over the Southern Ocean despite high SSA emission because SSA alkalinity is not completely depleted, and hence reaction (R5) is ineffective. BrO decreases from the surface to the middle troposphere, reflecting the SSA source, and then increases in the upper troposphere because of efficient heterogeneous recycling of HBr in ice clouds (Table 3). Figure 3 shows the global mean vertical distribution of Bry species, which is very different from Sherwen et al. (2016b), where the Bry concentration increased with altitude. This is due to the inclusion of SSA debromination in our simulation. Our Bry mixing ratio in the MBL is still only slightly higher than that in Sherwen et al. (2016b) because of the much lower Bry lifetime, resulting from the slower HOBr heterogeneous reactions, as mentioned above.
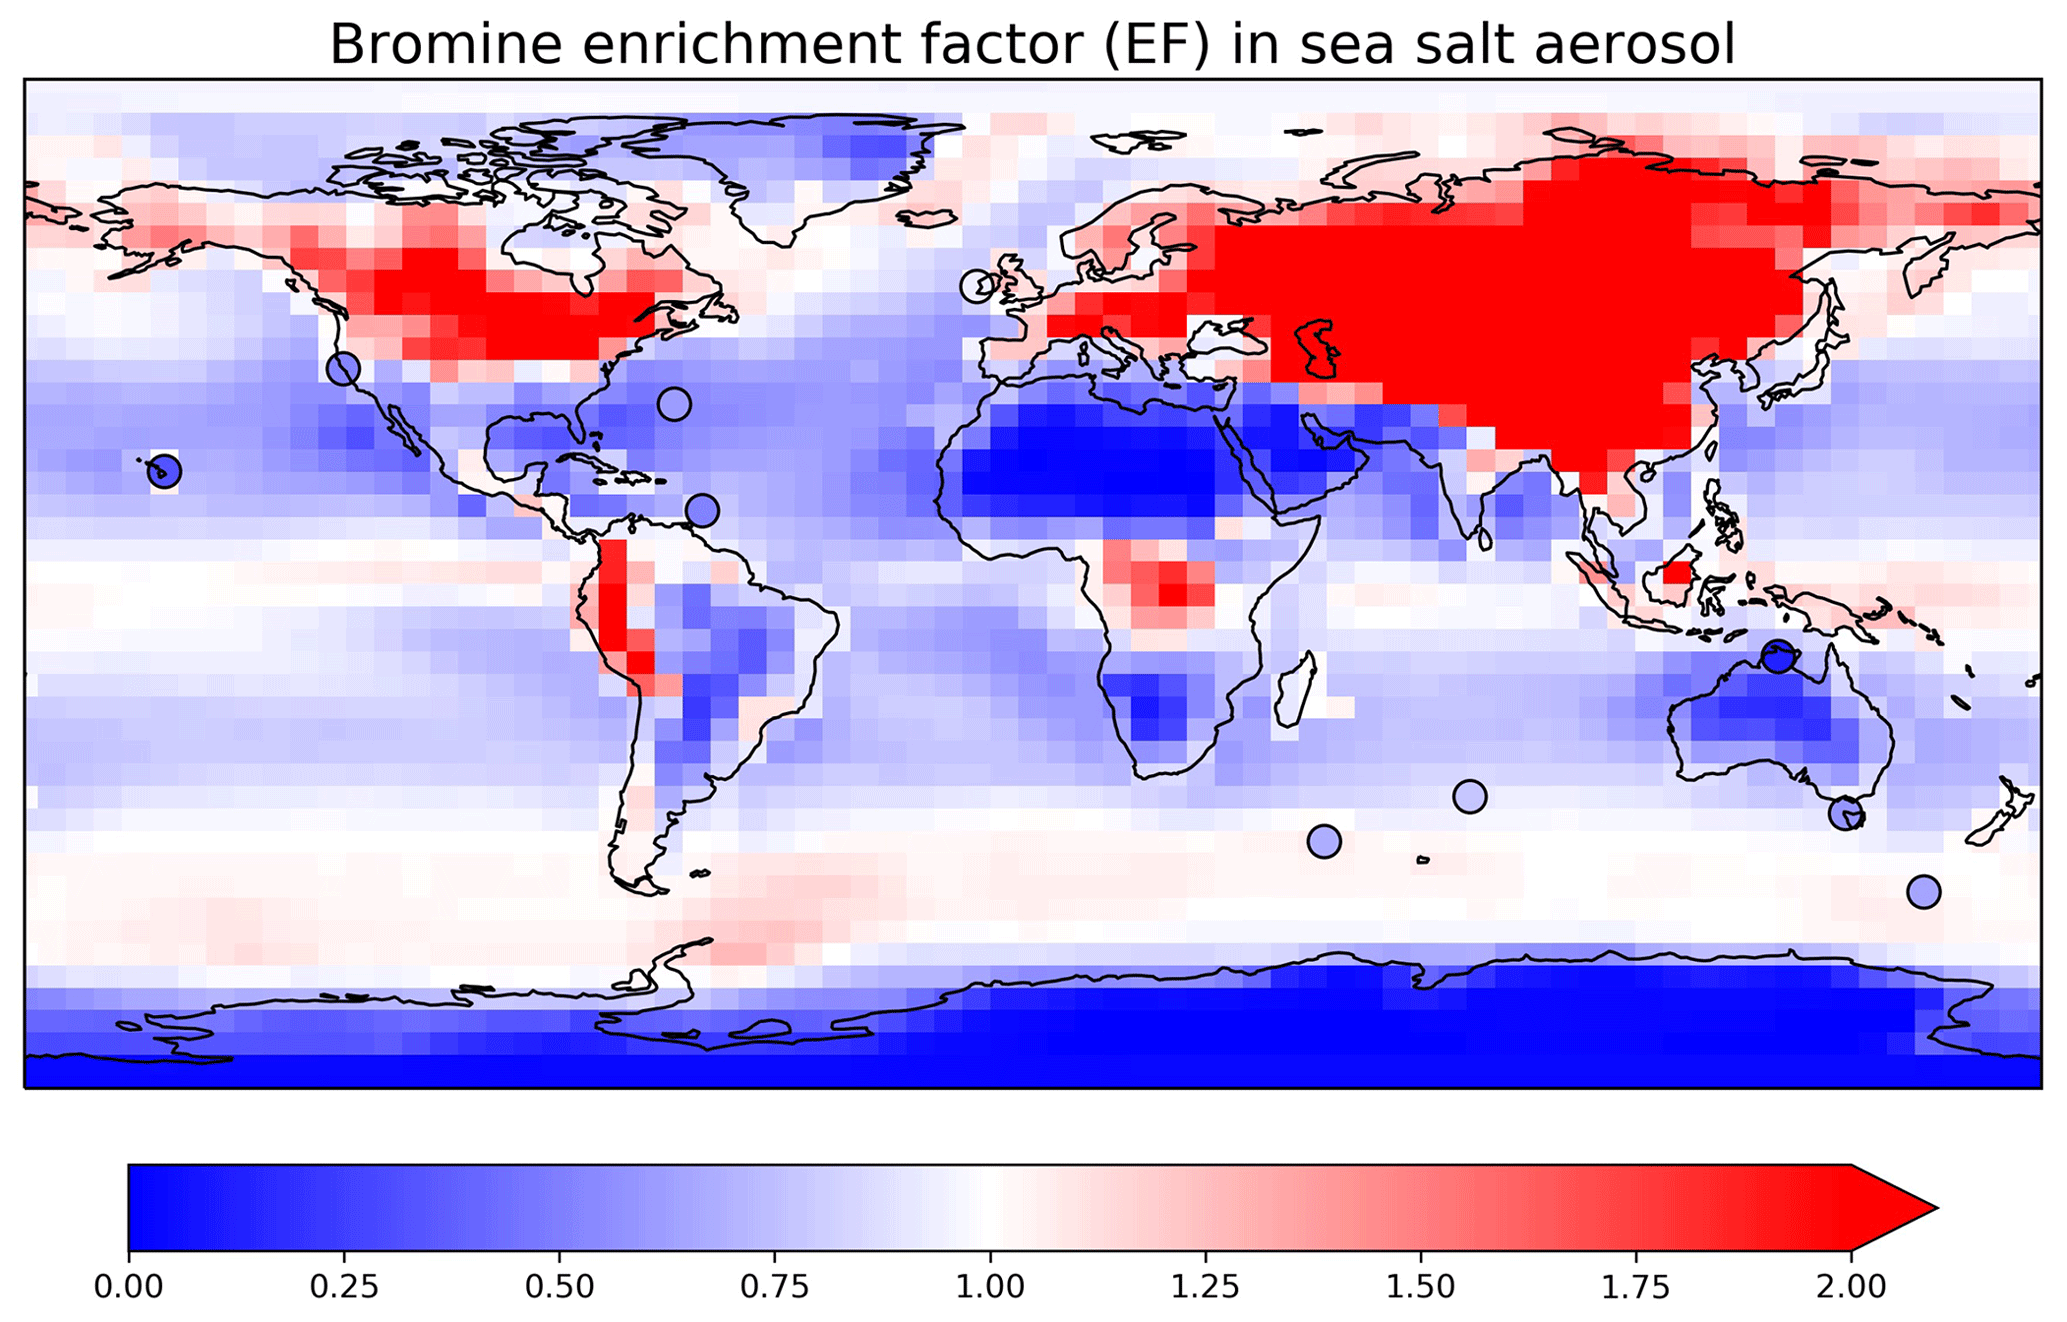
Figure 4Annual mean bromine enrichment factor (EF) of sea salt aerosol (SSA) in surface air. GEOS-Chem model results for total SSA (contours) are compared to observations (circles). We sum [Br−] and [SSA] from both fine and coarse SSA and use Eq. (6) to calculate the EF.
3.3 Iodine
The Iy source totals 2.7 Tg I a−1, with most (2.1 Tg I a−1) originating from ocean volatilization of HOI and I2 (Carpenter et al., 2013; MacDonald et al., 2014). The sink of Iy is from deposition (1.8 Tg I a−1) and uptake by aerosols (0.91 Tg I a−1). The global tropospheric loading of IO in the model is 1.4 Gg I, corresponding to a mean tropospheric mixing ratio of 0.08 ppt. As shown in Figs. 2 and 3, concentrations of all Iy species are highest in the MBL, consistent with the dominant emission from the ocean. Surface IO mixing ratios are highest over tropical oceans, where both organic and inorganic iodine emissions are high due to the high temperature. Concentrations of IO and most Iy species are the lowest in the middle troposphere, where Iy speciation is mostly as HOI, which can be removed via wet deposition efficiently. We calculate tropospheric lifetimes of 1.6 d for Iy and 1.7 min for I + IO* (≡ IO + OIO + 2I2O2 + 2I2O3 + 2I2O4). Our results are consistent with Sherwen et al. (2016b) since the iodine chemistry is largely unchanged. Our only significant update has been to conserve mass in iodine heterogeneous reactions (Text S2 in the Supplement), but this has little impact.
Here we compare the model simulation for 2016 to observations for gas-phase halogen species collected from surface and aircraft campaigns. The observations are in different years, but we assume that interannual variability is small compared to other sources of error. More extensive evaluations of previous model versions with observations for organohalogens, HCl–Cl− acid displacement, and iodine species can be found in Sherwen et al. (2016b), Wang et al. (2019), and Sherwen et al. (2016a), respectively, and our model results are not significantly different for purpose of these comparisons.
4.1 Bromine enrichment factors (EFs)
The bromine enrichment factor (EF) is a measure of SSA debromination, which can be calculated in the model as
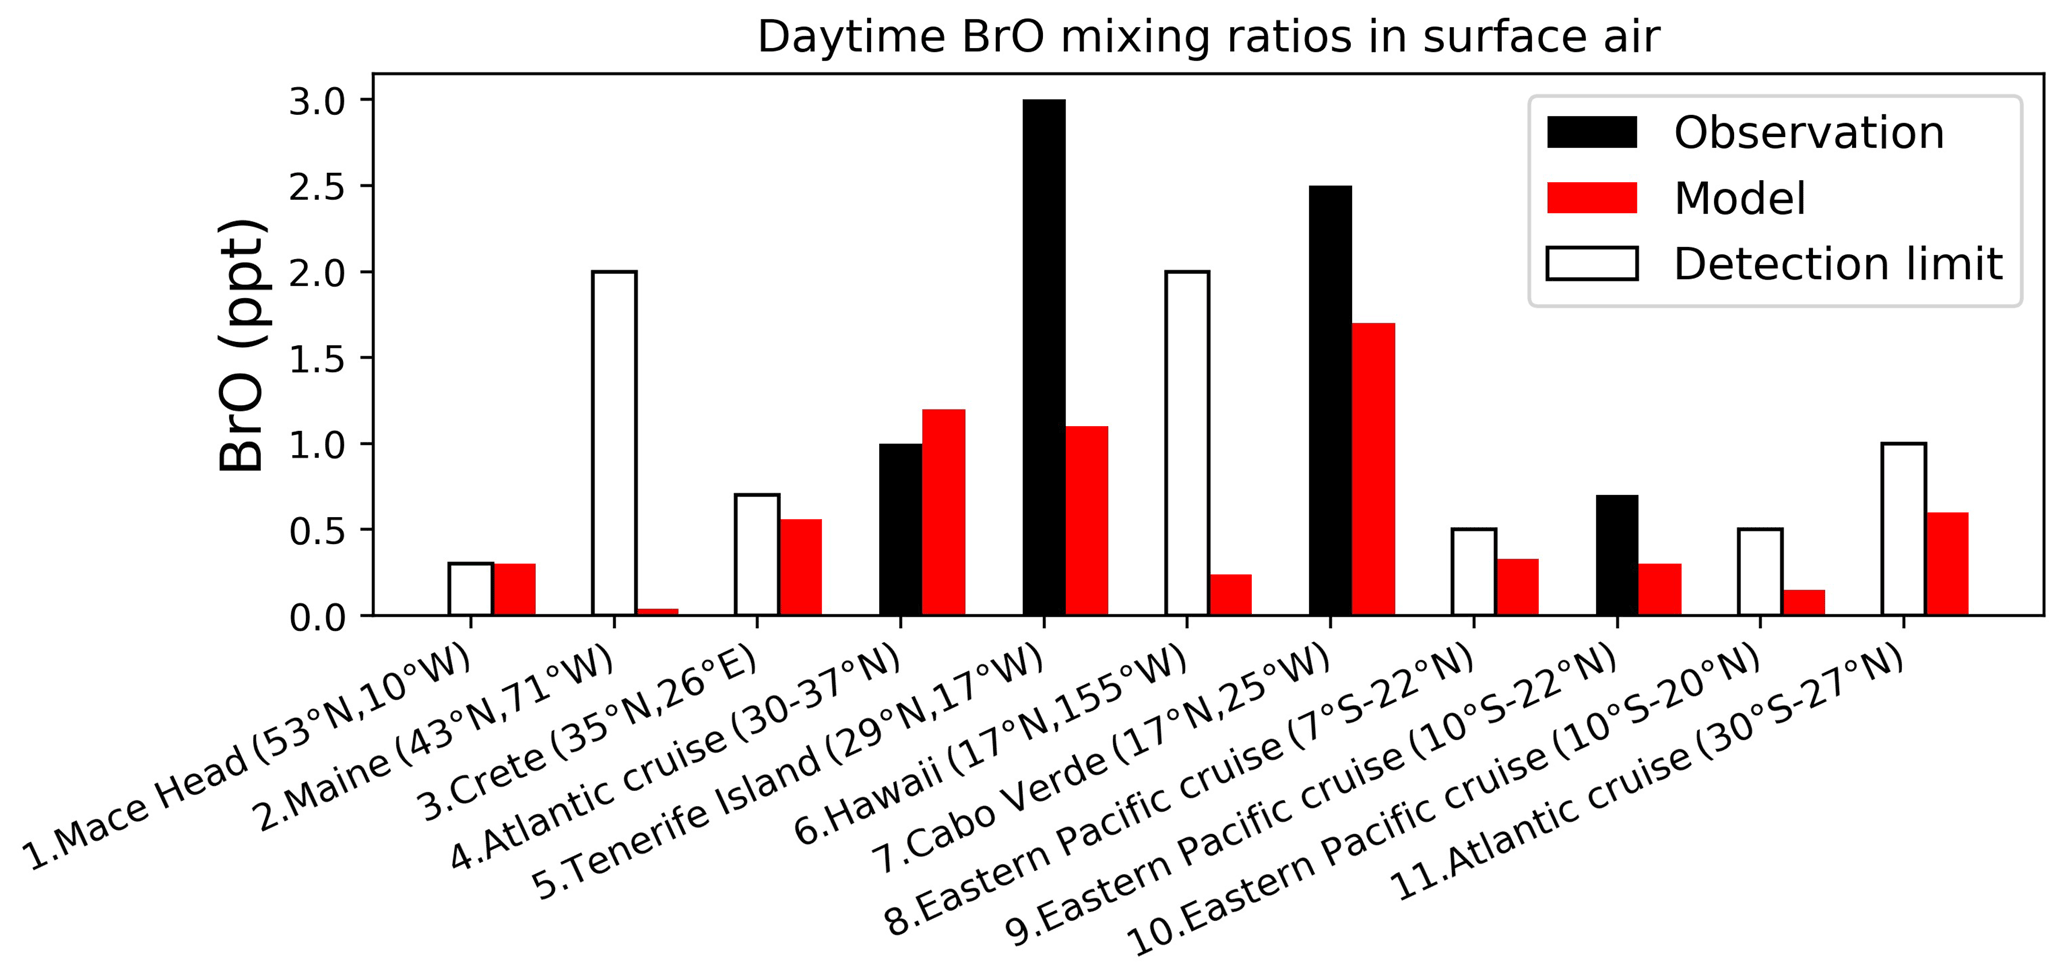
Figure 5Daytime surface air mixing ratios of BrO from island sites and ocean cruises, arranged from left to right in order of decreasing latitude. Observed values (black) are means for the reporting period in different years. Open bars show the measurement detection limit and indicate that the observation is below detection limit. Model values (red) are monthly mean values in 2016 taken for the same month and location as the observations. References: (1) Saiz-Lopez et al. (2004, 2006), (2) Keene et al. (2007), (3, 5, 6) Sander et al. (2003), (4, 11) Leser et al. (2003), Martin et al. (2009), (7) Read et al. (2008), Mahajan et al. (2010), (8, 9) Volkamer et al. (2010), (10) Volkamer et al. (2015).
Figure 4 shows the annual mean EFs in surface air in GEOS-Chem. The high values (EF > 1) indicate a more important role of HBr uptake than SSA debromination. EF is especially high over continental regions because Bry volatilized from SSA is then transported inland and taken up by continental aerosols. Measured annual mean observations at 10 surface sites from Sander et al. (2003) and from Newberg et al. (2005) are also shown in Fig. 4. The mean GEOS-Chem EF averaged over these sites is 0.88, higher than in Zhu et al. (2019) (0.75). This is due to the updated reactive uptake of HOBr in Sect. 2.2, which results in less efficient mobilization of bromine radicals from SSA. The mean observed EF is 0.57. The model bias is mainly due to the underestimates over the Southern Ocean. Zhu et al. (2019) suggested that this may be due to excessive model uptake of HBr by SSA in summer. Free-tropospheric transport of bromine released from SSA (Wang et al., 2015) is estimated conservatively in GEOS-Chem as the updated HOBr reactive uptake may potentially lead to overestimation of bromine washout during deep convection.
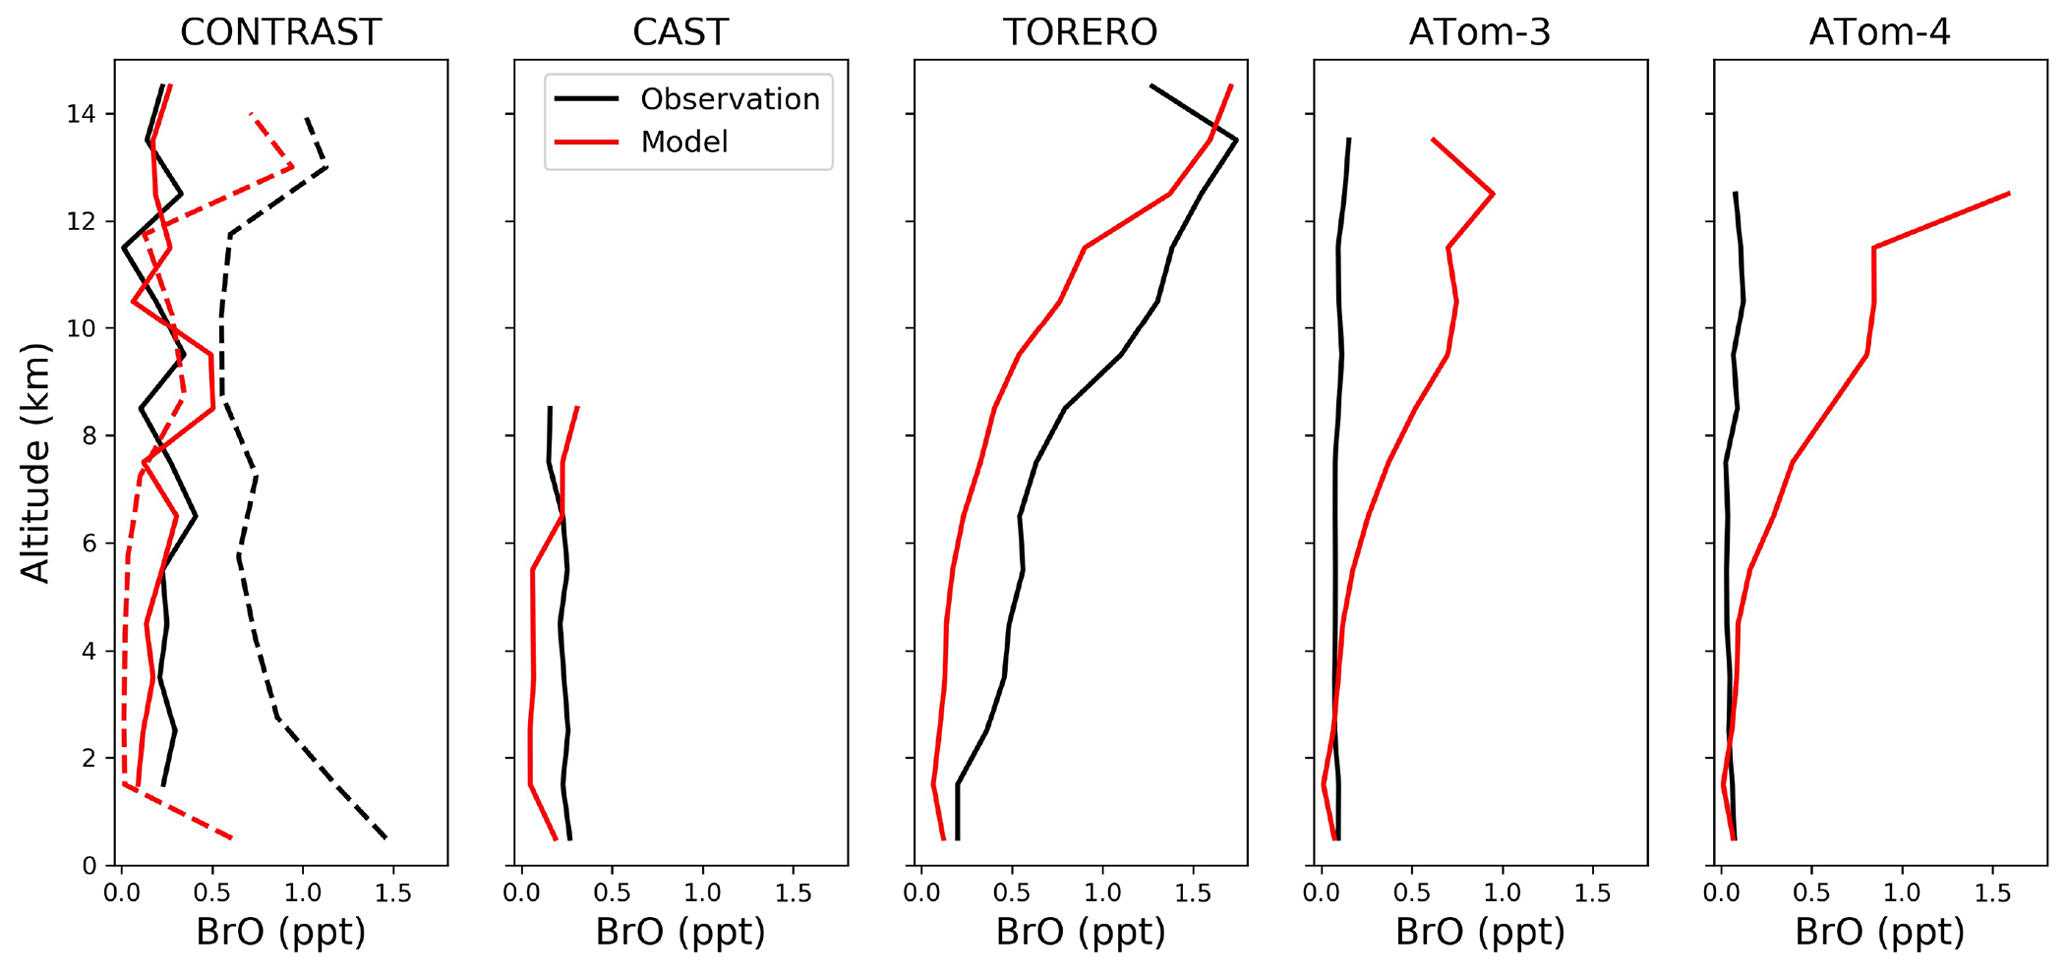
Figure 6Median vertical profiles of BrO mixing ratios from the CONTRAST (January–February 2014 over the western tropical Pacific), CAST (January–February 2014 over the western tropical Pacific), TORERO (January–February 2012 over the eastern tropical Pacific), ATom-3 (September–October 2017 over the Pacific and Atlantic), and ATom-4 (April–May 2018 over the Pacific and Atlantic) campaigns. Observations are shown as medians in 1 km vertical bins. Model values are shown as medians sampled along the flight tracks. There are two independent CONTRAST BrO data sets. The solid black line shows the chemical ionization mass spectrometer (CIMS) data from Chen et al. (2016). The dashed black line shows the differential optical absorption spectroscopy (DOAS) data from Koenig et al. (2017). The solid and dashed red lines show model values sampled along the flight tracks at the time of the available CIMS and DOAS observations, respectively.
Table 4Summary of aircraft measurements.
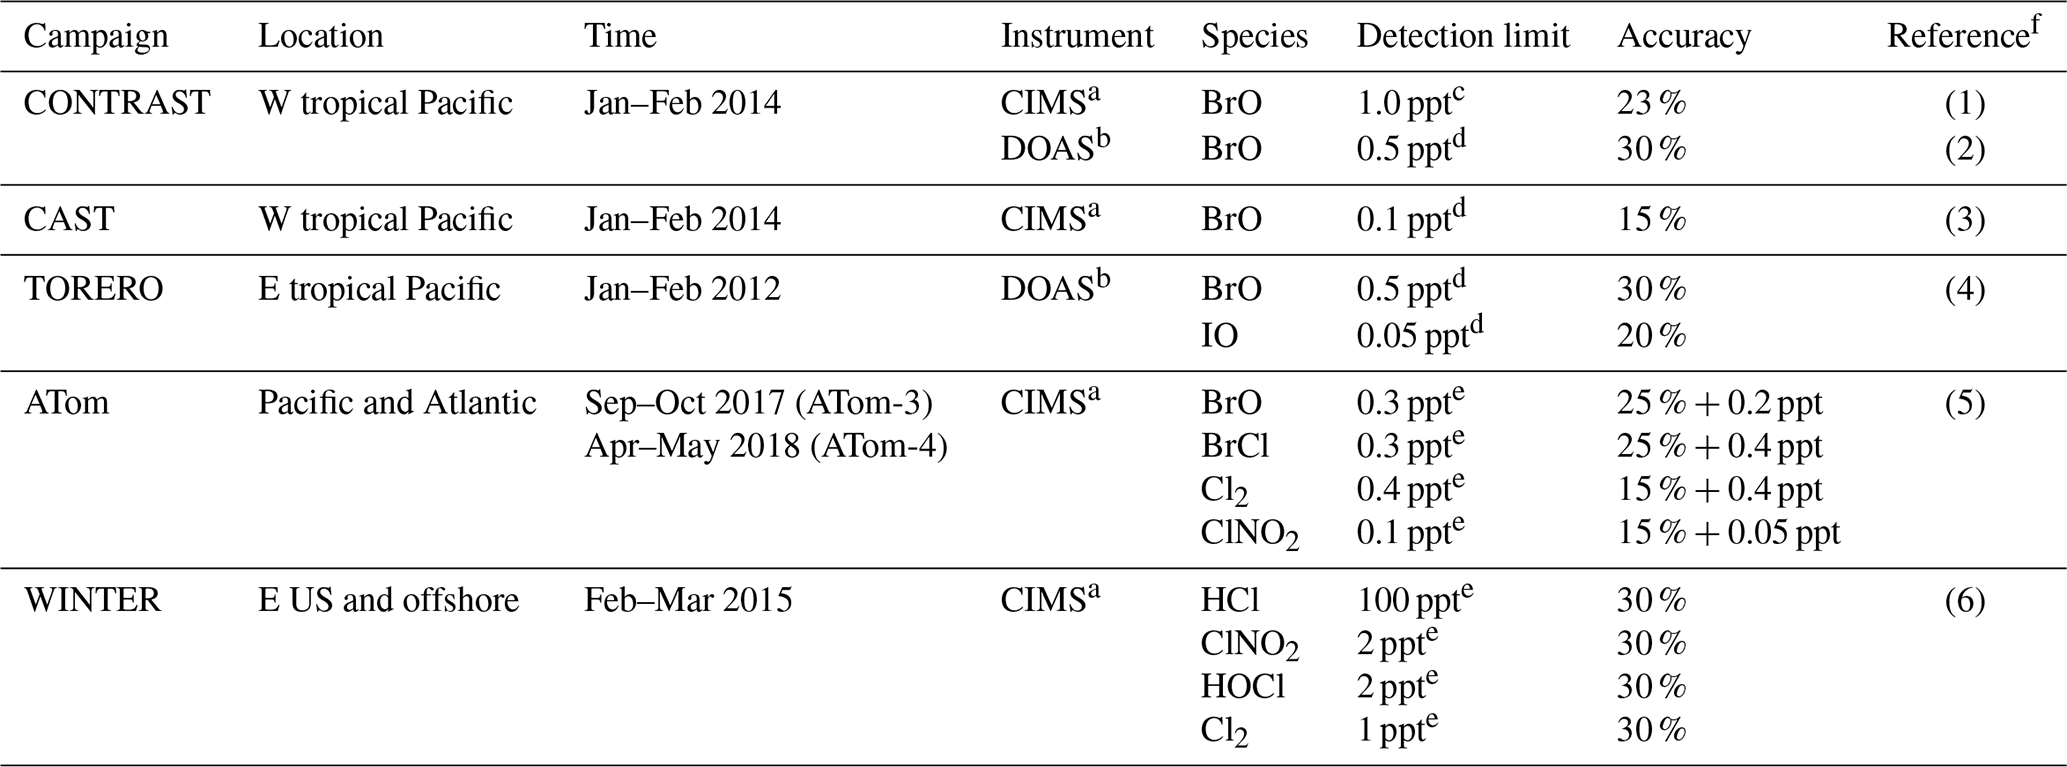
a CIMS: chemical ionization mass spectrometer; b DOAS: differential optical absorption spectroscopy; c for 60 s data; d for 30 s data; e for 1 s data. f References: (1) Chen et al. (2016), (2) Koenig et al. (2017), (3) Le Breton et al. (2017), (4) Dix et al. (2016), (5) Veres et al. (2019), (6) Lee et al. (2018).
4.2 Bromine monoxide (BrO)
Figure 5 compares surface measurements of BrO concentrations in marine air during daytime with corresponding model values. The model is generally consistent with these observations in showing surface air BrO mixing ratios in the range of 0–3 ppt. BrO over the tropical North Atlantic is higher (1–3 ppt) than other oceans (< 1 ppt and below measurement detection limits) in both the model and observations. In the model this is due to high SSA emissions and efficient acidification of SSA from continental outflow of HNO3 and SO2, resulting in rapid debromination. Figure 6 compares modeled vertical profiles with aircraft BrO observations over the tropics from the CONTRAST (Chen et al., 2016; Koenig et al., 2017), CAST (Le Breton et al., 2017), TORERO (Volkamer et al., 2015), and ATom (Wofsy and ATom Science Team, 2018; Veres et al., 2019) aircraft campaigns. Details of the instruments and uncertainty in these observations are listed in Table 4. The median profiles of BrO measured by CIMS during CONTRAST, CAST, and ATom are all around or below their detection limits. In contrast, observations during CONTRAST and TORERO measured by DOAS show higher BrO mixing ratios (> 1 ppt). There are two independent BrO measurements during CONTRAST. The DOAS measurement by Koenig et al. (2017) consists of portions of five flights during CONTRAST and shows higher values than the CIMS measurement by Chen et al. (2016). The model provides a reasonable fit to CONTRAST CIMS BrO, with a mean bias of 0.03 ppt, but is low compared to the DOAS observations. Observed BrO mixing ratios are low almost everywhere during the ATom campaign and show no obvious vertical variation from MBL to the free troposphere. Modeled BrO is generally consistent with ATom observations in the lower troposphere but is much higher in the upper troposphere, where transport from the stratosphere becomes important in the model. On the other hand, the model is lower than the TORERO observations in the upper troposphere. The higher BrO mixing ratios in the lowermost stratosphere in the model during ATom and in both model and observations during TORERO are consistent with balloon-borne measurements at 45∘ N by Stachnik et al. (2013), showing 5 ppt BrO at 15 km altitude, but the lower BrO mixing ratios in the observations during ATom and in both model and observations during CONTRAST CIMS are consistent with aircraft measurements over the eastern Pacific by Werner et al. (2017), showing < 1 ppt at 12–15 km altitudes.
To summarize, there is much ambiguity in the comparisons of model results to observed BrO concentrations, as might be expected since most observations are near their detection limits and with large uncertainties (Table 4). There is no evidence of systematic model bias, but more sensitive observations would be needed to be conclusive.
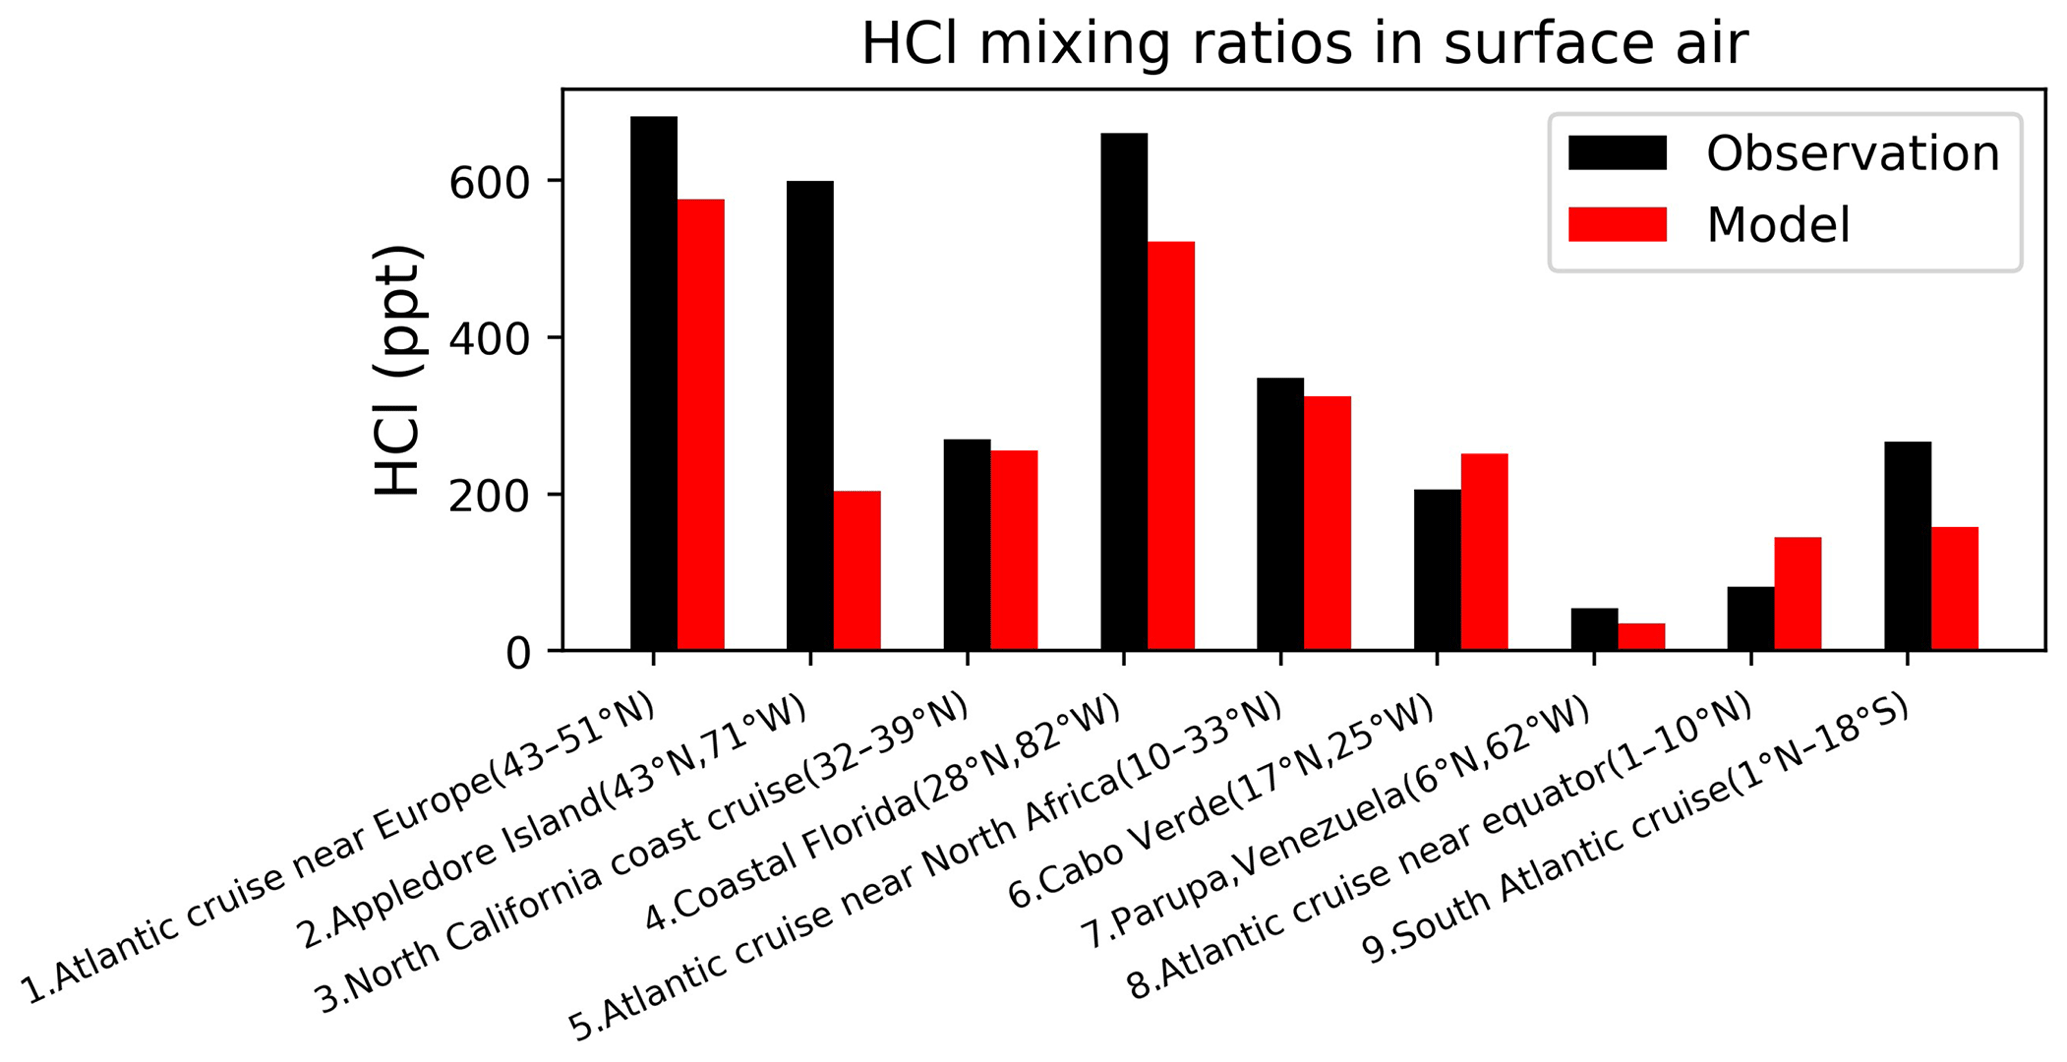
Figure 7Surface air mixing ratios of HCl at coastal and island sites and from ocean cruises, arranged from left to right in order of decreasing latitude. Observations (black) are means or medians depending on availability from the publications. Model values (red) are monthly mean values in 2016 taken for the same month and location as the observations. References: (1, 5, 8, 9) Keene et al. (2009), (2) Keene et al. (2007), (3) Crisp et al. (2014), (4) Dasgupta et al. (2007), (6) Sander et al. (2013), (7) Sanhueza and Garaboto (2002).
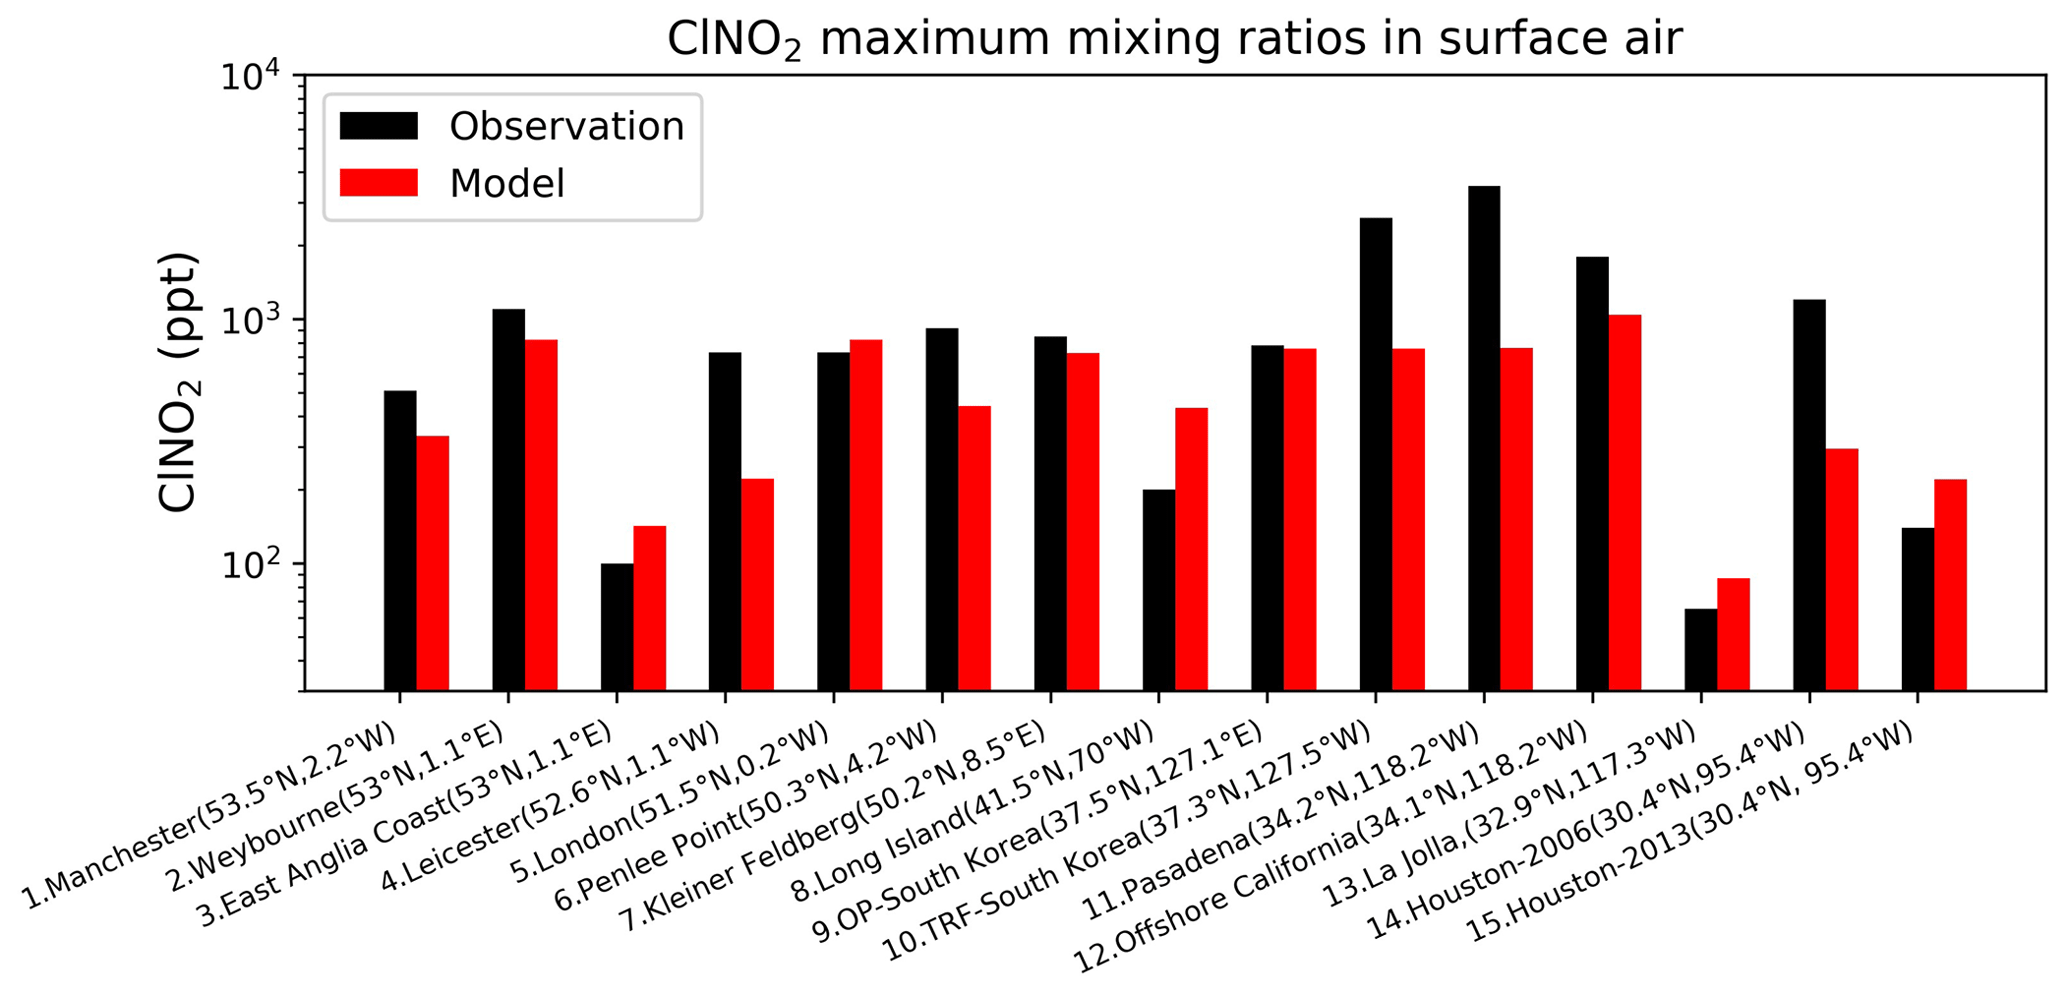
Figure 8Surface air mixing ratios of ClNO2 at coastal and island sites, arranged from left to right in order of decreasing latitude. Observed (black) and modeled (red) values are maxima for the reporting period. Model maxima are based on hourly values sampled at the same location and time period as the observations. References: (1) Priestley et al. (2018), (2, 4, 6) Sommariva et al. (2018), (3, 5) Bannan et al. (2017), (7) Phillips et al. (2012), (8) Kercher et al. (2009), (9, 10) Jeong et al. (2018), (11) Mielke et al. (2013), (12) Riedel et al. (2013), (13) Kim et al. (2014), (14) Osthoff et al. (2008), (15) Faxon et al. (2015).
4.3 Inorganic chlorine gases (Cly)
Our model does not include anthropogenic inorganic chlorine sources, which could however be important in polluted continental boundary layer regions as seen in atmospheric observations (Wang et al., 2016; Tham et al., 2016; Lee et al., 2018; Zhou et al.,2018; Yun et al., 2018; Peng et al., 2020; Thornton et al., 2010; Wang et al., 2020; Gunthe et al., 2021). Here we focus on a more global perspective. Figure 7 compares modeled surface HCl mixing ratios to observations at coastal sites and over oceans. The model captures the spatial variability in the HCl mixing ratios across locations, which largely reflects the strong acid displacement at northern midlatitudes. As previously shown by Wang et al. (2019), acid displacement is key to reproducing the observations. Figure 8 compares surface modeled maximum ClNO2 to observations in island and coastal environments. Observations of ClNO2 are usually reported as maxima instead of means and are made in nighttime urban environments, which are difficult to compare to our global model because of the coarse grid resolution and nighttime stratification of the surface layer. Despite these drawbacks, the model still offers a credible simulation of the 24 h maximum ClNO2.

Figure 9Vertical profiles of HCl, HOCl, Cl2 and nighttime ClNO2 mixing ratios during the WINTER campaign over the eastern US and offshore in February–March 2015. Observations are shown as individual 1 min data points, with medians and 25th–75th percentiles in 500 m vertical bins. ClNO2 data exclude during the daytime (10:00–16:00 LT), when mixing ratios are near zero in both the observations and the model. Model values are shown as medians sampled along the flight tracks.
The WINTER aircraft campaign provided data for multiple Cly gases including HCl, ClNO2, HOCl, and Cl2. The measurements were made over the eastern US and offshore during February–March 2015 by CIMS (Lee et al., 2018), as summarized in Table 4. Figure 9 compares the observed median vertical profiles of HCl, ClNO2, HOCl, and Cl2 during WINTER to the model sampled along the flight tracks for the corresponding period. Modeled HCl is lower than the observations but mostly within the calibration uncertainty (± 30 %). Modeled HOCl largely underestimates WINTER observations. Wang et al. (2019) found that such underestimation is over both land and ocean and mainly in daytime, when HOCl has a very short lifetime against photolysis (a few minutes). This may suggest a large photochemical source needed to decrease the model bias. Recent work also identified the potential of IOx ion chemistry to lead to measurement interferences (Dörich et al., 2021) and of the detection of acid gases, which could impact the measured HOCl:HCl ratio. Furthermore, rapid interconversion of halogen species on inlet walls has been reported that could also impact the measured HOCl:HCl ratio (Neuman et al., 2010).
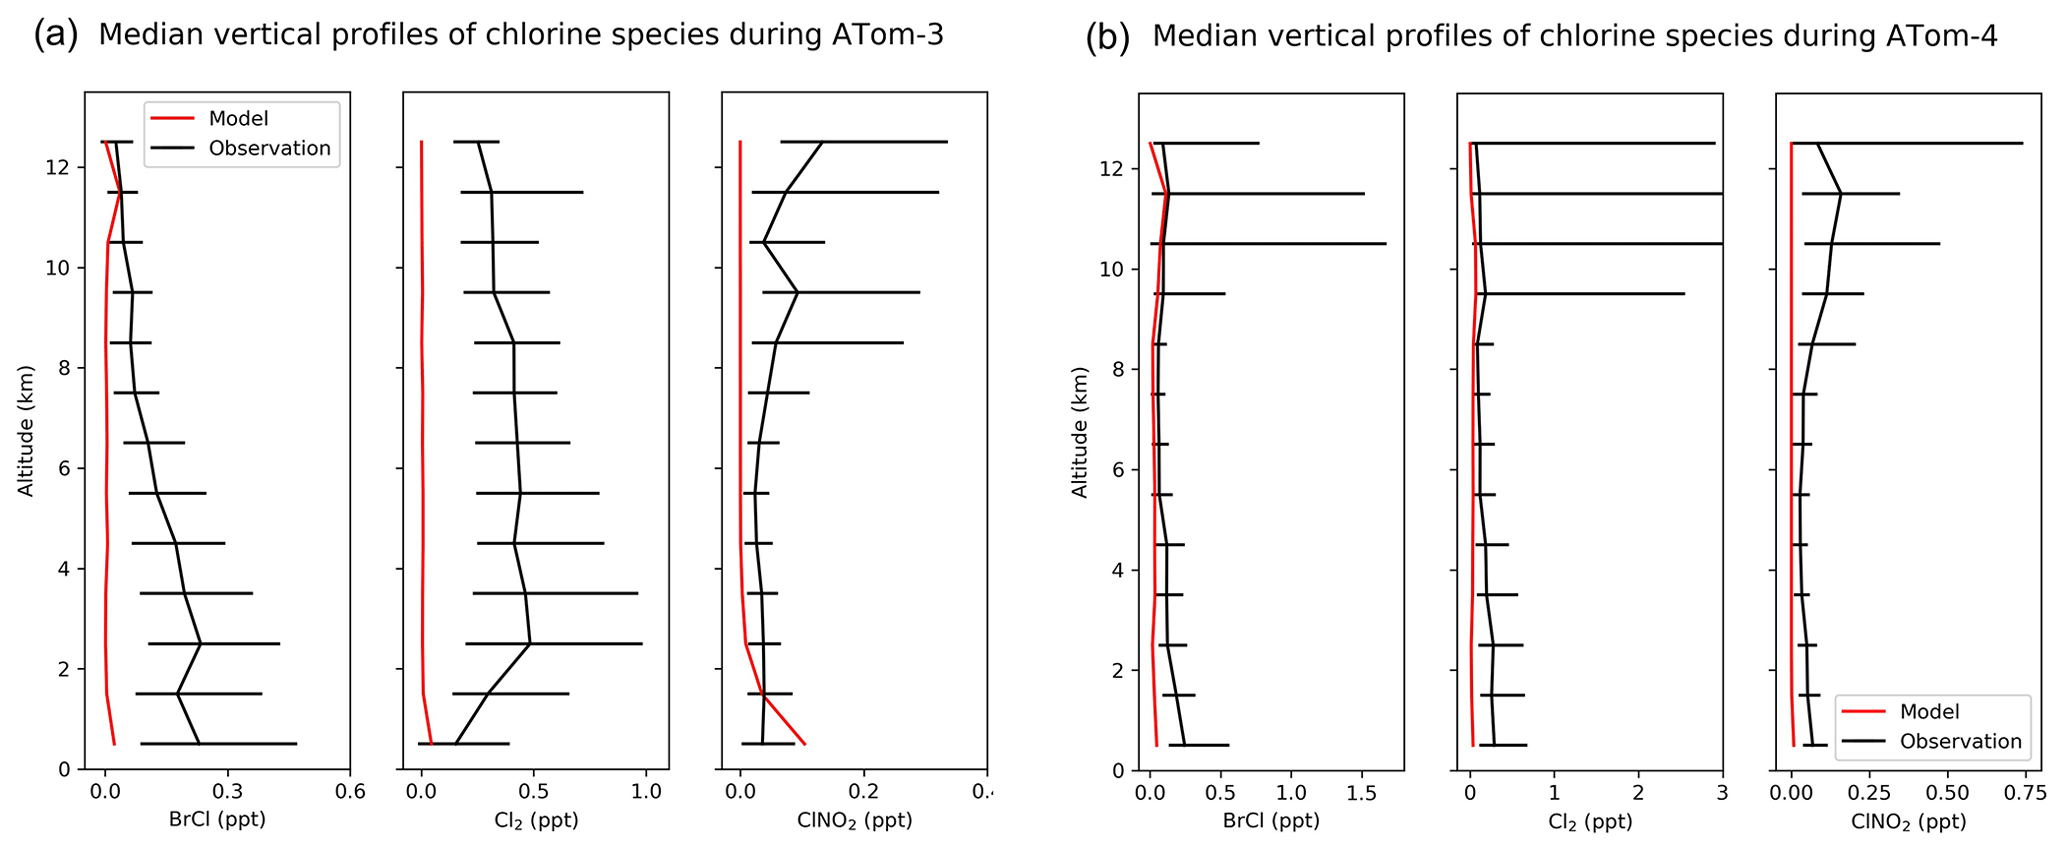
Figure 10(a) Vertical profiles of BrCl, Cl2, and ClNO2 mixing ratios from the ATom-3 campaign over the Pacific and Atlantic in September–October 2017. Observations are medians and 25th–75th percentiles in 1 km vertical bins. Model values are medians sampled along the flight tracks. (b) Same as Fig. 10a but for the Atom-4 campaign in April–May 2018.
Figure 10 compares modeled vertical BrCl, Cl2, and ClNO2 mixing ratios to observations during the ATom aircraft campaigns. Both modeled and observed chlorine gases are low in most regions (< 1 ppt). Most ATom measurements were made in daytime, when modeled BrCl, Cl2, and ClNO2 are close to zero due to their very short lifetimes against photolysis. Modeled BrCl and Cl2 underestimate observed values, especially in the lower troposphere. The observed median mixing ratios of all these species at all altitudes are either below or around the measurement detection limits (Table 4). The underestimates of HOCl during WINTER and of BrCl and Cl2 during ATom during the daytime may suggest a large photochemical source that can produce chlorine radicals from Cl−.
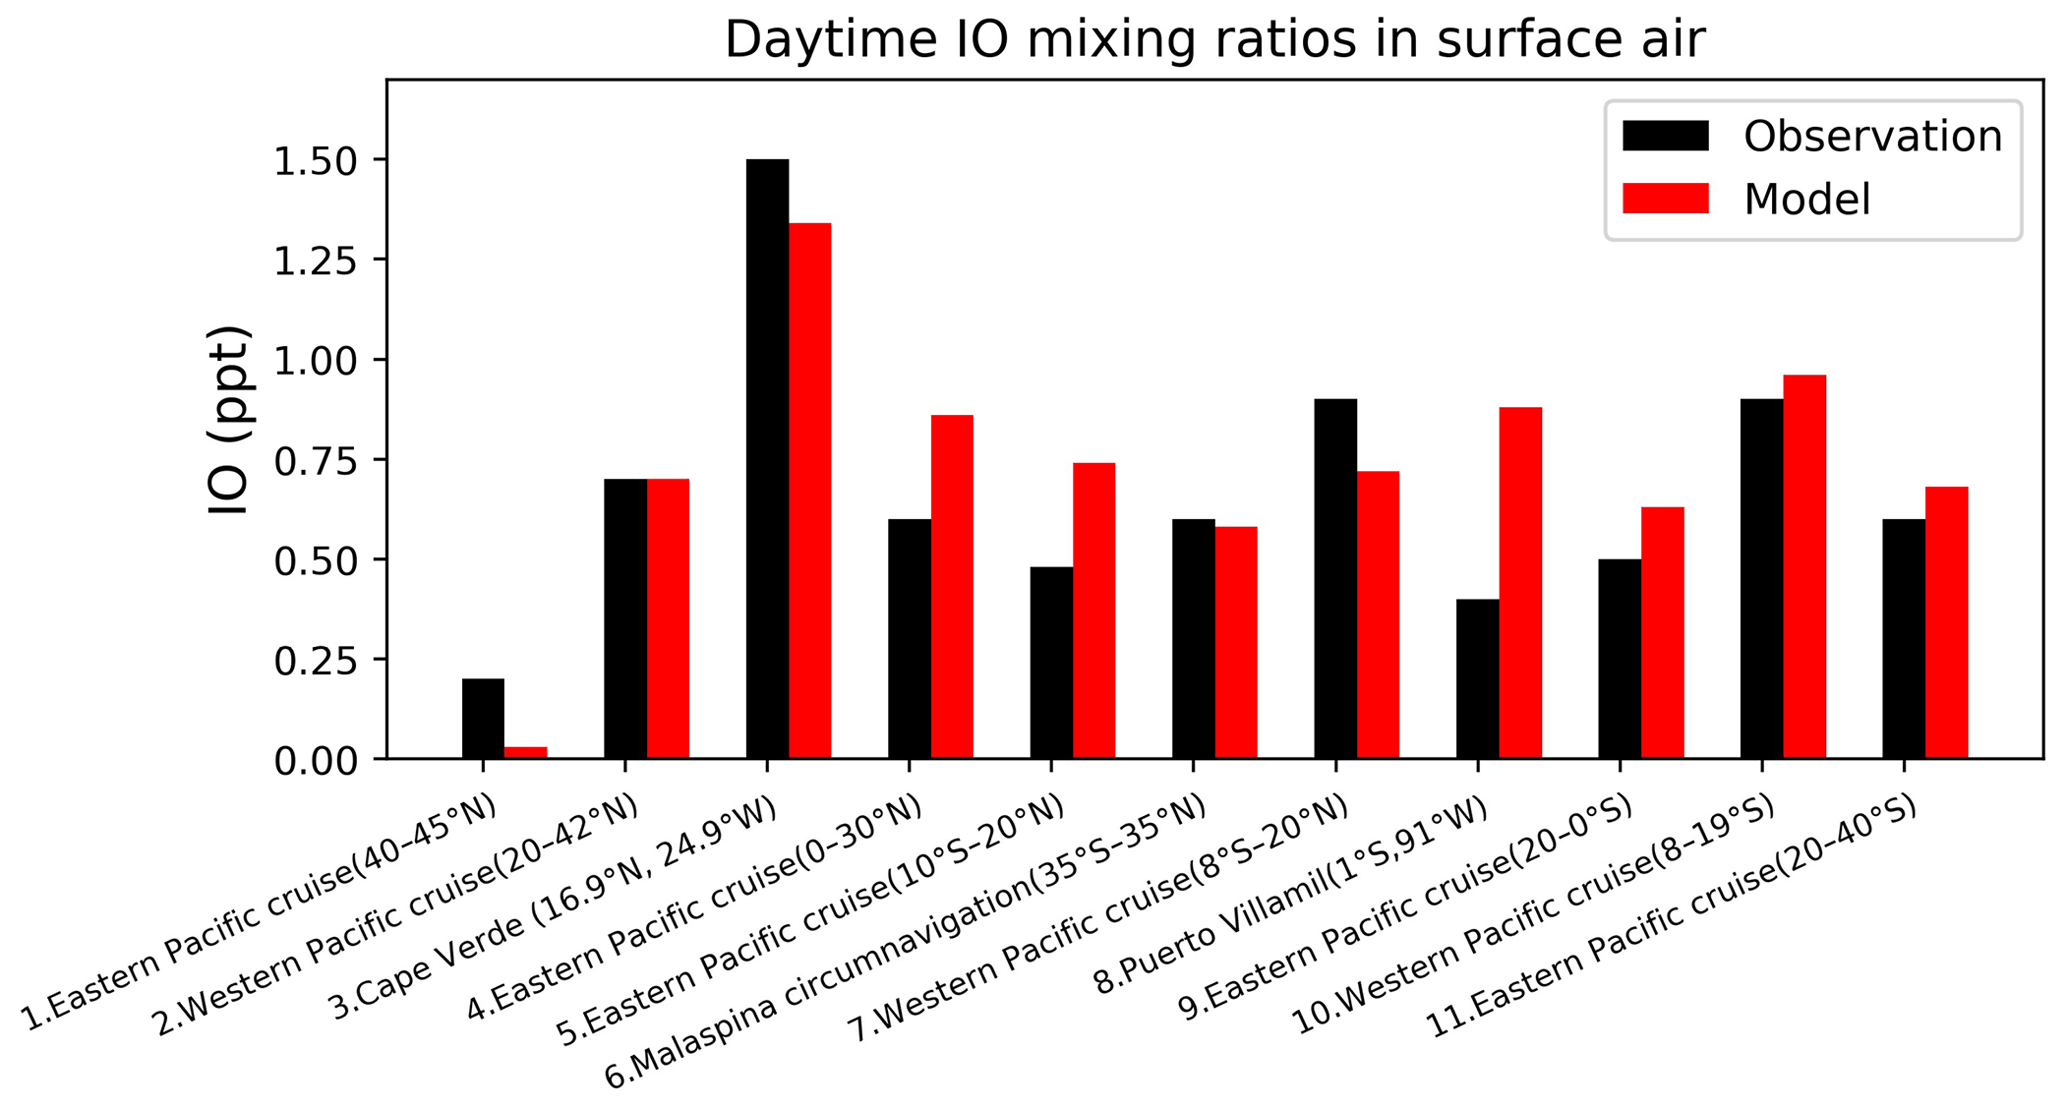
Figure 11Daytime surface air mixing ratios of IO from island sites and ocean cruises, arranged from left to right in order of decreasing latitude. Observed values (black) are means for the reporting period in different years. Model values (red) are monthly mean values in 2016 taken for the same month and location as the observations. References: (1, 4, 9, 12) Mahajan et al. (2012), (2, 7, 10) Großmann et al. (2013), (3) Mahajan et al. (2010), (5) Volkamer et al. (2015), (6) Prados-Roman et al. (2015), (8) Gómez Martín et al. (2013).
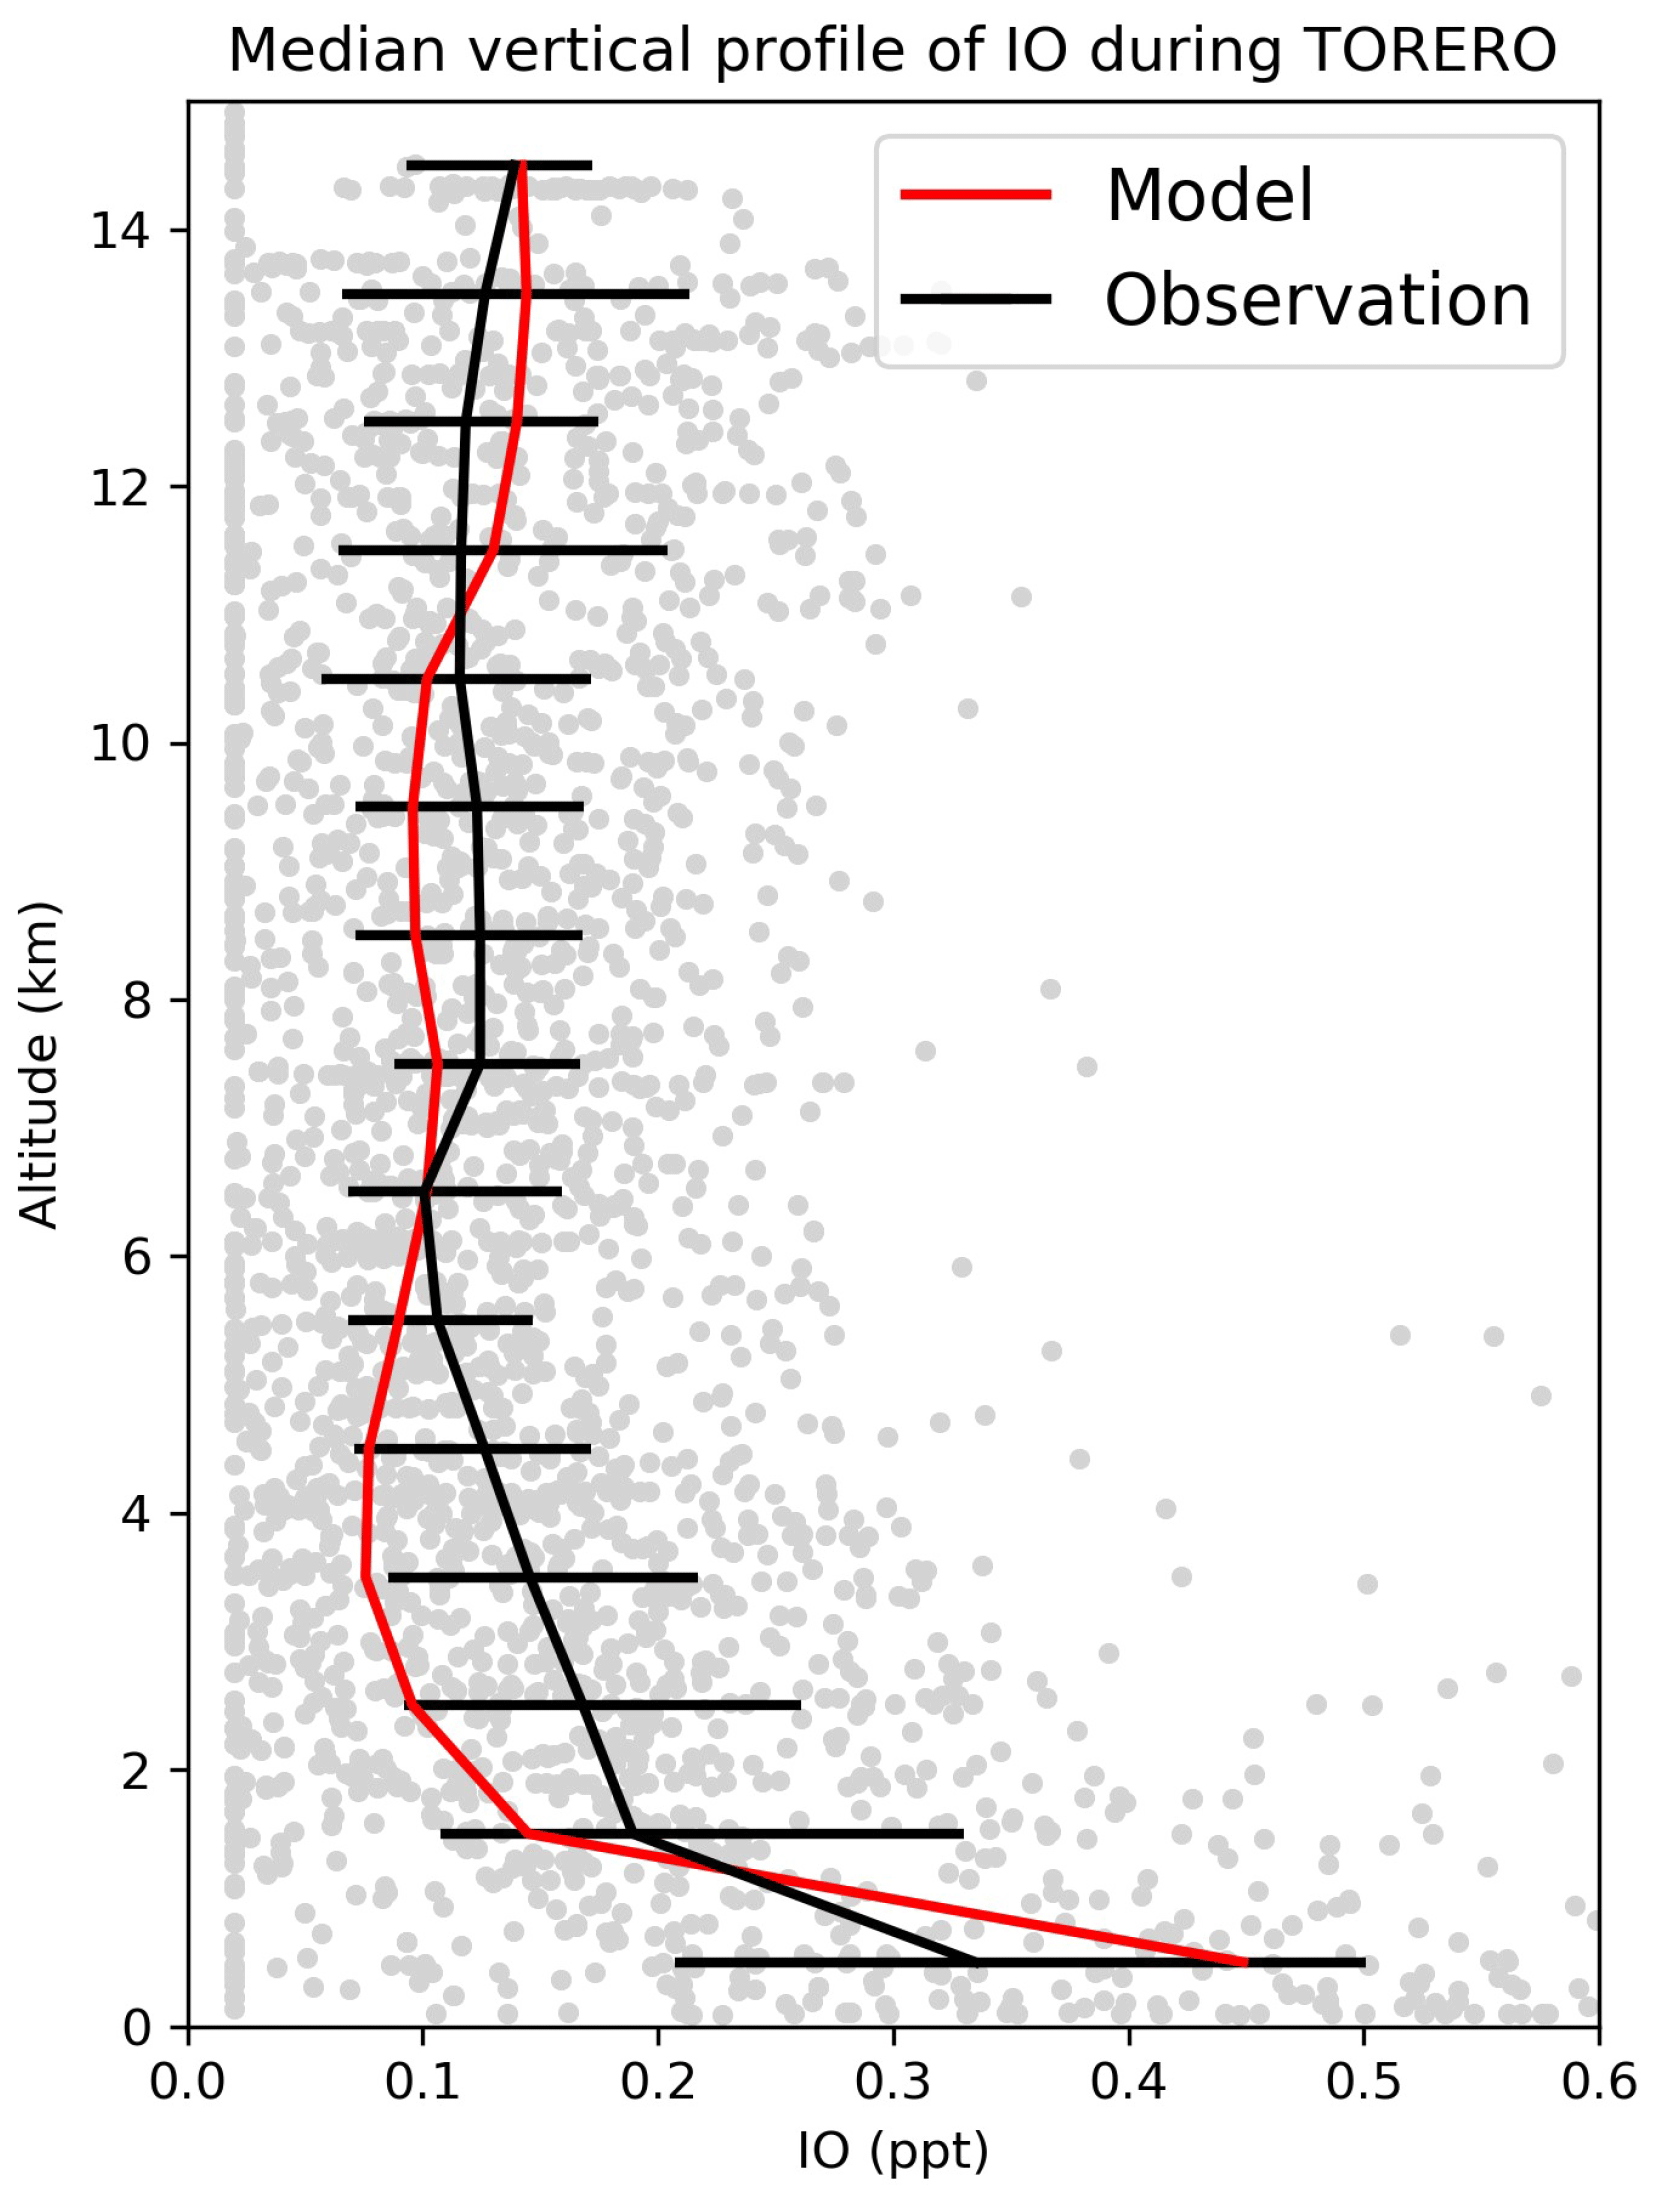
Figure 12Median vertical profile of IO mixing ratios from the TORERO (January–February 2012 over the eastern tropical Pacific) campaign. Observations are shown as individual 1 min data points, with medians and 25th–75th percentiles in 1 km vertical bins. Model values are shown as medians sampled along the flight tracks.
4.4 Iodine monoxide (IO)
Figure 11 compares surface measurements of IO over islands and oceans during daytime with corresponding model values. The model is generally consistent with these measurements, with an overall bias of −10 %. Both modeled and observed IO mixing ratios are highest over tropical oceans and lowest at high latitudes, reflecting the distribution of both organic and inorganic iodine emissions. Figure 12 compares modeled vertical profiles with aircraft IO observations over the eastern Pacific from TORERO (Volkamer et al., 2015). The model is in general agreement with the observations and able to reproduce the observed vertical variation with a mean bias of −0.09 ppt. Both observed and modeled IO mixing ratios are high in the MBL, reflecting the marine sources of iodine, and vary little in the free troposphere. Recently, Koenig et al. (2020) reported IO and Iy mixing ratios of 0.08 and 0.53 ppt at 12 km during the CONTRAST campaign over the western tropical Pacific. Our modeled values are 0.07 and 0.43 ppt for IO and Iy, respectively, at that location.
We now examine the implications of tropospheric halogen chemistry as described by our mechanism for the concentrations of tropospheric VOCs, ozone, NOx, and OH. Shah et al. (2021) examined the implications for mercury chemistry.
5.1 Volatile organic compounds (VOCs)
Cl atoms are strong VOC oxidants, but their importance is limited by their small supply. The global mean tropospheric Cl atom concentration in our model is 630 cm−3, consistent with the upper limit of 1000 cm−3 inferred by Singh et al. (1996) from global modeling of C2Cl4 observations. Within the MBL, the global mean concentration is 840 cm−3, similar to a recent estimate using isotopic observations of methane and CO by Gromov et al. (2018) (900 cm−3). Oxidation by Cl atoms in the troposphere drives a loss rate of 3.6 Tg a−1 for methane in our model, contributing 0.8 % of the total methane chemical loss. It additionally contributes 14 % of the global chemical loss for ethane, 8 % for propane, and 7 % for higher alkanes. These impacts could be higher if anthropogenic chlorine sources were considered. Oxidation of VOCs by Br atoms in GEOS-Chem is significant only for acetaldehyde, where it accounts for 2.0 % of the global loss and up to 18 % of the loss in the MBL of high-SSA regions (tropical oceans, North Atlantic). Badia et al. (2019) previously estimated a 9 % contribution of Br atoms to acetaldehyde oxidation in the tropospheric column over the eastern tropical Pacific.
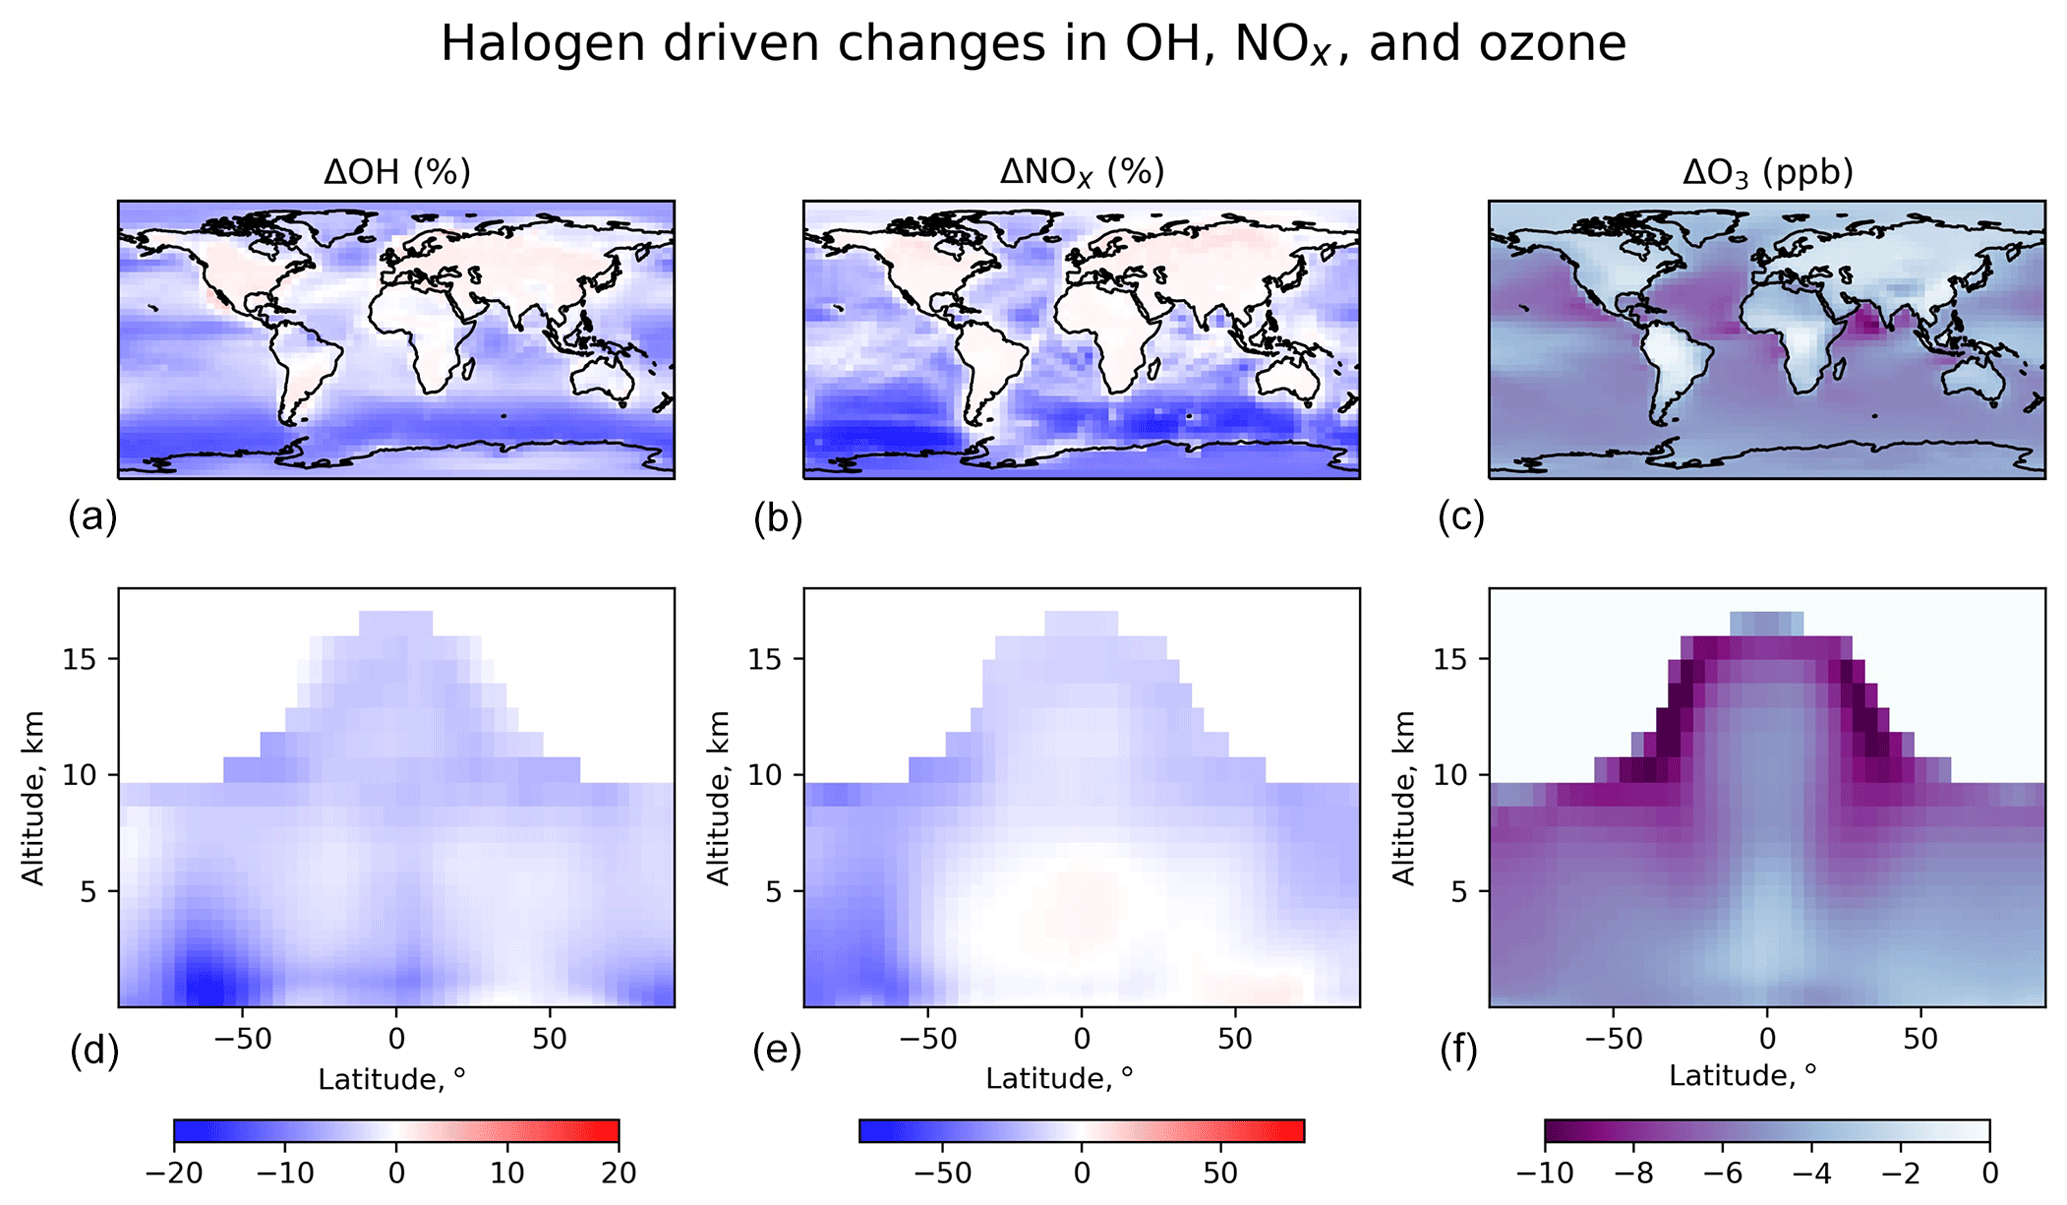
Figure 13Effects of halogen chemistry on tropospheric OH, NOx, and ozone concentrations. The figure shows differences in annual mean concentrations between the standard simulation and a sensitivity simulation removing all tropospheric halogen reactions. The panels (a–c) are for surface air, and the panels (d–f) are for zonal means as a function of latitude and latitude. Only tropospheric grid boxes are shown.
5.2 Ozone, NOx, and OH
Figure 13 shows the effects of halogen chemistry on tropospheric OH, NOx, and ozone concentrations, as obtained by difference with a sensitivity simulation excluding all halogen reactions in the troposphere (“no halogen”). Halogen chemistry decreases the global tropospheric ozone burden by 11 % in our model, which is smaller than the 18.6 % in Sherwen et al. (2016b). Global ozone chemical production decreases by 2 %, while ozone lifetime decreases by 10 %. The decrease in ozone production is due to a 5.6 % global decrease in NOx as a result of formation and hydrolysis of halogen nitrates XNO3 (X ≡ Cl, Br, I):
Globally, such NOx loss is mostly through ClNO3 and BrNO3 hydrolysis, with a negligible contribution from INO3. As shown in Fig. 13, surface NOx increases over the continents, and this is due to ClNO2 chemistry. We previously showed in Wang et al. (2019) that Cl− originating from SSA can be transported far inland by acid displacement of HCl and subsequent HCl uptake by sulfate–nitrate–ammonium (SNA) aerosols. Cl− will then react with N2O5 over the continents via Reaction (R9) and form ClNO2, resulting in longer NOx lifetime. This increase in continental boundary layer NOx would be further amplified by anthropogenic sources of Cl−. Halogen chemistry in our model lowers global tropospheric concentrations of OH and HO2 by 4.1 % and 3.4 %, respectively. The decrease in OH is mainly due to the decrease in ozone, which reduces primary OH production from ozone by 9.8 %. The increase in OH over continental regions (Fig. 13) is due to ClNO2 chemistry.
Table 5Global tropospheric ozone budget in GEOS-Chema.
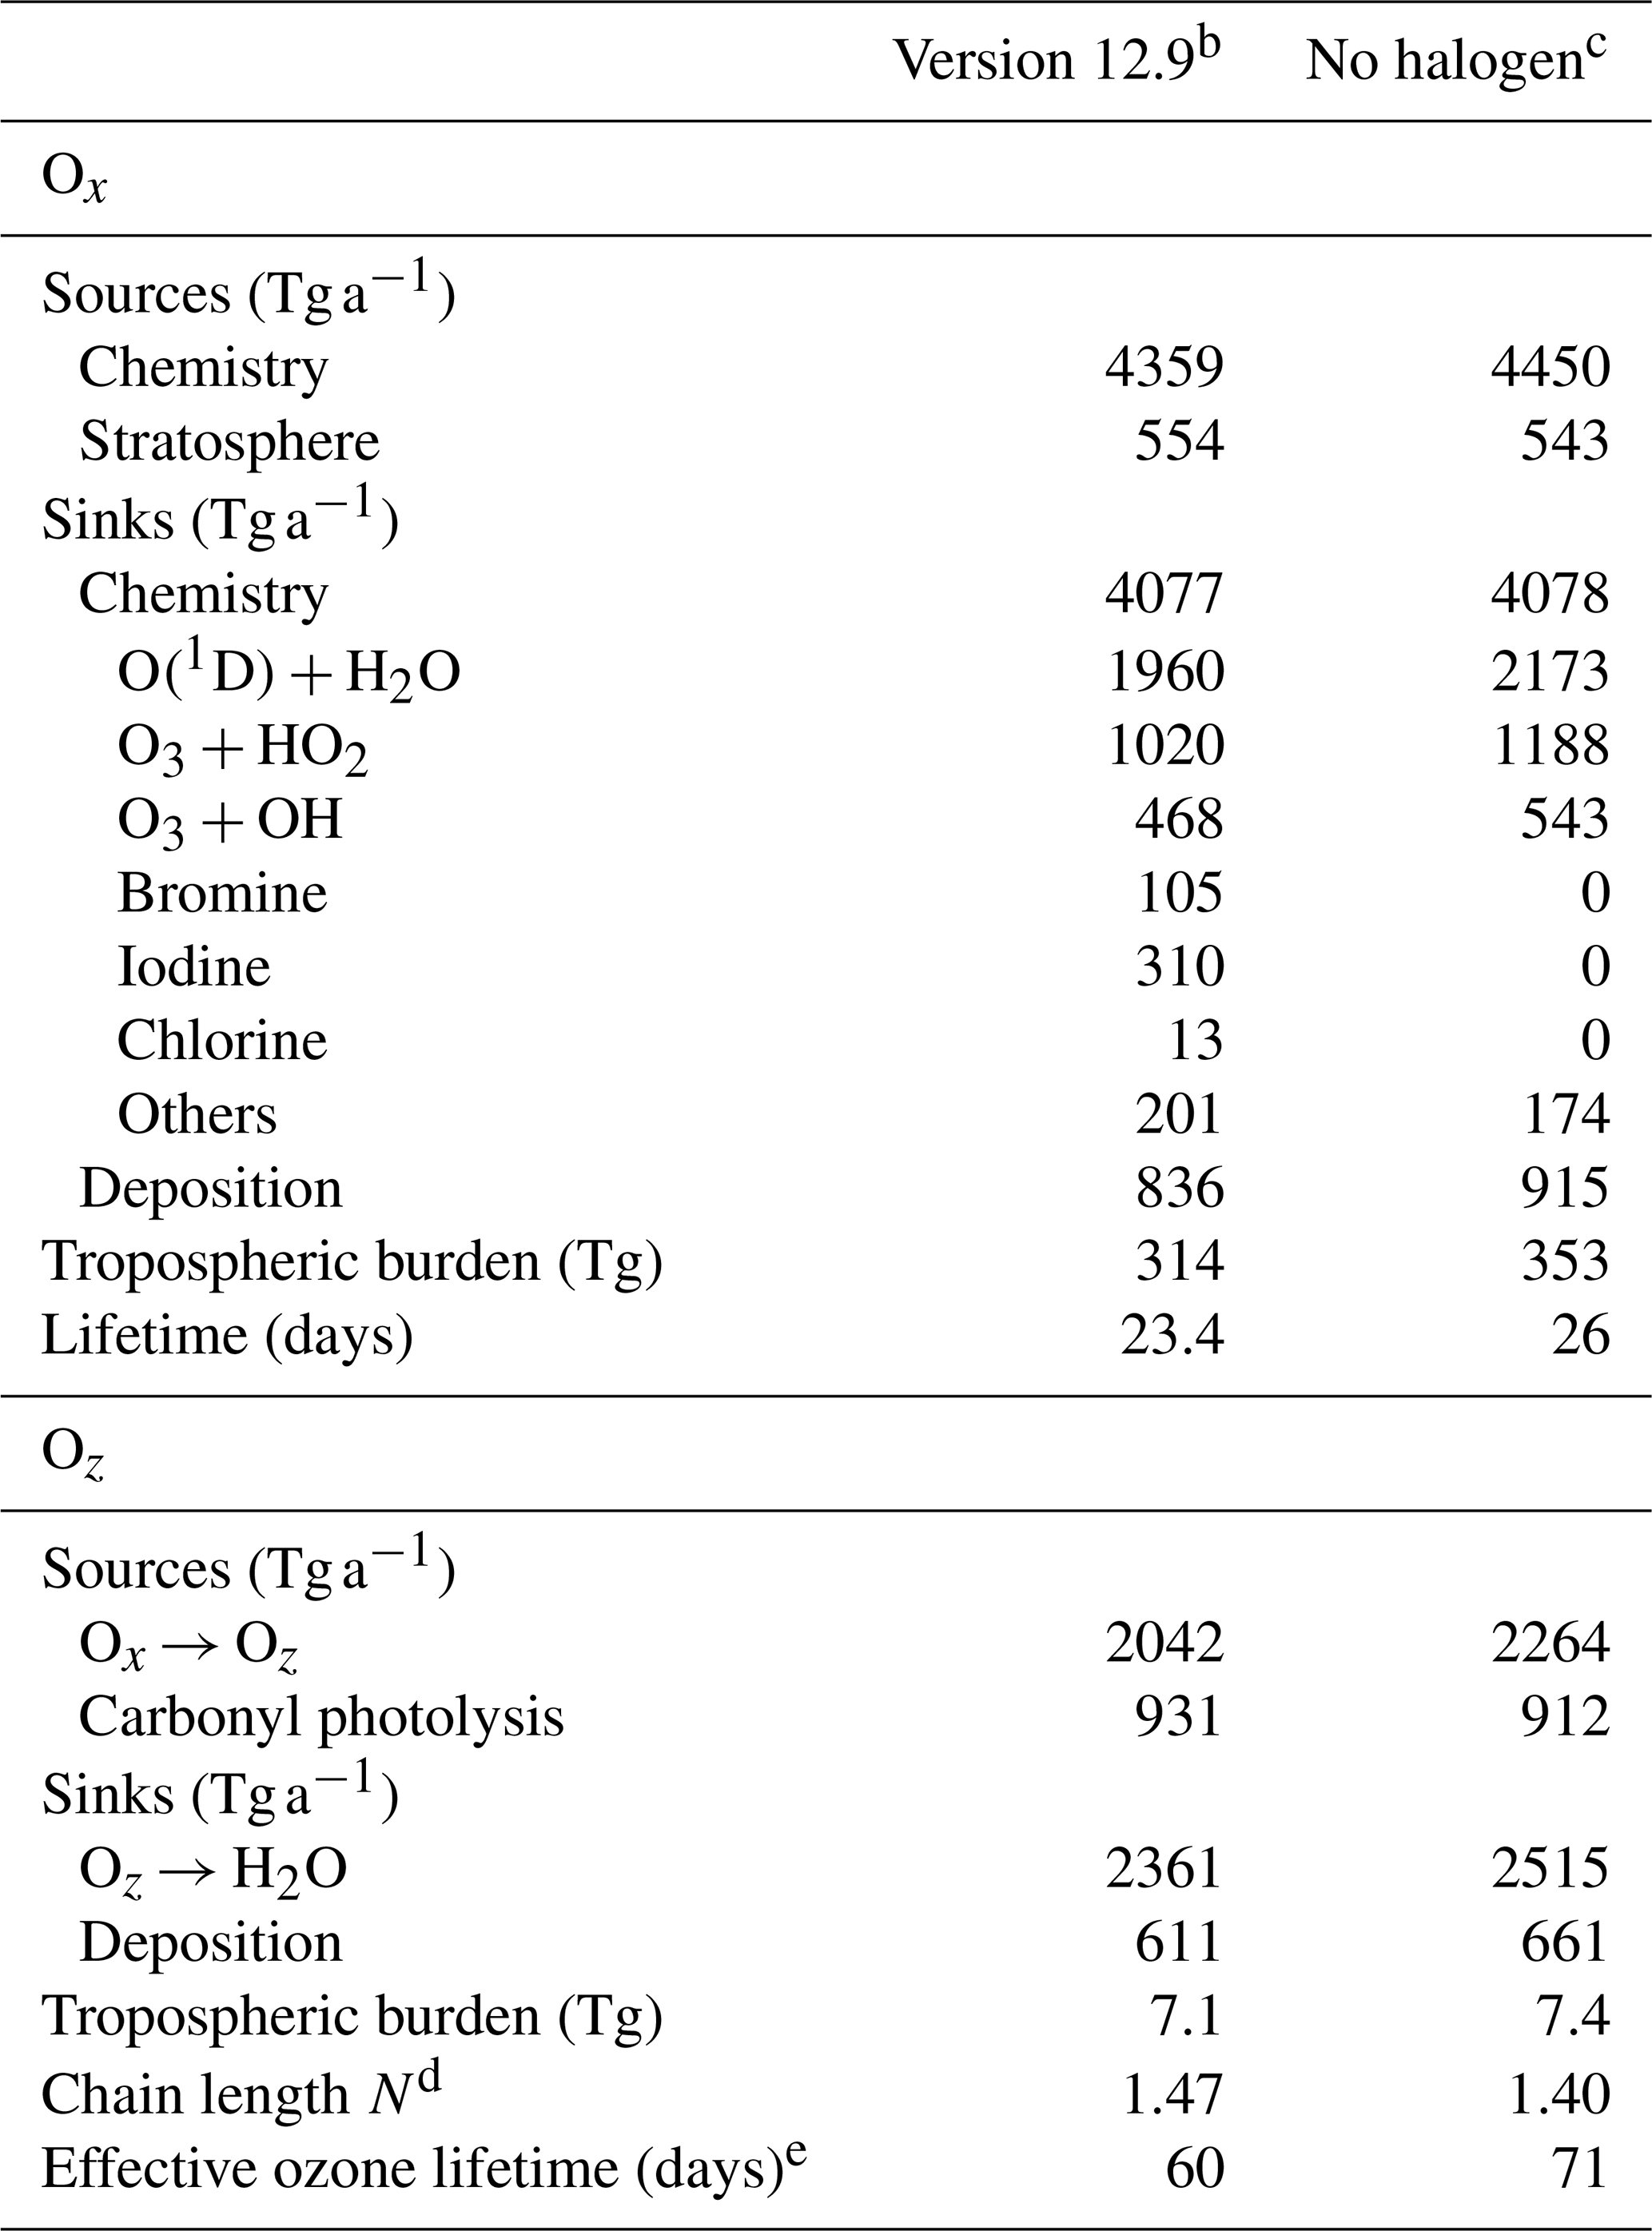
a Annual mean budget for the odd oxygen family (Ox) and for the reservoirs (Oz) of the expanded odd oxygen family (Oy ≡ Ox + Oz). Here, Oz ≈ 0.5HOy accounts for the hydrogen oxide (HOy ≡ OH + peroxy radicals) and their reservoirs cycling with ozone. See the text in Sect. 5.2 and Bates and Jacob (2020) for details. All values are given in ozone equivalent mass. For the halogen crossover reactions where two different halogens are included (e.g., ClO + BrO), we split the ozone loss equally between the two halogens. b As implemented in this work. c Version 12.9 with no tropospheric halogen reactions. d Ox production efficiency per unit Oz; see Eq. (6) in the text for definition. e See Eq. (7) in the text for definition.
Table 5 summarizes the global annual budget of tropospheric ozone in the standard model and in the no-halogen simulation. The budget of ozone is shown as that of odd oxygen (Ox ≡ O3 + O + O(1D) + NO2 + 2NO3 + peroxyacyl nitrates + HNO3 + HNO4 + 3N2O5 + organic nitrates + Criegee intermediates + XO + HOX + XNO2 + 2XNO3 + 2OIO + 2I2O2 + 3I2O3 + 4I2O4 + 2Cl2O2 + 2OClO, where X ≡ Cl, Br, I) to account for the rapid cycling between Ox species. The 10 % shorter ozone lifetime as a result of halogen chemistry is due to catalytic ozone loss cycles driven by iodine (7.6 %), bromine (2.6 %), and chlorine (0.3 %). Figure 14 shows the relative contributions of different reaction routes to ozone chemical loss in the troposphere. Halogens contribute about 19 % of ozone loss in the MBL, decreasing to 8 % at 2–4 km altitude and then increasing to 24 % in the upper troposphere. Halogen-catalyzed ozone loss is mainly driven by the sequence (X ≡ I, Br, Cl):
Bates and Jacob (2020) introduced an expanded odd oxygen family, Oy ≡ Ox + Oz, to include both Ox and an additional subfamily, Oz, consisting of HOx and its reservoirs (Oz ≡ 0.5 × (H + OH + organic peroxy radicals + HNO2 + HNO3 + HNO4 + peroxyacyl nitrates + organic nitrates + X + XO + XNO2 + XNO3 + OIO + OClO + ClOO) + H2O2 + organic peroxides + X2 + HOX + I2O2 + I2O3 + I2O4 + Cl2O2, where X ≡ Cl, Br, I). Table 4 also summarizes the budget of Oz. The global tropospheric Oz burden decreases by 4 % due to the halogen chemistry, which is mainly because of the lower production from Ox. Following Bates and Jacob (2020), we define the chain length N, or Ox production efficiency per unit Oz, as the number of times a unit of Oz is converted to Ox before it is removed to terminal sinks:
In the conventional Ox budget analysis, conversion from Ox to Oz through O(1D) + H2O is viewed as a sink for Ox, but if N > 1 it is actually a net source. By considering this, Bates and Jacob (2020) introduced an effective ozone lifetime as
where ki is the pseudo-first-order loss rate constant for process i. As shown in Table 4, N increases from 1.40 to 1.47 by including halogen chemistry, thus amplifying ozone production efficiency from O(1D) + H2O. This is because of the decrease in HO2, which slows down the loss rate of HOx. The effective ozone lifetime decreases by 15 %, from 71 to 60 d, because the halogen-driven catalytic pathways represent true ozone sinks by converting O3 to O2.
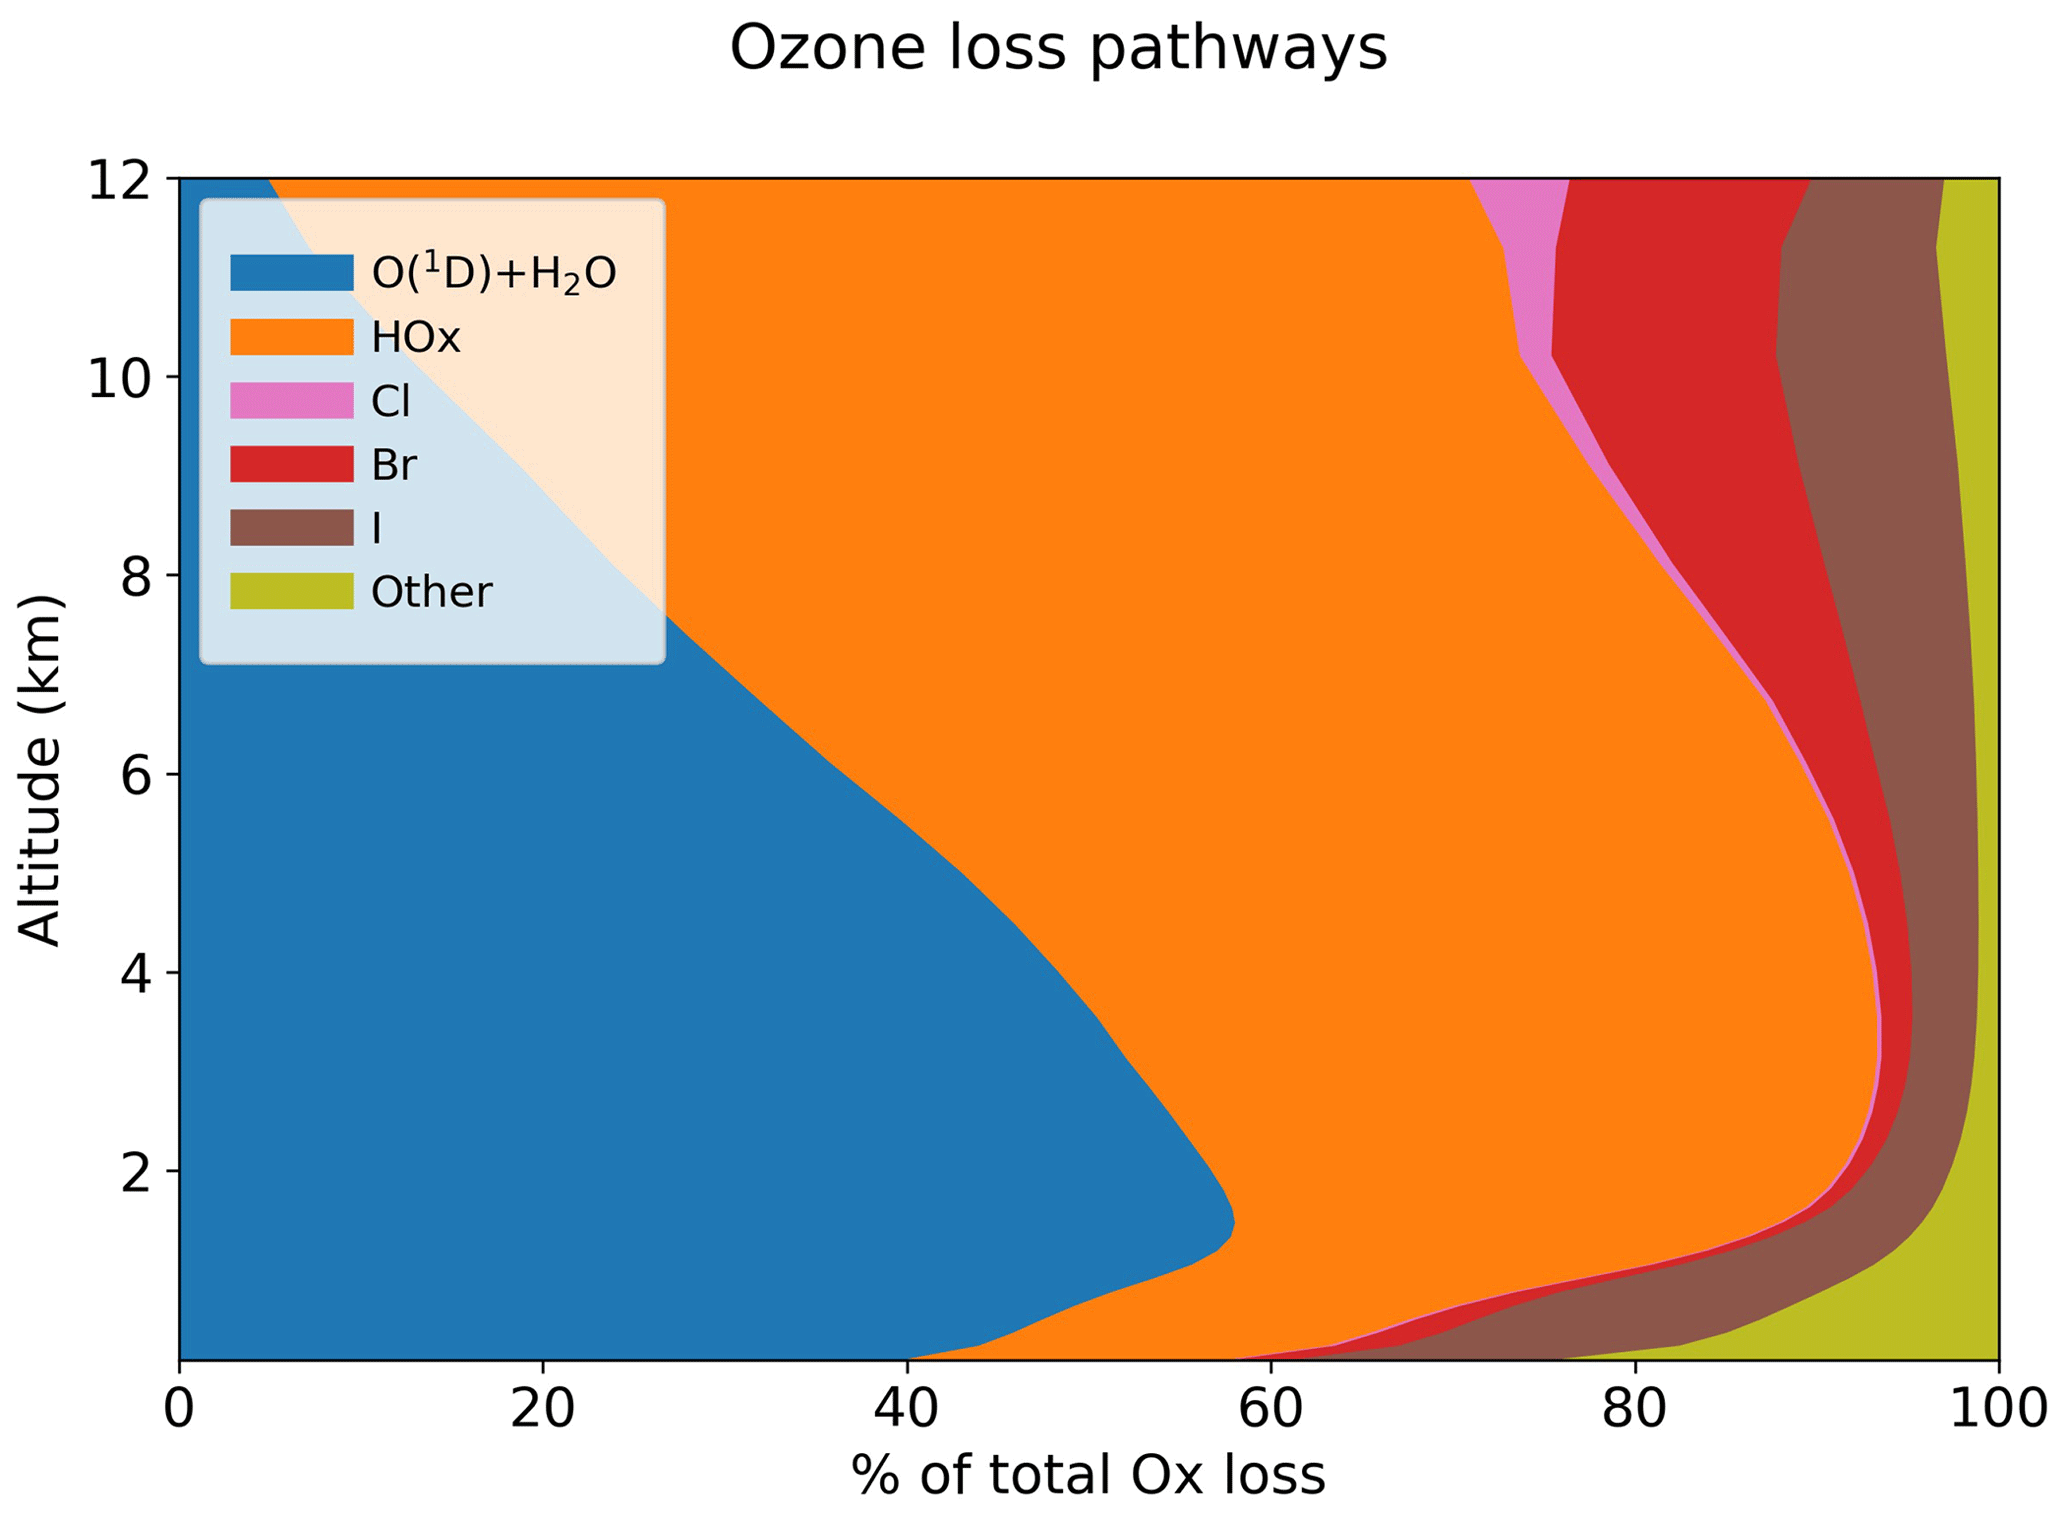
Figure 14Contributions of different pathways to the global annual loss of tropospheric ozone as a function of altitude. The “other” pathway includes sinks from reactions with alkenes and HNO3 deposition.
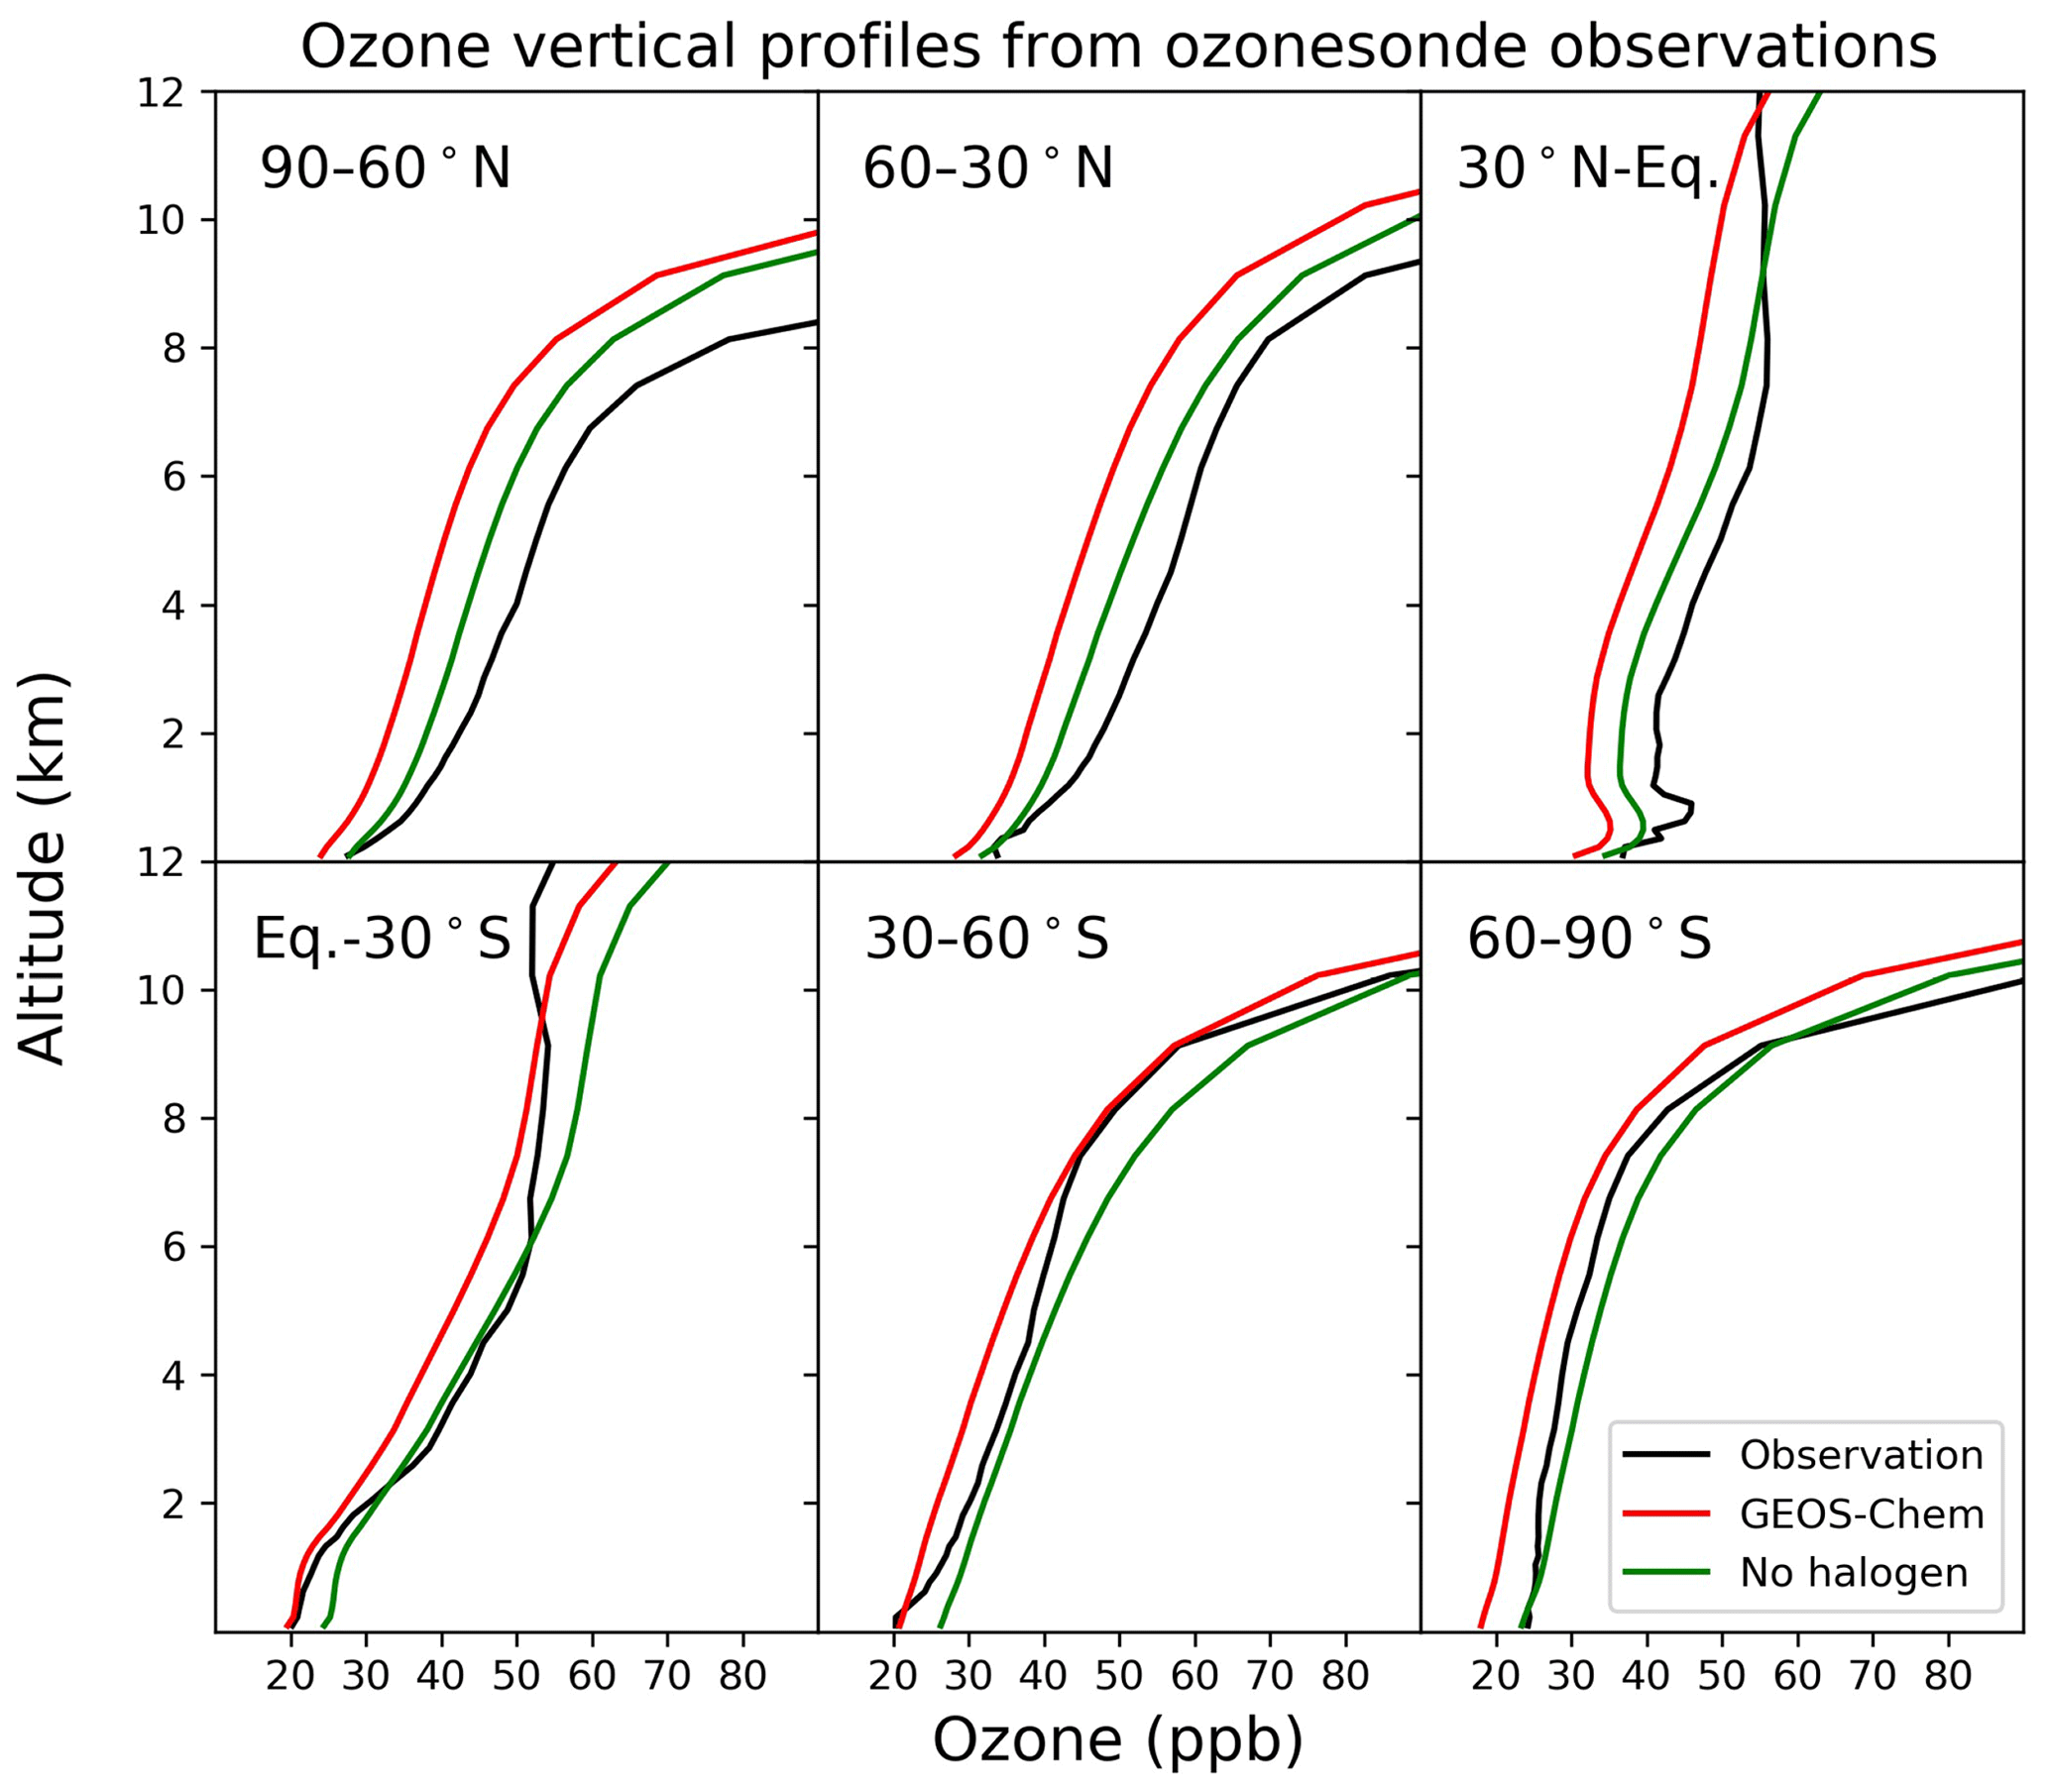
Figure 15Annual average vertical profile of ozone mixing ratios from ozonesonde observations and the model for six zonal bands.
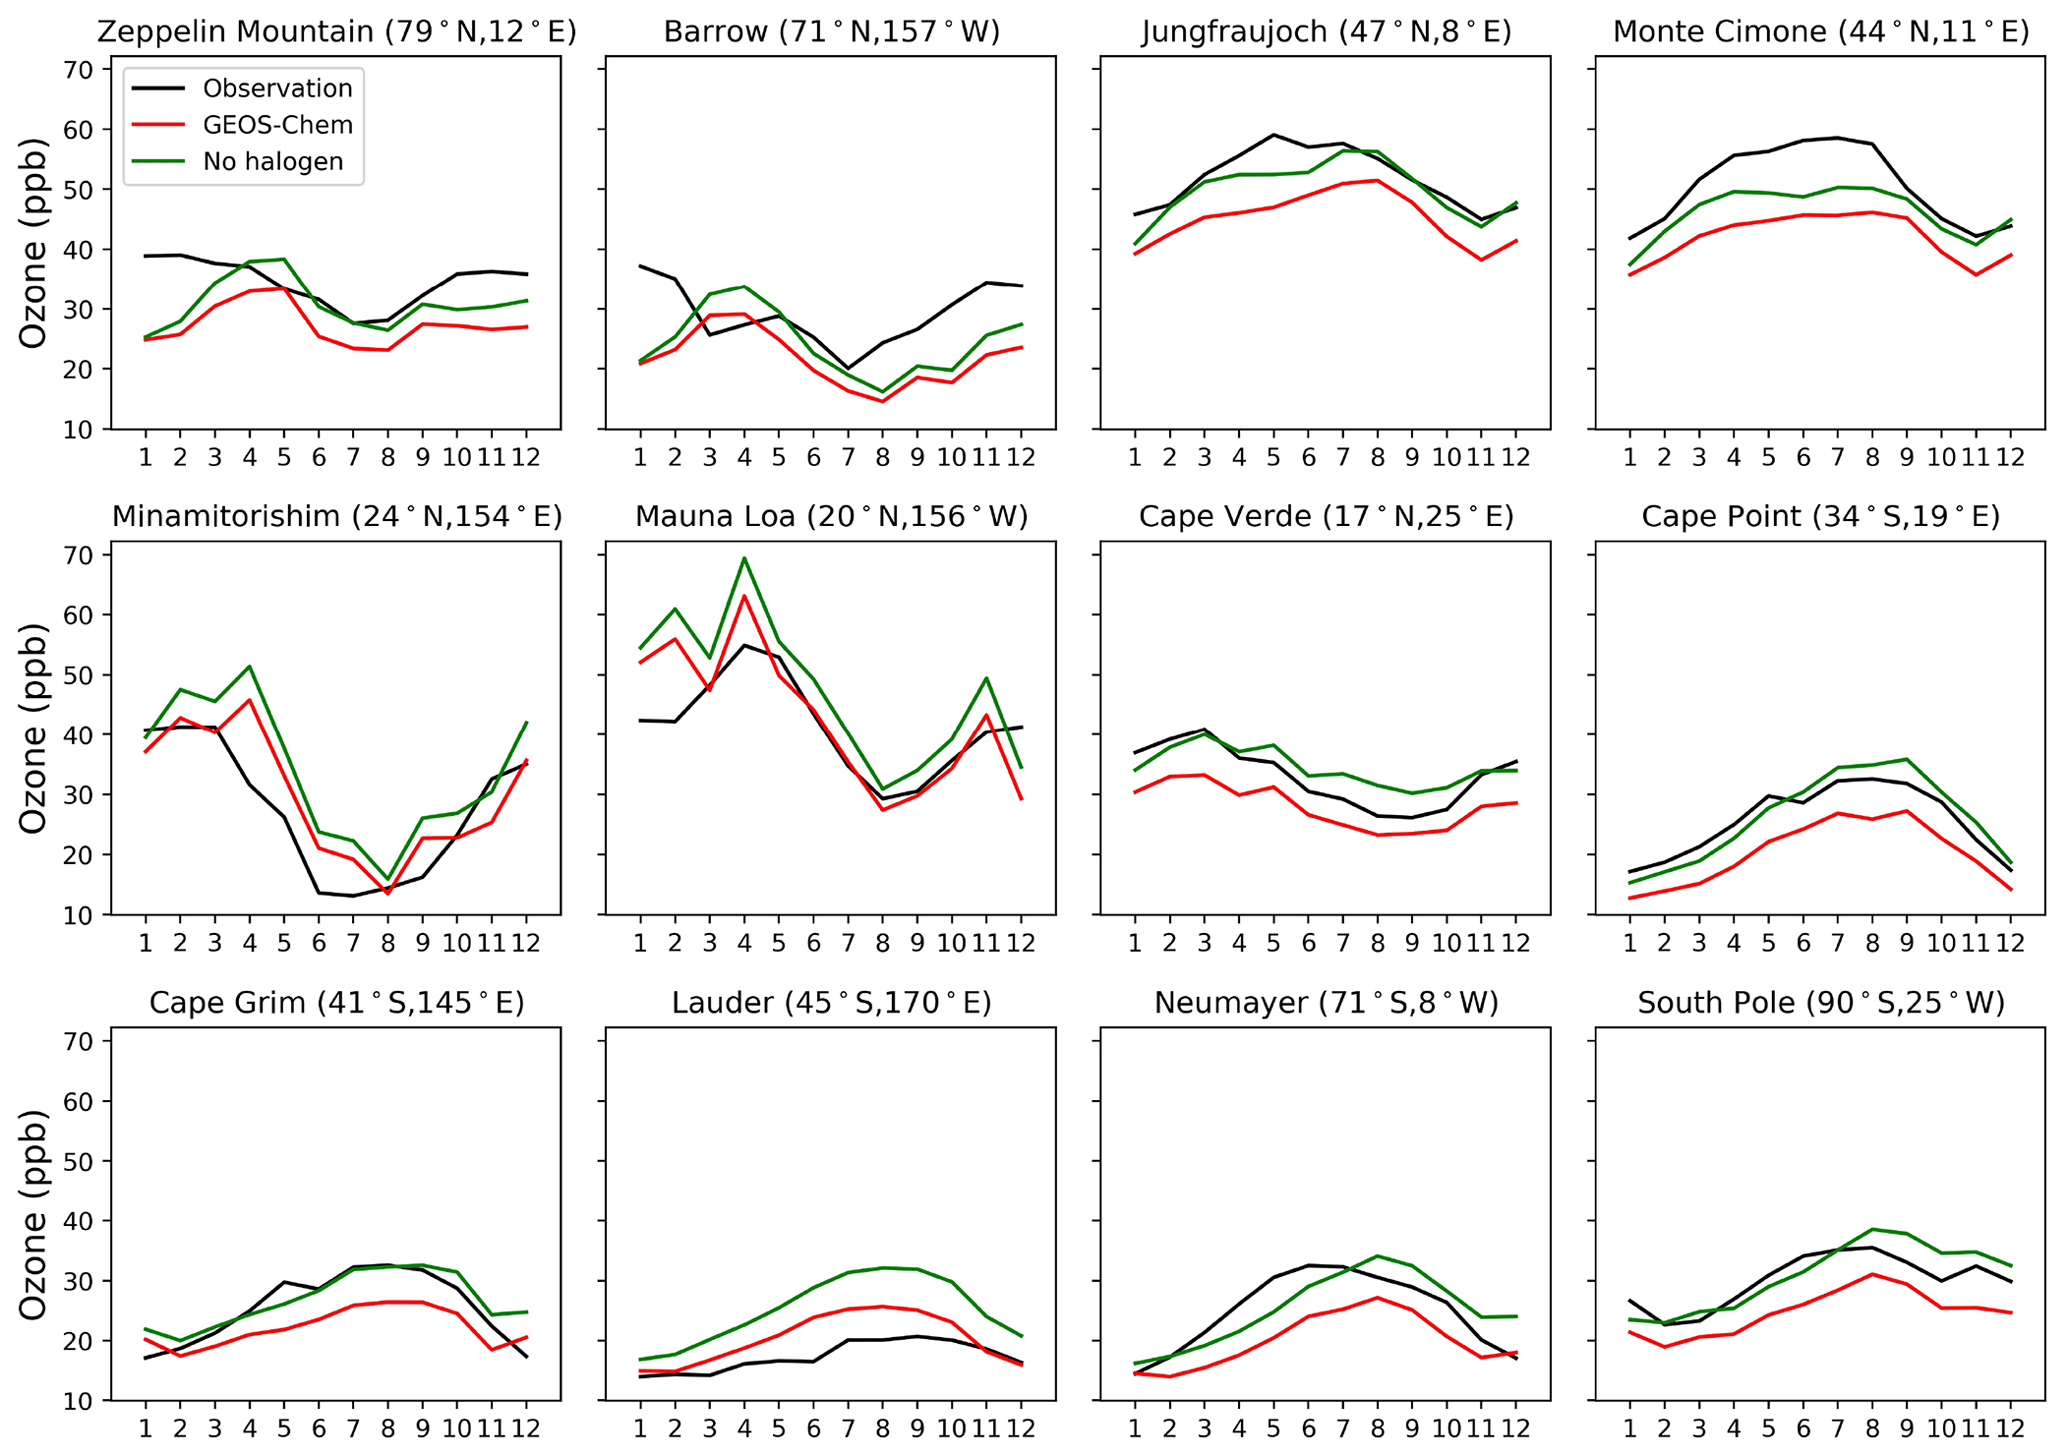
Figure 16Seasonal variation in surface ozone at a range of Global Atmospheric Watch (GAW) sites. Observational data are from the World Data Centre for Reactive Gases (WDCRG) and are 3-year monthly averages (2015–2017). Modeled values are monthly averages for 2016.
Figure 15 compares modeled ozone concentrations with and without halogen chemistry to ozonesonde observations from the World Ozone and Ultraviolet Data Center (WOUDC; http://www.woudc.org, last access: 1 April 2021). We only use data from the electrochemical concentration cell (ECC) and do not apply WOUDC-suggested correction factors, following Hu et al. (2017). There are a total of 47 stations in 2016 (Table S1 in the Supplement), and we average the data into six latitudinal bands. Halogen chemistry does not degrade the simulation in the Southern Hemisphere, where the model bias is small, but worsens the underestimate in the Northern Hemisphere. Similar results are found in Fig. 16, which compares modeled surface ozone mixing ratios to observations at surface sites. There is no significant seasonal variation for the impacts of halogen chemistry on surface ozone at these sites. The last extensive evaluation of the global tropospheric ozone simulation in GEOS-Chem was done by Hu et al. (2017) and found no significant bias, but it used version 10.1 of the model, and there have been many changes to the model since then. In particular, the introduction of NOy reactive uptake by clouds in version 12.6 (Holmes et al., 2019) drove a 7 % decrease in global tropospheric ozone. Correcting this underestimate should be a topic of further research.
We presented a new comprehensive representation of tropospheric halogen chemistry in the GEOS-Chem model that synthesizes and updates previous model developments. We used it to analyze the sources and cycling of halogen radicals, evaluate against observations of halogen radicals and their reservoirs, and examine the implications for tropospheric oxidant chemistry.
The model includes an improved representation of heterogeneous chemistry in aerosols and clouds, including in particular the reactions of HOBr, leading to less effective recycling and mobilization of bromine radicals. This allows us to include in the model the known source of bromine radicals from debromination of sea salt aerosol (SSA) without generating excessive BrO concentrations. Simulation of cloud processing is improved to include a more accurate computation of cloud water pH (Shah et al., 2020) and cloud entrainment (Holmes et al., 2019). ClNO2 production by the heterogeneous N2O5 + Cl− reaction is updated to a slower rate to account for organic coating of particles (McDuffie et al., 2018a, b).
Cycling of chlorine and iodine radicals is similar to previous versions of GEOS-Chem (Wang et al., 2019; Sherwen et al., 2016b), but cycling of bromine radicals is very different. We find a mean tropospheric BrO mixing ratio of 0.19 ppt, much lower than previous GEOS-Chem estimates and reflecting the less effective heterogeneous recycling of bromine radicals. BrO is highest in the marine boundary layer (MBL), where SSA debromination is the main source, and in the upper troposphere due to photodecomposition of bromocarbons and transport from the stratosphere. Model results are consistent with MBL observations of BrO from coastal sites and ship cruises, though observations are often below the detection limit. Comparisons to vertical profiles from aircraft campaigns paints an inconsistent picture, with model BrO being lower than the CAST CIMS, CONTRAST DOAS, and TORERO DOAS measurements over the tropical Pacific but higher than the ATom CIMS measurements at high altitudes on Pacific and Atlantic transects. The TORERO and CONTRAST DOAS data show increasing BrO concentrations in the upper troposphere, but the ATom CIMS data do not. The aircraft observations are again below or close to detection limits. A more confident evaluation of tropospheric bromine radical chemistry will require more sensitive observations of BrO and its reservoirs in the future.
Our simulation shows a global mass-weighted mean Cl atom concentration of 630 molecules cm−3 in the troposphere. Oxidation by Cl atoms accounts for 0.8 % of the global loss of atmospheric methane and has larger effects on the global losses of ethane (14 %), propane (8 %), and higher alkanes (7 %). Reactive chlorine (Cl∗ ≡ Cly − HCl) is mainly generated from HCl + OH (7.3 Tg Cl a−1), heterogeneous reactions of Cl− in clouds (6 Tg Cl a−1), and oxidation of organochlorines (3.3 Tg Cl a−1). Comparisons of model results to observations in marine surface air and aircraft campaigns in this study and our previous work (Wang et al., 2019) show that the model is in general consistent with the range and distributions of observed HCl and ClNO2 concentrations. The model cannot reproduce the high daytime BrCl and Cl2 concentrations observed during ATom, and matching those values would require a fast Cl∗ source. Whether this can be compatible with other ATom observations of VOCs and radicals needs future investigation. Our simulated IO mixing ratios are consistent with marine observations in surface air and from aircraft, showing high values in the tropical MBL and low uniform values in the free troposphere. Our simulated global mean tropospheric IO concentration is 0.08 ppt.
Halogen chemistry decreases the global burden of tropospheric ozone in GEOS-Chem by 11 %. This reflects a 2 % decrease in ozone production (due to the sink of NOx from formation and hydrolysis of ClNO3 and BrNO3) and an 11 % increase in ozone chemical loss (due to catalytic cycles involving iodine (8 %) and bromine (3 %)). The global mean tropospheric OH concentration decreases by 4.1 %, mostly due to the decrease in ozone. Tropospheric ozone concentrations in GEOS-Chem show no significant bias in the Southern Hemisphere relative to ozonesonde data but a low bias in the Northern Hemisphere that is also present in the absence of halogen chemistry. Addressing this low bias should be a priority for future research.
The model code is available at the GEOS-Chem repository (http://www.geos-chem.org, GEOS-Chem, 2021, https://doi.org/10.5281/zenodo.3950327; Yantosca et al., 2020). ATom data are publicly available through the Oak Ridge National Laboratory DAAC (https://doi.org/10.3334/ORNLDAAC/174; Veres et al., 2019). Data from the WINTER, CONTRAST, and TORERO campaigns are publicly available at the EOL data archive (https://doi.org/10.5065/D6RF5S6B; UCAR/NCAR – Earth Observing Laboratory; https://doi.org/10.5065/D6F769MF; Volkamer et al., 2020; https://doi.org/10.5065/D6DV1GW3; Huey, 2016; https://data.eol.ucar.edu/dataset/352.082; Volkamer and Dix, 2017). Data of CAST are publicly available at the CEDA archive (https://catalogue.ceda.ac.uk/uuid/565b6bb5a0535b438ad2fae4c852e1b3; Facility for Airborne Atmospheric Measurements, Natural Environment Research Council, Met Office, 2015).
The supplement related to this article is available online at: https://doi.org/10.5194/acp-21-13973-2021-supplement.
XW and DJJ designed the study and prepared the paper with input from all co-authors. XW developed the updated halogen code, performed the simulations, and conducted the analysis. WD merged the halogen code with other updates of GEOS-Chem in version 12.9. XW, SZ, LZ, VS, CDH, TS, BA, MJE, and SDE contributed to the GEOS-Chem model development. JAN, PV, TKK, RV, LGH, ML, TJB, CJP, BHL, and JAT conducted and processed the aircraft halogen measurements.
The contact author has declared that neither they nor their co-authors have any competing interests.
Publisher's note: Copernicus Publications remains neutral with regard to jurisdictional claims in published maps and institutional affiliations.
This work was supported by the City University of Hong Kong New Research Initiatives (grant no. 9610470) and the National Natural Science Foundation of China (grant no. 42005083) and was partially supported by the Shenzhen Research Institute, City University of Hong Kong. Work at Harvard was supported by the EPA STAR Program (grant no. 84001401). The authors thank Michael Le Breton for CAST measurements and Kelvin H. Bates for helpful discussions.
This research has been supported by the City University of Hong Kong (grant no. 9610470), the National Natural Science Foundation of China (grant no. 42005083), and the US Environmental Protection Agency (grant no. 84001401).
This paper was edited by Andreas Hofzumahaus and reviewed by Rolf Sander and one anonymous referee.
Ammann, M., Cox, R. A., Crowley, J. N., Jenkin, M. E., Mellouki, A., Rossi, M. J., Troe, J., and Wallington, T. J.: Evaluated kinetic and photochemical data for atmospheric chemistry: Volume VI – heterogeneous reactions with liquid substrates, Atmos. Chem. Phys., 13, 8045–8228, https://doi.org/10.5194/acp-13-8045-2013, 2013.
Andreae, M. O.: Emission of trace gases and aerosols from biomass burning – an updated assessment, Atmos. Chem. Phys., 19, 8523–8546, https://doi.org/10.5194/acp-19-8523-2019, 2019.
Atkinson, R.: Gas-Phase Tropospheric Chemistry of Volatile Organic Compounds: 1. Alkanes and Alkenes, J. Phys. Chem. Ref. Data, 26, 215–290, https://doi.org/10.1063/1.556012, 1997.
Badia, A., Reeves, C. E., Baker, A. R., Saiz-Lopez, A., Volkamer, R., Koenig, T. K., Apel, E. C., Hornbrook, R. S., Carpenter, L. J., Andrews, S. J., Sherwen, T., and von Glasow, R.: Importance of reactive halogens in the tropical marine atmosphere: a regional modelling study using WRF-Chem, Atmos. Chem. Phys., 19, 3161–3189, https://doi.org/10.5194/acp-19-3161-2019, 2019.
Bannan, T. J., Bacak, A., Le Breton, M., Flynn, M., Ouyang, B., McLeod, M., Jones, R., Malkin, T. L., Whalley, L. K., Heard, D. E., Bandy, B., Khan, M. A. H., Shallcross, D. E., and Percival, C. J.: Ground and Airborne U. K. Measurements of Nitryl Chloride: An Investigation of the Role of Cl Atom Oxidation at Weybourne Atmospheric Observatory, J. Geophys. Res.-Atmos., 122, 11154–11165, https://doi.org/10.1002/2017JD026624, 2017.
Bates, K. H. and Jacob, D. J.: An Expanded Definition of the Odd Oxygen Family for Tropospheric Ozone Budgets: Implications for Ozone Lifetime and Stratospheric Influence, Geophys. Res. Lett., 47, e2019GL084486, https://doi.org/10.1029/2019gl084486, 2020.
Beckwith, R. C., Wang, T. X., and Margerum, D. W.: Equilibrium and Kinetics of Bromine Hydrolysis, Inorg. Chem., 35, 995–1000, https://doi.org/10.1021/ic950909w, 1996.
Bell, N., Hsu, L., Jacob, D. J., Schultz, M. G., Blake, D. R., Butler, J. H., King, D. B., Lobert, J. M., and Maier-Reimer, E.: Methyl iodide: Atmospheric budget and use as a tracer of marine convection in global models, J. Geophys. Res.-Atmos., 107, ACH 8-1–ACH 8-12, https://doi.org/10.1029/2001JD001151, 2002.
Carpenter, L. J., MacDonald, S. M., Shaw, M. D., Kumar, R., Saunders, R. W., Parthipan, R., Wilson, J., and Plane, J. M. C.: Atmospheric iodine levels influenced by sea surface emissions of inorganic iodine, Nat. Geosci., 6, 108–111, https://doi.org/10.1038/ngeo1687, 2013.
Chen, D., Huey, L. G., Tanner, D. J., Salawitch, R. J., Anderson, D. C., Wales, P. A., Pan, L. L., Atlas, E. L., Hornbrook, R. S., Apel, E. C., Blake, N. J., Campos, T. L., Donets, V., Flocke, F. M., Hall, S. R., Hanisco, T. F., Hills, A. J., Honomichl, S. B., Jensen, J. B., Kaser, L., Montzka, D. D., Nicely, J. M., Reeves, J. M., Riemer, D. D., Schauffler, S. M., Ullmann, K., Weinheimer, A. J., and Wolfe, G. M.: Airborne measurements of BrO and the sum of HOBr and Br2over the Tropical West Pacific from 1 to 15 km during the CONvective TRansport of Active Species in the Tropics (CONTRAST) experiment, J. Geophys. Res.-Atmos., 121, 12560–12578, https://doi.org/10.1002/2016jd025561, 2016.
Chen, Q., Schmidt, J. A., Shah, V., Jaeglé, L., Sherwen, T., and Alexander, B.: Sulfate production by reactive bromine: Implications for the global sulfur and reactive bromine budgets, Geophys. Res. Lett., 44, 7069–7078, https://doi.org/10.1002/2017GL073812, 2017.
Crisp, T. A., Lerner, B. M., Williams, E. J., Quinn, P. K., Bates, T. S., and Bertram, T. H.: Observations of gas phase hydrochloric acid in the polluted marine boundary layer, J. Geophys. Res.-Atmos., 119, 6897–6915, https://doi.org/10.1002/2013JD020992, 2014.
Crowley, J. N., Ammann, M., Cox, R. A., Hynes, R. G., Jenkin, M. E., Mellouki, A., Rossi, M. J., Troe, J., and Wallington, T. J.: Evaluated kinetic and photochemical data for atmospheric chemistry: Volume V – heterogeneous reactions on solid substrates, Atmos. Chem. Phys., 10, 9059–9223, https://doi.org/10.5194/acp-10-9059-2010, 2010.
Dasgupta, P. K., Campbell, S. W., Al-Horr, R. S., Ullah, S. M. R., Li, J., Amalfitano, C., and Poor, N. D.: Conversion of sea salt aerosol to NaNO3 and the production of HCl: Analysis of temporal behavior of aerosol chloride/nitrate and gaseous HCl/HNO3 concentrations with AIM, Atmos. Environ., 41, 4242–4257, https://doi.org/10.1016/j.atmosenv.2006.09.054, 2007.
Deiber, G., George, Ch., Le Calvé, S., Schweitzer, F., and Mirabel, Ph.: Uptake study of ClONO2 and BrONO2 by Halide containing droplets, Atmos. Chem. Phys., 4, 1291–1299, https://doi.org/10.5194/acp-4-1291-2004, 2004.
Dix, B., Koenig, T. K., and Volkamer, R.: Parameterization retrieval of trace gas volume mixing ratios from Airborne MAX-DOAS, Atmos. Meas. Tech., 9, 5655–5675, https://doi.org/10.5194/amt-9-5655-2016, 2016.
Dörich, R., Eger, P., Lelieveld, J., and Crowley, J. N.: Iodide CIMS and 62: the detection of HNO3 as in the presence of PAN, peroxyacetic acid and ozone, Atmos. Meas. Tech., 14, 5319–5332, https://doi.org/10.5194/amt-14-5319-2021, 2021.
Eastham, S. D., Weisenstein, D. K., and Barrett, S. R. H.: Development and evaluation of the unified tropospheric–stratospheric chemistry extension (UCX) for the global chemistry-transport model GEOS-Chem, Atmos. Environ., 89, 52–63, https://doi.org/10.1016/j.atmosenv.2014.02.001, 2014.
Facility for Airborne Atmospheric Measurements, Natural Environment Research Council, Met Office: FAAM B826 CAST flight, number 3: Airborne atmospheric measurements from core and non-core instrument suites on board the BAE-146 aircraft, NCAS British Atmospheric Data Centre, available at: https://catalogue.ceda.ac.uk/uuid/565b6bb5a0535b438ad2fae4c852e1b3 (last access: 12 September 2021), 2015.
Faxon, C., Bean, J., and Ruiz, L.: Inland Concentrations of Cl2 and ClNO2 in Southeast Texas Suggest Chlorine Chemistry Significantly Contributes to Atmospheric Reactivity, Atmosphere, 6, 1487–1506, https://doi.org/10.3390/atmos6101487, 2015.
Fickert, S., Adams, J. W., and Crowley, J. N.: Activation of Br2 and BrCl via uptake of HOBr onto aqueous salt solutions, J. Geophys. Res.-Atmos., 104, 23719–23727, https://doi.org/10.1029/1999JD900359, 1999.
Finlayson-Pitts, B. J.: The Tropospheric Chemistry of Sea Salt: A Molecular-Level View of the Chemistry of NaCl and NaBr, Chem. Rev., 103, 4801–4822, https://doi.org/10.1021/cr020653t, 2003.
Fogelman, K. D., Walker, D. M., and Margerum, D. W.: Nonmetal redox kinetics: hypochlorite and hypochlorous acid reactions with sulfite, Inorg. Chem., 28, 986–993, https://doi.org/10.1021/ic00305a002, 1989.
Fountoukis, C. and Nenes, A.: ISORROPIA II: a computationally efficient thermodynamic equilibrium model for K+–Ca2+–Mg2+––Na+–––Cl−–H2O aerosols, Atmos. Chem. Phys., 7, 4639–4659, https://doi.org/10.5194/acp-7-4639-2007, 2007.
GEOS-Chem: http://www.geos-chem.org, last access: 20 September 2021.
Gómez Martín, J. C., Mahajan, A. S., Hay, T. D., Prados-Román, C., Ordóñez, C., MacDonald, S. M., Plane, J. M. C., Sorribas, M., Gil, M., Paredes Mora, J. F., Agama Reyes, M. V., Oram, D. E., Leedham, E., and Saiz-Lopez, A.: Iodine chemistry in the eastern Pacific marine boundary layer, J. Geophys. Res.-Atmos., 118, 887–904, https://doi.org/10.1002/jgrd.50132, 2013.
Graedel, T. E. and Keene, W. C.: Tropospheric budget of reactive chlorine, Global Biogeochem. Cy., 9, 47–77, https://doi.org/10.1029/94GB03103, 1995.
Gromov, S., Brenninkmeijer, C. A. M., and Jöckel, P.: A very limited role of tropospheric chlorine as a sink of the greenhouse gas methane, Atmos. Chem. Phys., 18, 9831–9843, https://doi.org/10.5194/acp-18-9831-2018, 2018.
Großmann, K., Frieß, U., Peters, E., Wittrock, F., Lampel, J., Yilmaz, S., Tschritter, J., Sommariva, R., von Glasow, R., Quack, B., Krüger, K., Pfeilsticker, K., and Platt, U.: Iodine monoxide in the Western Pacific marine boundary layer, Atmos. Chem. Phys., 13, 3363–3378, https://doi.org/10.5194/acp-13-3363-2013, 2013.
Gunthe, S. S., Liu, P., Panda, U., Raj, S. S., Sharma, A., Darbyshire, E., Reyes-Villegas, E., Allan, J., Chen, Y., Wang, X., and Song, S.: Enhanced aerosol particle growth sustained by high continental chlorine emission in India. Nat. Geosci., 14, 77–84, 2021.
Haskins, J. D., Jaeglé, L., and Thornton, J. A.: Significant Decrease in Wet Deposition of Anthropogenic Chloride Across the Eastern United States, 1998–2018, Geophys. Res. Lett., 47, e2020GL090195, https://doi.org/10.1029/2020gl090195, 2020.
Heymsfield, A., Winker, D., Avery, M., Vaughan, M., Diskin, G., Deng, M., Mitev, V., and Matthey, R.: Relationships between Ice Water Content and Volume Extinction Coefficient from In Situ Observations for Temperatures from 0∘ to −86 ∘C: Implications for Spaceborne Lidar Retrievals, J. Appl. Meteorol. Clim., 53, 479–505, https://doi.org/10.1175/jamc-d-13-087.1, 2014.
Holmes, C. D., Bertram, T. H., Confer, K. L., Graham, K. A., Ronan, A. C., Wirks, C. K., and Shah, V.: The Role of Clouds in the Tropospheric NOx Cycle: A New Modeling Approach for Cloud Chemistry and Its Global Implications, Geophys. Res. Lett., 46, 4980–4990, https://doi.org/10.1029/2019gl081990, 2019.
Horowitz, H. M., Jacob, D. J., Zhang, Y., Dibble, T. S., Slemr, F., Amos, H. M., Schmidt, J. A., Corbitt, E. S., Marais, E. A., and Sunderland, E. M.: A new mechanism for atmospheric mercury redox chemistry: implications for the global mercury budget, Atmos. Chem. Phys., 17, 6353–6371, https://doi.org/10.5194/acp-17-6353-2017, 2017.
Hu, L., Jacob, D. J., Liu, X., Zhang, Y., Zhang, L., Kim, P. S., Sulprizio, M. P., and Yantosca, R. M.: Global budget of tropospheric ozone: Evaluating recent model advances with satellite (OMI), aircraft (IAGOS), and ozonesonde observations, Atmos. Environ., 167, 323–334, https://doi.org/10.1016/j.atmosenv.2017.08.036, 2017.
Huey, L.: Georgia Tech Chemical Ionization Mass Spectrometer (GTCIMS) Bromine In Situ Measurements, Version 3.0, UCAR/NCAR – Earth Observing Laboratory [data set], https://doi.org/10.5065/D6DV1GW3, 2016.
Jacob, D. J.: Heterogeneous chemistry and tropospheric ozone, Atmos. Environ., 34, 2131–2159, https://doi.org/10.1016/S1352-2310(99)00462-8, 2000.
Jaeglé, L., Quinn, P. K., Bates, T. S., Alexander, B., and Lin, J.-T.: Global distribution of sea salt aerosols: new constraints from in situ and remote sensing observations, Atmos. Chem. Phys., 11, 3137–3157, https://doi.org/10.5194/acp-11-3137-2011, 2011.
Jeong, D., Seco, R., Gu, D., Lee, Y., Nault, B. A., Knote, C. J., Mcgee, T., Sullivan, J. T., Jimenez, J. L., Campuzano-Jost, P., Blake, D. R., Sanchez, D., Guenther, A. B., Tanner, D., Huey, L. G., Long, R., Anderson, B. E., Hall, S. R., Ullmann, K., Shin, H., Herndon, S. C., Lee, Y., Kim, D., Ahn, J., and Kim, S.: Integration of airborne and ground observations of nitryl chloride in the Seoul metropolitan area and the implications on regional oxidation capacity during KORUS-AQ 2016, Atmos. Chem. Phys., 19, 12779–12795, https://doi.org/10.5194/acp-19-12779-2019, 2019.
Keene, W. C., Stutz, J., Pszenny, A. A. P., Maben, J. R., Fischer, E. V., Smith, A. M., von Glasow, R., Pechtl, S., Sive, B. C., and Varner, R. K.: Inorganic chlorine and bromine in coastal New England air during summer, J. Geophys. Res.-Atmos., 112, D10S12, https://doi.org/10.1029/2006jd007689, 2007.
Keene, W. C., Long, M. S., Pszenny, A. A. P., Sander, R., Maben, J. R., Wall, A. J., O'Halloran, T. L., Kerkweg, A., Fischer, E. V., and Schrems, O.: Latitudinal variation in the multiphase chemical processing of inorganic halogens and related species over the eastern North and South Atlantic Oceans, Atmos. Chem. Phys., 9, 7361–7385, https://doi.org/10.5194/acp-9-7361-2009, 2009.
Kercher, J. P., Riedel, T. P., and Thornton, J. A.: Chlorine activation by N2O5: simultaneous, in situ detection of ClNO2 and N2O5 by chemical ionization mass spectrometry, Atmos. Meas. Tech., 2, 193–204, https://doi.org/10.5194/amt-2-193-2009, 2009.
Kim, M. J., Farmer, D. K., and Bertram, T. H.: A controlling role for the air–sea interface in the chemical processing of reactive nitrogen in the coastal marine boundary layer, P. Natl. Acad. Sci. USA, 111, 3943–3948, https://doi.org/10.1073/pnas.1318694111, 2014.
Koenig, T. K., Volkamer, R., Baidar, S., Dix, B., Wang, S., Anderson, D. C., Salawitch, R. J., Wales, P. A., Cuevas, C. A., Fernandez, R. P., Saiz-Lopez, A., Evans, M. J., Sherwen, T., Jacob, D. J., Schmidt, J., Kinnison, D., Lamarque, J.-F., Apel, E. C., Bresch, J. C., Campos, T., Flocke, F. M., Hall, S. R., Honomichl, S. B., Hornbrook, R., Jensen, J. B., Lueb, R., Montzka, D. D., Pan, L. L., Reeves, J. M., Schauffler, S. M., Ullmann, K., Weinheimer, A. J., Atlas, E. L., Donets, V., Navarro, M. A., Riemer, D., Blake, N. J., Chen, D., Huey, L. G., Tanner, D. J., Hanisco, T. F., and Wolfe, G. M.: BrO and inferred Bry profiles over the western Pacific: relevance of inorganic bromine sources and a Bry minimum in the aged tropical tropopause layer, Atmos. Chem. Phys., 17, 15245–15270, https://doi.org/10.5194/acp-17-15245-2017, 2017.
Koenig, T. K., Baidar, S., Campuzano-Jost, P., Cuevas, C. A., Dix, B., Fernandez, R. P., Guo, H., Hall, S. R., Kinnison, D., Nault, B. A., Ullmann, K., Jimenez, J. L., Saiz-Lopez, A., and Volkamer, R.: Quantitative detection of iodine in the stratosphere, P. Natl. Acad. Sci. USA, 117, 1860–1866, https://doi.org/10.1073/pnas.1916828117, 2020.
Le Breton, M., Bannan, T. J., Shallcross, D. E., Khan, M. A., Evans, M. J., Lee, J., Lidster, R., Andrews, S., Carpenter, L. J., Schmidt, J., Jacob, D., Harris, N. R. P., Bauguitte, S., Gallagher, M., Bacak, A., Leather, K. E., and Percival, C. J.: Enhanced ozone loss by active inorganic bromine chemistry in the tropical troposphere, Atmos. Environ., 155, 21–28, https://doi.org/10.1016/j.atmosenv.2017.02.003, 2017.
Lee, B. H., Lopez-Hilfiker, F. D., Schroder, J. C., Campuzano-Jost, P., Jimenez, J. L., McDuffie, E. E., Fibiger, D. L., Veres, P. R., Brown, S. S., Campos, T. L., Weinheimer, A. J., Flocke, F. F., Norris, G., O'Mara, K., Green, J. R., Fiddler, M. N., Bililign, S., Shah, V., Jaeglé, L., and Thornton, J. A.: Airborne Observations of Reactive Inorganic Chlorine and Bromine Species in the Exhaust of Coal-Fired Power Plants, J. Geophys. Res.-Atmos., 123, 11225–11237, https://doi.org/10.1029/2018jd029284, 2018.
Leser, H., Hönninger, G., and Platt, U.: MAX-DOAS measurements of BrO and NO2 in the marine boundary layer, Geophys. Res. Lett., 30, 1537, https://doi.org/10.1029/2002GL015811, 2003.
Liang, Q., Stolarski, R. S., Kawa, S. R., Nielsen, J. E., Douglass, A. R., Rodriguez, J. M., Blake, D. R., Atlas, E. L., and Ott, L. E.: Finding the missing stratospheric Bry: a global modeling study of CHBr3 and CH2Br2, Atmos. Chem. Phys., 10, 2269–2286, https://doi.org/10.5194/acp-10-2269-2010, 2010.
Liu, Q.: Kinetics of aqueous phase reactions related to ozone depletion in the arctic troposphere: Bromine chloride hydrolysis, bromide ion with ozone, and sulfur(IV) with bromine and hypobromous acid, PhD, Purdue University, Purdue, 2000.
Liu, Q. and Margerum, D. W.: Equilibrium and Kinetics of Bromine Chloride Hydrolysis, Environ. Sci. Technol., 35, 1127–1133, https://doi.org/10.1021/es001380r, 2001.
Liu, T. Y. and Abbatt, J. P. D.: An Experimental Assessment of the Importance of S(IV) Oxidation by Hypohalous Acids in the Marine Atmosphere, Geophys. Res. Lett., 47, e2019GL086465, https://doi.org/10.1029/2019GL086465, 2020.
Lobert, J. M., Keene, W. C., Logan, J. A., and Yevich, R.: Global chlorine emissions from biomass burning: Reactive Chlorine Emissions Inventory, J. Geophys. Res.-Atmos., 104, 8373–8389, https://doi.org/10.1029/1998JD100077, 1999.
Long, M. S., Keene, W. C., Easter, R. C., Sander, R., Liu, X., Kerkweg, A., and Erickson, D.: Sensitivity of tropospheric chemical composition to halogen-radical chemistry using a fully coupled size-resolved multiphase chemistry–global climate system: halogen distributions, aerosol composition, and sensitivity of climate-relevant gases, Atmos. Chem. Phys., 14, 3397–3425, https://doi.org/10.5194/acp-14-3397-2014, 2014.
MacDonald, S. M., Gómez Martín, J. C., Chance, R., Warriner, S., Saiz-Lopez, A., Carpenter, L. J., and Plane, J. M. C.: A laboratory characterisation of inorganic iodine emissions from the sea surface: dependence on oceanic variables and parameterisation for global modelling, Atmos. Chem. Phys., 14, 5841–5852, https://doi.org/10.5194/acp-14-5841-2014, 2014.
Mahajan, A. S., Plane, J. M. C., Oetjen, H., Mendes, L., Saunders, R. W., Saiz-Lopez, A., Jones, C. E., Carpenter, L. J., and McFiggans, G. B.: Measurement and modelling of tropospheric reactive halogen species over the tropical Atlantic Ocean, Atmos. Chem. Phys., 10, 4611–4624, https://doi.org/10.5194/acp-10-4611-2010, 2010.
Mahajan, A. S., Gómez Martín, J. C., Hay, T. D., Royer, S.-J., Yvon-Lewis, S., Liu, Y., Hu, L., Prados-Roman, C., Ordóñez, C., Plane, J. M. C., and Saiz-Lopez, A.: Latitudinal distribution of reactive iodine in the Eastern Pacific and its link to open ocean sources, Atmos. Chem. Phys., 12, 11609–11617, https://doi.org/10.5194/acp-12-11609-2012, 2012.
Martin, M., Pöhler, D., Seitz, K., Sinreich, R., and Platt, U.: BrO measurements over the Eastern North-Atlantic, Atmos. Chem. Phys., 9, 9545–9554, https://doi.org/10.5194/acp-9-9545-2009, 2009.
McCulloch, A., Aucott, M. L., Benkovitz, C. M., Graedel, T. E., Kleiman, G., Midgley, P. M., and Li, Y.-F.: Global emissions of hydrogen chloride and chloromethane from coal combustion, incineration and industrial activities: Reactive Chlorine Emissions Inventory, J. Geophys. Res.-Atmos., 104, 8391–8403, https://doi.org/10.1029/1999jd900025, 1999.
McDuffie, E. E., Fibiger, D. L., Dubé, W. P., Lopez-Hilfiker, F., Lee, B. H., Thornton, J. A., Shah, V., Jaeglé, L., Guo, H., Weber, R. J., Michael Reeves, J., Weinheimer, A. J., Schroder, J. C., Campuzano-Jost, P., Jimenez, J. L., Dibb, J. E., Veres, P., Ebben, C., Sparks, T. L., Wooldridge, P. J., Cohen, R. C., Hornbrook, R. S., Apel, E. C., Campos, T., Hall, S. R., Ullmann, K., and Brown, S. S.: Heterogeneous N2O5 Uptake During Winter: Aircraft Measurements During the 2015 WINTER Campaign and Critical Evaluation of Current Parameterizations, J. Geophys. Res.-Atmos., 123, 4345–4372, https://doi.org/10.1002/2018JD028336, 2018a.
McDuffie, E. E., Fibiger, D. L., Dubé, W. P., Lopez Hilfiker, F., Lee, B. H., Jaeglé, L., Guo, H., Weber, R. J., Reeves, J. M., Weinheimer, A. J., Schroder, J. C., Campuzano-Jost, P., Jimenez, J. L., Dibb, J. E., Veres, P., Ebben, C., Sparks, T. L., Wooldridge, P. J., Cohen, R. C., Campos, T., Hall, S. R., Ullmann, K., Roberts, J. M., Thornton, J. A., and Brown, S. S.: ClNO2 Yields From Aircraft Measurements During the 2015 WINTER Campaign and Critical Evaluation of the Current Parameterization, J. Geophys. Res.-Atmos., 123, 12994–13015, https://doi.org/10.1029/2018jd029358, 2018b.
Meinshausen, M., Vogel, E., Nauels, A., Lorbacher, K., Meinshausen, N., Etheridge, D. M., Fraser, P. J., Montzka, S. A., Rayner, P. J., Trudinger, C. M., Krummel, P. B., Beyerle, U., Canadell, J. G., Daniel, J. S., Enting, I. G., Law, R. M., Lunder, C. R., O'Doherty, S., Prinn, R. G., Reimann, S., Rubino, M., Velders, G. J. M., Vollmer, M. K., Wang, R. H. J., and Weiss, R.: Historical greenhouse gas concentrations for climate modelling (CMIP6), Geosci. Model Dev., 10, 2057–2116, https://doi.org/10.5194/gmd-10-2057-2017, 2017.
Mielke, L. H., Stutz, J., Tsai, C., Hurlock, S. C., Roberts, J. M., Veres, P. R., Froyd, K. D., Hayes, P. L., Cubison, M. J., Jimenez, J. L., Washenfelder, R. A., Young, C. J., Gilman, J. B., de Gouw, J. A., Flynn, J. H., Grossberg, N., Lefer, B. L., Liu, J., Weber, R. J., and Osthoff, H. D.: Heterogeneous formation of nitryl chloride and its role as a nocturnal NOx reservoir species during CalNex-LA 2010, J. Geophys. Res.-Atmos., 118, 10638–10652, https://doi.org/10.1002/jgrd.50783, 2013.
Moch, J. M., Dovrou, E., Mickley, L. J., Keutsch, F. N., Liu, Z., Wang, Y., Dombek, T. L., Kuwata, M., Budisulistiorini, S. H., Yang, L., Decesari, S., Paglione, M., Alexander, B., Shao, J., Munger, J. W., and Jacob, D. J.: Global Importance of Hydroxymethanesulfonate in Ambient Particulate Matter: Implications for Air Quality, J. Geophys. Res.-Atmos., 125, e2020JD032706, https://doi.org/10.1029/2020jd032706, 2020.
Neuman, J. A., Nowak, J. B., Huey, L. G., Burkholder, J. B., Dibb, J. E., Holloway, J. S., Liao, J., Peischl, J., Roberts, J. M., Ryerson, T. B., Scheuer, E., Stark, H., Stickel, R. E., Tanner, D. J., and Weinheimer, A.: Bromine measurements in ozone depleted air over the Arctic Ocean, Atmos. Chem. Phys., 10, 6503–6514, https://doi.org/10.5194/acp-10-6503-2010, 2010.
Newberg, J. T., Matthew, B. M., and Anastasio, C.: Chloride and bromide depletions in sea-salt particles over the northeastern Pacific Ocean, J. Geophys. Res., 110, D06209, https://doi.org/10.1029/2004JD005446, 2005.
Ordóñez, C., Lamarque, J.-F., Tilmes, S., Kinnison, D. E., Atlas, E. L., Blake, D. R., Sousa Santos, G., Brasseur, G., and Saiz-Lopez, A.: Bromine and iodine chemistry in a global chemistry-climate model: description and evaluation of very short-lived oceanic sources, Atmos. Chem. Phys., 12, 1423–1447, https://doi.org/10.5194/acp-12-1423-2012, 2012.
Osthoff, H. D., Roberts, J. M., Ravishankara, A. R., Williams, E. J., Lerner, B. M., Sommariva, R., Bates, T. S., Coffman, D., Quinn, P. K., Dibb, J. E., Stark, H., Burkholder, J. B., Talukdar, R. K., Meagher, J., Fehsenfeld, F. C., and Brown, S. S.: High levels of nitryl chloride in the polluted subtropical marine boundary layer, Nat. Geosci., 1, 324–328, https://doi.org/10.1038/ngeo177, 2008.
Parrella, J. P., Jacob, D. J., Liang, Q., Zhang, Y., Mickley, L. J., Miller, B., Evans, M. J., Yang, X., Pyle, J. A., Theys, N., and Van Roozendael, M.: Tropospheric bromine chemistry: implications for present and pre-industrial ozone and mercury, Atmos. Chem. Phys., 12, 6723–6740, https://doi.org/10.5194/acp-12-6723-2012, 2012.
Peng, X., Wang, W., Xia, M., Chen, H., Ravishankara, A. R., Li, Q., Saiz-Lopez, A., Liu, P., Zhang, F., Zhang, C., and Xue, L.: An unexpected large continental source of reactive bromine and chlorine with significant impact on wintertime air quality, Natl. Sci. Rev., 8, nwaa304, https://doi.org/10.1093/nsr/nwaa304, 2020.
Phillips, G. J., Tang, M. J., Thieser, J., Brickwedde, B., Schuster, G., Bohn, B., Lelieveld, J., and Crowley, J. N.: Significant concentrations of nitryl chloride observed in rural continental Europe associated with the influence of sea salt chloride and anthropogenic emissions, Geophys. Res. Lett., 39, L10811, https://doi.org/10.1029/2012gl051912, 2012.
Platt, U. and Hönninger, G.: The role of halogen species in the troposphere, Chemosphere, 52, 325–338, https://doi.org/10.1016/S0045-6535(03)00216-9, 2003.
Prados-Roman, C., Cuevas, C. A., Hay, T., Fernandez, R. P., Mahajan, A. S., Royer, S.-J., Galí, M., Simó, R., Dachs, J., Großmann, K., Kinnison, D. E., Lamarque, J.-F., and Saiz-Lopez, A.: Iodine oxide in the global marine boundary layer, Atmos. Chem. Phys., 15, 583–593, https://doi.org/10.5194/acp-15-583-2015, 2015.
Priestley, M., le Breton, M., Bannan, T. J., Worrall, S. D., Bacak, A., Smedley, A. R. D., Reyes-Villegas, E., Mehra, A., Allan, J., Webb, A. R., Shallcross, D. E., Coe, H., and Percival, C. J.: Observations of organic and inorganic chlorinated compounds and their contribution to chlorine radical concentrations in an urban environment in northern Europe during the wintertime, Atmos. Chem. Phys., 18, 13481–13493, https://doi.org/10.5194/acp-18-13481-2018, 2018.
Read, K. A., Mahajan, A. S., Carpenter, L. J., Evans, M. J., Faria, B. V. E., Heard, D. E., Hopkins, J. R., Lee, J. D., Moller, S. J., Lewis, A. C., Mendes, L., McQuaid, J. B., Oetjen, H., Saiz-Lopez, A., Pilling, M. J., and Plane, J. M. C.: Extensive halogen-mediated ozone destruction over the tropical Atlantic Ocean, Nature, 453, 1232–1235, https://doi.org/10.1038/nature07035, 2008.
Riedel, T. P., Wagner, N. L., Dubé, W. P., Middlebrook, A. M., Young, C. J., Öztürk, F., Bahreini, R., VandenBoer, T. C., Wolfe, D. E., Williams, E. J., Roberts, J. M., Brown, S. S., and Thornton, J. A.: Chlorine activation within urban or power plant plumes: Vertically resolved ClNO2 and Cl2 measurements from a tall tower in a polluted continental setting, J. Geophys. Res.-Atmos., 118, 8702–8715, https://doi.org/10.1002/jgrd.50637, 2013.
Roberts, J. M., Osthoff, H. D., Brown, S. S., and Ravishankara, A. R.: N2O5 Oxidizes Chloride to Cl2 in Acidic Atmospheric Aerosol, Science, 321, 1059–1059, https://doi.org/10.1126/science.1158777, 2008.
Roberts, T. J., Jourdain, L., Griffiths, P. T., and Pirre, M.: Re-evaluating the reactive uptake of HOBr in the troposphere with implications for the marine boundary layer and volcanic plumes, Atmos. Chem. Phys., 14, 11185–11199, https://doi.org/10.5194/acp-14-11185-2014, 2014.
Saiz-Lopez, A. and von Glasow, R.: Reactive halogen chemistry in the troposphere, Chem. Soc. Rev., 41, 6448–6472, https://doi.org/10.1039/c2cs35208g, 2012.
Saiz-Lopez, A., Plane, J. M. C., and Shillito, J. A.: Bromine oxide in the mid-latitude marine boundary layer, Geophys. Res. Lett., 31, L03111, https://doi.org/10.1029/2003GL018956, 2004.
Saiz-Lopez, A., Shillito, J. A., Coe, H., and Plane, J. M. C.: Measurements and modelling of I2, IO, OIO, BrO and NO3 in the mid-latitude marine boundary layer, Atmos. Chem. Phys., 6, 1513–1528, https://doi.org/10.5194/acp-6-1513-2006, 2006.
Sander, R.: Compilation of Henry's law constants (version 4.0) for water as solvent, Atmos. Chem. Phys., 15, 4399–4981, https://doi.org/10.5194/acp-15-4399-2015, 2015.
Sander, R., Keene, W. C., Pszenny, A. A. P., Arimoto, R., Ayers, G. P., Baboukas, E., Cainey, J. M., Crutzen, P. J., Duce, R. A., Hönninger, G., Huebert, B. J., Maenhaut, W., Mihalopoulos, N., Turekian, V. C., and Van Dingenen, R.: Inorganic bromine in the marine boundary layer: a critical review, Atmos. Chem. Phys., 3, 1301–1336, https://doi.org/10.5194/acp-3-1301-2003, 2003.
Sander, R., Pszenny, A. A. P., Keene, W. C., Crete, E., Deegan, B., Long, M. S., Maben, J. R., and Young, A. H.: Gas phase acid, ammonia and aerosol ionic and trace element concentrations at Cape Verde during the Reactive Halogens in the Marine Boundary Layer (RHaMBLe) 2007 intensive sampling period, Earth Syst. Sci. Data, 5, 385–392, https://doi.org/10.5194/essd-5-385-2013, 2013.
Sanhueza, E. and Garaboto, A.: Gaseous HCl at a remote tropical continental site, Tellus B, 54, 412–415, https://doi.org/10.3402/tellusb.v54i4.16675, 2002.
Schmidt, J. A., Jacob, D. J., Horowitz, H. M., Hu, L., Sherwen, T., Evans, M. J., Liang, Q., Suleiman, R. M., Oram, D. E., Le Breton, M., Percival, C. J., Wang, S., Dix, B., and Volkamer, R.: Modeling the observed tropospheric BrO background: Importance of multiphase chemistry and implications for ozone, OH, and mercury, J. Geophys. Res.-Atmos., 121, 11819–11835, https://doi.org/10.1002/2015jd024229, 2016.
Schmitt, C. G. and Heymsfield, A. J.: Total Surface Area Estimates for Individual Ice Particles and Particle Populations, J. Appl. Meteorol., 44, 467–474, https://doi.org/10.1175/jam2209.1, 2005.
Shah, V., Jacob, D. J., Moch, J. M., Wang, X., and Zhai, S.: Global modeling of cloud water acidity, precipitation acidity, and acid inputs to ecosystems, Atmos. Chem. Phys., 20, 12223–12245, https://doi.org/10.5194/acp-20-12223-2020, 2020.
Shah, V., Jacob, D. J., Thackray, C. P., Wang, X., Sunderland, E. M., Dibb, J. E., Saiz-Lopez, A., Černušák, I., Kellö, V., Castro, P. J., Wu, R., and Wang, C.: Improved mechanistic model of the atmospheric redox chemistry of mercury, Environ. Sci. Technol., submitted, 2021.
Sherwen, T., Evans, M. J., Carpenter, L. J., Andrews, S. J., Lidster, R. T., Dix, B., Koenig, T. K., Sinreich, R., Ortega, I., Volkamer, R., Saiz-Lopez, A., Prados-Roman, C., Mahajan, A. S., and Ordóñez, C.: Iodine's impact on tropospheric oxidants: a global model study in GEOS-Chem, Atmos. Chem. Phys., 16, 1161–1186, https://doi.org/10.5194/acp-16-1161-2016, 2016a.
Sherwen, T., Schmidt, J. A., Evans, M. J., Carpenter, L. J., Großmann, K., Eastham, S. D., Jacob, D. J., Dix, B., Koenig, T. K., Sinreich, R., Ortega, I., Volkamer, R., Saiz-Lopez, A., Prados-Roman, C., Mahajan, A. S., and Ordóñez, C.: Global impacts of tropospheric halogens (Cl, Br, I) on oxidants and composition in GEOS-Chem, Atmos. Chem. Phys., 16, 12239–12271, https://doi.org/10.5194/acp-16-12239-2016, 2016b.
Sherwen, T., Evans, M. J., Sommariva, R., Hollis, L. D. J., Ball, S. M., Monks, P. S., Reed, C., Carpenter, L. J., Lee, J. D., Forster, G., Bandy, B., Reeves, C. E., and Bloss, W. J.: Effects of halogens on European air-quality, Faraday Discuss., 200, 75–100, https://doi.org/10.1039/c7fd00026j, 2017.
Simpson, W. R., Brown, S. S., Saiz-Lopez, A., Thornton, J. A., and Glasow, R.: Tropospheric halogen chemistry: sources, cycling, and impacts, Chem. Rev., 115, 4035–4062, https://doi.org/10.1021/cr5006638, 2015.
Singh, H. B., Thakur, A. N., Chen, Y. E., and Kanakidou, M.: Tetrachloroethylene as an indicator of low Cl atom concentrations in the troposphere, Geophys. Res. Lett., 23, 1529–1532, https://doi.org/10.1029/96gl01368, 1996.
Sommariva, R., Hollis, L. D. J., Sherwen, T., Baker, A. R., Ball, S. M., Bandy, B. J., Bell, T. G., Chowdhury, M. N., Cordell, R. L., Evans, M. J., Lee, J. D., Reed, C., Reeves, C. E., Roberts, J. M., Yang, M., and Monks, P. S.: Seasonal and geographical variability of nitryl chloride and its precursors in Northern Europe, Atmos. Sci. Lett., 19, e844, https://doi.org/10.1002/asl.844, 2018.
Stachnik, R. A., Millán, L., Jarnot, R., Monroe, R., McLinden, C., Kühl, S., Puķīte, J., Shiotani, M., Suzuki, M., Kasai, Y., Goutail, F., Pommereau, J. P., Dorf, M., and Pfeilsticker, K.: Stratospheric BrO abundance measured by a balloon-borne submillimeterwave radiometer, Atmos. Chem. Phys., 13, 3307–3319, https://doi.org/10.5194/acp-13-3307-2013, 2013.
Tham, Y. J., Wang, Z., Li, Q., Yun, H., Wang, W., Wang, X., Xue, L., Lu, K., Ma, N., Bohn, B., Li, X., Kecorius, S., Größ, J., Shao, M., Wiedensohler, A., Zhang, Y., and Wang, T.: Significant concentrations of nitryl chloride sustained in the morning: investigations of the causes and impacts on ozone production in a polluted region of northern China, Atmos. Chem. Phys., 16, 14959–14977, https://doi.org/10.5194/acp-16-14959-2016, 2016.
Thornton, J. A., Kercher, J. P., Riedel, T. P., Wagner, N. L., Cozic, J., Holloway, J. S., Dubé, W. P., Wolfe, G. M., Quinn, P. K., Middlebrook, A. M., Alexander, B., and Brown, S. S.: A large atomic chlorine source inferred from mid-continental reactive nitrogen chemistry, Nature, 464, 271, https://doi.org/10.1038/nature08905, 2010.
Troy, R. C. and Margerum, D. W.: Non-metal redox kinetics: hypobromite and hypobromous acid reactions with iodide and with sulfite and the hydrolysis of bromosulfate, Inorg. Chem., 30, 3538–3543, https://doi.org/10.1021/ic00018a028, 1991.
UCAR/NCAR – Earth Observing Laboratory: UW-High Resolution Time of Flight Mass Spectrometer – CIMS1, Version 1.1, UCAR/NCAR – Earth Observing Laboratory, [data set], https://doi.org/10.5065/D6RF5S6B, 2016.
van der Werf, G. R., Randerson, J. T., Giglio, L., van Leeuwen, T. T., Chen, Y., Rogers, B. M., Mu, M., van Marle, M. J. E., Morton, D. C., Collatz, G. J., Yokelson, R. J., and Kasibhatla, P. S.: Global fire emissions estimates during 1997–2016, Earth Syst. Sci. Data, 9, 697–720, https://doi.org/10.5194/essd-9-697-2017, 2017.
Veres, P. R., Neuman, J. A., and Ryerson, T. B.: ATom: L2 Measurements from the NOAA ToF Chemical Ionization Mass Spectrometer (CIMS), ORNL Distributed Active Archive Center [data set], https://doi.org/10.3334/ORNLDAAC/1745, 2019.
Volkamer, R. and Dix, B.: GV AMAX-DOAS Data, Version 5.0, UCAR/NCAR – Earth Observing Laboratory, available at: https://data.eol.ucar.edu/dataset/352.082 (last access: 12 September 2021). 2017.
Volkamer, R., Coburn, S., Dix, B., and Sinreich, R.: The Eastern Pacific Ocean is a source for short lived atmospheric gases: Glyoxal and Iodine Oxide, CLIVAR Exchanges, 53, 15, 30–33, 2010.
Volkamer, R., Koenig, T., Baidar, S., and Dix, B.: Airborne Multi-AXis Differential Optical Absorption Spectroscopy (AMAX-DOAS) Data, Version 2.0, UCAR/NCAR – Earth Observing Laboratory [data set], https://doi.org/10.5065/D6F769MF, 2020.
Volkamer, R., Baidar, S., Campos, T. L., Coburn, S., DiGangi, J. P., Dix, B., Eloranta, E. W., Koenig, T. K., Morley, B., Ortega, I., Pierce, B. R., Reeves, M., Sinreich, R., Wang, S., Zondlo, M. A., and Romashkin, P. A.: Aircraft measurements of BrO, IO, glyoxal, NO2, H2O, O2–O2 and aerosol extinction profiles in the tropics: comparison with aircraft-/ship-based in situ and lidar measurements, Atmos. Meas. Tech., 8, 2121–2148, https://doi.org/10.5194/amt-8-2121-2015, 2015.
von Glasow, R., von Kuhlmann, R., Lawrence, M. G., Platt, U., and Crutzen, P. J.: Impact of reactive bromine chemistry in the troposphere, Atmos. Chem. Phys., 4, 2481–2497, https://doi.org/10.5194/acp-4-2481-2004, 2004.
Wang, S.-Y., Schmidt, J., Baidar, S., Coburn, S., Dix, B., Koenig, T., Apel, E., Bowdalo, D., Campos, T., Eloranta, E., Evans, M., DiGangii, J., Zondlo, M., Gao, R.-S., Haggerty, J., Hall, S., Hornbrook, R., Jacob, D., Morley, B., Pierce, B., Reeves, M., Romashkin, P., ter Schure, A., and Volkamer, R.: Active and widespread halogen chemistry in the tropical and subtropical free troposphere, P. Natl. Acad. Sci. USA, 112, 9281–9286, https://doi.org/10.1073/pnas.1505142112, 2015.
Wang, T., Tham, Y. J., Xue, L., Li, Q., Zha, Q., Wang, Z., Poon, S. C., Dubé, W. P., Blake, D. R., Louie, P. K., and Luk, C. W.: Observations of nitryl chloride and modeling its source and effect on ozone in the planetary boundary layer of southern China, J. Geophys. Res.-Atmos., 121, 2476–2489, 2016.
Wang, X., Jacob, D. J., Eastham, S. D., Sulprizio, M. P., Zhu, L., Chen, Q., Alexander, B., Sherwen, T., Evans, M. J., Lee, B. H., Haskins, J. D., Lopez-Hilfiker, F. D., Thornton, J. A., Huey, G. L., and Liao, H.: The role of chlorine in global tropospheric chemistry, Atmos. Chem. Phys., 19, 3981–4003, https://doi.org/10.5194/acp-19-3981-2019, 2019.
Wang, X., Jacob, D. J., Fu, X., Wang, T., Breton, M. L., Hallquist, M., Liu, Z., McDuffie, E. E., and Liao, H.: Effects of Anthropogenic Chlorine on PM2.5 and Ozone Air Quality in China, Environ. Sci. Technol., 54, 9908–9916, https://doi.org/10.1021/acs.est.0c02296, 2020.
Werner, B., Stutz, J., Spolaor, M., Scalone, L., Raecke, R., Festa, J., Colosimo, S. F., Cheung, R., Tsai, C., Hossaini, R., Chipperfield, M. P., Taverna, G. S., Feng, W., Elkins, J. W., Fahey, D. W., Gao, R.-S., Hintsa, E. J., Thornberry, T. D., Moore, F. L., Navarro, M. A., Atlas, E., Daube, B. C., Pittman, J., Wofsy, S., and Pfeilsticker, K.: Probing the subtropical lowermost stratosphere and the tropical upper troposphere and tropopause layer for inorganic bromine, Atmos. Chem. Phys., 17, 1161–1186, https://doi.org/10.5194/acp-17-1161-2017, 2017.
Wofsy, S. C. and ATom Science Team: ATom: Aircraft Flight Track and Navigational Data, ORNL Distributed Active Archive Center [data set], https://doi.org/10.3334/ORNLDAAC/1613, 2018.
Yang, X., Cox, R. A., Warwick, N. J., Pyle, J. A., Carver, G. D., O'Connor, F. M., and Savage, N. H.: Tropospheric bromine chemistry and its impacts on ozone: A model study, J. Geophys. Res., 110, D23311, https://doi.org/10.1029/2005jd006244, 2005.
Yantosca, B., Sulprizio, M., Lundgren, L., kelvinhb, 22degrees, Ridley, D., Eastham, S. D., Pound, R., Sherwen, T., Lin, H., Fisher, J., Downs, W., Thackray, C., michael-s-long, Holmes, C., GanLuo, Zhuang, J.,SpaceMouse, Bindle, L., Murray, L., noelleselin, xin-chen-github, emily-ramnarine, gianga, Zhu, L., Yao, F., Fite, C., Song, S., and zsx-GitHuband ayhwong: geoschem/geos-chem: GEOS-Chem 12.9.0 (12.9.0), Zenodo [code], https://doi.org/10.5281/zenodo.3950327, 2020.
Yun, H., Wang, W., Wang, T., Xia, M., Yu, C., Wang, Z., Poon, S. C. N., Yue, D., and Zhou, Y.: Nitrate formation from heterogeneous uptake of dinitrogen pentoxide during a severe winter haze in southern China, Atmos. Chem. Phys., 18, 17515–17527, https://doi.org/10.5194/acp-18-17515-2018, 2018.
Zhai, S., Wang, X., McConnell, J. R., Geng, L., Cole-Dai, J., Sigl, M., Chellman, N., Sherwen, T., Pound, R., Fujita, K., Hattori, S., Moch, J. M., Zhu, L., Evans, M., Legrand, M., Liu, P., Pasteris, D., Chan, Y. C., Murray, L. T., and Alexander, B.: Anthropogenic Impacts on Tropospheric Reactive Chlorine Since the Preindustrial, Geophys. Res. Lett., 48, e2021GL093808, https://doi.org/10.1029/2021gl093808, 2021.
Zhou, W., Zhao, J., Ouyang, B., Mehra, A., Xu, W., Wang, Y., Bannan, T. J., Worrall, S. D., Priestley, M., Bacak, A., Chen, Q., Xie, C., Wang, Q., Wang, J., Du, W., Zhang, Y., Ge, X., Ye, P., Lee, J. D., Fu, P., Wang, Z., Worsnop, D., Jones, R., Percival, C. J., Coe, H., and Sun, Y.: Production of N2O5 and ClNO2 in summer in urban Beijing, China, Atmos. Chem. Phys., 18, 11581–11597, https://doi.org/10.5194/acp-18-11581-2018, 2018.
Zhu, L., Jacob, D. J., Eastham, S. D., Sulprizio, M. P., Wang, X., Sherwen, T., Evans, M. J., Chen, Q., Alexander, B., Koenig, T. K., Volkamer, R., Huey, L. G., Le Breton, M., Bannan, T. J., and Percival, C. J.: Effect of sea salt aerosol on tropospheric bromine chemistry, Atmos. Chem. Phys., 19, 6497–6507, https://doi.org/10.5194/acp-19-6497-2019, 2019.
- Abstract
- Introduction
- Tropospheric halogen chemistry in GEOS-Chem
- Global budget and distribution of tropospheric halogens
- Comparison to observations
- Global implications for tropospheric oxidant chemistry
- Conclusions
- Data availability
- Author contributions
- Competing interests
- Disclaimer
- Acknowledgements
- Financial support
- Review statement
- References
- Supplement