the Creative Commons Attribution 4.0 License.
the Creative Commons Attribution 4.0 License.
 | 08 Sep 2021
Dynamics of gaseous oxidized mercury at Villum Research Station during the High Arctic summer
Bjarne Jensen
Andreas Massling
Daniel Charles Thomas
Henrik Skov
While much research has been devoted to the subject of gaseous elemental mercury (GEM) and gaseous oxidized mercury (GOM) in the Arctic spring during atmospheric mercury depletion events, few studies have examined the behavior of GOM in the High Arctic summer. GOM, once deposited and incorporated into the ecosystem, can pose a threat to human and wildlife health, though there remain large uncertainties regarding the transformation, deposition, and assimilation of mercury into the food web. Therefore, to further our understanding of the dynamics of GOM in the High Arctic during the late summer, we performed measurements of GEM and GOM, along with meteorological parameters and atmospheric constituents, and utilized modeled air mass history during two summer campaigns in 2019 and 2020 at Villum Research Station (Villum) in northeastern Greenland. Seven events of enhanced GOM concentrations were identified and investigated in greater detail. In general, the common factors associated with event periods at ground level were higher levels of radiation and lower H2O mixing ratios, accumulated precipitation, and relative humidity (RH), although none were connected with cold temperatures. Non-event periods at ground level each displayed a different pattern in one or more parameters when compared to event periods. Generally, air masses during event periods for both campaigns were colder and drier, arrived from higher altitudes, and spent more time above the mixed layer and less time in a cloud compared to non-events, although some events deviated from this general pattern. Non-event air masses displayed a different pattern in one or more parameters when compared to event periods, although they were generally warmer and wetter and arrived from lower altitudes with little radiation. Coarse-mode aerosols were hypothesized to provide the heterogenous surface for halogen propagation during some of the events, while for others the source is unknown. While these general patterns were observed for event and non-event periods, analysis of individual events showed more specific origins. Five of the seven events were associated with air masses that experienced similar conditions: transported from the cold, dry, and sunlit free troposphere. However, two events experienced contrasting conditions, with air masses being warm and wet with surface layer contact under little radiation. Two episodes of extremely high levels of NCoarse and BC, which appear to originate from flaring emissions in Russia, did not contribute to enhanced GOM levels. This work aims to provide a better understanding of the dynamics of GOM during the High Arctic summer.
- Article
(5360 KB) - Full-text XML
-
Supplement
(10551 KB) - BibTeX
- EndNote


Gaseous elemental mercury (Hg0 or GEM) is a ubiquitous pollutant in the atmosphere due to its long relaxation time (6 to 12 months; relaxation time refers to the time delay between emission reductions and effect on ambient concentrations), and thus it is subject to long-range transport from source regions to remote environments through deposition and re-emission cycling (Pirrone et al., 2010; Skov et al., 2020). The sources of mercury include anthropogenic emissions, e.g., fossil fuel and biomass combustion and artisanal small-scale gold mines, in addition to natural emissions such as volcanoes, biomass burning, ocean and soil evasion, and re-emission of previously deposited or legacy mercury (AMAP, 2011). In the atmosphere, GEM is oxidized to its divalent form (HgI), commonly known as gaseous oxidized mercury (GOM). GOM has a much shorter residence time than GEM in the atmosphere owing to its higher solubility, lower vapor pressure, and faster deposition velocity (Skov et al., 2006). Mercury can also be present in aerosol particles, referred to as particulate-bound mercury (PHg), either through GOM condensation or through heterogeneous reactions of GEM on aerosol surfaces (Durnford and Dastoor, 2011). In the polar regions, GEM typically dominates the atmospheric distribution throughout the year, with smaller contributions from GOM and PHg. However, during depletion events in the spring, GOM and PHg can constitute large fractions of total atmospheric mercury (Steffen et al., 2014). In contrast to the polar regions, at the midlatitudes (especially at locations close to anthropogenic emission point sources) GOM and PHg can be emitted directly to the atmosphere and represent significant fractions of the atmospheric mercury burden (Muntean et al., 2018).
In locations with elevated reactive halogen concentrations (e.g., polar environments, the marine boundary layer, volcanic plumes, and salt lakes) and especially bromine radicals, GEM is quickly transformed into GOM (Obrist et al., 2010; von Glasow, 2010; Angot et al., 2016; Ye et al., 2016; Wang et al., 2019). In the Arctic, this process manifests as atmospheric mercury depletion events (AMDEs), which occur in spring following polar sunrise and result in the rapid depletion (on the order of hours) of GEM and conversion to GOM (Schroeder et al., 1998; Lindberg et al., 2002; Berg et al., 2003; Skov et al., 2004). In the early spring at Alert, Nunavut, Canada, it has been demonstrated that GOM is converted to PHg (through condensational processes due to the cold temperatures and high aerosol surface area concentration; Freud et al., 2017), while in the late spring oxidized mercury is mainly present as GOM (due to reduced surface area and increased temperatures) (Steffen et al., 2014). Late spring is also the peak of total Hg in surface snow at Alert, Nunavut, Canada, and Utqiaġvik, Alaska, USA (formerly Barrow), indicating that dry deposition of GOM is a major pathway of mercury into the ecosystem (Lu et al., 2001; Lindberg et al., 2002; Steffen et al., 2002, 2014). GEM oxidation has been demonstrated to be initiated via photochemical reactions with the Br radical (R1–R2) through modeling studies (Holmes et al., 2006, 2010; Horowitz et al., 2017), kinetic studies (Donohoue et al., 2006), theoretical studies (Goodsite et al., 2004, 2012; Dibble et al., 2012), and observations (Skov et al., 2004; Stephens et al., 2012; Wang et al., 2019).
where Y could be OH, O3, NO2, HO2, Br, Cl, BrO, ClO, I, and IO (Holmes et al., 2006, 2010; Hynes et al., 2009; Dibble et al., 2012; Jiao and Dibble, 2017a, b). Of which Br, I, and OH have been postulated to be the main species for Y, both globally and in the Arctic (Goodsite et al., 2004, 2012), while NO2, HO2, ClO, or BrO have been demonstrated to be candidates for Y by Dibble et al. (2012). Recently, ozone was proposed to be a missing oxidation pathway of HgBr (Saiz-Lopez et al., 2020). Sources of these reactive halogen species include emissions from sea ice, snowpack, frost flowers, refreezing leads, sea salt aerosol, and labile halogen reservoir species (i.e., halocarbons and inorganic bromine) (Brooks et al., 2006; Kaleschke et al., 2004; Peterson et al., 2018, 2019; Simpson et al., 2015). The exact chemical formulas for GOM and PHg are currently unknown so both species are operationally defined by their detection methods (Landis et al., 2002; Angot et al., 2016), although the development of improved analytical systems for their detection is currently underway (Gustin et al., 2021). Once formed, GOM can either bind to aerosol particles, becoming PHg, or deposit onto the snowpack through dry and wet deposition. The majority of this deposited mercury is photo-reduced and emitted back into the atmosphere (Brooks et al., 2006; Dastoor et al., 2008; Kamp et al., 2018). The snowpack will retain a fraction of this mercury and release it with the ionic pulse during the melt season, introducing mercury into the ecosystem (Lu et al., 2001; Ariya et al., 2004; Durnford and Dastoor, 2011; Douglas et al., 2017). Recently, isotope analysis has revealed GEM uptake by vegetation and soils to be the main source of mercury input to the terrestrial environment in Alaska (Douglas and Blum, 2019; Jiskra et al., 2019), although this process has yet to be confirmed in the High Arctic.
After deposition, GOM can be methylated through biotic and abiotic processes to organic mercury (methylmercury and dimethylmercury) (Macdonald and Loseto, 2010; Møller et al., 2011). Organic mercury is an extremely powerful neurotoxin that bio-accumulates in upper trophic levels and thus poses a threat to ecosystems and human health (especially in indigenous peoples in high latitudes and societies that rely heavily on a seafood diet) (Park and Zheng, 2012). Therefore, as the Arctic becomes more populated and continues to change, it is important to understand mercury oxidation in response to a changing climate, especially in high latitude regions (AMAP, 2011; Durnford and Dastoor, 2011; Stern et al., 2012).
While the majority of GOM formation and deposition occurs in the Arctic during spring, little attention has been given to the behavior of GOM outside of AMDEs. Steen et al. (2011) reported high amounts of GOM (max > 120 pg m−3, mean 8±13 pg m−3) during the summers of 2007 and 2008 at Zeppelin Mountain (79.93∘ N, 11.50∘ E, 474 m a.s.l. – meters above sea level). This study revealed a pattern of GOM previously unknown to the Arctic, with elevated GOM concentrations during the summer, which postulates that GOM deposition occurs outside of AMDEs in the Arctic. They concluded the presence of GOM was of regional origin, as long-range transport of direct emissions from anthropogenic sources was unlikely. Other studies have found contrasting results regarding Arctic GOM concentrations during summer. During a research expedition in the Arctic Ocean in June–August 2004, Aspmo et al. (2006) measured GEM, GOM, and PHg and found increases in GEM over areas with >70 % sea ice concentrations, which were attributed to an enhanced reduction potential and increased evasion of supersaturated dissolved mercury from the ocean through open leads. However, they found lower levels of GOM (<20 pg m−3) and PHg (<10 pg m−3) compared to Steen et al. (2011). Levels of Hg in snow and melt ponds were low (<10 ng L−1), suggesting marginal accumulation of deposited mercury throughout the summer. Concentrations of GEM, GOM, PHg, CO, and ozone were also reported on a research cruise throughout the Arctic basin from July–September 2005 (Sommar et al., 2010). They found low levels of GOM (3.2±1.7 pg m−3) and PHg (1.0±0.7 pg m−3), which were not correlated with GEM, sunlight, or ozone. Steffen et al. (2014) analyzed GOM and PHg at Alert, Nunavut, Canada, from 2002–2011, and they reported median values during July–September of 5.3–7.36 and 1.01–14.78 pg m−3 for PHg and GOM, respectively. The source of GOM during this study was unclear. While these latter studies found relatively low levels of GOM, the presence of GOM at all indicates that mercury oxidation and deposition are occurring outside of AMDEs in the Arctic.
With only limited measurements of GOM performed in the High Arctic summertime, there are many questions still unanswered. The dynamics of GOM in the Arctic are extremely complex; uncertainties in its spatiotemporal variability, annual cycle, and formation mechanisms emphasize the need for further examination. The Arctic region is undergoing rapid changes due to anthropogenic climate change and the dynamics of mercury oxidation are poorly resolved, especially in summer. Understanding these dynamics can offer insight into the general chemistry during Arctic summer and atmospheric mercury will respond to future changes in the Arctic climate. It is also important to understand the changes in mercury concentrations in the Arctic to assess the effects of abatement strategies of the Minamata Convention (UNEP, 2013) globally. This will aid in understanding what the effects of decreasing anthropogenic mercury emissions and global climate change will be on the recycling of mercury between different environmental matrixes and how it is ultimately sequestered.
Here we report measurements of GEM and GOM, outside of AMDEs, during the late summer of 2019 and GEM, GOM, and PHg in the late summer of 2020 at Villum Research Station (Villum). We investigate the levels of GOM in connection with meteorological parameters, ozone, aerosol particle physical properties, and air mass history and examine existing interconnections and dependencies. In the following section, we describe the measurement site, analytical instrumentation, and analysis methods. We will then examine the results of the two campaigns in relation to meteorological parameters, atmospheric constituents, and air mass history. We then discuss the factors influencing event vs. non-event periods as well as individual events. We conclude with a summary and consider the implications for mercury oxidation in a future climate.
2.1 Measurement sites
Measurements were performed at Flyger's hut (81∘36′ N, 16∘40′ W), which is part of Villum (81.6∘ N 16.67∘ W, 24 m a.s.l.) located on the Danish military base Station Nord in northeastern Greenland. Villum and Flyger's hut are both located approx. 2 km to the south of Station Nord, are separated by approx. 200 m distance, and are both upwind > 95 % of the time from local pollution sources at the military base. All times are reported as UTC.
2.2 Atmospheric mercury measurements
In 2019, atmospheric measurements of GEM and GOM at Flyger's hut started on 16 August and ended on 1 September. In 2020, measurements of GEM, GOM, and PHg started on 17 July and ended on 4 August. GEM was analyzed on a 5 min time resolution by a Tekran 2537A vapor-phase analyzer at a flow rate of 1 L min−1. This technique is based on the pre-concentration of GEM on dual gold cartridges followed by thermal desorption in a stream of argon gas and detection by cold vapor atomic fluorescence spectroscopy (CVAFS) at a wavelength of 253.7 nm. Skov et al. (2004) determined a detection limit of 0.1 ng m−3 and a reproducibility of 20 % at a 95 % confidence interval (CI) and above 0.5 ng m−3. The instrument was manually calibrated with injections of a known amount of mercury before and after the campaigns and auto-calibrated in the field every 25 h by an internal permeation source.
GOM and PHg were collected using a Tekran 1130 and 1135 speciation unit, respectively, upstream of the GEM analyzer, at a flow rate of 10 L min−1. GOM was sampled onto potassium chloride (KCl) coated denuders. After sample collection, the denuders were flushed in a stream of zero air supplied from the 1130 pump module, then heated to 500 ∘C during which GOM was thermally decomposed to GEM and detected by the Tekran 2537A analyzer. Denuders were exchanged weekly. PHg was sampled onto quartz filters, thermally released in a stream of zero air at 800 ∘C, and pyrolyzed on quartz chips also at 800 ∘C (for details about denuder and quartz filter performance and coating procedure, see Landis et al., 2002). The cutoff size for PHg was <2.5 µm. For the 2019 campaign, the sampling time4 was 80 min, while for the 2020 campaign the sampling time was 60 min. Due to technical issues during the 2019 campaign, measurements of PHg were not available. The limit of detection (LOD) for both GOM and PHg was calculated as 3 times the standard deviation (SD) of blanks values for the flush cycles, excluding the first measurement in a flush cycle as the heated sampling line still contains ambient air. The LODs for the 2019 and 2020 campaigns were 0.180 and 0.684 pg m−3, respectively. With the KCl denuders being prone to unequal collection efficiencies for different GOM species and artifacts (Gustin et al., 2015) and the internal signal integration routine biassing the concentrations low (Slemr et al., 2016; Ambrose, 2017), the GEM and GOM concentrations are likely a lower limit (Huang and Gustin, 2015; Huang et al., 2017; Marusczak et al., 2017).
2.3 Ancillary measurements
Meteorological parameters including wind speed, wind direction, air temperature, relative humidity, radiation, and snow depth were measured at Villum on a time resolution of 5 min. Ground-level H2O mixing ratios were calculated using ambient temperature, relative humidity (RH), and pressure (Bolton, 1980; Weiss-Penzias et al., 2015). Ozone (O3) was measured at Villum using a photometric O3 analyzer (API M400) at 1 Hz, averaged to a 30 min arithmetic mean. The detection limit was 1 ppbv (parts per billion by volume), with an uncertainty of 3 % for measured concentrations above 10 ppbv and 6 % below, respectively, on a 95 % CI (Nguyen et al., 2016). All measurements used in this study were averaged (median) to correspond temporally to GOM and PHg sampling intervals.
2.4 Particle number size distribution and black carbon
Particle number size distributions (PNSDs) from 0.3 to 10 µm were measured using an optical particle sizer (OPS, TSI 3330) on a 10 min time resolution. This size range is representative of coarse-mode particles and a fraction of accumulation-mode particles. The entire particle size spectrum was integrated to give the coarse-mode particle number concentration (NCoarse). The OPS was located at Villum, and the data were vigorously quality controlled for abnormal instrument diagnostic parameters (RH, flow rate, and temperature) and the influence of local pollution (i.e., vehicles and activities from Station Nord).
Black carbon (BC) concentrations were measured using a MAGEE AE33 aethalometer (Drinovec et al., 2015) at a 1 min time resolution. The instrument is an absorption photometer that continuously collects aerosol particles onto a filter and measures light absorption from the resulting filter spot containing the aerosol particles. The AE33 automatically corrects for filter-loading effects by measuring absorption on a reference filter and operates at seven wavelengths: λ=370, 470, 520, 590, 660, 880, and 950 nm. By using a standard BC mass absorption cross section (MAC) of 7.77 m2 g−1 at 880 nm, these absorption coefficients are converted to equivalent black carbon (eBC) mass concentrations. It has been found that the aethalometer overestimates BC concentrations at Arctic sites compared to co-located absorption photometers (Backman et al., 2017). To account for this, an Arctic harmonization factor was used, adapted from Backman et al. (2017) to suit the newer aethalometer model. This has been widely used for Arctic datasets (Schmeisser et al., 2018; Zanatta et al., 2018; Schacht et al., 2019). Substantial uncertainties may arise from cross-sensitivity to scattering in the instrument, especially for Arctic aerosols, which are typically highly scattering. This uncertainty is estimated to be around 15 % at Villum using typical values of single-scattering albedo (SSA) and previously determined uncertainty studies (Weingartner et al., 2003; Drinovec et al., 2015).
2.5 Air mass history analysis
Air mass history was interrogated by use of the HYSPLIT trajectory model (Draxler and Hess, 1998; Rolph et al., 2017). Air mass back-trajectories of 240 h length were calculated arriving at 50 m a.g.l. (above ground level) for every hour during the two campaigns. The trajectory starting height of 50 m was selected as a compromise between capturing air masses that are representative of our sampling site and avoiding trajectories intercepting the surface, which can produce unrepresentative trajectories (Stohl, 1998); trajectories were also initialized at 20 m, which produced similar trajectory paths but often intercepted the surface. For the 2019 campaign, the mixed layer varied from 25 to 554 m, with a median ± median absolute deviation (m.a.d.) of 74±131 m and a bimodal diurnal profile with minima at night and peaks at 5:00 and 15:00 UTC of ∼80 and ∼85 m. For the 2020 campaign, the mixed layer varied from 25 to 204 m, with a median ± median absolute deviation (m.a.d.) of 34±21 m and a bimodal diurnal profile with minima at night and peaks at 13:00 and 18:00 UTC of ∼40 and ∼50 m. The trajectory length of 240 h was selected to capture the lifetime of GOM in the atmosphere and assess the geographical extent of air masses. Global Data Assimilation System (GDAS) meteorological data on a 1∘ spatial resolution, employing modeled vertical velocity, were used as input for the model. The HYSPLIT model output included meteorological variables along the trajectory path including relative humidity, precipitation, mixed-layer height, and H2O mixing ratio. Precipitation along each trajectory was integrated to calculate the amount of accumulated precipitation. These parameters, along with active fire data, were utilized to inspect the geo-physical history of air masses arriving at Villum during the campaign periods (Greene et al., 2017; Greene, 2020). Active fire data were provided by NASA's Fire Information for Resource Management System (FIRMS), Moderate Resolution Imaging Spectroradiometer (MODIS), and Visible Infrared Imaging Radiometer Suite (VIIRS) (Schroeder et al., 2014).
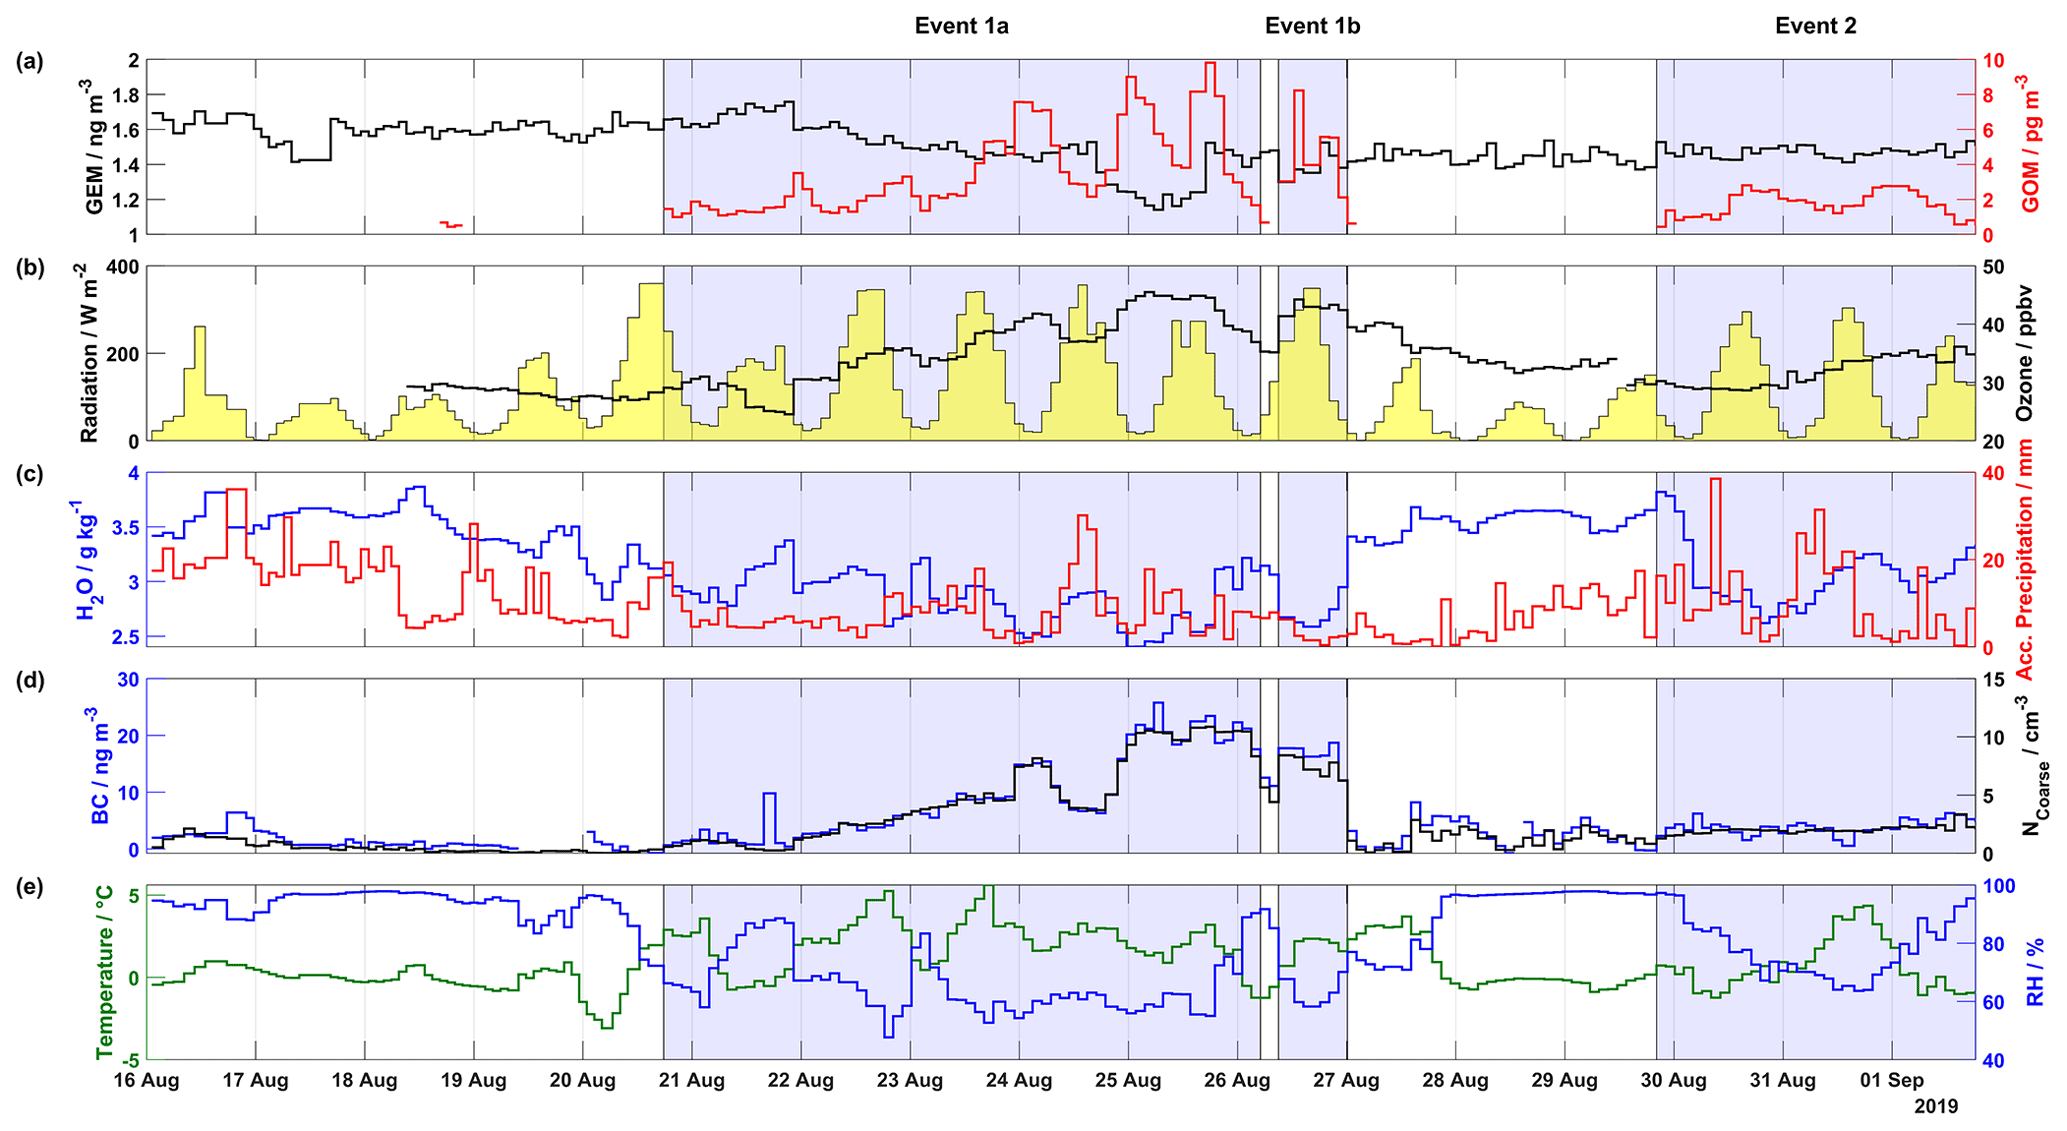
Figure 1Overview of mercury, meteorological parameters, ozone, and aerosol properties (BC and NCoarse) measured during the 2019 campaign, including (a) GEM (ng m−3) in black on the left axis and GOM (pg m−3) in red on the right axis, (b) radiation (W m−2) shaded in yellow on the left axis and ozone (ppbv) in black on the right axis, (c) H2O mixing ratio (g kg−1) at ground level in blue on the left axis and accumulated precipitation (mm) in red on the right axis, (d) BC (ng m−3) in blue on the left axis and NCoarse (cm−3) in black on the right axis, and (d) temperature (∘C) in green on the left axis and relative humidity (%) in blue on the right axis. The areas shaded in blue indicate Events 1a, 1b, and 2.
3.1 Atmospheric mercury and ground-level meteorological parameters
From the two campaigns, seven events of enhanced GOM concentrations were observed: three during the 2019 campaign and four during the 2020 campaign. These events were identified by enhancements of GOM over background levels, meteorological conditions, and air mass classification. Results from the 2019 campaign, describing the time series of atmospheric mercury concentrations, ground-level meteorological parameters (radiation, H2O mixing ratio, temperature, and RH), accumulated precipitation along the trajectory length, ozone, and aerosol properties (BC concentration and NCoarse) are presented in Fig. 1. Wind direction, wind speed, and snow depth are displayed in Fig. S1 in the Supplement. During the 2019 campaign, there were three distinct GOM enhancement events: Event 1a from 20 August at 17:45 UTC to 26 August at 05:00 UTC, Event 1b from 26 August at 09:00 UTC to 27 August at 00:10 UTC, and Event 2 from 29 August at 20:10 UTC to 1 September at 18:20 UTC.
During the first days of Event 1a (21 and 22 August), GEM increased slightly from ∼1.6 to ∼1.7 ng m−3, and then on the night of 22 August GEM suddenly dropped followed by a slow decrease until the afternoon of 24 August when it precipitously decreased, reaching a minimum of 1.1 ng m−3 on the morning of 25 August. GEM then quickly increased back to consistent levels of ∼1.5 ng m−3 for the remainder of the measurement campaign, including Event 1b and 2. For Event 1, GOM gradually increased from zero on the afternoon of 20 August to the night of 24 August, with the highest value (9.81 pg m−3) on 25 August. On the night of 25 August and into the morning of 26 August, GOM quickly decreased from ∼8 pg m−3 to zero, corresponding to a concurrent increase in RH and H2O mixing ratio and a concurrent decrease in temperature. As RH then decreased for Event 1b throughout the day of 26 August, GOM once again increased to levels comparable to those observed on the previous day. A back-trajectory analysis on 26 August revealed that before arrival at Villum air masses traversed the Arctic Ocean, Greenland, then the North Atlantic while experiencing low altitudes 50 h before arrival (Fig. S2). From 27 August to the evening of 29 August, GOM is undetectable, before averaging (median ± m.a.d.) 1.65±0.62 pg m−3 for Event 2.
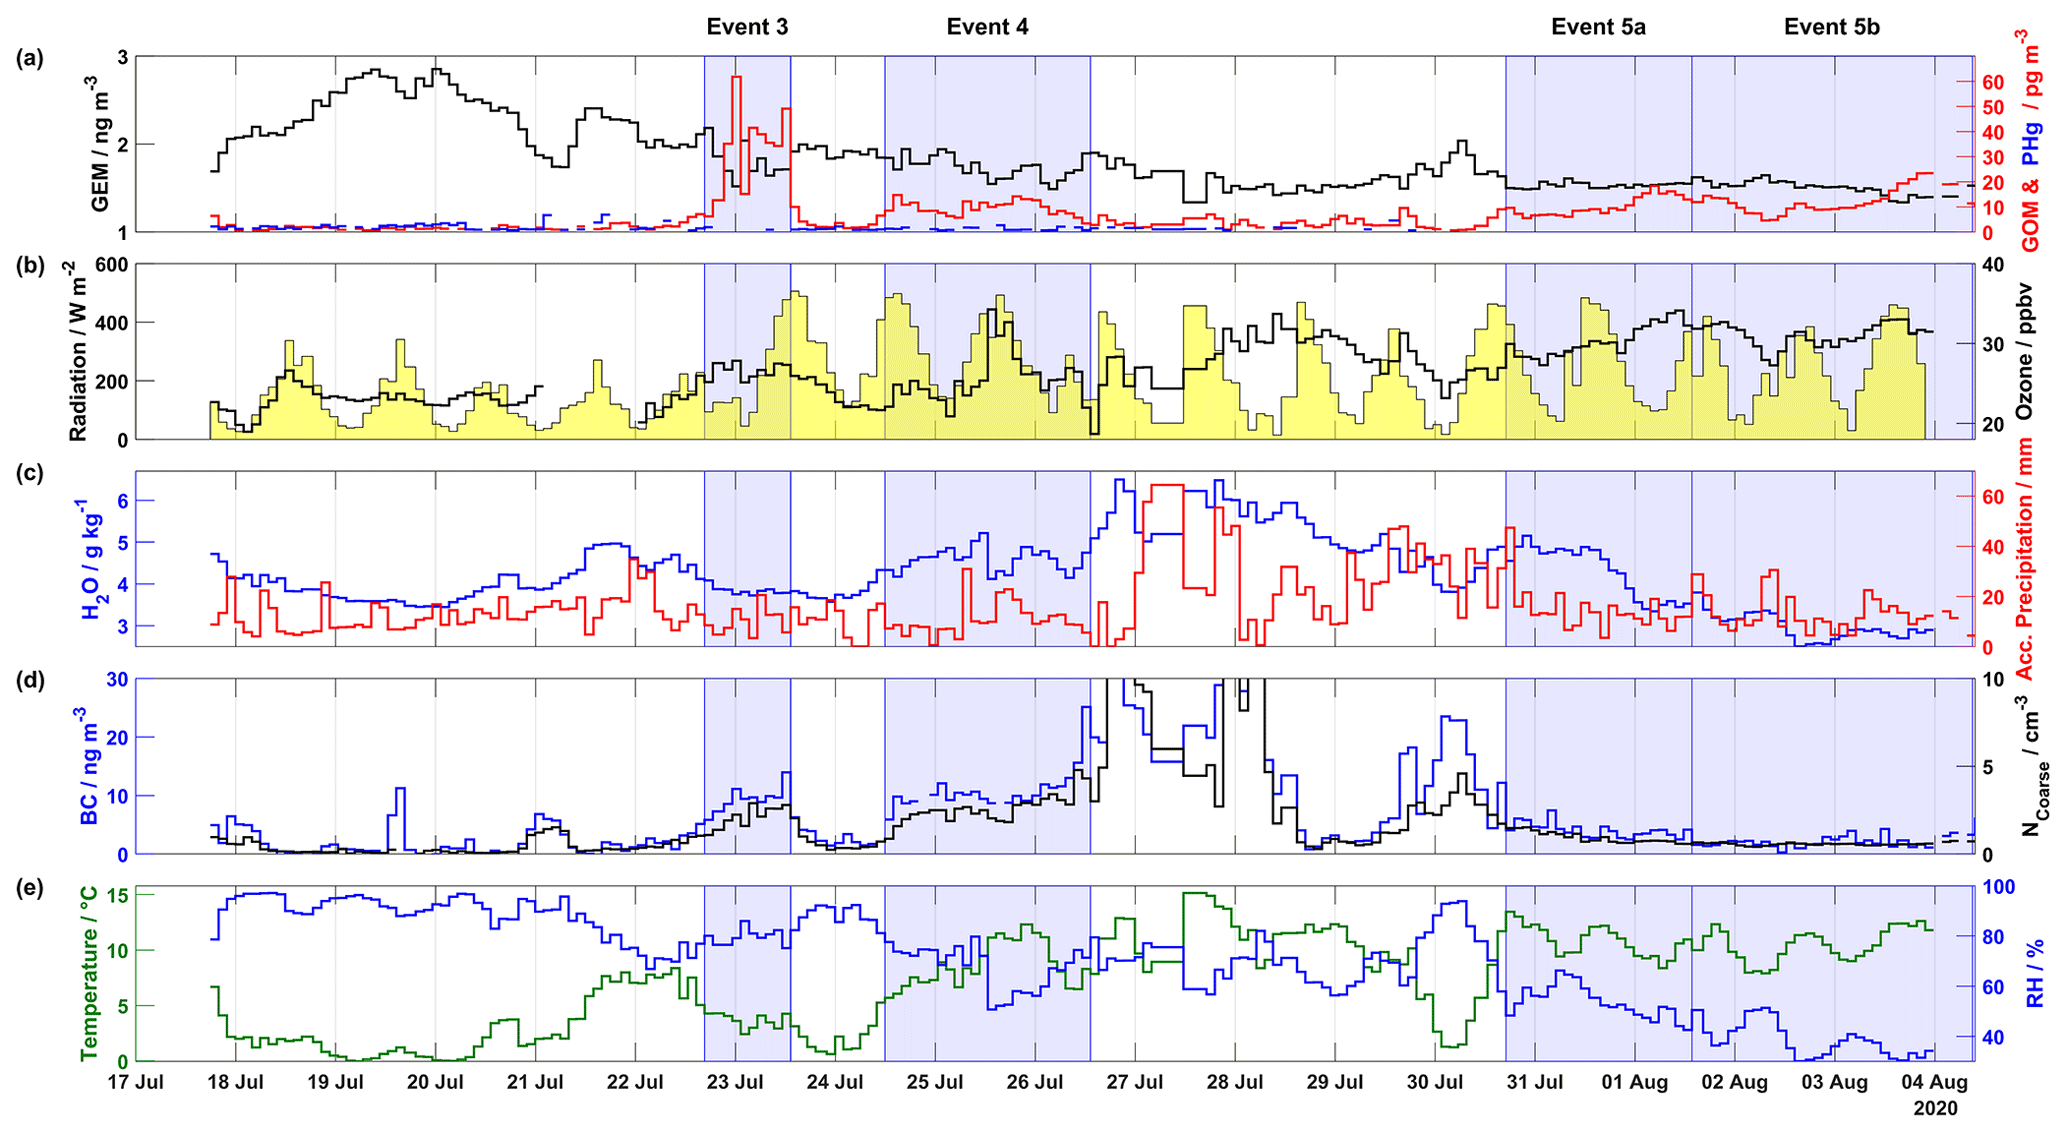
Figure 2Overview of mercury, meteorological parameters, ozone, and aerosol properties (BC and NCoarse) measured during the 2020 campaign, including (a) GEM (ng m−3) in black on the left axis, GOM (pg m−3) in red and PHg (pg m−3) in blue on the right axis, (b) radiation (W m−2) shaded in yellow on the left axis and ozone (ppbv) in black on the right axis, (c) H2O mixing ratio (g kg−1) at ground level in blue on the left axis and accumulated precipitation (mm) in red on the right axis, (d) BC (ng m−3) in blue on the left axis and NCoarse (cm−3) in black on the right axis, and (d) temperature (∘C) in green on the left axis and relative humidity (%) in blue on the right axis. The areas shaded in blue indicate Events 3, 4, 5a, and 5b. The axis scale for (d) is truncated to show the fine structure of BC and NCoarse during event periods; for the full scale see Fig. 7.
Concerning the meteorological parameters for Events 1a, 1b, and 2, the wind direction was mainly from the southwest (Fig. S1), with variable wind speed (3.43±2.02 m s−1, Table S1 in the Supplement). The relative humidity was low (<90 % RH), averaging 67.83±8.53 % RH for the 2019 event periods, with Events 1a and 1b experiencing similar levels ( %, Table S1) and Event 2 higher RHs (76.91±7.82 %. During non-event periods, RH was considerably higher (95.70±1.82 %). The temperature was routinely above freezing, with increased temperature during event periods vs. non-event periods, 1.68±1.23 vs. ∘C, respectively. The skies were clear, with peak solar radiation above 200 W m−2 during event periods. Comparable to RH, H2O mixing ratios and accumulated precipitation were noticeably higher during non-event periods than event periods, with Event 2 experiencing higher values than Events 1a and 1b and the lowest levels of GOM (Table S1). On 23, 24, 30, and 31 August, GOM experienced a reduction in concentration, while accumulated precipitation simultaneously increased. A similar relationship between the H2O mixing ratios and GOM levels is observed during the first part of Event 1a (21 and 22 August) and the aforementioned pattern during the transition of Event 1a to 1b.
Results from the 2020 campaign, describing the time series of atmospheric mercury concentrations, ground-level meteorological parameters (radiation, H2O mixing ratio, temperature, and RH), accumulated precipitation along the trajectory length, ozone, and aerosol properties (BC concentration and NCoarse), are presented in Fig. 2. Wind direction, wind speed, and snow depth are displayed in Fig. S3. During the 2020 campaign, four distinct GOM enhancement events are observed: Event 3 from 22 July at 16:35 UTC to 23 July at 13:15 UTC, Event 4 from 24 July at 11:55 UTC to 26 July at 13:15 UTC, Event 5a from 30 July at 17:00 UTC to 1 August at 13:40 UTC, and Event 5b from 1 August at 13:40 UTC to 4 August at 09:00 UTC The 2020 campaign experienced higher GEM and GOM concentrations compared to the 2019 campaign. For example, GEM increased from ∼1.7 ng m−3 on 17 July to ∼2.8 ng m−3 on 19 July, only to dip to ∼1.7 ng m−3 on 21 July before increasing to ∼2.4 ng m−3. These elevated concentrations could be the result of oceanic evasion through open leads and fissures in the consolidated pack ice (Aspmo et al., 2006; DiMento et al., 2019), as air masses experienced extensive surface contact with sea ice on 19–21 July (Fig. S4a–c). Satellite images, which show fractured sea ice surrounding Villum, are available at http://ocean.dmi.dk/arctic/nord.uk.php (last access: 16 July 2021). For Event 3, GEM and GOM averaged 1.71±0.13 ng m−3 and 35.13±13.98 pg m−3, respectively (Table S1). At the beginning of Event 3, GEM dropped from ∼2 to ∼1.5 ng m−3, while GOM increased from ∼6 to ∼62 pg m−3. For Event 4, GEM and GOM averaged 1.79±0.09 ng m−3 and 8.78±2.38 pg m−3, respectively (Table S1). During Event 4, GOM peaked at ∼14 pg m−3 on 24 July at 13:55 UTC and 25 July at 18:35 UTC, while GEM decreased from ∼1.9 to ∼1.4 ng m−3 before returning to levels of ∼1.9 ng m−3 by the end of Event 4, this decrease in GEM during Event 4 is part of an overall decreasing pattern of GEM during the preceding and subsequent days (Fig. 2). For Event 5a, GEM was constant, averaging 1.54±0.02 ng m−3, with GOM increasing throughout the event while averaging 9.10±2.43 pg m−3. For Event 5b, GEM displayed a slight decreasing pattern with an average of 1.51±0.05 ng m−3, GOM decreased from ∼14 pg m−3 on 1 August to ∼5 pg m−3 on 2 August, before increasing until August 4 where GOM began to decrease. For Events 3, 4, and 5, PHg displayed no visible pattern and was constantly near or below LOD.
Meteorological parameters during the 2020 campaign are displayed in Figs. 2 and S3 and summarized in Table S1. Event 3 experienced decreasing temperatures (from ∼5 to ∼1 ∘C) and increasing RH (∼77 % to ∼92 %), while Event 4 displayed an opposite pattern of increasing temperatures (∼5 to ∼7, maximum 12 ∘C) and similar levels of RH at the beginning (∼77 }) and end (∼79 %) of the event with a minimum of ∼52 % in the middle. A similar relationship is observed for H2O mixing ratios, with low values during Event 3 (3.83±0.04 g kg−1) and elevated values for Event 4 (4.61±0.23 g kg−1). Accumulated precipitation was slightly higher for Event 3 vs. 4, 10.90±4.10 and 8.90±1.90 mm, respectively, although Event 4 experienced a higher maximum (∼31 mm) on 25 July. For Events 3 and 4, the wind direction was mainly from the east with low and stable wind speeds (Fig. S3 and Table S1). Radiation during the start of Event 3 was low (∼125 W m−2) but increased as the event progressed. For Event 5a, the temperature exhibited high values (10.81±1.27 ∘C) and a diurnal pattern with maxima during the afternoon, low (<67 %) and decreasing RH (minimum ∼42 %), and wind consistently from the southwest with high wind speeds (9.30±1.05 m s−1, max 11.5 m s−1, Fig. S3 and Table S1). During the beginning of Event 5a, the H2O mixing ratio was high (∼5 g kg−1) compared to the end of the event (∼3.5 g kg−1), and accumulated precipitation peaked at the beginning of the event (47.4 mm) and averaged 12.95±3.4 mm. For Event 5b, the temperature continued to be elevated with a diurnal pattern, while RH displayed a decreasing pattern till the end of the event; similar patterns were observed for the H2O mixing ratios and accumulated precipitation (Fig. 2). During all four events, snow cover was near zero (Fig. S3) and radiation was high, with peak values > 375 W m−2 (except during the beginning of Event 3 and end of Event 4, Fig. 2).
3.2 Air mass history
Contour plots for different meteorological parameters (temperature, relative humidity, radiation, H2O mixing ratio, and precipitation) and altitude for each hourly trajectory for the 2019 and 2020 campaigns are displayed in Figs. 3 and 4, respectively. Mixed-layer height for each step of each hourly trajectory for the 2019 and 2020 campaigns is shown in Fig. S5.
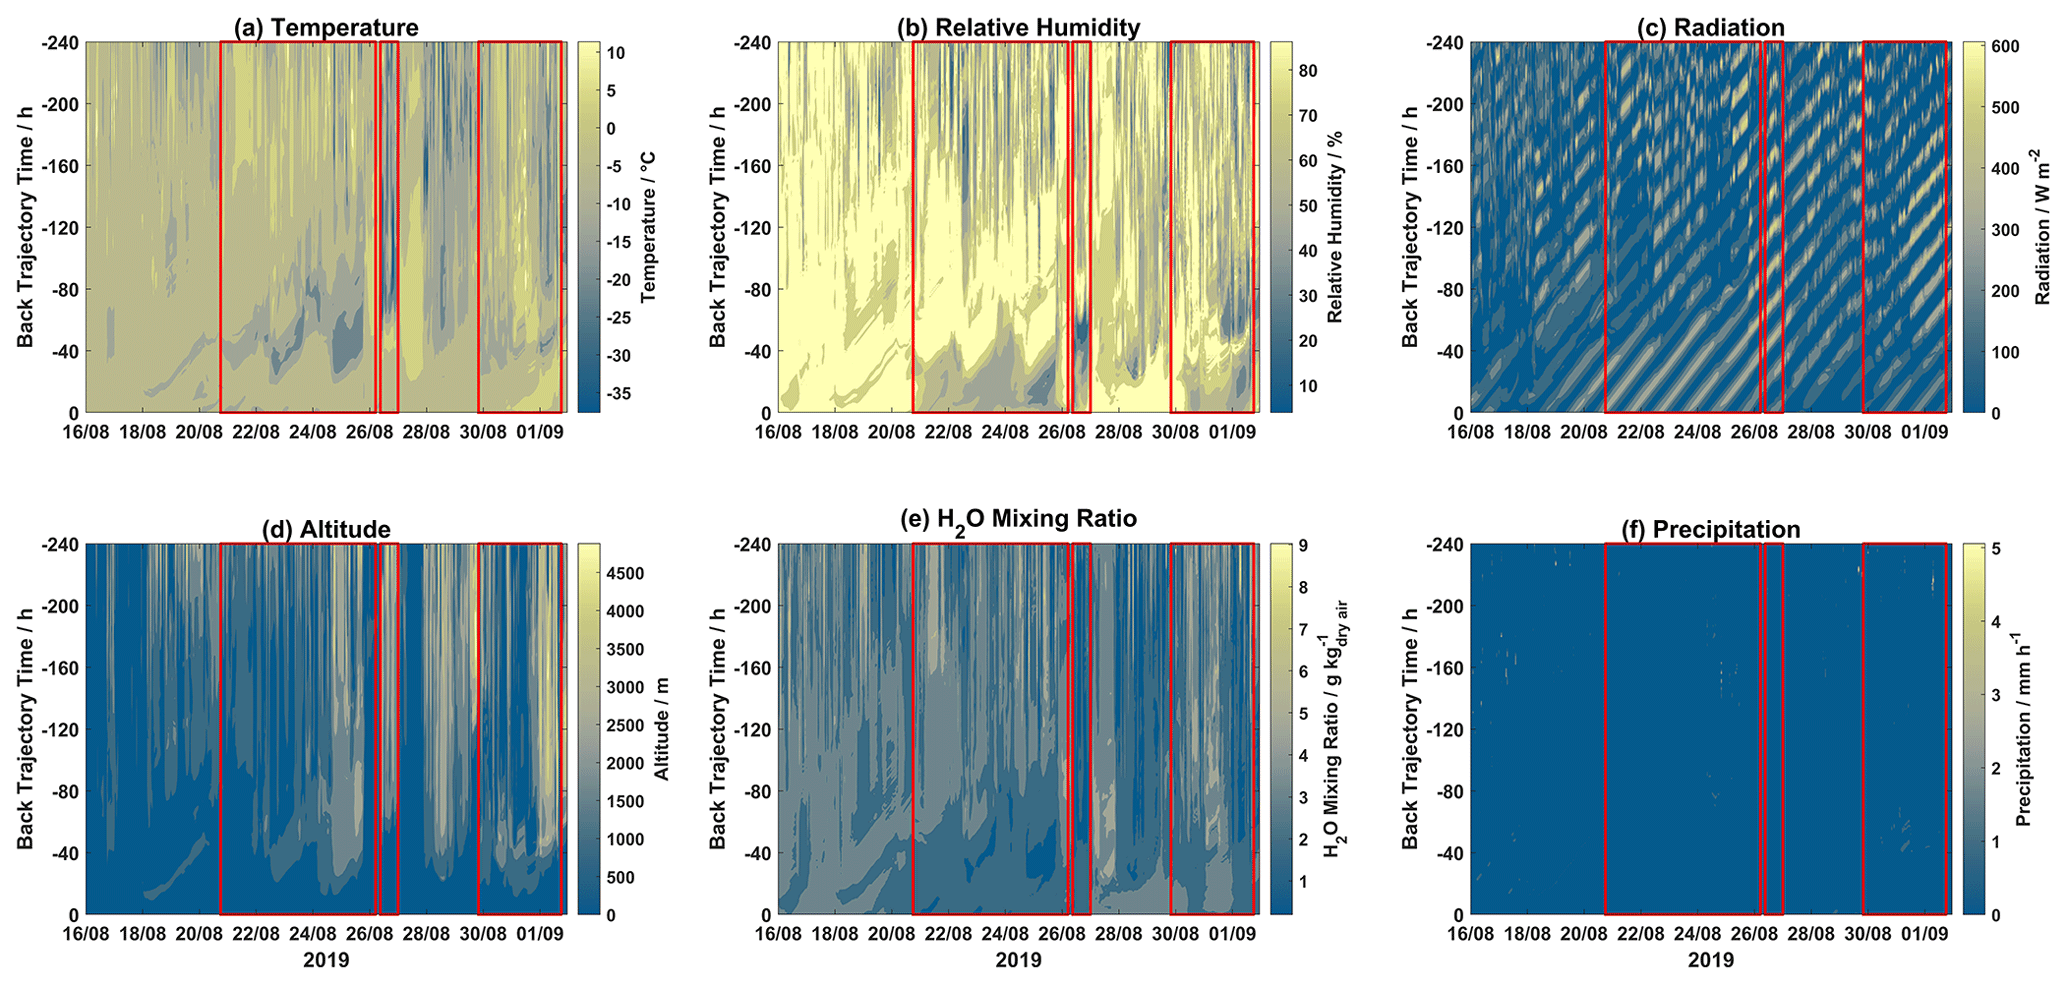
Figure 3Contour plots of trajectory-derived meteorological parameters, i.e., (a) temperature, (b) relative humidity, (c) solar radiation, (d) altitude, (e) H2O mixing ratio, and (f) precipitation, along each trajectory for the 2019 campaign. Event periods are outlined in red. The x axis displays arrival time at Villum, the y axis displays hours backward in time for each trajectory, and the color bar represents the meteorological parameter.
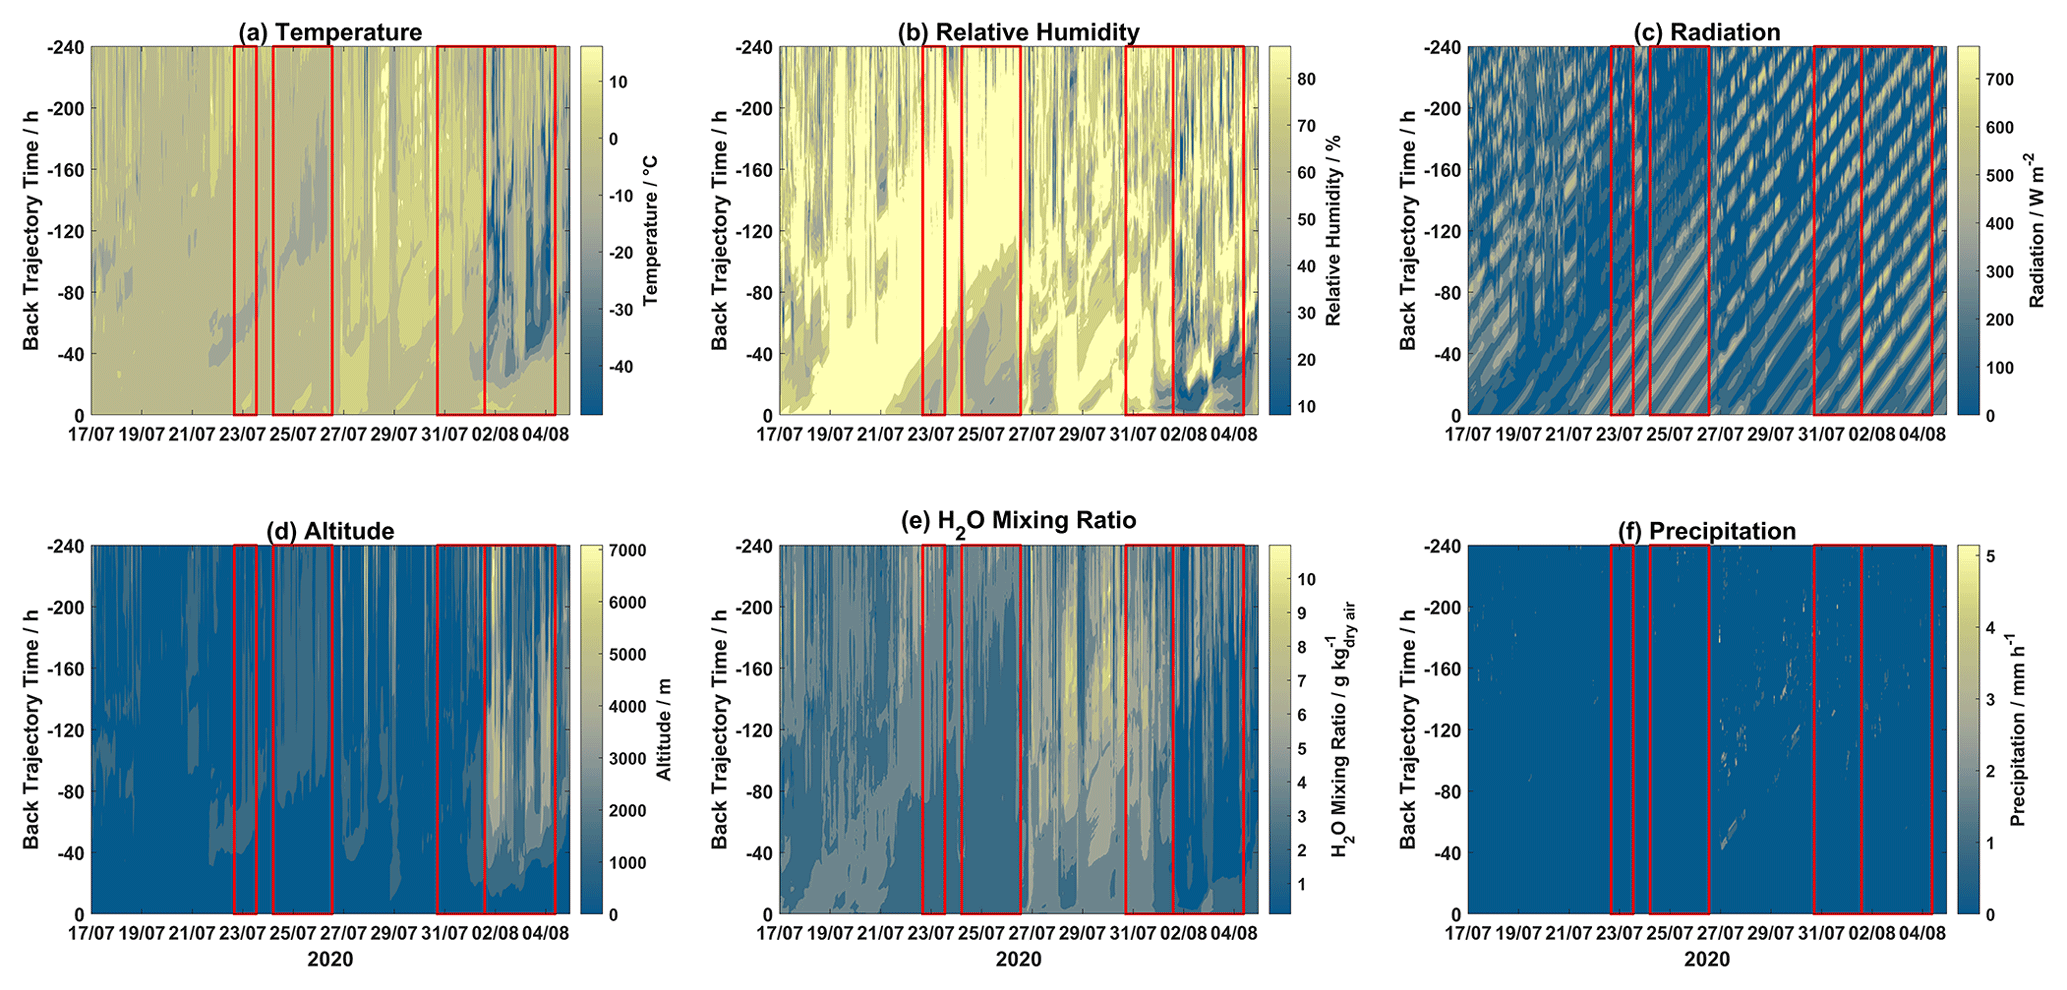
Figure 4Contour plots of trajectory-derived meteorological parameters, i.e., (a) temperature, (b) relative humidity, (c) solar radiation, (d) altitude, (e) H2O mixing ratio, and (f) precipitation, along each trajectory for the 2020 campaign. Event periods are outlined in red. The x axis displays arrival time at Villum, the y axis displays hours backward in time for each trajectory, and the color bar represents the meteorological parameter.
During Event 1a, after ∼120 h trajectory temperatures were warmer with lower RH values, while H2O mixing ratios were increased after ∼80 h. Radiation was intense before 80 h for the entirety of Event 1a, after this time air masses experienced variable radiation, especially on 21, 22, 24, and 25 August. Air masses during Event 1a were consistently elevated with the highest altitudes on 24–26 August. Precipitation was low except for several episodes, which is reflected in the accumulated precipitation (Fig. 1). Event 1b experienced lower temperatures after 80 h despite lower RH before this time, and radiation was intense and H2O mixing ratios were low throughout the trajectory length for the entire event. For the first half of Event 2, air masses were slightly warmer and wetter, with lower radiation and decreased altitudes when compared to the second half of this event. During Event 3, temperatures were consistently warm except for a period of colder temperatures around ∼60 h backward. A similar observation is made for RH, with high values after ∼50 h, although the H2O mixing ratios were elevated after ∼70 h. Radiation was intense before ∼60 h and low after that time. Event 4 experienced similar conditions to Event 3, although at later times throughout the air mass history. Interestingly, Event 5a and 5b experienced similar levels of GOM (Fig. 2), although Event 5a experienced higher temperatures as well as higher RH and H2O mixing ratios with trajectories arriving from lower altitudes and being exposed to less radiation. Presuming that an RH greater than 95 % signifies air masses were within a cloud (Schmeissner et al., 2011; Freud et al., 2017), the time spent in cloud could be calculated for each event. Air masses during Events 1a, 1b, and 2 spent 22.67 %, 11.67 %, and 14.28 % of the time in cloud, respectively, and 19.15 % combined. For Events 3, 4, 5a, and 5b, air masses spent 52.58 %, 38.32 %, 20.37 %, and 14.68 % of the time in cloud, and 27.37 % combined. For the 2019 campaign, event air masses spent less time in a cloud compared to non-event air masses (29.61 %) both when comparing individual events and combined event periods. For the 2020 campaign, the same general pattern is observed when comparing combined event periods, although Events 3 and 4 spent more time in a cloud compared to non-event air masses (32.59 %, Table S2).
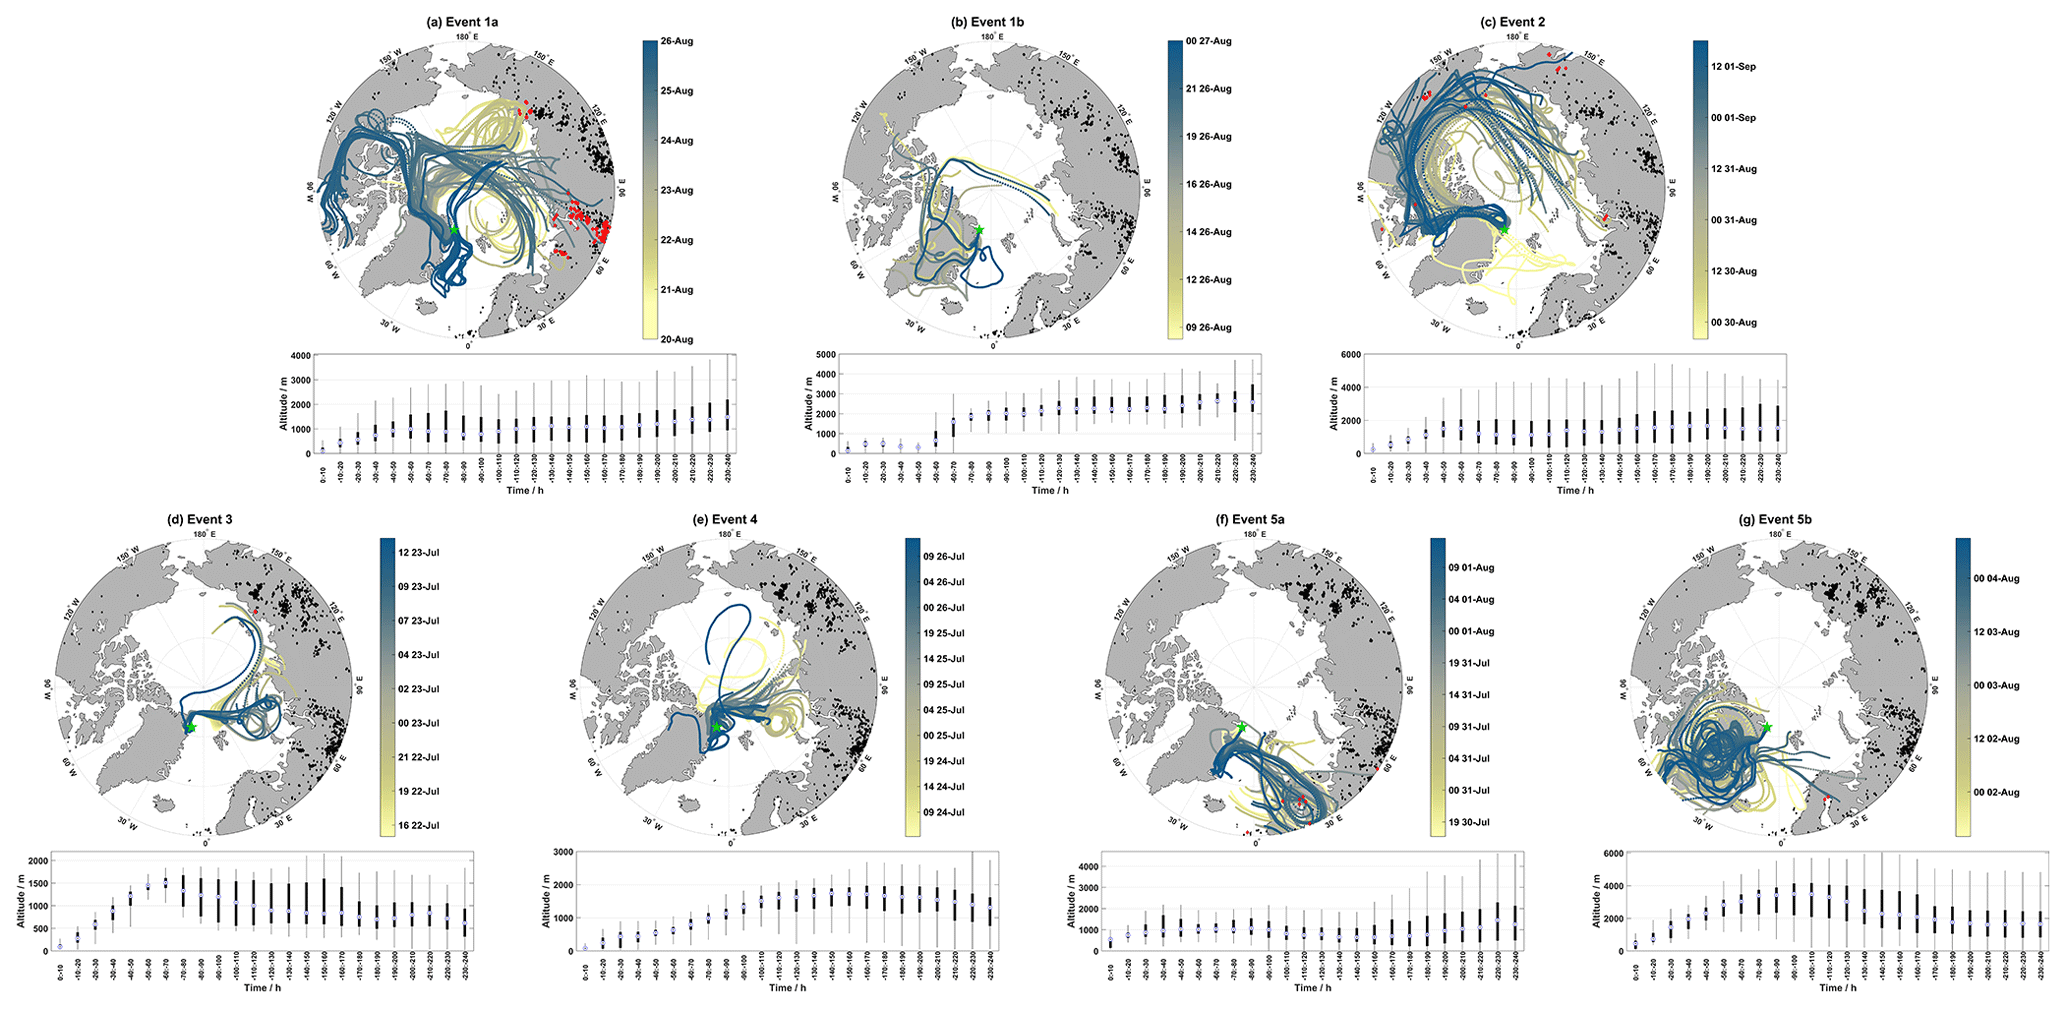
Figure 5Map of air mass back-trajectories during Events 1–5 in (a) through (g). Panels (a–c) show individual hourly trajectories that are colored-coded by the arrival date at Villum. as indicated by the color bar (the date format is HH dd-MMM), active fires during each event are in black, active fires intersecting trajectories within 1∘ latitude and longitude and within 1 h are in red (active fires from the previous 10 d before the start of an event were included to reflect the trajectory length). The position of Villum is marked by the green star. Panels (d–g) display boxplots of the altitude for each event binned in increments of 10 h.
Geospatially, the GOM enhancement events show different source regions. Figure 5a–g show hourly air mass back-trajectories, combined with active fire data, for each event. To capture the presence of fires in relation to the length of each trajectory, active fires from the previous 10 d before the start of each event and up to the end of each event are marked in black and active fires intersecting trajectories within 2∘ latitude and longitude and within 2 h are marked in red. The bottom parts of Fig. 5a–g display the distribution of trajectory altitudes binned in 10 h increments. Biomass burning (one of the possible causes of active fires) can emit aerosols covering a large size range and varying chemical composition (Reid et al., 2005); therefore, active fires were included to analyze their effect on the air mass history during event periods. For Event 1, air masses circulated over the Barents Sea, Kara Sea, and the central Arctic Ocean at the beginning of the event before transitioning to the East Siberian Sea. During the latter part of Event 1a, trajectories experienced continental influence from Eurasia before shifting to the Canadian Arctic Archipelago and finally arriving from the Greenland Sea. Trajectories in Event 1a were influenced by active fires during each circulation pattern, except for the latter part when air masses passed over the Greenland Sea before arrival, corresponding to reduced GOM concentrations (Fig. 1). Trajectory altitudes during Event 1a were consistently above 1000 m after 120 h; they experienced a minimum median altitude at 80–90 h and descended from ∼1000 m approx. 50–60 h before arrival. The distributions of trajectory altitudes during Event 1a were diverse, with each bin experiencing surface level contact and reaching the middle free troposphere (Fig. 5a). For Event 1b, air masses were mainly confined to the Arctic Ocean and central Greenland, with a few trajectories passing over the Canadian Arctic Archipelago and the Greenland Sea. Median trajectories altitudes spent considerable time above 2000 m after 80 h, followed by a quick descent to low altitudes for the last 50 h before arrival at Villum. Event 2 showed a major contribution of air masses from the central Arctic Ocean, North America, and the Canadian Arctic Archipelago, with smaller contributions from the northern Atlantic just south of Svalbard. There is some influence of active fires from Eurasia, North America, and the Canadian Arctic Archipelago during this event, although these are infrequent and at different stages of transport (Fig. 5c). Analogous to Event 1a, median trajectory altitudes during Event 2 were consistently elevated after 120 h and resided in the surface layer and the middle of the free troposphere. Event 2 experienced a minimum median altitude at 80–90 h and started a descent from ∼1500 m approx. 40–50 h backward. Events 3 showed air masses originating from the Barents Sea and the Arctic Ocean with little influence of active fires. Trajectory altitudes for Event 3 experienced surface layer contact after 200 h backward, and thereafter started an ascent in the free troposphere from 70–190 h backward, which was followed by a steep descent from 1500 m at approx. 60–70 before arrival. Event 4 showed a similar spatial extent to Event 3 but with air masses located closer to Villum. Median trajectory altitudes for Event 4 resided at elevated altitudes with surface layer contact only after 200 h and then started their descent from 1600 m approx. 120 before arrival. For Event 5a, air masses consistently arrived from northern Scandinavia with extensive influence from active fires. Trajectory altitudes were considerably lower (varying around 1000 m) and experienced surface layer contact after 100 h, after which they started their descent closer to Villum (20–30 h backward). For Event 5b, air masses shifted to circulating mainly over the Greenland ice sheet, although a few trajectories from the northern Atlantic and parts of northern Scandinavia also contributed. Trajectory altitudes showed the highest elevations compared to the other events (Table S2 and Fig. 5g), experienced altitudes around 1600 m after 200 h, starting around 190 h backward trajectories ascended from ∼2000 m until approx. 90–100 backward where trajectories started to descend from ∼3500 m. Other than Events 3 and 4, the geospatial origins of air masses during GOM enhancement events were quite diverse. Events 3 and 4 were only separated by a couple of hours, and therefore similar air mass origin is expected for the two events, although interestingly Events 5a and 5b showed quite different air mass origins but were temporally consecutive. Each event displayed a gradual descent from elevated altitudes before reaching Villum, except for Event 1b which experienced a steep descent around 50 h backward followed by extensive surface layer contact.
3.3 Ozone
Ozone mixing ratios for the 2019 campaign are displayed in Fig. 1b. Due to technical difficulties, ozone measurements started on 18 August during the 2019 campaign. From 18 August to the beginning of Event 1a, ozone was slightly decreasing with values of ∼30 ppbv. For Event 1a, ozone increased concurrently with GOM, reaching max values of 45.50 ppbv and 9.81 ng m−3, respectively, on 25 August (Fig. 1), while GEM exhibits a minimum on 25 August at 1.14 ng m−3. The peak ozone level is abnormally high for the late summer (median ± m.a.d. ozone mixing ratio for August 2010–2019 is 24.64±3.14 ppb). Ozone decreased from this maximum to 35.30 ppbv at the end of Event 1a. For Event 1b, ozone returned to high levels observed at the peak of Event 1a (∼40 ppbv). Ozone steadily decreased from the end of Event 1a to the beginning of Event 2. For Event 2, ozone steadily increased from ∼29 to ∼36 ppbv. For the 2020 campaign, a similar relationship between ozone and GOM is observed (Fig. 2b). Background levels during July (median ± m.a.d. ozone mixing ratio for July 2010–2019) is 23.92±2.88 ppb. During Event 3, ozone is increasing simultaneously with GOM while GEM is decreasing; for this event, ozone averaged 26.69±0.79 ppb. While this value is not considered elevated for the season, it is elevated over the preceding and subsequent days around Event 3. For Event 4, ozone averaged 25.30±1.63 ppb and is at background levels for much of the event. On 25 July, ozone peaked at ∼34 ppb before returning to background levels. For Event 5a and 5b, ozone experienced similar levels (Table S1) and followed a similar pattern as GOM, increasing during Event 5a, followed by a dip on 2 August, and increasing for the remainder of Event 5b.
3.4 Particle number and black carbon
During the non-event periods of the 2019 campaign, the coarse-mode particle number concentration (NCoarse) and black carbon (BC) are both low, 0.46±0.34 cm−3 and 1.22±1.06 ng m−3, respectively. For Event 1a, NCoarse and BC are both elevated (3.92±2.82 cm−3 and 7.30±4.94 ng m−3, respectively) and increase concurrently with GOM, reaching a maximum concentration of ∼11 cm−3 and ∼26 ng m−3, respectively, on 25 August (Fig. 1d). Between Event 1a and 1b, NCoarse and BC showed a reduction in concentration, consistent with other parameters during this time (Fig. 1). For Event 1b, NCoarse and BC were elevated and relatively constant, 7.19±0.95 cm−3 and 16.44±1.32 ng m−3, respectively. For Event 2, NCoarse and BC returned to low values, although at a higher level compared to non-event periods, 1.99±0.13 cm−3 and 3.80±0.59 ng m−3, respectively. This pattern is comparable to the behavior of ozone (Sect. 3.4, Fig. 1b). For the 2020 campaign, a different scenario is observed between NCoarse, BC, and GOM (Fig. 2a and d). For Events 3 and 4, there is a slight enhancement of NCoarse and BC levels when compared to the preceding non-event periods (Fig. 2d). For Event 5a and 5b, both NCoarse and BC are decreasing and low (Fig. 2d and Table S1).
During the 2020 campaign, there are two episodes, the first from 26 July at 17:15 UTC to 27 July at 03:35 UTC and the second from 27 July at 19:05 UTC to 28 July at 09:05 UTC, where NCoarse and BC are significantly elevated, reaching up to ∼33 cm−3 and ∼100 ng m−3, respectively, compared to the rest of the campaign (Fig. 7b). These two episodes are observed during non-event periods (Fig. 7b). GOM during these episodes is low, i.e., 2.95±0.78 pg m−3 for the first episode and 2.20±1.09 pg m−3 for the second episode. These episodes are likely transported over a long range, as they are too gradual and long to be identified as local pollution from activities at Station Nord. Another indicator that these episodes were of non-local origin is that ozone remained at constant levels throughout both episodes. If these episodes were of local pollution, then we would expect ozone to decrease as it is titrated by local NOx emissions. Figure 6a–c show the time series of GOM, NCoarse, and BC on a full-scale axis and air mass back-trajectories for the first and second episodes, combined with active fire data from the previous 10 d to the end of the episode.
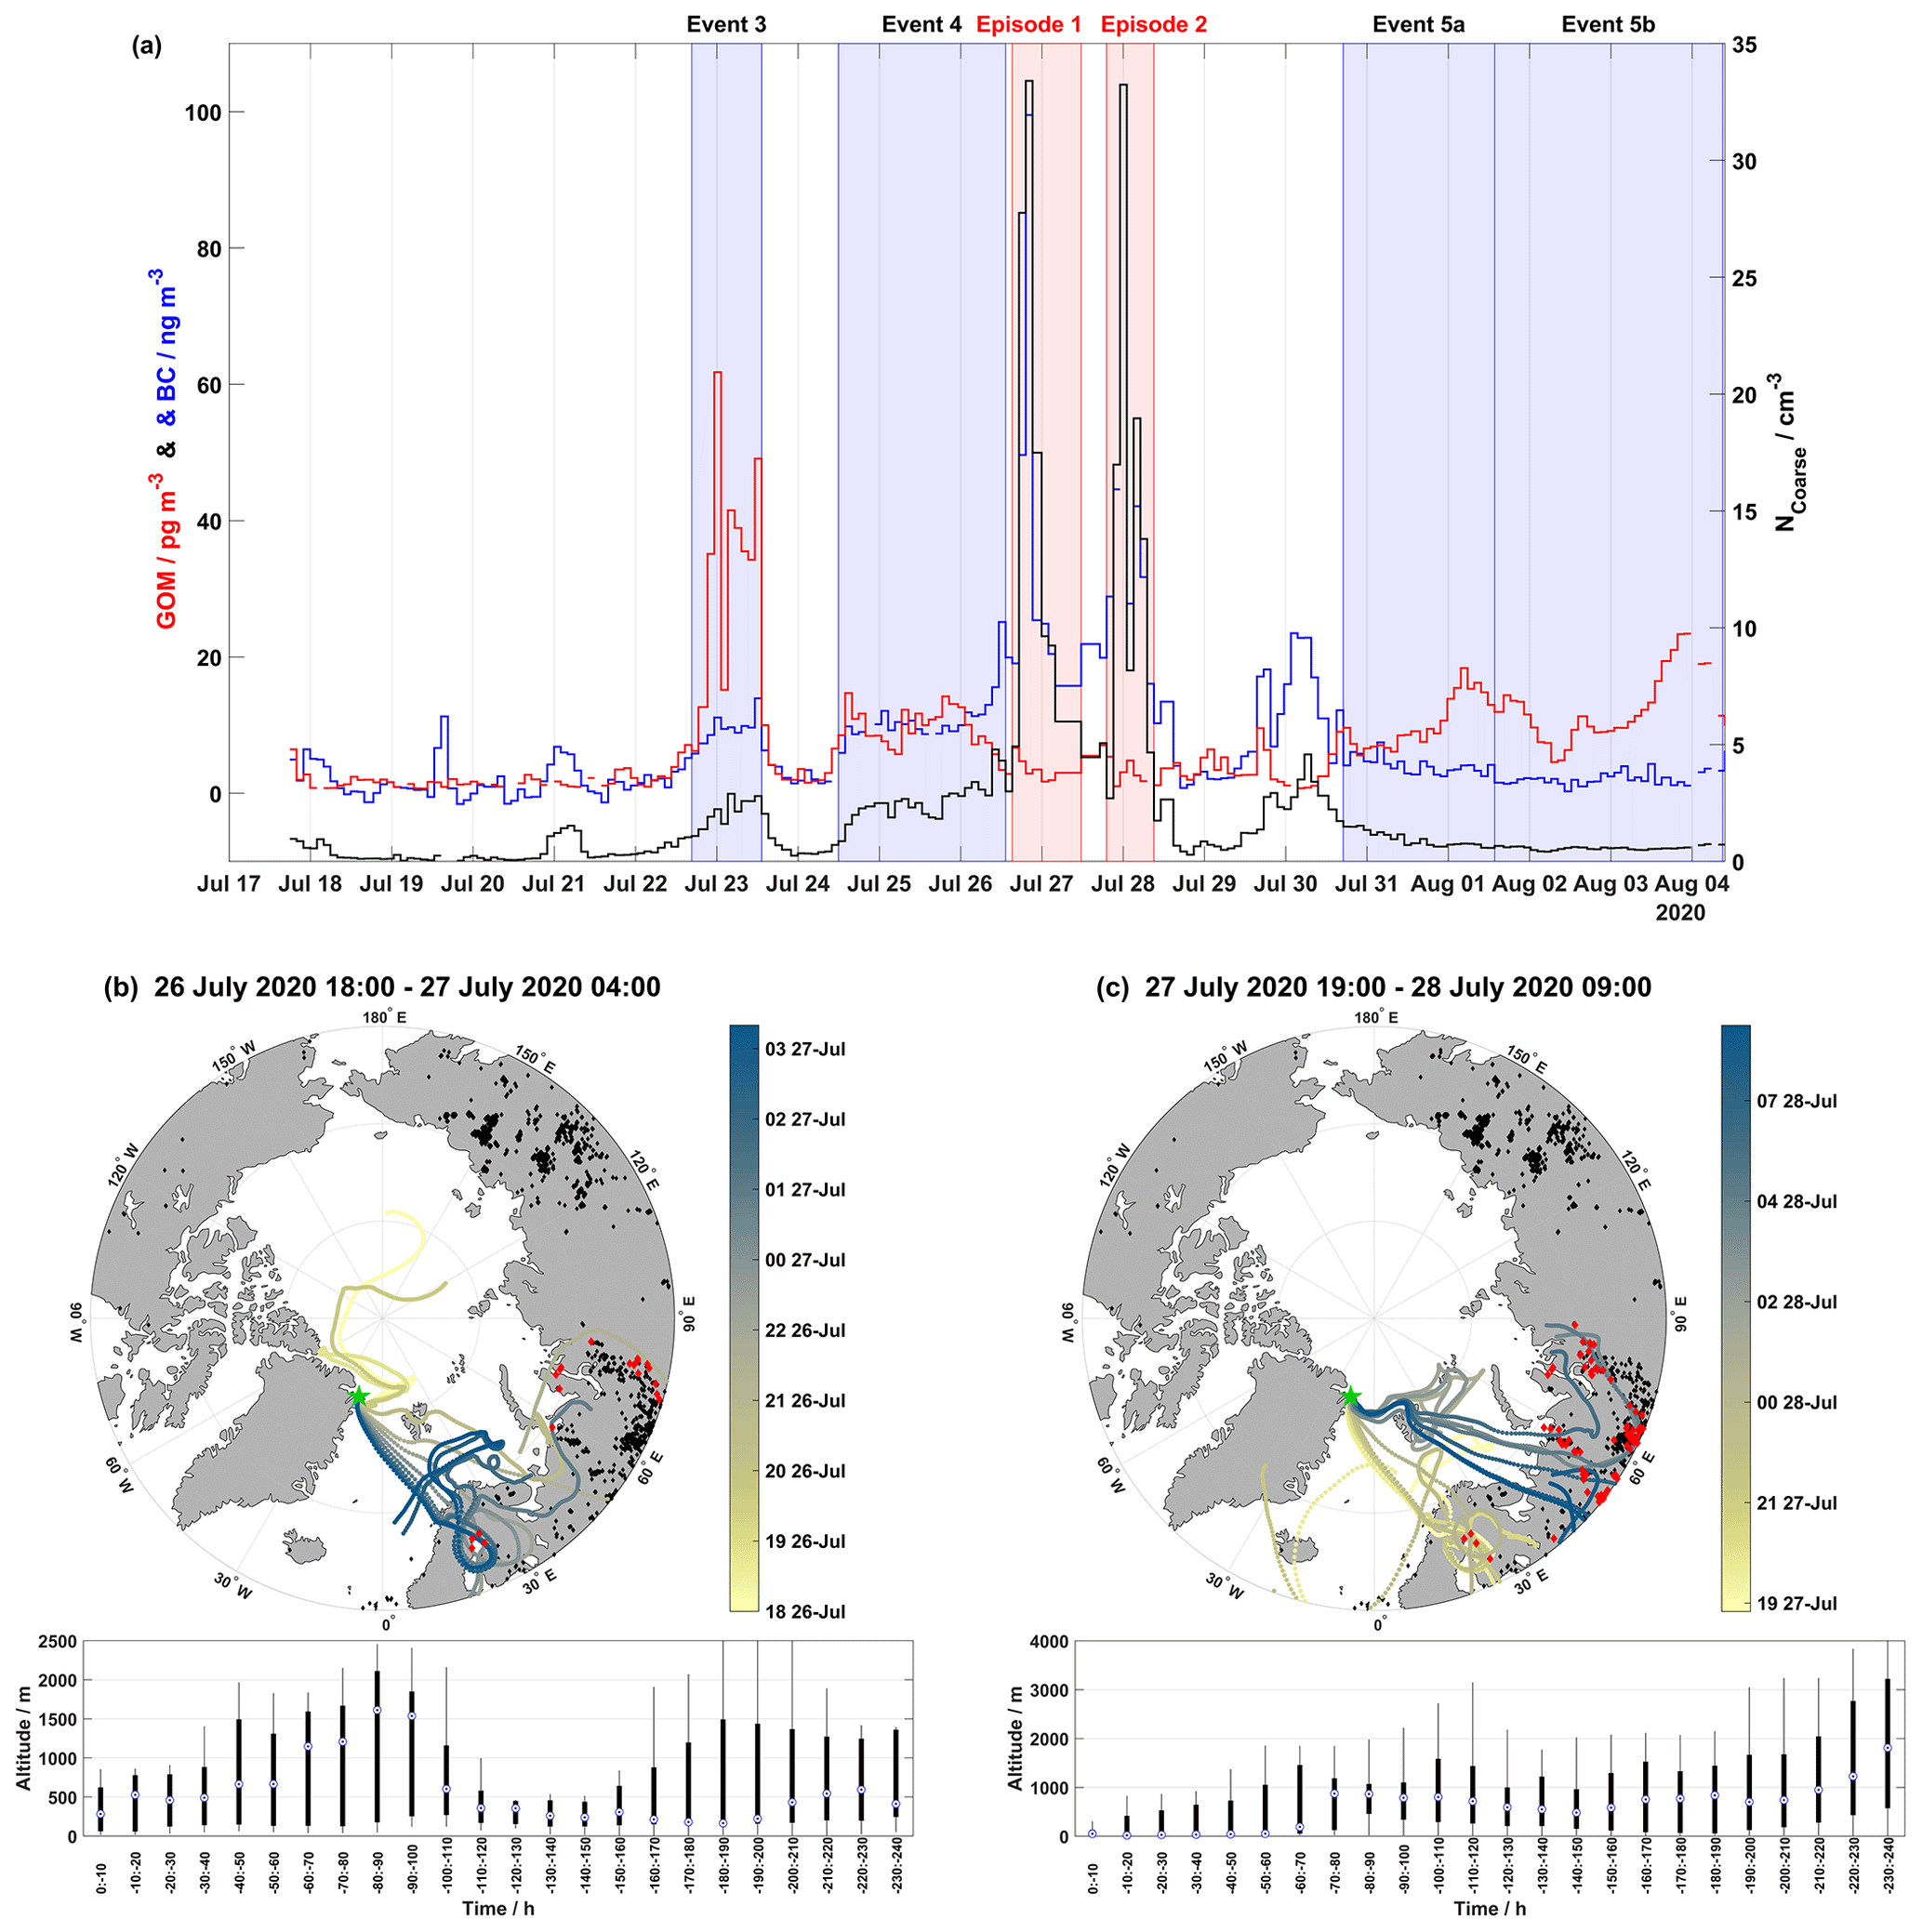
Figure 6Time series demonstrating the full scale of NCoarse and BC, along with GOM concentrations shown in (a). The event periods are shaded in blue while the two episodes are shaded in red. Map of air mass back-trajectories during (b) the first episode and (c) the second episode of elevated NCoarse and BC concentrations. The top panels in (b) and (c) show individual hourly trajectories are colored-coded by the arrival date at Villum as indicated by the color bar (the date format is HH dd-MMM): active fires during each event are in black, and active fires intersecting trajectories within 2∘ latitude and longitude and within 2 h are in red (active fires from the previous 10 d before the start of an event were included to reflect the trajectory length). The position of Villum is marked by the green star. The bottom panel displays boxplots of the altitude for each event binned in increments of 10 h.
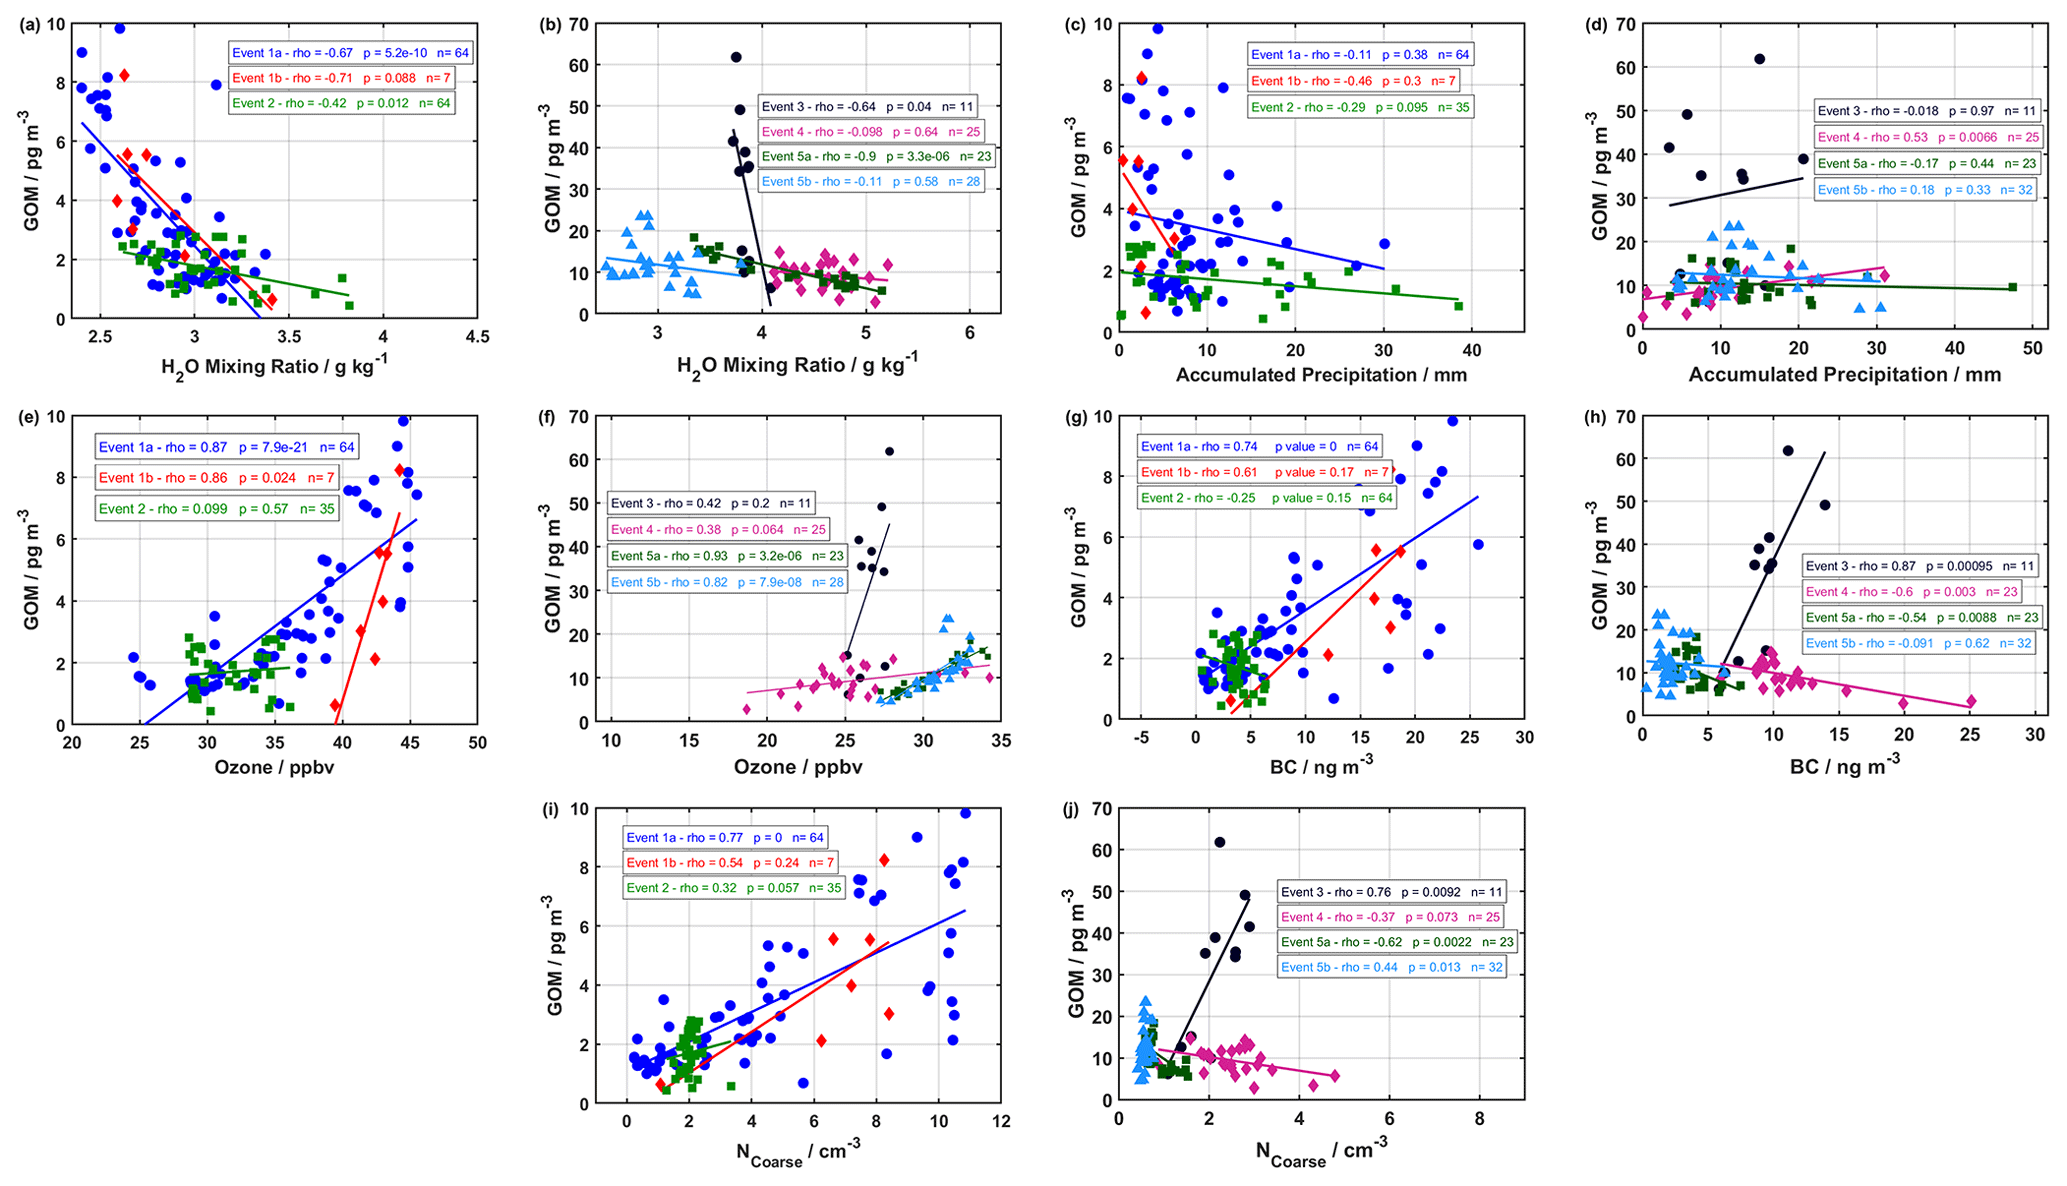
Figure 7Correlation analysis of GOM with (a, b) H2O mixing ratio, (c, d) accumulated precipitation, (e, f) ozone, (g, h) BC, and (i, j) NCoarse for the 2019 and 2020 campaigns, respectively. The Spearman rank correlation coefficient (rho – ρ), the p value, and the number of observations are listed for each event in each panel.
4.1 Factors influencing event vs. non-event periods
For Events 1a, 1b, 2, 4, and 5, the ground-level meteorological parameters mainly associated with GOM enhancement are higher levels of radiation, lower RH, H2O mixing ratios, and accumulated precipitation when compared to non-event periods (Table S1). For Event 3, radiation was low at the beginning of the event and temperature and RH displayed an opposite pattern relative to the rest of the events, although H2O mixing ratios and accumulated precipitation were both low. For the non-event periods in 2019, radiation and temperature were lower while H2O mixing ratios, accumulated precipitation, and the RH were higher. For the 2020 campaign, non-event periods were more diverse although each displayed a dissimilar pattern in one or more parameters when compared to event periods. For example, at the beginning of the 2020 campaign and during the non-event period between Event 3 and 4 both H2O mixing ratios and accumulated precipitation were low and radiation was also low, while the RH was high (Fig. 2). For the non-event period between Event 4 and 5a, radiation was sufficiently high but H2O mixing ratios and accumulated precipitation were also exceptionally high, while the temperature and RH fluctuated throughout this period (Fig. 2).
The factors influencing event periods at ground level are high levels of radiation, low H2O mixing ratios, accumulated precipitation, and RH. Higher levels of solar radiation enable the photolysis of reactive halogen species, and lower RH and H2O mixing ratios inhibit the partitioning of GOM into the liquid phase (Laurier, 2003; Soerensen et al., 2010; Brooks et al., 2011; Steen et al., 2011). Interestingly, none of the events were linked to cold temperatures, which has been previously demonstrated to be associated with mercury oxidation through observations in the Arctic (Cole and Steffen, 2010; Ariya et al., 2015; Steffen et al., 2015), theoretical studies (Shepler et al., 2007), and modeling (Toyota et al., 2014). The stability of the HgBr intermediate is highly temperature dependent (Goodsite et al., 2004, 2012; Donohoue et al., 2006; Dibble et al., 2012). Lower temperatures aid in the formation of GOM from HgBr; for example, Skov et al. (2004) and Christensen et al. (2004) modeled a surface temperature below −4 ∘C for mercury depletion to occur in the Arctic, while Brooks et al. (2011) observed a temperature threshold of −15 ∘C for mercury oxidation to occur at Summit Station atop the Greenland ice sheet. It should be noted that Brooks et al. (2011) detected oxidized mercury at temperatures above this threshold but not above 0 ∘C. Tarasick and Bottenheim (2002) analyzed ozonesonde records, and observed surface temperatures below −20 ∘C were required for the occurrence of ozone-depletion events. Furthermore, Halfacre et al. (2019) and Burd et al. (2017) demonstrated that a frozen heterogeneous surface is required for the propagation of halogen explosion events. The temperature at Villum ranged from −1.2 to 5.6 ∘C and from 2.4 to 13.5 ∘C during the 2019 and 2020 event periods, respectively. During AMDEs, ozone and GEM are positively correlated due to mutual reaction with halogen species and are both extremely depleted due to strong halogen explosion events in the boundary layer (Schroeder et al., 1998; Lindberg et al., 2002; Berg et al., 2003; Skov et al., 2004; Brooks et al., 2006; Simpson et al., 2015). However, during event periods ozone was consistently elevated over not only non-event periods but also background levels and displayed positive correlations with GOM during all events (Sect. 3.4, Table S1, and Fig. 7). While ozone mixing ratios were high during GOM enhancement events, they are an order of magnitude below levels reported in the upper troposphere–lower stratosphere (Talbot et al., 2007), and given the slow rate reaction coefficient (Pal and Ariya, 2004), ozone is an improbable first oxidant of mercury during these campaigns (Calvert and Lindberg, 2005), although ozone has recently been identified as a second oxidant of HgI (Saiz-Lopez et al., 2020). While ozone might be acting as a second oxidant of HgI, any depletions of ozone during GEM oxidation, either through reaction with the HgI intermediate or with halogen species, is likely masked by the elevated levels of ozone in the free troposphere. Therefore, the high ground-level temperatures, the increased ozone mixing ratios, and the positive correlations observed between ozone and GOM during all events cast doubt on the local in situ production of GOM in the boundary layer.
The differences in air mass history between the event and non-event periods may offer insight into the origin of GOM, given the doubt associated with in situ oxidation at the surface. In general, air masses during event periods were colder, drier, arrived from higher altitudes, and spent more time above the mixed layer and less time in a cloud (Table S2). However, there are notable exceptions to this pattern: Event 3 experienced high RH values and spent over half of the 240 h in a cloud, and Event 5a experienced high temperatures and elevated H2O mixing ratios. Analogous to the ground-level meteorological parameters, the air mass history during non-event periods was missing one or more of these conditions compared to event periods. For example, during all non-event periods, air mass arrived from altitudes comparable to event periods but often experienced decreased radiation and high RH and H2O mixing ratios, especially closer to Villum. The overall pattern of the air mass history for event periods appears to be cold and dry air masses arriving from above the mixed layer, being at higher altitudes, and there being little time spent in a cloud. The temperature and altitude parameters are interconnected because with increasing altitude the temperature will decrease as the air becomes less dense. This suggests the cold, dry, high altitudes of the free troposphere are facilitating the formation of GOM. Colder temperatures in the free troposphere are likely facilitating the formation of GOM by increasing the stability of the HgI intermediate, while low RHs, H2O mixing ratios, and less time spent within a cloud limit uptake of GOM into the aqueous phase. Additionally, given the low surface resistance of GOM over snowpack (Skov et al., 2006, estimated a surface resistance of GOM close to zero), the occurrence of dry (and possibly wet) deposition will increase when air masses come in close contact with the surface layer (i.e., below the mixed layer), resulting in decreased concentrations.
NCoarse was enhanced during event periods vs. non-event periods and for every individual event except for 5b (Table S2). Coarse-mode particles and aerosol optical depth have been shown to be connected to the recycling of bromine during spring in the free troposphere leading to a prolonged lifetime of BrO (Peterson et al., 2017; Bognar et al., 2020), through the recycling of halogens on aerosol surfaces. This suggests coarse-mode particles could be providing a surface for the propagation of halogen plumes aloft, as demonstrated by Peterson et al. (2017) and Simpson et al. (2017). These observations suggest coarse-mode particles may be providing a heterogenous surface for the propagation of halogen species required for the formation of GOM, and this process is facilitated in the cold, dry, and sunlit environment of the free troposphere.
Previous studies have demonstrated the influence of the free troposphere on mercury concentrations within the boundary layer. In the Northern Hemisphere, the free troposphere has been established as a source of GOM through modeling studies (Gratz et al., 2015; Shah and Jaeglé, 2017) and observations from both aircraft campaigns (Talbot et al., 2007; Gratz et al., 2015) and high-altitude sites (Swartzendruber et al., 2006; Faïn et al., 2009; Weiss-Penzias et al., 2015; Fu et al., 2016). Faïn et al. (2009) reported similar observations of the free troposphere acting as a source of oxidized mercury at a high-elevation site (3220 m a.s.l.) in the Rocky Mountains, USA. They also observed that the presence of GOM was dependent on RH. They hypothesized that the build-up of GOM in the free troposphere was governed exclusively by the existence of low RH, possibly due to the lack of scavenging by particles at low RH levels. Modeling studies have also shown the free troposphere to be a source of GOM. Using the GEOS-Chem global chemical transport model, Holmes et al. (2006, 2010) identified bromine to be the dominant oxidant of GEM globally, with most of the oxidation occurring in the middle and upper troposphere. Shah and Jaeglé (2017) arrived at a similar conclusion using GEOS-Chem that much of the mercury oxidation by bromine occurs in the middle and upper troposphere. Weiss-Penzias et al. (2015) compared the GEOS-Chem model output from two different mercury oxidation schemes (a standard run using bromine and an alternative run using OH–O3) with observations of mercury speciation (GEM and reactive mercury, which is a combination of GOM and PHg) from five high-elevation sites. In both the model output and observations, they observed RM was negatively correlated with GEM and H2O mixing ratios and positively correlated with ozone. They hypothesized RM was formed in the free tropospheric air from the photo-oxidation of GEM. These studies show the free troposphere to be a source of GOM globally; however, there are a limited number of field studies on GOM in the High Arctic summer and none, to the authors' knowledge, on the influence of the free troposphere on GOM levels. These observations from other locations around the globe add credence to our hypothesis, as they all observed similar conditions during high levels of GOM as we did during event periods. Similar chemical processes are likely the cause of the observations in this study; however, the Arctic atmosphere is largely separated from the mid-latitudes during summer on account of contraction of the polar dome, so there may be some differences in the dynamics, although this is unlikely (Holmes et al., 2010).
4.2 Factors influencing individual events
The general pattern associated with event vs. non-event periods showed the cold, dry, sunlit free troposphere to be the likely origin of the GOM enhancement, although individual events did not always fit this description. Individual events displayed unique features that can offer insight into the specific origins of GOM in the Arctic summer.
Event 1a followed the general pattern for ground-level meteorological parameters and air mass history of dry, warm, and sunlit conditions at ground level (Fig. 1) and cold, dry, sunlit air masses arriving from elevated altitudes (Figs. 3 and 5), along with elevated NCoarse and ozone. GOM during Event 1a was moderately negatively correlated with the H2O mixing ratio and significant at the 95 % confidence level (CL) using the Spearman rank correlation (Fig. 7a), although no correlation was found for accumulated precipitation (Fig. 7b). GOM during Event 1a was also strongly positively correlated with ozone, NCoarse, and BC at the 95 % CL (Fig. 7e, g, and i), indicating biomass burning could be a potential factor influencing this event. While active fires might not be directly producing GOM (Friedli et al., 2003), they can explain elevated levels of NCoarse, BC, and ozone (Andreae, 2019). Indeed, trajectories during Event 1a experienced extensive intersection with active fires, especially during the first half of the event, under a range of altitudes during transport (Fig. 5a). This range of altitudes could allow for injected active fire emissions to be entrained into the event air mass. Coarse-mode particles emitted from active fires could provide a heterogenous surface for halogen recycling. Although there were no intersections with trajectories and active fires during the second half of this event, coarse-mode particles could arise from other sources (e.g., sea salt aerosol) or result from interactions occurring beyond the length of the trajectories. Thus, while Event 1a exhibited the general pattern for GOM formation in the cold, dry, and sunlit free troposphere, emissions of coarse-mode aerosols from active fires likely influenced this event.
On the morning of 26 August, GOM concentrations dropped to zero, which marked the end of Event 1a and the beginning of Event 1b. Event 1b experienced similar conditions at ground level, although the air masses were colder, drier, and from higher altitudes with increased radiation (Table S2 and Fig. 3). During Event 1b, GOM displayed a moderately negative correlation with H2O mixing ratios, although this was only significant at the 90 % CL and was not correlated with accumulated precipitation (Fig. 7a and c). GOM during Event 1b was strongly positively correlated with ozone at the 95 % CL and displayed moderate correlations with NCoarse and BC however they were not statistically significant (Fig. 7e, g, and i). Air masses during this event were confined to the Arctic, exhibited no intersection with active fires, and experienced extensive surface layer contact 50 h before arrival; however, this event showed similar levels of GOM when compared to Event 1a. Even though air masses experienced surface layer contact 50 h backward, they were extremely dry and previously resided aloft under cold temperatures (Fig. 3). These conditions are conducive for the formation of GOM and inhibit its removal. The source of coarse-mode particles could be emissions from active fires on timescales greater than 240 h, given the strong correlation with ozone and the moderate yet insignificant correlations with NCoarse and BC (Fig. 7g and i), or possibly other sources such as sea salt. GOM during Event 1b appears to be formed in the cold, dry, sunlit free troposphere, with an unknown source of coarse-mode aerosols.
Event 2 displayed the overall pattern of warm, dry, sunlit conditions at ground level accompanied by cold, dry, sunlit conditions in the free troposphere, similar to Event 1a and 1b, although Event 2 exhibited increased accumulated precipitation and H2O mixing ratios relative to the other events in 2019 (Fig. 1c). GOM during Event 2 showed a weak correlation with H2O mixing ratios and accumulated precipitation, with only the former being significant at the 95 % CL (Fig. 7a and c). NCoarse and BC showed no enhancement and were constant, while ozone started low and increased throughout the event. GOM during Event 2 was weakly positively correlated with ozone, NCoarse, and BC, and none of these showed a significant correlation at the 95 % CL (Fig. 7e, g, and i). Air masses at the beginning of Event 2 originated from the Greenland Sea and then transitioned to a circulation pattern starting near Eurasia before traversing over North America (Fig. 5), and the intersection with active fires was present albeit infrequent. If active fires were influencing GOM concentrations during this event, their signature is likely masked by the increased levels of accumulated precipitation and H2O mixing ratios, which is also likely responsible for the decreased levels of GOM, NCoarse, and BC during Event 2 relative to 1a and 1b (Table S2), as well as weak correlations. Therefore, the observed levels during Event 2 are likely the result of GOM formation in the cold, dry, sunlit free troposphere, and the source of coarse-mode particles was possibly active fires, with the decreased levels of GOM, NCoarse, and BC being due to wet removal.
Event 3 showed the largest observed levels of GOM but showed no obvious features indicating the cause. Radiation, RH, and temperature displayed the opposite pattern for GOM formation, with low levels of radiation, high and increasing values of RH, and decreasing temperatures during the beginning of the event. H2O mixing ratio and accumulated precipitation both showed low values compared to non-event periods (Fig. 2b), with GOM showing and a moderate correlation with H2O mixing ratios and no correlation with accumulated precipitation (Fig. 7b and c). Ozone showed an enhancement during this event but was low compared to other events and did not show a correlation with GOM (Fig. 7f). NCoarse and BC both displayed enhancements during this event and were both strongly correlated with GOM (Fig. 7h and j). Air masses originated from the Arctic Ocean and the Barents Sea, with only one active fire intersecting trajectories in western Russia (Fig. 5d). The air mass history of this event exhibited the highest temperatures and RHs, the lowest altitudes, the most time spent above the mixed layer, and the most time within a cloud (Table S2). However, this event did experience cold, dry, and sunlit conditions several hours before arrival (Fig. 4) and a steep descent before arrival (Fig. 5d). The free troposphere has been shown to be a source of aerosol particles to the boundary layer in the Arctic through entrainment and cloud-mediated transport (Igel et al., 2017). It is possible that the extended time that this event spent within a cloud resulted in the cloud-mediated transport of free troposphere constituents to the surface layer (Igel et al., 2017), although possible aqueous-phase oxidation of Hg0 cannot be ruled out (Lin and Pehkonen, 1998; Lyman et al., 2020). Activated and interstitial aerosol particles and GOM could also have undergone evaporation in the warm surface layer temperatures (Fig. 2). This event experienced favorable conditions for GOM formation (cold, dry, and sunlit air masses from aloft) shortly before arrival, followed by a quick descent into the surface layer, and these conditions could create a situation where GOM formation is favored and the removal is inhibited, resulting in the high levels. This is however a hypothesis that requires further research.
Event 4 occurred approx. 1 d after Event 3, experienced a similar geographical origin and similar levels of ozone, accumulated precipitation, NCoarse, and BC; however, the ground-level meteorological parameters showed differences in the amount of radiation, H2O mixing ratios, temperatures, and RHs (Figs. 2 and 5, Table S1). The temperature and RH during Event 4 displayed the general pattern observed for GOM formation that contrasted with the pattern of temperature and RH during Event 3. While the H2O mixing ratios at ground level were higher during Event 4 compared to Event 3, they showed no correlation with GOM (Fig. 7b). GOM and ozone during Event 4 showed a weak and insignificant correlation (95 % CL) and showed a moderate significant negative correlation with BC and none with NCoarse (Fig. 7f, h, and j). The air mass history showed Event 4 experienced lower temperatures, RHs, H2O mixing ratios, and time spent within a cloud, as well as higher radiation and altitudes, but a similar amount of time above the mixed layer compared to Event 3 (Table S2). Event 4 did not show as steep of a descent as Event 3 (Fig. 5d and e). The amount of time spent within a cloud could indicate cloud-mediated transport to the surface layer, and the slower rate of descent, coupled with the increased H2O mixing ratios at ground level, could lead to increased removal of GOM before being observed at Villum. Event 3 and 4 showed similarities that could indicate cloud-mediated transport from the free troposphere to the surface layer; however, there exist dissimilarities that suggest that Event 4 could be the result of entrainment of GOM formed in the cold, dry, sunlit free troposphere. It appears that the increased H2O mixing ratios at ground level during Event 4 is the reason for the decreased levels of GOM compared to Event 3. A definitive conclusion for the origin of this event is currently unavailable.
Event 5a exhibited high radiation, H2O mixing ratios, ozone, and temperature, along with low accumulated precipitation, RH, NCoarse, and BC at ground level (Fig. 2). GOM during this event was strongly negatively and significantly correlated with H2O mixing ratios but displayed no correlation with accumulated precipitation at the 95 % CL (Fig. 7b and d). This event showed a strong positive correlation between GOM and ozone and moderately negative, albeit significant, correlations with NCoarse and BC (Fig. 7f, h, and j). Air masses for this event arrived consistently from northern Scandinavia after low-level transport with high temperatures, RHs, and H2O mixing ratios and being exposed to less radiation (Fig. 4). Air masses circulated in the vicinity of active fires in northern Scandinavia before being transported to Villum (Fig. 5f). These conditions are opposite to the pattern identified for GOM formation, the cause of the observed GOM levels could therefore be the extensive interactions between trajectories and active fires, although the influence of anthropogenic pollution cannot be ruled out. Air masses were however warm, wet, and traveled at low altitudes under little radiation, and therefore it is reasonable to expect this air mass to be depleted in NCoarse and BC as well as GOM, given the high values of hydrological-related parameters. Ozone was elevated and strongly correlated with GOM during Event 5a (Figs. 2 and 7). Ozone could originate from both anthropogenic and natural sources, and ozone is only slightly water soluble, leading to less efficient wet removal (Sander, 2015). GOM observed during Event 5a appears to be the result of emissions either from active fires or anthropogenic sources in northern Scandinavia.
Air masses shifted from circulating northern Scandinavia to the Greenlandic continent on August 1, which coincided with the start of Event 5b. This event is a good example of the observed pattern of GOM formation: warm, dry, sunlit conditions at ground level and cold, dry, sunlit air masses from the free troposphere (Figs. 2 and 4). GOM during this event exhibited no correlation with H2O mixing ratio, accumulated precipitation, or BC while being strongly correlated with ozone and moderately positively correlated with NCoarse (Fig. 7). Enhancements of GOM, which exhibited a positive correlation with ozone, have also been observed during subsidence events in Antarctica (Brooks et al., 2008; Pfaffhuber et al., 2012). However, concentrations of NCoarse and BC were extremely low, which is expected of upper tropospheric air masses above the polar dome, which is extremely pristine (Schulz et al., 2019). With the low concentration of NCoarse, there does not appear to be a heterogenous surface for halogen propagation, although this could be due to particles smaller than 0.3 µm facilitating halogen propagation. Another source of reactive halogen species is the photolysis of halocarbons (Yang et al., 2005; Simpson et al., 2015). However, Gratz et al. (2015) found this source to be too slow to explain mercury oxidation in the upper troposphere. The origins of GOM during Event 5b appear to be the result of formation in the cold, dry, sunlit free troposphere over the Greenland ice sheet from an unknown source of halogens.
It is interesting to note the vast differences in air mass history for Events 5a and 5b even though both events observed similar levels of GEM, GOM, ozone, and NCoarse (Fig. 2). The main differences between these events lie in the H2O mixing ratios and RH (both at ground level and during transport), the temperature during transport, and the altitude (Tables S1 and S2). The median BC concentration for Event 5a was over double that of 5b, although was low compared to other events influenced by active fires, i.e., Events 1a and 1b (Table S1). During Event 5a, air masses were warmer, wetter, and traveled at lower altitudes compared to Event 5b; these conditions could lead to the removal of GOM, NCoarse, and BC through deposition and uptake into the aqueous phase. It is an intriguing observation that air masses that originated from the European continent and were subject to increased hydrological parameters during transport (Event 5a) have a similar composition of GOM, ozone, NCoarse, and BC to air masses that originated over Greenland (Event 5b). Currently, the explanation for these observations is unknown, and further research is required to fully resolve the interactions of anthropogenic and natural emissions, transport-related processes, and removal mechanisms that are responsible for these observations.
There were two episodes of enhanced NCoarse and BC, as presented in Sect. 3.5 and shown in Fig. 6, which appear to be the result of active fire emissions. These two events were interrupted by large amounts of accumulated precipitation on 27 August (Fig. 2). The air mass history during these two episodes shows warm and wet low-altitude trajectories with little radiation (Fig. 3); these conditions are unconducive towards GOM formation as indicated by the low levels of GOM; however, they show greatly enhanced concentrations of NCoarse and BC. Figure 6b and c show the geographical extent and intersection of air masses with active fires during the two episodes, respectively. The first few hours of the first episode show trajectories arriving from the central Arctic Ocean, which could arise from emissions in western Russia on longer timescales than 240 h; however, the reason is unknown at this time. The trajectories for both episodes intersect active fires in northern Scandinavia and Russia, and this region of Russia has been shown to emit large amounts of BC through flaring (Huang et al., 2015; Böttcher et al., 2021). It should be noted that the term active fires represents a thermal anomaly detected by MODIS and VIIRS and cannot distinguish between vegetation fires and fires due to flaring (Schroeder et al., 2014). The low-level transport, under wet conditions, will likely result in the removal of a fraction of the emissions from these active fires. However, fresh BC emissions are very hydrophobic (Dusek et al., 2006), and might not be removed as efficiently during transport. Event 5a experienced air mass arriving from northern Scandinavia having circulated over several active fires, although no large increase in BC was observed (Figs. 2 and 5). The large increase in NCoarse and BC during these two episodes is therefore likely due to the flaring activities in Russia, while the observed GOM in Event 5a could possibly be due to vegetation fires, although this cannot be confirmed in this study and anthropogenic sources remain a possibility.
While the behavior of GEM and GOM during the spring in the High Arctic has received much attention, the dynamics of GOM in the late summer and autumn have seldom been investigated. Therefore, we conducted measurements of GEM, GOM, PHg (only in 2020), meteorological parameters, ozone, and aerosol particle physical properties at Villum Research Station in northeastern Greenland during the High Arctic summer in 2019 and 2020. The general pattern observed for events of GOM enhancement appears to be cold, dry, sunlit air masses from the free troposphere, as opposed to the low levels of GOM connected with warm and wet air masses with little radiation observed during non-event periods. Coarse-mode aerosols provided a heterogenous surface for halogen propagation during certain events, while the source of halogens during other events remains unknown. Analysis of individual events displayed unique origins. GOM observed during Events 1a, 1b, and 2 were likely formed in the cold, dry, sunlit free troposphere with contributions of coarse-mode particles from active fires and possibly other sources. Decreased concentrations of GOM during Event 2 were likely due to wet removal. GOM observed during Events 3 and 4 appears to have formed in the cold, dry, sunlit free troposphere from an unknown source of halogens, and other processes are likely contributing to this; therefore, specific origins of these events cannot be ascertained. The observed GOM during Event 5a was likely the result of emissions from either active fires or anthropogenic activities in northern Scandinavia. The origins of GOM during Event 5b appear to be the result of formation in the cold, dry, sunlit free troposphere over the Greenland ice sheet from an unknown source of halogens. Two episodes of flaring emissions from Russia were observed that did not contribute to enhanced GOM levels.
These measurements and analyses provide insight into the behavior of GOM during summer at a High Arctic station and highlight the complex relationships between GOM formation, removal mechanisms, atmospheric constituents, and meteorological parameters during transport. The behavior of mercury in a changing Arctic climate is still an area with many knowledge gaps, and this work seeks to bridge those gaps, although further research (especially long-term, mercury speciation measurements) is needed.
With changing conditions in the Arctic (i.e., rising temperatures, melting sea ice, longer melt seasons), there is large uncertainty regarding the oxidation and deposition of mercury in response to these changes (Stern et al., 2012). For example, with the Arctic becoming warmer (Jiang et al., 2020) and therefore wetter, the feedback mechanisms on mercury oxidation remain an important scientific question. Warming temperatures will decrease the stability of the HgI intermediate and increase atmospheric water vapor, which will favor increased uptake of oxidized mercury into the aqueous phase and its removal by wet deposition. Forest fires are expected to increase in the future (Flannigan et al., 2009; Kelly et al., 2013), which could lead to an increase in coarse-mode particles. The magnitude of these effects and their consequences for GOM levels in the High Arctic is still an open question. Given the positive correlation between GOM and coarse-mode particles and their role in halogen activation, changes in the size distribution and chemical composition of aerosol particles could have implications for mercury oxidation. Recent trends in declining sea ice (Stroeve et al., 2012) could increase the sea salt and total aerosol burden, thus potentially increasing mercury oxidation and deposition via increased halogen recycling and particulate mercury deposition. Declining sea ice could also increase GEM evasion from the Arctic Ocean, shifting the Arctic Ocean from a sink to a source (Ariya et al., 2004; Dastoor and Durnford, 2014). Future studies addressing the contribution of the free troposphere to boundary layer GOM concentrations and flux measurements of dry and wet deposition of GOM in the summer will help answer these questions. The presented work aims to bridge some of the knowledge gaps in mercury processing although further research is needed to advance our understanding of how the behavior of atmospheric mercury will respond in a changing climate. Specifically, we recommend long-term measurements of mercury speciation at more High Arctic stations to obtain more information on the seasonality, trends, and geospatial distribution of atmospheric mercury species.
All data used in this publication are available to the community and can be accessed by request to the corresponding author Jakob Boyd Pernov (jbp@envs.au.dk).
The supplement related to this article is available online at: https://doi.org/10.5194/acp-21-13287-2021-supplement.
JBP, BJ, and HSK designed the study. JBP and BJ performed the mercury and aerosol sizing measurements. DCT and AM performed the black carbon measurements. JBP performed all data analysis and air mass history analysis. HSK led the project. JBP wrote the manuscript with comments from all co-authors.
The authors declare that they have no conflict of interest.
Publisher's note: Copernicus Publications remains neutral with regard to jurisdictional claims in published maps and institutional affiliations.
This article is part of the special issue “Research results from the 14th International Conference on Mercury as a Global Pollutant (ICMGP 2019), MercOx project, and iGOSP and iCUPE projects of ERA-PLANET in support of the Minamata Convention on Mercury (ACP/AMT inter-journal SI)”. It is not associated with a conference.
Thanks to the Royal Danish Air Force, Arctic Command, and the staff at Station Nord for providing logistic support to the project. Christel Christoffersen and Keld Mortensen are gratefully acknowledged for their technical support. We thank NOAA for use of the HYSPLIT model. We acknowledge the use of data from the NASA FIRMS application (https://firms.modaps.eosdis.nasa.gov/, 1 August 2021).
This study was funded by the Danish Environmental Protection Agency (DANCEA funds for Environmental Support to the Arctic Region project; grant no. 2019-7975) and by the European ERA-PLANET projects of iGOSP and iCUPE (consortium agreement no. 689443 for both projects). The Villum Foundation is gratefully acknowledged for financing Villum Research Station.
This paper was edited by Ralf Ebinghaus and reviewed by four anonymous referees.
AMAP: AMAP Assessment 2011: Mercury in the Arctic, Arctic Monitoring and Assessment Programme (AMAP), Oslo, Norway, xiv + 193 pp., 2011.
Ambrose, J. L.: Improved methods for signal processing in measurements of mercury by Tekran® 2537A and 2537B instruments, Atmos. Meas. Tech., 10, 5063–5073, https://doi.org/10.5194/amt-10-5063-2017, 2017.
Andreae, M. O.: Emission of trace gases and aerosols from biomass burning – an updated assessment, Atmos. Chem. Phys., 19, 8523–8546, https://doi.org/10.5194/acp-19-8523-2019, 2019.
Angot, H., Dastoor, A., De Simone, F., Gårdfeldt, K., Gencarelli, C. N., Hedgecock, I. M., Langer, S., Magand, O., Mastromonaco, M. N., Nordstrøm, C., Pfaffhuber, K. A., Pirrone, N., Ryjkov, A., Selin, N. E., Skov, H., Song, S., Sprovieri, F., Steffen, A., Toyota, K., Travnikov, O., Yang, X., and Dommergue, A.: Chemical cycling and deposition of atmospheric mercury in polar regions: review of recent measurements and comparison with models, Atmos. Chem. Phys., 16, 10735–10763, https://doi.org/10.5194/acp-16-10735-2016, 2016.
Ariya, P. A., Dastroor, A. P., Amyot, M., Schroeder, W. H., Barrie, L., Anlauf, K., Raofie, F., Ryzhkov, A., Davignon, D., Lalonde, J., and Steffen, A.: The Arctic: a sink for mercury, Tellus B, 56, 397–403, https://doi.org/10.3402/tellusb.v56i5.16458, 2004.
Ariya, P. A., Amyot, M., Dastoor, A., Deeds, D., Feinberg, A., Kos, G., Poulain, A., Ryjkov, A., Semeniuk, K., Subir, M., and Toyota, K.: Mercury physicochemical and biogeochemical transformation in the atmosphere and at atmospheric interfaces: a review and future directions, Chem. Rev., 115, 3760–3802, https://doi.org/10.1021/cr500667e, 2015.
Arnold, S. R., Emmons, L. K., Monks, S. A., Law, K. S., Ridley, D. A., Turquety, S., Tilmes, S., Thomas, J. L., Bouarar, I., Flemming, J., Huijnen, V., Mao, J., Duncan, B. N., Steenrod, S., Yoshida, Y., Langner, J., and Long, Y.: Biomass burning influence on high-latitude tropospheric ozone and reactive nitrogen in summer 2008: a multi-model analysis based on POLMIP simulations, Atmos. Chem. Phys., 15, 6047–6068, https://doi.org/10.5194/acp-15-6047-2015, 2015.
Aspmo, K., Temme, C., Berg, T., Ferrari, C., Gauchard, P. A., Fain, X., and Wibetoe, G.: Mercury in the atmosphere, snow and melt water ponds in the North Atlantic Ocean during Arctic summer, Environ. Sci. Technol., 40, 4083–4089, https://doi.org/10.1021/es052117z, 2006.
Atkinson, H. M., Hughes, C., Shaw, M. J., Roscoe, H. K., Carpenter, L. J., and Liss, P. S.: Halocarbons associated with Arctic sea ice, Deep-Sea Res. Pt. I, 92, 162–175, https://doi.org/10.1016/j.dsr.2014.05.012, 2014.
Backman, J., Schmeisser, L., Virkkula, A., Ogren, J. A., Asmi, E., Starkweather, S., Sharma, S., Eleftheriadis, K., Uttal, T., Jefferson, A., Bergin, M., Makshtas, A., Tunved, P., and Fiebig, M.: On Aethalometer measurement uncertainties and an instrument correction factor for the Arctic, Atmos. Meas. Tech., 10, 5039–5062, https://doi.org/10.5194/amt-10-5039-2017, 2017.
Berg, T., Sekkesæter, S., Steinnes, E., Valdal, A.-K., and Wibetoe, G.: Springtime depletion of mercury in the European Arctic as observed at Svalbard, Sci. Total Environ., 304, 43–51, https://doi.org/10.1016/S0048-9697(02)00555-7, 2003.
Bognar, K., Zhao, X., Strong, K., Chang, R. Y.-W., Frieß, U., Hayes, P. L., McClure-Begley, A., Morris, S., Tremblay, S., and Vicente-Luis, A.: Measurements of Tropospheric Bromine Monoxide Over Four Halogen Activation Seasons in the Canadian High Arctic, J. Geophys. Res.-Atmos., 125, e2020JD033015, https://doi.org/10.1029/2020jd033015, 2020.
Bolton, D.: The Computation of Equivalent Potential Temperature, Mon. Weather Rev., 108, 1046–1053, https://doi.org/10.1175/1520-0493(1980)108<1046:Tcoept>2.0.Co;2, 1980.
Böttcher, K., Paunu, V.-V., Kupiainen, K., Zhizhin, M., Matveev, A., Savolahti, M., Klimont, Z., Väätäinen, S., Lamberg, H., and Karvosenoja, N.: Black carbon emissions from flaring in Russia in the period 2012–2017, Atmos. Environ., 254, 118390, https://doi.org/10.1016/j.atmosenv.2021.118390, 2021.
Brooks, I. M., Tjernström, M., Persson, P. O. G., Shupe, M. D., Atkinson, R. A., Canut, G., Birch, C. E., Mauritsen, T., Sedlar, J., and Brooks, B. J.: The Turbulent Structure of the Arctic Summer Boundary Layer During The Arctic Summer Cloud-Ocean Study, J. Geophys. Res.-Atmos., 122, 9685–9704, https://doi.org/10.1002/2017JD027234, 2017.
Brooks, S., Arimoto, R., Lindberg, S., and Southworth, G.: Antarctic polar plateau snow surface conversion of deposited oxidized mercury to gaseous elemental mercury with fractional long-term burial, Atmos. Environ., 42, 2877–2884, https://doi.org/10.1016/j.atmosenv.2007.05.029, 2008.
Brooks, S., Moore, C., Lew, D., Lefer, B., Huey, G., and Tanner, D.: Temperature and sunlight controls of mercury oxidation and deposition atop the Greenland ice sheet, Atmos. Chem. Phys., 11, 8295–8306, https://doi.org/10.5194/acp-11-8295-2011, 2011.
Brooks, S. B., Saiz-Lopez, A., Skov, H., Lindberg, S. E., Plane, J. M. C., and Goodsite, M. E.: The mass balance of mercury in the springtime arctic environment, Geophys. Res. Lett., 33, L13812, https://doi.org/10.1029/2005gl025525, 2006.
Browse, J., Carslaw, K. S., Arnold, S. R., Pringle, K., and Boucher, O.: The scavenging processes controlling the seasonal cycle in Arctic sulphate and black carbon aerosol, Atmos. Chem. Phys., 12, 6775–6798, https://doi.org/10.5194/acp-12-6775-2012, 2012.
Burd, J. A., Peterson, P. K., Nghiem, S. V., Perovich, D. K., and Simpson, W. R.: Snowmelt onset hinders bromine monoxide heterogeneous recycling in the Arctic, J. Geophys. Res.-Atmos., 122, 8297–8309, https://doi.org/10.1002/2017jd026906, 2017.
Calvert, J. G. and Lindberg, S. E.: Mechanisms of mercury removal by O3 and OH in the atmosphere, Atmos. Environ., 39, 3355–3367, https://doi.org/10.1016/j.atmosenv.2005.01.055, 2005.
Cavalieri, D. J., Parkinson, C. L., Gloersen, P., and Zwally, H. J.: Sea Ice Concentrations from Nimbus-7 SMMR and DMSP SSM/I-SSMIS Passive Microwave Data, Version 1, https://doi.org/10.5067/8GQ8LZQVL0VL, 1996.
Christensen, J. H., Brandt, J., Frohn, L. M., and Skov, H.: Modelling of Mercury in the Arctic with the Danish Eulerian Hemispheric Model, Atmos. Chem. Phys., 4, 2251–2257, https://doi.org/10.5194/acp-4-2251-2004, 2004.
Cole, A. S. and Steffen, A.: Trends in long-term gaseous mercury observations in the Arctic and effects of temperature and other atmospheric conditions, Atmos. Chem. Phys., 10, 4661–4672, https://doi.org/10.5194/acp-10-4661-2010, 2010.
Comiso, J. C.: Large Decadal Decline of the Arctic Multiyear Ice Cover, J. Climate, 25, 1176–1193, https://doi.org/10.1175/jcli-d-11-00113.1, 2012.
Croft, B., Martin, R. V., Leaitch, W. R., Tunved, P., Breider, T. J., D'Andrea, S. D., and Pierce, J. R.: Processes controlling the annual cycle of Arctic aerosol number and size distributions, Atmos. Chem. Phys., 16, 3665–3682, https://doi.org/10.5194/acp-16-3665-2016, 2016.
Dastoor, A. P. and Durnford, D. A.: Arctic Ocean: Is It a Sink or a Source of Atmospheric Mercury?, Environ. Sci. Technol., 48, 1707–1717, https://doi.org/10.1021/es404473e, 2014.
Dastoor, A. P., Davignon, D., Theys, N., Van Roozendael, M., Steffen, A., and Ariya, P. A.: Modeling Dynamic Exchange of Gaseous Elemental Mercury at Polar Sunrise, Environ. Sci. Technol., 42, 5183–5188, https://doi.org/10.1021/es800291w, 2008.
Dibb, J. E., Arsenault, M., Peterson, M. C., and Honrath, R. E.: Fast nitrogen oxide photochemistry in Summit, Greenland snow, Atmos. Environ., 36, 2501–2511, https://doi.org/10.1016/s1352-2310(02)00130-9, 2002.
Dibble, T. S., Zelie, M. J., and Mao, H.: Thermodynamics of reactions of ClHg and BrHg radicals with atmospherically abundant free radicals, Atmos. Chem. Phys., 12, 10271–10279, https://doi.org/10.5194/acp-12-10271-2012, 2012.
DiMento, B. P., Mason, R. P., Brooks, S., and Moore, C.: The impact of sea ice on the air-sea exchange of mercury in the Arctic Ocean, Deep-Sea Res. Pt. I, 144, 28–38, https://doi.org/10.1016/j.dsr.2018.12.001, 2019.
Donohoue, D. L., Bauer, D., Cossairt, B., and Hynes, A. J.: Temperature and Pressure Dependent Rate Coefficients for the Reaction of Hg with Br and the Reaction of Br with Br: A Pulsed Laser Photolysis-Pulsed Laser Induced Fluorescence Study, J. Phys. Chem. A, 110, 6623–6632, https://doi.org/10.1021/jp054688j, 2006.
Douglas, T. A. and Blum, J. D.: Mercury Isotopes Reveal Atmospheric Gaseous Mercury Deposition Directly to the Arctic Coastal Snowpack, Environ. Sci. Technol. Lett., 6, 235–242, https://doi.org/10.1021/acs.estlett.9b00131, 2019.
Douglas, T. A., Sturm, M., Blum, J. D., Polashenski, C., Stuefer, S., Hiemstra, C., Steffen, A., Filhol, S., and Prevost, R.: A Pulse of Mercury and Major Ions in Snowmelt Runoff from a Small Arctic Alaska Watershed, Environ. Sci. Technol., 51, 11145–11155, https://doi.org/10.1021/acs.est.7b03683, 2017.
Draxler, R. R. and Hess, G. D.: An overview of the HYSPLIT_4 modelling system for trajectories, dispersion and deposition, Aust. Meteorol. Mag., 47, 295–308, 1998.
Drinovec, L., Močnik, G., Zotter, P., Prévôt, A. S. H., Ruckstuhl, C., Coz, E., Rupakheti, M., Sciare, J., Müller, T., Wiedensohler, A., and Hansen, A. D. A.: The “dual-spot” Aethalometer: an improved measurement of aerosol black carbon with real-time loading compensation, Atmos. Meas. Tech., 8, 1965–1979, https://doi.org/10.5194/amt-8-1965-2015, 2015.
Durnford, D. and Dastoor, A.: The behavior of mercury in the cryosphere: A review of what we know from observations, J. Geophys. Res., 116, D06305, https://doi.org/10.1029/2010jd014809, 2011.
Dusek, U., Reischl, G. P., and Hitzenberger, R.: CCN Activation of Pure and Coated Carbon Black Particles, Environ. Sci. Technol., 40, 1223–1230, https://doi.org/10.1021/es0503478, 2006.
Faïn, X., Obrist, D., Hallar, A. G., McCubbin, I., and Rahn, T.: High levels of reactive gaseous mercury observed at a high elevation research laboratory in the Rocky Mountains, Atmos. Chem. Phys., 9, 8049–8060, https://doi.org/10.5194/acp-9-8049-2009, 2009.
Flannigan, M., Stocks, B., Turetsky, M., and Wotton, M.: Impacts of climate change on fire activity and fire management in the circumboreal forest, Global Change Biol., 15, 549–560, https://doi.org/10.1111/j.1365-2486.2008.01660.x, 2009.
Freud, E., Krejci, R., Tunved, P., Leaitch, R., Nguyen, Q. T., Massling, A., Skov, H., and Barrie, L.: Pan-Arctic aerosol number size distributions: seasonality and transport patterns, Atmos. Chem. Phys., 17, 8101–8128, https://doi.org/10.5194/acp-17-8101-2017, 2017.
Frey, M. M., Norris, S. J., Brooks, I. M., Anderson, P. S., Nishimura, K., Yang, X., Jones, A. E., Nerentorp Mastromonaco, M. G., Jones, D. H., and Wolff, E. W.: First direct observation of sea salt aerosol production from blowing snow above sea ice, Atmos. Chem. Phys., 20, 2549–2578, https://doi.org/10.5194/acp-20-2549-2020, 2020.
Friedli, H. R., Radke, L. F., Lu, J. Y., Banic, C. M., Leaitch, W. R., and MacPherson, J. I.: Mercury emissions from burning of biomass from temperate North American forests: laboratory and airborne measurements, Atmos. Environ., 37, 253–267, https://doi.org/10.1016/S1352-2310(02)00819-1, 2003.
Friedli, H. R., Arellano, A. F., Cinnirella, S., and Pirrone, N.: Initial Estimates of Mercury Emissions to the Atmosphere from Global Biomass Burning, Environ. Sci. Technol., 43, 3507–3513, https://doi.org/10.1021/es802703g, 2009.
Fu, X., Marusczak, N., Heimbürger, L. E., Sauvage, B., Gheusi, F., Prestbo, E. M., and Sonke, J. E.: Atmospheric mercury speciation dynamics at the high-altitude Pic du Midi Observatory, southern France, Atmos. Chem. Phys., 16, 5623–5639, https://doi.org/10.5194/acp-16-5623-2016, 2016.
Giordano, M. R., Kalnajs, L. E., Goetz, J. D., Avery, A. M., Katz, E., May, N. W., Leemon, A., Mattson, C., Pratt, K. A., and DeCarlo, P. F.: The importance of blowing snow to halogen-containing aerosol in coastal Antarctica: influence of source region versus wind speed, Atmos. Chem. Phys., 18, 16689–16711, https://doi.org/10.5194/acp-18-16689-2018, 2018.
Goodsite, M. E., Plane, J. M. C., and Skov, H.: A theoretical study of the oxidation of Hg0 to HgBr2 in the troposphere, Environ. Sci. Technol., 38, 1772–1776, https://doi.org/10.1021/es034680s, 2004.
Goodsite, M. E., Plane, J. M. C., and Skov, H.: Correction to A Theoretical Study of the Oxidation of Hg0 to HgBr2 in the Troposphere, Environ. Sci. Technol., 46, 5262–5262, https://doi.org/10.1021/es301201c, 2012.
Gratz, L. E., Ambrose, J. L., Jaffe, D. A., Shah, V., Jaegle, L., Stutz, J., Festa, J., Spolaor, M., Tsai, C., Selin, N. E., Song, S., Zhou, X., Weinheimer, A. J., Knapp, D. J., Montzka, D. D., Flocke, F. M., Campos, T. L., Apel, E., Hornbrook, R., Blake, N. J., Hall, S., Tyndall, G. S., Reeves, M., Stechman, D., and Stell, M.: Oxidation of mercury by bromine in the subtropical Pacific free troposphere, Geophys. Res. Lett., 42, 10494–10502, https://doi.org/10.1002/2015gl066645, 2015.
Greene, C. A.: Arctic Sea ice, available at: https://www.mathworks.com/matlabcentral/fileexchange/56923-arctic-sea-ice, last access: 26 January 2020.
Greene, C. A., Gwyther, D. E., and Blankenship, D. D.: Antarctic Mapping Tools for MATLAB, Comput. Geosci., 104, 151–157, https://doi.org/10.1016/j.cageo.2016.08.003, 2017.
Gustin, M. S., Amos, H. M., Huang, J., Miller, M. B., and Heidecorn, K.: Measuring and modeling mercury in the atmosphere: a critical review, Atmos. Chem. Phys., 15, 5697–5713, https://doi.org/10.5194/acp-15-5697-2015, 2015.
Gustin, M. S., Dunham-Cheatham, S. M., Huang, J., Lindberg, S., and Lyman, S. N.: Development of an Understanding of Reactive Mercury in Ambient Air: A Review, Atmosphere, 12, 73, https://doi.org/10.3390/atmos12010073, 2021.
Halfacre, J. W., Shepson, P. B., and Pratt, K. A.: pH-dependent production of molecular chlorine, bromine, and iodine from frozen saline surfaces, Atmos. Chem. Phys., 19, 4917–4931, https://doi.org/10.5194/acp-19-4917-2019, 2019.
Hara, K., Osada, K., Yabuki, M., Takashima, H., Theys, N., and Yamanouchi, T.: Important contributions of sea-salt aerosols to atmospheric bromine cycle in the Antarctic coasts, Scient. Rep., 8, 13852, https://doi.org/10.1038/s41598-018-32287-4, 2018.
Helmig, D., Oltmans, S. J., Carlson, D., Lamarque, J.-F., Jones, A., Labuschagne, C., Anlauf, K., and Hayden, K.: A review of surface ozone in the polar regions, Atmos. Environ., 41, 5138–5161, https://doi.org/10.1016/j.atmosenv.2006.09.053, 2007.
Hirdman, D., Aspmo, K., Burkhart, J. F., Eckhardt, S., Sodemann, H., and Stohl, A.: Transport of mercury in the Arctic atmosphere: Evidence for a spring-time net sink and summer-time source, Geophys. Res. Lett., 36, L12814, https://doi.org/10.1029/2009gl038345, 2009.
Holmes, C. D., Jacob, D. J., and Yang, X.: Global lifetime of elemental mercury against oxidation by atomic bromine in the free troposphere, Geophys. Res. Lett., 33, L20808, https://doi.org/10.1029/2006gl027176, 2006.
Holmes, C. D., Jacob, D. J., Corbitt, E. S., Mao, J., Yang, X., Talbot, R., and Slemr, F.: Global atmospheric model for mercury including oxidation by bromine atoms, Atmos. Chem. Phys., 10, 12037–12057, https://doi.org/10.5194/acp-10-12037-2010, 2010.
Horowitz, H. M., Jacob, D. J., Zhang, Y., Dibble, T. S., Slemr, F., Amos, H. M., Schmidt, J. A., Corbitt, E. S., Marais, E. A., and Sunderland, E. M.: A new mechanism for atmospheric mercury redox chemistry: implications for the global mercury budget, Atmos. Chem. Phys., 17, 6353–6371, https://doi.org/10.5194/acp-17-6353-2017, 2017.
Huang, J. and Gustin, M. S.: Uncertainties of Gaseous Oxidized Mercury Measurements Using KCl-Coated Denuders, Cation-Exchange Membranes, and Nylon Membranes: Humidity Influences, Environ. Sci. Technol., 49, 6102–6108, https://doi.org/10.1021/acs.est.5b00098, 2015.
Huang, J., Miller, M. B., Edgerton, E., and Sexauer Gustin, M.: Deciphering potential chemical compounds of gaseous oxidized mercury in Florida, USA, Atmos. Chem. Phys., 17, 1689–1698, https://doi.org/10.5194/acp-17-1689-2017, 2017.
Huang, K., Fu, J. S., Prikhodko, V. Y., Storey, J. M., Romanov, A., Hodson, E. L., Cresko, J., Morozova, I., Ignatieva, Y., and Cabaniss, J.: Russian anthropogenic black carbon: Emission reconstruction and Arctic black carbon simulation, J. Geophys. Res.-Atmos., 120, 11306–11333, https://doi.org/10.1002/2015JD023358, 2015.
Hynes, A. J., Donohoue, D. L., Goodsite, M. E., and Hedgecock, I. M.: Our current understanding of major chemical and physical processes affecting mercury dynamics in the atmosphere and at the air-water/terrestrial interfaces, in: Mercury Fate and Transport in the Global Atmosphere: Emissions, Measurements and Models, edited by: Mason, R. and Pirrone, N., Springer US, Boston, MA, 427–457, 2009.
Igel, A. L., Ekman, A. M. L., Leck, C., Tjernström, M., Savre, J., and Sedlar, J.: The free troposphere as a potential source of arctic boundary layer aerosol particles, Geophys. Res. Lett., 44, 7053–7060, https://doi.org/10.1002/2017gl073808, 2017.
Jacob, D. J., Crawford, J. H., Maring, H., Clarke, A. D., Dibb, J. E., Emmons, L. K., Ferrare, R. A., Hostetler, C. A., Russell, P. B., Singh, H. B., Thompson, A. M., Shaw, G. E., McCauley, E., Pederson, J. R., and Fisher, J. A.: The Arctic Research of the Composition of the Troposphere from Aircraft and Satellites (ARCTAS) mission: design, execution, and first results, Atmos. Chem. Phys., 10, 5191–5212, https://doi.org/10.5194/acp-10-5191-2010, 2010.
Jiang, S., Ye, A., and Xiao, C.: The temperature increase in Greenland has accelerated in the past five years, Global Planet. Change, 194, 103297, https://doi.org/10.1016/j.gloplacha.2020.103297, 2020.
Jiao, Y. and Dibble, T. S.: Quality Structures, Vibrational Frequencies, and Thermochemistry of the Products of Reaction of BrHg with NO2, HO2, ClO, BrO, and IO, J. Phys. Chem. A, 119, 10502–10510, https://doi.org/10.1021/acs.jpca.5b04889, 2015.
Jiao, Y. and Dibble, T. S.: First kinetic study of the atmospherically important reactions BrHgy+NO2 and BrHgy+HOO, Phys. Chem. Chem. Phys., 19, 1826–1838, https://doi.org/10.1039/C6CP06276H, 2017a.
Jiao, Y. and Dibble, T. S.: Structures, Vibrational Frequencies, and Bond Energies of the BrHgOX and BrHgXO Species Formed in Atmospheric Mercury Depletion Events, J. Phys. Chem. A, 121, 7976–7985, https://doi.org/10.1021/acs.jpca.7b06829, 2017b.
Jiskra, M., Sonke, J. E., Agnan, Y., Helmig, D., and Obrist, D.: Insights from mercury stable isotopes on terrestrial–atmosphere exchange of Hg(0) in the Arctic tundra, Biogeosciences, 16, 4051–4064, https://doi.org/10.5194/bg-16-4051-2019, 2019.
Kaleschke, L., Richter, A., Burrows, J., Afe, O., Heygster, G., Notholt, J., Rankin, A. M., Roscoe, H. K., Hollwedel, J., Wagner, T., and Jacobi, H. W.: Frost flowers on sea ice as a source of sea salt and their influence on tropospheric halogen chemistry, Geophys. Res. Lett., 31, L16114, https://doi.org/10.1029/2004gl020655, 2004.
Kamp, J., Skov, H., Jensen, B., and Sorensen, L. L.: Fluxes of gaseous elemental mercury (GEM) in the High Arctic during atmospheric mercury depletion events (AMDEs), Atmos. Chem. Phys., 18, 6923–6938, https://doi.org/10.5194/acp-18-6923-2018, 2018.
Kelly, R., Chipman, M. L., Higuera, P. E., Stefanova, I., Brubaker, L. B., and Hu, F. S.: Recent burning of boreal forests exceeds fire regime limits of the past 10,000 years, P. Natl. Acad. Sci. USA, 110, 13055–13060, https://doi.org/10.1073/pnas.1305069110, 2013.
Lampert, A., Maturilli, M., Ritter, C., Hoffmann, A., Stock, M., Herber, A., Birnbaum, G., Neuber, R., Dethloff, K., Orgis, T., Stone, R., Brauner, R., Kässbohrer, J., Haas, C., Makshtas, A., Sokolov, V., and Liu, P.: The Spring-Time Boundary Layer in the Central Arctic Observed during PAMARCMiP 2009, Atmosphere, 3, 320–351, 2012.
Landis, M. S., Stevens, R. K., Schaedlich, F., and Prestbo, E. M.: Development and characterization of an annular denuder methodology for the measurement of divalent inorganic reactive gaseous mercury in ambient air, Environ. Sci. Technol., 36, 3000–3009, https://doi.org/10.1021/es015887t, 2002.
Laurier, F. J. G.: Reactive gaseous mercury formation in the North Pacific Ocean's marine boundary layer: A potential role of halogen chemistry, J. Geophys. Res., 108, 4529, https://doi.org/10.1029/2003jd003625, 2003.
Law, K. S., Stohl, A., Quinn, P. K., Brock, C. A., Burkhart, J. F., Paris, J.-D., Ancellet, G., Singh, H. B., Roiger, A., Schlager, H., Dibb, J., Jacob, D. J., Arnold, S. R., Pelon, J., and Thomas, J. L.: Arctic Air Pollution: New Insights from POLARCAT-IPY, B. Am. Meteorol. Soc., 95, 1873–1895, https://doi.org/10.1175/bams-d-13-00017.1, 2014.
Lin, C.-J. and Pehkonen, S. O.: Oxidation of elemental mercury by aqueous chlorine (): Implications for tropospheric mercury chemistry, J. Geophys. Res.-Atmos., 103, 28093–28102, https://doi.org/10.1029/98JD02304, 1998.
Lindberg, S. E., Brooks, S., Lin, C. J., Scott, K. J., Landis, M. S., Stevens, R. K., Goodsite, M., and Richter, A.: Dynamic oxidation of gaseous mercury in the Arctic troposphere at polar sunrise, Environ. Sci. Technol., 36, 1245–1256, https://doi.org/10.1021/es0111941, 2002.
Lu, J. Y., Schroeder, W. H., Barrie, L. A., Steffen, A., Welch, H. E., Martin, K., Lockhart, L., Hunt, R. V., Boila, G., and Richter, A.: Magnification of atmospheric mercury deposition to polar regions in springtime: The link to tropospheric ozone depletion chemistry, Geophys. Res. Lett., 28, 3219–3222, https://doi.org/10.1029/2000gl012603, 2001.
Lyman, S. N., Cheng, I., Gratz, L. E., Weiss-Penzias, P., and Zhang, L.: An updated review of atmospheric mercury, Sci. Total Environ., 707, 135575, https://doi.org/10.1016/j.scitotenv.2019.135575, 2020.
Macdonald, R. W. and Loseto, L. L.: Are Arctic Ocean ecosystems exceptionally vulnerable to global emissions of mercury? A call for emphasised research on methylation and the consequences of climate change, Environ. Chem., 7, 133–138, https://doi.org/10.1071/en09127, 2010.
Marusczak, N., Sonke, J. E., Fu, X., and Jiskra, M.: Tropospheric GOM at the Pic du Midi Observatory – Correcting Bias in Denuder Based Observations, Environ. Sci. Technol., 51, 863–869, https://doi.org/10.1021/acs.est.6b04999, 2017.
Møller, A. K., Barkay, T., Al-Soud, W. A., Sørensen, S. J., Skov, H., and Kroer, N.: Diversity and characterization of mercury-resistant bacteria in snow, freshwater and sea-ice brine from the High Arctic, FEMS Microbiol. Ecol., 75, 390–401, https://doi.org/10.1111/j.1574-6941.2010.01016.x, 2011.
Monks, S. A., Arnold, S. R., Emmons, L. K., Law, K. S., Turquety, S., Duncan, B. N., Flemming, J., Huijnen, V., Tilmes, S., Langner, J., Mao, J., Long, Y., Thomas, J. L., Steenrod, S. D., Raut, J. C., Wilson, C., Chipperfield, M. P., Diskin, G. S., Weinheimer, A., Schlager, H., and Ancellet, G.: Multi-model study of chemical and physical controls on transport of anthropogenic and biomass burning pollution to the Arctic, Atmos. Chem. Phys., 15, 3575–3603, https://doi.org/10.5194/acp-15-3575-2015, 2015.
Muntean, M., Janssens-Maenhout, G., Song, S., Giang, A., Selin, N. E., Zhong, H., Zhao, Y., Olivier, J. G. J., Guizzardi, D., Crippa, M., Schaaf, E., and Dentener, F.: Evaluating EDGARv4.tox2 speciated mercury emissions ex-post scenarios and their impacts on modelled global and regional wet deposition patterns, Atmos. Environ., 184, 56–68, https://doi.org/10.1016/j.atmosenv.2018.04.017, 2018.
Nguyen, Q. T., Glasius, M., Sorensen, L. L., Jensen, B., Skov, H., Birmili, W., Wiedensohler, A., Kristensson, A., Nojgaard, J. K., and Massling, A.: Seasonal variation of atmospheric particle number concentrations, new particle formation and atmospheric oxidation capacity at the high Arctic site Villum Research Station, Station Nord, Atmos. Chem. Phys., 16, 11319–11336, https://doi.org/10.5194/acp-16-11319-2016, 2016.
Obrist, D., Tas, E., Peleg, M., Matveev, V., Faïn, X., Asaf, D., and Luria, M.: Bromine-induced oxidation of mercury in the mid-latitude atmosphere, Nat. Geosci., 4, 22–26, https://doi.org/10.1038/ngeo1018, 2010.
Pal, B. and Ariya, P. A.: Studies of ozone initiated reactions of gaseous mercury: kinetics, product studies, and atmospheric implications, Phys. Chem. Chem. Phys., 6, 572–579, https://doi.org/10.1039/B311150D, 2004.
Park, J.-D. and Zheng, W.: Human Exposure and Health Effects of Inorganic and Elemental Mercury, J. Prev. Med. Publ. Health, 45, 344–352, https://doi.org/10.3961/jpmph.2012.45.6.344, 2012.
Peterson, P. K., Pöhler, D., Sihler, H., Zielcke, J., General, S., Frieß, U., Platt, U., Simpson, W. R., Nghiem, S. V., Shepson, P. B., Stirm, B. H., Dhaniyala, S., Wagner, T., Caulton, D. R., Fuentes, J. D., and Pratt, K. A.: Observations of bromine monoxide transport in the Arctic sustained on aerosol particles, Atmos. Chem. Phys., 17, 7567–7579, https://doi.org/10.5194/acp-17-7567-2017, 2017.
Peterson, P. K., Pöhler, D., Zielcke, J., General, S., Frieß, U., Platt, U., Simpson, W. R., Nghiem, S. V., Shepson, P. B., Stirm, B. H., and Pratt, K. A.: Springtime Bromine Activation over Coastal and Inland Arctic Snowpacks, ACS Earth Space Chem., 2, 1075–1086, https://doi.org/10.1021/acsearthspacechem.8b00083, 2018.
Peterson, P. K., Hartwig, M., May, N. W., Schwartz, E., Rigor, I., Ermold, W., Steele, M., Morison, J. H., Nghiem, S. V., and Pratt, K. A.: Snowpack measurements suggest role for multi-year sea ice regions in Arctic atmospheric bromine and chlorine chemistry, Elem.-Sci. Anth., 7, 14, https://doi.org/10.1525/elementa.352, 2019.
Pfaffhuber, K. A., Berg, T., Hirdman, D., and Stohl, A.: Atmospheric mercury observations from Antarctica: seasonal variation and source and sink region calculations, Atmos. Chem. Phys., 12, 3241–3251, https://doi.org/10.5194/acp-12-3241-2012, 2012.
Pirrone, N., Cinnirella, S., Feng, X., Finkelman, R. B., Friedli, H. R., Leaner, J., Mason, R., Mukherjee, A. B., Stracher, G. B., Streets, D. G., and Telmer, K.: Global mercury emissions to the atmosphere from anthropogenic and natural sources, Atmos. Chem. Phys., 10, 5951–5964, https://doi.org/10.5194/acp-10-5951-2010, 2010.
Reid, J. S., Koppmann, R., Eck, T. F., and Eleuterio, D. P.: A review of biomass burning emissions part II: intensive physical properties of biomass burning particles, Atmos. Chem. Phys., 5, 799–825, https://doi.org/10.5194/acp-5-799-2005, 2005.
Rolph, G., Stein, A., and Stunder, B.: Real-time Environmental Applications and Display sYstem: READY, Environ. Model. Softw., 95, 210–228, https://doi.org/10.1016/j.envsoft.2017.06.025, 2017.
Saiz-Lopez, A., Travnikov, O., Sonke, J. E., Thackray, C. P., Jacob, D. J., Carmona-García, J., Francés-Monerris, A., Roca-Sanjuán, D., Acuña, A. U., Dávalos, J. Z., Cuevas, C. A., Jiskra, M., Wang, F., Bieser, J., Plane, J. M. C., and Francisco, J. S.: Photochemistry of oxidized Hg(I) and Hg(II) species suggests missing mercury oxidation in the troposphere, P. Natl. Acad. Sci. USA, 117, 30949–30956, https://doi.org/10.1073/pnas.1922486117, 2020.
Sander, R.: Compilation of Henry's law constants (version 4.0) for water as solvent, Atmos. Chem. Phys., 15, 4399–4981, https://doi.org/10.5194/acp-15-4399-2015, 2015.
Schacht, J., Heinold, B., Quaas, J., Backman, J., Cherian, R., Ehrlich, A., Herber, A., Huang, W. T. K., Kondo, Y., Massling, A., Sinha, P. R., Weinzierl, B., Zanatta, M., and Tegen, I.: The importance of the representation of air pollution emissions for the modeled distribution and radiative effects of black carbon in the Arctic, Atmos. Chem. Phys., 19, 11159–11183, https://doi.org/10.5194/acp-19-11159-2019, 2019.
Schmeisser, L., Backman, J., Ogren, J. A., Andrews, E., Asmi, E., Starkweather, S., Uttal, T., Fiebig, M., Sharma, S., Eleftheriadis, K., Vratolis, S., Bergin, M., Tunved, P., and Jefferson, A.: Seasonality of aerosol optical properties in the Arctic, Atmos. Chem. Phys., 18, 11599–11622, https://doi.org/10.5194/acp-18-11599-2018, 2018.
Schmeissner, T., Krejci, R., Ström, J., Birmili, W., Wiedensohler, A., Hochschild, G., Gross, J., Hoffmann, P., and Calderon, S.: Analysis of number size distributions of tropical free tropospheric aerosol particles observed at Pico Espejo (4765 m a.s.l.), Venezuela, Atmos. Chem. Phys., 11, 3319–3332, https://doi.org/10.5194/acp-11-3319-2011, 2011.
Schroeder, W., Oliva, P., Giglio, L., and Csiszar, I. A.: The New VIIRS 375 m active fire detection data product: Algorithm description and initial assessment, Remote Sens. Environ., 143, 85–96, https://doi.org/10.1016/j.rse.2013.12.008, 2014.
Schroeder, W. H., Anlauf, K. G., Barrie, L. A., Lu, J. Y., Steffen, A., Schneeberger, D. R., and Berg, T.: Arctic springtime depletion of mercury, Nature, 394, 331–332, https://doi.org/10.1038/28530, 1998.
Schulz, H., Zanatta, M., Bozem, H., Leaitch, W. R., Herber, A. B., Burkart, J., Willis, M. D., Kunkel, D., Hoor, P. M., Abbatt, J. P. D., and Gerdes, R.: High Arctic aircraft measurements characterising black carbon vertical variability in spring and summer, Atmos. Chem. Phys., 19, 2361–2384, https://doi.org/10.5194/acp-19-2361-2019, 2019.
Semane, N., Peuch, V. H., El Amraoui, L., Bencherif, H., Massart, S., Cariolle, D., Attie, J. L., and Abida, R.: An observed and analysed stratospheric ozone intrusion over the high Canadian Arctic UTLS region during the summer of 2003, Q. J. Roy. Meteorol. Soc., 133, 171–178, https://doi.org/10.1002/qj.141, 2007.
Shah, V. and Jaeglé, L.: Subtropical subsidence and surface deposition of oxidized mercury produced in the free troposphere, Atmos. Chem. Phys., 17, 8999–9017, https://doi.org/10.5194/acp-17-8999-2017, 2017.
Shepler, B. C., Balabanov, N. B., and Peterson, K. A.: Hg + BrHgBr recombination and collision-induced dissociation dynamics, J. Chem. Phys., 127, 164304, https://doi.org/10.1063/1.2777142, 2007.
Simpson, W. R., Brown, S. S., Saiz-Lopez, A., Thornton, J. A., and Glasow, R.: Tropospheric halogen chemistry: sources, cycling, and impacts, Chem. Rev., 115, 4035–4062, https://doi.org/10.1021/cr5006638, 2015.
Simpson, W. R., Peterson, P. K., Frieß, U., Sihler, H., Lampel, J., Platt, U., Moore, C., Pratt, K., Shepson, P., Halfacre, J., and Nghiem, S. V.: Horizontal and vertical structure of reactive bromine events probed by bromine monoxide MAX-DOAS, Atmos. Chem. Phys., 17, 9291–9309, https://doi.org/10.5194/acp-17-9291-2017, 2017.
Skov, H., Christensen, J. H., Goodsite, M. E., Heidam, N. Z., Jensen, B., Wahlin, P., and Geernaert, G.: Fate of elemental mercury in the arctic during atmospheric mercury depletion episodes and the load of atmospheric mercury to the arctic, Environ. Sci. Technol., 38, 2373–2382, https://doi.org/10.1021/es030080h, 2004.
Skov, H., Brooks, S., Goodsite, M., Lindberg, S., Meyers, T., Landis, M., Larsen, M., Jensen, B., McConville, G., and Christensen, J.: Fluxes of reactive gaseous mercury measured with a newly developed method using relaxed eddy accumulation, Atmos. Environ., 40, 5452–5463, https://doi.org/10.1016/j.atmosenv.2006.04.061, 2006.
Skov, H., Hjorth, J., Nordstrøm, C., Jensen, B., Christoffersen, C., Bech Poulsen, M., Baldtzer Liisberg, J., Beddows, D., Dall'Osto, M., and Christensen, J. H.: Variability in gaseous elemental mercury at Villum Research Station, Station Nord, in North Greenland from 1999 to 2017, Atmos. Chem. Phys., 20, 13253–13265, https://doi.org/10.5194/acp-20-13253-2020, 2020.
Slemr, F., Weigelt, A., Ebinghaus, R., Kock, H. H., Bödewadt, J., Brenninkmeijer, C. A. M., Rauthe-Schöch, A., Weber, S., Hermann, M., Becker, J., Zahn, A., and Martinsson, B.: Atmospheric mercury measurements onboard the CARIBIC passenger aircraft, Atmos. Meas. Tech., 9, 2291–2302, https://doi.org/10.5194/amt-9-2291-2016, 2016.
Soerensen, A. L., Skov, H., Jacob, D. J., Soerensen, B. T., and Johnson, M. S.: Global Concentrations of Gaseous Elemental Mercury and Reactive Gaseous Mercury in the Marine Boundary Layer, Environ. Sci. Technol., 44, 7425–7430, https://doi.org/10.1021/es903839n, 2010.
Sommar, J., Andersson, M. E., and Jacobi, H. W.: Circumpolar measurements of speciated mercury, ozone and carbon monoxide in the boundary layer of the Arctic Ocean, Atmos. Chem. Phys., 10, 5031–5045, https://doi.org/10.5194/acp-10-5031-2010, 2010.
Steen, A. O., Berg, T., Dastoor, A. P., Durnford, D. A., Engelsen, O., Hole, L. R., and Pfaffhuber, K. A.: Natural and anthropogenic atmospheric mercury in the European Arctic: a fractionation study, Atmos. Chem. Phys., 11, 6273–6284, https://doi.org/10.5194/acp-11-6273-2011, 2011.
Steffen, A., Schroeder, W., Bottenheim, J., Narayan, J., and Fuentes, J. D.: Atmospheric mercury concentrations: measurements and profiles near snow and ice surfaces in the Canadian Arctic during Alert 2000, Atmos. Environ., 36, 2653–2661, https://doi.org/10.1016/S1352-2310(02)00112-7, 2002.
Steffen, A., Bottenheim, J., Cole, A., Ebinghaus, R., Lawson, G., and Leaitch, W. R.: Atmospheric mercury speciation and mercury in snow over time at Alert, Canada, Atmos. Chem. Phys., 14, 2219–2231, https://doi.org/10.5194/acp-14-2219-2014, 2014.
Steffen, A., Lehnherr, I., Cole, A., Ariya, P., Dastoor, A., Durnford, D., Kirk, J., and Pilote, M.: Atmospheric mercury in the Canadian Arctic. Part I: a review of recent field measurements, Sci. Total Environ., 509–510, 3–15, https://doi.org/10.1016/j.scitotenv.2014.10.109, 2015.
Stephens, C. R., Shepson, P. B., Steffen, A., Bottenheim, J. W., Liao, J., Huey, L. G., Apel, E., Weinheimer, A., Hall, S. R., Cantrell, C., Sive, B. C., Knapp, D. J., Montzka, D. D., and Hornbrook, R. S.: The relative importance of chlorine and bromine radicals in the oxidation of atmospheric mercury at Barrow, Alaska, J. Geophys. Res.-Atmos., 117, D00R11, https://doi.org/10.1029/2011jd016649, 2012.
Stern, G. A., Macdonald, R. W., Outridge, P. M., Wilson, S., Chetelat, J., Cole, A., Hintelmann, H., Loseto, L. L., Steffen, A., Wang, F., and Zdanowicz, C.: How does climate change influence Arctic mercury?, Sci. Total Environ., 414, 22–42, https://doi.org/10.1016/j.scitotenv.2011.10.039, 2012.
Stohl, A.: Computation, accuracy and applications of trajectories – A review and bibliography, Atmos. Environ., 32, 947–966, https://doi.org/10.1016/s1352-2310(97)00457-3, 1998.
Stohl, A.: Characteristics of atmospheric transport into the Arctic troposphere, J. Geophys. Res., 111, D11306, https://doi.org/10.1029/2005jd006888, 2006.
Stroeve, J. C., Serreze, M. C., Holland, M. M., Kay, J. E., Malanik, J., and Barrett, A. P.: The Arctic's rapidly shrinking sea ice cover: a research synthesis, Climatic Change, 110, 1005–1027, https://doi.org/10.1007/s10584-011-0101-1, 2012.
Sturges, W. T., Cota, G. F., and Buckley, P. T.: Bromoform emission from Arctic ice algae, Nature, 358, 660–662, https://doi.org/10.1038/358660a0, 1992.
Swartzendruber, P. C., Jaffe, D. A., Prestbo, E. M., Weiss-Penzias, P., Selin, N. E., Park, R., Jacob, D. J., Strode, S., and Jaeglé, L.: Observations of reactive gaseous mercury in the free troposphere at the Mount Bachelor Observatory, J. Geophys. Res., 111, D24301, https://doi.org/10.1029/2006jd007415, 2006.
Talbot, R., Mao, H., Scheuer, E., Dibb, J., and Avery, M.: Total depletion of Hg degrees in the upper troposphere-lower stratosphere, Geophys. Res. Lett., 34, L23804, https://doi.org/10.1029/2007gl031366, 2007.
Tarasick, D. W. and Bottenheim, J. W.: Surface ozone depletion episodes in the Arctic and Antarctic from historical ozonesonde records, Atmos. Chem. Phys., 2, 197–205, https://doi.org/10.5194/acp-2-197-2002, 2002.
Thomas, J. L., Dibb, J. E., Huey, L. G., Liao, J., Tanner, D., Lefer, B., von Glasow, R., and Stutz, J.: Modeling chemistry in and above snow at Summit, Greenland – Part 2: Impact of snowpack chemistry on the oxidation capacity of the boundary layer, Atmos. Chem. Phys., 12, 6537–6554, https://doi.org/10.5194/acp-12-6537-2012, 2012.
Toyota, K., Dastoor, A. P., and Ryzhkov, A.: Air–snowpack exchange of bromine, ozone and mercury in the springtime Arctic simulated by the 1-D model PHANTAS – Part 2: Mercury and its speciation, Atmos. Chem. Phys., 14, 4135–4167, https://doi.org/10.5194/acp-14-4135-2014, 2014.
Tunved, P., Ström, J., and Krejci, R.: Arctic aerosol life cycle: linking aerosol size distributions observed between 2000 and 2010 with air mass transport and precipitation at Zeppelin station, Ny-Ålesund, Svalbard, Atmos. Chem. Phys., 13, 3643–3660, https://doi.org/10.5194/acp-13-3643-2013, 2013.
UNEP: UNEP: Minamata Convention on Mercury, available at: http://www.mercuryconvention.org/Convention/tabid/3426/Default.aspx (last access: 12 November 2020), 2013.
von Glasow, R.: Atmospheric chemistry in volcanic plumes, P. Natl. Acad. Sci. USA, 107, 6594–6599, https://doi.org/10.1073/pnas.0913164107, 2010.
Walker, T. W., Jones, D. B. A., Parrington, M., Henze, D. K., Murray, L. T., Bottenheim, J. W., Anlauf, K., Worden, J. R., Bowman, K. W., Shim, C., Singh, K., Kopacz, M., Tarasick, D. W., Davies, J., von der Gathen, P., Thompson, A. M., and Carouge, C. C.: Impacts of midlatitude precursor emissions and local photochemistry on ozone abundances in the Arctic, J. Geophys. Res.-Atmos., 117, D01305, https://doi.org/10.1029/2011jd016370, 2012.
Wang, S., McNamara, S. M., Moore, C. W., Obrist, D., Steffen, A., Shepson, P. B., Staebler, R. M., Raso, A. R. W., and Pratt, K. A.: Direct detection of atmospheric atomic bromine leading to mercury and ozone depletion, P. Natl. Acad. Sci. USA, 116, 14479–14484, https://doi.org/10.1073/pnas.1900613116, 2019.
Weingartner, E., Saathoff, H., Schnaiter, M., Streit, N., Bitnar, B., and Baltensperger, U.: Absorption of light by soot particles: determination of the absorption coefficient by means of aethalometers, J. Aerosol Sci., 34, 1445–1463, https://doi.org/10.1016/S0021-8502(03)00359-8, 2003.
Weiss-Penzias, P., Amos, H. M., Selin, N. E., Gustin, M. S., Jaffe, D. A., Obrist, D., Sheu, G. R., and Giang, A.: Use of a global model to understand speciated atmospheric mercury observations at five high-elevation sites, Atmos. Chem. Phys., 15, 1161–1173, https://doi.org/10.5194/acp-15-1161-2015, 2015.
Winiger, P., Barrett, T. E., Sheesley, R. J., Huang, L., Sharma, S., Barrie, L. A., Yttri, K. E., Evangeliou, N., Eckhardt, S., Stohl, A., Klimont, Z., Heyes, C., Semiletov, I. P., Dudarev, O. V., Charkin, A., Shakhova, N., Holmstrand, H., Andersson, A., and Gustafsson, Ö.: Source apportionment of circum-Arctic atmospheric black carbon from isotopes and modeling, Sci. Adv., 5, eaau8052, https://doi.org/10.1126/sciadv.aau8052, 2019.
Yang, X., Cox, R. A., Warwick, N. J., Pyle, J. A., Carver, G. D., O'Connor, F. M., and Savage, N. H.: Tropospheric bromine chemistry and its impacts on ozone: A model study, J. Geophys. Res.-Atmos., 110, D23311, https://doi.org/10.1029/2005jd006244, 2005.
Ye, Z., Mao, H., Lin, C. J., and Kim, S. Y.: Investigation of processes controlling summertime gaseous elemental mercury oxidation at midlatitudinal marine, coastal, and inland sites, Atmos. Chem. Phys., 16, 8461–8478, https://doi.org/10.5194/acp-16-8461-2016, 2016.
Zanatta, M., Laj, P., Gysel, M., Baltensperger, U., Vratolis, S., Eleftheriadis, K., Kondo, Y., Dubuisson, P., Winiarek, V., Kazadzis, S., Tunved, P., and Jacobi, H. W.: Effects of mixing state on optical and radiative properties of black carbon in the European Arctic, Atmos. Chem. Phys., 18, 14037–14057, https://doi.org/10.5194/acp-18-14037-2018, 2018.
Zheng, C., Wu, Y., Ting, M., Orbe, C., Wang, X., and Tilmes, S.: Summertime Transport Pathways From Different Northern Hemisphere Regions Into the Arctic, J. Geophys. Res.-Atmos., 126, e2020JD033811, https://doi.org/10.1029/2020JD033811, 2021.