the Creative Commons Attribution 4.0 License.
the Creative Commons Attribution 4.0 License.
 | 01 Feb 2021
Ozonolysis of fatty acid monolayers at the air–water interface: organic films may persist at the surface of atmospheric aerosols
Benjamin Woden
Maximilian W. A. Skoda
Adam Milsom
Curtis Gubb
Armando Maestro
James Tellam
Ozonolysis of fatty acid monolayers was studied to understand the fate of organic-coated aerosols under realistic atmospheric conditions. Specifically, we investigated the effects of temperature and salinity on the degradation of oleic acid at the air–water interface and the persistence of the aged surfactant film at the surface. The presence of a residual film is of atmospheric importance, as surface monolayers affect the physical properties of the droplets and because of the role they play in cloud formation. This occurs via several effects, most notably via surface tension reduction. The interplay between atmospheric aerosol loading and the formation, nature, and persistence of clouds is a key uncertainty in climate modelling.
Our data show that a residual surface film, which we suspect to be formed of nonanoic acid and a mixture of azelaic and 9-oxononanoic acids, is retained at the interface after ozonolysis at near-zero temperatures but not at room temperature. Given the low-temperature conditions used here are atmospherically realistic, the persistence of a product film must be considered when assessing the impact of unsaturated fatty acid partitioned to the air–water interface. The presence of stable (non-oxidisable) reaction products also opens the possibility of build-up of inert monolayers during the aerosol life cycle with potential implications for cloud formation. Furthermore, we measured the kinetic behaviour of these films and found that the reactions are not significantly affected by the shift to a lower temperature with rate coefficients determined to be (2.2 ± 0.4) × 10−10 cm2 s−1 at 21 ± 1 ∘C and (2.2 ± 0.2) × 10−10 cm2 s−1 at 2 ± 1 ∘C.
- Article
(452 KB) - Full-text XML
-
Supplement
(529 KB) - BibTeX
- EndNote


Organic films are formed at the surfaces of aerosol particles in the atmosphere (Gill et al., 1983; Ellison et al., 1999; Sareen et al., 2013; Nozière et al., 2014 Kroflič et al., 2018; Geŕard et al., 2019), and the partitioning of organic components in this manner changes the physical properties of the aerosol particle and its chemical reactivity (Rudich, 2003; Ruehl et al., 2016; Ovadnevaite et al., 2017). A key review (Donaldson and Vaida, 2006) has brought together various emerging trends in the study of these films and their relevance to atmospheric processes. An important area of interest regarding these films concerns the interactions between atmospheric aerosol particles and clouds. This relationship is complex and difficult to measure or predict (Stevens and Feingold, 2009), and resolving the role played by organic monolayers at the surface of aerosol particles is part of solving this puzzle. The organic species that are contained in these surface films oxidise in the atmosphere and may produce low-volatility products that form secondary organic aerosols. If the oxidation of these species is prevented, accelerated, or otherwise modified by the partitioning of the reactant into a surface monolayer, then this will have implications for the contribution of that reactant to aerosol loading. More importantly, the presence of a surface monolayer changes the physical and chemical properties of the aerosol particle itself.
The present study focuses on monolayers at the air–water interface as would be seen on aqueous aerosol droplets, but the concept is broadly transferrable to any aerosol particle with an organic film coating. These monolayers are relevant, as they decrease the surface tension of water (Donaldson and Vaida, 2006; Ambaum, 2010); the surface tension of aqueous droplets plays a key role in the growth and formation of clouds (Ambaum, 2010; Ovadnevaite et al., 2017). Furthermore, the monolayer can act as a barrier to water uptake, retard droplet evaporation, and inhibit the transfer of atmospheric species between the air and water phases (Rideal, 1924; La Mer, 1962; La Mer et al., 1964; Gaines, 1966; Garrett, 1971; Ray et al., 1991; Benjamin, 1996; Barnes, 1997; Li et al., 2019). It can also act as a 2D solvent for normally water-insoluble species that could not partition to a water aerosol or modify the solvation behaviour of soluble species (Tomoaia-Cotisel and Cadenhead, 1991; Cohen Stuart et al., 1996; Mmereki and Donaldson, 2002; Mmereki et al., 2003; Gilman et al., 2004). Organic monolayers can also act as efficient ice-nucleating particles (see Knopf et al., 2018; Knopf and Forrester, 2011; Zobrist et al., 2007; Cantrell and Robinson, 2006).
This catalogue of effects upon the aerosol particle caused by the presence of an organic monolayer coating shows the importance of establishing the lifetime and ageing of these monolayers in the atmosphere, and this has been the focus of previous research (e.g. Thornton and Abbatt, 2005; Hung et al., 2005; Knopf et al., 2005; McNeill et al., 2006; Voss et al., 2007; Knopf et al., 2007; Cosman et al., 2008; Gross et al., 2009; King et al., 2009; Pfrang et al., 2014; Sebastiani et al., 2018).
Oleic acid has been a monolayer component of particular interest, as it is a major contributor to both anthropogenic organic emissions – it is mostly produced by meat cooking (Shrivastava et al., 2007) and is the dominant component of such emissions (Allan et al., 2010) – and biogenic marine aerosols (Tervahattu et al., 2002; Fu et al., 2013). Its ubiquity in such aerosols has allowed it to serve as a benchmark molecule for more complex mixtures of organic surfactant produced by such anthropogenic activity (Zahardis and Petrucci, 2007). While there are numerous studies of pure oleic acid or high-oleic-acid-content droplets and their oxidation reactions (e.g. King et al., 2004; Voss et al., 2007; Last et al., 2009; Pfrang et al., 2011, 2017a), work on the oxidation of an oleic acid monolayer at the air–water interface in particular has been comparatively scarce (King et al., 2009; Skoda et al., 2017; Sebastiani et al., 2018).
Ozone (O3) and nitrate radicals (NO) are important night-time oxidants (e.g. Hung et al., 2005; Gross et al., 2009; Sebastiani et al., 2018; Woden et al., 2018), while O3 and hydroxyl radicals (•OH) are the key daytime oxidants (see Chen et al., 2020, for a recent study of heterogenous OH reactions on organic aerosols). Of these three primary atmospheric oxidants O3 is the only one present during the day and night, and the present study is focused on ozonolysis, i.e. oxidation by O3.

Scheme 1Oleic acid ozonolysis reaction scheme. We used both fully and half-deuterated oleic acid samples, granting us the ability to create different contrasts for analysis by neutron reflectometry. In the fully deuterated (d34) variant of oleic acid, both the head portion (purple) and tail portion (teal) of the molecule are deuterated. In the partially deuterated (d18) variant of oleic acid, only the tail portion (teal) is deuterated. The colouring of the products and intermediates indicates the fate of the two portions of the oleic acid molecule and demonstrates that, when d18-oleic acid is oxidised, two products (nonanal and nonanoic acid) are deuterated and two (azelaic acid and 9-oxononanoic acid) are not.
The initial reaction of O3 with oleic acid is chemically well understood and is laid out in Scheme 1 (compare King et al., 2009; see also Gallimore et al., 2017). It proceeds via an attack on the carbon–carbon double bond at the centre of the molecule. The two reaction pathways resulting from the two possible collapses of the molozonide lead to a total of four initial reaction products. These products are nonanoic acid, nonanal, 9-oxononanoic acid, and azelaic acid (Zahardis and Petrucci, 2007). One detailed kinetic study on bulk-like oleic acid (Thornberry and Abbatt, 2004) identifies nonanal as major product with a yield of 0.50 (±0.10) for the oleic acid ozonolysis using a coated-wall tube (0.6 mm thick oleic acid layer). The authors found only a small temperature dependence of the uptake coefficients down to 263 K. The fate of these products after the ozonolysis of an oleic acid monolayer however is the subject of debate (Voss et al., 2007; King et al., 2009).
The presence of a product partitioned to the (air–water) interface after reaction is the most important question for atmospheric impact, as a monolayer remaining after ozonolysis may perpetuate the modifications to the properties of an aerosol droplet due to the persistence of the organic character at the air–water interface even after ozonolysis (Ellison et al., 1999; Donaldson and Vaida, 2006).
The aim of this study is to extend the understanding of oleic acid monolayer ozonolysis under atmospherically relevant conditions by investigating the impact of low temperatures and saline subphases. King et al. (2009) investigated a variety of saline subphases but did not study differences in ozonolysis behaviour between the monolayers spread upon them at room temperature, and to our knowledge no studies have yet investigated the effects of low temperatures (< 10∘), which are common in the lower troposphere (Grotjahn, 2015), where these reactions occur. To this end, we investigated the behaviour at ca. 0∘, i.e. near the ice melting temperature (referred to as near-zero temperatures in this paper), but it should be noted that aqueous NaCl solutions will experience a slight ice melting point depression (see phase diagram and previous studies, in particular Koop et al., 2000a, b) and that water droplets in the atmosphere will freeze at significantly lower temperatures. Near-zero temperatures are more frequently encountered in the atmosphere than room-temperature conditions used in other studies, especially in temperate and polar regions as well as in the free troposphere, possibly with the exception of the boundary layer in the tropics. Our neutron reflectometry (NR) study also incorporates simultaneous characterisation by infrared reflection absorption spectroscopy (IRRAS) as a secondary analysis technique, using a bespoke reaction/analysis chamber recently developed for this purpose (Skoda et al., 2017).
This research was performed on the specular neutron reflectometry instruments INTER at the ISIS Neutron and Muon Source and FIGARO at Institut Laue–Langevin (ILL) and builds on previous work by this research group on the oxidation of floating monolayers at the air–water interface performed at these facilities (Pfrang et al., 2014; Sebastiani et al., 2015; Skoda et al., 2017; Sebastiani et al., 2018; Woden et al., 2018).
2.1 Neutron reflectometry
A review paper (Lu et al., 2000) details how neutron reflectometry can be used to determine the surface concentration of organic films present as a monolayer at the air–water interface. In short, neutron reflectivity depends on the differences between concentrations of atoms with a characteristic neutron scattering length in adjacent thin layers of material. Simplifications of the equations describing this system are possible when studying just one layer (the organic monolayer) at the interface between air – which essentially has a scattering length density (SLD) of zero – and a “null-reflecting” or “air-contrast-matched” subphase (a subphase prepared to have a neutron SLD of zero, matching that of air). The null-reflecting matched water was prepared as a solution of D2O (99.9 % atom D; Sigma-Aldrich) 8.8 % v∕v in 18.2 MΩ H2O. Null-reflecting sodium chloride solution subphase was prepared with 35 g NaCl (< 99 %; Sigma-Aldrich) in 900 mL H2O and 58 mL D2O. This preparation compensates for the scattering length of the salt ions with a slightly different H2O ∕ D2O ratio.
Details of the experimental setup and procedure can be found in Skoda et al. (2017). In short, a purpose-built aluminium gas flow cell with a volume of approximately 1.5 L was used, which accommodated a PTFE liquid trough with inner dimensions of 238 mm × 70 mm. The sample stage was equipped with passive and active anti-vibration control. The reaction chamber was mounted on the sample stage and interfaced with the gas setup. The PTFE trough was filled with 90 mL of null-reflecting water. Monolayers were spread using 20–40 µL of the spreading solutions in chloroform, leaving a monolayer of the dissolved species after evaporation of the solvent. A dry oxygen flow of 1.2 L min−1 was continuously present, providing a low (< 10 %) relative humidity (RH) and avoiding any build-up of gas-phase products that would not be consistent with atmospheric conditions. Thanks to the low RH, we did not observe any condensation within the reaction chamber or windows throughout the experiments. Data were recorded for a few minutes before O3 was admitted into the chamber. O3 was then generated continuously by exposing the O2 flow to UV light. The height of the air–liquid interface was aligned with respect to the neutron beam using a Keyence laser displacement sensor (model no. LK-G402), which was coupled into the sample chamber via a quartz window to allow automated height adjustment during the measurements. Height adjustments over a 2 h experiment were always less than 0.15 mm for a water height of ca. 5 mm in the trough. The reflectivity (fraction of incident neutrons reflected; R) varies as a function of the energy and reflection angle of the incident neutrons (expressed as momentum transfer, Q) and the SLD (ρ) and thickness (τ) of the monolayer as expressed in Eq. (1) (based on Lu et al., 2000).
The SLD and layer thickness characteristic of the system can then be inferred from the relationship between reflectivity and momentum transfer as measured by the instrument. The two parameters are fitted over the whole Q range as a combined ρτ value, which corresponds to a surface concentration of scattering length, from which the surface concentration of oleic acid can be determined as the scattering length of oleic acid is known (b=315 fm). Reflectivity curves of R vs. Q are collected at 20 s intervals throughout the reaction and fitted using MOTOFIT (Nelson, 2006) to give ρτ values for each time slice. These fitted ρτ values can be converted into surface concentration (Γ) values for oleic acid (Eq. 2, based on Lu et al., 2000).
In order for the layer to stand out sufficiently from the other phases, a deuterated form, d34-oleic acid, was used. Spreading onto an aqueous subphase will cause the acidic deuterium to be exchanged with the subphase, so we use the scattering length of oleic acid with 33 deuterium atoms (315 fm) to calculate the surface concentration from ρτ values. For product identification studies, we used custom-synthesised half-deuterated d18-oleic acid.
2.2 Reaction chamber for simultaneous infrared reflection absorption spectroscopy (IRRAS)
The reactions were carried out in a bespoke chamber developed by this research group. The chamber is designed to provide a controlled and confined environment in which the monolayer can be oxidised by a gas-phase oxidant while under analysis by both neutron reflectometry and IRRAS. The integration of IRRAS analysis in situ during the neutron reflectometry experiment is non-trivial, and the entire analysis and reaction setup is described in detail in a method paper (Skoda et al., 2017). For this study it had been further developed to allow for cooling of the subphase in order to access relevant atmospheric temperature conditions. IRRAS integration is primarily intended to facilitate the study of mixed monolayers, in which one component can be deuterated (for neutron reflectometry) and the other left non-deuterated (and thus easily measurable by IRRAS). This work focuses on a film composed solely of oleic acid, so the IRRAS analysis served as an additional semi-quantitative method to follow the oleic acid component rather than as a method to follow non-deuterated film components (Skoda et al., 2017). During experiments using d18-oleic acid, IRRAS data were sensitive to the deuterated and non-deuterated halves of the molecule (via the C–D and C–H absorption bands, respectively). The IRRAS equipment was only available at the INTER beamline, given the large and flexible sample environment available at that instrument.
Baseline-corrected integrations under C–D peaks (symmetric and asymmetric stretch) provide a series of peak area against time traces for each reaction, which reflect the presence or absence of C–D chains at the surface and traces their evolution throughout the reaction.
While IRRAS can measure deuterated components (the infrared absorbance bands are shifted to a lower wavenumber, distinguishing them from the absorbance bands associated with non-deuterated components), the sensitivity in this region is much lower, as these bands are weaker and more affected by the gas-phase atmosphere above the organic film. This meant that the IRRAS measurements could not distinguish the residues left at low temperatures from background noise. Figure S13 in the Supplement shows an example of IRRAS data from an ozonolysis experiment on INTER.
2.3 Materials
d34-oleic acid was used (one batch custom synthesised by the ISIS Deuteration Facility and one batch purchased from Sigma-Aldrich at 98 % atom D; 99.9 %); the half-deuterated d18-oleic acid was produced by the ISIS Deuteration Facility; O3 was produced for the reaction using a commercial Pen-Ray ozoniser (UVP Ltd, Cambridge) to ozonise a stream of O2 (99.999 %; BOC Ltd) regulated to a flow of 1.2 L min−1 (20 cm3 s−1) using an electronic mass flow controller to an O3 concentration of (1.43 ± 0.05) × 1013 cm−3; the ozoniser was calibrated offline using UV–Vis absorption at 254 nm and an absorption cross-section value of 1.13 × 10⁻¹⁷ cm−2 (Daumont et al., 1992). Mixing ratios of ozone (in O2) in the chamber were in the range 126–2010 ppb, so that we were working in large excess of O3 compared to the organic monolayer, and [O3] remained approximately constant during the reaction.
Prior to the ozonolysis studies we characterised the stability of the oleic acid monolayers at room and reduced temperatures (see Sect. S1 of the Supplement with π-A isotherms presented as Figs. S1 and S2). After confirming the reactant film's stability, we exposed the monolayers to ozone following the reaction by neutron reflectometry and IRRAS in the conditions described below.
3.1 Pure water subphase – room temperature
At room temperature, on a pure water subphase, we found that the removal of deuterated material from the surface is consistent with complete oxidation. The remaining reflectivity signal is not distinguishable from zero and cannot be fitted except by using a fixed background. This is consistent with the results of Voss et al. (2007), but not with those of King et al. (2009), where a stable product film was reported.
Figure 1 shows a time series of fitted ρτ values (proportional to surface concentration) for 120 s time slices of the reaction, with an O3 concentration of 323 ± 9 ppb introduced at t=0 s. The absence of points after ca. 800 s indicates that the numerical fits fail to converge after this point, demonstrating that the reflectivity is not consistent with an adsorbed surface layer (i.e. not measurably different from the background). Figure S3 in the Supplement illustrates this as a pair of before/after R vs. Q reflectivity curves. The figure also shows data for a salt subphase reaction, which will be discussed below.
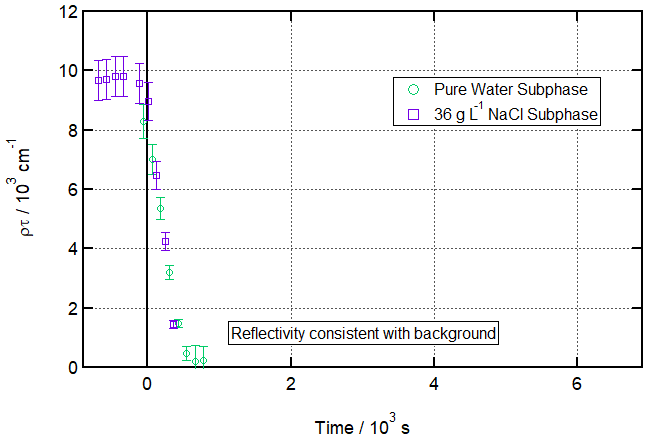
Figure 1Ozonolysis of an oleic acid monolayer floating on pure vs. salt water. Time evolution plot for ozonolysis of 29 µL 1.0 g L−1 d34-OA (CHCl3 spreading solution) on pure water (green circles) and 25 µL 1.0 g L−1 d34-OA 36 g L−1 NaCl(aq) (purple squares) subphases by 323 ± 29 ppb O3 introduced at t=0 s at 21 ± 1 ∘C.
This result of no measurable residue was reproducible across 11 different ozonolysis runs carried out across an [O3] range of 126 ± 15 to 2010 ± 238 ppb as parts of three different beamline experiments at two different neutron facilities (ISIS INTER RB 1810793 and RB 1710483; ILL FIGARO 9-10-1518).
3.2 Salt water subphase – room temperature
Sea spray aerosol will naturally be salty, and a simple monovalent common salt, sodium chloride (aq; 36 g L−1), was used as a rough model of sea spray for this experiment.
At room temperature, the reaction also proceeded to completion, with no residual deuterated material detectable at the interface. King et al. (2009) found that there was no detectable difference in the nature of the reaction between a room-temperature pure water subphase and a room-temperature salted subphase (across a wider variety of salts than studied here), and these results support that comparative conclusion (though King et al. (2009) actually measured a residual layer in both conditions while the present study has measured no residual layer in either condition; this experiment supports their finding that no difference between the reaction in the two conditions is detectable using this method). Figure 1 shows the results in these conditions as a time series of 120 s time slices (a lack of points indicates no convergence in the numerical fit; a pair of before/after R vs. Q reflectivity curves can be found as Fig. S4 in the Supplement).
3.3 Near-zero temperature conditions: pure water subphase
Experiments were then undertaken to determine if the reaction proceeds in a similar manner at atmospherically more relevant temperatures of 3 ± 1 ∘C. A clear difference between this reaction and the reaction at room temperature is observable. At the lower temperature, the neutron reflectometry data clearly show a residual signal from deuterated material at the interface after the initial reaction of oleic acid and ozone. On heating the subphase to room temperature, this residue disappears. This is inferred from the fact that, after heating, the reflectivity signal is consistent with that for a null-reflecting water surface (i.e. background), meaning that no deuterated material remains at the surface (or so little that it cannot be distinguished from this background condition1); the reflectivity data for such a null-reflecting air–water interface are included in the Supplement (Fig. S11).
The kinetics of the reaction, however, do not seem to differ markedly in the two temperature conditions. A fuller treatment of the kinetics of the reaction (in which we confirm no significant difference in second-order rate coefficients for the two temperature conditions) will follow in Sect. 3.9.
Figure 2 shows a time evolution plot for these conditions. It demonstrates that a stable residual layer remaining after ozonolysis for more than 1 h can be measured and fitted over 120 s counting periods and that this is no longer the case after heating to 20 ∘C. The figure also shows data from a salt subphase reaction, which will be discussed below. Figure 3 draws particular attention to the distinction between the situation after ozonolysis and the situation after heating by showing R vs. Q reflectivity curves before ozonolysis, after ozonolysis, and after heating (the analogous plot for the salt water condition is included in the Supplement as Fig. S5).
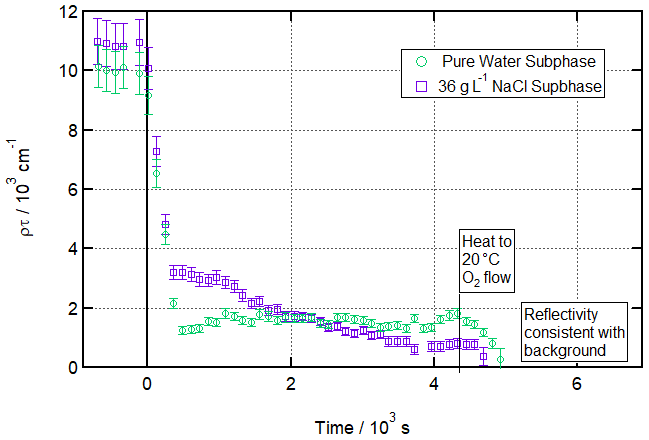
Figure 2Ozonolysis of an oleic acid monolayer at low temperatures floating on pure vs. salt water. Time evolution plot for ozonolysis of 25 µL 1.0 g L−1 d34-OA (CHCl3 spreading solution) on pure water (green circles) and 36 g L−1 NaCl(aq) (purple squares) subphases by 323 ± 29 ppb O3 introduced at t=0 s at 3 ± 1 ∘C (pure water) or −2 ± 1 ∘C (salt water).
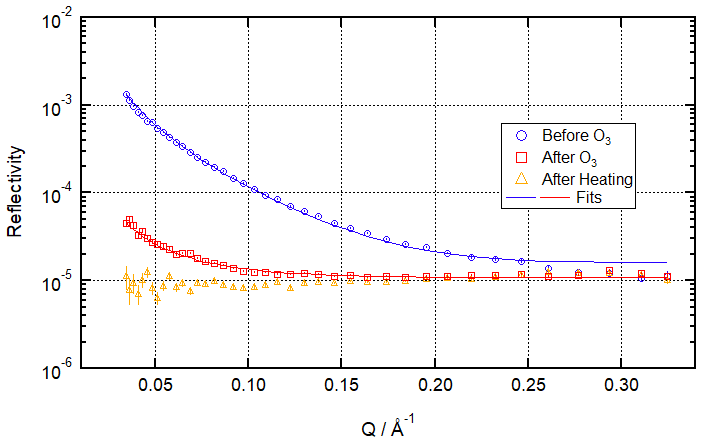
Figure 3Neutron reflectivity signal from the air–water interface before ozonolysis (blue circles – signal from the pristine oleic acid monolayer), after ozonolysis (red squares – clear signal remaining), and after heating (orange triangles – no measurable signal) for ozonolysis of 25 µL 1.0 g L−1 d34-OA (CHCl3 spreading solution) on pure water subphase by 323 ± 29 ppb O3 introduced at t=0 s at 3 ± 1 ∘C.
This measurable residue after ozonolysis is reproducible across 18 experiments carried out with a wide [O3] range from 126 ± 15 to 2010 ± 238 ppb. The lower end of this range is close to mixing ratios of 100 ppb that have been observed in polluted conditions (Warneck, 1999) and thus approaches atmospherically realistic concentrations as far as feasible within the time constraints of beam-time experiments for such a rigorous study.
Twelve of these runs (those obtained at the high-flux instrument FIGARO at ILL; experiment 9-10-1518) were carried out to determine the kinetic behaviour of this reaction and were therefore performed using a high dQ∕Q fast (5 s per measurement) chopper and slit setup optimised for kinetic measurements of the fast reactions afforded by high [O3]. These runs were used to measure second-order rate constants for the reaction (cf. Sect. 3.9) rather than to precisely quantify the residual material. Therefore, these 12 runs support the qualitative conclusion that a residue remains after ozonolysis but were not used to quantify this residue.
Four runs (INTER; experiment RB 1810793) were carried out with the precise and reproducible temperature control system and with the neutron reflectometry setup optimised to facilitate precise measurement of a low-intensity reflectivity signal (low dQ∕Q, low background). These were assumed to be sampling from a Gaussian distribution of residue intensities, and on that basis a mean deuterated residue fraction of 11.1 % of the initial spread material was calculated, with a 95 % confidence interval of ±1.9 % (absolute).
3.4 Atmospheric ageing simulation
In order to provide further assurance that the measured residue was a genuine product monolayer and not, for example, a temperature-dependent fitting artefact, an experiment was performed in which, after ozonolysis of an oleic acid monolayer, more oleic acid was added and another ozonolysis reaction carried out, and then yet more oleic was added, and a third ozonolysis reaction carried out. If the measured residual reflectivity is due to a product monolayer, then this should build up over multiple spreading and ozonolysis cycles. This was indeed observed, adding further weight to the conclusion that the measured residual reflectivity stems from the presence of a product monolayer that is not susceptible to further ozonolysis.
Figure 4 shows a time series representing reflectivity from the air–water interface at 120 s time slices throughout this process and clearly demonstrates the gradual build-up of a product monolayer. As well as illustrating that this is a real product, not a temperature-dependent measurement artefact, this represents a possible process in the real atmosphere, in which reactive species could be repeatedly adsorbed to the surface and engage in reactions which leave a small amount of unreactive material behind, gradually building up an unreactive monolayer. The atmospheric implications of this, which are potentially significant, are discussed in Sect. 4.2.
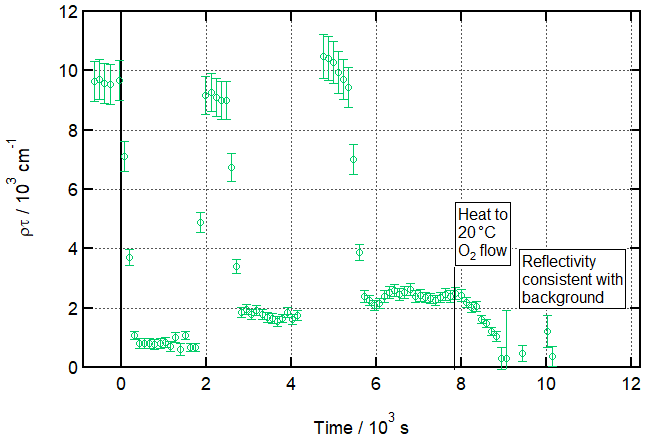
Figure 4Experiment mimicking an aqueous aerosol droplet exposed to multiple cooking emission peaks and demonstrating the associated build-up of an inert organic film at the air–water interface at low temperatures. Time evolution plot for ozonolysis of 25 µL 1.0 g L−1 d34-OA (CHCl3 spreading solution) on pure water subphase by 323 ± 29 ppb O3 introduced at t=0 s and after two additional spreadings of 25 µL 1.0 g L−1 d34-OA at 3 ± 1 ∘C.
Figure 5 further illustrates this as a series of R vs. Q reflectivity curves for each spreading and ozonolysis (as well as for a final heating step; data for second and third spreading steps are omitted, and only fits shown as all three data series heavily overlap), and Fig. S6 in the Supplement focuses in on the build-up of the product monolayer by excluding the spreading R vs. Q curves from the plot and zooming in on the post-ozonolysis reflectivity data. In Fig. 5, the data points for the spreading of additional material (two series) are removed for clarity (they very closely overlap the initial spreading data), and only the fits are shown.
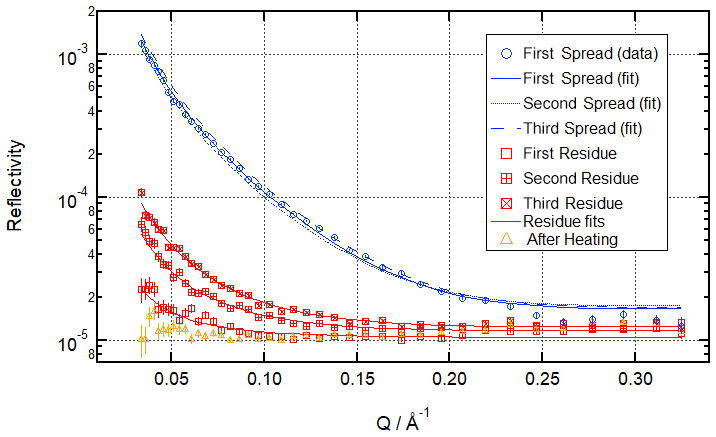
Figure 5Neutron reflectivity signal from the air–water interface before ozonolysis (blue circles; data only shown for first spreading; fits shown for all three spreadings – clear and consistent signal from the oleic acid monolayers across the three simulated cooking emission peaks), after ozonolysis (red squares – demonstrating the build-up of organic residue at the air–water interface during repeated exposure to cooking emission), and after heating (orange triangles – removal of organic residue at room temperature) for the multi-ozonolysis reaction shown as a time evolution plot in Fig. 4.
3.5 Near-zero temperature conditions: salt water subphase
Ozonolysis reaction was also carried out on a simple monovalent sea salt solution model subphase. At the same temperatures where a residue was observed on pure water (3 ± 1 ∘C), a residue was not reproducibly measurable for the salt-water subphase: only one out of five runs carried out with the temperature control setup produced a measurable residue, and it is possible that this residue was not stable but was still slowly disappearing – see discussion below on the unexpected kinetics of the reaction in these conditions. This could be because no residue remains under these conditions or because whatever residue does remain is close to the detection limit for this technique.
However, at still colder temperatures not accessible on a pure water subphase (−2 ± 1 ∘C), a residue is reliably measurable. Figure 2 shows a time evolution for a reaction in these conditions, and Fig. S5 in the Supplement shows the corresponding R vs. Q plots for spreading, ozonolysis, and heating.
This result was produced in duplicate (INTER experiment RB 1810793). Using the same assumption of sampling from a Gaussian distribution of measured residues as a fraction of initially deposited deuterated material as used in the pure water at 3 ± 1 ∘C, the mean deuterated residue fraction of 7.3 % was calculated, with a 95 % confidence interval of ±0.45 % (absolute). The upper confidence bound of this mean lies below the lower confidence bound of the mean for the pure water at 2 ± 1 ∘C. This supports the conclusion that a little less product monolayer remains at the interface in the salt water at −2 ± 1 ∘C condition than in the pure water at 3 ± 1 ∘C condition.
A basic visual appraisal of the time evolution of this reaction (see Fig. 2) also suggests a considerable difference in the kinetics of the reaction compared with those seen at room temperature and on pure water at low temperatures. Instead of the linear-to-exponential decay (either to no signal or to a residual signal) seen under other conditions, the reaction appears to follow a linear-to-exponential decay at first, before switching to a much slower roughly linear decay to the final residual monolayer. This shape was reproducible across three runs under these conditions, as well as in five runs with the salt subphase at 3 ± 1 ∘C. One of these five runs in which a residue was detectable may have simply been a slow linear decay that was not allowed to run to completion – as this arresting of exponential decay and replacement with a much slower linear decay was unexpected, it was initially difficult to distinguish from the stable residual monolayer, as seen in pure water at 3 ± 1 ∘C and after the slow linear decay in salt water at −2 ± 1 ∘C.
We can currently only speculate about what exactly is causing this deviation from expected stretched exponential decay in the low-temperature salt water conditions. The most likely explanation seems to be that some deuterated products are building up on the surface throughout the reaction and then slowly partitioning away from the interface (in a process which goes to completion at 3 ± 1 ∘C but not at −2 ± 1 ∘C).
3.6 Product elucidation with partially deuterated reactants at near-zero temperatures: pure water subphase
In order to understand what the atmospheric impacts of this product monolayer are likely to be, it is important to understand its composition. The ozonolysis of oleic acid (see Scheme 1) produces four initial products: nonanoic acid (estimated vapour pressure at 25 ∘C: 0.0 ± 0.5 mm Hg; all estimated vapour pressures are from ChemSpider), nonanal (estimated vapour pressure at 25 ∘C: 0.5 ± 0.4 mm Hg), azelaic acid (estimated vapour pressure at 25 ∘C: 0.0 ± 1.8 mm Hg), and 9-oxononanoic acid (estimated vapour pressure at 25 ∘C: 0.0 ± 1.4 mm Hg). It should be noted that recent work has reported that Criegee intermediates not only re-arrange to form carboxylic acids, but may also react with species such as carboxylic acids, leading to formation of hydroperoxide esters (see e.g. work at the air–water interface by Enami and Colussi, 2017, on reactions of cis-pinonic acid with Criegee intermediates produced from the ozonolysis of sesquiterpenes and by Zhou et al., 2019, on reactions of condensed-phase Criegee intermediates with carboxylic acids and perfluoroalkyl carboxylic acids). To our knowledge there are no studies on oleic acid reacting with Criegee intermediates, but it is clearly possible that the simple four products presented here are not the only products given the potential for secondary chemistry. For our specific approach of studying a floating monolayer on water, secondary reactions seem comparably unlikely given the geometry and relatively low concentration of oleic acid compared to ozone in the conditions applied. Future studies as a function of oleic acid surface coverage could disentangle this chemistry to some extent and potentially provide evidence for Criegee intermediates reacting with oleic acid.
Out of the four initial products described in Scheme 1, nonanoic acid is the most obviously amphiphilic product and thus the prime candidate picked out in the past for possible membership in a post-ozonolysis monolayer (King et al., 2009). Nonanal has been reported as partitioning to the gas phase upon oxidation of methyl oleate monolayers (McNeill et al., 2007). The surfactant activity of azelaic acid is under debate, with Voss et al. (2007) suggesting no surfactant activity and Tuckermann (2007) taking the opposite view. The room-temperature solubility of azelaic acid (2.4 g L−1; Tuckermann, 2007) is much higher than that of nonanoic acid (0.28 g L−1; Gilman et al., 2004), so, in a reaction producing both products, azelaic acid is more likely to partition into the bulk rather than to the interface, although there is no conclusive evidence that it does not partition to the interface. King et al. (2009) suggest that it most likely partitions to the bulk. 9-Oxononanoic acid is not as well studied as the other products and therefore is the hardest to predict as regards to its partitioning. King et al. (2009) suggest tentatively that it does not partition to the interface.
From the results discussed so far and knowledge of the volatility, solubility, and amphiphilicity of the candidate species, it is reasonable to dismiss nonanal from consideration due to its measured partition to the gas phase in a very similar reaction and due to the lack of any obvious significant amphiphilicity in the structure of the molecule. The results discussed so far do not allow discernment between nonanoic acid, azelaic acid, and 9-oxononanoic acid, all of which, if present as product monolayers, could produce the observed results.
However, the use of a partially deuterated form of oleic acid allows for some discernment between possibilities. Deuteration of only the tail side of the double bond of the oleic acid molecule (shown in teal in Scheme 1) facilitates an ozonolysis reaction in which two of the products (nonanal and nonanoic acid) will be deuterated (and thus detectable via neutron reflectometry) and the other two (9-oxononanoic acid and azelaic acid) will not be deuterated (and thus will not be detectable via neutron reflectometry).
Depending on the makeup of the product monolayer, the measured residue (as a fraction of initial deuterated material) will vary from nothing (signifying a product monolayer made up entirely of azelaic acid and/or 9-oxononanoic acid) to twice the relative amount (the same absolute amount if the same initial surface concentration of oleic acid is assumed) as in the d34 case (signifying a product monolayer made up entirely of nonanoic acid).
This experiment was carried out on a pure water subphase at 3 ± 1 ∘C, and the result was intermediate between these two possible extremes. The fraction of deuterated material remaining at the interface was calculated for five ozonolysis reactions, and the mean deuterated residue fraction was 9.8 %, with a 95 % confidence interval (assuming sampling from a Gaussian distribution as before) of ±2.0 % (absolute). The confidence interval here heavily overlaps with the confidence interval for the mean deuterated residue fraction for the d34 experiment, so the two values are not significantly different. Indistinguishable fractional deuterated residue means that, from the same oleic acid surface concentration starting point, the deuterated residue present in a d18 experiment is half of what it is in a d34 experiment. This implies a product monolayer made up of roughly equal molar amounts of nonanoic acid and azelaic and/or 9-oxononanoic acids (the ratio between these latter two cannot be determined by this method, as both are deuterated in a d34 experiment and non-deuterated in a d18 experiment). While there are limited data available on the temperature dependence of the solubilities of these three products, the solubility of azelaic acid has been reported to reduce to 1.0 g L−1 at 1 ∘C from 2.4 g L−1 at 20 ∘C (O'Neil, 2006), which suggests that azelaic acid may be lost to the subphase at room temperature while being retained at the air–water interface at near-zero temperatures.
Figure 6 shows a representative example of a time series of 120 s time slices for this reaction on pure water, as well as the reaction on a salt subphase. The absolute amount of deuterated material in the residue is about half of that seen for the d34 experiment in the same conditions (see Fig. 2), and this comes close to the detection limit for 120 s count times in this neutron reflectometry setup. This results in many non-converging fits for the product monolayer, making its identification via this method of analysis alone difficult. However, taking longer time slices allows for a reliable discernment of a product monolayer, as the quality of the reflectivity statistics scales with the square root of count time (assuming a constant neutron flux). This is also illustrated in the stage-by-stage R vs. Q reflectivity plots displayed in Fig. S7 in the Supplement.
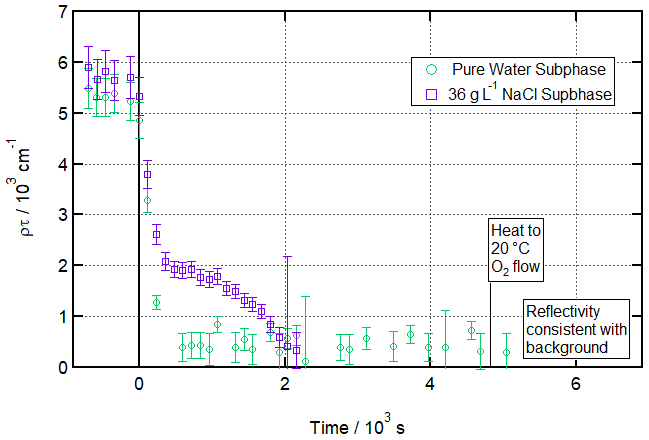
Figure 6Ozonolysis of a partially deuterated oleic acid monolayer floating on pure vs. salt water. Time evolution plot for ozonolysis of 17 µL 1.3 g L−1 d18-OA (CHCl3 spreading solution) on pure water (green circles) and 36 g L−1 NaCl(aq) (purple squares) subphases by 323 ± 29 ppb O3 introduced at t=0 s at 3 ± 1 ∘C (pure water) or −2 ± 1 ∘C (salt water).
A topping-up and re-oxidisation experiment was also carried out with d18-oleic acid, and the results were analogous to those for the d34-oleic acid experiment (except scaled down by a factor of 2). This demonstrates that both the nonanoic acid and azelaic/9-oxononanoic acid components of the product monolayer can be built up over time (if only nonanoic acid were to build up, then the build-up of fractional deuterated residue would be faster in the d18 experiment; if only azelaic/9-oxononanoic acid were to build up, then no build-up would be observed in the d18 experiment). These data are included in the Supplement (Figs. S9 and S10).
3.7 Product elucidation at near-zero temperatures with partially deuterated reactants: salt water subphase
A series of d18 experiments was also run for the salt water subphase at −2 ± 1 ∘C in which measurable residue was observed for d34-oleic acid ozonolysis. This allowed investigation of the likely makeup of the product monolayer in the same way as under the pure water 3 ± 1 ∘C conditions. However, the yet lower absolute amounts of residual deuterated material in this experiment posed sensitivity problems for this method of measuring the residue, and therefore the conclusions that can be drawn about the composition of the product monolayer in the salt water −2 ± 1 ∘C conditions are less secure than those that can be drawn about the composition of the product monolayer on pure water at 3 ± 1 ∘C discussed above.
In two out of three runs, a residue was detected. This could be because the residue was genuinely absent in the third run or because it was simply below the detection threshold. Treating the run in which no residue was measurable as a measurement of zero residue yields a mean fractional deuterated residue of 5.6 % with a 95 % confidence interval of ±2.9 % (absolute) for this system. This may be a slight underestimate of the true value due to the treatment of below-threshold residue as zero residue.
Based on our analysis, the product monolayer cannot be predominantly composed of nonanoic acid, as that would produce a significantly higher fractional deuterated residual in the d18 case than in the d34 case, which can be ruled out by our data. It is not possible to say with confidence that the composition of this product monolayer is similar to that observed in the pure water 3 ± 1 ∘C conditions (a roughly equal mixture of nonanoic acid and azelaic/9-oxononanoic acids), as the data are also consistent with somewhat lower relative levels of nonanoic acid (though not none at all, as that would produce no measurable residue).
It must be noted that, in this particular case, an assumption had to be made that the reaction would have proceeded to completion within 4000 s and that anything measured after that point was a stable residue. This is because the residue was, in all these d18 salt water −2 ± 1 ∘C cases, below the detection threshold for a 120 s count time. This meant that the reaction could not be followed to ascertain at which point the system was stable in order to define a period over which the residue could be more accurately measured using a single reflectivity curve compiled over a long count time. As the saltwater trace in Fig. 2 (low temperature) shows, the reaction on salt water at low temperatures proceeds to completion over a much longer time frame than the pure water equivalent.
In order to measure the stable residue, the 120 s interval time series graph is first prepared, and the slope of that graph is then used to determine at what point a stable residue has formed, and the time period during which that graph is flat is then averaged over to create the single after-ozonolysis reflectivity curve which is shown in the R vs. Q reflectivity graphs and used to determine the fractional deuterated residue values. For instance, Fig. 2 shows that the signal is no longer declining after 4000 s, so the time period used for the after-ozonolysis reflectivity curve in Fig. S4 is 4000–4500 s (heating began at 4500 s). For all fractional deuterated residue calculations except these last (for d18 salt water −2 ± 1 ∘C), the 120 s time series interval graphs have been able to guide the time integration ranges for the step-by-step R vs. Q reflectivity curves (see Fig. S7 in the Supplement).
However, for the d18 salt water −2 ± 1 ∘C experiment, the absolute signal from the residue was so low that 120 s count times were not sufficient. As a result, the reaction was assumed to have completed by 4000 s (longer than any observed reaction times), and signal was averaged from this point until heating in order to quantify the residue.
Figures 6 and S8 (in the Supplement) show a time series and R vs. Q reflectivity plots for these conditions. The time series plot demonstrates that any residue is below the detection limit for 120 s of counting; however, the 500 s over which the after-ozonolysis reflectivity curve is calculated affords good enough data to discern a residue.
3.8 Atmospheric product stability: temperature threshold
It has been demonstrated that a residue remains at the interface after ozonolysis (2 h timescale) of an oleic acid monolayer by gas-phase ozone at 3 ± 1 ∘C on a pure water subphase and at −2 ± 1 ∘C on a 36 g L−1 NaCl aqueous solution. However, it would be useful to establish across what ranges of temperature this product monolayer persists.
In order to investigate this, a product monolayer was gradually heated (1∘ every 5 min) to see if there was a critical threshold temperature above which it would be rapidly removed from the interface.
Figure 7 shows the temperature-ramping experiment in detail. The temperature of the subphase is controlled by varying the temperature of a coupled coolant bath. For the experiments discussed thus far, the temperature of the subphase can be measured before each experiment, allowing the offset between bath and subphase to be measured and an accurate assessment of the subphase temperature via direct measurement used for each experiment. For this ramping experiment, it was not practical to measure the subphase temperature directly for every step. Instead, the relationship between bath and subphase temperatures was used to define a linear relationship between bath and subphase temperatures that was deemed sufficiently accurate given the existing ±1 ∘C uncertainty. Diurnal temperature variations that could have disturbed this relationship were largely eliminated using air conditioning to maintain the temperature of the experimental area at around 15 ∘C, which was also key in reducing the impact of condensation. The bath was set to −1 ∘C for ozonolysis and then increased by 1 ∘C at t=1035 s and every 300 s following until 5 ∘C (corresponding to a measured subphase temperature of 7 ∘C) was reached after 2535 s. A single step to a bath temperature of 11 ∘C, which corresponds to a subphase temperature of around 12 ∘C, was performed at t=3260 s.

Figure 7Gradual loss of residue due to increase in temperature. Time evolution plot for ozonolysis of 29 µL 1.0 g L−1 d34-OA (CHCl3 spreading solution) on pure subphase by 754 ± 89 ppb O3 introduced at t=0 s at 2 ± 1 ∘C, with temperature ramping (described in detail in the text) from t=1035 s; error bars are omitted for visual clarity.
This experiment was performed on the FIGARO reflectometer at the ILL (experiment 9-10-1518) and showed that the product film was stable at up to 7 ± 1 ∘C, though there was a slight linear decay in product monolayer surface concentration with increasing temperature. On further heating to 12 ± 1 ∘C, no threshold temperature was observed, but, at this higher temperature, the linear decay ran into the detection limits of the neutron reflectometry setup. This could mean that the monolayer is not stable at or above 12 ± 1 ∘C, or it could mean that it simply continues to gradually linearly decay with rising temperature above 12 ± 1 ∘C, but passed the detection limit of the setup used for this experiment. Either way, the product monolayer is certainly stable up to 7 ± 1 ∘C but definitely not above 12 ± 1 ∘C (upper limit).
It is important to note that a monolayer produced at 3 ± 1 ∘C and then being stable at up to around 12 ± 1 ∘C does not mean that a reaction carried out at 12 ± 1 ∘C would definitely produce a stable monolayer. However, this temperature-ramping experiment at least provides a hint for the range of temperatures over which these product monolayers might persist. Most of the troposphere is below 10 ∘C, so these conditions are highly atmospherically relevant.
Hung and Tang (2010) suggested that the physical state of products from the ozonolysis of solid state oleic acid particles by O3 might be temperature dependent across a 4–9 ∘C temperature range, and it is worth considering whether the effect we report in present work is linked to this phenomenon, as there is overlap between this transition temperature range and the 6–13 ∘C transition range we observe.
3.9 Kinetic analysis of oleic acid ozonolysis
Experiments were performed on the FIGARO reflectometer at the ILL (experiment 9-10-1518) to elucidate the effect of temperature changes on the kinetics of the reaction. The ozonolysis reaction was performed with [O3]gas ranging between 126 ± 15 and 1005 ± 119 ppb. A pseudo-first-order rate coefficient (k1) for each reaction was calculated by fitting a modified exponential developed in previous work by this group in order to account for the fact that [O3]gas initially builds up in the reaction chamber and thus rises steeply at the start of the reaction as initial mixing occurs within the chamber (Pfrang et al., 2014). The traditional first-order exponential equation that describes a second-order reaction occurring with an excess of one reactant (in this case, O3) is modified to (Pfrang et al., 2014)
The expected exponential relationship between surface concentration (Γ) and time (t) is modified by the inclusion of a second exponential function that includes constants for the gas flow rate (f), which is 20 cm3 s−1 for these experiments, and chamber volume (v), which is 2.1 × 103 cm3, but which requires replacement with an effective chamber volume. The derivation of Eq. (3) is presented in previous work (Pfrang et al., 2014).
It is important to note that this analytical treatment is not a complete description of the processes at work throughout the reaction. Transient reaction products at the interface are, due to their deuterated nature, measured along with the reactant film throughout the reaction if and when they are present (this is why the technique is sensitive to a residual product film). As a result, fitting this analytical model to the data needs to take this into account. A number of assumptions have to be made about the precise way in which ozone mixes into the chamber. These are discussed in detail in Sect. S3 of the Supplement. Here, we present and discuss the results of this fitting procedure.
Figure 8 displays fitted k1 values for reactions under a variety of [O3]surf conditions at 21 and 2 ∘C, as well as 95 % confidence intervals for fits of k2 values () to these data.
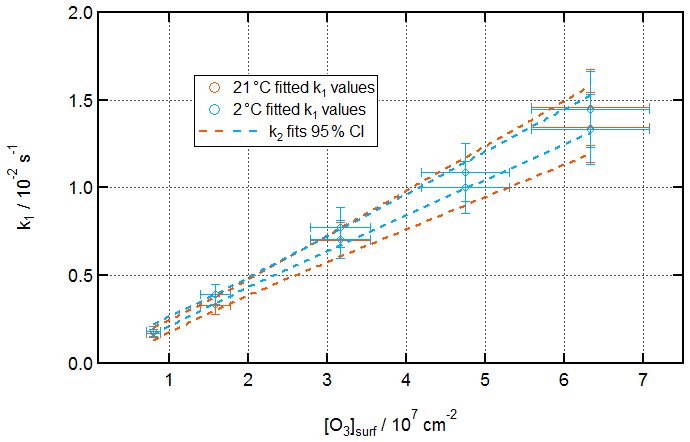
Figure 8Kinetics of ozonolysis of the oleic acid monolayer on pure water at room and low temperatures. Fitted k1 pseudo-first-order rate constants against [O3]surf at 21 ± 1 ∘C (orange) and 2 ± 1 ∘C (aqua).
[O3]surf values were calculated from [O3]gas values by using a Henry's law solubility constant for O3 in organics of [organic] ∕ [gas] = 11.7 (unitless) and assuming the same layer thickness of 2 nm. This solubility constant is consistent with the value used previously in ozonolysis experiments by King et al. (2009) and is informed by the work of Smith et al. (2002).
The error in each fitted k1 value, as noted in Sect. S3 of the Supplement, is dominated by uncertainty in model fitting at the start of each reaction. Uncertainty in [O3]surf arises from uncertainties in the calibration of the Pen-Ray ozoniser, which was performed using Beer–Lambert law UV absorbance at 254 nm using an extinction coefficient of 1.13 × 10⁻¹⁷ cm−2 (Daumont et al., 1992).
The fitted k2 values for these two conditions (± a 95 % confidence interval) are (2.2 ± 0.4) × 10−10 and (2.2 ± 0.2) × 10−10 cm2 s−1 at 21 and 2 ∘C, respectively.
Our experiments observe either no difference or a difference too small to be reliably detected (a difference of < 10 % might not be noticeable given the uncertainty in fitted k1 parameters and [O3] calibration). This is a similar situation to that found by Hung and Tang (2010), who observed, for ozonolysis of liquid oleic acid, a very slight dependence on temperature based on their point estimates of reaction rate that was within their margins of error (although they observed a strong temperature dependence for the ozonolysis of solid oleic acid).
It is important to note that, as this reflectivity-based method for calculating surface concentration of oleic acid is not sensitive only to oleic acid, but also to reaction products that may remain at the interface, it is possible that the rate of reaction does differ across this temperature range but that changes in product build-up and distribution conspire to entirely mask this, leading to a similar trend in total adsorbed deuterated material at the interface. It seems highly unlikely that counterbalancing effects would conspire to so well balance each other out across a range of [O3] conditions. In any case, from an atmospheric perspective, the key question is not how fast oleic acid reacts but how fast the monolayer is removed from the interface. These experiments confirm that changing the temperature from room temperature to a more atmospherically realistic near-zero temperature does not notably alter the rate of monolayer removal from the interface.
Figure 9 shows time series of the product of SLD and thickness for the lowest and highest [O3]surf concentrations used at the two temperatures studied, to provide a clearer visual confirmation of the similar rates of the two reactions.
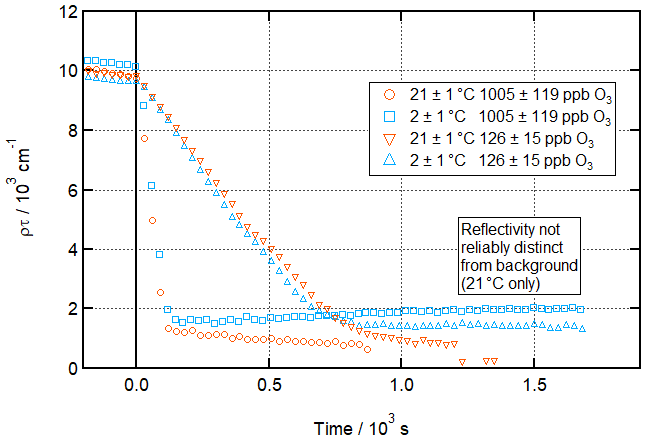
Figure 9Comparison of time-dependent loss of material from the air–water interface during oleic acid ozonolysis at room and low temperatures and at highest and lowest [O3]. Time evolution plot for ozonolysis of 39 µL 0.75 g L−1 d34-OA (CHCl3 spreading solution) on pure subphase by O3 introduced at t=0 s at 21 ± 1 ∘C (orange) and 2 ± 1 ∘C (aqua); error bars are omitted for visual clarity.
It can be seen from these two comparisons that the rates of these reactions do not differ appreciably. Indeed, the offset between the two curves is due in both cases to slight differences in starting concentration. These plots also further corroborate the main result of this study – that a residue remains after ozonolysis at near-zero temperature but not at room temperature.
The rate coefficients determined here are about 3 times higher than those previously reported for ozonolysis of oleic acid monolayers (King et al., 2009). Significant variability between experiments to determine rates for these heterogeneous reactions is not unprecedented. When Hung and Tang (2010) investigated heterogeneous ozonolysis of liquid oleic acid, they measured a rate coefficient that was 3 times higher than the highest value they could find in previous work (Moise and Rudich, 2002) and up to 10 times higher than the lowest. For solid state ozonolysis, the discrepancy was up to a factor of 40 (Hung and Tang, 2010).
The most important conclusions here, however, are not the absolute rate coefficients measured but the fact that there is not a notable difference between them. Despite the qualitative differences between the ozonolysis of an oleic acid monolayer at room temperature and more atmospherically relevant near-zero temperatures (namely the presence of a residual monolayer in the latter case), the kinetics of the reaction does not appear to be altered substantially in these two conditions.
4.1 Atmospheric surface chemistry
Based on our neutron reflectometry data, we conclude that the ozonolysis of an oleic acid monolayer on a pure water subphase (a basic model of an atmospheric water droplet) does not leave behind a product at the interface at room temperature but does leave such a residual product film at more atmospherically relevant near-zero temperatures and may do so at temperatures of up to 7–12 ∘C. Data from an experiment involving re-deposition and re-ozonolysis of oleic acid showing the build-up of this product monolayer convince us that this is a genuine product of the reaction.
Further to this, we conclude that the ozonolysis of an oleic acid monolayer film on a 36 g L−1 NaCl aqueous solution subphase (a basic model of a sea spray droplet) does not leave a product film at the interface at room temperature but does leave such a residual product film behind at temperatures below freezing. Such a residual product film probably is not left behind after ozonolysis at the 3 ± 1 ∘C temperature condition at which stable product films were observed on pure water.
Based on data from experiments performed with a partially deuterated form of oleic acid together with a knowledge of the expected major products of the ozonolysis, we conclude that, for the pure water subphase, this product film is roughly half nonanoic acid, with the other half being azelaic acid or 9-oxononanoic acid, or a mixture of the two. For the salt subphase case, the data are less conclusive on the ratio between these components, though very high or very low fractions of nonanoic acid can be ruled out.
Experiments performed at a variety of O3 concentrations demonstrate that the rate of monolayer removal does not differ significantly between the two temperatures studied, despite the clear qualitative differences in the end state of the reaction; rate coefficients were determined to be (2.2 ± 0.4) × 10−10 and (2.2 ± 0.2) × 10−10 cm2 s−1 at 21 ± 1 and 2 ± 1 ∘C, respectively.
4.2 Atmospheric implications
Almost regardless of the chemical nature of the surface film, the result from an atmospheric physics perspective is very similar: a film remains at the surface after ozonolysis of an oleic acid monolayer at atmospherically realistic temperatures. The presence of such a film means that the physical effects of a surface monolayer, such as reduced water uptake, reduced surface pressure, and reduced evaporation, will still be present, albeit not to the same extent, as they were in the original oleic-acid-coated aerosol droplet. This means the fact that an oleic acid film will oxidise in the atmosphere does not render such a film irrelevant to the physical properties of the droplet in the long term, as would be the case if no residual film remained after ozonolysis.
Furthermore, our re-oxidation experiments demonstrate that an inert product film may build up during the droplet ageing process in the atmosphere, even if only ordinarily short-lived reactive species (such as oleic acid and other unsaturated compounds) were initially emitted into the atmosphere. It is entirely possible that, given suitably cold conditions, an entirely saturated “full” monolayer could be built up by repeated deposition and ozonolysis of entirely unsaturated precursor surfactants. More generally, long-lived inert films could develop even if only short-lived reactive species are emitted, provided a suitable processing mechanism is available. The ozonolysis of oleic acid studied here is such a mechanism; therefore emissions of oleic acid and similar unsaturated fatty acids may well result in the build-up of saturated monolayers inert to further ozonolysis. This provides a way to reconcile the observation that anthropogenic activity emits significant quantities of unsaturated fatty acids (Shrivastava et al., 2007) with the observation that aerosol particles collected from the atmosphere seem to host monolayers entirely inert to ozonolysis (Jones et al., 2017).
The presence of these long-lived films is atmospherically significant. The surface pressure reduction in particular may have an impact on cloud lifetimes via the stabilisation of lower diameter droplets associated with this change under Köhler theory (Ambaum, 2010). Other possible effects include reduced water uptake (and therefore growth) of the droplet, inhibited evaporation from the droplet, reduced transfer of species between the droplet and the wider atmosphere (alternative processes leading to this effect have been discussed in earlier work by this research group and others; King et al., 2004; Pfrang et al., 2014, 2017a), and modified surface solubility of other atmospheric species (Barnes, 1997; Benjamin, 1996; Cohen Stuart et al., 1996; Gaines, 1966; Garrett, 1971; Gilman et al., 2004; La Mer, 1962; La Mer et al., 1964; Mmereki et al., 2003; Mmereki and Donaldson, 2002; Ray et al., 1991; Rideal, 1924; Tomoaia-Cotisel and Cadenhead, 1991).
In summary, this work provides evidence that even the emission of reactive surfactant species such as unsaturated fatty acids could alter the physical properties of water droplets in the atmosphere (including in clouds) over a much longer timeframe than the atmospheric lifetime of these species would suggest, via the build-up of inert monolayers on the surface of such droplets composed of the products of the oxidative processing of such fatty acids in the atmosphere.
The data presented in this paper can be obtained from the corresponding author upon request. The underlying data are archived at ILL (https://doi.org/10.5291/ILL-DATA.9-10-1518, Thomas et al., 2018) and ISIS (https://doi.org/10.5286/ISIS.E.87020742, Pfrang et al., 2017b; https://doi.org/10.5286/ISIS.E.92919810, Pfrang et al., 2018).
The supplement related to this article is available online at: https://doi.org/10.5194/acp-21-1325-2021-supplement.
CP and MWAS initiated the research project. CP, MWAS, and BW designed the experiments and carried them out. BW analysed the data with support from MWAS and CP. AMi and CG supported the work during beam-time experiments, and AMi also helped with the offline calibrations. AMa provided support during the FIGARO beam time. JT synthesised deuterated oleic acid. BW, CP, and MWAS prepared the manuscript.
The authors declare that they have no conflict of interest.
The authors acknowledge the following people for their contributions to this work: Sophie Ayscough (University of Edinburgh) and Evita Hartmane (University of Reading) for assistance on beamline experiments at ILL and ISIS; Philipp Gutfreund (ILL) for help with the FIGARO beamline operation; Simon Wood (ILL) for technical assistance on the FIGARO beamline; Jacob Simms (ISIS) for reaction chamber design and assembly partnership; Richard Haynes (ISIS) for support of the reaction chamber design, assembly, and deployment, plus technical assistance on the INTER beamline; John Crawford (ISIS) for assistance with the reactor chamber assembly; Jeff Vine (ISIS), Tom Charleston (ISIS), and Andy Church (ISIS) for technical assistance on the INTER beamline.
This research has been supported by the Natural Environment Research Council (grant no. NE/L002566/1).
This paper was edited by Jason Surratt and reviewed by four anonymous referees.
Allan, J. D., Williams, P. I., Morgan, W. T., Martin, C. L., Flynn, M. J., Lee, J., Nemitz, E., Phillips, G. J., Gallagher, M. W., and Coe, H.: Contributions from transport, solid fuel burning and cooking to primary organic aerosols in two UK cities, Atmos. Chem. Phys., 10, 647–668, https://doi.org/10.5194/acp-10-647-2010, 2010.
Ambaum, M. H. P.: Thermal Physics of the Atmosphere, 1st edn., Wiley-Blackwell, Reading, UK, 2010.
Barnes, G. T.: Permeation through monolayers, Colloid. Surface. A, 126, 149–158, https://doi.org/10.1016/S0927-7757(96)03926-X, 1997.
Benjamin, I.: Chemical Reactions and Solvation at Liquid Interfaces: A Microscopic Perspective Chemical Reactions and Solvation at Liquid Interfaces: A Microscopic Perspective, Chem. Rev., 96, 1449–1476, https://doi.org/10.1021/cr950230, 1996.
Cantrell, W. and Robinson, C.: Heterogeneous freezing of ammonium sulfate and sodium chloride solutions by long chain alcohols, Geophys. Res. Lett., 33, L07802, https://doi.org/10.1029/2005gl024945, 2006.
Chen, Y., Zhang, Y., Lambe, A. T., Xu, R., Lei, Z., Olson, N. E., Zhang, Z., Szalkowski, T., Cui, T., Vizuete, W., Gold, A., Turpin, B. J., Ault, A. P., Chan, M. N., and Surratt, J. D.: Heterogeneous Hydroxyl Radical Oxidation of Isoprene-Epoxydiol-Derived Methyltetrol Sulfates: Plausible Formation Mechanisms of Previously Unexplained Organosulfates in Ambient Fine Aerosols, Environ. Sci. Technol. Lett., 7, 460–468, https://doi.org/10.1021/acs.estlett.0c00276, 2020.
Cohen Stuart, M. A., Wegh, R. A. J., Kroon, J. M., and Sudhölter, E. J. R.: Design and Testing of a Low-Cost and Compact Brewster Angle Microscope, Langmuir, 12, 2863–2865, https://doi.org/10.1021/la9507592, 1996.
Cosman, L. M., Knopf, D. A., and Bertram, A. K.: N2O5 reactive uptake on aqueous sulfuric acid solutions coated with branched and straight-chain insoluble organic surfactants, J. Phys. Chem. A, 112, 2386–2396, https://doi.org/10.1021/jp710685r, 2008.
Daumont, D., Brion, J., Charbonnier, J., and Malicet, J.: Ozone UV spectroscopy I: Absorption cross sections at room temperature, J. Atmos. Chem., 15, 135–155, 1992.
Donaldson, D. J. and Vaida, V.: The influence of organic films at the air-aqueous boundary on atmospheric processes, Chem. Rev., 106, 1445–1461, https://doi.org/10.1021/cr040367c, 2006.
Ellison, G. B., Tuck, A. F., and Vaida, V.: Atmospheric processing of organic aerosols, J. Geophys. Res., 104, 11633–11641, https://doi.org/10.1029/1999JD900073, 1999.
Enami, S. and Colussi, A. J.: Efficient scavenging of Criegee intermediates on water by surface-active cis-pinonic acid, Phys. Chem. Chem. Phys., 19, 17044–17051, 2017.
Fu, P. Q., Kawamura, K., Chen, J., Charrière, B., and Sempéré, R.: Organic molecular composition of marine aerosols over the Arctic Ocean in summer: contributions of primary emission and secondary aerosol formation, Biogeosciences, 10, 653–667, https://doi.org/10.5194/bg-10-653-2013, 2013.
Gaines, G. L.: Insoluble Monolayers at the Liquid Gas Interface, Interscience Publishers, New York, USA, 1966.
Gallimore, P. J., Griffiths, P. T., Pope, F. D., Reid, J. P., and Kalberer, M.: Comprehensive modeling study of ozonolysis of oleic acid aerosol based on real-time, online measurements of aerosol composition, J. Geophys. Res.-Atmos., 122, 4364–4377, https://doi.org/10.1002/2016JD026221, 2017.
Garrett, W. D.: Retardation of Water Drop Evaporation with Monomolecular Surface Films, J. Atmos. Sci., 28, 816–819, https://doi.org/10.1175/1520-0469(1971)028<0816:rowdew>2.0.co;2, 1971.
Geŕard, V., Noziere, B., Fine, L., Ferronato, C., Singh, D. K., Frossard, A. A., Cohen, R. C., Asmi, E., Lihavainen, H., Kivekas̈, N., Aurela, M., Brus, D., Frka, S., Kusǎn, A. C.: Concentrations and Adsorption Isotherms for Amphiphilic Surfactants in PM1 Aerosols from Different Regions of Europe, Environ. Sci. Technol., 53, 21, 12379–12388, 2019.
Gill, P. S., Graedel, T. E., and Weschler, C. J.: Organic films on atmospheric aerosol particles, fog droplets, cloud droplets, raindrops, and snowflakes, Rev. Geophys., 21, 903, https://doi.org/10.1029/RG021i004p00903, 1983.
Gilman, J. B., Eliason, T. L., Fast, A., and Vaida, V.: Selectivity and stability of organic films at the air-aqueous interface, J. Colloid Interf. Sci., 280, 234–43, https://doi.org/10.1016/j.jcis.2004.07.019, 2004.
Gross, S., Iannone, R., Xiao, S., and Bertram, A. K.: Reactive uptake studies of NO3 and N2O5 on alkenoic acid, alkanoate, and polyalcohol substrates to probe nighttime aerosol chemistry, Phys. Chem. Chem. Phys., 11, 7792–7803, 2009.
Grotjahn, R.: General Circulation of the Atmosphere, Mean Characteristics, in: Encyclopedia of Atmospheric Sciences, 2nd edn., edited by: North, G. R., Pyle, J., and Zhang, F., 73–89, Academic Press, Oxford, UK, 2015.
Hung, H.-M. and Tang, C.-W.: Effects of Temperature and Physical State on Heterogeneous Oxidation of Oleic Acid Droplets with Ozone, J. Phys. Chem. A, 114, 13104–13112, https://doi.org/10.1021/jp105042w, 2010.
Hung, H.-M., Katrib, Y., and Martin, S. T.: Products and mechanisms of the reaction of oleic acid with ozone and nitrate radical, J. Phys. Chem. A., 109, 4517–4530, https://doi.org/10.1021/jp0500900, 2005.
Jones, S. H., King, M. D., Ward, A. D., Rennie, A. R., Jones, A. C., and Arnold, T.: Are organic films from atmospheric aerosol and sea water inert to oxidation by ozone at the air-water interface?, Atmos. Environ., 161, 274–287, https://doi.org/10.1016/J.ATMOSENV.2017.04.025, 2017.
King, M. D., Thompson, K. C., and Ward, A. D.: Laser Tweezers Raman Study of Optically Trapped Aerosol Droplets of Seawater and Oleic Acid Reacting with Ozone: Implications for Cloud-Droplet Properties, J. Am. Chem. Soc., 126, 16710–16711, https://doi.org/10.1021/ja044717o, 2004.
King, M. D., Rennie, A. R., Thompson, K. C., Fisher, F. N., Dong, C. C., Thomas, R. K., Pfrang, C., and Hughes, A. V.: Oxidation of oleic acid at the air-water interface and its potential effects on cloud critical supersaturations., Phys. Chem. Chem. Phys., 11, 7699–7707, https://doi.org/10.1039/b906517b, 2009.
Knopf, D. A. and Forrester, S. M.: Freezing of Water and Aqueous NaCl Droplets Coated by Organic Monolayers as a Function of Surfactant Properties and Water Activity, J. Phys. Chem. A, 115, 5579–5591, 2011.
Knopf, D. A., Anthony, L. M., and Bertram, A. K.: Reactive uptake of O3 by multicomponent and multiphase mixtures containing oleic acid, J. Phys. Chem. A, 109, 5579–5589, 2005.
Knopf, D. A., Cosman, L. M., Mousavi, P., Mokamati, S., and Bertram, A. K.: A novel flow reactor for studying reactions on liquid surfaces coated by organic monolayers: Methods, validation, and initial results, J. Phys. Chem. A, 111, 11021–11032, https://doi.org/10.1021/Jp075724c, 2007.
Knopf, D. A., Alpert, P. A., and Wang, B.: The Role of Organic Aerosol in Atmospheric Ice Nucleation: A Review, ACS Earth Space Chem., 2, 168–202, https://doi.org/10.1021/acsearthspacechem.7b00120, 2018.
Koop, T., Kapilashrami, A., Molina, L. T., and Molina, M. J.: Phase transitions of sea-salt/water mixtures at low temperatures: Implications for ozone chemistry in the polar marine boundary layer, J. Geophys. Res., 105, 26393–26402, 2000a.
Koop, T., Luo, B. P., Tsias, A., and Peter, T.: Water activity as the determinant for homogeneous ice nucleation in aqueous solutions, Nature, 406, 611–614, https://doi.org/10.1038/35020537, 2000b.
Kroflič, A., Frka, S., Simmel, M., Wex, H., and Grgič, I.: Size-Resolved Surface-Active Substances of Atmospheric Aerosol: Reconsideration of the Impact on Cloud Droplet Formation, Environ. Sci. Technol., 52, 9179–9187, 2018.
La Mer, V. K.: Retardation of Evaporation by Monolayers: Transport Processes, Academic Press Inc., London, UK, 1962.
La Mer, V. K., Healy, T. W., and Aylmore, L. A. G.: The transport of water through monolayers of long-chain n-paraffinic alcohols, J. Colloid Sci., 19, 673–684, 1964.
Last, D. J., Nájera, J. J., Wamsley, R., Hilton, G., McGillen, M., Percival, C. J., and Horn, A. B.: Ozonolysis of organic compounds and mixtures in solution. Part I: Oleic, maleic, nonanoic and benzoic acids, Phys. Chem. Chem. Phys., 11, 1427–1440, https://doi.org/10.1039/b815425b, 2009.
Li, S., Cheng, S., Du, L., and Wang, W.: Establishing a model organic film of low volatile compound mixture on aqueous aerosol surface, Atmos. Environ., 200, 15–23, https://doi.org/10.1016/j.atmosenv.2018.11.052, 2019.
Lu, J. R., Thomas, R. K., and Penfold, J.: Surfactant layers at the air/water interface: structure and composition, Adv. Colloid Interfac., 84, 143–304, https://doi.org/10.1016/S0001-8686(99)00019-6, 2000.
McNeill, V. F., Patterson, J., Wolfe, G. M., and Thornton, J. A.: The effect of varying levels of surfactant on the reactive uptake of N2O5 to aqueous aerosol, Atmos. Chem. Phys., 6, 1635–1644, https://doi.org/10.5194/acp-6-1635-2006, 2006.
McNeill, V. F., Wolfe, G. M., and Thornton, J. A.: The Oxidation of Oleate in Submicron Aqueous Salt Aerosols: Evidence of a Surface Process, J. Phys. Chem. A, 111, 1073–1083, https://doi.org/10.1021/JP066233F, 2007.
Mmereki, B. T. and Donaldson, D. J.: Laser induced fluorescence of pyrene at an organic coated air-water interface, Phys. Chem. Chem. Phys., 4, 4186–4191, https://doi.org/10.1039/b204754c, 2002.
Mmereki, B. T., Chaudhuri, S. R., and Donaldson, D. J.: Enhanced Uptake of PAHs by Organic-Coated Aqueous Surfaces, J. Phys. Chem. A, 107, 2264–2269, https://doi.org/10.1021/jp027361g, 2003.
Moise, T. and Rudich, Y.: Reactive Uptake of Ozone by Aerosol-Associated Unsaturated Fatty Acids: Kinetics, Mechanism, and Products, J. Phys. Chem. A, 106, 6469–6476, https://doi.org/10.1021/jp025597e, 2002.
Nelson, A.: Co-refinement of multiple-contrast neutron/X-ray reflectivity data using MOTOFIT, J. Appl. Crystallogr., 39, 273–276, https://doi.org/10.1107/S0021889806005073, 2006.
Nozière, B., Baduel, C., and Jaffrezo, J.-L.: The dynamic surface tension of atmospheric aerosol surfactants reveals new aspects of cloud activation, Nat. Commun., 5, 3335, https://doi.org/10.1038/ncomms4335, 2014.
O'Neil, M. J. (Ed.): The Merck Index – An Encyclopedia of Chemicals, Drugs, and Biologicals, Merck and Co., Inc., Whitehouse Station, NJ, USA, p. 153, 2006.
Ovadnevaite, J., Zuend, A., Laaksonen, A., Sanchez, K. J., Roberts, G., Ceburnis, D., Decesari, S., Rinaldi, M., Hodas, N., Facchini, M. C., Seinfeld, J. H., and O'Dowd, C.: Surface tension prevails over solute effect in organic-influenced cloud droplet activation, Nature, 546, 637–641, 2017.
Pfrang, C., Shiraiwa, M., and Pöschl, U.: Chemical ageing and transformation of diffusivity in semi-solid multi-component organic aerosol particles, Atmos. Chem. Phys., 11, 7343–7354, https://doi.org/10.5194/acp-11-7343-2011, 2011.
Pfrang, C., Sebastiani, F., Lucas, C. O. M., King, M. D., Hoare, I. D., Chang, D., and Campbell, R. A.: Ozonolysis of methyl oleate monolayers at the air–water interface: oxidation kinetics, reaction products and atmospheric implications, Phys. Chem. Chem. Phys., 16, 13220–13228, https://doi.org/10.1039/c4cp00775a, 2014.
Pfrang, C., Rastogi, K., Cabrera-Martinez, E. R., Seddon, A. M., Dicko, C., Labrador, A., Plivelic, T. S., Cowieson, N., and Squires, A. M.: Complex three-dimensional self-assembly in proxies for atmospheric aerosols, Nat. Commun., 8, 1724, https://doi.org/10.1038/s41467-017-01918-1, 2017a.
Pfrang, C., Woden, B., Skoda, M., and Gubb, C.: More than the sum – oxidation behaviour of mixed fatty acid monolayers, STFC ISIS Neutron and Muon Source, https://doi.org/10.5286/ISIS.E.87020742, 2017b.
Pfrang, C., Skoda, M., Woden, B., and Hartmane, E.: Closer to Reality: Studies of Mixed Organic Monolayer Ozonolysis at Atmospherically Relevant Temperature and Salinity Conditions, STFC ISIS Neutron and Muon Source, https://doi.org/10.5286/ISIS.E.92919810, 2018.
Ray, A. K., Devakottai, B., Souyri, A., and Huckaby, J. L.: Evaporation characteristics of droplets coated with immiscible layers of nonvolatile liquids, Langmuir, 7, 525–531, https://doi.org/10.1021/la00051a019, 1991.
Rideal, E. K.: On the Influence of Thin Surface Films on the Evaporation of Water, J. Phys. Chem., 29, 1585–1588, https://doi.org/10.1021/j150258a011, 1924.
Rudich, Y.: Laboratory perspectives on the chemical transformations of organic matter in atmospheric particles, Chem. Rev., 103, 5097–5124, 2003.
Ruehl, C. R., Davies, J. F., and Wilson, K. R.: An interfacial mechanism for cloud droplet formation on organic aerosols, Science, 351, 1447–1450, 2016.
Sareen, N., Schwier, A. N., Lathem, T. L., Nenes, A., and McNeill, V. F.: Surfactants from the gas phase may promote cloud droplet formation, P. Natl. Acad. Sci. USA, 110, 2723–2728, 2013.
Sebastiani, F., Campbell, R. A., and Pfrang, C.: Complementarity of neutron reflectometry and ellipsometry for the study of atmospheric reactions at the air–water interface, RSC Adv., 5, 107105–107111, https://doi.org/10.1039/C5RA22725A, 2015.
Sebastiani, F., Campbell, R. A., Rastogi, K., and Pfrang, C.: Nighttime oxidation of surfactants at the air–water interface: effects of chain length, head group and saturation, Atmos. Chem. Phys., 18, 3249–3268, https://doi.org/10.5194/acp-18-3249-2018, 2018.
Shrivastava, M. K., Subramanian, R., Rogge, W. F., and Robinson, A. L.: Sources of organic aerosol: Positive matrix factorization of molecular marker data and comparison of results from different source apportionment models, Atmos. Environ., 41, 9353–9369, https://doi.org/10.1016/j.atmosenv.2007.09.016, 2007.
Skoda, M. W. A., Thomas, B., Hagreen, M., Sebastiani, F., and Pfrang, C.: Simultaneous neutron reflectometry and infrared reflection absorption spectroscopy (IRRAS) study of mixed monolayer reactions at the air-water interface, RSC Adv., 7, 34208–34214, https://doi.org/10.1039/C7RA04900E, 2017.
Smith, G. D., Woods, E., DeForest, C. L., Baer, T., and Miller, R. E.: Reactive uptake of ozone by oleic acid aerosol particles: Application of single-particle mass spectrometry to heterogeneous reaction kinetics, J. Phys. Chem. A, 106, 8085–8095, https://doi.org/10.1021/jp020527t, 2002.
Stevens, B. and Feingold, G.: Untangling aerosol effects on clouds and precipitation in a buffered system, Nature, 461, 607–613, https://doi.org/10.1038/nature08281, 2009.
Tervahattu, H., Juhanoja, J., and Kupiainen, K.: Identification of an organic coating on marine aerosol particles by TOF-SIMS, J. Geophys. Res.-Atmos., 107, ACH 18-1–ACH 18-7, https://doi.org/10.1029/2001JD001403, 2002.
Thomas, B., Maestro, A., Milsom, A., Pfrang, C., and Skoda, M.: Oxidation Kinetics of Oleic Acid in Mixed Fatty Acid Monolayers: Miscible Vs Immiscible Mixtures, Institut Laue-Langevin (ILL), https://doi.org/10.5291/ILL-DATA.9-10-1518, 2018.
Thornberry, T. and Abbatt, J. P. D.: Heterogeneous reaction of ozone with liquid unsaturated fatty acids: detailed kinetics and gas-phase product studies, Phys. Chem. Chem. Phys., 6, 84–93, 2004.
Thornton, J. A. and Abbatt, J. P. D.: N2O5 reaction on submicron sea salt aerosol: Kinetics, products, and the effect of surface active organics, J. Phys. Chem. A, 109, 10004–10012, https://doi.org/10.1021/jp054183t, 2005.
Tomoaia-Cotisel, M. and Cadenhead, D. A.: The interaction of procaine with stearic acid monolayers at the air/water interface, Langmuir, 7, 964–974, https://doi.org/10.1021/la00053a025, 1991.
Tuckermann, R.: Surface tension of aqueous solutions of water-soluble organic and inorganic compounds, Atmos. Environ., 41, 6265–6275, https://doi.org/10.1016/j.atmosenv.2007.03.051, 2007.
Voss, L. F., Bazerbashi, M. F., Beekman, C. P., Hadad, C. M., and Allen, H. C.: Oxidation of oleic acid at air/liquid interfaces, J. Geophys. Res., 112, D06209, https://doi.org/10.1029/2006JD007677, 2007.
Warneck, P.: Chemistry of the Natural Atmosphere, vol. 71, 2nd edn., available at: https://www.elsevier.com/books/chemistry-of-the-natural-atmosphere/warneck/978-0-12-735632-7 (last access: 6 December 2020), 1999.
Woden, B., Skoda, M. W. A., Hagreen, M., and Pfrang, C.: Night-Time Oxidation of a Monolayer Model for the Air–Water Interface of Marine Aerosols – A Study by Simultaneous Neutron Reflectometry and in Situ Infra-Red Reflection Absorption Spectroscopy (IRRAS), Atmosphere, 9, 471, https://doi.org/10.3390/atmos9120471, 2018.
Zahardis, J. and Petrucci, G. A.: The oleic acid-ozone heterogeneous reaction system: products, kinetics, secondary chemistry, and atmospheric implications of a model system – a review, Atmos. Chem. Phys., 7, 1237–1274, https://doi.org/10.5194/acp-7-1237-2007, 2007.
Zhou, S., Joudan, S., Forbes, M. W., Zhou, Z., and Abbatt, J. P. D., Reaction of Condensed-Phase Criegee Intermediates with Carboxylic Acids and Perfluoroalkyl Carboxylic Acids, Environ. Sci. Technol. Lett., 6, 243–250, 2019.
Zobrist, B., Koop, T., Luo, B. P., Marcolli, C., and Peter, T.: Heterogeneous ice nucleation rate coefficient of water droplets coated by a nonadecanol monolayer, J. Phys. Chem. C, 111, 2149–2155, https://doi.org/10.1021/Jp066080w, 2007.
The exact value of this cut-off point varies depending on measurement conditions and count time, but ρτ ∼ 5 × 102 cm−1, corresponding to ca. 5 % of the oleic acid concentration spread initially, have been reliably measured with this experimental setup.