the Creative Commons Attribution 4.0 License.
the Creative Commons Attribution 4.0 License.
 | 02 Sep 2021
A global study of hygroscopicity-driven light-scattering enhancement in the context of other in situ aerosol optical properties
María A. Burgos
Paul Zieger
Lucas Alados-Arboledas
Urs Baltensperger
Anne Jefferson
James Sherman
Ernest Weingartner
Bas Henzing
Krista Luoma
Colin O'Dowd
Alfred Wiedensohler
Elisabeth Andrews
The scattering and backscattering enhancement factors (f(RH) and fb(RH)) describe how aerosol particle light scattering and backscattering, respectively, change with relative humidity (RH). They are important parameters in estimating direct aerosol radiative forcing (DARF). In this study we use the dataset presented in Burgos et al. (2019) that compiles f(RH) and fb(RH) measurements at three wavelengths (i.e., 450, 550 and 700 nm) performed with tandem nephelometer systems at multiple sites around the world. We present an overview of f(RH) and fb(RH) based on both long-term and campaign observations from 23 sites representing a range of aerosol types. The scattering enhancement shows a strong variability from site to site, with no clear pattern with respect to the total scattering coefficient. In general, higher f(RH) is observed at Arctic and marine sites, while lower values are found at urban and desert sites, although a consistent pattern as a function of site type is not observed. The backscattering enhancement fb(RH) is consistently lower than f(RH) at all sites, with the difference between f(RH) and fb(RH) increasing for aerosol with higher f(RH). This is consistent with Mie theory, which predicts higher enhancement of the light scattering in the forward than in the backward direction as the particle takes up water. Our results show that the scattering enhancement is higher for PM1 than PM10 at most sites, which is also supported by theory due to the change in scattering efficiency with the size parameter that relates particle size and the wavelength of incident light. At marine-influenced sites this difference is enhanced when coarse particles (likely sea salt) predominate. For most sites, f(RH) is observed to increase with increasing wavelength, except at sites with a known dust influence where the spectral dependence of f(RH) is found to be low or even exhibit the opposite pattern. The impact of RH on aerosol properties used to calculate radiative forcing (e.g., single-scattering albedo, ω0, and backscattered fraction, b) is evaluated. The single-scattering albedo generally increases with RH, while b decreases. The net effect of aerosol hygroscopicity on radiative forcing efficiency (RFE) is an increase in the absolute forcing effect (negative sign) by a factor of up to 4 at RH = 90 % compared to dry conditions (RH < 40 %). Because of the scarcity of scattering enhancement measurements, an attempt was made to use other more commonly available aerosol parameters (i.e., ω0 and scattering Ångström exponent, αsp) to parameterize f(RH). The majority of sites (75 %) showed a consistent trend with ω0 (higher f(RH = 85 %) for higher ω0), while no clear pattern was observed between f(RH = 85 %) and αsp. This suggests that aerosol ω0 is more promising than αsp as a surrogate for the scattering enhancement factor, although neither parameter is ideal. Nonetheless, the qualitative relationship observed between ω0 and f(RH) could serve as a constraint on global model simulations.
- Article
(800 KB) - Full-text XML
-
Supplement
(423 KB) - BibTeX
- EndNote


Aerosol particles from both natural and anthropogenic sources interact with solar radiation through scattering and absorption. The direct aerosol radiative forcing (DARF) results from changes at the top of the atmosphere and surface net fluxes associated with the aerosol scattering and absorbing behavior. The optical properties of the aerosol particles largely govern the magnitude of their radiative impact. Thus, uncertainties in these properties contribute to uncertainties in aerosol radiative forcing and are also important for visibility estimates.
Depending on their size and chemical composition, aerosol particles are able to take up water and become larger in size than their dry equivalents. Water uptake by aerosols changes not only the particle size but also composition (reflected in the aerosol refractive index), and this impacts the magnitude and angular distribution of scattered light. Aerosol absorption may also be impacted by RH if absorbing aerosols become embedded in a scattering shell (Bond et al., 2006; Fuller et al., 1999). Thus, the magnitude of the DARF will be affected by aerosol hygroscopic growth. The uncertainty related to parameterizing aerosol water uptake may be one contributor to the large differences observed among global climate models (e.g., Burgos et al., 2020) when simulating the direct aerosol effect (Myhre et al., 2013; Boucher and Anderson, 1995; Curci et al., 2015).
The influence of aerosol hygroscopicity on the particle light-scattering coefficient is usually quantified by means of the scattering enhancement factor, f(RH, λ), which is typically defined as the ratio of the scattering coefficient (σsp) at some high relative humidity (RH) to the scattering coefficient at a low reference RH (RHdry) (Covert et al., 1972), as shown in Eq. (1):
Hereafter, f(RH) refers to the 550 nm wavelength unless otherwise noted, with the wavelength dependence omitted for simplicity. Since the 1970s there have been multiple deployments of surface in situ instrumentation to measure f(RH) of the atmospheric aerosol across a wide range of aerosol types. Climatological information on f(RH) can provide useful information about the diversity of the effect of aerosol hygroscopicity on light scattering. Titos et al. (2016) present a review of many of these previous observations and point out the need to use a harmonized dataset to perform a joint f(RH) analysis. Even at individual sites, changes in emission sources and air masses impacting the sites can cause variability in observed f(RH) (e.g., McInnes et al., 1998; Carrico et al., 2003; Zieger et al., 2013; Titos et al., 2014a). Assessing the underlying causes of the diversity both spatially (i.e., across sites) and temporally (i.e., at a single site) is important, particularly if a goal is to constrain Earth system model parameterizations.
As mentioned above, water uptake by aerosols can modify their angular scattering properties and therefore may also affect the backscatter fraction (amount of radiation that is scattered in the backward direction compared with the total scatter radiation), further influencing the DARF. In order to take into account the RH dependence of the backscattering coefficient, the backscattering enhancement factor (fb(RH, λ)) can be calculated using Eq. (2):
where fb(RH,λ) is the ratio of the hemispheric backscattering coefficient at some high relative humidity (RH) to the backscattering coefficient at a low reference RH (RHdry). Again, for simplicity, the wavelength dependence is omitted, with wavelength being 550 nm unless otherwise noted.
The backscatter fraction has been found to decrease with increasing RH (Fierz-Schmidhauser et al., 2010a). Fierz-Schmidhauser et al. (2010a) showed that, at Jungfraujoch, the aerosol radiative forcing efficiency (RFE) increases (in absolute terms) with RH and that this increase is smaller if the RH dependence of both the backscattering coefficient and the single-scattering albedo are taken into account in the RFE calculation. Most previous studies investigating the effect of water uptake on the aerosol optical properties focus on the total scattering coefficient, and less attention is paid to fb(RH). That said, Hegg et al. (1996) noted that, based on Mie theory, fb(RH) would be expected to be lower than f(RH) as it is more sensitive to smaller particles. They were able to see this in a small observational dataset, although the extent of the difference between fb(RH) and f(RH) (40 %) was almost double what they expected (25 %). Several other observational studies (Carrico et al., 2003; Koloutsou-Vakakis et al., 2001; Fierz-Schmidhauser et al., 2010a) show that the backscattering enhancement is significantly lower than the total scattering enhancement across a range of aerosol types. Here, we present an overview of fb(RH) and f(RH) measured across the globe and evaluate them in relation to other colocated aerosol optical properties.
One important application of experimentally based f(RH) and fb(RH) parameterizations is to improve DARF and visibility estimates (Kanakidou et al., 2005). Such parameterizations may also be used to evaluate or constrain models (Burgos et al., 2020) and to predict and/or estimate the spatial and temporal variability of aerosol hygroscopicity where water uptake measurements are not available. For example, an f(RH) proxy could be used to better adjust vertical profiles of dry aerosol optical properties to ambient conditions for comparison to remote sensing measurements rather than assuming a constant f(RH) throughout the profile, as is often done when aerosol hygroscopicity measurements are not available (Andrews et al., 2004; Sheridan et al., 2012). Various approaches have been used to identify proxies for estimating aerosol water uptake, as described below.
Ideally, combined aerosol composition and size distribution measurements together with Mie theory would be used to parameterize hygroscopicity when direct measurements of aerosol hygroscopicity are not available (Zieger et al., 2013). Zieger et al. (2013) showed that a simple parameterization for all major aerosol types is difficult to retrieve without knowledge of certain constraints like the fine-mode composition or mode diameter and noted that the coarse-mode composition can be an important parameter in determining the magnitude of the modeled f(RH) for total aerosol (Zieger et al., 2013, 2014). Zieger et al. (2010) demonstrated that, at the Zeppelin station (ZEP, Ny-Ålesund), the measured size distribution in conjunction with an assumed chemical composition could also be used as a predictor of f(RH).
However, because many measurement sites lack the detailed chemistry, hygroscopic growth and size distribution information used, for example, in Zieger et al. (2015, 2014) and Fierz-Schmidhauser et al. (2010a, b), other approaches have been used instead. Towards this end, the IMPROVE network developed an equation for hygroscopicity relying on bulk PM2.5 chemical filter measurements of several species, including common ions, crustal elements, black carbon, organic carbon and unspeciated coarse particle mass (Pitchford et al., 2007; Prenni et al., 2019). Quinn et al. (2005) derived a simple parameterization that quantitatively describes the relationship between the particulate organic material (POM) mass fraction and f(RH) for ambient aerosols from three different field campaigns when the mass was assumed to consist solely of POM and sulfate. This parameterization was further extended by Zieger et al. (2015) and Zhang et al. (2015) to include the contribution of additional inorganic components. Those studies demonstrated a decreasing trend of f(RH) for an increasing POM mass fraction (Quinn et al., 2005; Zhang et al., 2015; Zieger et al., 2015; Jefferson et al., 2017). Burgos et al. (2020) showed that some global models are unable to reproduce this relationship between f(RH) and POM mass fraction (one of the models even simulated the opposite behavior).
While f(RH) parameterizations based on chemical and physical properties of the aerosol are useful, high-temporal-resolution measurements of aerosol composition or hygroscopic growth and complete (fine + coarse) size distribution can be complex and time-consuming to make. They are most frequently collected during field campaigns with durations of a few weeks to a few months. Thus, other potential proxies for f(RH), from more widely available observations, are important to investigate. For example, dry aerosol optical properties can provide some qualitative information on particle size and composition and may thus be useful for constraining f(RH). An early example of this was provided by Sheridan et al. (2001), who showed different probability distribution functions of f(RH) for different single-scattering albedo (ω0) and submicron scattering fraction constraints at the Southern Great Plains (SGP), a rural site in the continental US. They linked the decrease in ω0 to the presence of smoke aerosol and the increase in particle size to the presence of dust aerosol. Both cases (lowest ω0 and highest submicron scattering fraction) showed lower f(RH) values than the overall f(RH) climatology at the site. Sheridan et al. (2002) also observed that increases in ω0 correlated with increases in f(RH) during research flights over the Indian Ocean. Titos et al. (2014b) showed a decrease in f(RH) together with a decrease in ω0 at an urban site (Granada, UGR). However, the relationship between αsp and f(RH) at UGR varied throughout the year depending on the contribution of dust (coarse) particles at the site (Titos et al., 2014b). Nessler et al. (2005a) reported a strong relationship between f(RH) and αsp at Jungfraujoch. During the ACE-Asia campaign, the submicron scattering fraction, which is highly correlated with αsp (Delene and Ogren, 2002), was shown to be a good proxy for some hygroscopicity measurements but less so for others (Doherty et al., 2005). More recently, Titos et al. (2014a) utilized measurements of aerosol optical properties to develop an empirical equation quantifying the relationship between ω0 and f(RH) at a marine site with anthropogenic influence. Titos et al. (2014a) showed at Cape Cod (PVC, a coastal site in the northeastern US) that f(RH) increases as the contribution of absorbing particles to aerosol extinction decreases (i.e., as ω0 increases) and that, at PVC, ω0 could be used as a proxy to estimate the scattering-related hygroscopic enhancement. In contrast, Zieger et al. (2011, 2014) reported that at Cabauw (CES, in the Netherlands), neither ω0 nor αsp were good predictors of f(RH) (Zieger et al., 2011), while αsp was not a good proxy for f(RH) at Melpitz (MPZ, a rural site in Germany) (Zieger et al., 2014). Zieger et al. (2013) were unable to develop a general parameterization for f(RH) based on aerosol optical properties that was valid for multiple sites (Cabauw, Melpitz, Jungfraujoch, Mace Head and Ny-Ålesund).
In this work, we use the scattering enhancement dataset presented in Burgos et al. (2019), which compiles f(RH) and fb(RH) measurements performed with tandem nephelometer systems at 26 measurement sites. We first describe the variability of scattering enhancement at 23 of these sites in order to present a climatological overview of hygroscopicity observations (three of the sites in the Burgos et al., 2019, dataset are not included in this analysis because of their lower time resolution or because colocated measurements of the aerosol absorption coefficient were not available). This overview includes, for the first time, a climatology of the hygroscopicity of the aerosol hemispheric backscattering coefficient across diverse sites. Additionally, the impact of measurement wavelength and size cut on scattering-related hygroscopicity is assessed. We then combine the hygroscopicity dataset with simultaneous and colocated measurements of dry aerosol optical properties (i.e., dry spectral aerosol light-scattering and absorption coefficients) to investigate the impact of relative humidity on radiative forcing calculations. Finally, we extend previous investigations of the viability of using aerosol optical properties (i.e., scattering Ångström exponent and single-scattering albedo) as constraints for f(RH) across sites and aerosol types.
We focus on sites from the Burgos et al. (2019) dataset which include f(RH) and fb(RH) measurements of PM10 (particles with aerodynamic diameter <10 µm) or total scattering; some of the measurement sites also have concurrent measurements of f(RH) and fb(RH) for PM1 (particles with aerodynamic diameter <1 µm). Table 1 lists the sites included in this study and some relevant information for each site. In this section we present a brief overview of the data processing of the f(RH) dataset (more details are provided in Burgos et al., 2019), and then we describe the dry aerosol optical property dataset.
Schmeisser et al. (2018)Schmeisser et al. (2018); Zieger et al. (2010)Fierz-Schmidhauser et al. (2010a); Bukowiecki et al. (2016); Zieger et al. (2012)Ervens et al. (2010); Fehsenfeld et al. (2006)Wood et al. (2015)Doherty et al. (2005)Clarke et al. (2002)Eldering et al. (2002)Jennings et al. (2003)Fierz-Schmidhauser et al. (2010b)Titos et al. (2014a)Berkowitz et al. (2011)Parrish et al. (2004)Sherman et al. (2015)Pandolfi et al. (2018); Zanatta et al. (2016); Zieger et al. (2011)Fierz-Schmidhauser et al. (2010c)Liu et al. (2011)Luoma et al. (2019); Zieger et al. (2015)Pandolfi et al. (2018); Zanatta et al. (2016); Zieger et al. (2014)Sherman et al. (2015); Jefferson et al. (2017)Liu and Li (2018)Almeida et al. (2019)Dumka et al. (2017)Titos et al. (2012, 2014b)Miller and Slingo (2007)Table 1 Table listing sites, site type, references (general reference and f(RH) reference if available), absorption instruments used at each site and absorption instrument correction, and cut size. Site order is by site type and within it alphabetical by station ID. n/a stands for not applicable.
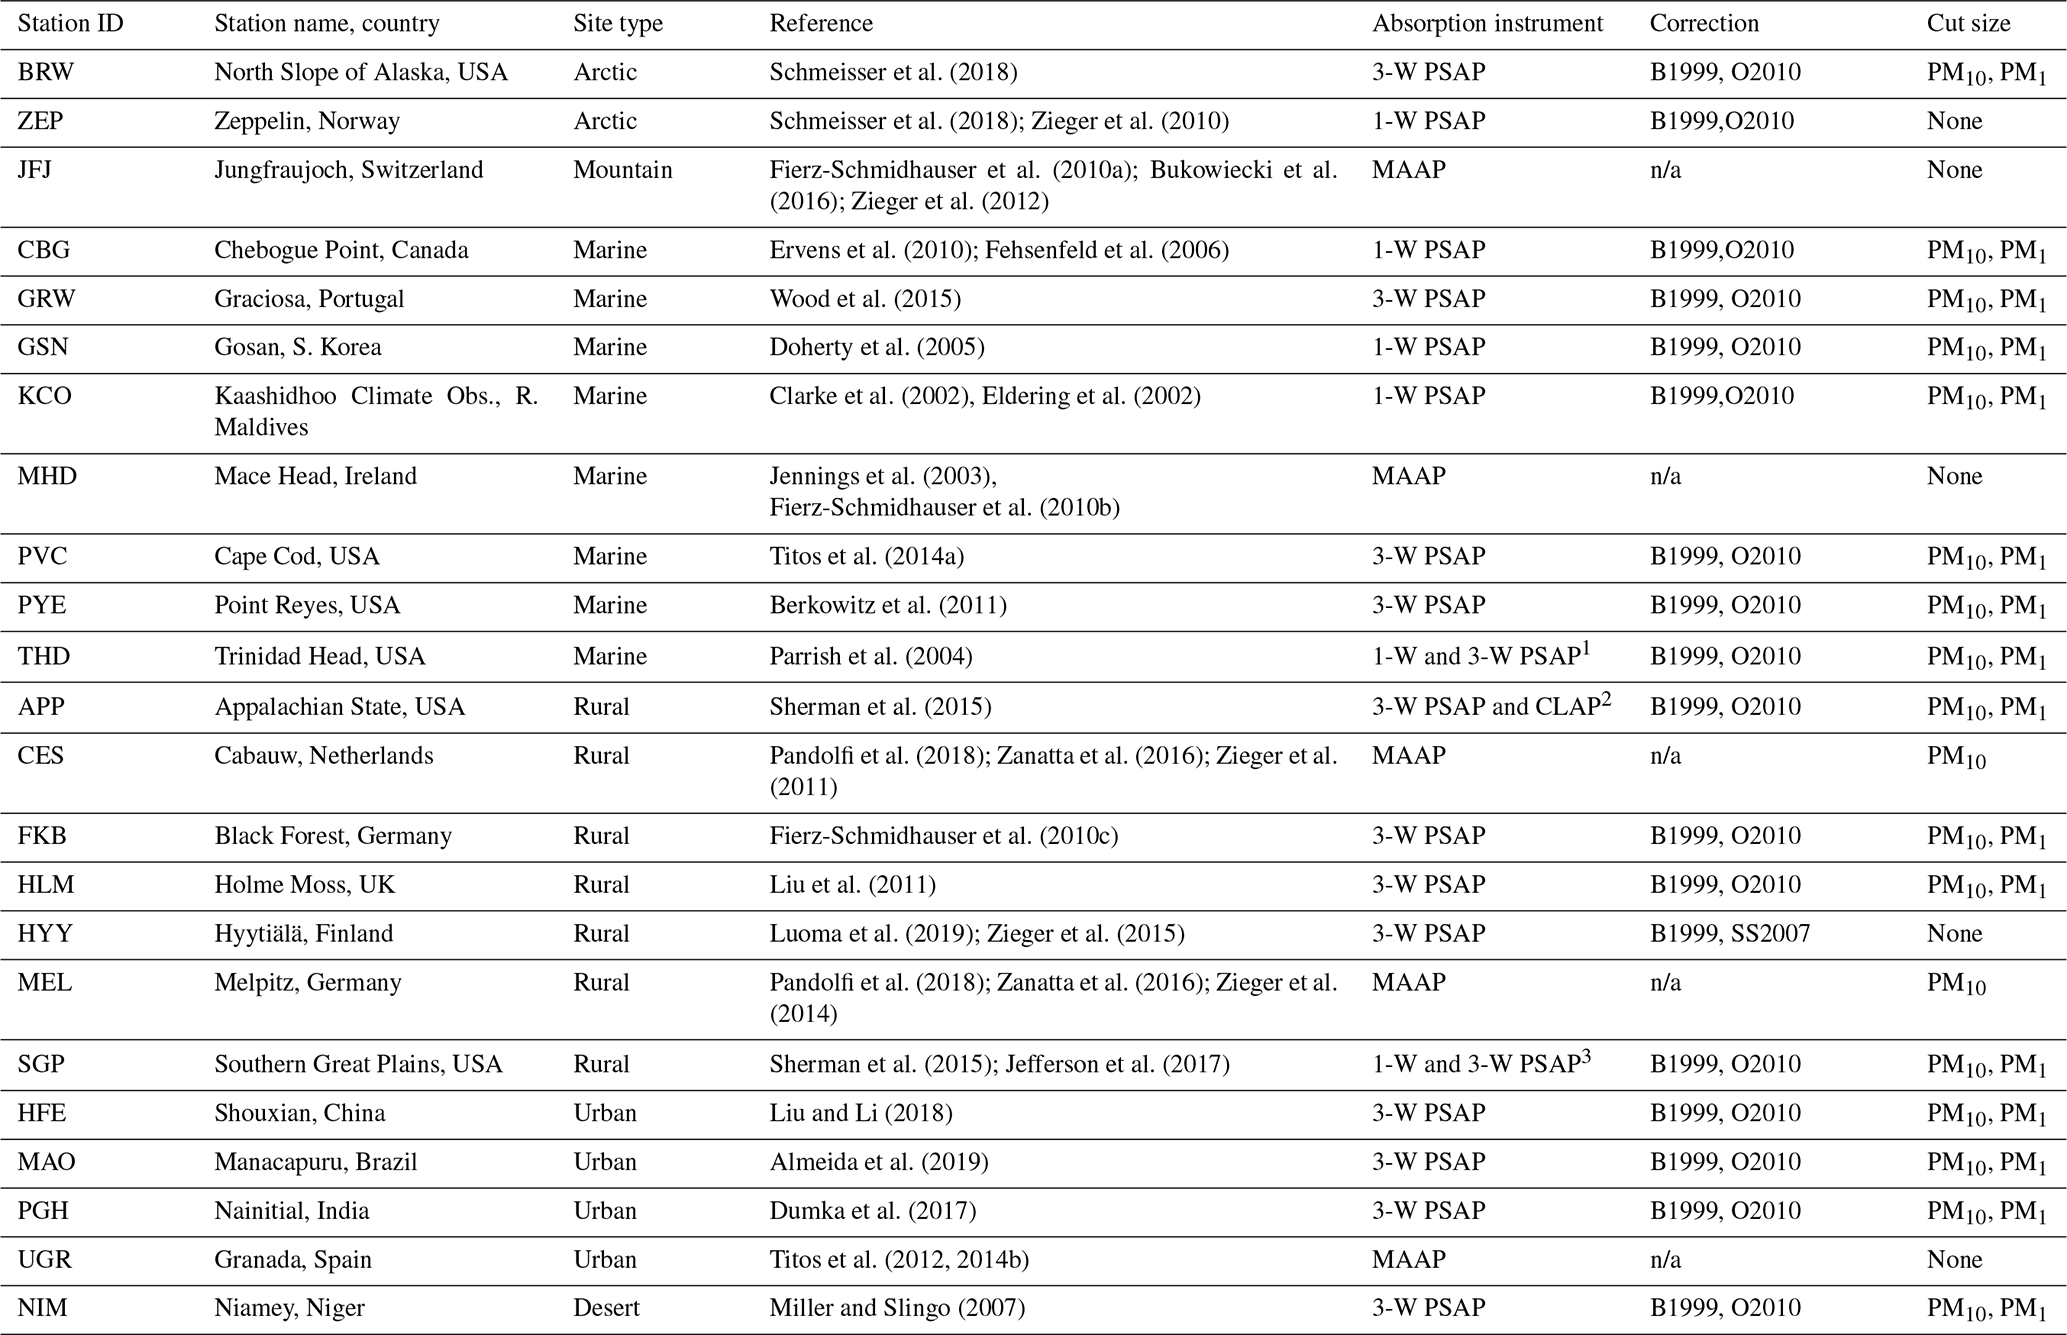
PSAP: particle soot absorption photometer (1-W and 3-W refer to single- and three-wavelength versions of the instrument), MAAP: multi-angle absorption photometer. B1999: Bond et al. (1999), O2010: Ogren (2010), SS2007: Springston and Sedlacek (2007). Instruments change date 1 October 2005, 2 March 2016, 3 April 2005.
2.1 Global dataset of hygroscopic scattering enhancement
In Burgos et al. (2019), the harmonization of the hygroscopicity datasets was implemented by starting with raw, high-resolution wet and dry nephelometer data from the data providers. Data providers shared site log information so that invalid data (e.g., due to instrument failure) could be removed from the dataset. The first processing step was to apply all instrument corrections including the truncation and illumination correction (Anderson and Ogren, 1998; Müller et al., 2011), standard temperature and pressure correction, and, where applicable, dilution. Wet and dry scattering measurements at low RH were compared to determine an offset for differences in the wet and dry instrument (e.g., due to differential losses in the humidifier system). The remaining valid data were fit using an exponential equation (Eq. 3) (Kasten, 1969), where a represents the intercept at RH = 0 % and γ the magnitude of the scattering enhancement. Only humidograms complying with strict selection criteria were used for calculating f(RH) at RH = 85 % with Eq. (3) (Burgos et al., 2019). First, the criteria applied in Burgos et al. (2019) to generate the f(RH = 85 %) data used in this study consist of only humidograms spanning an RH range larger than 30 % in the humidified nephelometer; second, a goodness-of-fit criterion was applied such that humidogram fits with an R-squared value less than 0.5 were also flagged as invalid. A stricter goodness-of fit-requirement was used for Hyytiälä and Jungfraujoch (the R-squared value threshold was set to 0.7 and 0.8, respectively) where higher variability was observed in the RH scans. The same procedure was applied to obtain the fb(RH) at RH = 85 %. The dataset includes scattering and backscattering enhancement factors at three wavelengths (see Burgos et al., 2019, for further details).
The Burgos et al. (2019) dataset includes two f(RH = 85 %) and fb(RH = 85 %) values: one is referred to a reference RH value of 40 %, while the other is referred to RH in the range 0 %–40 % (as measured in the reference nephelometer). The difference between the two calculations is small for most of the sites (see Fig. S11 in Burgos et al., 2020). In this study, we have used the f(RH = 85 %) and fb(RH = 85 %) referenced to RH 0 %–40 % because of higher data availability and consistency with previous f(RH) comparison studies (Titos et al., 2016; Zieger et al., 2013). Finally, Level 2 data as described in Burgos et al. (2019) have been used. Briefly, Level 2 means the data have undergone review, have all corrections applied and are averaged over an appropriate time period for each site (e.g., 1 h averages for sites with high aerosol loading, 6 h averages for very clean sites). In Burgos et al. (2019), the range in uncertainty (calculated as error propagation) was found to depend on aerosol loading, RH and particle composition being in the range 25 %–30 % and 25 %–75 % for f(RH = 85 %) and fb(RH = 85 %), respectively, for moderately hygroscopic aerosol (γ=0.6). The data availability (measurement period and number of valid data points) for each site can be found in Burgos et al. (2019) (their Fig. 1 and Tables 5 and 6). Table S1 of the Supplement includes the number of available f(RH = 85 %) and fb(RH = 85 %) values.
2.2 Dry aerosol optical property dataset
The sites where the f(RH) measurements were performed also typically included measurements of additional aerosol properties, including dry aerosol scattering and absorption coefficients (σsp and σap, respectively). Dry scattering coefficients were needed for the f(RH) calculation and were acquired from the data providers as raw data, which then underwent the data processing explained in Burgos et al. (2019). Quality-controlled and hourly-averaged absorption data (Level 2) for these sites have been obtained from the EBAS database (http://ebas.nilu.no, last access: 1 March 2019) or, in the case of the US Department of Energy mobile facility sites (GRW, PVC, PYE, FKB, HLM, HFE, MAO, PGH and NIM), from http://www.arm.gov/data (last access: 1 December 2018) (AIPAVG1OGREN.c1 data streams).
For scattering, all dry nephelometer measurements (except for HYY) were made using TSI integrating nephelometers. The TSI instruments measure total scattering and hemispheric backscattering at three wavelengths (450, 550 and 700 nm). At HYY, an Ecotech Aurora 3000 nephelometer (wavelengths: 450, 525, and 635 nm) was used to obtain dry total scattering. As noted above, the nephelometer data are corrected to account for angular truncation errors and instrument non-idealities using the method proposed by Anderson and Ogren (1998) (for the TSI nephelometers) or by Müller et al. (2011) (for the Ecotech nephelometer). Table 1 lists the absorption instruments used in this analysis and describes corrections applied in each case. The absorption data corrections are necessary to account for scattering artifacts and other instrument limitations (Bond et al., 1999). For this analysis, both the scattering and absorption data are adjusted to standard temperature and pressure.
From these dry aerosol optical properties, several parameters can be derived which provide qualitative information about inherent characteristics (size and composition) of the aerosol particles: scattering Ångström exponent, backscatter fraction and single-scattering albedo. The equations and a short description of each property are provided below. Sherman et al. (2015) present information on calculating uncertainties for these properties.
The scattering Ångström exponent parameterizes the spectral dependence of light scattering.
This parameter for atmospheric aerosol particles typically ranges between −1 and 3 and is sensitive to the size distribution of the aerosol. Values of αsp near 2 or greater indicate the aerosol is dominated by submicrometer particles, while αsp values less than 1 indicate a significant contribution of coarse-mode aerosol to the observed scattering. The scattering Ångström exponent has often been used to differentiate between natural aerosol such as dust and sea salt, which tend to dominate the coarse mode, and anthropogenic aerosol, which consists of smaller (primarily submicrometer) aerosol (e.g., Carrico et al., 2003; Anderson and Ogren, 1998). The αsp used here was calculated from the 700 and 450 nm wavelength pair, except for HYY where it was calculated from the 635–450 nm wavelength pair.
The hemispheric backscattering fraction characterizes the amount of light scattered back to the light source:
where σbsp(λ) is the hemispheric backscattering coefficient and σsp(λ) is the total scattering coefficient at a certain wavelength. The hemispheric backscattered fraction is sensitive to the accumulation-mode size distribution, especially particles in the 0.1–0.4 µm size range (Collaud Coen et al., 2007). In this study, b has been calculated for the 550 nm wavelength. Typical values of b for the atmospheric aerosol at this wavelength range from approximately 0.05 to 0.20, with lower values of b indicative of larger accumulation-mode particles (i.e., primarily forward scattering) and higher values indicative of smaller accumulation-mode particles which backscatter light more efficiently. The hemispheric backscattering coefficient is often used to parameterize the angular distribution of scattered light and has been used to estimate the asymmetry parameter (Andrews et al., 2006).
The single-scattering albedo is the ratio of the scattering to extinction coefficient (extinction is the sum of scattering and absorption):
where σap(λ) is the absorption coefficient at wavelength λ. For atmospheric aerosols, ω0 typically varies between 0.5 and 1.0 (e.g., Laj et al., 2020). Sites dominated by primarily scattering aerosols (e.g., clean maritime sites) exhibit ω0 values close to 1, with ω0=1 implying all of the extinction is due to scattering. In contrast, sites impacted by combustion sources have lower ω0 values. Bond and Bergstrom (2006) suggest that the ω0 at 550 nm for fresh atmospheric combustion aerosol is in the range of 0.2–0.3. In this study, ω0 was calculated for the 550 nm wavelength. The absorption coefficient was interpolated to this wavelength using the calculated absorption Ångström exponent, αap. For sites performing absorption coefficient measurements at a single wavelength, an αap of 1 was assumed. This is a reasonable assumption for anthropogenically influenced sites where black carbon is the main light absorber, but it can differ for sites influenced by dust or biomass burning, which show higher spectral dependence (Kirchstetter et al., 2004).
2.3 Calculation of RFE RH dependence
In this study, the radiative forcing efficiency, RFE, is calculated following Haywood and Shine (1995):
where the parameters fractional daylight, D, solar flux, S0, atmospheric transmission, Tatm, fractional cloud amount, AC, and surface reflectance, RS, are independent of the RH. The RH-dependent variables are the aerosol optical depth, δ, up-scatter fraction, β, and single-scattering albedo, ω0.
β is calculated from the measured b using the following formula (Sheridan and Ogren, 1999):
The radiative forcing efficiency at a certain RH relative to dry conditions (RH < 40 %) depends on RS, f(RH), ω0(RH) and b(RH) in the following way (Sheridan and Ogren, 1999; Fierz-Schmidhauser et al., 2010a):
RFE does not take into account the fact that the properties and concentration of aerosol particles vary vertically in the atmospheric column. Fierz-Schmidhauser et al. (2010a) and Luoma et al. (2019) have shown the importance of using the appropriate RS values at each site. In this study, we have used the average annual value as a function of site type (for rural, urban and mountain sites Rs=0.25, for marine sites Rs=0.10, and for Arctic sites Rs=0.65; based on Hummel and Reck, 1979). These values are just rough estimates and will, of course, vary with the specifics of ground cover at each site, as well as season and factors related to site latitude and altitude.
3.1 Overview of f(RH) and fb(RH) observations
Figure 1 shows the dry total scattering (top plot) and f(RH = 85 %) statistics (bottom plot) for individual sites obtained over the entire measurement period at each site. Some sites have multiple years of f(RH) data, while others performed f(RH) measurements just for a few months, so the f(RH) values shown are not necessarily representative of the annual climatological value at each location. The f(RH = 85 %) values shown are for measurements made for total or PM10 aerosol. The sites in Fig. 1 are grouped by their assumed dominant aerosol type (e.g., marine, rural, urban). Since previous research has shown systematic variability between loading and proxies for aerosol size and composition at individual sites (e.g., Delene and Ogren, 2002, their Figs. 8 and 9), within the groupings, the f(RH = 85 %) values are ordered by the aerosol loading (using the dry aerosol scattering coefficient as a proxy for aerosol amount).

Figure 1Box plot of dry scattering coefficient (a) and f(RH = 85 %) (b) at λ=550 nm (λ=525 nm at HYY) . The black stars in the lower panel indicate the median backscattering enhancement factor fb(RH = 85 %). Sites are sorted by site type and scattering coefficient (from low to high). For each box, the central mark is the median, the box extends vertically between the 25th and 75th percentiles, and the whiskers extend to the most extreme data that are not considered outliers.
As we can see in Fig. 1, f(RH = 85 %) values both within and outside the different site type groupings do not follow a consistent trend, with σsp suggesting that aerosol loading does not control the magnitude of f(RH = 85 %). Further, while there are general differences in f(RH = 85 %) as a function of aerosol type, there is also substantial overlap in the f(RH = 85 %) statistics, meaning there is no clear separation in f(RH = 85 %) values amongst most site types. The lack of dependence of f(RH) on aerosol loading amongst site types is likely due to sites experiencing different aerosol sources and/or types throughout the measurement period, which cannot be disentangled when looking at the overall statistics of f(RH) and loading. This is looked at in more detail in Sect. 3.4. Overall, urban sites and a dust-dominated site tend to show the lowest hygroscopicity based on f(RH = 85 %) values, while the two Arctic sites (ZEP and BRW) show high f(RH = 85 %) values. Most clean marine sites (THD, GRW, PYE and MHD) are characterized by higher f(RH = 85 %) than polluted marine sites (KCO and GSN).
Figure 1 is consistent with the general pattern summarized in the Titos et al. (2016) f(RH) review paper in that marine sites tend to exhibit higher f(RH) than rural sites, which exhibit higher f(RH) than sites dominated by dust-laden air masses. The consistent processing by Burgos et al. (2019) enables presentation of more detailed f(RH = 85 %) statistics than was possible with literature-reported values provided in the Titos et al. (2016) overview study. However, there is still no clear distinction of f(RH) values as a function of general site type. This is due, at least in part, to variability in aerosol type impacting each location, creating a wide range in observed f(RH) at individual sites, as discussed below.
The f(RH = 85 %) values presented in Fig. 1 represent all tandem nephelometer measurements at each site – they have not been filtered for different aerosol types. This is likely one reason why some relatively clean (based on loading) marine sites (PVC and CBG) have f(RH = 85 %) values more similar to the polluted marine sites. PVC and CBG are situated relatively close to each other on the NE coast of North America (Cape Cod and Nova Scotia, respectively). Titos et al. (2014a) show that when PVC was impacted by anthropogenic emissions from the region, the f(RH) values were lower than when the site was affected by clean marine air. The aerosol at CBG will also vary between clean marine and anthropogenically influenced aerosol as well as being impacted by biogenic aerosol from forests (Fehsenfeld et al., 2006). While “clean” vs. “polluted” is a simple binary way to differentiate air mass types, sites can be impacted by multiple different types of air masses (urban, regional background, dust, etc.). For example, Zieger et al. (2013) present a table for five European sites detailing f(RH) values based on all measurements at each site and then segregated by the different air mass types identified at each site. Another possible explanation for the observed variability among sites is that measurements at each site covered different seasons (while some sites have measurements just for a few months covering one or more seasons, other sites cover more than a year). This is likely the case at MEL, which shows higher f(RH = 85 %) values compared to the other rural sites. The MEL f(RH = 85 %) values are similar to Arctic (BRW and ZEP) and clean marine sites (e.g., PYE), perhaps because they correspond to winter when the aerosol is dominated by inorganic compounds (Zieger et al., 2014). Detailed information about the aerosol size distribution and chemical composition would be needed to better understand the observed differences amongst sites. Section 3.4 further explores this variability using αsp and ω0 as qualitative indicators of predominant aerosol size and composition due to the lack of concurrent size distribution and chemical composition measurements at most sites.
Also included in Fig. 1 is the median value of the backscattering enhancement factor, fb(RH = 85 %), indicated by the star overlaid on the f(RH = 85 %) plots. Box–whisker plots of fb(RH) are available in the Supplement (Fig. S1). The backscattering enhancement factor is useful as it indicates how the angular distribution of aerosol light scattering changes with RH and is thus a key factor in aerosol forcing calculations for ambient atmospheric conditions. In general, the fb(RH = 85 %) values track the f(RH = 85 %) variations at each site, with the median fb(RH = 85 %) always being lower than the median f(RH = 85 %). It should be noted that the f(RH = 85 %) and fb(RH = 85 %) information in Fig. 1 refers to all available f(RH = 85 %) and all fb(RH = 85 %) values at each site, and the two parameters do not necessarily have the same temporal coverage – there were fewer successful fits of fb(RH = 85 %) than there were of f(RH = 85 %) (Burgos et al., 2019). The number of available f(RH = 85 %) and fb(RH = 85 %) values is included in Table S1 and in Tables 5 and 6 of Burgos et al. (2019). The percentage of fb(RH = 85 %) coinciding with f(RH = 85 %) ranges from <10 % at JFJ and ZEP to >75 % at CES and MEL. The fb(RH = 85 %) measurements at HYY and MAO were not included due to instrument issues.
The relationship between f(RH = 85 %) and fb(RH = 85 %) is further explored in Fig. 2. This figure shows that there is a linear trend between f(RH = 85 %) and fb(RH = 85 %) with a slope of 0.58 ± 0.12, intercept of 0.31 ± 0.23 and strong correlation (R2=0.81). These parameters have been retrieved from a weighted bivariate fit according to York et al. (2004), taking the standard deviation of the average values as an input for the uncertainty calculation. Note that for this analysis, only data with coincident f(RH = 85 %) and fb(RH = 85 %) measurements are included. The relationship between f(RH = 85 %) and fb(RH = 85 %) is supported by observations from other sites reported in the literature, and these have been added to Fig. 2 (gray dots). Similar relationships between fb(RH = 85 %) and f(RH = 85 %) are also observed for the temporally matched data points for the individual sites (Fig. S2 of the Supplement shows some examples). Hegg et al. (1996) suggest that Mie theory predicts a reduction of approximately 25 % in fb(RH) relative to f(RH) for typical atmospheric aerosols, but they did not have access to a database of aerosol water uptake impact on aerosol optical properties such as Burgos et al. (2019) to demonstrate the relationship.
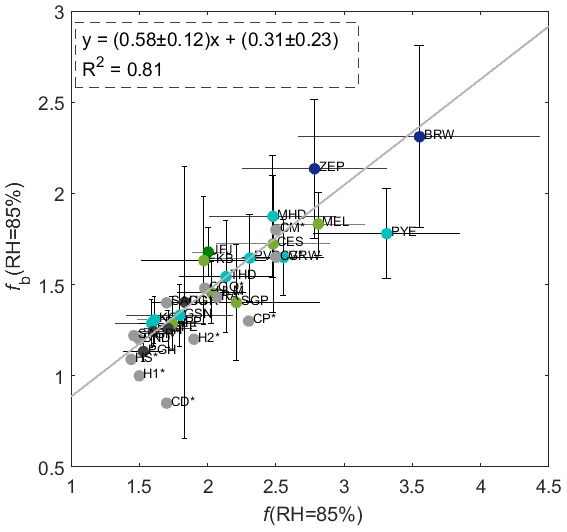
Figure 2Scatterplot of fb(RH = 85 %) versus f(RH = 85 %) at λ=550 nm. Dots represent the mean value and error bars 1 standard deviation. The figure includes the results of a weighted bivariate fit according to York et al. (2004). The colors indicate the site type (dark green for mountain site, light green for rural, cyan for marine, dark blue for Arctic and black for urban sites); other studies are plotted in gray. Those studies are as follows. SAG refers to Sagres (Portugal), with SAGP and SAGC referring to polluted and clean conditions, respectively (Carrico et al., 2000); CGO refers to Cape Grim (Australia) (Carrico et al., 1998); BND refers to Bondville (Illinois, USA) (Koloutsou-Vakakis et al., 2001); H1 and H2 are average values from two flights made off the west coast of the US (Hegg et al., 1996); CM, CP, CV and CD refer to marine, polluted, volcanic and dust-dominated conditions during the ACE-Asia campaign in the North Pacific Ocean (Carrico et al., 2003); and RA and HS refer to regional southern African air and heavy smoke, respectively (Magi and Hobbs, 2003).
Figure 2 exhibits a general pattern relating f(RH) and fb(RH), which might be useful due to the scarcity of fb(RH) measurements. Hegg et al. (1996) noted that enhanced reductions in fb(RH) could confound the attribution of aerosol water content in aerosol optical depth (AOD) retrievals from backscattered radiation if water uptake assumptions were based on f(RH) rather than fb(RH). At that time, Hegg et al. (1996) also noted that many models implicitly assumed that the humidity dependence of backscattering was identical to total scattering. Later, Wang and Martin (2007) suggested that satellite retrievals make assumptions about RH when they use algorithms to retrieve aerosol information from measured reflectances. Therefore, if the aerosol is at a different RH than the RH assumed by the satellite algorithms for the aerosol properties (like backscattering) it could lead to incorrect retrievals. Wang and Martin (2007) noted that in satellite retrieval algorithms for AOD that employ angular-dependent radiance observations, the aerosol hygroscopicity must be explicitly considered.
3.2 Impact of size cut and wavelength on f(RH)
The f(RH) is controlled by both the size and composition of the aerosol particles, although size and composition are not completely independent variables. Further, Mie theory dictates that, for a given composition and concentration, aerosol scattering will depend on both the size of the particle and the wavelength of the incident light. Thus, there may be some information about the character of the underlying aerosol gained by studying differences in f(RH) as a function of measurement size cut and spectral dependence.
The size split between PM1 and PM10 is roughly a size split between anthropogenic and natural aerosol (e.g., Carrico et al., 2003; Anderson and Ogren, 1998), although at clean marine sites this is less true (due to secondary particle formation from natural emissions and submicron sea salt). Thus, understanding the difference in hygroscopicity between these two size cuts may provide information about the different behaviors of man-made and natural particles in a humid atmosphere. Figure 3 shows the difference between f(RH = 85 %) and f(RH = 85 %) at 550 nm as a function of dry αsp binned in 0.2 αsp increments. As in Andrews et al. (2011), only bins that have a standard error less than a certain threshold (3 % in this case) of the typical value of that variable were included (standard error is the standard deviation of the sample divided by the square root of the number of points in the sample). For simplicity, a typical value of αsp was assumed to be 2.0, meaning that 3 % of the typical value is 0.06. Bins with a larger standard error were omitted, since they may not be representative of actual systematic aerosol variability at the site.
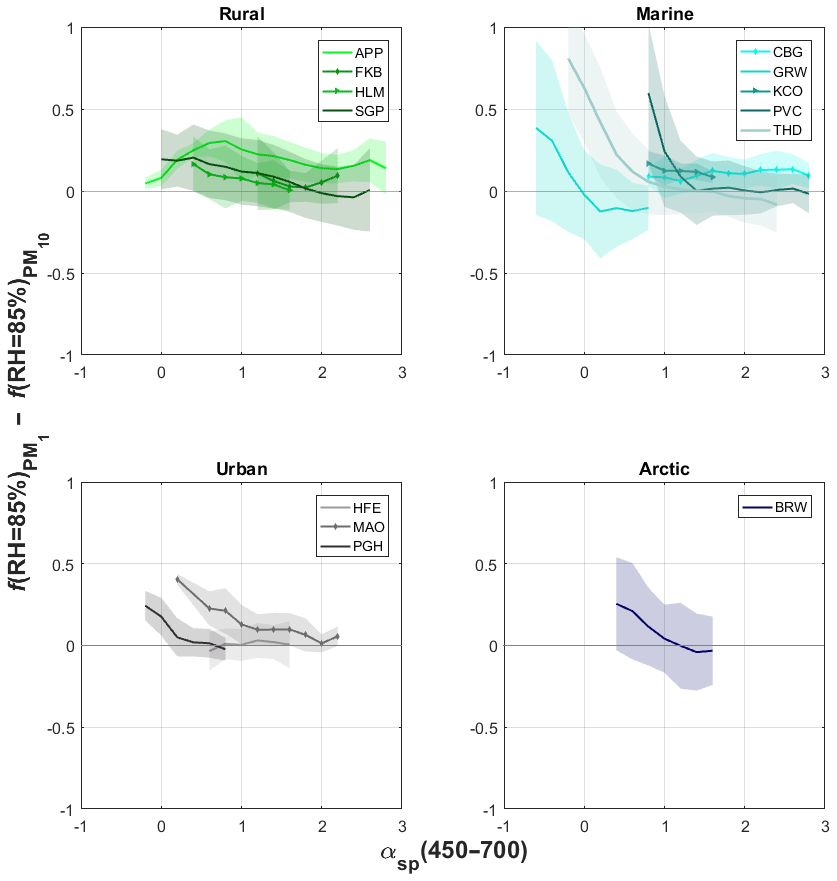
Figure 3Difference in the f(RH = 85 %) in PM1 and PM10 size fractions at 550 nm as a function of the dry scattering Ångström exponent, αsp, calculated between 700 and 450 nm. The solid line represents the mean value, and the shaded region represents ±1 standard deviation. The points are binned in increments of 0.2 αsp. Only bins with standard error below 0.03 are considered.
Across all sites the difference in f(RH = 85 %) between PM1 and PM10 tends to be positive, indicating that PM1 particles exhibit relatively more scattering enhancement than their PM10 counterparts. This is consistent with previous f(RH) values reported in the literature when both PM1 and PM10 f(RH) were measured (Carrico et al., 2000; Koloutsou-Vakakis et al., 2001; Carrico et al., 2003; Titos et al., 2014a; Jefferson et al., 2017) and is consistent with Mie modeling of f(RH) (Zieger et al., 2010, 2013). This may seem counterintuitive (for example, at marine sites where PM10 aerosol is dominated by very hygroscopic coarse-mode sea salt). However, it is consistent with Mie theory, whereby a stronger increase in the scattering efficiency in the accumulation-mode size range would be expected, while the scattering efficiency for super-micrometer aerosol at visible wavelengths is relatively constant. This may result in smaller particles having less diameter change due to water uptake (lower hygroscopicity) but more scattering enhancement due to a larger relative increase in the scattering efficiency; this is in contrast to larger particles, which may have more diameter growth (higher hygrosocopicity) but exhibit only a little relative change in the scattering efficiency. Zieger et al. (2013) show this effect by plotting f(RH) as a function of particle size for some common atmospheric constituents (their Fig. 2 and Table 3). The compensating effects of size and hygroscopicity have been observed and explained for Arctic aerosol (Zieger et al., 2010), with smaller but less hygroscopic particles exhibiting a similar f(RH) as larger, more hygroscopic particles.
Figure 3 also shows that, at marine and Arctic sites, the separation between PM1 and PM10 f(RH = 85 %) is more variable and exhibits a dependence on αsp. The f(RH = 85 %)(RH = 85 %) separation increases as αsp decreases, which likely suggests that the marine sea salt aerosol is not confined to the coarse mode or there are other hygroscopic components in the fine marine aerosol. The behavior observed is also consistent with Carrico et al. (2000, 2003) and Titos et al. (2014a), reporting larger differences between PM1 and PM10 f(RH) for clean marine air (lower αsp) than for polluted marine air (higher αsp). Quinn et al. (2002) showed that at BRW, at some times of the year, sea salt contributes as much to the PM1 aerosol as it does to the super-micrometer aerosol.
A similar, but less marked, dependence of the f(RH = 85 %)(RH = 85 %) separation with αsp is observed at two of the three urban sites investigated here. The anthropogenic urban emissions are likely to be different across these three sites, especially concerning the types of fuel burned and burning conditions. At PGH, Dumka et al. (2017) observed higher f(RH) values for lower αsp, and this was associated with biomass burning events. According to Dumka et al. (2017), coarse carbonaceous aerosols predominated during winter, leading to lower f(RH). It is important to note that at PGH αsp values were always <1 (see Fig. 3), indicating a predominance of coarse particles, so the distinction between coarse and fine particle predominance cannot be well addressed at this site with the αsp parameter. At MAO, Almeida et al. (2019) reported that when fine particles predominate the aerosol tends to be less soluble, which could lead to lower f(RH). The study of Almeida et al. (2019) is not directly comparable with ours, since these authors focused on the fine-mode fraction. Therefore, more study is needed with additional information from the individual sites about composition, size and sources to explain the observed behavior at urban sites.
Differences in f(RH = 85 %) for the two size cuts as a function of αsp are not observed for rural sites (Fig. 3). The likely explanation for this is twofold. First, the f(RH = 85 %) at these sites is probably dominated by organic aerosols, which are typically less hygroscopic than soluble components such as sulfate (Zieger et al., 2013). Second, when significant coarse aerosol is present at these sites, it most likely is dominated by dust, which is also less hygroscopic (Titos et al., 2014b; Fierz-Schmidhauser et al., 2010a). Both these factors would result in little observed difference between PM1 and PM10 hygroscopicity at sites with these characteristics. This is consistent with Koloutsou-Vakakis et al. (2001), finding a minimal difference between PM1 and PM10 f(RH) at a rural site in central Illinois (USA).
Understanding spectral changes in f(RH) is also important since surface solar irradiance and, hence, radiative forcing are a function of wavelength (e.g., Kiehl and Briegleb, 1993; Kotchenruther and Hobbs, 1998). Some previous reports on the spectral dependence of f(RH) describe diversity in spectral dependence for different air mass types (e.g., Carrico et al., 2003, 2000; Fierz-Schmidhauser et al., 2010a; Magi and Hobbs, 2003), but generally, most studies do not discuss their spectral findings in detail or put them in a wider context. Our review of the literature indicates that in the majority of cases in which spectral values of f(RH) are presented, f(RH) increases for increasing wavelength (Carrico et al., 1998, 2000; Kotchenruther et al., 1999; Koloutsou-Vakakis et al., 2001; Zieger et al., 2014, 2015; Magi and Hobbs, 2003). There are a few cases in the literature in which the spectral dependence of f(RH) is found to be negligible: polluted marine (Carrico et al., 2003), smoke (Kotchenruther and Hobbs, 1998) and clean Arctic (Zieger et al., 2010). There are even fewer cases in which the spectral dependence of f(RH) increases with decreasing wavelength: two occurred during dust-impacted f(RH) measurement periods at different sites in Asia (Carrico et al., 2003) and at a high alpine site (JFJ) (Fierz-Schmidhauser et al., 2010a). Fierz-Schmidhauser et al. (2010a) also reported this type of spectral dependence at JFJ for some times that were not impacted by dust; they attributed this to shifts in aerosol size distribution but did not associate it with a specific aerosol type.
Figure 4 provides an overview of spectral dependencies across the range of sites and aerosol types studied here by presenting the frequency of occurrence of the difference in spectral f(RH = 85 %) at 700 nm and (RH = 85 %) at 450 nm. These wavelengths bracket the 550 nm data presented in other plots and represent the extreme of the wavelength dependence available with this dataset. Figure 4 shows that the f(RH = 85 %) at 700 nm is typically larger than the f(RH = 85 %) at 450 nm for most sites. Similar behavior is observed for fb(RH = 85 %) (not shown here). For the marine sites, Fig. 4 suggests that the wavelength difference of f(RH = 85 %) is always positive except for GSN – a site which was likely impacted by dust during the measurements (e.g., Doherty et al., 2005). This higher scattering enhancement at longer wavelengths was observed by Haarig et al. (2017) for pure marine aerosol. Rural and urban sites show a higher variability in the observed wavelength dependence, with most sites showing data points for which the difference f(RH = 85 %, 700 nm) − f(RH = 85 %, 450 nm) is negative (frequencies of occurrence are shifted towards more negative values relative to what is observed for marine sites, but on average the differences are positive). Sites like UGR (urban) and SGP (rural) show frequency distributions centered around 0. This could be due to the influence of dust particles at these sites (Sheridan et al., 2001; Titos et al., 2014b). For JFJ, we found that, for most of the measurements, the f(RH = 85 %, 700 nm) is larger than f(RH = 85 %, 450 nm), in agreement with Bukowiecki et al. (2016), although measurements showing the opposite behavior also exist. This could be associated with dust-influenced periods as shown by Fierz-Schmidhauser et al. (2010a). It should be noted that the measurement period at JFJ in Fierz-Schmidhauser et al. (2010a) is different from the data time frame used in this study. In general, the wavelength dependence observed for f(RH = 85 %) across sites is constrained within the f(RH = 85 %) range of ±0.5, but the wavelength dependence is smaller for most sites that show narrower frequency distributions (exceptions are GSN, UGR and SGP).
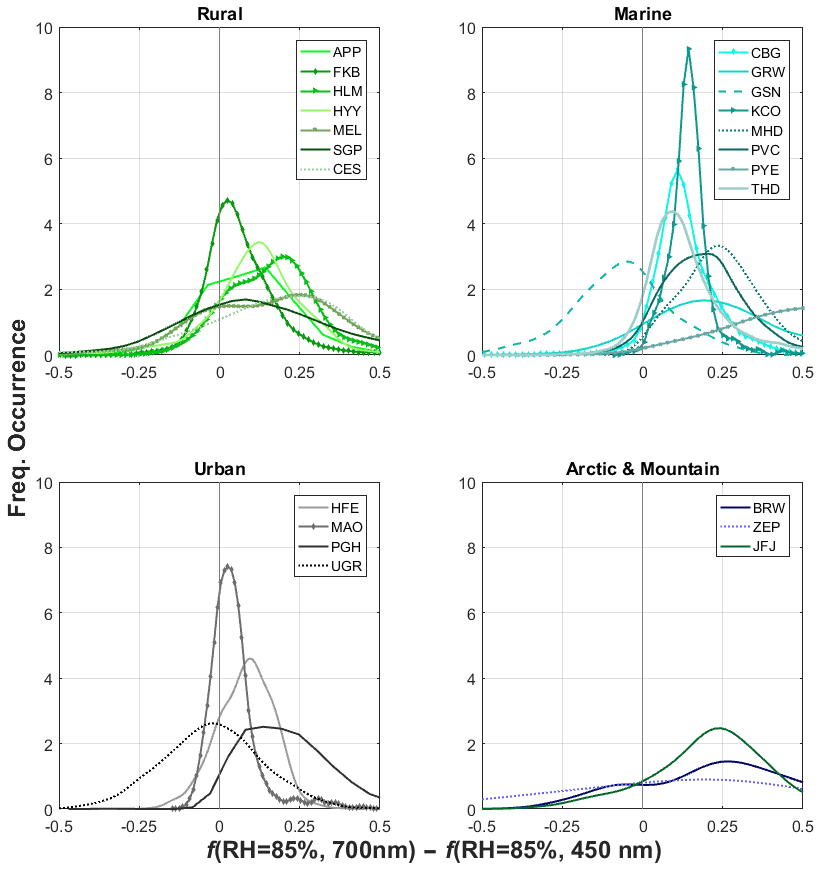
Figure 4Frequency of occurrence of the difference in the f(RH = 85 %) at 700 and 450 nm segregated by site type.
3.3 Changes in RFE-relevant properties as a function of RH
Figure 5 shows the RH dependence of the single-scattering albedo, backscatter fraction and the ratio of the radiative forcing efficiency at a certain RH to dry conditions (RH < 40 %) for different site types. Absorption is assumed to be independent of RH, and the potential absorption enhancement due to a water coating is neglected. This is a simplified assumption since the absorption enhancement due to coating and water uptake can be a very complex process and it strongly depends on the coating material and the RH history to which the absorbing particle has been exposed (Yuan et al., 2020). Nevertheless, several authors (e.g., Nessler et al., 2005b; Yuan et al., 2020) reported that the absorption enhancement is minimal compared to the scattering enhancement, and calculations of RFE usually assume that the RH absorption enhancement can be neglected (e.g., Fierz-Schmidhauser et al., 2010a; Luoma et al., 2019). Yuan et al. (2020) reported that the RH scattering enhancement of black carbon coated with ammonium nitrate was 5 times the enhancement observed in the absorption coefficient. Since measurements of absorption RH enhancement are not available for this study, we assumed that the absorption was not dependent on RH as done in previous studies, and the results are consequently discussed in light of this simplification.
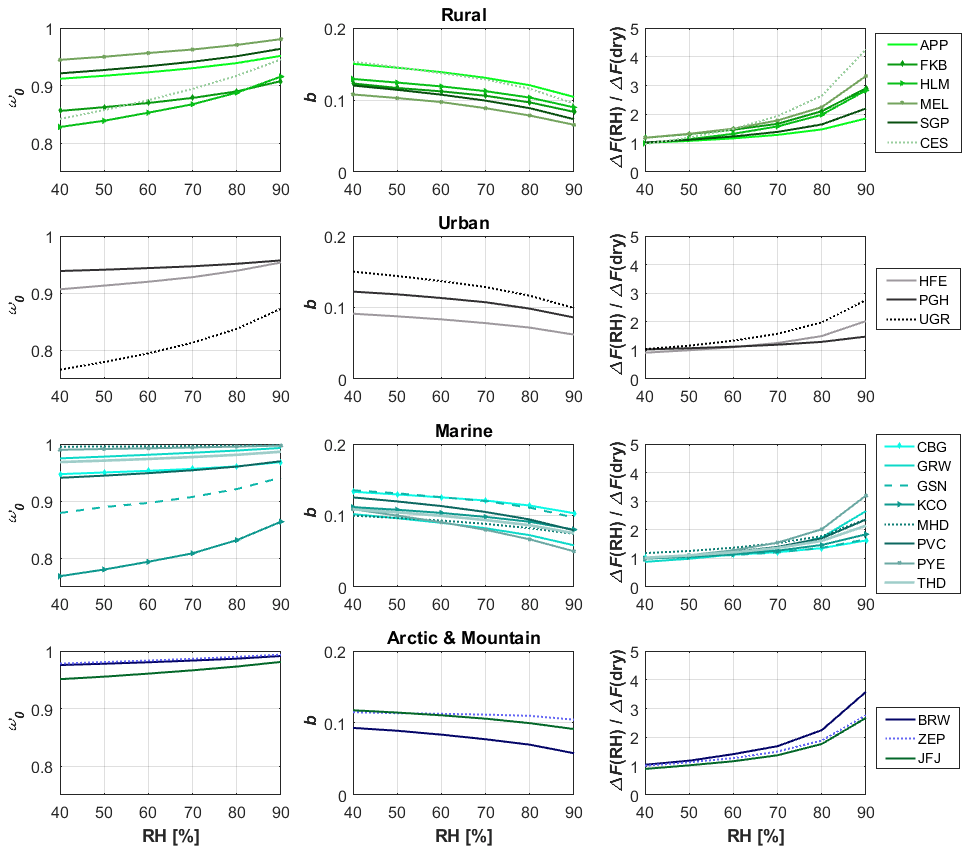
Figure 5Median values of single-scattering albedo, backscatter fraction and ratio of the radiative forcing at certain RH to the radiative forcing at dry conditions (RH < 40 %). All variables refer to the 550 nm wavelength.
Overall, as shown in Fig. 5, ω0 increases with RH for all site types, with a larger slope for some marine (KCO and GSN), urban (UGR) and rural sites (CES, HLM). The increase is, of course, because of the enhanced scattering due to water uptake simultaneous with the assumed lack of change in aerosol absorption. Any enhancement in the absorption coefficient due to water uptake will result in a lower ω0 enhancement with RH than observed in Fig. 5. In contrast, b shows opposite behavior to ω0 (i.e., b decreases with increasing RH) because as particles grow the amount of light scattered in the backward direction is reduced. A similar RH dependence of ω0 and b has been shown in previous studies at individual sites (e.g., Carrico et al., 2003; Fierz-Schmidhauser et al., 2010b, a). As shown in Fig. 5, some sites show less dependence of b on RH than others, but there is no consistent pattern with site type, suggesting a complex interplay of aerosol composition and size distribution.
All sites show an increase in the forcing efficiency at elevated RH, indicating the importance of considering the RH effect in the aerosol optical properties when estimating aerosol forcing. The forcing efficiency is negative for all sites, indicative of a cooling effect which becomes larger (in absolute terms) with the increase in RH. However, there does not appear to be a clear trend related to site type. The range of forcing enhancement among sites varies from almost no enhancement up to a factor of 3–4 at RH = 90 %. The enhancement in forcing efficiency due to RH at each site is modulated by the RH dependence of ω0 and b. As noted by Luoma et al. (2019), the tendencies of ω0 to increase with RH and of b to decrease with RH will have opposite effects on the aerosol radiative forcing efficiency, and thus to some extent the RH dependencies of these two parameters will counterbalance each other. However, as shown in Fig. 5, the differences in the RH dependence of ω0 and b can result in significant changes in the forcing efficiency. For example, CES and APP exhibit very similar trends of b with RH, but CES exhibits a stronger increase in ω0 with RH than is observed at APP. This difference results in a larger increase in the forcing efficiency due to RH at CES, the site which shows the largest enhancement in the forcing efficiency at high RH (4-fold) relative to dry conditions. Sites with higher f(RH) values do not necessarily exhibit higher forcing efficiency enhancement at elevated RH. For example, ZEP and JFJ show similar forcing efficiency enhancement, but the f(RH) values at ZEP are much higher than those at JFJ (see Fig. 1). Figure S3 of the Supplement shows the forcing efficiency enhancement as a function of f(RH). This figure demonstrates that the forcing efficiency dependence on f(RH) is different from site to site. Rural and urban sites show a higher rate of increase in the forcing enhancement as a function of f(RH) (curves above the 1:1 line), while for marine and Arctic sites most of the curves lie below the 1:1 line (exceptions are BRW and PVC). In other words, for the same f(RH) value the impact on the radiative forcing would be higher at rural and urban sites than at marine and Arctic sites. This is likely due to the lower ω0 at rural and urban sites that show a significant increase with RH, while marine and Arctic sites are characterized by ω0 values already close to 1, so the effect of RH is lower. Luoma et al. (2019) show that at HYY the seasonal variability of parameters impacting RFE (aerosol- and location-specific parameters such as cloud cover and sun angle) can have a profound impact on the resulting radiative forcing. Since we have kept the focus on the effect of RH on the radiative forcing efficiency, assumptions regarding those parameters were not necessary (see Eq. 9). Nevertheless, the simplified assumptions regarding RS values which we know depend on season, surface properties, altitude and latitude, as well as neglecting the potential RH dependence of the absorption coefficient, might have an impact on the results obtained. The latter assumption is expected to have a small effect in the calculated RFE because the scattering is dominant in the calculation of ω0 and it is expected to show higher RH dependence than the absorption coefficient. Concerning the use of a constant RS value for each site type, Fierz-Schmidhauser et al. (2010a) showed that at JFJ, changes in RS between 0.05 and 0.25 lead to changes in the RFE between approximately 2.2 and 2.5. Therefore, the results obtained in this study of the RFE at multiple sites around the world offer a comprehensive picture of the importance of RH for RFE, despite the intrinsic limitations discussed above.
3.4 Relationship between f(RH = 85 %) and dry aerosol optical properties
Predicting aerosol hygroscopicity is critical for understanding aerosol–water interactions which impact climate, visibility and cloud formation. As shown in Burgos et al. (2020), there is a large diversity in f(RH = 85 %) simulated by Earth system models. The diversity among different models is primarily driven by differences in model hygroscopicity parameterizations and model chemistry (Burgos et al., 2020). Aerosol hygroscopicity measurements, such as the Burgos et al. (2019) dataset used here, are not very common, so developing methods to estimate hygroscopicity from other measurements would be helpful in setting constraints for models and explaining physical processes in the atmosphere. Our approach here is to utilize aerosol optical measurements such as ω0 and αsp, which indirectly provide qualitative information about aerosol composition and size. As noted in the Introduction, there has been some success with this approach for individual stations (e.g., Sheridan et al., 2002, 2001; Titos et al., 2014a; Doherty et al., 2005; Nessler et al., 2005b). However, there have also been some efforts when this approach did not work for individual sites (Zieger et al., 2014, 2011; Doherty et al., 2005) or across several sites (Zieger et al., 2013). Here, with a much larger and more diverse group of sites, we further explore relationships between f(RH = 85 %) and several readily available observed aerosol optical properties.
Figure 6 shows f(RH = 85 %) segregated by ω0 (upper panel) and by αsp (lower panel). The segregation has been performed based on the 25th and 75th percentiles of ω0 and αsp, respectively, at each site, ensuring enough data in each category while looking at relatively extreme situations. The values of the 25th and 75th percentiles for each site are noted in Fig. 6. The t test (at the 5 % significance level) has been used here to determine if the segregation of f(RH = 85 %) either by ω0 or αsp is statistically significant (i.e., if the f(RH = 85 %) values for the <25th percentile category and the f(RH = 85 %) values for the >75th percentile category are statistically different from each other). We also tested if the ω0 and αsp values were statistically different. According to the results of the t test, all ω0 and αsp divisions are statistically significant, while f(RH = 85 %) segregation was not statistically different for ZEP and PGH for ω0 segregation and for GSN, MEL, CES, HFE and MAO for αsp segregation. The significance tests failed at NIM because of limited data. The sites showing non-statistically significant differences are represented with thinner lines in Fig. 6.
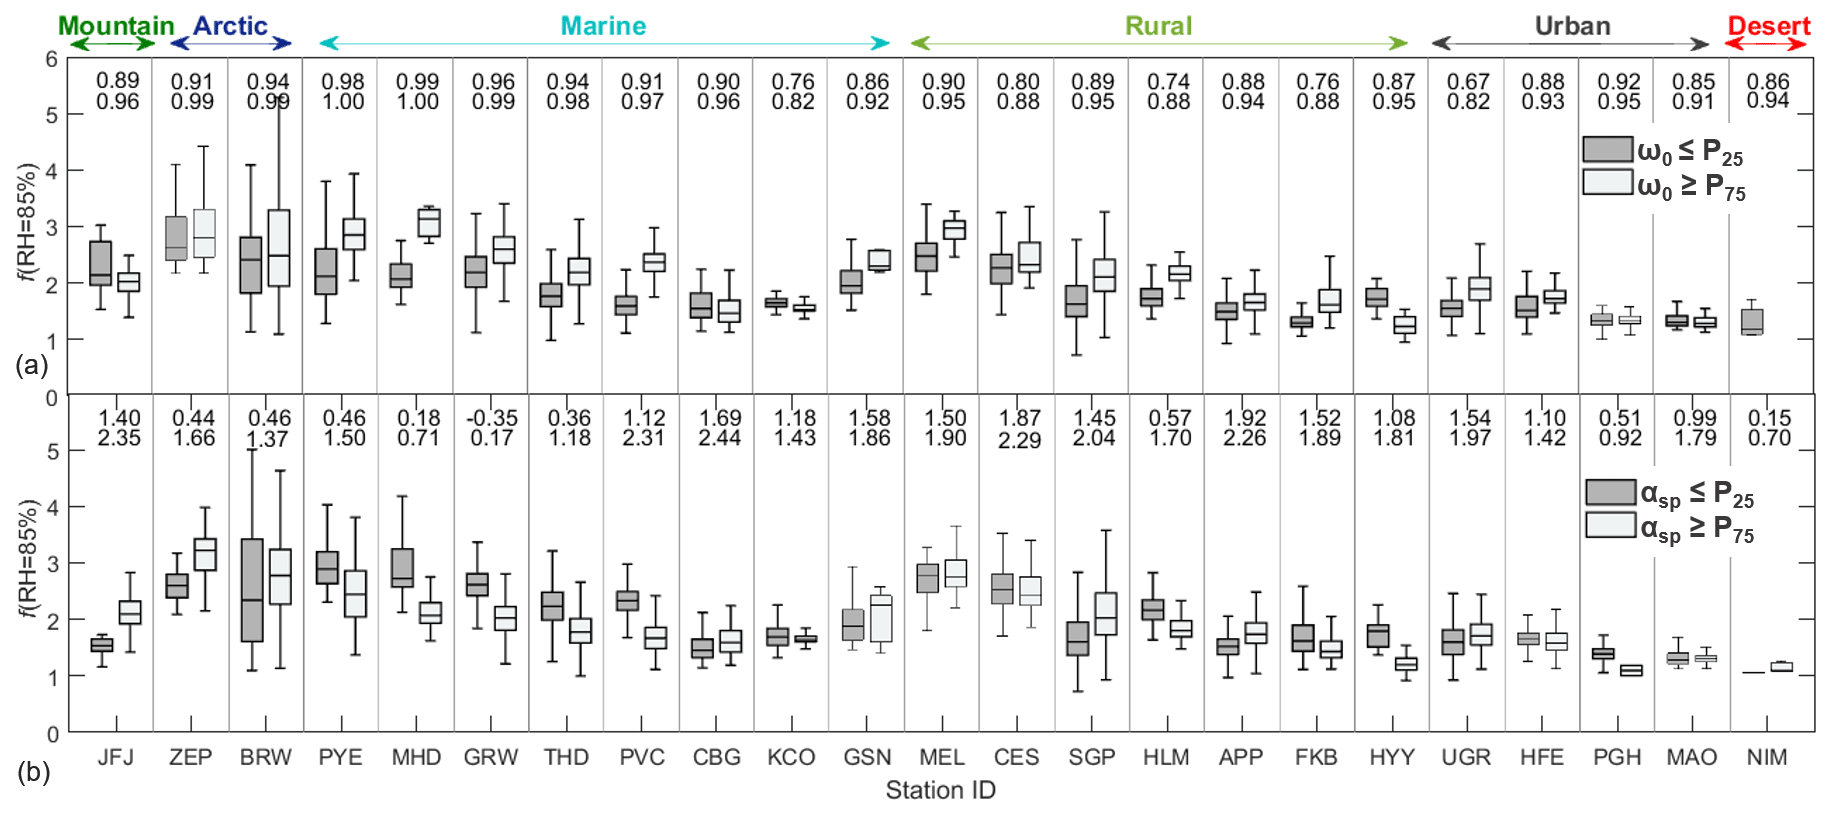
Figure 6Box plot of f(RH = 85 %) at 550 nm (λ=525 nm at HYY) segregated by single-scattering albedo (ω0) values (a) and scattering Ångström exponent (αsp) values (b). Sites are sorted by site type and decreasing f(RH = 85 %). For each box, the central mark is the median, the box extends vertically between the 25th and 75th percentiles, and the whiskers extend to the most extreme data that are not considered outliers. The numbers on top indicate the 25th and 75th percentiles used for segregating each dataset. Categories that are not significantly different are shown with thinner lines in the box plot.
At the majority of sites (75 % of the sites) higher hygroscopicity, based on the median value of f(RH = 85 %), is observed for aerosols with higher values of ω0. This is consistent with the hypothesis that scattering aerosol is often composed of soluble ions (e.g., sea salt and sulfates), which are hygroscopic, while combustion aerosols, which contribute to lower ω0, tend to be less hygroscopic to non-hygroscopic. However, the opposite trend is observed (i.e., higher f(RH = 85 %) for lower ω0 values) at five sites (JFJ, CBG, KCO, MAO and HYY). Although for CBG, KCO and MAO the difference between the f(RH = 85 %) segments is small, it is statistically significant. These five sites are quite different in terms of site type (high altitude, marine, rural), making it difficult to identify an obvious reason for their different behavior with respect to ω0. Additionally, as noted above, general site categories can encompass a variety of air mass types depending on transport and seasonality, so further investigation (e.g., trajectory analysis and aerosol chemistry information similar to Zieger et al., 2013) would be needed. That level of detail is beyond the scope of this work.
Figure 6 also shows f(RH = 85 %) segregated by αsp. In general, Fig. 6 shows that approximately half of the sites exhibit larger f(RH = 85 %) values when the αsp is lower (this is the case for most marine sites). Lower αsp values indicate the presence of coarse aerosol. Depending on the site, coarse aerosol could be associated with sea salt, which is hygroscopic and would lead to higher f(RH). However, lower αsp may also be associated with the presence of dust aerosol, which is often considered to be non-hygroscopic depending on age and atmospheric processing (Fierz-Schmidhauser et al., 2010a; Titos et al., 2014b). The range in hygroscopicity properties for different types of coarse particles explains why αsp is less useful as a constraint of f(RH = 85 %) than ω0 (Zieger et al., 2013, 2014).
Figure 7 shows the scatterplot of the median f(RH = 85 %) versus ω0 color-coded by αsp for the sites considered in this study. The site type is indicated by the different symbols in Fig. 7. At PVC, Titos et al. (2014a) found that aerosol scattering-related hygroscopicity followed an exponential relationship with ω0 and that particles with higher f(RH) and ω0 also tended to have the lowest αsp values (predominance of bigger particles). When taking into account all the median values for all sites of this study using concurrent f(RH = 85 %), ω0 and αsp data, Fig. 7 shows a similar pattern, whereby more hygroscopic and less absorbing particles tend to be larger (lower αsp). This is true for most marine sites, while Arctic sites (BRW and ZEP) show a similar behavior but exhibit lower ω0 values than the marine sites. Other sites characterized by considerably lower ω0 than PVC, such as UGR, HLM, FKB and KCO, exhibit higher scattering enhancement than predicted by the exponential relationship observed at PVC (Titos et al., 2014a). Additional exceptions to this trend are CES and MEL, which have much higher scattering enhancement than would be estimated based on their respective ω0 or αsp values. A distinct pattern depending on site type is not clearly observed. It is important to bear in mind that using the median value for each site hides the strong variability in aerosol properties at each site (as shown by the large standard deviations in Fig. 7) and that the separation of the individual sites' datasets by wind direction or air mass origin may clarify the pattern observed. The individual relationship between f(RH = 85 %) and ω0 for each site is shown in Fig. S4. Most sites show no trend between the analyzed variables, except for some of the marine sites (e.g., PVC, PYE, GRW, MHD and THD). Although using aerosol optical properties as an overall predictor of f(RH = 85 %) seems of limited utility based on the high variability observed among sites, the patterns we observe between f(RH = 85 %) and ω0 (and to a lesser extent αsp) may still be a useful constraint for models on a site-by-site basis.
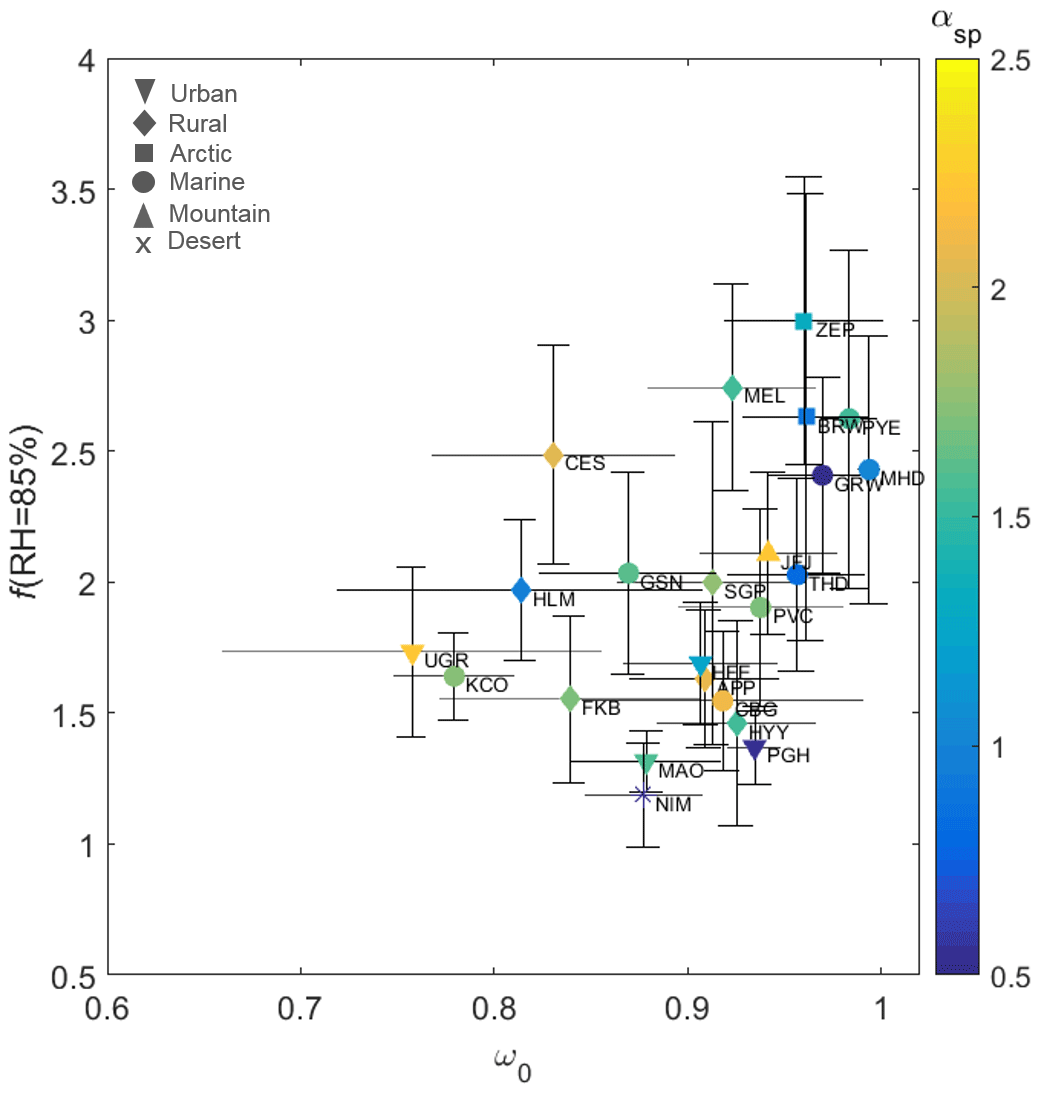
Figure 7Scatterplot of mean f(RH = 85 %) versus single-scattering albedo, ω0, at 550 nm (λ=525 nm at HYY) color-coded by the scattering Ångström exponent, αsp, for the wavelength pair 450–700 nm at each site. The dots represent the mean value, and the error bars are the standard deviation.
In this paper we have presented an extended overview and analysis of the range and variability of the scattering enhancement factor, f(RH = 85 %), at 23 diverse sites across the globe based on the dataset developed by Burgos et al. (2019). There are no clear patterns in f(RH = 85 %) as a function of site type, although in general marine sites tend to exhibit higher f(RH = 85 %) than rural and urban sites. The variability in f(RH = 85 %) observed at each site suggests that simple assumptions about f(RH) based on dominant aerosol type will not capture the actual range observed in this parameter for a given location.
We have also studied in detail the climatology of the hemispheric backscattering enhancement factor fb(RH = 85 %) across the same set of diverse sites. The value of fb(RH = 85 %) is highly correlated with that of f(RH = 85 %), and the difference between fb(RH = 85 %) and f(RH = 85 %) increases with f(RH = 85 %), suggesting that the more hygroscopic the aerosol, the lower the scattering enhancement in the backward direction relative to the total scattering enhancement, which is in agreement with Mie theory and consistent with previous observations at individual sites.
We investigated the influence of size cut and wavelength on f(RH = 85 %). f(RH = 85 %) is found to be higher for PM1 than for PM10 at most sites, which is a result of the size dependence of scattering efficiency according to Mie theory. Specifically at marine and Arctic sites, a larger difference in f(RH = 85 %) as a function of size cut is observed for lower αsp (predominance of larger particles), which is explained by the fact that sea salt is not only confined to the coarse mode. Small differences in f(RH = 85 %) for rural and urban sites are observed as a function of size cut. Additionally, f(RH = 85 %) increases as wavelength increases for the pair of wavelengths we studied here (450 and 700 nm). In contrast, the spectral dependence is negligible or even shows the opposite pattern for sites impacted by dust.
The light-scattering enhancement influences the estimates of direct radiative aerosol forcing by changing the single-scattering albedo and the angular distribution of scattered light. We assessed this influence across the sites in this study and found that ω0 increases with increasing RH, while b decreases. These results are in agreement with previous studies performed at individual sites. The aerosol radiative forcing efficiency (RFE) at high RH is larger (more negative) than the dry RFE, although the magnitude of the RH effect can be rather small in some cases, while for other cases a factor of 3–4 enhancement in RFE is observed (e.g., for clean Arctic sites). This RFE enhancement with RH is more pronounced at sites with lower ω0 values despite the lower f(RH) values at those sites. In spite of the simplified assumptions made to calculate RFE (constant Rs value and neglecting any absorption enhancement due to water uptake) we present an analysis of the effect of RH on RFE at very diverse sites, demonstrating the importance of considering RH in the calculation of RFE, especially at sites with low ω0.
We explored the relationship between readily available in situ aerosol optical properties (single-scattering albedo, ω0, and scattering Ångström exponent, αsp) and f(RH = 85 %). The f(RH = 85 %) values for each site were segregated by the outer quartile ranges of colocated ω0 and αsp properties. With a few exceptions, lower ω0 tended to be associated with lower f(RH = 85 %), consistent with the hypothesis that combustion-related aerosol tends to be less hygroscopic. Splitting f(RH = 85 %) by αsp was less definitive. At marine-influenced sites, lower αsp (likely indicating the presence of sea salt) tended to coincide with higher f(RH = 85 %). At other sites which may have a dust influence the opposite was observed; i.e., lower αsp was associated with lower f(RH = 85 %). Further information on aerosol size, chemical composition or air mass history would help to better constrain the relationship between f(RH = 85 %) and other variables.
This study provides a detailed analysis of multi-wavelength aerosol scattering and backscattering enhancement as a function of RH based on the harmonized dataset developed in Burgos et al. (2019). This dependence on RH is important for radiative forcing estimations. Measurements of f(RH) are necessary to address the impact of RH on aerosol optical properties. The relationship between f(RH = 85 %) and other aerosol optical properties such as ω0 or αsp could be useful to constrain f(RH) values within Earth system global models, but it appears to be of limited utility for predictions of f(RH) in the absence of direct f(RH) measurements. Future studies with this f(RH) dataset could explore other aerosol properties like size distribution (fine + coarse) and aerosol chemistry as proxies for f(RH). Furthermore, separation of each dataset by predominant wind direction or air mass history could help to better constrain the relationship between f(RH) and other aerosol properties.
The hygroscopicity dataset used in this study is already publicly available (see https://doi.org/10.1038/s41597-019-0158-7, Burgos et al., 2019). Absorption data were obtained from EBAS database (http://ebas.nilu.no, last access: 1 March 2019, NILU, 2021) or DOE archive (http://www.arm.gov/data, AIPAVG1OGREN.c1 data streams), last access: 1 December 2018, Atmospheric Research Facility, 2021).
The supplement related to this article is available online at: https://doi.org/10.5194/acp-21-13031-2021-supplement.
GT, MAB and EA performed the data analysis. GT, EA, MAB, and PZ designed the study and wrote the paper. EA, LAA, UB, BH, AJ, JS, GT, EW, KL, CO'D and AW were involved in either the humidified nephelometer or the absorption coefficient measurements (or both). All authors read and commented on the paper.
The authors declare that they have no conflict of interest.
Publisher's note: Copernicus Publications remains neutral with regard to jurisdictional claims in published maps and institutional affiliations.
The authors would like to thank all the technical and scientific staff members of the stations, whose dedication to quality have made this paper possible. Provision of data from this study has mainly been acquired in the framework of NOAA-FAN (https://www.esrl.noaa.gov/gmd/aero/net/, last access:1 March 2020); ACTRIS, under the ACTRIS-2 (Aerosols, Clouds, and Trace gases Research InfraStructure) project supported by European Union (grant agreement no. 654109) and the ACTRIS PPP project under grant agreement no. 739530. Gloria Titos thanks the Spanish Ministry of Economy and Competitiveness (RTI2018-101154-A-I00).
This research has been supported by the Department of Energy, Labor and Economic Growth (grant no. DE-SC0016541).
This paper was edited by Andreas Petzold and reviewed by two anonymous referees.
Almeida, G. P., Bittencourt, A. T., Evangelista, M. S., Vieira-Filho, M. S., and Fornaro, A.: Characterization of aerosol chemical composition from urban pollution in Brazil and its possible impacts on the aerosol hygroscopicity and size distribution, Atmos. Environ., 202, 149–159, https://doi.org/10.1016/j.atmosenv.2019.01.024, 2019. a, b, c
Anderson, T. and Ogren, J.: Determining aerosol radiative properties using the TSI 3563 integrating nephelometer, Aerosol Sci. Technol., 29, 57–69, 1998. a, b, c, d
Andrews, E., Sheridan, P. J., Ogren, J. A., and Ferrare, R.: In situ aerosol profiles over the Southern Great Plains cloud and radiation test bed site: 1. Aerosol optical properties, J. Geophys. Res.-Atmos., 109, D06208, https://doi.org/10.1029/2003JD004025, 2004. a
Andrews, E., Sheridan, P., Fiebig, M., McComiskey, A., Ogren, J., Arnott, P., Covert, D., Elleman, R., Gasparini, R., Collins, D., Jonsson, H., Schmid, B., and Wang, J.: Comparison of methods for deriving aerosol asymmetry parameter, J. Geophys. Res., 111, D05S04, https://doi.org/10.1029/2004JD005734, 2006. a
Andrews, E., Ogren, J., Bonasoni, P., Marinoni, A., Cuevas, E., Rodrigues, S., Sun, J., Jaffe, D., Fischer, E., Baltensperger, U., Weingartner, E., Collaud Coen, M., Sharma, S., Macdonald, A., Leaitch, W., Lin, N.-H., Laj, P., Arsov, T., Kalapov, I., Jefferson, A., and Sheridan, P.: Climatology of aerosol radiative properties in the free troposphere, Atmos. Res., 102, 365–393, 2011. a
Atmospheric Research Facility: Atmospheric Radiation Measurement (ARM) user facility data, available at: http://www.arm.gov/data, last access: 1 December 2018. a
Berkowitz, C. M., Berg, L. K., Yu, X.-Y., Alexander, M. L., Laskin, A., Zaveri, R. A., Jobson, B. T., Andrews, E., and Ogren, J. A.: The influence of fog and airmass history on aerosol optical, physical and chemical properties at Pt. Reyes National Seashore, Atmospheric Environment, 45, 2559–2568, https://doi.org/10.1016/j.atmosenv.2011.02.016, 2011. a
Bond, T. and Bergstrom, R.: Light absorption by carbonaceous particles: An investigative review, Aerosol Sci. Technol., 40, 27–67, 2006. a
Bond, T. C., Anderson, T. L., and Campbell, D.: Calibration and Intercomparison of Filter-Based Measurements of Visible Light Absorption by Aerosols, Aerosol Sci. Tech., 30, 582–600, https://doi.org/10.1080/027868299304435, 1999. a, b
Bond, T. C., Habib, G., and Bergstrom, R. W.: Limitations in the enhancement of visible light absorption due to mixing state, J. Geophys. Res.-Atmos., 111, D20211, https://doi.org/10.1029/2006JD007315, 2006. a
Boucher, O. and Anderson, T. L.: General circulation model assessment of the sensitivity of direct climate forcing by anthropogenic sulfate aerosols to aerosol size and chemistry, J. Geophys. Res.-Atmos., 100, 26117–26134, https://doi.org/10.1029/95JD02531, 1995. a
Bukowiecki, N., Weingartner, E., Gysel, M., Collaud Coen, M., Zieger, P., Herrmann, E., Steinbacher, M., Gäggeler, H. W., , and Baltensperger, U.: A Review of More Than 20 Years of Aerosol Observation at the High Altitude Research Station Jungfraujoch, Switzerland (3580 m asl), Aerosol Air Qual. Res., 16, 764–788, https://doi.org/10.4209/aaqr.2015.05.0305, 2016. a, b
Burgos, M., Andrews, E., Titos, G., Alados-Arboledas, L., Baltensperger, U., Day, D., Jefferson, A., Kalivitis, N., Mihalopoulos, N., Sherman, J., Sun, J., Weingartner, E., and Zieger, P.: A global view on the effect of water uptake on aerosol particle light scattering, Scientific Data, 6, 157, https://doi.org/10.1038/s41597-019-0158-7, 2019. a, b, c, d, e, f, g, h, i, j, k, l, m, n, o, p, q, r, s, t, u, v
Burgos, M. A., Andrews, E., Titos, G., Benedetti, A., Bian, H., Buchard, V., Curci, G., Kipling, Z., Kirkevåg, A., Kokkola, H., Laakso, A., Letertre-Danczak, J., Lund, M. T., Matsui, H., Myhre, G., Randles, C., Schulz, M., van Noije, T., Zhang, K., Alados-Arboledas, L., Baltensperger, U., Jefferson, A., Sherman, J., Sun, J., Weingartner, E., and Zieger, P.: A global model–measurement evaluation of particle light scattering coefficients at elevated relative humidity, Atmos. Chem. Phys., 20, 10231–10258, https://doi.org/10.5194/acp-20-10231-2020, 2020. a, b, c, d, e, f
Carrico, C., Rood, M., and Ogren, J.: Aerosol light scattering properties at Cape Grim, Tasmania, during the first Aerosol Characterization Experiment (ACE 1), J. Geophys. Res., 103, 16565–16574, https://doi.org/10.1029/98JD00685, 1998. a, b
Carrico, C., Rood, M., Ogren, J., Neusüß, C., Wiedensohler, A., and Heintzenberg, J.: Aerosol optical properties at Sagres, Portugal, during ACE-2, Tellus B, 52, 694–715, 2000. a, b, c, d, e
Carrico, C., Kus, P., Rood, M., Quinn, P., and Bates, T.: Mixtures of pollution, dust, sea salt, and volcanic aerosol during ACE-Asia: Radiative properties as a function of relative humidity, J. Geophys. Res., 108, 8650, https://doi.org/10.1029/2003JD003405, 2003. a, b, c, d, e, f, g, h, i, j, k
Clarke, A. D., Howell, S., Quinn, P. K., Bates, T. S., Ogren, J. A., Andrews, E., Jefferson, A., Massling, A., Mayol-Bracero, O., Maring, H., Savoie, D., and Cass, G.: INDOEX aerosol: A comparison and summary of chemical, microphysical, and optical properties observed from land, ship, and aircraft, J. Geophys. Res., 107, 8033, https://doi.org/10.1029/2001JD000572, 2002. a
Collaud Coen, M., Weingartner, E., Nyeki, S., Cozic, J., Henning, S., Verheggen, B., Gehrig, R., and Baltensperger, U.: Long-term trend analysis of aerosol variables at the high-alpine site Jungfraujoch, J. Geophys. Res., 112, D13213, https://doi.org/10.1029/2006JD007995, 2007. a
Covert, D. S., Charlson, R. J., and Ahlquist, N. C.: A Study of the Relationship of Chemical Composition and Humidity to Light Scattering by Aerosols, J. Appl. Meteorol., 11, 968–976, 1972. a
Curci, G., Hogrefe, C., Bianconi, R., Im, U., Balzarini, A., Baro, R., Brunner, D., Forkel, R., Giordano, L., Hirtl, M., Honzak, L., Jimenez-Guerrero, P., Knote, C., Langer, M., Makar, P. A., Pirovano, G., Perez, J. L., San Jose, R., Syrakov, D., Tuccella, P., Werhahn, J., Wolke, R., Zabkar, R., Zhang, J., and Galmarini, S.: Uncertainties of simulated aerosol optical properties induced by assumptions on aerosol physical and chemical properties: An AQMEII-2 perspective, Atmos. Environ., 115, 541–552, https://doi.org/10.1016/j.atmosenv.2014.09.009, 2015. a
Delene, D. J. and Ogren, J. A.: Variability of Aerosol Optical Properties at Four North American Surface Monitoring Sites, J. Atmos. Sci., 59, 1135–1150, https://doi.org/10.1175/1520-0469(2002)059<1135:VOAOPA>2.0.CO;2, 2002. a, b
Doherty, S., Quinn, P., Jefferson, A., Carrico, C., Anderson, T., and Hegg, D.: A comparison and summary of aerosol optical properties as observed in situ from aircraft, ship, and land during ACE-Asia, J. Geophys. Res., 110, D04201, https://doi.org/10.1029/2004JD004964, 2005. a, b, c, d, e
Dumka, U., Kaskaoutis, D., Sagar, R., Chen, J., Singh, N., and Tiwari, S.: First results from light scattering enhancement factor over central Indian Himalayas during GVAX campaign, Sci. Total Environ., 605, 124–138, 2017. a, b, c
Eldering, A., Ogren, J. A., Chowdhury, Z., Hughes, L. S., and Cass, G. R.: Aerosol optical properties during INDOEX based on measured aerosol particle size and composition, J. Geophys. Res.-Atmos., 107, 8001, https://doi.org/10.1029/2001JD001572, 2002. a
Ervens, B., Cubison, M. J., Andrews, E., Feingold, G., Ogren, J. A., Jimenez, J. L., Quinn, P. K., Bates, T. S., Wang, J., Zhang, Q., Coe, H., Flynn, M., and Allan, J. D.: CCN predictions using simplified assumptions of organic aerosol composition and mixing state: a synthesis from six different locations, Atmos. Chem. Phys., 10, 4795–4807, https://doi.org/10.5194/acp-10-4795-2010, 2010. a
Fehsenfeld, F. C., Ancellet, G., Bates, T. S., Goldstein, A. H., Hardesty, R. M., Honrath, R., Law, K. S., Lewis, A. C., Leaitch, R., McKeen, S., Meagher, J., Parrish, D. D., Pszenny, A. A. P., Russell, P. B., Schlager, H., Seinfeld, J., Talbot, R., and Zbinden, R.: International Consortium for Atmospheric Research on Transport and Transformation (ICARTT): North America to Europe – Overview of the 2004 summer field study, J. Geophys. Res.-Atmos., 111, D23S01, https://doi.org/10.1029/2006JD007829, 2006. a, b
Fierz-Schmidhauser, R., Zieger, P., Gysel, M., Kammermann, L., DeCarlo, P. F., Baltensperger, U., and Weingartner, E.: Measured and predicted aerosol light scattering enhancement factors at the high alpine site Jungfraujoch, Atmos. Chem. Phys., 10, 2319–2333, https://doi.org/10.5194/acp-10-2319-2010, 2010a. a, b, c, d, e, f, g, h, i, j, k, l, m, n, o, p, q
Fierz-Schmidhauser, R., Zieger, P., Vaishya, A., Monahan, C., Bialek, J., O'Dowd, C. D., Jennings, S. G., Baltensperger, U., and Weingartner, E.: Light scattering enhancement factors in the marine boundary layer (Mace Head, Ireland), J. Geophys. Res., 115, D20204, https://doi.org/10.1029/2009jd013755, 2010b. a, b, c
Fierz-Schmidhauser, R., Zieger, P., Wehrle, G., Jefferson, A., Ogren, J. A., Baltensperger, U., and Weingartner, E.: Measurement of relative humidity dependent light scattering of aerosols, Atmos. Meas. Tech., 3, 39–50, https://doi.org/10.5194/amt-3-39-2010, 2010c. a
Fuller, K., Malm, W., and Kreidenweis, S.: Effects of mixing on extinction by carbonaceous particles, J. Geophys. Res., 104, 15941–15954, https://doi.org/10.1029/1998JD100069, 1999. a
Haarig, M., Ansmann, A., Gasteiger, J., Kandler, K., Althausen, D., Baars, H., Radenz, M., and Farrell, D. A.: Dry versus wet marine particle optical properties: RH dependence of depolarization ratio, backscatter, and extinction from multiwavelength lidar measurements during SALTRACE, Atmos. Chem. Phys., 17, 14199–14217, https://doi.org/10.5194/acp-17-14199-2017, 2017. a
Haywood, J. M. and Shine, K. P.: The effect of anthropogenic sulfate and soot aerosol on the clear sky planetary radiation budget, Geophys. Res. Lett., 22, 603–606, https://doi.org/10.1029/95GL00075, 1995. a
Hegg, D. A., Covert, D. S., Rood, M., and Hobbs, P.: Measurements of aerosol optical properties in marine air, J. Geophys. Res., 101, 12893–12903, 1996. a, b, c, d, e
Hummel, J. R. and Reck, R. A.: A global surface model, J. Appl. Meteorol., 3, 239–253, 1979. a
Jefferson, A., Hageman, D., Morrow, H., Mei, F., and Watson, T.: Seven years of aerosol scattering hygroscopic growth measurements from SGP: Factors influencing water uptake, J. Geophys. Res.-Atmos., 122, 9451–9466, https://doi.org/10.1002/2017JD026804, 2017. a, b, c
Jennings, S., Kleefeld, C., O'Dowd, C., Junker, C., Spain, T., O'Brien, P., Roddy, A., and O'Connor, T.: Mace Head Atmospheric Research Station – Characterization of aerosol radiative parameters, Boreal Environ. Res., 8, 303–314, 2003. a
Kanakidou, M., Seinfeld, J. H., Pandis, S. N., Barnes, I., Dentener, F. J., Facchini, M. C., Van Dingenen, R., Ervens, B., Nenes, A., Nielsen, C. J., Swietlicki, E., Putaud, J. P., Balkanski, Y., Fuzzi, S., Horth, J., Moortgat, G. K., Winterhalter, R., Myhre, C. E. L., Tsigaridis, K., Vignati, E., Stephanou, E. G., and Wilson, J.: Organic aerosol and global climate modelling: a review, Atmos. Chem. Phys., 5, 1053–1123, https://doi.org/10.5194/acp-5-1053-2005, 2005. a
Kasten, F.: Visibility forecast in the phase of pre-condensation, Tellus, 21, 631–635, 1969. a
Kiehl, J. T. and Briegleb, B. P.: The Relative Roles of Sulfate Aerosols and Greenhouse Gases in Climate Forcing, Science, 260, 311–314, https://doi.org/10.1126/science.260.5106.311, 1993. a
Kirchstetter, T., Novakov, T., and Hobbs, P.: Evidence that the spectral dependence of light absorption by aerosols is affected by organic carbon, J. Geophys. Res.-Atmos., 109, D21208, https://doi.org/10.1029/2004JD004999, 2004. a
Koloutsou-Vakakis, S., Carrico, C., Kus, P., Rood, M., Li, Z., Shrestha, R., Ogren, J., Chow, J., and Watson, J.: Aerosol properties at a midlatitude Northern Hemisphere continental site, J. Geophys. Res., 106, 3019–3032, https://doi.org/10.1029/2000JD900126, 2001. a, b, c, d, e
Kotchenruther, R. and Hobbs, P.: Humidification factors of aerosols from biomass burning in Brazil, J. Geophys. Res., 103, 32081–32089, https://doi.org/10.1029/98JD00340, 1998. a, b
Kotchenruther, R., Hobbs, P., and Hegg, D.: Humidification factors for atmospheric aerosols off the mid-Atlantic coast of the United States, J. Geophys. Res.-Atmos., 104, 2239–2251, https://doi.org/10.1029/98JD01751, 1999. a
Laj, P., Bigi, A., Rose, C., Andrews, E., Lund Myhre, C., Collaud Coen, M., Lin, Y., Wiedensohler, A., Schulz, M., Ogren, J. A., Fiebig, M., Gliß, J., Mortier, A., Pandolfi, M., Petäja, T., Kim, S.-W., Aas, W., Putaud, J.-P., Mayol-Bracero, O., Keywood, M., Labrador, L., Aalto, P., Ahlberg, E., Alados Arboledas, L., Alastuey, A., Andrade, M., Artíñano, B., Ausmeel, S., Arsov, T., Asmi, E., Backman, J., Baltensperger, U., Bastian, S., Bath, O., Beukes, J. P., Brem, B. T., Bukowiecki, N., Conil, S., Couret, C., Day, D., Dayantolis, W., Degorska, A., Eleftheriadis, K., Fetfatzis, P., Favez, O., Flentje, H., Gini, M. I., Gregorič, A., Gysel-Beer, M., Hallar, A. G., Hand, J., Hoffer, A., Hueglin, C., Hooda, R. K., Hyvärinen, A., Kalapov, I., Kalivitis, N., Kasper-Giebl, A., Kim, J. E., Kouvarakis, G., Kranjc, I., Krejci, R., Kulmala, M., Labuschagne, C., Lee, H.-J., Lihavainen, H., Lin, N.-H., Löschau, G., Luoma, K., Marinoni, A., Martins Dos Santos, S., Meinhardt, F., Merkel, M., Metzger, J.-M., Mihalopoulos, N., Nguyen, N. A., Ondracek, J., Pérez, N., Perrone, M. R., Petit, J.-E., Picard, D., Pichon, J.-M., Pont, V., Prats, N., Prenni, A., Reisen, F., Romano, S., Sellegri, K., Sharma, S., Schauer, G., Sheridan, P., Sherman, J. P., Schütze, M., Schwerin, A., Sohmer, R., Sorribas, M., Steinbacher, M., Sun, J., Titos, G., Toczko, B., Tuch, T., Tulet, P., Tunved, P., Vakkari, V., Velarde, F., Velasquez, P., Villani, P., Vratolis, S., Wang, S.-H., Weinhold, K., Weller, R., Yela, M., Yus-Diez, J., Zdimal, V., Zieger, P., and Zikova, N.: A global analysis of climate-relevant aerosol properties retrieved from the network of Global Atmosphere Watch (GAW) near-surface observatories, Atmos. Meas. Tech., 13, 4353–4392, https://doi.org/10.5194/amt-13-4353-2020, 2020. a
Liu, D., Allan, J., Corris, B., Flynn, M., Andrews, E., Ogren, J., Beswick, K., Bower, K., Burgess, R., Choularton, T., Dorsey, J., Morgan, W., Williams, P. I., and Coe, H.: Carbonaceous aerosols contributed by traffic and solid fuel burning at a polluted rural site in Northwestern England, Atmos. Chem. Phys., 11, 1603–1619, https://doi.org/10.5194/acp-11-1603-2011, 2011. a
Liu, J. and Li, Z.: Significant Underestimation in the Optically Based Estimation of the Aerosol First Indirect Effect Induced by the Aerosol Swelling Effect, Geophys. Res. Lett., 45, 5690–5699, https://doi.org/10.1029/2018GL077679, 2018. a
Luoma, K., Virkkula, A., Aalto, P., Petäjä, T., and Kulmala, M.: Over a 10-year record of aerosol optical properties at SMEAR II, Atmos. Chem. Phys., 19, 11363–11382, https://doi.org/10.5194/acp-19-11363-2019, 2019. a, b, c, d, e
Magi, B. I. and Hobbs, P. V.: Effects of humidity on aerosols in southern Africa during the biomass burning season, J. Geophys. Res.-Atmos., 108, 8495, https://doi.org/10.1029/2002JD002144, 2003. a, b, c
McInnes, L., Bergin, M., Ogren, J., and Schwartz, S.: Apportionment of light scattering and hygroscopic growth to aerosol composition, Geophys. Res. Lett., 25, 513–516, https://doi.org/10.1029/98GL00127, 1998. a
Miller, M. A. and Slingo, A.: The Arm Mobile Facility and Its First International Deployment: Measuring Radiative Flux Divergence in West Africa, B. Am. Meteorol. Soc., 88, 1229–1244, https://doi.org/10.1175/BAMS-88-8-1229, 2007. a
Müller, T., Laborde, M., Kassell, G., and Wiedensohler, A.: Design and performance of a three-wavelength LED-based total scatter and backscatter integrating nephelometer, Atmos. Meas. Tech., 4, 1291–1303, https://doi.org/10.5194/amt-4-1291-2011, 2011. a, b
Myhre, G., Samset, B. H., Schulz, M., Balkanski, Y., Bauer, S., Berntsen, T. K., Bian, H., Bellouin, N., Chin, M., Diehl, T., Easter, R. C., Feichter, J., Ghan, S. J., Hauglustaine, D., Iversen, T., Kinne, S., Kirkevåg, A., Lamarque, J.-F., Lin, G., Liu, X., Lund, M. T., Luo, G., Ma, X., van Noije, T., Penner, J. E., Rasch, P. J., Ruiz, A., Seland, Ø., Skeie, R. B., Stier, P., Takemura, T., Tsigaridis, K., Wang, P., Wang, Z., Xu, L., Yu, H., Yu, F., Yoon, J.-H., Zhang, K., Zhang, H., and Zhou, C.: Radiative forcing of the direct aerosol effect from AeroCom Phase II simulations, Atmos. Chem. Phys., 13, 1853–1877, https://doi.org/10.5194/acp-13-1853-2013, 2013. a
Nessler, R., Weingartner, E., and Baltensperger, U.: Adaptation of Dry Nephelometer Measurements to Ambient Conditions at the Jungfraujoch, Environ. Sci. Technol., 39, 2219–2228, https://doi.org/10.1021/es035450g, 2005a. a
Nessler, R., Weingartner, E., and Baltensperger, U.: Effect of humidity on aerosol light absorption and its implications for extinction and the single scattering albedo illustrated for a site in the lower free troposphere, J. Aerosol Sci., 36, 958–972, https://doi.org/10.1016/j.jaerosci.2004.11.012, 2005b. a, b
NILU: EBAS database, available at: http://ebas.nilu.no, last access: 1 March 2019. a
Ogren, J. A.: Comment on “Calibration and Intercomparison of Filter-Based Measurements of Visible Light Absorption by Aerosols”, Aerosol Sci. Tech., 44, 589–591, https://doi.org/10.1080/02786826.2010.482111, 2010. a
Pandolfi, M., Alados-Arboledas, L., Alastuey, A., Andrade, M., Angelov, C., Artiñano, B., Backman, J., Baltensperger, U., Bonasoni, P., Bukowiecki, N., Collaud Coen, M., Conil, S., Coz, E., Crenn, V., Dudoitis, V., Ealo, M., Eleftheriadis, K., Favez, O., Fetfatzis, P., Fiebig, M., Flentje, H., Ginot, P., Gysel, M., Henzing, B., Hoffer, A., Holubova Smejkalova, A., Kalapov, I., Kalivitis, N., Kouvarakis, G., Kristensson, A., Kulmala, M., Lihavainen, H., Lunder, C., Luoma, K., Lyamani, H., Marinoni, A., Mihalopoulos, N., Moerman, M., Nicolas, J., O'Dowd, C., Petäjä, T., Petit, J.-E., Pichon, J. M., Prokopciuk, N., Putaud, J.-P., Rodríguez, S., Sciare, J., Sellegri, K., Swietlicki, E., Titos, G., Tuch, T., Tunved, P., Ulevicius, V., Vaishya, A., Vana, M., Virkkula, A., Vratolis, S., Weingartner, E., Wiedensohler, A., and Laj, P.: A European aerosol phenomenology – 6: scattering properties of atmospheric aerosol particles from 28 ACTRIS sites, Atmos. Chem. Phys., 18, 7877–7911, https://doi.org/10.5194/acp-18-7877-2018, 2018. a, b
Parrish, D. D., Kondo, Y., Cooper, O. R., Brock, C. A., Jaffe, D. A., Trainer, M., Ogawa, T., Hübler, G., and Fehsenfeld, F. C.: Intercontinental Transport and Chemical Transformation 2002 (ITCT 2K2) and Pacific Exploration of Asian Continental Emission (PEACE) experiments: An overview of the 2002 winter and spring intensives, J. Geophys. Res.-Atmos., 109, D23S01, https://doi.org/10.1029/2004JD004980, 2004. a
Pitchford, M., Malm, W., Schichtel, B., Kumar, N., Lowenthal, D., and Hand, J.: Revised Algorithm for Estimating Light Extinction from IMPROVE Particle Speciation Data, J. Air Waste Manage., 57, 1326–1336, https://doi.org/10.3155/1047-3289.57.11.1326, 2007. a
Prenni, A., Hand, J., Malm, W., Copeland, S., Luo, G., Yu, F., Taylor, N., Russell, L., and Schichtel, B.: An examination of the algorithm for estimating light extinction from IMPROVE particle speciation data, Atmos. Environ., 214, 116880, https://doi.org/10.1016/j.atmosenv.2019.116880, 2019. a
Quinn, P., Miller, T., Bates, T., Ogren, J., Andrews, E., and Shaw, G.: A 3-year record of simultaneously measured aerosol chemical and optical properties at Barrow, Alaska, J. Geophys. Res., 107, 4130, https://doi.org/10.1029/2001JD001248, 2002. a
Quinn, P., Bates, T., Baynard, T., Clarke, A., Onasch, T., Wang, W., Rood, M., Andrews, E., Allan, J., Carrico, C., Coffman, D., Worsnop, D.: Impact of particulate organic matter on the relative humidity dependence of light scattering: A simplified parameterization, Geophys. Res. Lett., 32, L22809, https://doi.org/10.1029/2005GL024322, 2005. a, b
Schmeisser, L., Backman, J., Ogren, J. A., Andrews, E., Asmi, E., Starkweather, S., Uttal, T., Fiebig, M., Sharma, S., Eleftheriadis, K., Vratolis, S., Bergin, M., Tunved, P., and Jefferson, A.: Seasonality of aerosol optical properties in the Arctic, Atmos. Chem. Phys., 18, 11599–11622, https://doi.org/10.5194/acp-18-11599-2018, 2018. a, b
Sheridan, P. and Ogren, J.: Observations of the vertical and regional variability of aerosol optical properties over central and eastern North America, J. Geophys. Res., 104, 16793–16805, https://doi.org/10.1029/1999JD900241, 1999. a, b
Sheridan, P., Delene, D., and Ogren, J.: Four years of continuous surface aerosol measurements from the Department of Energy's Atmospheric Radiation Measurement Program Southern Great Plains Cloud and Radiation Testbed site, J. Geophys. Res., 106, 20735–20747, 2001. a, b, c
Sheridan, P. J., Jefferson, A., and Ogren, J. A.: Spatial variability of submicrometer aerosol radiative properties over the Indian Ocean during INDOEX, J. Geophys. Res.-Atmos., 107, 8011, https://doi.org/10.1029/2000JD000166, 2002. a, b
Sheridan, P. J., Andrews, E., Ogren, J. A., Tackett, J. L., and Winker, D. M.: Vertical profiles of aerosol optical properties over central Illinois and comparison with surface and satellite measurements, Atmos. Chem. Phys., 12, 11695–11721, https://doi.org/10.5194/acp-12-11695-2012, 2012. a
Sherman, J. P., Sheridan, P. J., Ogren, J. A., Andrews, E., Hageman, D., Schmeisser, L., Jefferson, A., and Sharma, S.: A multi-year study of lower tropospheric aerosol variability and systematic relationships from four North American regions, Atmos. Chem. Phys., 15, 12487–12517, https://doi.org/10.5194/acp-15-12487-2015, 2015. a, b, c
Springston, S. and Sedlacek, A.J., I.: Noise characteristics of an instrumental particle absorbance technique, Aerosol Sci. Tech., 41, 1110–1116, https://doi.org/10.1080/02786820701777457, 2007. a
Titos, G., Foyo-Moreno, I., Lyamani, H., Querol, X., Alastuey, A., and Alados-Arboledas, L.: Optical properties and chemical composition of aerosol particles at an urban location: An estimation of the aerosol mass scattering and absorption efficiencies, J. Geophys. Res.-Atmos., 117, D04206, https://doi.org/10.1029/2011JD016671, 2012. a
Titos, G., Jefferson, A., Sheridan, P. J., Andrews, E., Lyamani, H., Alados-Arboledas, L., and Ogren, J. A.: Aerosol light-scattering enhancement due to water uptake during the TCAP campaign, Atmos. Chem. Phys., 14, 7031–7043, https://doi.org/10.5194/acp-14-7031-2014, 2014a. a, b, c, d, e, f, g, h, i, j
Titos, G., Lyamani, H., Cazorla, A., Sorribas, M., Foyo-Moreno, I., Wiedensohler, A., and Alados-Arboledas, L.: Study of the relative humidity dependence of aerosol light-scattering in southern Spain, Tellus B, 66, 24536, https://doi.org/10.3402/tellusb.v66.24536, 2014b. a, b, c, d, e, f
Titos, G., Cazorla, A., Zieger, P., Andrews, E., Lyamani, H., Granados-Muñoz, M., Olmo, F., and Alados-Arboledas, L.: Effect of hygroscopic growth on the aerosol light-scattering coefficient: A review of measurements, techniques and error sources, Atmos. Environ., 141, 494–507, https://doi.org/10.1016/j.atmosenv.2016.07.021, 2016. a, b, c, d
Wang, J. and Martin, S. T.: Satellite characterization of urban aerosols: Importance of including hygroscopicity and mixing state in the retrieval algorithms, J. Geophys. Res.-Atmos., 112, D17203, https://doi.org/10.1029/2006JD008078, 2007. a, b
Wood, R., Wyant, M., Bretherton, C. S., Rémillard, J., Kollias, P., Fletcher, J., Stemmler, J., de Szoeke, S., Yuter, S., Miller, M., Mechem, D., Tselioudis, G., Chiu, J. C., Mann, J. A. L., O’Connor, E. J., Hogan, R. J., Dong, X., Miller, M., Ghate, V., Jefferson, A., Min, Q., Minnis, P., Palikonda, R., Albrecht, B., Luke, E., Hannay, C., and Lin, Y.: Clouds, Aerosols, and Precipitation in the Marine Boundary Layer: An Arm Mobile Facility Deployment, B. Am. Meteorol. Soc., 96, 419–440, https://doi.org/10.1175/BAMS-D-13-00180.1, 2015. a
York, D., Evensen, N., Martínez, M., and De Basabe Delgado, J.: Unified equations for the slope, intercept, and standard errors of the best straight line, Am. J. Phys., 72, 367–375, https://doi.org/10.1119/1.1632486, 2004. a, b
Yuan, C., Zheng, J., Ma, Y., Jiang, Y., Li, Y., and Wang, Z.: Significant restructuring and light absorption enhancement of black carbon particles by ammonium nitrate coating, Environ. Pollut., 262, 114172, https://doi.org/10.1016/j.envpol.2020.114172, 2020. a, b, c
Zanatta, M., Gysel, M., Bukowiecki, N., Müller, T., Weingartner, E., Areskoug, H., Fiebig, M., Yttri, K., Mihalopoulos, N., Kouvarakis, G., Beddows, D., Harrison, R., Cavalli, F., Putaud, J., Spindler, G., Wiedensohler, A., Alastuey, A., Pandolfi, M., Sellegri, K., Swietlicki, E., Jaffrezo, J., Baltensperger, U., and Laj, P.: A European aerosol phenomenology-5: Climatology of black carbon optical properties at 9 regional background sites across Europe, Atmos. Environ., 145, 346–364, https://doi.org/10.1016/j.atmosenv.2016.09.035, 2016. a, b
Zhang, L., Sun, J. Y., Shen, X. J., Zhang, Y. M., Che, H., Ma, Q. L., Zhang, Y. W., Zhang, X. Y., and Ogren, J. A.: Observations of relative humidity effects on aerosol light scattering in the Yangtze River Delta of China, Atmos. Chem. Phys., 15, 8439–8454, https://doi.org/10.5194/acp-15-8439-2015, 2015. a, b
Zieger, P., Fierz-Schmidhauser, R., Gysel, M., Ström, J., Henne, S., Yttri, K. E., Baltensperger, U., and Weingartner, E.: Effects of relative humidity on aerosol light scattering in the Arctic, Atmos. Chem. Phys., 10, 3875–3890, https://doi.org/10.5194/acp-10-3875-2010, 2010. a, b, c, d, e
Zieger, P., Weingartner, E., Henzing, J., Moerman, M., de Leeuw, G., Mikkilä, J., Ehn, M., Petäjä, T., Clémer, K., van Roozendael, M., Yilmaz, S., Frieß, U., Irie, H., Wagner, T., Shaiganfar, R., Beirle, S., Apituley, A., Wilson, K., and Baltensperger, U.: Comparison of ambient aerosol extinction coefficients obtained from in-situ, MAX-DOAS and LIDAR measurements at Cabauw, Atmos. Chem. Phys., 11, 2603–2624, https://doi.org/10.5194/acp-11-2603-2011, 2011. a, b, c, d
Zieger, P., Kienast-Sjögren, E., Starace, M., von Bismarck, J., Bukowiecki, N., Baltensperger, U., Wienhold, F. G., Peter, T., Ruhtz, T., Collaud Coen, M., Vuilleumier, L., Maier, O., Emili, E., Popp, C., and Weingartner, E.: Spatial variation of aerosol optical properties around the high-alpine site Jungfraujoch (3580 m a.s.l.), Atmos. Chem. Phys., 12, 7231–7249, https://doi.org/10.5194/acp-12-7231-2012, 2012. a
Zieger, P., Fierz-Schmidhauser, R., Weingartner, E., and Baltensperger, U.: Effects of relative humidity on aerosol light scattering: results from different European sites, Atmos. Chem. Phys., 13, 10609–10631, https://doi.org/10.5194/acp-13-10609-2013, 2013. a, b, c, d, e, f, g, h, i, j, k, l, m
Zieger, P., Fierz-Schmidhauser, R., Poulain, L., Müller, T., Birmili, W., Spindler, G., Wiedensohler, A., Baltensperger, U., and Weingartner, E.: Influence of water uptake on the aerosol particle light scattering coeffcients of the Central European aerosol, Tellus B, 66, 22716, https://doi.org/10.3402/tellusb.v66.22716, 2014. a, b, c, d, e, f, g, h, i
Zieger, P., Aalto, P. P., Aaltonen, V., Äijälä, M., Backman, J., Hong, J., Komppula, M., Krejci, R., Laborde, M., Lampilahti, J., de Leeuw, G., Pfüller, A., Rosati, B., Tesche, M., Tunved, P., Väänänen, R., and Petäjä, T.: Low hygroscopic scattering enhancement of boreal aerosol and the implications for a columnar optical closure study, Atmos. Chem. Phys., 15, 7247–7267, https://doi.org/10.5194/acp-15-7247-2015, 2015. a, b, c, d, e