the Creative Commons Attribution 4.0 License.
the Creative Commons Attribution 4.0 License.
 | 01 Sep 2021
Measurement report: Vertical distribution of biogenic and anthropogenic secondary organic aerosols in the urban boundary layer over Beijing during late summer
Hong Ren
Lianfang Wei
Siyao Yue
Jian Zhao
Linjie Li
Libin Wu
Wanyu Zhao
Lujie Ren
Mingjie Kang
Qiaorong Xie
Sihui Su
Xiaole Pan
Zifa Wang
Kimitaka Kawamura
Secondary organic aerosol (SOA) plays a significant role in atmospheric chemistry. However, little is known about the vertical profiles of SOA in the urban boundary layer (UBL). This knowledge gap constrains the SOA simulation in chemical transport models. Here, the aerosol samples were synchronously collected at 8, 120, and 260 m based on a 325 m meteorological tower in Beijing from 15 August to 10 September 2015. Strict emission controls were implemented during this period for the 2015 China Victory Day parade. Here, we observed that the total concentration of biogenic SOA tracers increased with height. The fraction of SOA from isoprene oxidation increased with height, whereas the fractions of SOA from monoterpenes and sesquiterpenes decreased, and 2,3-dihydroxy-4-oxopentanoic acid (DHOPA), a tracer of anthropogenic SOA from toluene oxidation, also increased with height. The complicated vertical profiles of SOA tracers highlighted the need to characterize SOA within the UBL. The mass concentration of estimated secondary organic carbon (SOC) ranged from 341 to 673 ng C m−3. The increase in the estimated SOC fractions from isoprene and toluene with height was found to be more related to regional transport, whereas the decrease in the estimated SOC from monoterpenes and sesquiterpene with height was more subject to local emissions. Emission controls during the parade reduced SOC by 4 %–35 %, with toluene SOC decreasing more than the other SOC. This study demonstrates that vertical distributions of SOA within the UBL are complex, and the vertical profiles of SOA concentrations and sources should be considered in field and modeling studies in the future.
- Article
(10403 KB) - Full-text XML
-
Supplement
(4471 KB) - BibTeX
- EndNote


In the middle of the 20th century, atmosphere pollution events began to be frequently reported in different regions worldwide (White and Roberts, 1976; Went, 1960; Barrie, 1986). Many studies on atmospheric aerosols have been undertaken to understand the sources and evolution mechanisms of aerosols and discuss their effects on climate and human health. It is well known that atmospheric aerosols can impact radiative forcing, the hydrological cycle, regional and global climate, and human health (Kanakidou et al., 2005; Su et al., 2020), and these impacts were all shown in the Intergovernmental Panel on Climate Change (IPCC) report (IPCC, 2014). Generally, 20 %–90 % of the mass concentration of particulate matter (PM) is contributed by organic aerosols (OAs) of which ca. 30 %–70 % is secondary organic aerosol (SOA) (Huang et al., 2014; Ervens et al., 2011). SOA is generally formed through the photooxidation of volatile organic compounds (VOCs), including biogenic VOCs (BVOCs, e.g., isoprene, monoterpenes, sesquiterpenes, and oxygenated hydrocarbons) from terrestrial vegetation and marine phytoplankton and anthropogenic VOCs (AVOCs, e.g., toluene and naphthalene) from biomass burning, coal combustion, vehicle exhausts, and solvent use.
Anthropogenic SOA (ASOA) and biogenic SOA (BSOA) are important contributors to OA and air pollution in the atmosphere (Hodzic et al., 2016; Nault et al., 2021; An et al., 2019). BSOA and ASOA fractions are potentially underestimated in models according to previous studies (Volkamer et al., 2006; Shrivastava et al., 2017). In recent years, a large number of studies based on field observations suggest that the formation of BSOA can be enhanced by anthropogenic precursors, an effect which is known as anthropogenic–biogenic interactions (Zelenyuk et al., 2017; Goldstein et al., 2009; Shilling et al., 2013). Simultaneously, SOA can be transported on a regional or global scale, changing cloud condensation nuclei (CCN) size, influencing the climate, and damaging human health (Russell and Brunekreef, 2009; Pöschl, 2005; Shrivastava et al., 2017).
In the last decade, severe air pollution in China has attracted worldwide attention (An et al., 2019; Huang et al., 2020a). The haze episodes in China are suggested to result from a complex interplay of anthropogenic emissions, atmospheric processes, regional transport, meteorological conditions, and climatic conditions (An et al., 2019; Zheng et al., 2015; Sun et al., 2016; Du et al., 2021; Huang et al., 2020b). The high contribution of secondary aerosols to the PM pollution during haze events in China highlights the urgent need to understand the compositions and processes of SOA formation in the atmosphere (An et al., 2019; Huang et al., 2014). Previous studies have reported the chemical characteristics of OA in many regions in China (Simoneit et al., 1991; Wang et al., 2006; Xie et al., 2020; Li et al., 2018). However, studies characterizing the vertical properties of SOA in the urban boundary layer are lacking, which constrains research on the interactions of aerosols and regional transport, local emissions, atmospheric processes, and meteorological conditions in urban areas.
Vertical profiles of atmospheric dynamic structures, gaseous species, bulk chemical compositions, and nitrogen isotopes in the urban boundary layer (UBL) have been investigated over Beijing (Guinot et al., 2006; Sun et al., 2015; Zhao et al., 2017; Chan et al., 2005; Wu et al., 2019). Several field studies at the rainforest Amazon Tall Tower Observatory (ATTO) also measured the vertical gradients of VOCs. (Andreae et al., 2015; Yáñez-Serrano et al., 2018). However, vertical SOA profiles were still lacking. A previous study reported that the loading of SOA is high above the surface layer during the summer over the southeastern United States, which was potentially related to the heterogeneous chemical reactions and gas-to-particle conversion of BVOC oxidation products (Goldstein et al., 2009). This highlights the pressing need to obtain the vertical SOA profiles in the cities, especially in a Chinese megacity frequently enduring severe air pollution. It is meaningful to learn the SOA properties and probe its behavior in the atmosphere. This information also has regulatory implications for decision makers.
Beijing, one of the super megacities of China, held the 2015 China Victory Day parade in the late summer of 2015. The government had implemented strict emission controls in Beijing and its seven surrounding provinces to improve the air quality. This provided a unique chance to study atmospheric aerosols under government interventions. Daily PM2.5 samples were synchronously collected at three heights (8, 120, and 260 , respectively) based on a 325 m meteorological tower in urban Beijing during the period 15 August to 10 September 2015. Observations at 8 m are more subject to local emissions, whereas those at 120 and 260 m are more representative of mixing and/or regional-scale influences (Sun et al., 2015; Zhao et al., 2020). BSOA and ASOA tracers in PM2.5 were quantified by gas chromatography and mass spectrometry (GC/MS); organic carbon (OC), elemental carbon (EC), and water-soluble organic carbon (WSOC) in PM2.5 were also determined. In addition, the tracer-based method (Kleindienst et al., 2007) was used to estimate the contributions of biogenic SOC (BSOC) and anthropogenic SOC (ASOC). The influences of emission controls during the parade period on the characteristics of SOC were also investigated. To the best of our knowledge, this was the first time that vertical profiles of SOA tracers were measured at a molecular level in a Chinese megacity. This campaign provided new insights into the formation mechanisms of SOA in haze episodes and the influences of local emissions, regional transport, and mixing of heights on SOA over the North China Plain (NCP). Furthermore, this study provided a scientific basis for China's initiatives to guarantee good air quality in Beijing and contributed to improving the simulations of SOA in the chemical transport models.
2.1 Sampling
Daily PM2.5 samples were collected at three heights: 8 m (at the rooftop of a two-story building about 10 m away from the 325 m meteorological tower), 120, and 260 m (at the platforms of the tower) in Beijing during the China Victory Day parade period (08:00–06:00 LT the next day; 15 August–10 September 2015). The sampling site is at the Institute of Atmospheric Physics (IAP), Chinese Academy of Sciences (39∘58.53′ N, 116∘22.69′ E), which is in an urban site (between the 3rd and 4th ring roads) of Beijing and surrounded by a traffic road (∼50 m), highway (∼300 m), a public park (∼500 m to the southwest), restaurants (∼100 m), residential housing, and a gas station (∼200 m). The predominant vegetation types surrounding the sampling site are deciduous broadleaf vegetation (acacia and Juglandaceae), shrub, and lawn. The vegetation cover of the public park is more than 50 %. The predominant vegetation is also deciduous broadleaf. Filter samples were collected onto pre-combusted (450 ∘C combusted for 6 h) quartz fiber filters (Pallflex, 20×25 cm) using high-volume air samplers (Tisch, USA) at a flow rate of 1.1 m3 min−1. The filter samples were enveloped in aluminum foil and stored at −20 ∘C in darkness until analysis. Meteorological parameters including wind speed (WS), wind direction (WD), temperature (T), and relative humidity (RH) at the heights of 8, 120, and 260 m were measured by the meteorological system on the tower. Three periods are classified according to the phases of emission controls by the government: before the parade (Before-P): 15–19 August; during the parade (During-Parade): 20 August–3 September; and after the parade (After-P): 4–10 September.
2.2 Carbonaceous component analyses
OC and EC in aerosols were directly analyzed by an OC/EC carbon aerosol analyzer (Sunset Laboratory Inc., USA) following a NIOSH protocol (Mkoma et al., 2013). A portion of each filter of 3.14 cm2 was extracted with 15 mL ultrapure water under ultrasonication with ice water for 20 min. WSOC in this water extract was measured by a total organic carbon (TOC) analyzer (model NPOC, Shimadzu, Japan). The concentrations of OC, EC, and WSOC were calibrated with field blank filters.
2.3 Measurement of OA molecular compositions using GC/MS
A filter was extracted three times with dichloromethanemethanol (2:1, ) under ultrasonication. The extracts were then filtered, concentrated by a rotary evaporator, and blown to dryness. After that, the dried extracts were reacted with 60 µL of N,O-bis-(trimethylsilyl)trifluoroacetamide (BSTFA) with 1 % trimethylsilyl chloride and 10 µL of pyridine at 70 ∘C for 3 h. After sufficient reaction, 40 µL internal standard solvent (C13n-alkane, 1.43 ng µL−1) was added to the derivatives before GC/MS analyses. Three field blank filters were treated as real samples and used for quality calibration. GC/MS is performed on a Hewlett-Packard model Agilent 7890A GC coupled to a Hewlett-Packard model Agilent 5975C mass selective detector (MSD). GC separation is equipped with a split/splitless injection and a fused silica capillary column (DB-5MS, 30 m×0.25 mm i.d., 0.25 µm film thickness). The GC oven temperature program was set as follows: held at 50 ∘C 2 min, then increased to 120 ∘C at a rate of 15 , heated up to 300 ∘C at a rate of 5 , and finally held at 300 ∘C for 16 min. The mass spectrometer was operated on the electron impact (IE) mode at 70 eV and scanned from 50 to 650 Da. Organic marker measurements were determined by comparing with references, a library, and authentic standards, and were quantified with GC/MS response factors acquired using authentic standards or surrogates (Fu et al., 2009). The data reported in this work were corrected for the field blank but not for recoveries.
2.4 Air mass backward trajectory
To investigate the influences of air mass on urban aerosols of Beijing, 3 d backward trajectories starting at 300 every 6 h were calculated for each sample using the HYSPLIT4 model (http://ready.arl.noaa.gov/HYSPLIT.php, last access: 28 August 2021). Cluster analyses were applied to estimate the influence of air mass. As shown in Fig. S1 in the Supplement, seven clusters were determined. Air mass from south, southeast, and northeast of Beijing accounted for >70 %. Especially, for pollution days, retroplumes of air masses were calculated by the FLEXPART (FLEXible PARTicle dispersion) model (Fig. S2 in the Supplement). Detailed information about the model was described in a previous study (Wei et al., 2018). The model was set with a height of 300 and 3 d backward trajectories.
2.5 Ancillary parameters
The ground surface concentrations of PM2.5, CO, SO2, NO2, and O3 were obtained from the monitor station of the Olympic Center (39.98∘ N, 116.40∘ E) about 3 km away from our sampling site, which is available on national urban air quality and real-time publishing platforms (http://106.37.208.233:20035/, last access: 28 August 2021). The hourly levels of these parameters are shown in Fig. S4 in the Supplement.
Meteorological parameters (wind speed, wind direction, temperature, and relative humidity) at the sampling site during the observation period are shown in Fig. 1. These meteorological parameters have been reported in a previous study (Zhao et al., 2017). The prevailing winds at 8 m were either easterly or westerly, while at 120 and 260 m the wind directions were dominated by northerlies. Wind at the ground surface (8 m) was weaker than that at upper layers, which was likely related to the influences of surrounding buildings near the sampling site. Some high buildings are several hundred meters away from the sampling site. Vertical differences in wind speeds and directions suggest that samples collected at 8 m are more related to local source emissions, whereas samples collected at upper layers are more influenced by the regional scale. Air temperature decreased slightly with the height, while relative humidity (RH) increased. This feature possibly plays a role in the vertical profile of the gas-to-particle partitioning of organic aerosols (Sun et al., 2015).
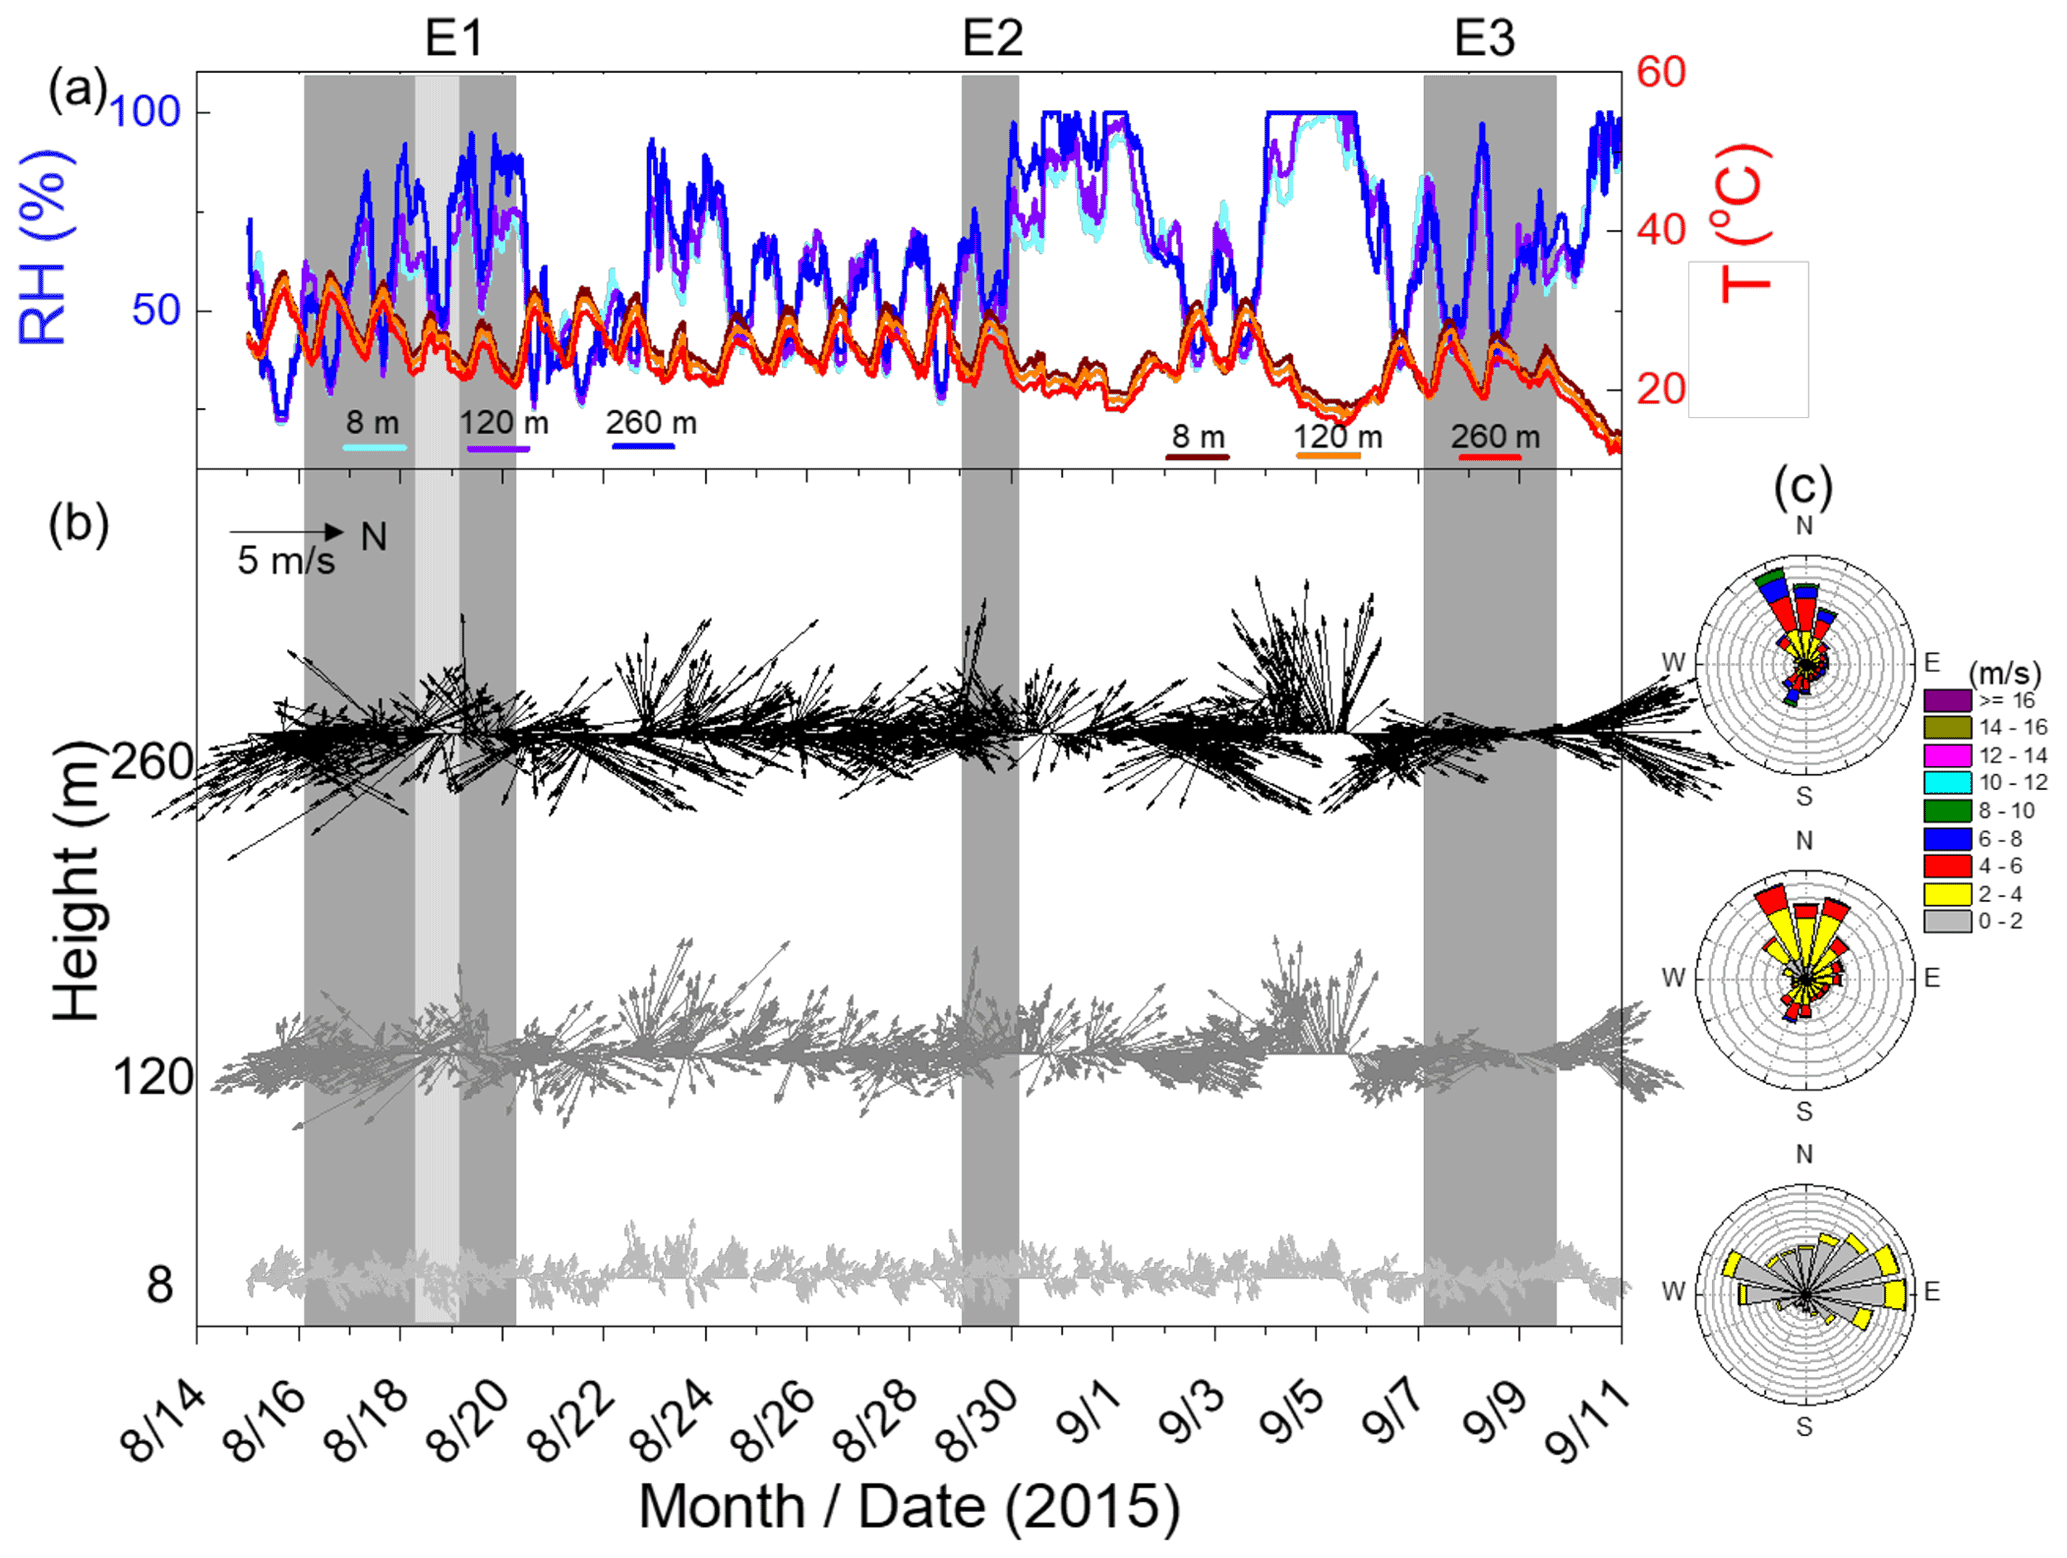
Figure 1Temporal series of vertical meteorological parameters including (a) relative humidity (RH) and temperature (T), (b) wind direction (WD) and wind speed (WS), and (c) wind roses. Three pollution events (including E1 to E3) are indicated by grey shading (E1: 16 to 19 August; E2: 29 August; and E3: 7 to 8 September). The light grey shading during E1 is a short rain event that reduced the loading of OA in aerosols. N represents the northern wind.
Three pollution episodes (marked as E1, E2, and E3) were recorded during the sampling period. The pollution episodes were defined according to a previous study (Zhao et al., 2017) and the air quality index (AQI) from the Chinese national environmental monitoring center (http://www.cnemc.cn, last access: 28 August 2021). The prevailing winds during these pollution episodes varied with height between 8 and 260 m (Fig. S3 in the Supplement). The wind in the upper layers (120 and 260 m) was mainly from the south, whereas at the ground surface layer (8 m) it was from the north. Similar to the air mass footprints (Fig. S2), these results suggest that the air masses from the southern region significantly contributed to the haze pollution in Beijing (Zheng et al., 2015; Tian et al., 2019).
The concentrations of WSOC and OC were 2.73±1.31 and 5.03±2.28 µg C m−3 at 260 m, 2.69±1.55 and 5.32±2.88 µg m−3 at 120 m, and 2.03±0.99 and 4.37±1.69 µg m−3 at 8 m, respectively (Fig. S4 and Table S1 in the Supplement). There were no significant differences between the average concentrations of WSOC and OC at the three layers (Table S2 in the Supplement). However, the fractions of WSOC to OC at the upper layers (120 and 260 m: 51.1 % and 54.0 %, respectively) were higher than that at 8 m (46.9 %) (Table S1). The correlation coefficient values (R2) between WSOC and OC were also higher at upper layers: 0.96, 0.93, and 0.47 at 260, 120, and 8 m, respectively (Fig. S5 in the Supplement). These results reveal a predominant contribution of secondary sources to OA at the upper layers, indicating that organic aerosols in the upper layers were more oxidized than in the ground surface layer. This highlights the importance of investigating the vertical profiles of SOA in the UBL. In addition, primary sources from local dust and soil resuspension, such as primary biological aerosols which contain a high abundance of water-insoluble organic compounds (Wang et al., 2019), potentially caused the lower fractions of WSOC to OC at the ground surface than at the upper layers.
Concentrations of identified secondary organic compounds are shown in Table S1, including BSOA tracers (isoprene, monoterpene, and sesquiterpene oxidation products), ASOA tracers (2,3-dihydroxy-4-oxopentanoic acid (DHOPA) and phthalic acid for toluene and naphthalene oxidation products, respectively), polyacids, and aromatic acids in the aerosols at three heights. Most of these molecular tracers showed a higher abundance at high layers (≥120 m) than at 8 m, except for pinic acid (PA), pinonic acid (PNA), 3-acetyladipic acid, and β-caryophyllinic acid. Table S2 shows significant differences in the average concentrations of these SOA tracers with height, except for monoterpene SOA tracers. Many factors can regulate the vertical profiles of SOA: (1) lower temperature and higher RH at the upper layers than the ground surface layer are potentially favorable to the condensation of semi-volatile organic compounds onto particles (Carlton et al., 2009; Hallquist et al., 2009); (2) local emission, regional transport, and vertical mixing can influence the relative loading and fraction of SOA in aerosols (Brown et al., 2013); and (3) atmosphere oxidation capacity can also play a role in the formation of SOA (H. Wang et al., 2018). Thus, vertical distributions of SOA can be useful for investigating the atmospheric behavior of aerosols in the UBL.
3.1 Vertical characteristics of SOA tracers
3.1.1 Emissions of BVOCs
Vegetation species, plant growth stage, and environmental conditions can impact the release of BVOCs (Wang et al., 2003; Benjamin et al., 1997), which contribute to the vertical profiles of BSOA tracers. Northwest China is mainly grasslands or barren lands, while other areas of China, especially the south of China, are rich in terrestrial plants (Ran et al., 2012). The emission inventory showed that in summer a large amount of BVOCs were mainly emitted from the northeast, north, and southeast regions with only a small amount from southwest China (Yan et al., 2005). Isoprene is one of the most abundant non-methane VOCs, mostly emitted by broadleaf plants (deciduous or evergreen trees) and marine phytoplankton (Sharkey et al., 2008). Back trajectories showed that 70 % of the air masses originated from the south or northeast regions of Beijing (Fig. S1), suggesting isoprene oxidation products were potentially influenced by the regional-scale emissions of BVOCs from these regions. Monoterpenes are mainly emitted from needle leaf trees (e.g., coniferous plants), and the emissions from soil and litter in local places may be larger than those from vegetation (Faiola et al., 2014). Sesquiterpenes are mainly emitted from plants and trees, which are controlled by many factors, such as temperature and stage of plant growth (Duhl et al., 2008; Faiola et al., 2019). The different contributions from various BVOC emissions are one possible factor that influences the observed vertical profiles of BSOA tracers. Terrestrial vegetation can emit a broad spectrum of BVOCs. Ambient temperature, solar radiation, soil moisture, and pollution situation can also affect their formation processes and concentrations in the atmosphere. In addition, oxidation processes (such as reaction rates and lifetime) simultaneously control the properties of BSOA in the atmosphere (Jaoui et al., 2007; Tarvainen et al., 2005).
3.1.2 Vertical distribution of BSOA tracers
The total concentrations of BSOA tracers were 31.5±16.8, 36.4±26.1, and 50.2±27.0 ng m−3 at 8, 120, and 260 m, respectively (Table S1). The vertical distribution properties of BSOA tracers are related to complicated factors, such as regional transport and ambient temperatures influencing different BSOA species (Goldstein et al., 2009). The total concentrations of isoprene SOA tracers were 19.7±12.0, 27.1±22.4, and 38.7±24.1 ng m−3 at 8, 120, and 260 m, respectively, among which C5-alkene triols (the sum of cis-2-methyl-1,3,4-trihydroxy-1-butene, 3-methyl-2,3,4-trihydroxy-1-butene, and trans-2-methyl-1,3,4-trihydroxy-1-butene) were the most abundant compounds, followed by 2-methylerythritol (2-MTeryth), 2-methylthreitol (2-MTthrei), and 2-methylglyceric acid (2-MGA) (Table S1). The total concentrations of monoterpene SOA tracers were 10.5±5.18 ng m−3 (8 m), 8.45±3.68 ng m−3 (120 m), and 10.5±3.86 ng m−3 (260 m). Pinonic acid was the most abundant species at 8 m, whereas 3-methyl-1,2,3-butanetricarboxylic acid (MBTCA) was the dominant compound at 120 and 260 m. The concentrations of the sesquiterpene SOA tracer (β-caryophyllinic acid) were 1.32±0.63, 0.89±0.89, and 1.02±0.69 ng m−3 at 8, 120, and 260 m, respectively. The abundance of isoprene SOA tracers increased with height, while there was no significant variation in the concentrations of the monoterpene and sesquiterpene SOA tracers.
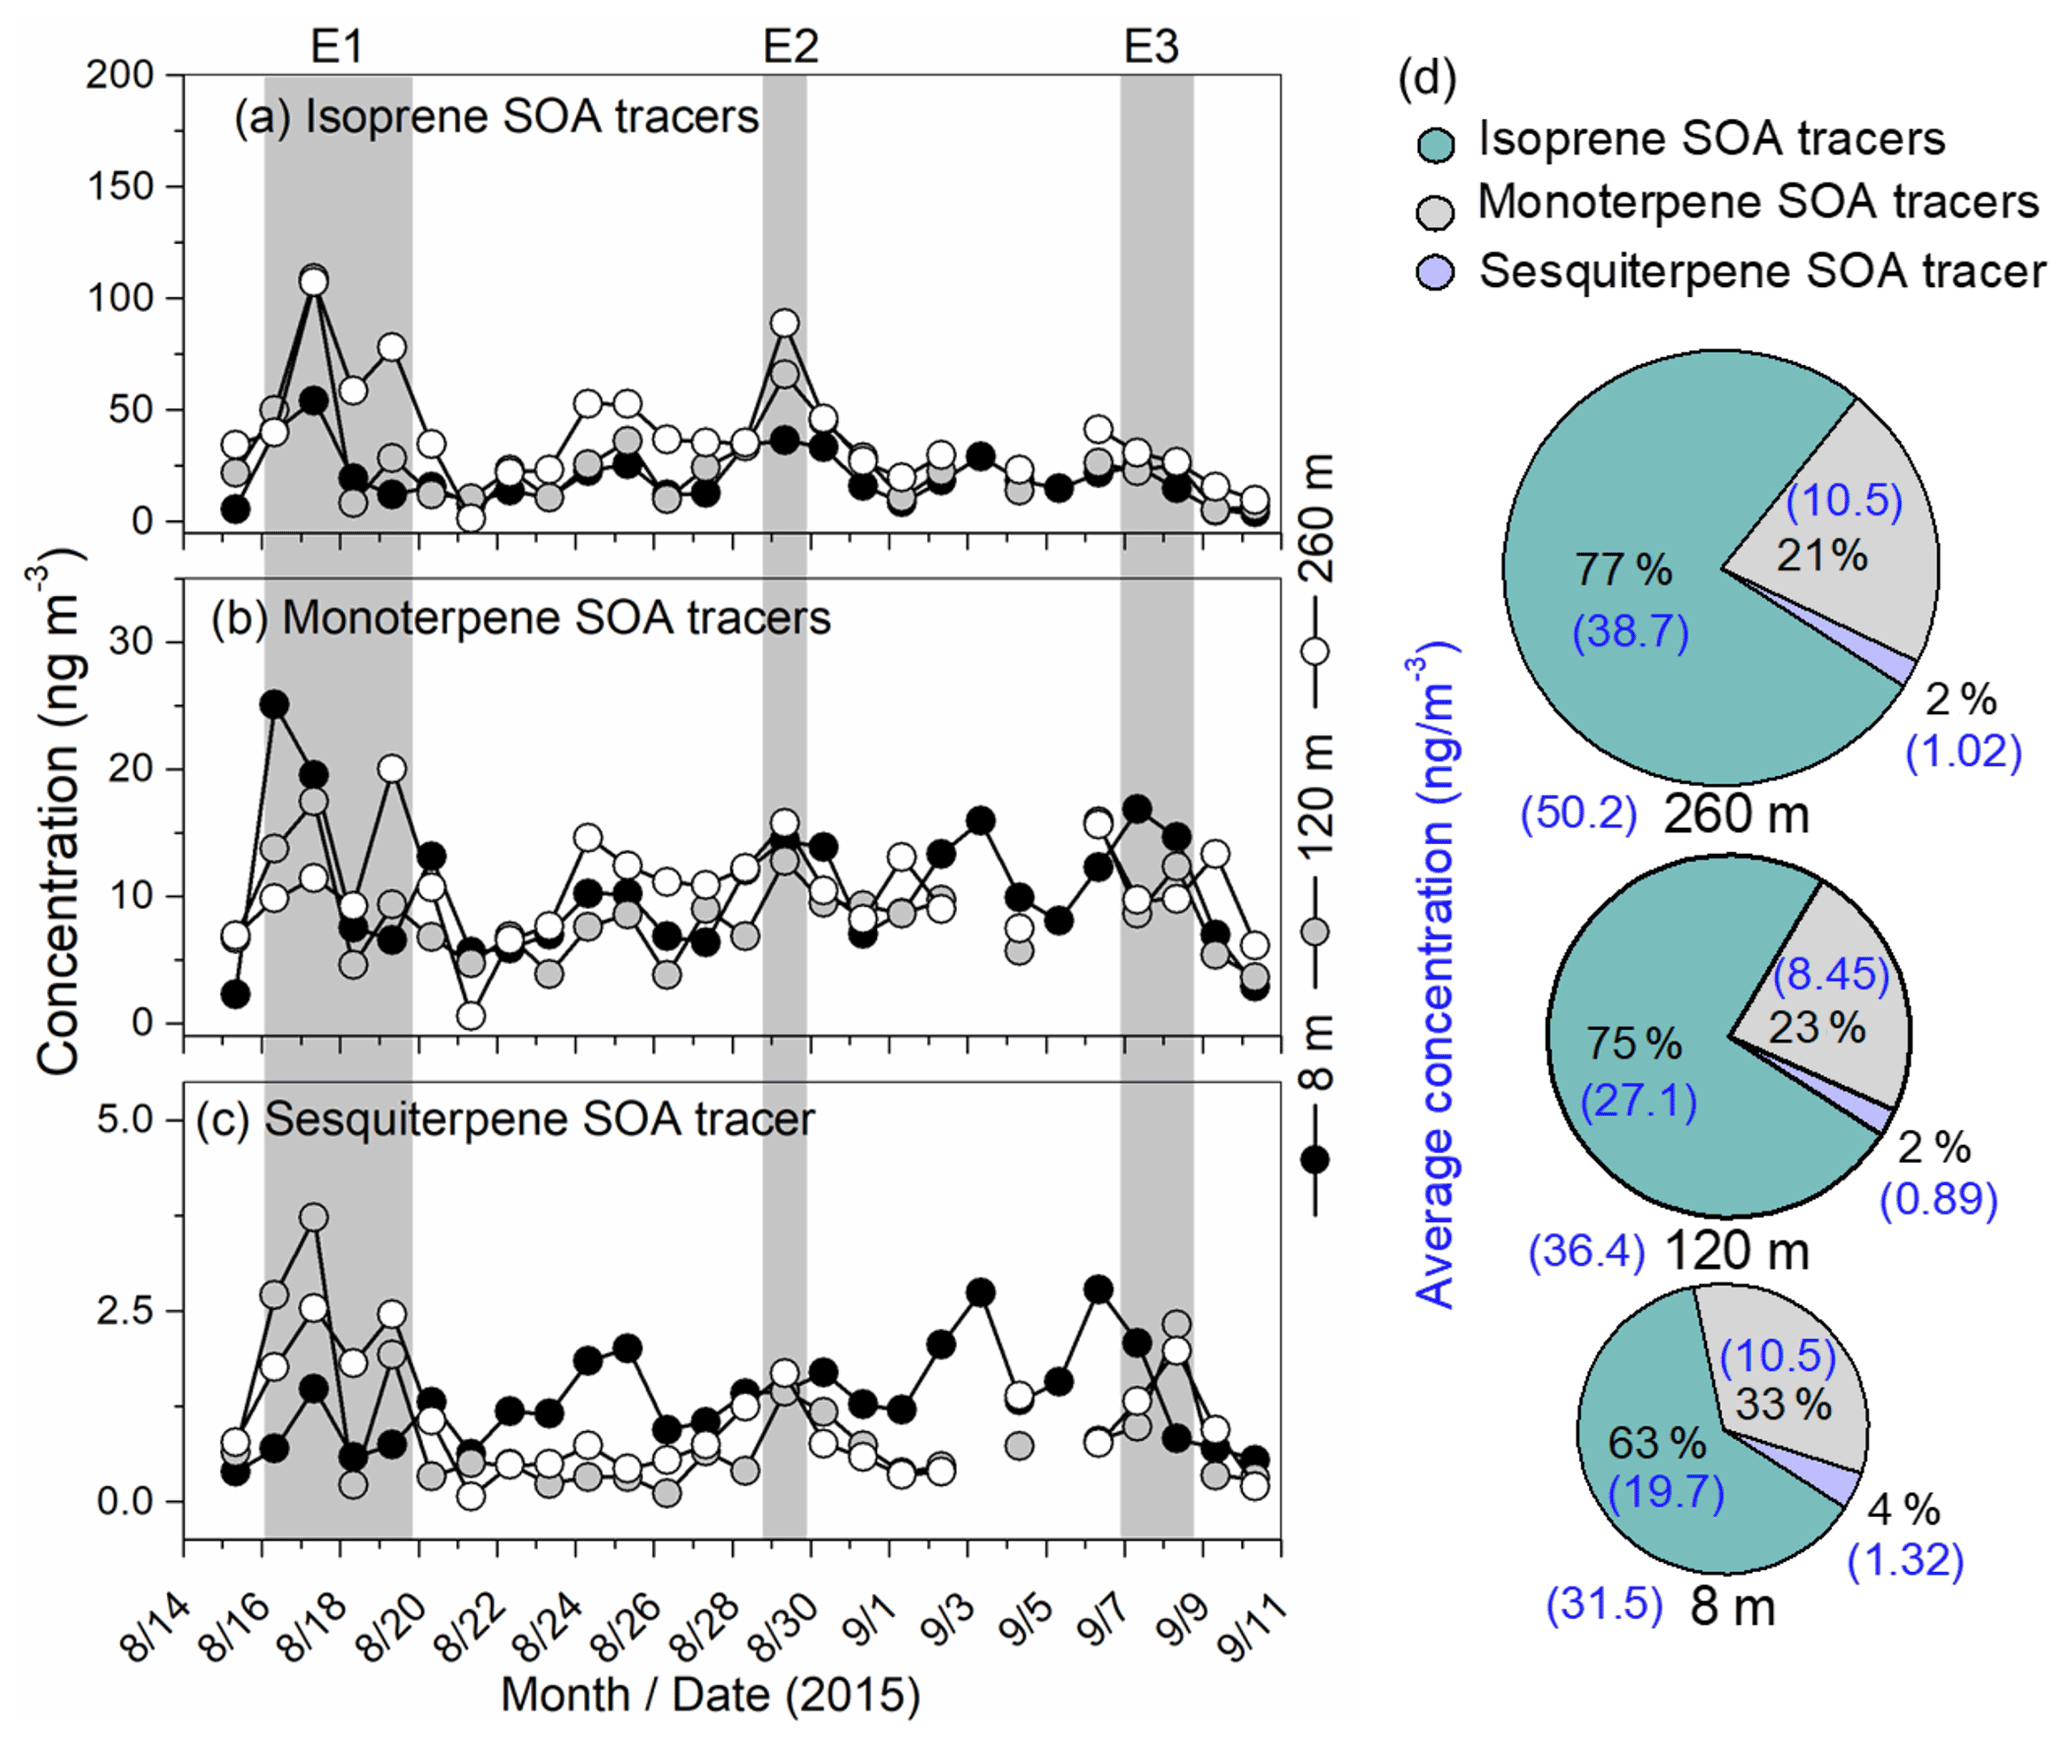
Figure 2Vertical and temporal variations in BSOA tracers from (a) isoprene, (b) monoterpenes, and (c) sesquiterpene. Measurement heights were at 8 m (solid circles), 120 m (grey circles), and 260 m (open circles). Relative mass fractions are shown in (d).
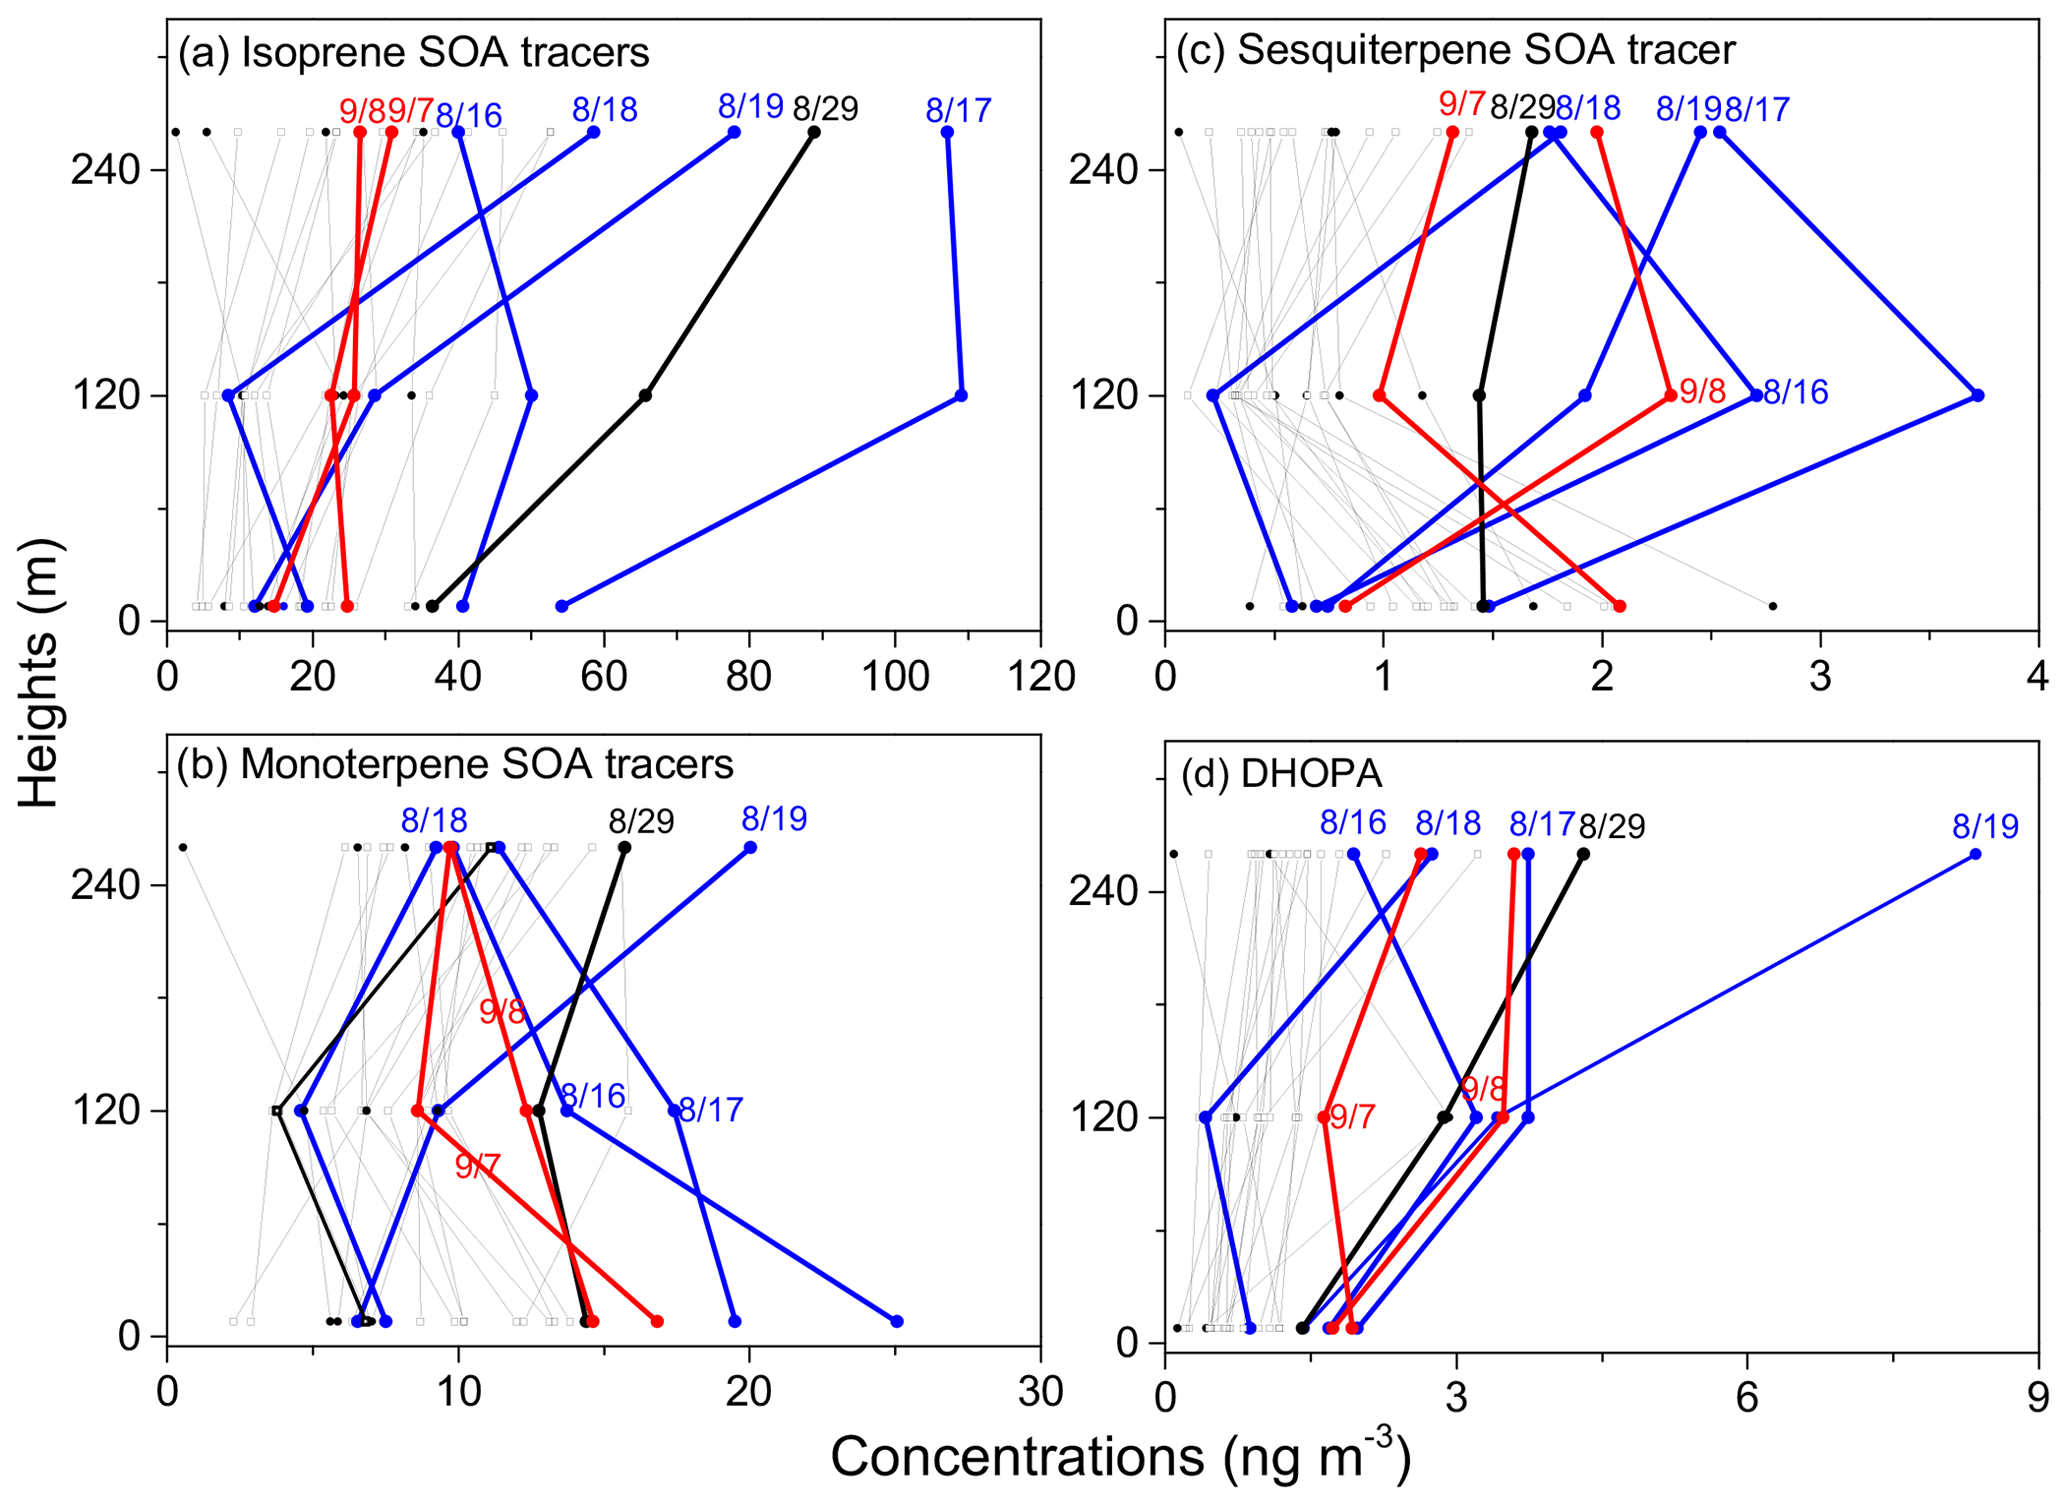
Figure 3Vertical profiles in the concentrations of SOA tracers from (a) isoprene, (b) monoterpenes, (c) sesquiterpene, and (d) DHOPA in daily samples collected at three heights. The samples collected during E1, E2, and E3 periods are marked with bold blue, black, and red lines, respectively. The sampling date during the pollution days is also marked.
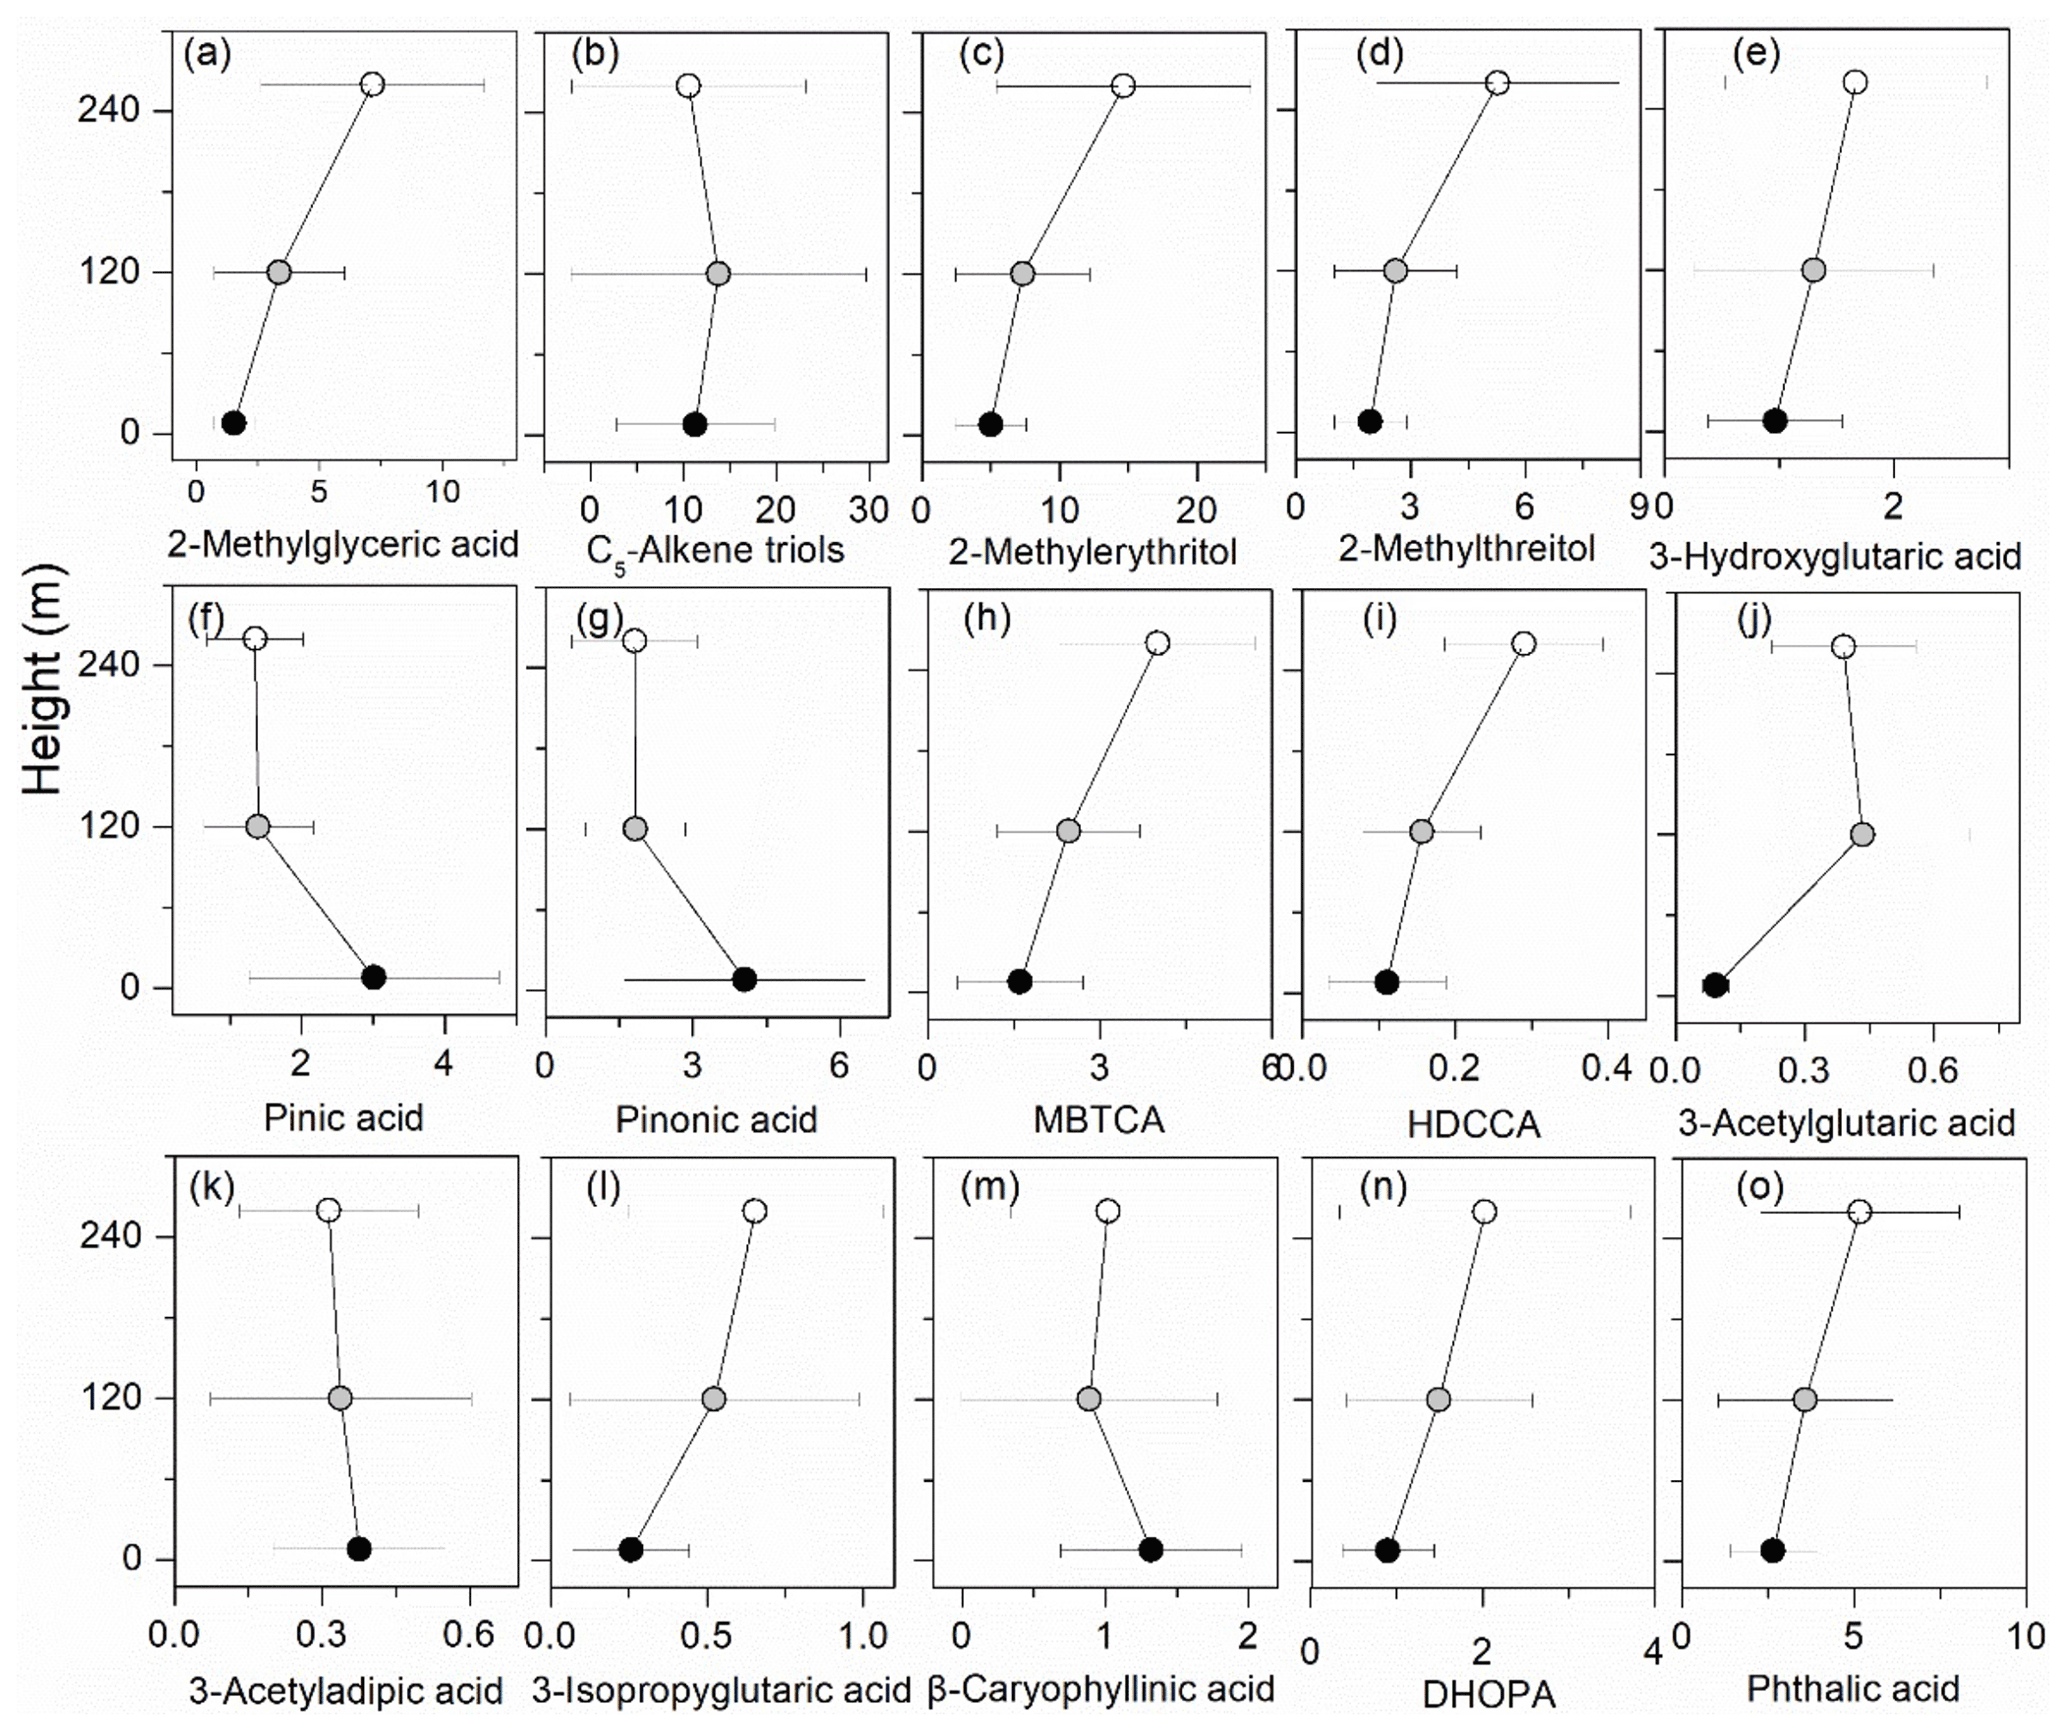
Figure 4Vertical distributions of the average concentrations of SOA tracers from (a–d) isoprene, (e–i) monoterpenes, (m) β-caryophyllinic acid, (n) dihydroxy-4-oxopentanoic acid (DHOPA), and (o) phthalic acid in PM2.5. Panels (a–m) and (n–o) are tracers of BSOA and ASOA, respectively (HDCCA is the abbreviation of 3-(2-hydroxyethyl)-2,2-dimethyl-cyclobutane carboxylic acid).
The time series of the concentrations of BSOA from isoprene, monoterpenes, and sesquiterpene at the three layers and their relative contributions are shown in Fig. 2 and Fig. S6 in the Supplement. Their vertical patterns are also shown in Figs. 3 and 4. Generally, isoprene SOA tracers increased with height, while the other two kinds of SOA tracers varied slightly with height. From 8 to 260 m, the contributions of total BSOA tracers by isoprene SOA tracers increased from 63 % to 77 %, while the fractions from monoterpene SOA tracers and the sesquiterpene SOA tracer decreased from 33 % to 21 % and 4 % to 2 %, respectively (Figs. 2d and S7 in the Supplement). It indicates that oxidized products from isoprene are more important contributors to SOA in Beijing over the late summer than other BVOC products. It suggests that regional transport potentially contributes more to isoprene SOA, while SOA from monoterpenes and sesquiterpene is likely more influenced by local sources. In addition, some other factors (such as transformation and condensation processes) can also lead to these patterns. Our results are in agreement with the field observations over the United States and the modeled vertical distributions of isoprene-derived SOA, that is, high loadings of SOA from isoprene oxidation occurred above the surface layer (Zhang et al., 2007; Goldstein et al., 2009). In particular, each kind of BSOA tracer displayed different temporal and vertical distributions (Figs. S6 and 4). These features are potentially influenced by many causes. The predominant reason is likely related to local emissions and regional transport (Du et al., 2017). Secondly, the mixing of heights (Q. Wang et al., 2018) and meteorological conditions of the atmosphere (Ding et al., 2011) is potentially another important factor. Moreover, oxidation processes (Claeys et al., 2004; Szmigielski et al., 2007) and emissions (Wang et al., 2008; Faiola et al., 2014) of BVOCs can also cause this complex vertical profiles of SOA.
3.1.3 Vertical variations in the photooxidation of BSOA tracers
Isoprene SOA tracers are the photooxidation products of isoprene with atmospheric oxidants (e.g., OH, O3, and NOx). The isoprene oxidation mechanisms are dependent on atmospheric conditions (Bates and Jacob, 2019; Wennberg et al., 2018). These processes are influenced by many factors, such as atmospheric conditions (humidity, temperature, and solar radiation) and the acidity of aerosols (Claeys et al., 2004; Kleindienst et al., 2009; Nguyen et al., 2015; Surratt et al., 2010). Specifically, 2-MGA is mainly formed under a high NOx level, while 2-MTs (the sum of 2-MTeryth and 2-MTthrei) are formed under a low NOx level. The ratio of 2-MTs to 2-MGA can reflect the impacts of NOx loading on the isoprene oxidation processes (Surratt et al., 2010). In this study, the average ratio of 2-MTs to 2-MGA was 5.20±2.24 at 8 m, higher than that at 120 m (3.80±1.95) and 260 m (3.15±1.83) (Fig. 5a). The lower ratio aloft suggested aerosols transported from other polluted regions with higher NOx levels contributed to the isoprene oxidation products in the upper-layer aerosols of Beijing. The impacts of other factors (e.g., relative humidity, temperature, and oxidizing capacity) on the heterogeneous oxidations of isoprene cannot be ignored (H. Wang et al., 2018).
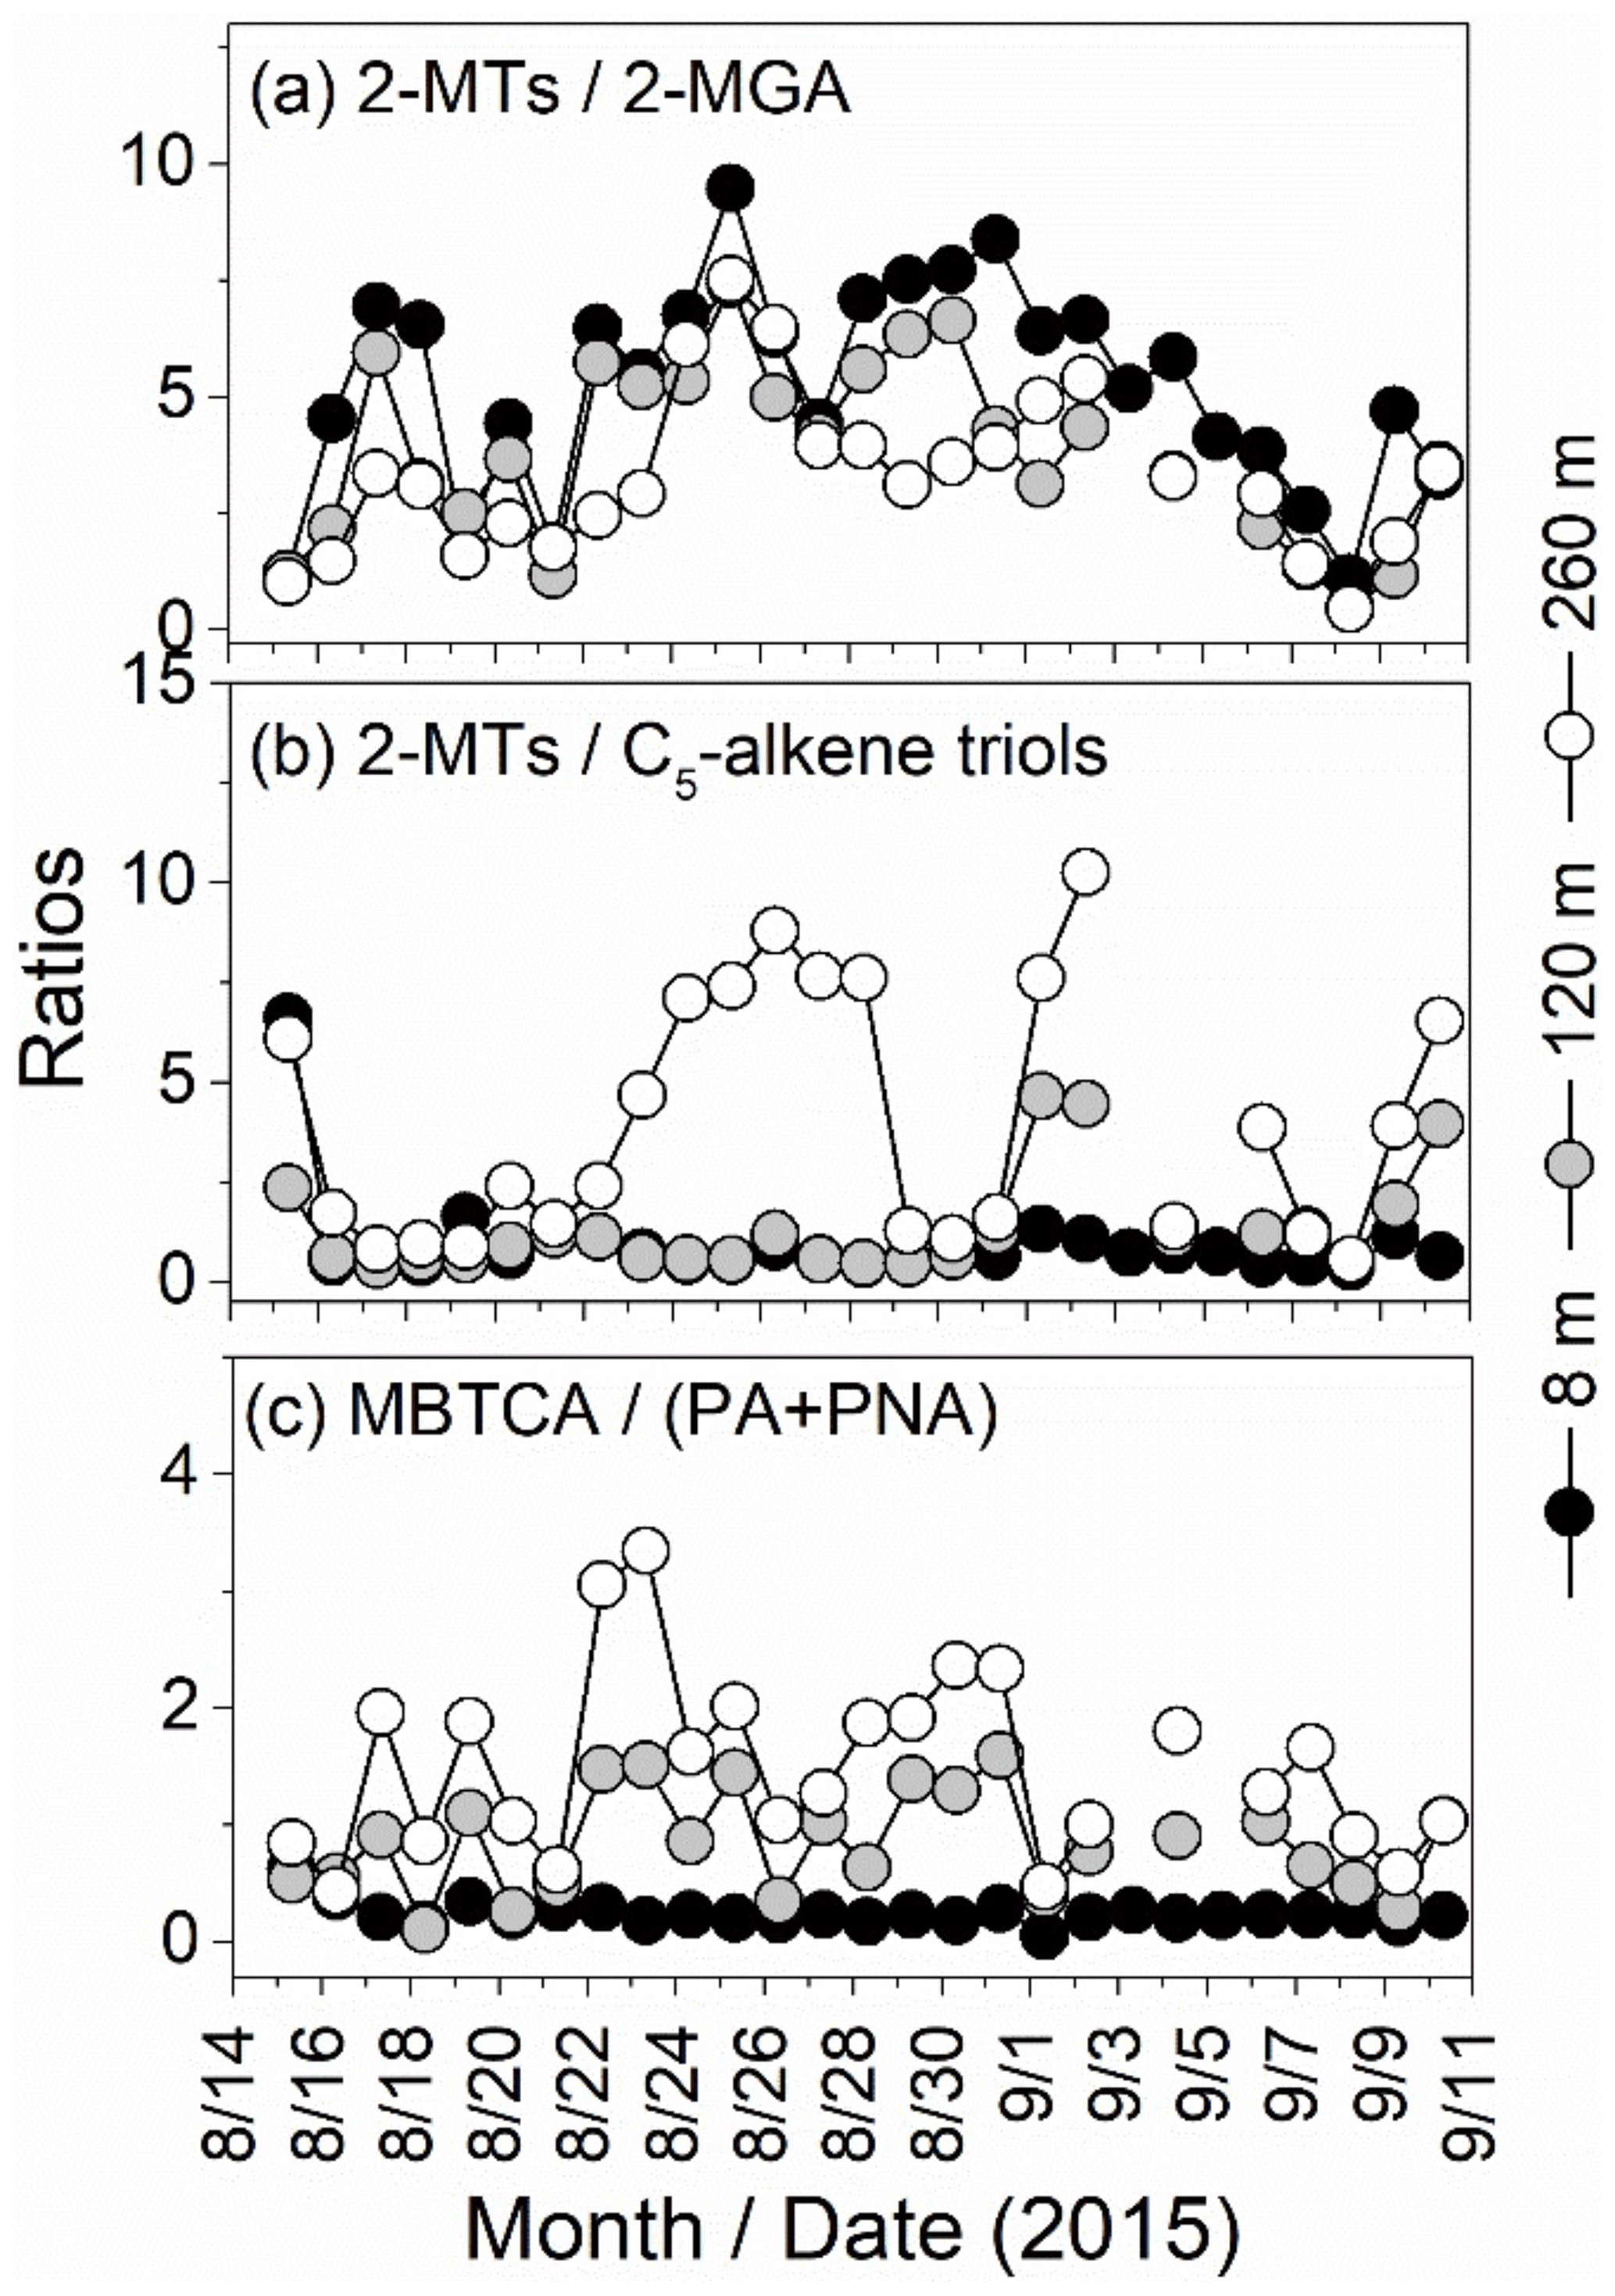
Figure 5Temporal variations in the mass concentration ratios among different biogenic SOA tracers in PM2.5: (a) 2-MTs2-MGA; (b) 2-MTsC5-alkene triols, and (c) MBTCA(PA + PNA).
The average ratios of 2-MTs to C5-alkene triols were 0.97±1.17, 1.33±1.24, and 3.97±3.08 at 8, 120, and 260 m, respectively (Fig. 5b). Both C5-alkene triols and 2-MTs can be formed from epoxydiol (IEPOX) derivatives of isoprene (Wang et al., 2005). Some studies also suggested that the loading of 2-MTs increased with the enhancement of aerosol acidity (Surratt et al., 2007), and the relative humidity can affect the ratio of 2-MTs to C5-alkene triols (Surratt et al., 2010). Recent studies suggested the ratio of 2-MTs to C5-alkene triols decreased with aerosol acidity (Yee et al., 2020), and C5-alkene triols were likely formed from thermal degradation of 2-methyltetrol sulfates for GC/MS artifacts (Cui et al., 2018). Hence, it is difficult to explain the different ratios of 2-MTs to C5-alkene triols at three heights. It also suggests that more field observations on the ratios of SOA tracers are needed.
Eight monoterpene SOA tracers have been identified here, with pinonic acid (PNA), pinic acid (PA), and MBTCA being the dominant compounds (Table S1). The different temporal and vertical patterns of these tracers are displayed in Figs. S6 and 4. MBTCA can be produced by further oxidations of PNA and PA by OH radical (Szmigielski et al., 2007; Ding et al., 2016). Thus, the ratio of MBTCA to (PNA+PA) can represent the aging extent of monoterpene-derived SOA. The ratio of MBTCA to (PNA + PA) at 8 m (0.24±0.10) was lower than those at 120 m (0.84±0.44) and 280 m (1.49±0.77) (Figs. 5d and S7), indicating that SOA from monoterpenes was much fresher at the surface than the upper layers. These results suggested that the lower height (8 m) was more relevant for local fresh aerosols, whereas the higher layer (260 m) was more subject to regional aged aerosols, and the middle layer (120) was likely the mixed influence of local and regional aerosols. This conclusion can also be supported by the more significant correlation between PNA and MBTCA at 8 m than those at 120 and 260 m (Fig. S8 in the Supplement).
β-Caryophyllinic acid is produced by the oxidation of β-caryophyllene emitted from trees and plants (Jaoui et al., 2007). The average concentration of β-caryophyllinic acid decreased and then increased slightly with height (Fig. 4). This could be associated with relatively high ambient temperature (Duhl et al., 2008) or β-caryophyllene released from the soil or litter around the ground surface (Zhu et al., 2016). It is noteworthy that the correlations (r) of β-caryophyllinic acid with other SOA tracers (polyacids, aromatic acids, 2-MGA, C5-alkene triols, and 3-hydroxyglutaric acid) were stronger at 120 and 260 m than those at 8 m (Fig. S7), implying that these tracers had the same origins and were potentially associated with regional transport of aerosols at upper layers.
3.1.4 Vertical profiles of BSOA tracers during pollution events
The winds during the pollution episodes were mostly from the south of Beijing (Fig. S2), which contributed to the formation of air pollution in the city. It was also found that the variations in RH were different for E1 and E3. The southwest winds, which potentially carried high RH and pollutant air masses to urban Beijing (Q. Wang et al., 2018), likely leading to the vertical variation in RH during E1. These results suggest that E1 is likely related to regional transport. However, minor vertical variation in RH during E3 suggests complex pollution. The concentrations of EC and the ratio of ECOC (Fig. S4) showed extremely low values and varied vertically during E2 when compared with other pollution events, suggesting that E2 is largely influenced by regional transport. In addition, the increasing levels of pollution parameters (such as O3, SO2, and NO2) also contributed to the pollution episodes.
Total concentrations of BSOA tracers increased with height during the 17 and 19 August episodes (E1) and the 29 August episode (E2), and complex vertical distributions were recorded in other pollution days. The lower concentration of BSOA tracers (13.2 ng m−3) at 120 m on 18 August (E1) than average values (27.1 ng m−3) during the whole sampling period was likely related to the removal by a short-lived rain event. High abundance and increasing fractions of isoprene SOA tracers with height were recorded on 17 and 19 August (E1 and E2; Fig. 6), likely associated with the regional transport from southern areas of Beijing (Figs. S2 and S3). The lower abundance of isoprene oxidation products aloft than at the surface layer on 16 August (E1) was likely influenced by the air masses from the northwest. The same difference on 7 to 8 September (E3) was likely influenced by the air masses from the northeast. Monoterpene SOA tracers during the pollution events showed vertical patterns similar to the average values, that is, the concentrations and fractions recorded at the ground surface layer were higher than at the upper layers due to local emissions. However, their concentrations increased with height on 19 August (E1) (Fig. 3b), likely influenced by regional transport. The sesquiterpene SOA tracer showed unusually vertical distribution patterns during the episodes, that is, higher concentrations were recorded at the upper layers than at the ground surface layer (Fig. 3c), which was also associated with the regional transport.
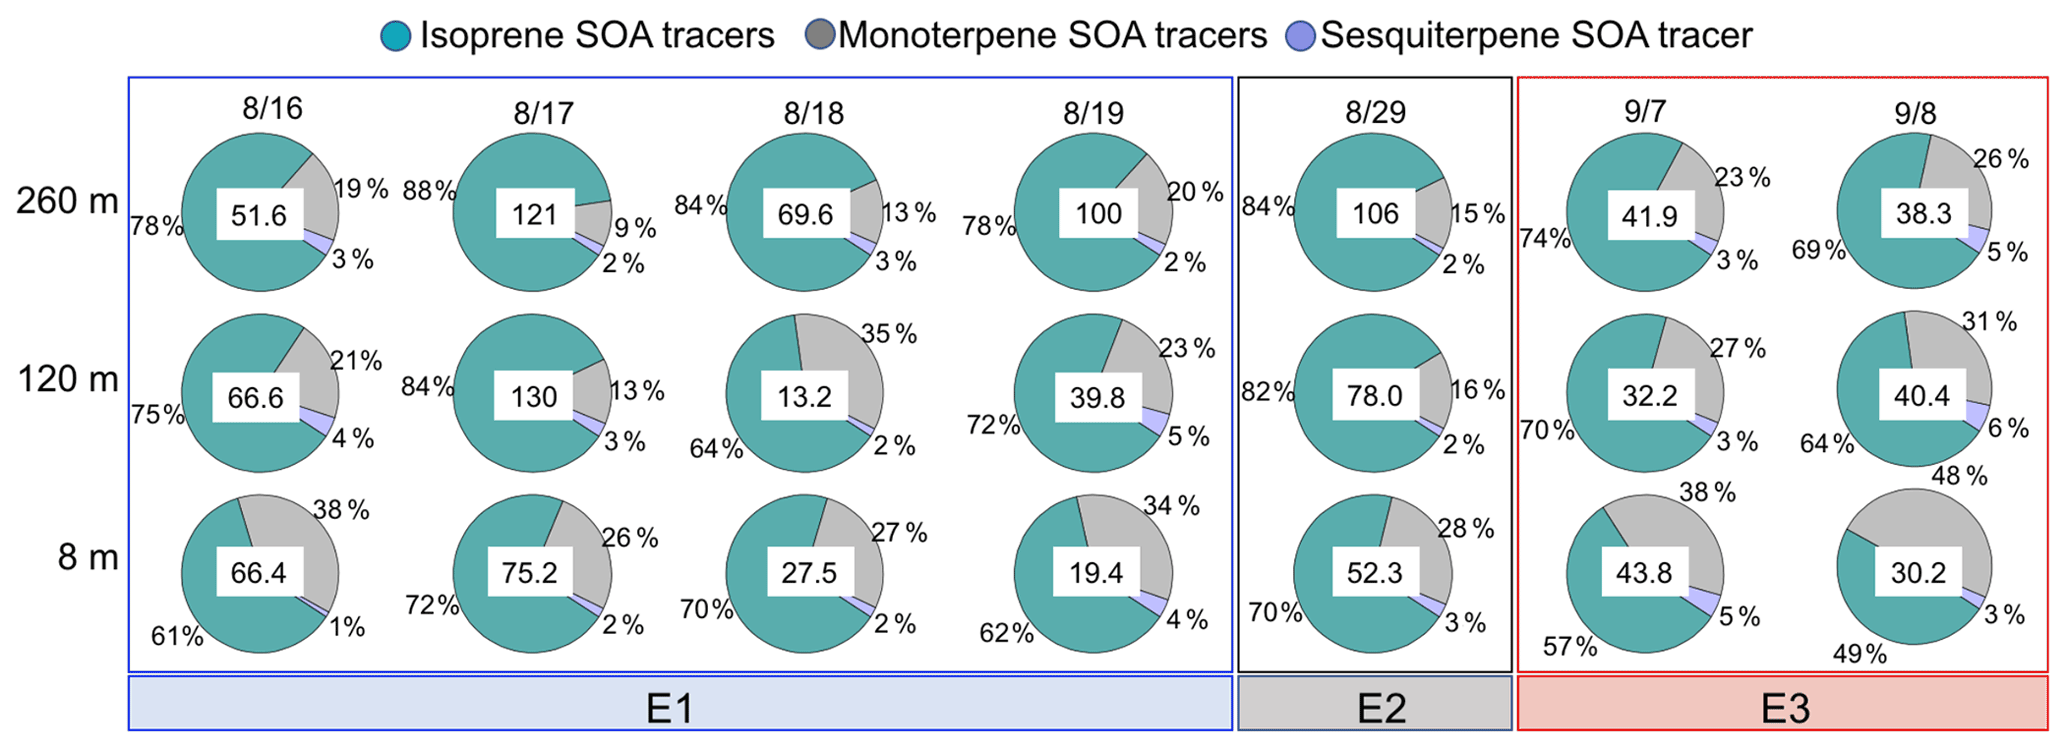
Figure 6Relative mass contributions of three kinds of BSOA tracers during the pollution days at three heights. The sum concentrations of BSOA tracers (ng m−3) are shown in the center of each pie.
The vertical patterns of BSOA tracers during the pollution events highlighted the significant roles of air mass origins, regional transport, local emissions, and oxidation processes in urban aerosols of Beijing. More field measurements are needed to address the interactions between SOA formation and the urban boundary layer. In addition, it is important to investigate the vertical profiles of ASOA and its interactions with BSOA. ASOA is a larger contributor to the loading of SOA and the formation of air pollution in urban areas (Fan et al., 2020; An et al., 2019).
3.2 Vertical profiles of DHOPA
DHOPA is an anthropogenic secondary organic compound which is often used as a tracer for toluene-derived (aromatic hydrocarbon) SOA and can only be detected in the particulate phase (Kleindienst et al., 2007; Al-Naiema and Stone, 2017). DHOPA concentrations were 0.90±0.53, 1.50±1.09, and 2.03±1.69 ng m−3 at 8, 120, and 260 m, respectively. The average concentrations at 8 and 260 m differed significantly. This vertical pattern was more obvious during pollution episodes, except for 16 August and 7 September when air masses were from the northwest and northeast (Fig. S2). Thus, the increasing abundance of DHOPA at the upper layers during the pollution episodes was most likely related to the pollutants from the southern region of Beijing.
In addition, DHOPA correlated well (r>0.7) with aromatic acids and polyacids at all of the three heights, suggesting that they had similar origins, such as anthropogenic aromatic VOCs (Ding et al., 2017; Al-Naiema and Stone, 2017). DHOPA also showed moderate correlations (r>0.5) with 2-MGA, C5-alkene triols, 3-hydroxyglutaric acid (3-HGA), and β-caryophyllene acid (Fig. S7). Previous studies have reported that urban pollution can enhance the formation of natural aerosols (Shrivastava et al., 2019); the existence of aromatic compounds can lead to high loading of α-pinene-derived SOA (Shilling et al., 2013; Zelenyuk et al., 2017). These moderate correlations also suggest that the anthropogenic sources are related to biogenic sources, and their interaction mechanisms still need more investigation.
3.3 SOC estimation by the tracer-based method
The tracer-based method is used to estimate the contributions of different sources to SOC along vertical gradients. The fraction factors for SOC from isoprene, monoterpenes, and sesquiterpene (Iso_SOC, Mon_SOC, and Sesq_SOC) are set as 0.155±0.039, 0.231±0.111, and 0.0230±0.0046, respectively, and those for toluene SOC (DHOPA as a tracer) and naphthalene SOC (phthalic acid as a surrogate) are 0.0079±0.0026 and 0.0199, respectively (Kleindienst et al., 2007, 2012). It should be noted that estimations of fraction factors in chamber processes deviate from the real atmospheric environment (Ding et al., 2014). Quantitative uncertainties, system errors, volatility of BSOA tracers, and other factors could also increase the challenge in getting a more accurate estimation of SOC.
Temporal variations in the estimated SOC and their percentages of OC at the three heights are shown in Fig. 7 and Table S3 in the Supplement. The total concentrations of these estimated SOCs were 341±150 ng C m−3 (average percentages in OC: 8.05±3.17 %), 444±283 ng C m−3 (8.60±3.66 %), and 673±385 ng C m−3 (13.4±4.81 %) at 8, 120, and 260 m, respectively. Toluene SOC was the dominant contributor to SOC (32 %, 41 %, and 35 % at 8, 120, and 260 m, respectively), followed by naphthalene SOC and BSOC. The sum of ASOC (toluene and naphthalene SOC) contributed more than 50 % of these SOCs at the three heights, and their concentrations and fractions increased with height (Fig. 7c), suggesting a significant impact of anthropogenic sources from regional transport on urban aerosols of Beijing. The average concentrations of BSOC ranged from 157 to 272 ng C m−3 and accounted for 3.80±1.46 % (8 m), 3.09±0.97 % (120 m), and 5.63±2.32 % (260 m) of OC (Table S3).
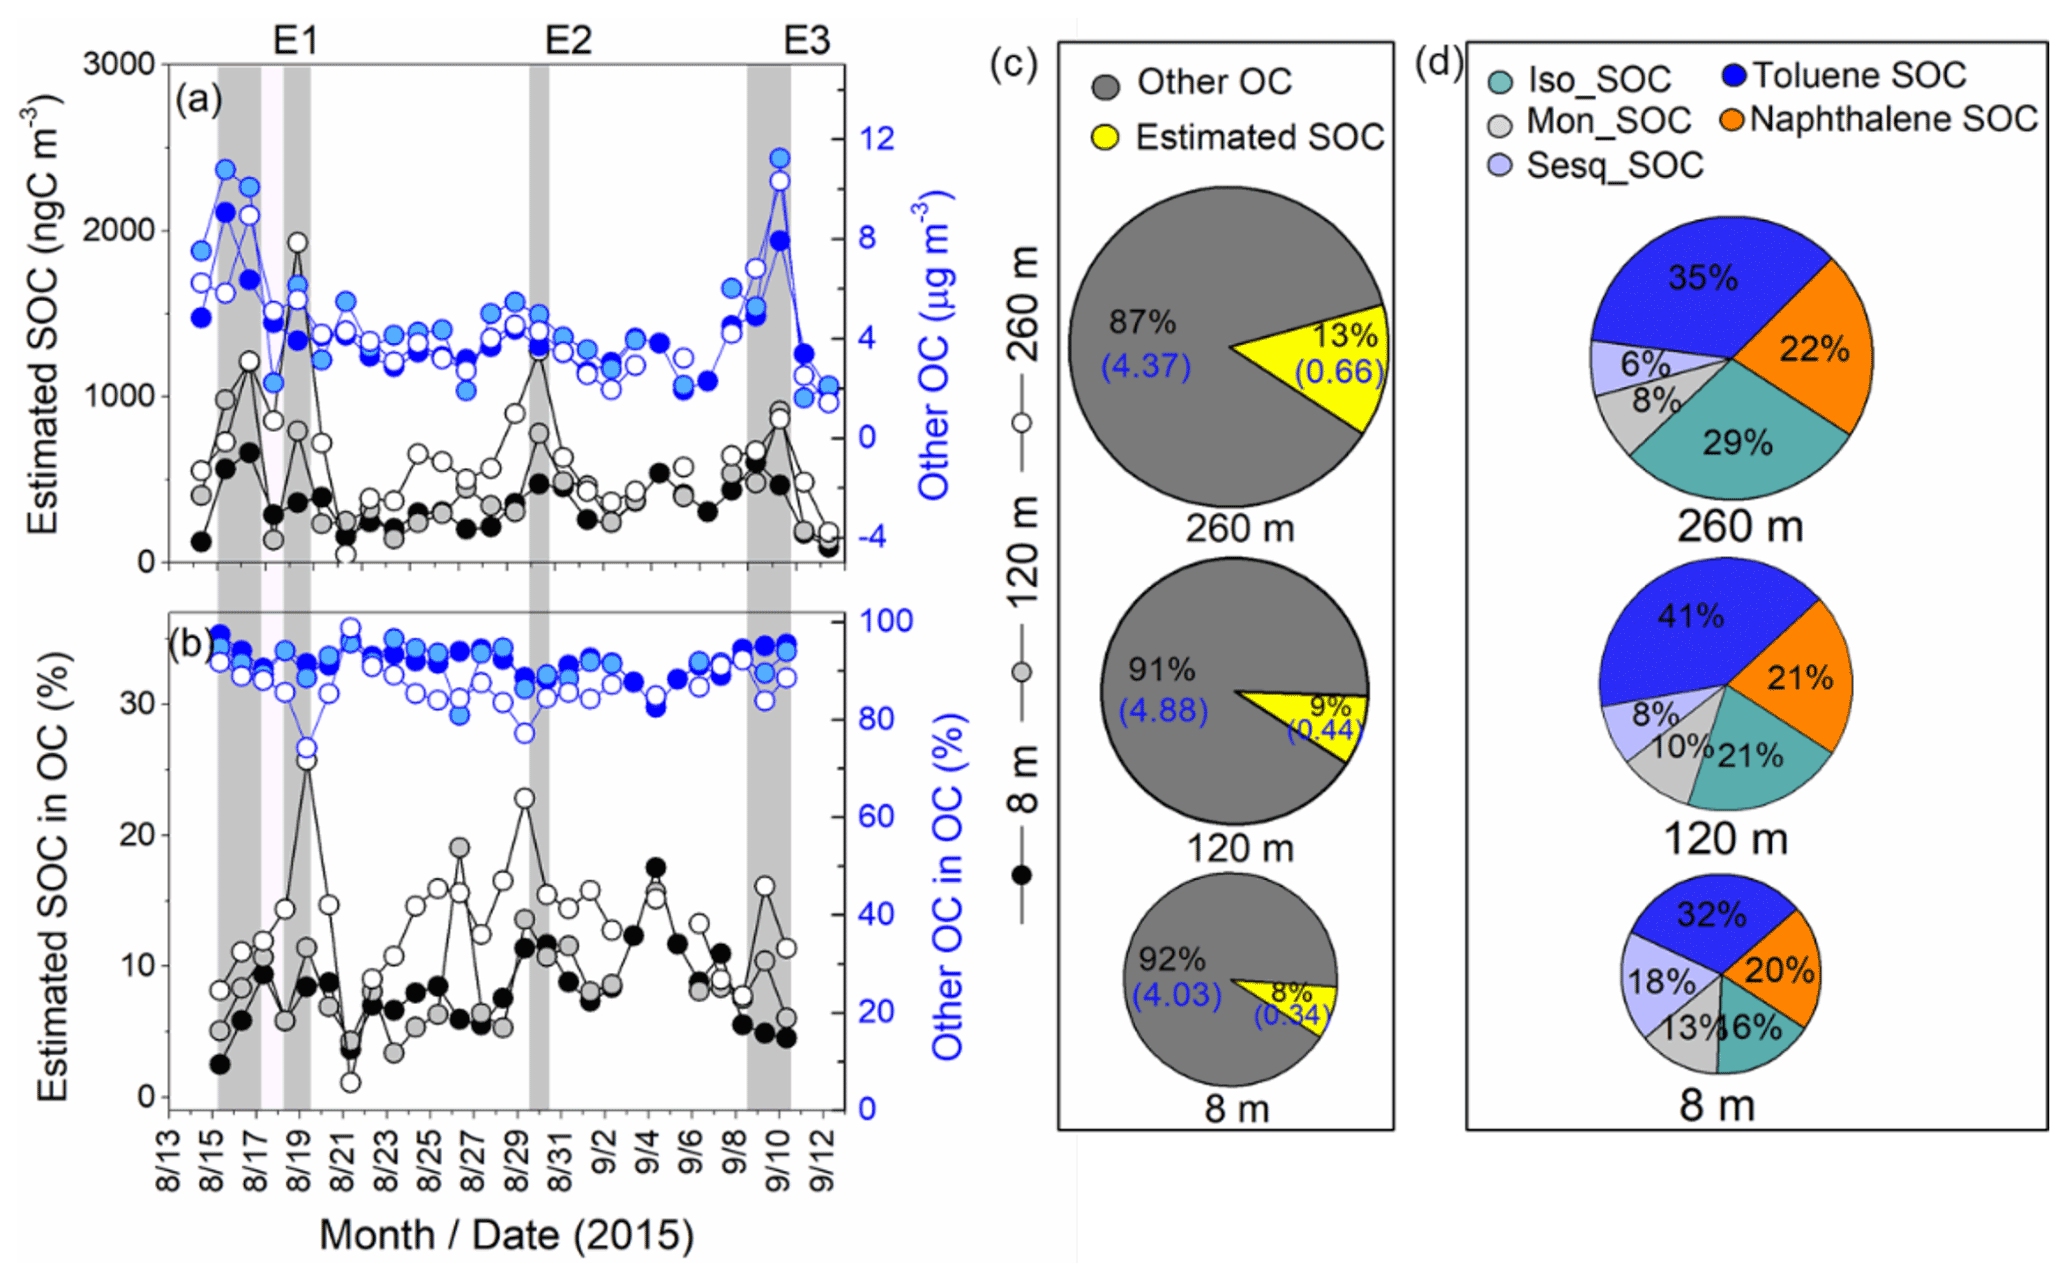
Figure 7Temporal variations in the estimated SOC and other OC at three heights: (a) the concentrations of estimated SOC (right axis) and other OC (left axis) and (b) the fraction of estimated SOC and other OC in OC. Relative mass fractions of OC and estimated SOC are shown in (c) and (d). Other OC is not captured by the source apportionment. Iso_SOC, Mon_SOC, and Sesq_SOC represent BSOC estimated from isoprene, monoterpenes, and sesquiterpene, respectively. Toluene SOC and naphthalene SOC represent anthropogenic SOCs (ASOC) that were estimated by DHOPA and phthalic acid, respectively.
BSOC showed different fractions at the three layers. Iso_SOC fractions at the upper layers were higher than those at the ground surface, while Mon_SOC and Sesq_SOC fractions at the ground surface were the highest (Fig. S8). These features illustrate the large contribution of regional transport to isoprene-derived SOC above the surface layer, while monoterpenes and sesquiterpene were likely influenced by local emissions. Consequently, the fractions of toluene SOC and Iso_SOC increased with height, Mon_SOC and Sesq_SOC fractions decreased with height and naphthalene SOC fractions were similar at the three heights, suggesting that the regional transport is rich in toluene SOC and Iso_SOC. In addition to the influence of local emissions and regional transport, meteorological conditions, atmosphere turbulence, and UBL structure also cannot be ignored.
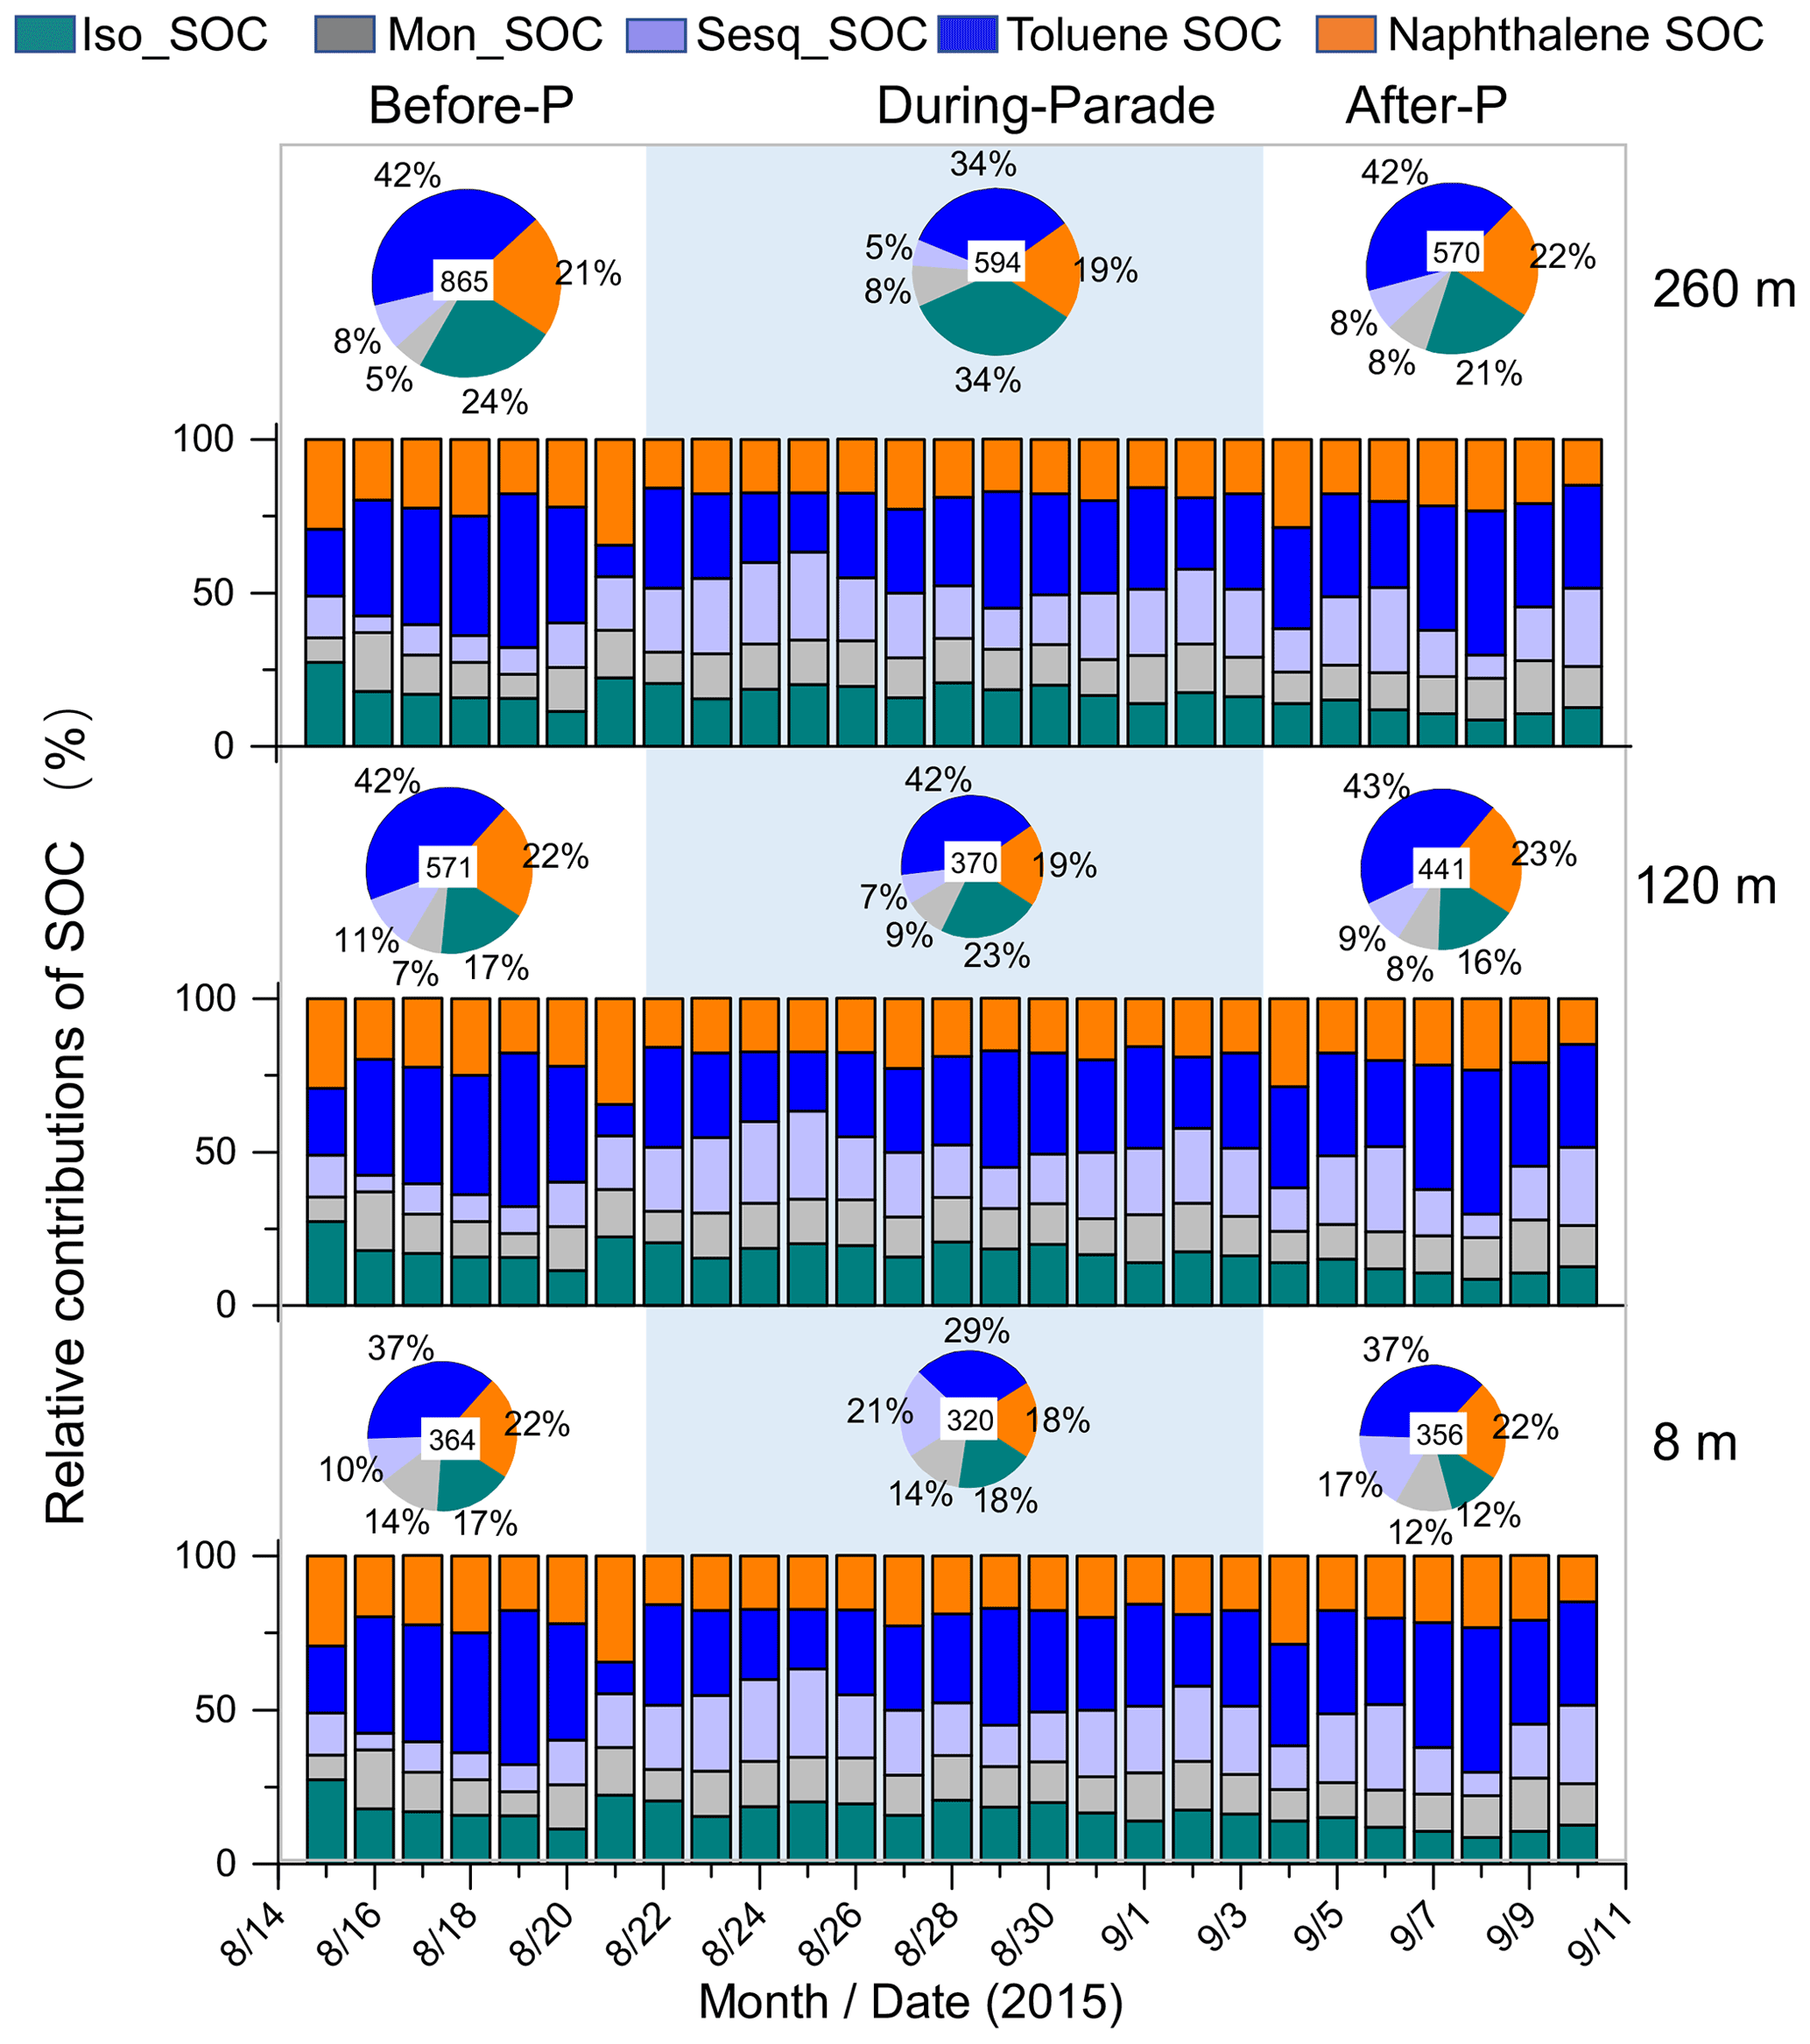
Figure 8Temporal variation in mass fractions of estimated SOC in PM2.5 and its relative contributions during three periods (Before-P means before parade, During-P means during parade, and After-P means after parade) at three heights. The values in the center of the pies represent the average concentrations of estimated SOC, and the sizes of the pies are related to the concentrations.
3.4 Impacts of emission controls on estimated SOC loadings
The average concentrations of estimated SOC before, during, and after the parade (marked as Before-P, During-Parade, and After-P, respectively) are shown in Fig. 8. The estimated SOC concentrations during the parade (320±111, 370±163, and 594±264 ng C m−3 at 8, 120, and 260 m, respectively) decreased by ∼12 % (364±199 ng C m−3) and 10 % (356±177 ng C m−3) at 8 m, decreased by 35 % (571±419 ng C m−3) and 16 % (441±279 ng C m−3) at 120 m, and decreased by 31 % (864±585 ng C m−3) and increased by 4 % (570±229 ng C m−3) at 260 m when compared to the Before-P and After-P, respectively. The SOC at the upper layers decreased more than at the ground surface layer, suggesting the efficient mitigation of SOC on a regional scale. The previous studies during the same period (Zhao et al., 2017; Wu et al., 2019) showed a high frequency of southerly winds before the parade and north winds during the parade at the high layers. It suggests that the north winds were also an important reason for the reduction in SOC during the parade.
We found that the fractions of ASOC decreased and Iso_SOC increased as a response to the emission controls. The ASOC fractions at 8 m were 59±8 % (Before-P), 47±5 % (During-Parade), and 57±8 % (After-P), and Iso_SOC fractions were 18±5 %, 18±2 %, and 12±2 %, respectively. The ASOC fractions at 120 m were 64±5 % (Before-P), 61±10 % (During-Parade), and 65±8 % (After-P), and Iso_SOC fractions were 17±5 %, 23±6 %, and 16±6 %, respectively. The ASOC fractions at 260 m were 63±10 % (Before-P), 53±9 % (During-Parade), and 64±9 % (After-P), and Iso_SOC fractions were 24±8 %, 34±9 %, and 21±9 %, respectively. The decreased contributions of ASOC during the control period indicated the emission controls were effective in mitigating anthropogenic sources, with the control on toluene SOC being particularly effective. However, emission mitigation was not so efficient to control BSOC, especially for Iso_SOC, implying that SOA from isoprene oxidation was potentially a more stable contributor than other VOCs in Beijing during the late summer.
Consequently, these results indicate that regional emission controls changed the aerosol SOC composition. Moreover, meteorological conditions and other factors (e.g., atmospheric oxidation state) could also impact the variations in SOC during different sampling periods, such as the wind shift before and after the parade and the complex vertical distributions of particulate nitrate (Zhao et al., 2017; H. Wang et al., 2018; Wu et al., 2019).
The vertical properties of SOA tracers in aerosols were investigated over the late summer in Beijing. The sum of BSOA tracers were 31.5±16.8 ng m−3 (8 m), 36.4±26.1 ng m−3 (120 m), and 50.2±27.0 ng m−3 (260 m). BSOA tracers from isoprene were the dominant compound, followed by monoterpenes and sesquiterpene. The fractions of isoprene SOA tracers showed an increasing vertical pattern aloft, whereas monoterpene and sesquiterpene SOA tracers showed opposite variations. These vertical characteristics of BSOA tracers were influenced by multiple factors, such as their photooxidation processes, local sources, and regional transport of their precursors. The isoprene oxidation products were largely influenced by air masses from regional transport, while monoterpene oxidation products were mainly influenced by local emission sources. The specific vertical distributions of BSOA tracers during pollution episodes suggest a significant contribution of regional transport of aerosols from the southern regions of Beijing. The average concentrations of the toluene tracer (DHOPA) were 0.90±0.53 ng m−3 (8 m), 1.50±1.09 ng m−3 (120 m), and 2.03±1.69 ng m−3 (260 m). DHOPA showed an increasing pattern aloft with larger variations during the episodes, also suggesting the regional transport from the southern regions.
Estimated by the tracer-based method, the sum concentrations of estimated SOC were 341±150 ng C m−3 (8 m), 444±283 ng C m−3 (120 m), and 673±385 ng C m−3 (260 m), with toluene SOC being the dominant compound, followed by naphthalene SOC, Iso_SOC, and other SOC. The increasing SOC aloft suggests a contribution from the regional transport. The increase in toluene SOC and Iso_SOC fraction with height indicates that the air masses subject to the regional transport were potentially rich in toluene- and isoprene-derived SOC. The implementation of joint regional prevention and control by the government can significantly reduce the amount of SOC. However, they are likely more efficient in reducing toluene SOC but not isoprene-derived SOC. Our study demonstrates the variability in SOA within the urban boundary layer and highlights that vertical profiles of SOA are critical to improving the simulation of SOA in chemical transport models.
The atmospheric particulate matter data used for analysis are available in the Supplement, and the data are also available upon request from the corresponding author Pingqing Fu (fupingqing@tju.edu.cn).
The supplement related to this article is available online at: https://doi.org/10.5194/acp-21-12949-2021-supplement.
HR, LiaW SY, JZ, LL, and WZ conducted the laboratory analysis. WH, LibW, SY, LR, MK, QX, SS, XP, ZW, YS, and KK reviewed and commented on the paper. PF designed the research. HR and PF wrote the paper.
The authors declare that they have no conflict of interest.
Publisher's note: Copernicus Publications remains neutral with regard to jurisdictional claims in published maps and institutional affiliations.
The vertical meteorological data were obtained from the Institute of Atmospheric Physics (IAP), the Chinese Academy of Sciences (CAS). The tower samples were collected with the help of the staff of IAP. Detailed tables and figures about the data in this paper are present in the supporting information. The language of this paper has been edited by International Science Editing (http://www.internationalscienceediting.com, last access: 28 August 2021).
This research has been supported by the National Key Research and Development Program of China (grant no. 2017YFC0212700), the National Natural Science Foundation of China (grant nos. 41625014, 41475117, and 41571130024), and China Postdoctoral Science Foundation (grant no. 390/0401130003).
This paper was edited by Barbara Ervens and reviewed by two anonymous referees.
Al-Naiema, I. M. and Stone, E. A.: Evaluation of anthropogenic secondary organic aerosol tracers from aromatic hydrocarbons, Atmos. Chem. Phys., 17, 2053–2065, https://doi.org/10.5194/acp-17-2053-2017, 2017.
An, Z., Huang, R., Zhang, R., Tie, X., Lia, G., Caoa, J., Zhou, W., Shi, Z., Han, Y., Guh, Z., and Ji, Y.: Severe haze in northern China: A synergy of anthropogenic emissions and atmospheric processes, P. Natl. Acad. Sci. USA., 116, 8657–8666, https://doi.org/10.1073/pnas.1900125116, 2019.
Andreae, M. O., Acevedo, O. C., Araùjo, A., Artaxo, P., Barbosa, C. G. G., Barbosa, H. M. J., Brito, J., Carbone, S., Chi, X., Cintra, B. B. L., da Silva, N. F., Dias, N. L., Dias-Júnior, C. Q., Ditas, F., Ditz, R., Godoi, A. F. L., Godoi, R. H. M., Heimann, M., Hoffmann, T., Kesselmeier, J., Könemann, T., Krüger, M. L., Lavric, J. V., Manzi, A. O., Lopes, A. P., Martins, D. L., Mikhailov, E. F., Moran-Zuloaga, D., Nelson, B. W., Nölscher, A. C., Santos Nogueira, D., Piedade, M. T. F., Pöhlker, C., Pöschl, U., Quesada, C. A., Rizzo, L. V., Ro, C.-U., Ruckteschler, N., Sá, L. D. A., de Oliveira Sá, M., Sales, C. B., dos Santos, R. M. N., Saturno, J., Schöngart, J., Sörgel, M., de Souza, C. M., de Souza, R. A. F., Su, H., Targhetta, N., Tóta, J., Trebs, I., Trumbore, S., van Eijck, A., Walter, D., Wang, Z., Weber, B., Williams, J., Winderlich, J., Wittmann, F., Wolff, S., and Yáñez-Serrano, A. M.: The Amazon Tall Tower Observatory (ATTO): overview of pilot measurements on ecosystem ecology, meteorology, trace gases, and aerosols, Atmos. Chem. Phys., 15, 10723–10776, https://doi.org/10.5194/acp-15-10723-2015, 2015.
Barrie, L. A.: Arctic air pollution: an overview of current knowledge, Atmos. Environ., 20, 643–663, 1986.
Bates, K. H. and Jacob, D. J.: A new model mechanism for atmospheric oxidation of isoprene: global effects on oxidants, nitrogen oxides, organic products, and secondary organic aerosol, Atmos. Chem. Phys., 19, 9613–9640, https://doi.org/10.5194/acp-19-9613-2019, 2019.
Benjamin, M. T., Sudol, M., Vorsatz, D., and Winer, A.: A spatially and temporally resolved biogenic hydrocarbon emissions inventory for the californina south coast air basin, Atmos. Environ., 31, 3087–3100, https://doi.org/10.1016/s1352-2310(97)00014-9, 1997.
Brown, S. S., Dubé, W. P., Bahreini, R., Middlebrook, A. M., Brock, C. A., Warneke, C., de Gouw, J. A., Washenfelder, R. A., Atlas, E., Peischl, J., Ryerson, T. B., Holloway, J. S., Schwarz, J. P., Spackman, R., Trainer, M., Parrish, D. D., Fehshenfeld, F. C., and Ravishankara, A. R.: Biogenic VOC oxidation and organic aerosol formation in an urban nocturnal boundary layer: aircraft vertical profiles in Houston, TX, Atmos. Chem. Phys., 13, 11317–11337, https://doi.org/10.5194/acp-13-11317-2013, 2013.
Carlton, A. G., Wiedinmyer, C., and Kroll, J. H.: A review of Secondary Organic Aerosol (SOA) formation from isoprene, Atmos. Chem. Phys., 9, 4987–5005, https://doi.org/10.5194/acp-9-4987-2009, 2009.
Chan, C. Y., Xu, X. D., Li, Y. S., Wong, K. H., Ding, G. A., Chan, L. Y., and Cheng, X. H.: Characteristics of vertical profiles and sources of PM2.5, PM10 and carbonaceous species in Beijing, Atmos. Environ., 39, 5113–5124, https://doi.org/10.1016/j.atmosenv.2005.05.009, 2005.
Claeys, M., Graham, B., Vas, G., Wang, W., Vermeylen, R., Pashynska, V., Cafmeyer, J., Guyon, P., Andreae, M. O., Artaxo, P., and Maenhaut, W.: Formation of secondary organic aerosols through photooxidation of isoprene, Sicence, 303, 1173–1176, https://doi.org/10.1126/science.1092805, 2004.
Cui, T., Zeng, Z., Santos, E. O. d., Zhang, Z., Chen, Y., Zhang, Y., Rose, C. A., Budisulistiorini, S. H., Collins, L. B., Bodnar, W. M., Souza, R. A. F. d., Scot T. Martin, E. C. M. D. M., Barbara J. Turpin, A. A. G., Ault, A. P., and Surratt, J. D.: Development of a hydrophilic interaction liquid chromatography (HILIC) method for the chemical characterization of water-soluble isoprene epoxydiol (IEPOX)-derived secondary organic aerosol, Environ. Sci.-Proc. Imp., 20, 1524–1536, https://doi.org/10.1039/C8EM00308D, 2018.
Ding, X., Wang, X. M., and Zheng, M.: The influence of temperature and aerosol acidity on biogenic secondary organic aerosol tracers: Observations at a rural site in the central Pearl River Delta region, South China, Atmos. Environ., 45, 1303–1311, https://doi.org/10.1016/j.atmosenv.2010.11.057, 2011.
Ding, X., He, Q. F., Shen, R. Q., Yu, Q. Q., and Wang, X. M.: Spatial distributions of secondary organic aerosols from isoprene, monoterpenes, β-caryophyllene, and aromatics over China during summer, J. Geophys. Res.-Atmos., 119, 1–15, https://doi.org/10.1002/2014jd021748, 2014.
Ding, X., Zhang, Y. Q., He, Q. F., Yu, Q. Q., Shen, R. Q., Zhang, Y. L., Lyu, S. J., Hu, Q. H., Wang, Y. S., Li, L. F., Song, W., and Wang, X. M.: Spatial and seasonal variations of secondary organic aerosol from terpenoids over China, J. Geophys. Res.-Atmos., 121, 14661–14678, https://doi.org/10.1002/2016JD025467, 2016.
Ding, X., Zhang, Y. Q., He, Q. F., Yu, Q. Q., Wang, J. Q., Shen, R. Q., Song, W., Wang, Y. S., and Wang, X. M.: Significant increase of aromatics-derived secondary organic aerosol during fall to winter in China, Environ. Sci. Technol., 51, 7432–7441, https://doi.org/10.1021/acs.est.6b06408, 2017.
Du, W., Zhao, J., Wang, Y., Zhang, Y., Wang, Q., Xu, W., Chen, C., Han, T., Zhang, F., Li, Z., Fu, P., Li, J., Wang, Z., and Sun, Y.: Simultaneous measurements of particle number size distributions at ground level and 260 m on a meteorological tower in urban Beijing, China, Atmos. Chem. Phys., 17, 6797–6811, https://doi.org/10.5194/acp-17-6797-2017, 2017.
Du, W., Dada, L., Zhao, J., Chen, X. S., Daellenback, K. R., Xie, C. H., Wang, W. Q., He, Y., Cai, J., Yao, L., Zhang, Y. J., Wang, Q. Q., Xu, W. Q., Wang, Y. Y., Tang, G. Q., Cheng, X. L., Kokkonen, T. V., Zhou, W., Yan, C., Chu, B. W., Zha, Q. Z., Hakala, S., Kurppa, M., Järvi, L., Liu, Y. C., Li, Z. Q., Ge, M. F., Fu, P. Q., Nie, W., Bianchi, F., Petäjä, T., Paasonen, P., Wang, Z. F., Worsnop, D. R., Kerminen, V.-M., Kulmala, M., and Sun, Y. L.: A 3D study on the amplification of regional haze and particle growth by local emissions, npj Climate and Atmospheric Science, 4, 4, https://doi.org/10.1038/s41612-020-00156-5, 2021.
Duhl, T. R., Helmig, D., and Guenther, A.: Sesquiterpene emissions from vegetation: a review, Biogeosciences, 5, 761–777, https://doi.org/10.5194/bg-5-761-2008, 2008.
Ervens, B., Turpin, B. J., and Weber, R. J.: Secondary organic aerosol formation in cloud droplets and aqueous particles (aqSOA): a review of laboratory, field and model studies, Atmos. Chem. Phys., 11, 11069–11102, https://doi.org/10.5194/acp-11-11069-2011, 2011.
Faiola, C. L., Vanderschelden, G. S., Wen, M., Elloy, F. C., Cobos, D. R., Watts, R. J., Jobson, B. T., and Vanreken, T. M.: SOA formation potential of emissions from soil and leaf litter, Environ. Sci. Technol., 48, 938–946, https://doi.org/10.1021/es4040045, 2014.
Faiola, C. L., Pullinen, I., Buchholz, A., Khalaj, F., Ylisirnio, A., Kari, E., Miettinen, P., Holopainen, J. K., Kivimaenpaa, M., Schobesberger, S., Yli-Juuti, T., and Virtanen, A.: Secondary Organic Aerosol Formation from Healthy and Aphid-Stressed Scots Pine Emissions, ACS Earth Space Chem., 3, 1756–1772, https://doi.org/10.1021/acsearthspacechem.9b00118, 2019.
Fan, Y., Liu, C.-Q., Li, L., Ren, L., Ren, H., Zhang, Z., Li, Q., Wang, S., Hu, W., Deng, J., Wu, L., Zhong, S., Zhao, Y., Pavuluri, C. M., Li, X., Pan, X., Sun, Y., Wang, Z., Kawamura, K., Shi, Z., and Fu, P.: Large contributions of biogenic and anthropogenic sources to fine organic aerosols in Tianjin, North China, Atmos. Chem. Phys., 20, 117–137, https://doi.org/10.5194/acp-20-117-2020, 2020.
Fu, P. Q., Kawamura, K., Chen, C., and Barrie, L. A.: Isoprene, Monoterpene, and Sesquiterpene Oxidation Products in the High Arctic Aerosols during Late Winter to Early Summer, Environ. Sci. Technol., 43, 4022–4028, https://doi.org/10.1021/es803669a, 2009.
Goldstein, A. H., Koven, C. D., Heald, C. L., and Fung, I. Y.: Biogenic carbon and anthropogenic pollutants combine to form a cooling haze over the southeastern United States, P. Natl. Acad. Sci. USA., 106, 8835–8840, https://doi.org/10.1073/pnas.0904128106, 2009.
Guinot, B., Roger, J. C., Cachier, H., Pucai, W., Jianhui, B., and Tong, Y.: Impact of vertical atmospheric structure on Beijing aerosol distribution, Atmos. Environ., 40, 5167–5180, 2006.
Hallquist, M., Wenger, J. C., Baltensperger, U., Rudich, Y., Simpson, D., Claeys, M., Dommen, J., Donahue, N. M., George, C., Goldstein, A. H., Hamilton, J. F., Herrmann, H., Hoffmann, T., Iinuma, Y., Jang, M., Jenkin, M. E., Jimenez, J. L., Kiendler-Scharr, A., Maenhaut, W., McFiggans, G., Mentel, Th. F., Monod, A., Prévôt, A. S. H., Seinfeld, J. H., Surratt, J. D., Szmigielski, R., and Wildt, J.: The formation, properties and impact of secondary organic aerosol: current and emerging issues, Atmos. Chem. Phys., 9, 5155–5236, https://doi.org/10.5194/acp-9-5155-2009, 2009.
Hodzic, A., Kasibhatla, P. S., Jo, D. S., Cappa, C. D., Jimenez, J. L., Madronich, S., and Park, R. J.: Rethinking the global secondary organic aerosol (SOA) budget: stronger production, faster removal, shorter lifetime, Atmos. Chem. Phys., 16, 7917–7941, https://doi.org/10.5194/acp-16-7917-2016, 2016.
Huang, R. J., Zhang, Y. L., Bozzetti, C., Ho, K. F., Cao, J. J., Han, Y., Daellenbach, K. R., Slowik, J. G., Platt, S. M., Canonaco, F., Zotter, P., Wolf, R., Pieber, S. M., Bruns, E. A., Crippa, M., Ciarelli, G., Piazzalunga, A., Schwikowski, M., Abbaszade, G., Schnelle-Kreis, J., R., Z., An, Z. S., Szidat, S., Baltensperger, U., Haddad, E. I., and Prevot, A. S.: High secondary aerosol contribution to particulate pollution during haze events in China, Nature, 514, 218–222, https://doi.org/10.1038/nature13774, 2014.
Huang, X., Ding, A., Wang, Z., Ding, K., Gao, J., Chai, F., and Fu, C.: Amplified transboundary transport of haze by aerosol–boundary layer interaction in China, Nat. Geosci., 13, 428–434, https://doi.org/10.1038/s41561-020-0583-4, 2020a.
Huang, X., Huang, J. T., Ren, C. H., Wang, J. P., Wang, H. Y., Wang, J. D., Yu, H., Chen, J., Gao, J., and Ding, A. J.: Chemical Boundary Layer and Its Impact on Air Pollution in Northern China, Environ. Sci. Tech. Let., 7, 826–832, https://doi.org/10.1021/acs.estlett.0c00755, 2020b.
IPCC: Climate change 2014: synthesis report, IPCC, Geneva, Switzerland, 2014.
Jaoui, M., Lewandowski, M., Kleindienst, T. E., Offenberg, J. H., and Edney, E. O.: β-caryophyllinic acid: An atmospheric tracer for β-caryophyllene secondary organic aerosol, Geophys. Res. Lett., 34, L05816, https://doi.org/10.1029/2006gl028827, 2007.
Kanakidou, M., Seinfeld, J. H., Pandis, S. N., Barnes, I., Dentener, F. J., Facchini, M. C., Van Dingenen, R., Ervens, B., Nenes, A., Nielsen, C. J., Swietlicki, E., Putaud, J. P., Balkanski, Y., Fuzzi, S., Horth, J., Moortgat, G. K., Winterhalter, R., Myhre, C. E. L., Tsigaridis, K., Vignati, E., Stephanou, E. G., and Wilson, J.: Organic aerosol and global climate modelling: a review, Atmos. Chem. Phys., 5, 1053–1123, https://doi.org/10.5194/acp-5-1053-2005, 2005.
Kleindienst, T. E., Jaoui, M., Lewandowski, M., Offenberg, J. H., Lewis, C. W., Bhave, P. V., and Edney, E. O.: Estimates of the contributions of biogenic and anthropogenic hydrocarbons to secondary organic aerosol at a southeastern US location, Atmos. Environ., 41, 8288–8300, 2007.
Kleindienst, T. E., Lewandowski, M., Offenberg, J. H., Jaoui, M., and Edney, E. O.: The formation of secondary organic aerosol from the isoprene + OH reaction in the absence of NOx, Atmos. Chem. Phys., 9, 6541–6558, https://doi.org/10.5194/acp-9-6541-2009, 2009.
Kleindienst, T. E., Jaoui, M., Lewandowski, M., Offenberg, J. H., and Docherty, K. S.: The formation of SOA and chemical tracer compounds from the photooxidation of naphthalene and its methyl analogs in the presence and absence of nitrogen oxides, Atmos. Chem. Phys., 12, 8711–8726, https://doi.org/10.5194/acp-12-8711-2012, 2012.
Li, L. J., Ren, L. J., Ren, H., Yue, S. Y., Xie, Q. R., Zhao, W. Y., Kang, M. J., Li, J., Wang, Z. F., Sun, Y. L., and Fu, P. Q.: Molecular Characterization and Seasonal Variation in Primary and Secondary Organic Aerosols in Beijing, China, J. Geophys. Res.-Atmos., 123, 12394–12412, https://doi.org/10.1029/2018jd028527, 2018.
Mkoma, S. L., Kawamura, K., and Fu, P. Q.: Contributions of biomass/biofuel burning to organic aerosols and particulate matter in Tanzania, East Africa, based on analyses of ionic species, organic and elemental carbon, levoglucosan and mannosan, Atmos. Chem. Phys., 13, 10325–10338, https://doi.org/10.5194/acp-13-10325-2013, 2013.
Nault, B. A., Jo, D. S., McDonald, B. C., Campuzano-Jost, P., Day, D. A., Hu, W., Schroder, J. C., Allan, J., Blake, D. R., Canagaratna, M. R., Coe, H., Coggon, M. M., DeCarlo, P. F., Diskin, G. S., Dunmore, R., Flocke, F., Fried, A., Gilman, J. B., Gkatzelis, G., Hamilton, J. F., Hanisco, T. F., Hayes, P. L., Henze, D. K., Hodzic, A., Hopkins, J., Hu, M., Huey, L. G., Jobson, B. T., Kuster, W. C., Lewis, A., Li, M., Liao, J., Nawaz, M. O., Pollack, I. B., Peischl, J., Rappenglück, B., Reeves, C. E., Richter, D., Roberts, J. M., Ryerson, T. B., Shao, M., Sommers, J. M., Walega, J., Warneke, C., Weibring, P., Wolfe, G. M., Young, D. E., Yuan, B., Zhang, Q., de Gouw, J. A., and Jimenez, J. L.: Secondary organic aerosols from anthropogenic volatile organic compounds contribute substantially to air pollution mortality, Atmos. Chem. Phys., 21, 11201–11224, https://doi.org/10.5194/acp-21-11201-2021, 2021.
Nguyen, T. B., Bates, K. H., Crounse, J. D., Schwantes, R. H., Zhang, X., Kjaergaard, H. G., Surratt, J. D., Lin, P., Laskin, A., Seinfeld, J. H., and Wennberg, P. O.: Mechanism of the hydroxyl radical oxidation of methacryloyl peroxynitrate (MPAN) and its pathway toward secondary organic aerosol formation in the atmosphere, Phys. Chem. Chem. Phys., 17, 17914–17926, https://doi.org/10.1039/c5cp02001h, 2015.
Pöschl, U.: Atmospheric aerosols: composition, transformation, climate and health effects, Angew. Chem. Int. Edit, 44, 7520–7540, https://doi.org/10.1002/anie.200501122, 2005.
Ran, Y. H., Li, X., Lu, L., and Li, Z. Y.: Large-scale land cover mapping with the integration of multi-source information based on the Dempster–Shafer theory, Int. J. Geogr. Inf. Sci., 26, 169–191, https://doi.org/10.1080/13658816.2011.577745, 2012.
Russell, A. G. and Brunekreef, B.: A focus on particulate matter and health, Environ. Sci. Technol., 43, 4620–4625, https://doi.org/10.1021/es9005459, 2009.
Sharkey, T. D., Wiberley, A. E., and Donohue, A. R.: Isoprene emission from plants: why and how, Ann. Bot., 101, 5–18, https://doi.org/10.1093/aob/mcm240, 2008.
Shilling, J. E., Zaveri, R. A., Fast, J. D., Kleinman, L., Alexander, M. L., Canagaratna, M. R., Fortner, E., Hubbe, J. M., Jayne, J. T., Sedlacek, A., Setyan, A., Springston, S., Worsnop, D. R., and Zhang, Q.: Enhanced SOA formation from mixed anthropogenic and biogenic emissions during the CARES campaign, Atmos. Chem. Phys., 13, 2091–2113, https://doi.org/10.5194/acp-13-2091-2013, 2013.
Shrivastava, M., Cappa, C. D., Fan, J., Goldstein, A. H., Guenther, A. B., Jimenez, J. L., Kuang, C., Laskin, 821, A., M., S. T., Ng, N. L., Petaja, T., Pierce, J. R., Rasch, P. J., Roldin, P., Seinfeld, J. H., Shilling, J., 822, Smith, J. N., Thornton, J. A., Volkamer, R., Wang, J., Worsnop, D. R., Zaveri, R. A., Zelenyuk, A. and 823, and Zhang, Q.: Recent advances in understanding secondary organic aerosol: Implications for global climate 824 forcing, Rev. Geophys., 55, 509–559, https://doi.org/10.1002/2016RG000540, 2017.
Shrivastava, M., Andreae, M. O., Artaxo, P., Barbosa, H. M. J., Berg, L. K., Brito, J., Ching, J., Easter, R. C., Fan, J., Fast, J. D., Feng, Z., Fuentes, J. D., Glasius, M., Goldstein, A. H., Alves, E. G., Gomes, H., Gu, D., Guenther, A., Jathar, S. H., Kim, S., Liu, Y., Lou, S., Martin, S. T., McNeill, V. F., Medeiros, A., de Sa, S. S., Shilling, J. E., Springston, S. R., Souza, R. A. F., Thornton, J. A., Isaacman-VanWertz, G., Yee, L. D., Ynoue, R., Zaveri, R. A., Zelenyuk, A., and Zhao, C.: Urban pollution greatly enhances formation of natural aerosols over the Amazon rainforest, Nat. Commun., 10, 1046, https://doi.org/10.1038/s41467-019-08909-4, 2019.
Simoneit, B. R. T., Sheng, G. Y., Chen, X. J., Fu, J. M., Zhang, J., and Xu, Y. P.: Melocular marks study of extractable matter in aerosols from areas of China, Atmos. Environ., 25A, 2111–2129, 0.1016/0960-1686(91)90088-O, 1991.
Su, H., Cheng, Y. F., and Poschl, U.: New Multiphase Chemical Processes Influencing Atmospheric Aerosols, Air Quality, and Climate in the Anthropocene, Accounts Chem. Res., 53, 2034–2043, https://doi.org/10.1021/acs.accounts.0c00246, 2020.
Sun, Y., Du, W., Wang, Q., Zhang, Q., Chen, C., Chen, Y., Chen, Z., Fu, P., Wang, Z., Gao, Z., and Worsnop, D. R.: Real-time characterization of aerosol particle composition above the urban canopy in Beijing: insights into the interactions between the atmospheric boundary layer and aerosol chemistry, Environ. Sci. Technol., 49, 11340–11347, https://doi.org/10.1021/acs.est.5b02373, 2015.
Sun, Y. L., Chen, C., Zhang, Y. J., Xu, W. Q., Zhou, L. B., Cheng, X. L., Zheng, H. T., Ji, D. S., Li, J., Tang, X., Fu, P. Q., and Wang, Z. F.: Rapid formation and evolution of an extreme haze episode in Northern China during winter 2015, Sci. Rep.-UK, 6, 27151, https://doi.org/10.1038/srep27151, 2016.
Surratt, J. D., Lewandowski, M., Jaoui, M., Kleindienst, T. E., Edney, E. O., and Seinfeld, J. H.: Effect of acidity on secondary organic aerosol formation from isoprene, Environ. Sci. Technol., 41, 5363–5369, https://doi.org/10.1021/es0704176, 2007.
Surratt, J. D., Chan, A. W., Eddingsaas, N. C., Chan, M., Loza, C. L., Kwan, A. J., Hersey, S. P., Flagan, R. C., Wennberg, P. O., and Seinfeld, J. H.: Reactive intermediates revealed in secondary organic aerosol formation from isoprene, P. Natl. Acad. Sci. USA., 107, 6640–6645, https://doi.org/10.1073/pnas.0911114107, 2010.
Szmigielski, R., Surratt, J. D., Gómez-González, Y., Van der Veken, P., Kourtchev, I., Vermeylen, R., Blockhuys, F., Jaoui, M., Kleindienst, T. E., Lewandowski, M., Offenberg, J. H., Edney, E. O., Seinfeld, J. H., Maenhaut, W., and Claeys, M.: 3-methyl-1,2,3-butanetricarboxylic acid: An atmospheric tracer for terpene secondary organic aerosol, Geophys. Res. Lett., 34, L24811, https://doi.org/10.1029/2007gl031338, 2007.
Tarvainen, V., Hakola, H., Hellén, H., Bäck, J., Hari, P., and Kulmala, M.: Temperature and light dependence of the VOC emissions of Scots pine, Atmos. Chem. Phys., 5, 989–998, https://doi.org/10.5194/acp-5-989-2005, 2005.
Tian, P., Liu, D., Huang, M., Liu, Q., Zhao, D., Ran, L., Deng, Z., Wu, Y., Fu, S., Bi, K., Gao, Q., He, H., Xue, H., and Ding, D.: The evolution of an aerosol event observed from aircraft in Beijing: An insight into regional pollution transport, Atmos. Environ., 206, 11–20, https://doi.org/10.1016/j.atmosenv.2019.02.005, 2019.
Volkamer, R., Jimenez, J. L., San Martini, F., Dzepina, K., Zhang, Q., Salcedo, D., Molina, L. T., Worsnop, D. R., and Molina, M. J.: Secondary organic aerosol formation from anthropogenic air pollution: Rapid and higher than expected, Geophys. Res. Lett., 33, L17811, https://doi.org/10.1029/2006gl026899, 2006.
Wang, G., Kawamura, K., Lee, S., Ho, K., and Cao, J.: Molecular, Seasonal, and Spatial Distributions of Organic Aerosols from Fourteen Chinese Cities, Environ. Sci. Technol., 40, 4619–4625, 2006.
Wang, H., Lu, K., Chen, X., Zhu, Q., Wu, Z., Wu, Y., and Sun, K.: Fast particulate nitrate formation via N2O5 uptake aloft in winter in Beijing, Atmos. Chem. Phys., 18, 10483–10495, https://doi.org/10.5194/acp-18-10483-2018, 2018.
Wang, Q., Sun, Y., Xu, W., Du, W., Zhou, L., Tang, G., Chen, C., Cheng, X., Zhao, X., Ji, D., Han, T., Wang, Z., Li, J., and Wang, Z.: Vertically resolved characteristics of air pollution during two severe winter haze episodes in urban Beijing, China, Atmos. Chem. Phys., 18, 2495–2509, https://doi.org/10.5194/acp-18-2495-2018, 2018.
Wang, S., Song, T., Shiraiwa, M., Song, J., Ren, H., Ren, L., Wei, L., Sun, Y., Zhang, Y., Fu, P., and Lai, S.: Occurrence of aerosol proteinaceous matter in urban Beijing: an investigation on composition, sources, and atmospheric processes during the “APEC Blue” period, Environ. Sci. Technol., 53, 7380–7390, https://doi.org/10.1021/acs.est.9b00726, 2019.
Wang, W., Kourtchev, I., Graham, B., Cafmeyer, J., Maenhaut, W., and Claeys, M.: Characterization of oxygenated derivatives of isoprene related to 2-methyltetrols in Amazonian aerosols using trimethylsilylation and gas chromatography/ion trap mass spectrometry, Rapid Comun. Mass Sp., 19, 1343–1351, https://doi.org/10.1002/rcm.1940, 2005.
Wang, W., Wu, M. H., Li, L., Zhang, T., Liu, X. D., Feng, J. L., Li, H. J., Wang, Y. J., Sheng, G. Y., Claeys, M., and Fu, J. M.: Polar organic tracers in PM2.5 aerosols from forests in eastern China, Atmos. Chem. Phys., 8, 7507–7518, https://doi.org/10.5194/acp-8-7507-2008, 2008.
Wang, Z. H., Bai, Y. H., and Zhang, S. Y.: A biogenic volatile organic compounds emission inventory for Beijing, Atmos. Environ., 37, 3771–3782, https://doi.org/10.1016/s1352-2310(03)00462-x, 2003.
Wei, L. F., Yue, S. Y., Zhao, W. Y., Yang, W. Y., Zhang, Y. J., Ren, L. J., Han, X. K., Guo, Q. J., Sun, Y. L., Wang, Z. F., and Fu, P. Q.: Stable sulfur isotope ratios and chemical compositions of fine aerosols (PM2.5) in Beijing, China, Sci. Total. Environ., 633, 1156–1164, https://doi.org/10.1016/j.scitotenv.2018.03.153, 2018.
Wennberg, P. O., Bates, K. H., Crounse, J. D., Dodson, L. G., McVay, R. C., Mertens, L. A., Nguyen, T. B., Praske, E., Schwantes, R. H., Smarte, M. D., St Clair, J. M., Teng, A. P., Zhang, X., and Seinfeld, J. H.: Gas-Phase Reactions of Isoprene and Its Major Oxidation Products, Chem. Rev., 118, 3337–3390, https://doi.org/10.1021/acs.chemrev.7b00439, 2018.
Went, F. W.: Blue hazes in the atmosphere, Nature, 187, 641–643, 1960.
White, W. H. and Roberts, G. C.: On the nature and origins of visibility-reducing aerosols in the Los Angeles air basin, Atmos. Environ., 11, 803–812, 1976.
Wu, L., Ren, H., Wang, P., Chen, J., Fang, Y., Hu, W., Ren, L., Deng, J., Song, Y., Li, J., Sun, Y., Wang, Z., Liu, C.-Q., Ying, Q., and Fu, P.: Aerosol ammonium in the urban boundary layer in Beijing: insights from nitrogen isotope ratios and simulations in summer 2015, Environ. Sci. Tech. Let., 6, 389–395, https://doi.org/10.1021/acs.estlett.9b00328, 2019.
Xie, Q. R., Li, Y., Yue, S. Y., Su, S. H., Cao, D., Xu, Y. S., Chen, J., Tong, H. J., Su, H., Cheng, Y. F., Zhao, W. Y., Hu, W., Wang, Z., Yang, T., Pan, X. L., Sun, Y. L., Wang, Z. F., Liu, C. Q., Kawamura, K., Jiang, G. B., Shiraiwa, M., and Fu, P. Q.: Increase of High Molecular Weight Organosulfate With Intensifying Urban Air Pollution in the Megacity Beijing, J. Geophys. Res.-Atmos., 125, e2019JD032200, https://doi.org/10.1029/2019jd032200, 2020.
Yan, Y., Wang, Z. H., Bai, Y. H., Xie, S. D., and Shao, M.: Establishment of vegetation VOC emission inventory in China, China Environmental Science, 25, 110–114, 2005.
Yáñez-Serrano, A. M., Nölscher, A. C., Bourtsoukidis, E., Gomes Alves, E., Ganzeveld, L., Bonn, B., Wolff, S., Sa, M., Yamasoe, M., Williams, J., Andreae, M. O., and Kesselmeier, J.: Monoterpene chemical speciation in a tropical rainforest:variation with season, height, and time of dayat the Amazon Tall Tower Observatory (ATTO), Atmos. Chem. Phys., 18, 3403–3418, https://doi.org/10.5194/acp-18-3403-2018, 2018.
Yee, L. D., Isaacman-VanWertz, G., Wernis, R. A., Kreisberg, N. M., Glasius, M., Riva, M., Surratt, J. D., de Sa, S. S., Martin, S. T., Alexander, M. L., Palm, B. B., Hu, W., Campuzano-Jost, P., Day, D. A., Jimenez, J. L., Liu, Y., Misztal, P. K., Artaxo, P., Viegas, J., Manzi, A., de Souza, R. A. F., Edgerton, E. S., Baumann, K., and Goldstein, A. H.: Natural and Anthropogenically Influenced Isoprene Oxidation in Southeastern United States and Central Amazon, Environ. Sci. Technol., 54, 5980–5991, https://doi.org/10.1021/acs.est.0c00805, 2020.
Zelenyuk, A., Imre, D. G., Wilson, J., Bell, D. M., Suski, K. J., Shrivastava, M., Beranek, J., Alexander, M. L., Kramer, A. L., and Massey Simonich, S. L.: The effect of gas-phase polycyclic aromatic hydrocarbons on the formation and properties of biogenic secondary organic aerosol particles, Faraday Discuss., 200, 143–164, https://doi.org/10.1039/c7fd00032d, 2017.
Zhang, Y., Huang, J. P., Henze, D. K., and Seinfeld, J. H.: Role of isoprene in secondary organic aerosol formation on a regional scale, J. Geophys. Res., 112, D20207, https://doi.org/10.1029/2007jd008675, 2007.
Zhao, J., Du, W., Zhang, Y., Wang, Q., Chen, C., Xu, W., Han, T., Wang, Y., Fu, P., Wang, Z., Li, Z., and Sun, Y.: Insights into aerosol chemistry during the 2015 China Victory Day parade: results from simultaneous measurements at ground level and 260 m in Beijing, Atmos. Chem. Phys., 17, 3215–3232, https://doi.org/10.5194/acp-17-3215-2017, 2017.
Zhao, W., Ren, H., Kawamura, K., Du, H., Chen, X., Yue, S., Xie, Q., Wei, L., Li, P., Zeng, X., Kong, S., Sun, Y., Wang, Z., and Fu, P.: Vertical distribution of particle-phase dicarboxylic acids, oxoacids and α-dicarbonyls in the urban boundary layer based on the 325 m tower in Beijing, Atmos. Chem. Phys., 20, 10331–10350, https://doi.org/10.5194/acp-20-10331-2020, 2020.
Zheng, G. J., Duan, F. K., Su, H., Ma, Y. L., Cheng, Y., Zheng, B., Zhang, Q., Huang, T., Kimoto, T., Chang, D., Pöschl, U., Cheng, Y. F., and He, K. B.: Exploring the severe winter haze in Beijing: the impact of synoptic weather, regional transport and heterogeneous reactions, Atmos. Chem. Phys., 15, 2969–2983, https://doi.org/10.5194/acp-15-2969-2015, 2015.
Zhu, C. M., Kawamura, K., and Fu, P. Q.: Seasonal variations of biogenic secondary organic aerosol tracers in Cape Hedo, Okinawa, Atmos. Environ., 130, 113–119, https://doi.org/10.1016/j.atmosenv.2015.08.069, 2016.