the Creative Commons Attribution 4.0 License.
the Creative Commons Attribution 4.0 License.
 | 31 Aug 2021
On the role of aerosol radiative effect in the wet season onset timing over the Congo rainforest during boreal autumn
Sudip Chakraborty
Jonathon H. Jiang
Hui Su
Rong Fu
The boreal summer dry season length is reported to have been increasing in the last 3 decades over the Congo rainforest, which is the second-largest rainforest in the world. In some years, the wet season in boreal autumn starts early, while in others it arrives late. The mechanism behind such a change in the wet season onset date has not been investigated yet. Using multi-satellite data sets, we discover that the variation in aerosols in the dry season plays a major role in determining the subsequent wet season onset. Dry season aerosol optical depth (AOD) influences the strength of the southern African easterly jet (AEJ-S) and, thus, the onset of the wet season. Higher AOD associated with a higher dust mass flux reduces the net downward shortwave radiation and decreases the surface temperature over the Congo rainforest region, leading to a stronger meridional temperature gradient between the rainforest and the Kalahari Desert as early as in June. The latter, in turn, strengthens the AEJ-S, sets in an early and a stronger easterly flow, and leads to a stronger equatorward convergence and an early onset of the wet season in late August to early September. The mean AOD in the dry season over the region is strongly correlated (r=0.7) with the timing of the subsequent wet season onset. Conversely, in low AOD years, the onset of the wet season over the Congo basin is delayed to mid-October.
- Article
(9185 KB) - Full-text XML
-
Supplement
(1025 KB) - BibTeX
- EndNote


The author's copyright for this publication is transferred to NASA Jet Propulsion Laboratory (JPL).
Wet season onset over the Congo rainforest marks the end of the dry season with increasing precipitation; thus, it is important for the groundwater and soil moisture replenishment, photosynthetic rate, greenness, ecology, and sustainability of the rainforest, especially in a warming climate (Erfanian et al., 2017; Lewis et al., 2011, 2013; Marengo et al., 2008). Recent studies show that the Congo rainforest, which is the second-largest rainforest following the Amazon, has been experiencing a longer boreal summer dry season (Malhi and Wright, 2004; Zhou et al., 2014). The dry season length has increased by 6.4–10.4 d per decade between 1988–2013, and the rainfall has been declining at a striking rate of −0.32 ± 0.10 mm per day per decade over the last 50 years (Jiang et al., 2019). Observations also indicate a long-term drying and declining of greenness in the Congo rainforest (Zhou et al., 2014). Annual rainfall over much of the Congo rainforest is marginal to sustain the rainforest (Mayer and Khalyani, 2011; Staver et al., 2011). A significant reduction in rainfall due to the delay of the main rainy season in boreal autumn can lead to significant water stress in the rainforest. Besides, continuous deforestation, droughts, and global warming pose serious threats to the rainforest, making it more vulnerable and unsustainable for future existence (Tyukavina et al., 2018).
The Congo basin experiences two different rainy seasons during March–May (MAM; Nicholson and Dezfuli, 2013) and September–December (SOND; Dezfuli and Nicholson, 2013), with the twice-annual passage of the intertropical convergence zone (ITCZ; Nicholson, 2018; Nicholson and Dezfuli, 2013). The latter one (SOND) during the boreal autumn is stronger, following the lengthening and widely spreading dry boreal summer (Jiang et al., 2019), and is associated with a different dynamical mechanism to that of the MAM rainy season (Jackson et al., 2009). Mid-level African easterly jets (AEJs), especially the southern hemispheric branch (AEJ-S), are known to play a crucial role in the boreal autumn wet season (Adebiyi and Zuidema, 2016; Jackson et al., 2009; Nicholson and Grist, 2003). The AEJ-S is associated with equatorward convergence (Adebiyi and Zuidema, 2016) and is strong during the boreal autumn season but absent during the boreal spring or MAM season (Adebiyi and Zuidema, 2016; Jackson et al., 2009). Very intense mesoscale convective systems (MCSs) are associated with the presence of the AEJ-S and bring rainfall during boreal autumn (Jackson et al., 2009; Vondou et al., 2010). Thus, the AEJ-S timing and strength might play an important role in accelerating or delaying the wet season onset over the Congo basin.
Table 1Onset pentads between 2003–2012 from GPCP data.
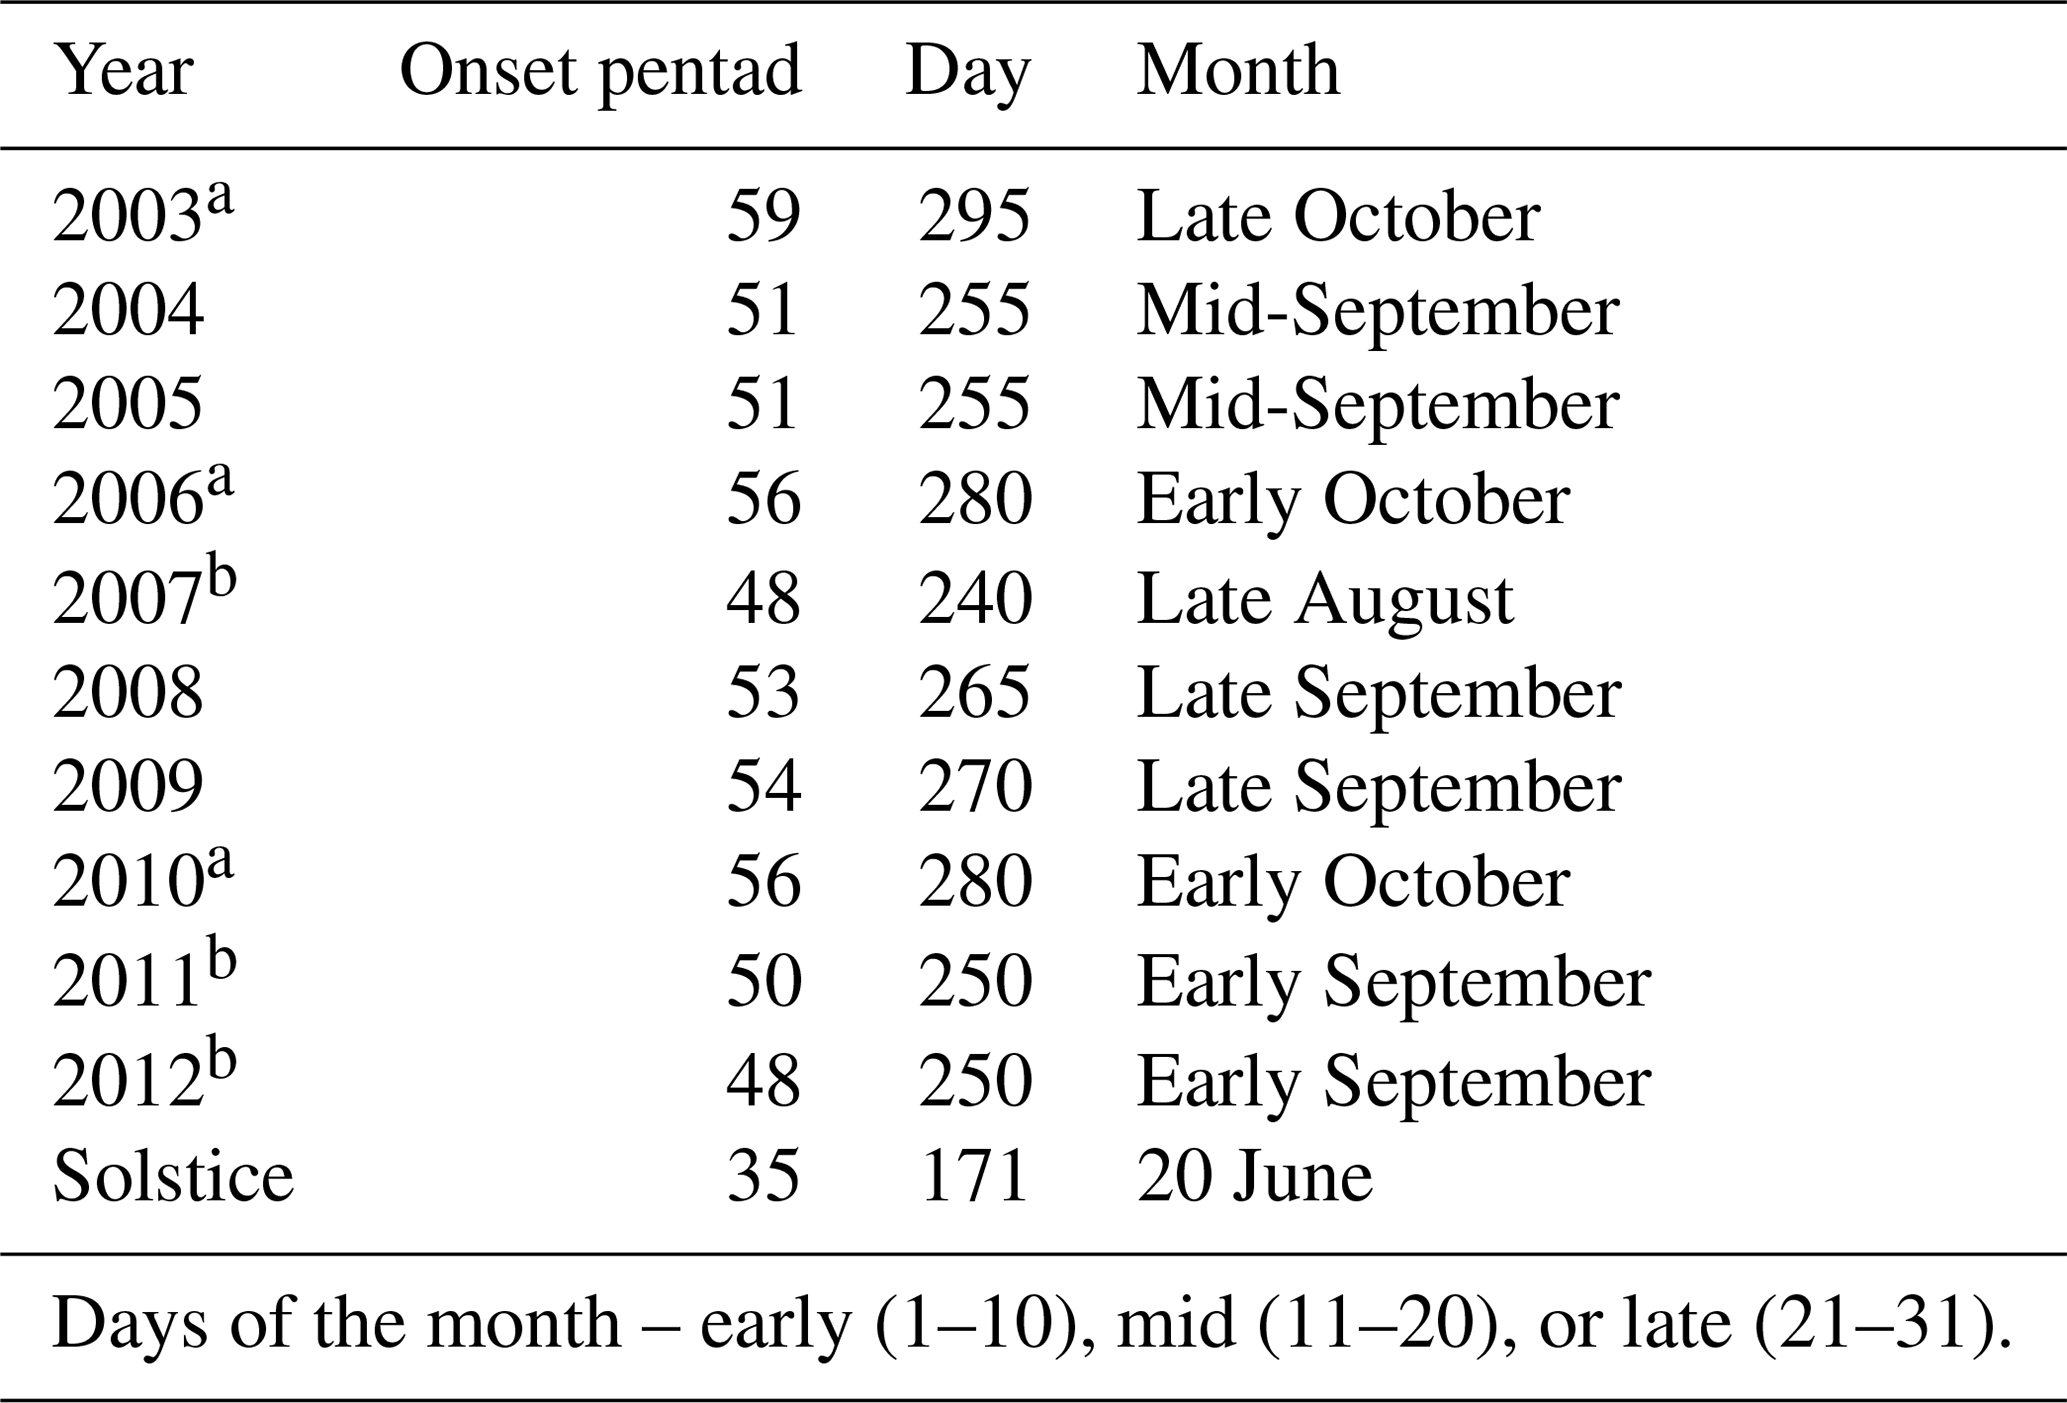
a Late-onset years. b Early-onset years
Out of the entire Congo basin, only the Angolan coast in the west and the eastern Zaire basin are regulated by the sea surface temperature (SST) anomalies. Circulation features associated with El Niño (La Niña) conditions are strongly linked to wet (dry) conditions over the eastern Zaire basin. Warmer western Indian Ocean SST is somewhat weakly associated with the rainfall over there compared to a strong association between the Atlantic SST and the rainfall over the Angolan coast (Dezfuli and Nicholson, 2013). Since rainfall onsets in late August to early September during the early-onset years (Table 1), we plot tropical δSST (differences in SST between early- and late-onset years and, henceforth, for other parameters) during August and September in Fig. 1 from Atmospheric Infrared Sounder (AIRS) data sets. Figure 1 shows that, although SST over the Indian Ocean is higher, La Niña condition prevails over the Pacific Ocean during the early-onset years. On the other hand, La Niña conditions, i.e., warm SST along the Benguela coast and the colder western Indian Ocean, are related to the wet conditions over the Angolan coast (Dezfuli and Nicholson, 2013). The rainfall variability over the Angolan coast exhibits the strongest correlation (r=0.74) with the SST differences between the warmer Benguela current (10∘ E–coast, 2–16∘ S) and colder western equatorial Indian Oceans (coast–56∘ E, and 2–14∘ S; Dezfuli and Nicholson, 2013). Although the La Niña condition develops, and the Benguela current is warmer, SST over the western equatorial Indian ocean is higher in August–September (Fig. 1) during the early-onset years. As a result, SST differences between the western equatorial Indian Ocean and Benguela current decrease. Other regions over the Congo basin, such as the northern and southern areas of the Zaire basin, northern slopes of the Central African Plateau and highlands of the Central African Republic show weak relationships with the circulation features, sea level pressure, and SST (Dezfuli and Nicholson, 2013; Vondou et al., 2010). Rather, the rainfall variability over the central Congo basin (15–25∘ E) is strongly associated with the stronger easterly tropical jet and local effects (Adebiyi and Zuidema, 2016; Dezfuli and Nicholson, 2013; Jackson et al., 2009; Nicholson and Grist, 2003; Vondou et al., 2010). Thus, these results explain that the SST patterns cannot solely explain the early arrival of the wet conditions over the Congo rainforest.
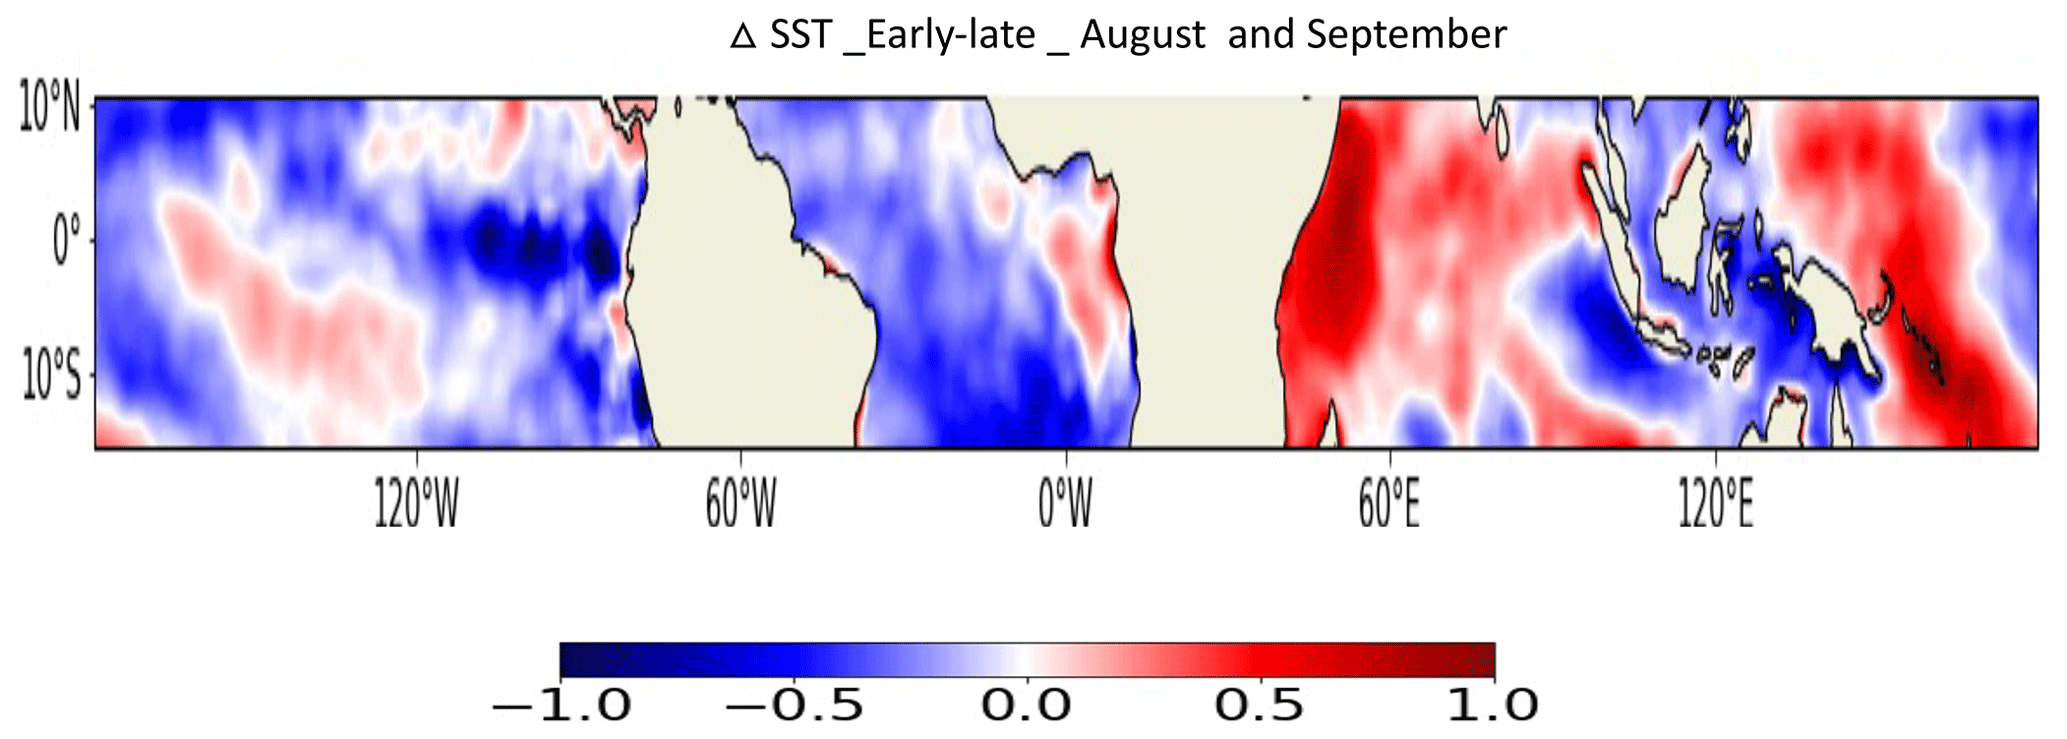
Figure 1Map of mean of August and September δSST for the time between the early- and late-onset years.
The moisture source during the wet season is the low-level westerly jet that brings moisture from the Atlantic Ocean below 850 hPa (Cook and Vizy, 2016; Neupane, 2016; Nicholson, 2018); however, we observe that the difference in the atmospheric moisture content (not shown) is insignificant between the early- and late-onset years (Dezfuli and Nicholson, 2013). Thus, over a large part of the rainforest, as indicated by many studies in the past (Adebiyi and Zuidema, 2016; Dezfuli and Nicholson, 2013; Jackson et al., 2009; Nicholson and Grist, 2003), zonal circulation and stronger tropical easterly jets might explain the rainfall variability and onset timing. Hence, we focus on the influence of the regional thermodynamic and dynamical conditions on the wet season onset over the Congo basin as suggested by previous studies (Jackson et al., 2009; Vondou et al., 2010).
On the other hand, it is known that dust aerosols are abundant with frequent outbreaks over the Congo rainforest (Laurent et al., 2008), and they can modulate the precipitation over Africa (N'Datchoh et al., 2018). Aerosols have a radiative cooling impact at the surface because they reflect, scatter, and absorb sunlight (Léon et al., 2002). Such a cooling effect can influence the meridional temperature gradient, which is the primary driver of the thermally driven jets. A few attempts, mostly using model simulations, have been made to tease out the dust impacts on the west African monsoon (Lavaysse et al., 2011; Marcella and Eltahir, 2014); however, such studies over the Congo rainforest are absent. Adebiyi and Zuidema (2016) found out that a high amount of aerosol concentration (aerosol optical depth, AOD > 0.5) coexists with the AEJ-S. However, to date, it is not clear whether aerosols can influence the wet season onset timing over the Congo rainforest despite their well-known impact on the downward shortwave radiation over the rainforest (Konzelmann et al., 1996) and the impact of the meridional temperature gradient between the Congo rainforest and the Kalahari Desert on the AEJ-S (Adebiyi and Zuidema, 2016; Cook, 1999).
Improved understanding of the mechanisms that affect the timing of the wet season is important for an accurate representation of the wet season onset in climate models (Whittleston et al., 2017), for reducing the large uncertainty in the rainfall variability over the Congo rainforest (Whittleston et al., 2017), and for assessing the future and sustainability of the rainforest under various global warming scenarios. The Congo rainforest has been far less studied compared to the Amazon rainforest (Wright et al., 2017). Although it is known that the AEJ-S is central to the boreal autumn wet season over the Congo rainforest, the reasons behind the early or late wet season onset are not clear. In particular, it is not clear whether or how aerosol loading, in addition to the meteorological, radiative, and dynamic parameters, affect the timing of the wet season onset.
In this study, we examine the wet season onset timing mechanism by analyzing the aerosol radiative effect on surface temperature (Ts), AEJ-S, and associated convergence. We use a suite of satellite measurements, ERA-Interim and the Modern-Era Retrospective Analysis for Research and Applications (MERRA-2) data set over 10 years (2003–2012), focusing on the domain of 5∘ N–10∘ S, 12∘ E–32∘ E to tease out the influence of the aerosol radiative effect on the wet season onset.
What changes in the meteorological, dynamical, and aerosol concentration led to an early onset in some years but a delayed onset in other years? To understand what causes the differences in the wet season onset, we compare the differences in the abovementioned conditions between three early-onset (2007, 2011, and 2012) and three late-onset (2003, 2006, and 2010) years (Table 1). Methods to calculate the onset pentads from the Global Precipitation Climatology Project (GPCP) data are given in Sect. 2. We calculate precipitation variability between the early and late years from GPCP data. We use cloud cover and surface irradiance data from the Cloud and the Earth's Radiant Energy System (CERES). The AOD data from the Moderate Resolution Imaging Spectroradiometer (MODIS) is used. Ts is obtained from the Atmospheric Infrared Sounder (AIRS) and ERA-Interim reanalysis is used to detect the AEJ-S and calculate divergence (see the Supplement).
2.1 Data
2.1.1 GPCP pentad data
The Global Precipitation Climatology Project (GPCP) pentad rainfall data have been used to compute the climatological mean and the wet season onset dates. The data are provided in a 2.5∘ resolution at a 5 d (pentad) temporal average and are available at https://data.nodc.noaa.gov/cgi-bin/iso?id=gov.noaa.ncdc:C00933 (last access: 20 August 2021). The version 2.2 data set has rainfall records from 1979 to the present (Adler et al., 2003). GPCP pentad data have been used for wet-season-onset-related analysis in previous studies (Li and Fu, 2006; Wright et al., 2017).
2.1.2 Cloud and the Earth's Radiant Energy System (CERES)
CERES provides cloud cover and radiant information at 1∘ spatial resolution at a daily scale. We use the SYN1deg data set (https://ceres.larc.nasa.gov/products.php?product=SYN1deg, last access: 20 August 2021) for this study (Minnin et al., 2011). The product uses 3 h radiances and cloud properties to provide cloud cover, surface radiance, and 500 hPa radiance values. We use the longwave and shortwave data at both the upward and downward directions in the all-sky and clear-sky conditions. CERES data have previously been used in wet-season-onset-related studies (Wright et al., 2017) and are well validated against the in situ measurements (Loeb et al., 2018).
2.1.3 Moderate Resolution Imaging Spectroradiometer (MODIS)
We use MODIS daily aerosol products to calculate daily aerosol optical depth (AOD) over the domain. MODIS provides AOD over the oceans and land at a spatial resolution of 10×10, 1 km pixels. The MODIS (on board the Aqua satellite) data are available every day from 2002 (Kaufman et al., 2005, https://ladsweb.modaps.eosdis.nasa.gov/missions-and-measurements/science-domain/aerosol, last access: 20 August 2021) and have been extensively used for scientific purposes in the past few decades (Adebiyi and Zuidema, 2016; Fan et al., 2016). MODIS AOD has been used by many researchers to study aerosol–cloud interaction (Gryspeerdt et al., 2015), aerosols' radiative impact (Adebiyi and Zuidema, 2016), and the relationship between PM2.5 concentration and human health (Owili et al., 2017) over the Congo basin. Over Central Africa, MODIS AOD retrievals with high data quality flag from Terra and Aqua platforms are found to have a high correlation (0.87) with the AERONET (AErosol RObotic NETwork) station data (Gupta et al., 2018).
2.1.4 Atmospheric Infrared Sounder (AIRS)
AIRS data are available from 21 August 2002 (https://disc.gsfc.nasa.gov/datasets/AIRX3STD_006/summary?keywords=_airs version 6, last access: 20 August 2021), with a spatial coverage of 180∘ E to 180∘ W and 90∘ S to 90∘ N. We use the AIRS in combination with an advanced microwave sounding unit (AMSU) and the Humidity Sounder for Brazil (HSB) data. These data use visible, infrared, and microwave sensors to estimate water vapor and 2 m surface temperature. AIRS is an instrument on board the Aqua satellite, which is a part of the A-train constellation. We use the AIRX3STD (Susskind et al., 2014) daily version 6 standard physical retrieval data at 1∘ horizontal resolution.
2.1.5 ERA-Interim
We use ERA-Interim data that are available from 1979 to August 2019 (Berrisford et al., 2011). We use the zonal and meridional wind data to analyze the wind field and the jet location for our study. Previous studies have already used ERA-Interim data to detect the African jets (Cook, 1999; Jackson et al., 2009). The data are available at a 0.75×0.67 spatial resolution in the longitudinal and latitudinal direction, respectively, at four different hours (00:00, 06:00, 12:00, and 18:00) of temporal resolution. The data are available at 60 pressure levels from the surface to 0.1 hPa, which can be found at https://www.ecmwf.int/en/forecasts/documentation-and-support/60-model-levels (last access: 20 August 2021). We have used 673 and 897 hPa levels wind data to calculate the intensity and direction of the southern as well as northern African easterly jets (AEJ-S and AEJ-N) and low-level African westerly jet, respectively.
2.1.6 Modern-Era Retrospective Analysis for Research and Applications (MERRA-2)
We use two-dimensional hourly averaged surface and vertically integrated aerosol mass fluxes (tavg1_2d_aer_Nx) from the Modern-Era Retrospective Analysis for Research and Applications (MERRA-2) data sets (Gelaro et al., 2017). The gridded data are provided in 576 grids along the longitudinal direction and 361 grids along the latitudinal direction. To understand the aerosol transport over the region, we use the Modern-Era Retrospective analysis for Research and Applications (MERRA-2) aerosol reanalysis (Gelaro et al., 2017) data set. The MERRA-2 aerosol mass flux data have been widely used to for aerosol-transport-related studies (Sitnov et al., 2020; Xu et al., 2020), including the ones that detect and identify aerosol atmospheric rivers, as well as major aerosol transport pathways, across the globe (Chakraborty et al., 2021). The data set provides us with an opportunity to detect the sources and pathways of aerosol particles transported over the Congo rainforest. The MERRA-2 aerosol reanalysis data are validated against 793 AERONET stations (Gueymard and Yang, 2020) and have already been used for scientific purposes (Sitnov et al., 2020; Xu et al., 2020). The data provide five different aerosol mass fluxes, such as dust (DU), organic carbon (OC), black carbon (BC), sulfates (SU), and sea salt (SS) in the zonal and meridional direction. We use this data set to estimate the dominant aerosol types that contribute to the largest fraction to the aerosol concentrations. MERRA-2 provides a vertically integrated aerosol mass flux (AMF) in each grid cell in the zonal (AMFu) and the meridional directions (AMFv) as , where p is pressure, A is aerosols mass mixing ratio, U is the wind vector, and g is the gravitational constant. We compute integrated aerosol mass flux as .
2.2 Methods
We first compute mean rainfall over the domain (5∘ N–10∘ S, 12–32∘ E) from 1979 for each pentad. GPCP pentad data have often been used to detect wet season onset over other regions of the world (Li and Fu, 2006; Wright et al., 2017). The climatological (1979–2013) mean rainfall is 4.14 mm per day over the domain. We detect onset dates each year based on the following three criteria: (1) the rainfall of that pentad is higher than the climatological mean, (2) five out of eight pentads before that pentad have rainfall less than the climatological mean, and (3) five out of eight pentads after that pentad have rainfall more than the climatological mean (Wright et al., 2017). Onset pentads between 2003–2012 are shown in Table 1. We used GPCP daily data to compute 5 d (pentad) of rainfall. We compute rainfall time series during the three early-onset (2007, 2011, and 2012) and three late-onset (2003, 2006, and 2010) years in Fig. 1a. The differences in rainfall and other parameters, including cloud cover, AOD, wind speed of the AEJ-S, and radiation fluxes from June to September between the early- and late-onset years are computed.
We compute cloud cover from CERES and AOD from MODIS data sets. We compute pentad values of low, mid-low, mid-high, and high cloud cover (percent) over the domain. To compute AOD, we used daily Aqua MODIS AOD data and averaged over 5 consecutive days to estimate pentad AOD values over the domain. To understand the relationships between rainfall onset and meteorological, as well as dynamical, conditions over the domain, we have computed various other parameters from various satellites and ERA-Interim reanalysis data sets. We compute net downward shortwave energy (SWnet) as a difference between the downward shortwave energy and upward shortwave energy at the surface from CERES data.
We use daily AIRS 2 m surface temperature (Ts) to calculate the pentad values over the domain. To detect the African easterly jets, we use ERA-Interim zonal and meridional wind data. For the southern African easterly jet (AEJ-S), we use the 650 hPa between 5–15∘ S and 12–24∘ E (Adebiyi and Zuidema, 2016). We show the wind map of the jet over the domain in Fig. 3. We also use wind speed and direction in our analysis to show the maps of the easterly jets at 650 hPa. To compute divergence, we have used the divergence equation as follows:
where u and v are the zonal and meridional wind, and x and y are the longitudinal and latitudinal distances, respectively.
Figure 2a shows a time series of precipitation over the domain during the early- and late-onset years. Precipitation (Fig. 2a) and high cloud cover (Fig. 2b) increase during August (42nd–48th pentads) when the wet season is early (blue stars; Fig. 2a) compared to their slower pick-up during the late-onset years (red circles; Fig. 2a). The wet season starts in late August to early September during the early-onset years, unlike the late-onset years when the onset delays until October (Table 1). The rainforest also receives less rain (∼ 1 mm per day) during the late-onset years (Fig. 2d). However, low cloud cover is larger during the late-onset years after the 38th pentad as compared to the early-onset years (up to 11 %; Fig. 2c). Although low clouds can also induce surface cooling, our results show the low cloud cover is higher during the late onset years when the rainforest surface is warmer than the early onset years. The reason why we do not observe the cooling effect from the low clouds on surface cooling could be related to the fact that the low cloud fraction is large over the Angolan coast (∼ 70 %) but sharply decreases inland. Low cloud cover is below 15 % east of 12∘ E during June–September (pentads 30–54; Dommo et al., 2018).

Figure 2(a) Mean precipitation time series during the early- (blue) and late-onset (red) years at each pentad. Blue stars (red circles) represent the timing of the early- (late-)onset years. Rainfall ranges represent precipitation of individual early- or late-onset years. Mean high and mid-high cloud cover (b) and low and mid-low cloud cover (c) during the early- and late-onset years. Vertical lines show the ranges of onset times during the early (blue) and late (red) years. (d) Maps of precipitation differences between the late- and early-onset years using GPCP data. The shading indicates two sigma errors.
Figure 3a–d show the differences in the δTs (shaded contours), the 650 hPa wind speed (arrows; δWind), and wind direction over the domain between the early- and late-onset years from June to August. They show that the Congo rainforest is cooler by more than 3 K in June–August prior to the early onsets. Such a cooling creates an early and stronger meridional temperature gradient throughout boreal summer before the wet season starts during the early-onset years. As a result, δWind at 650 hPa is easterly as early as in June between 8–16∘ S (Fig. 3a). The wind speed difference between the early- and late-onset years is significant (> 3 m/s) with respect to the climatological mean speed of ∼ 7 m/s (Adebiyi and Zuidema, 2016). The wind is westerly during the late-onset years in June (Fig. S2 in the Supplement) but is easterly during early-onset years below 10∘ S, where the AEJ-S is generally known to form (Adebiyi and Zuidema, 2016). The AEJ-S is known to form over the Southern Hemisphere and gradually move towards the Equator as the wet season approaches. In July (Fig. 3b), the easterly δwind spreads over most of the domain. Stronger easterly wind is also noted in July–September (Fig. S2). δWind is cyclonic in the Southern Hemisphere in August (Fig. 3c) and over the Congo rainforest in September (Fig. 3d) during the early-onset years compared to the late-onset years. Consequently, Fig. 5 shows that the Southern Hemisphere is more convergent during the early-onset years. As a result, high cloud cover (Fig. 2b) and precipitation (Fig. 2a) increase from August, and the wet season onsets as precipitation gradually increases. These findings suggest that stronger surface cooling and earlier formation of the AEJ-S lead to an earlier wet season onset. The differences in Ts between the early- and late-onset years is also observed when we plot the actual temperature (Fig. S1). A slightly higher temperature is observed in the bottom row (late-onset years). It should be noted that, in June–July, the Sun is in the Northern Hemisphere. Thus, a slight difference in the temperature due to the aerosols in the Southern Hemisphere can lead to the formation of the AEJ-S.
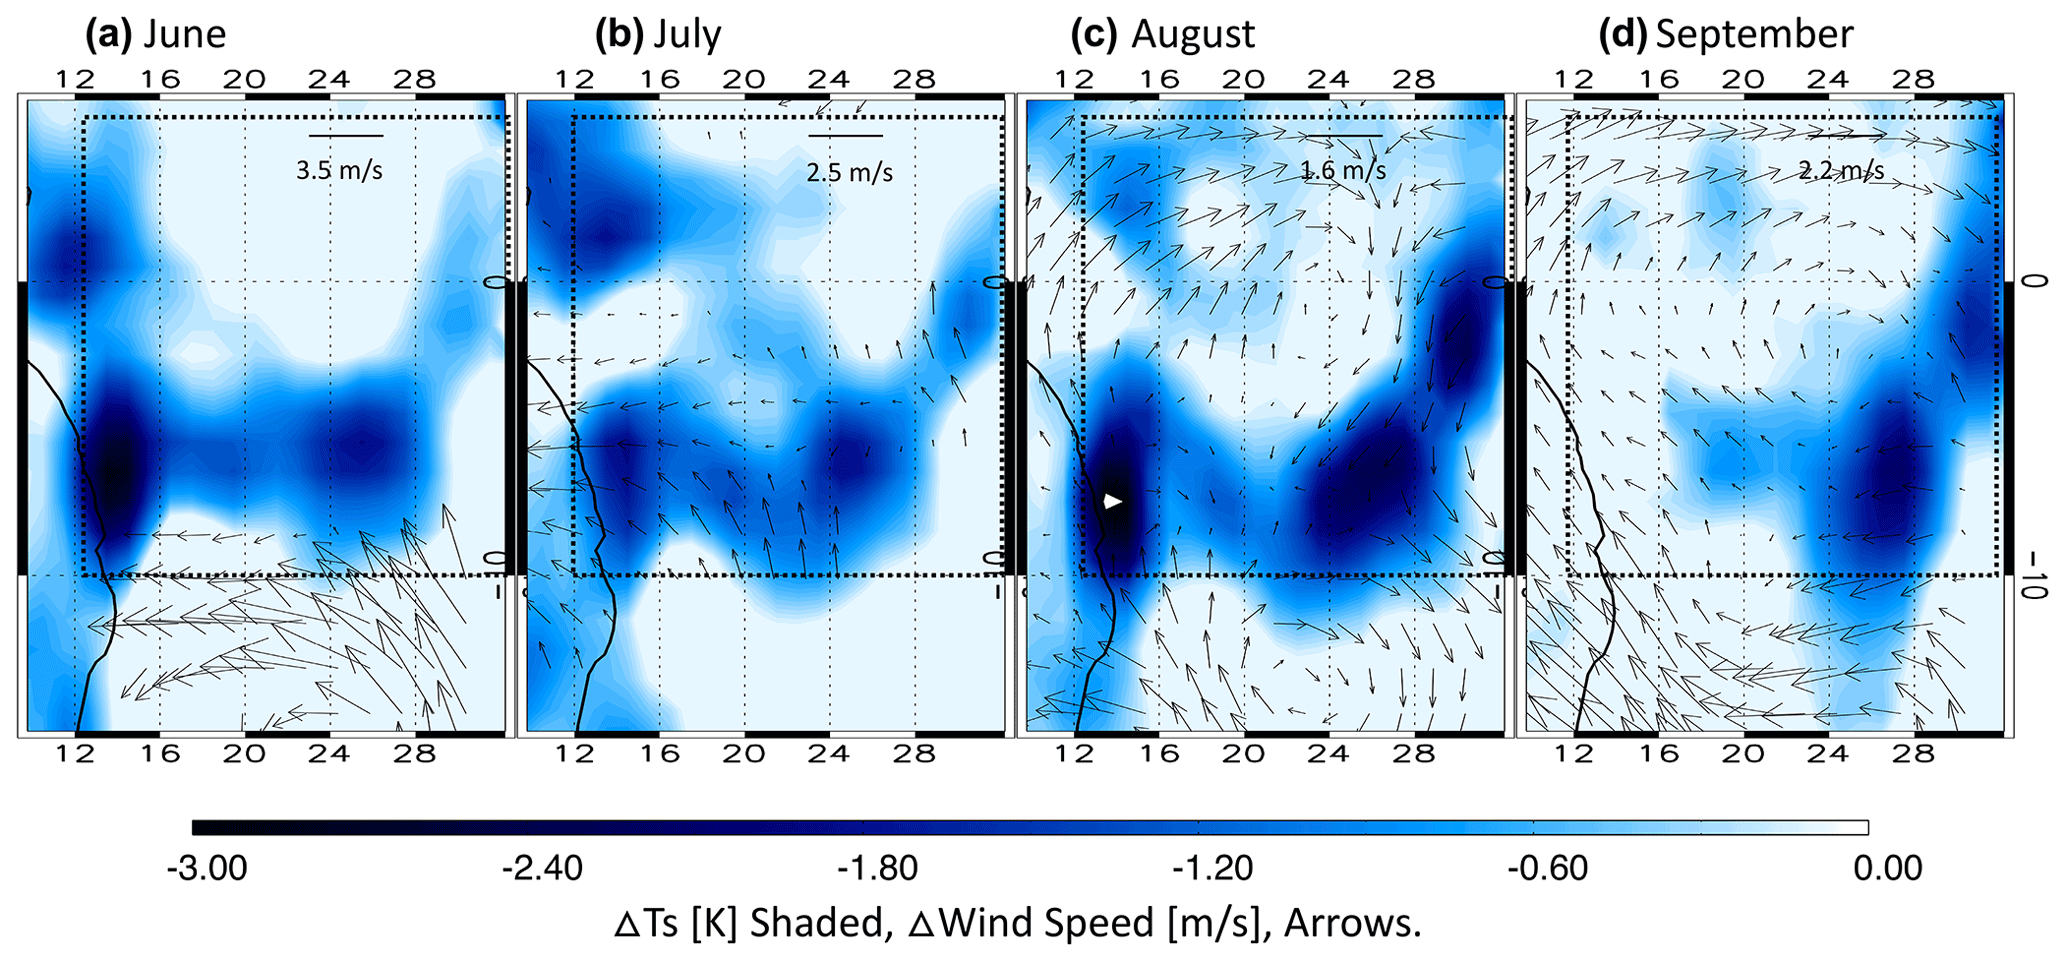
Figure 3Map of differences in 2 m skin temperature (δTs; shaded contours) from AIRS and 650 hPa δwind (arrows) from ERA-Interim between (a) 30th–36th pentads (June), (b) 36th–42nd pentads (July), (c) 42nd–48th pentads (August), and (d) 48–54th pentads (September) between 3 early-onset years (2007, 2011, and 2012) and 3 late-onset years (2003, 2006, and 2010). Only the easterly winds are shown in (a) and (b) to show the location of AEJ-S.
Figure 4 shows the differences in various parameters related to the wet season onset between the early- and late-onset years. Figure 4a shows that δAOD is positive during the early-onset years from the 28th pentad (late May). The accumulation of aerosols in the early-onset years is higher during the 30th–39th pentads and continues until the 45th pentad. The surface during the early-onset years is cooler (Fig. 4b) than the late-onset years, with the strongest cooling coinciding to (domain mean δTs ∼ −0.7 K), with the higher δAOD during the 30th–38th pentads in June to mid-July. All-sky δSWnet is less (Fig. 4c) compared to the late-onset years. The reduced all-sky δSWnet can be attributed to higher δAOD (Fig. 4a) during the 30th–38th pentads as cloud cover difference is insignificant (Figs. 2b and c) during that time. The role of AOD on the surface cooling is confirmed in Fig. 4d, which shows that the clear-sky δSWnet reaches up to −10 W/m2 during the 30th–38th pentads. A strong negative correlation exists between the clear-sky δSWnet and δAOD during the 30th–48th pentads (.9; Fig. 4e), suggesting that aerosols play a significant role in reducing the SWnet over the rainforest during the early-onset years. A lower all-sky and clear-sky δSWnet give rise to a lower δTs. Hence, these results suggest that aerosols have a strong impact on the timing and strength of the AEJ-S by reducing SWnet at the surface and Ts over the Congo rainforest. Such a cooling begins as early as June and continues throughout the summer during the early-onset years.
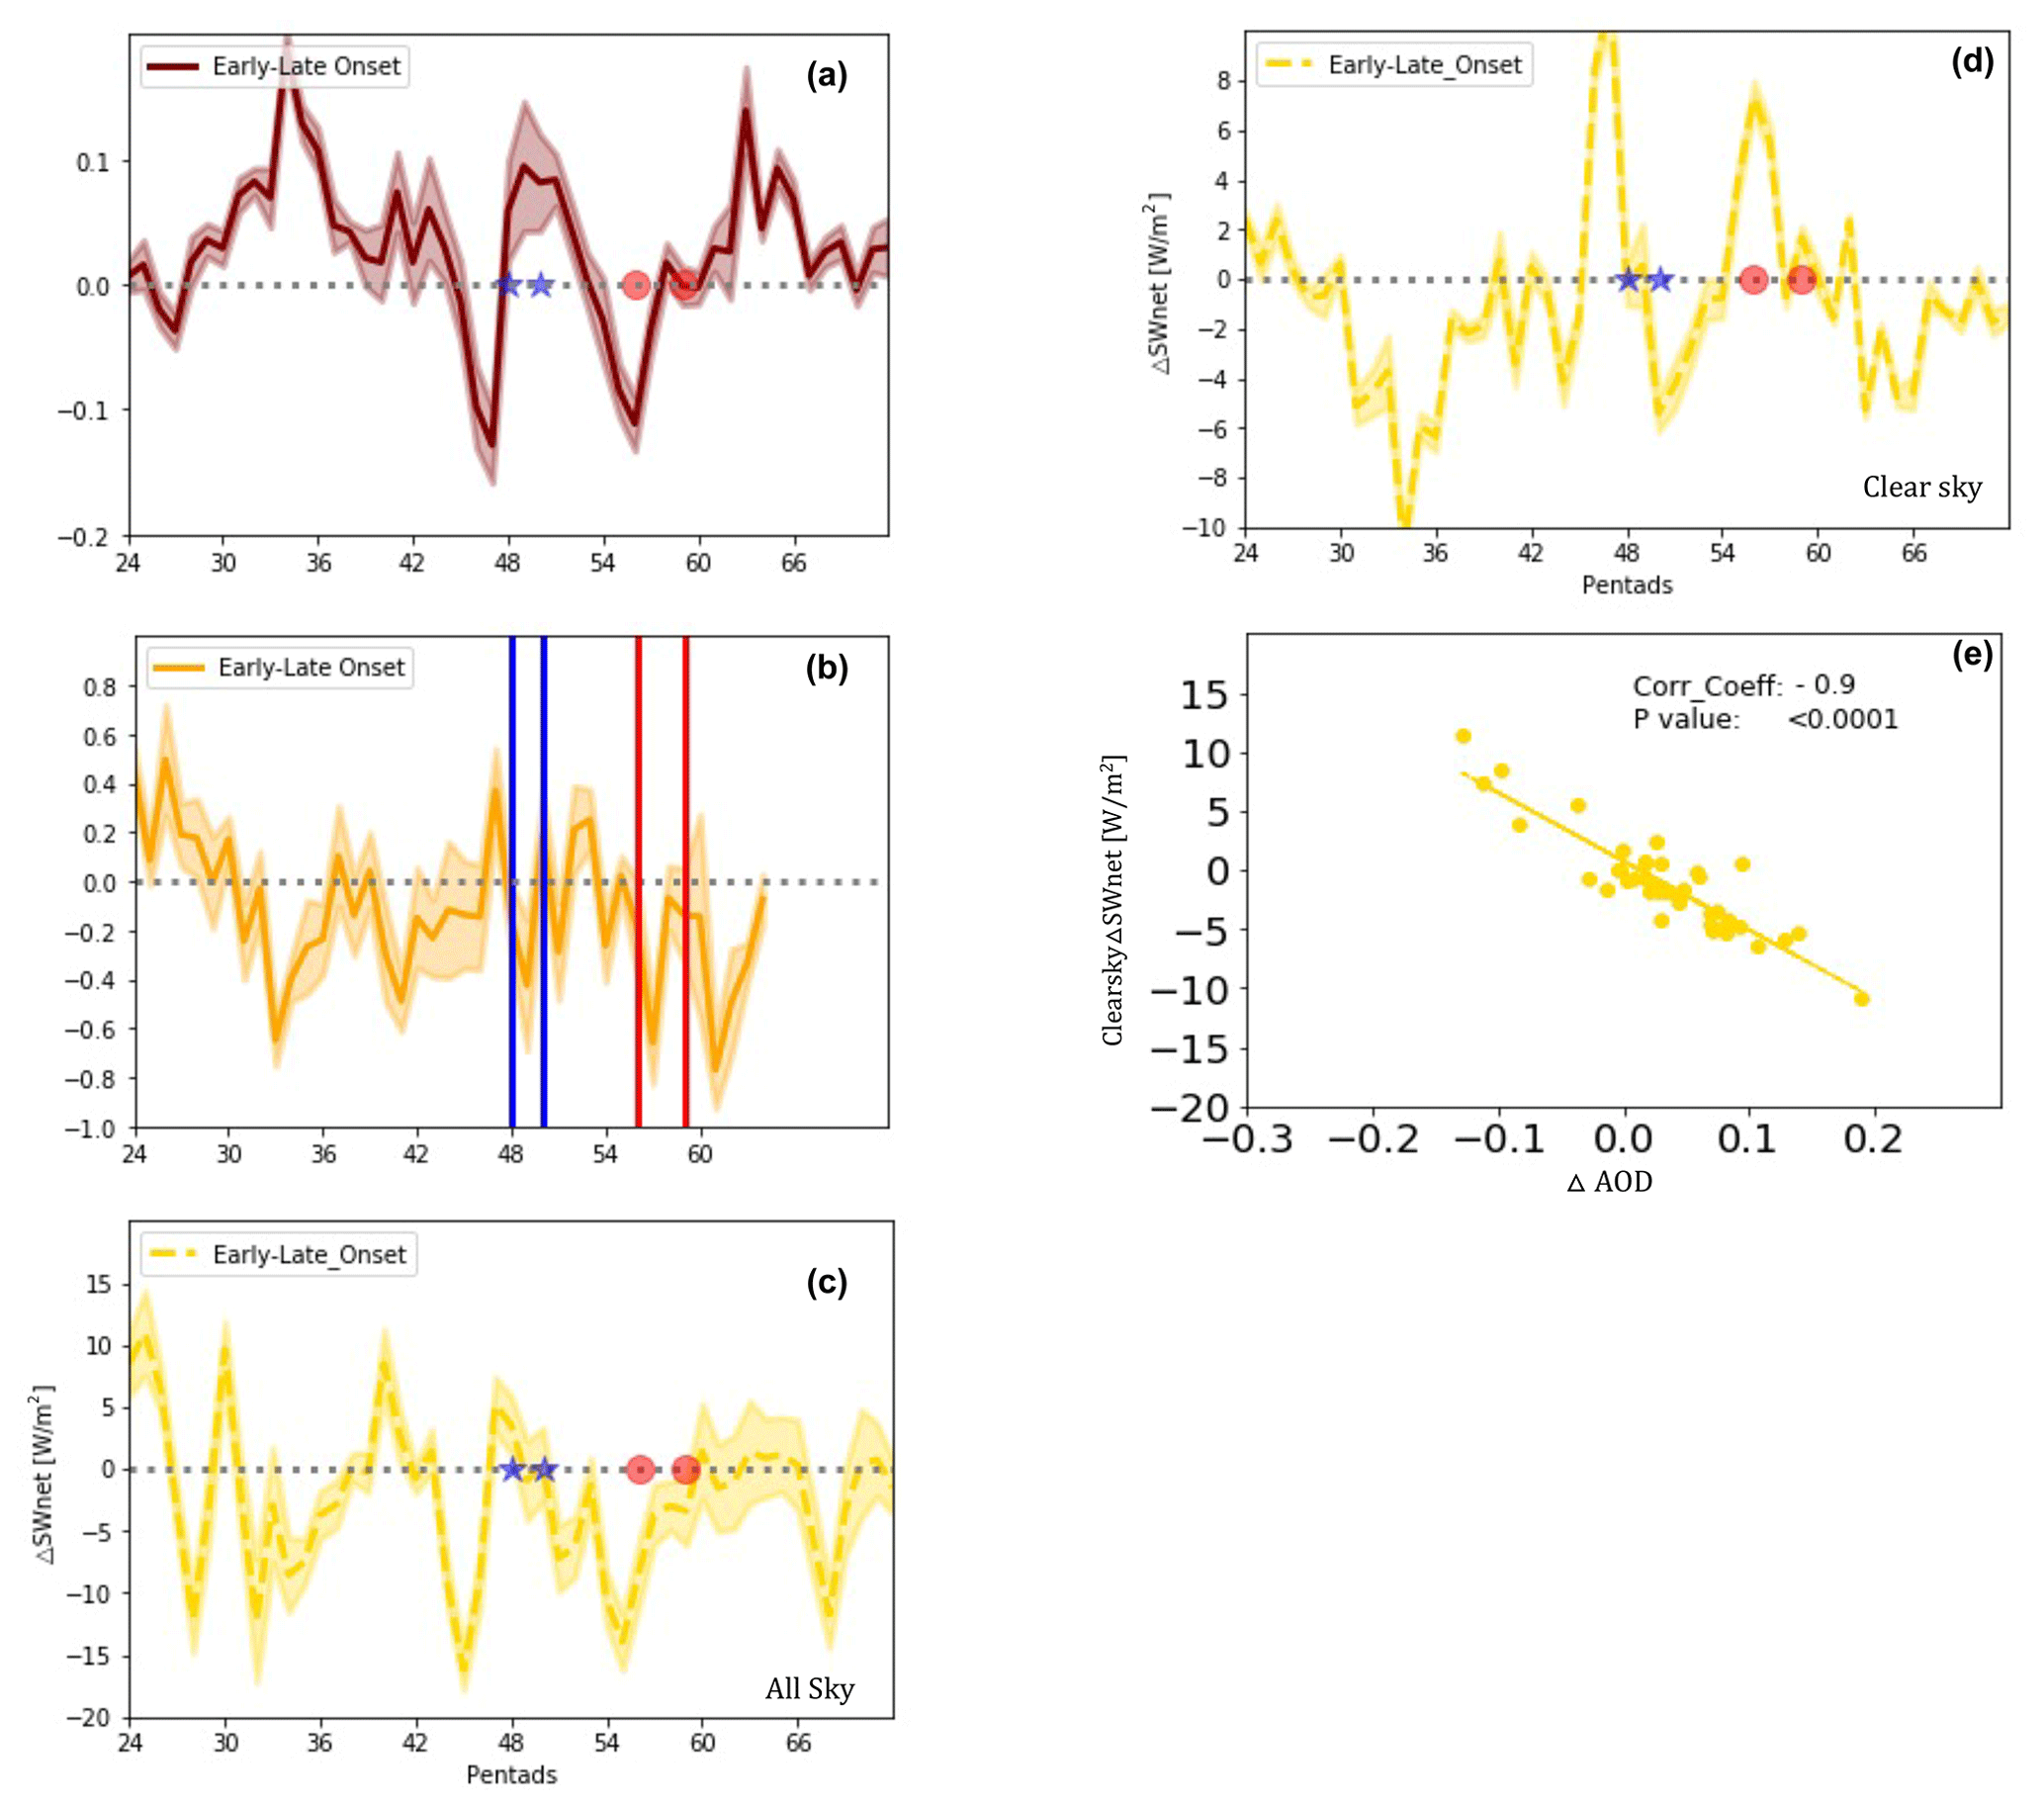
Figure 4(a) Differences in MODIS AOD (δAOD) from the 24th (day 120) pentad to the 72nd pentad (day 360). (b) As in (a) but for δTs from AIRS. Values up to the 66th pentad are shown due to data unavailability in some days after the 66th pentad. (c) As in (a), showing the all-sky net downward shortwave energy difference at the surface (δSWnet) from CERES. (d) As in (a) but for clear-sky net downward shortwave energy difference at the surface (δSWnet) between the early- and late-onset years from CERES. (e) Correlation between δAOD difference (in Fig. 3a) and clear-sky δSWnet (in Fig. 3d) between the early- and late-onset years at the surface. The shading shows two sigma errors.
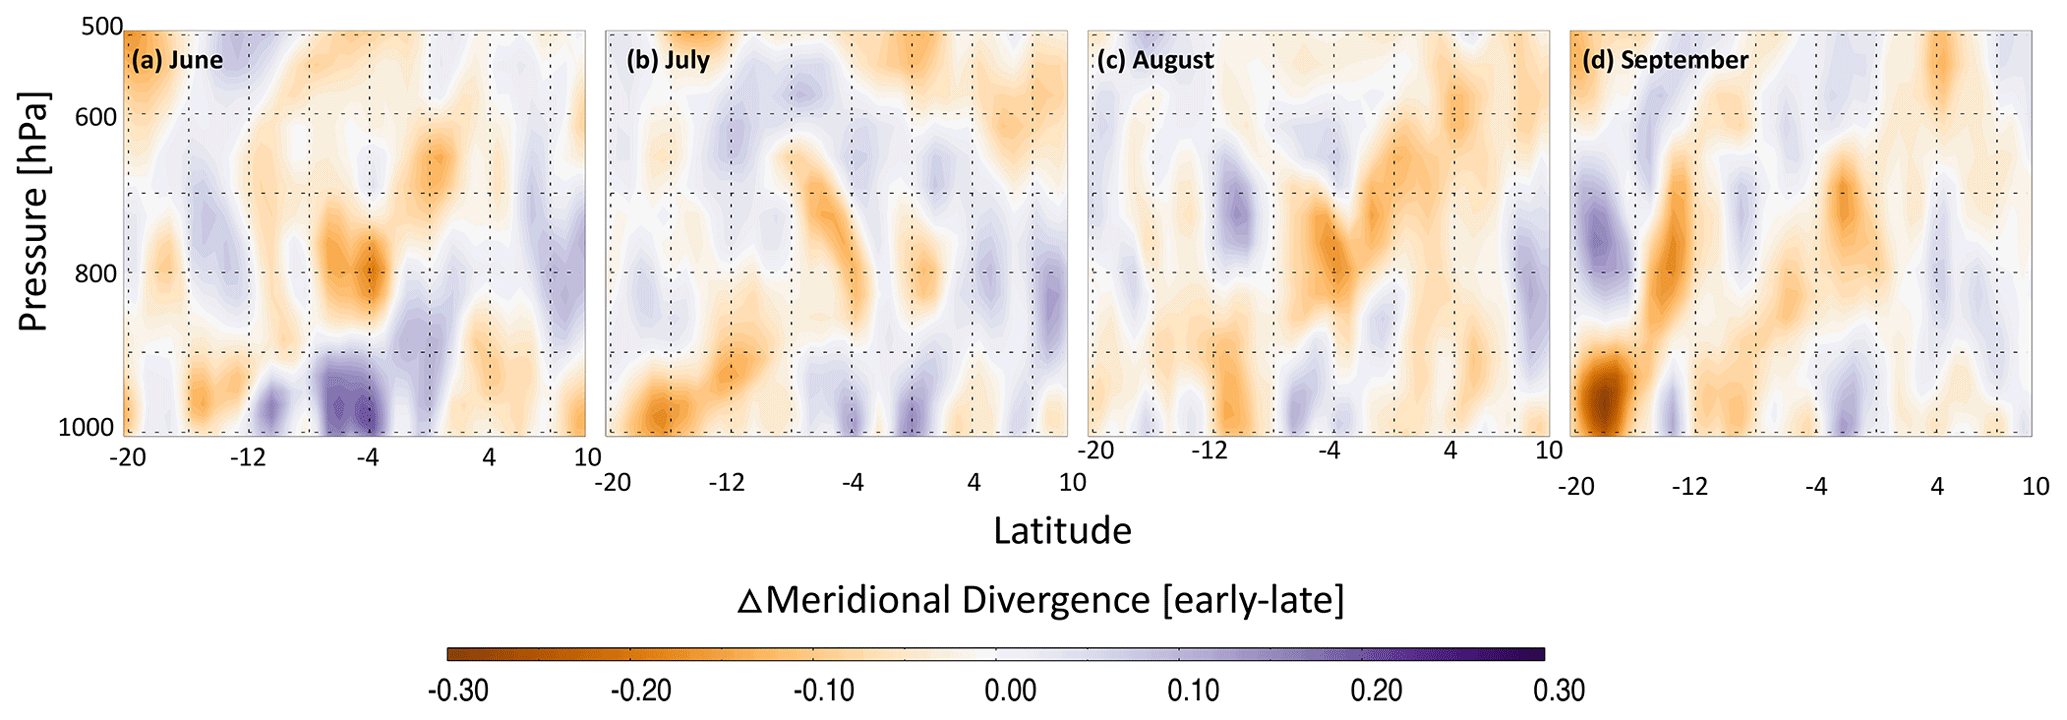
Figure 5Differences in the mean meridional divergence between 10∘ N and 20∘ S between 1000 and 500 hPa (y axis) averaged over 12–32∘ E, between the early- and late-onset years during (a) 30th–36th pentads (June), (b) 36th–42nd pentads (July), (c) 42nd–48th pentads (August), and (d) 48th–54th pentads (September).
Several important changes in the cloud cover, SWnet, precipitation, and AOD occur after the 40th pentad during the early-onset years. An early formation of AEJ-S and stronger easterly wind makes the Southern Hemisphere more convergent (Fig. 5). The domain (5∘ N–10∘ S) experiences a comparatively stronger convergence from August. Thus, high cloud cover (Fig. 2b) and precipitation (Fig. 2a) increase between the 42nd–48th pentads during the early-onset years as compared to late-onset years. δAOD also increases between the 40th–45th pentad (Fig. 4a). As a result, clear-sky δSWnet reduces by 5 W/m2 during 40th–45th pentads (Fig. 4d), whereas all-sky δSWnet reduces by 18 W/m2 during 43rd–47th pentads (Fig. 4c) because of higher high cloud cover (Fig. 2b). Although clear-sky δSWnet increases by ∼ 10 W/m2 during 45th–48th pentads as δAOD decreases due to higher precipitation and high/mid-high cloud cover, and all-sky δSWnet only increases by 5 W/m2 after the 47th pentad. Hence, δTs decreases by up to 3 K in August (Fig. 3c). Mean δTs over the domain decreases by 0.2–0.5 K (Fig. 4b) between 40th–46th pentads. These results point out that aerosol induced cooling in early boreal summer (June to mid-July) leads to higher cloud cover and precipitation in the late summer by influencing the timing and strength of AEJ-S and associated convergence. Such changes in cloud cover in the late summer play a significant role on the all-sky δSWnet and the domain Ts during the late summer (August). As a result, the onset timing is highly correlated with the AOD over the domain. The correlation (r) between the onset dates and the AOD averaged over June–August (Fig. 6) is −0.57 (blue dots and line; p value = 0.085). When June AOD is correlated with the onset dates, correlation coefficient becomes even stronger (red dots and line; r = −0.72; p value = 0.02). These results indicate a close relationship between the dry period AOD and the wet season timing over the Congo basin.
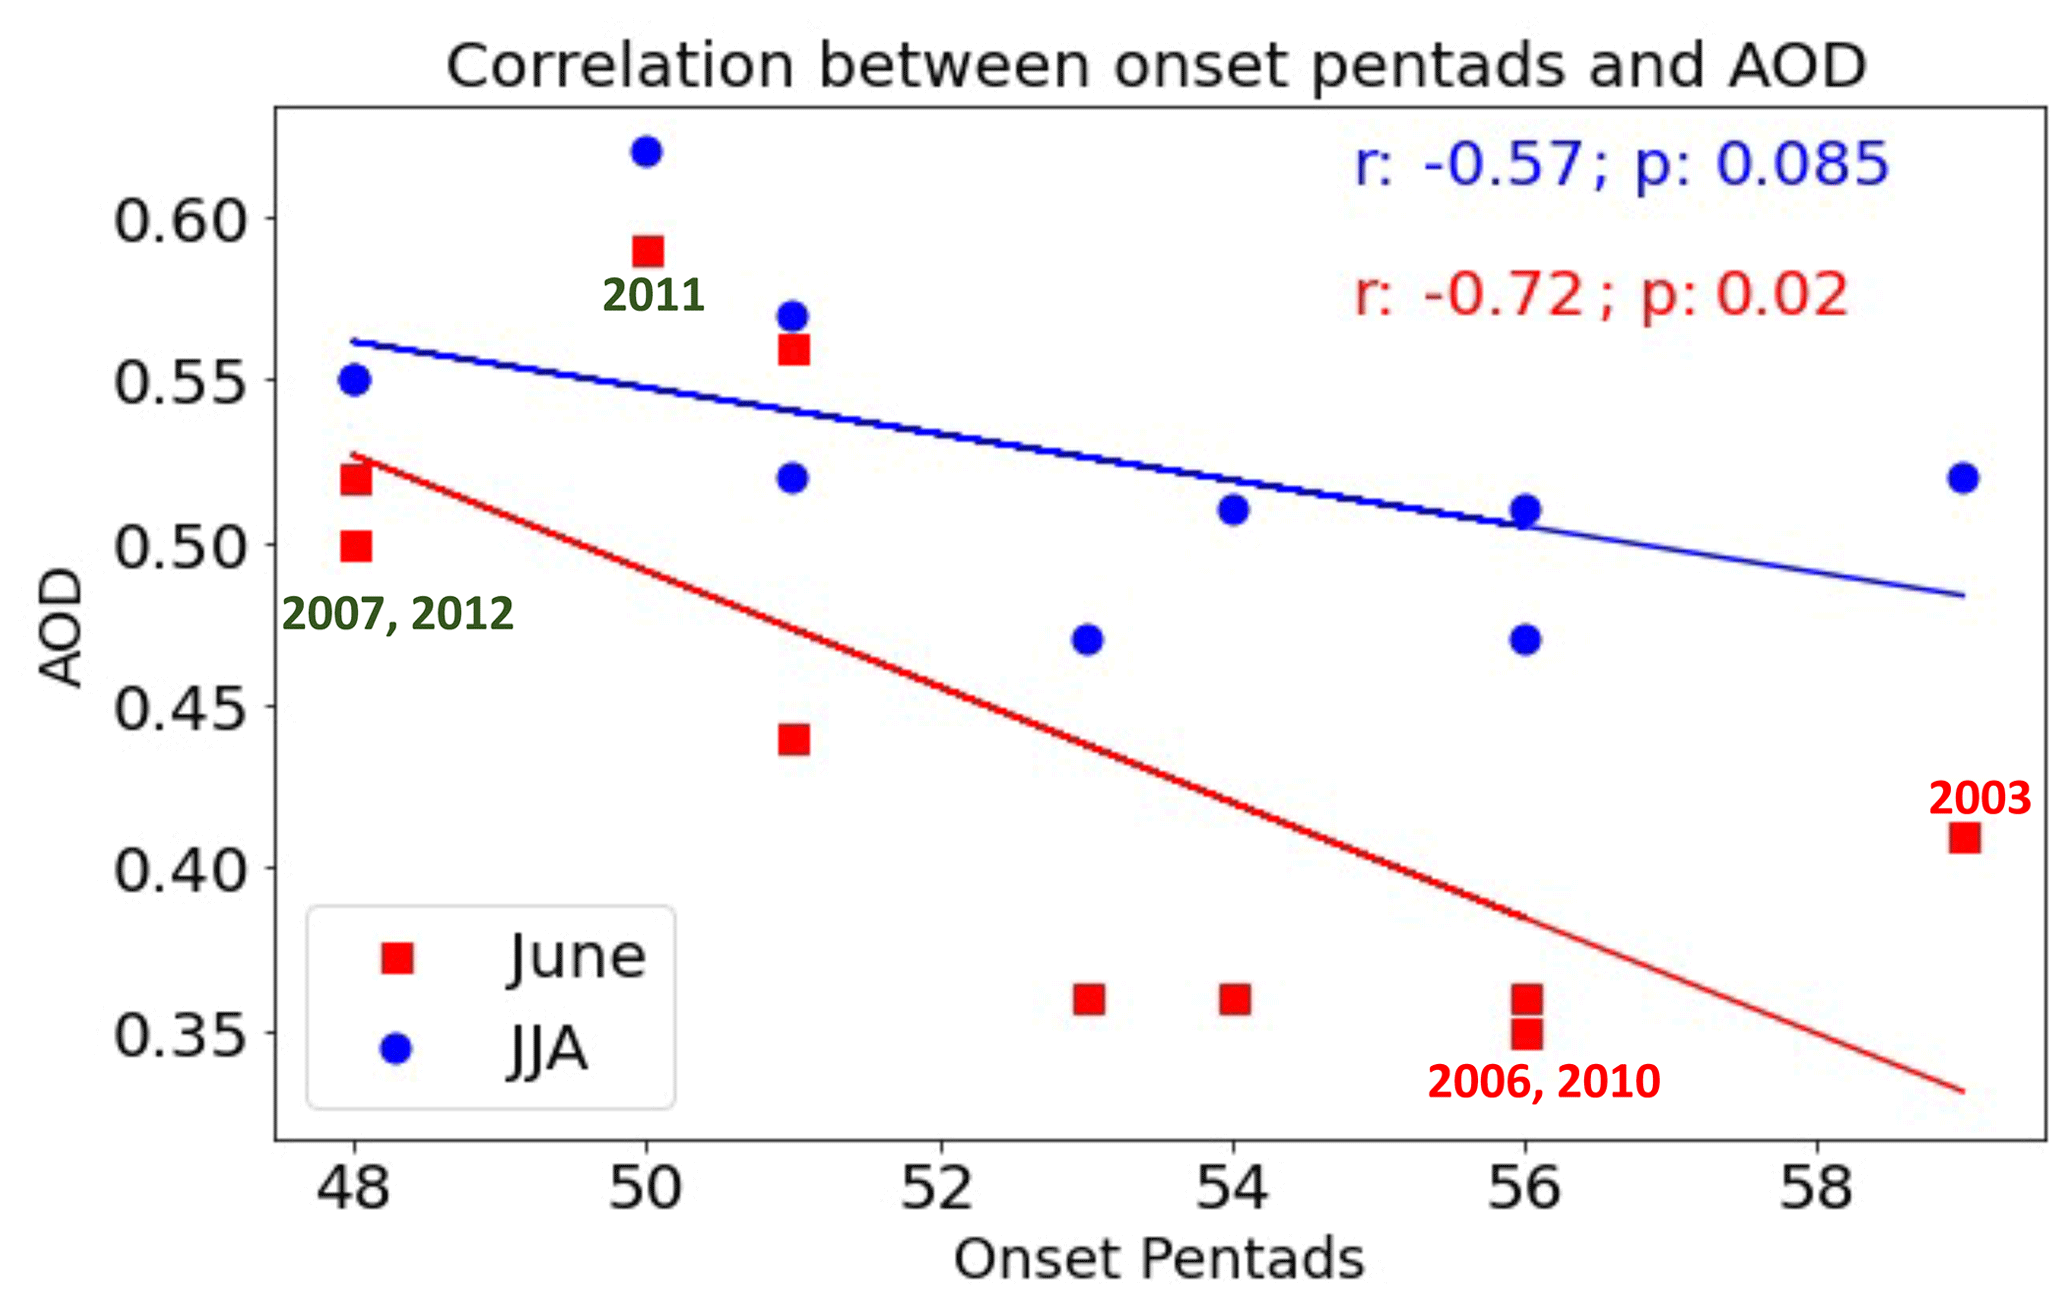
Figure 6Correlation between the domain mean AOD between June and August and June with the onset pentads. The early- and late-onset years have also been marked.
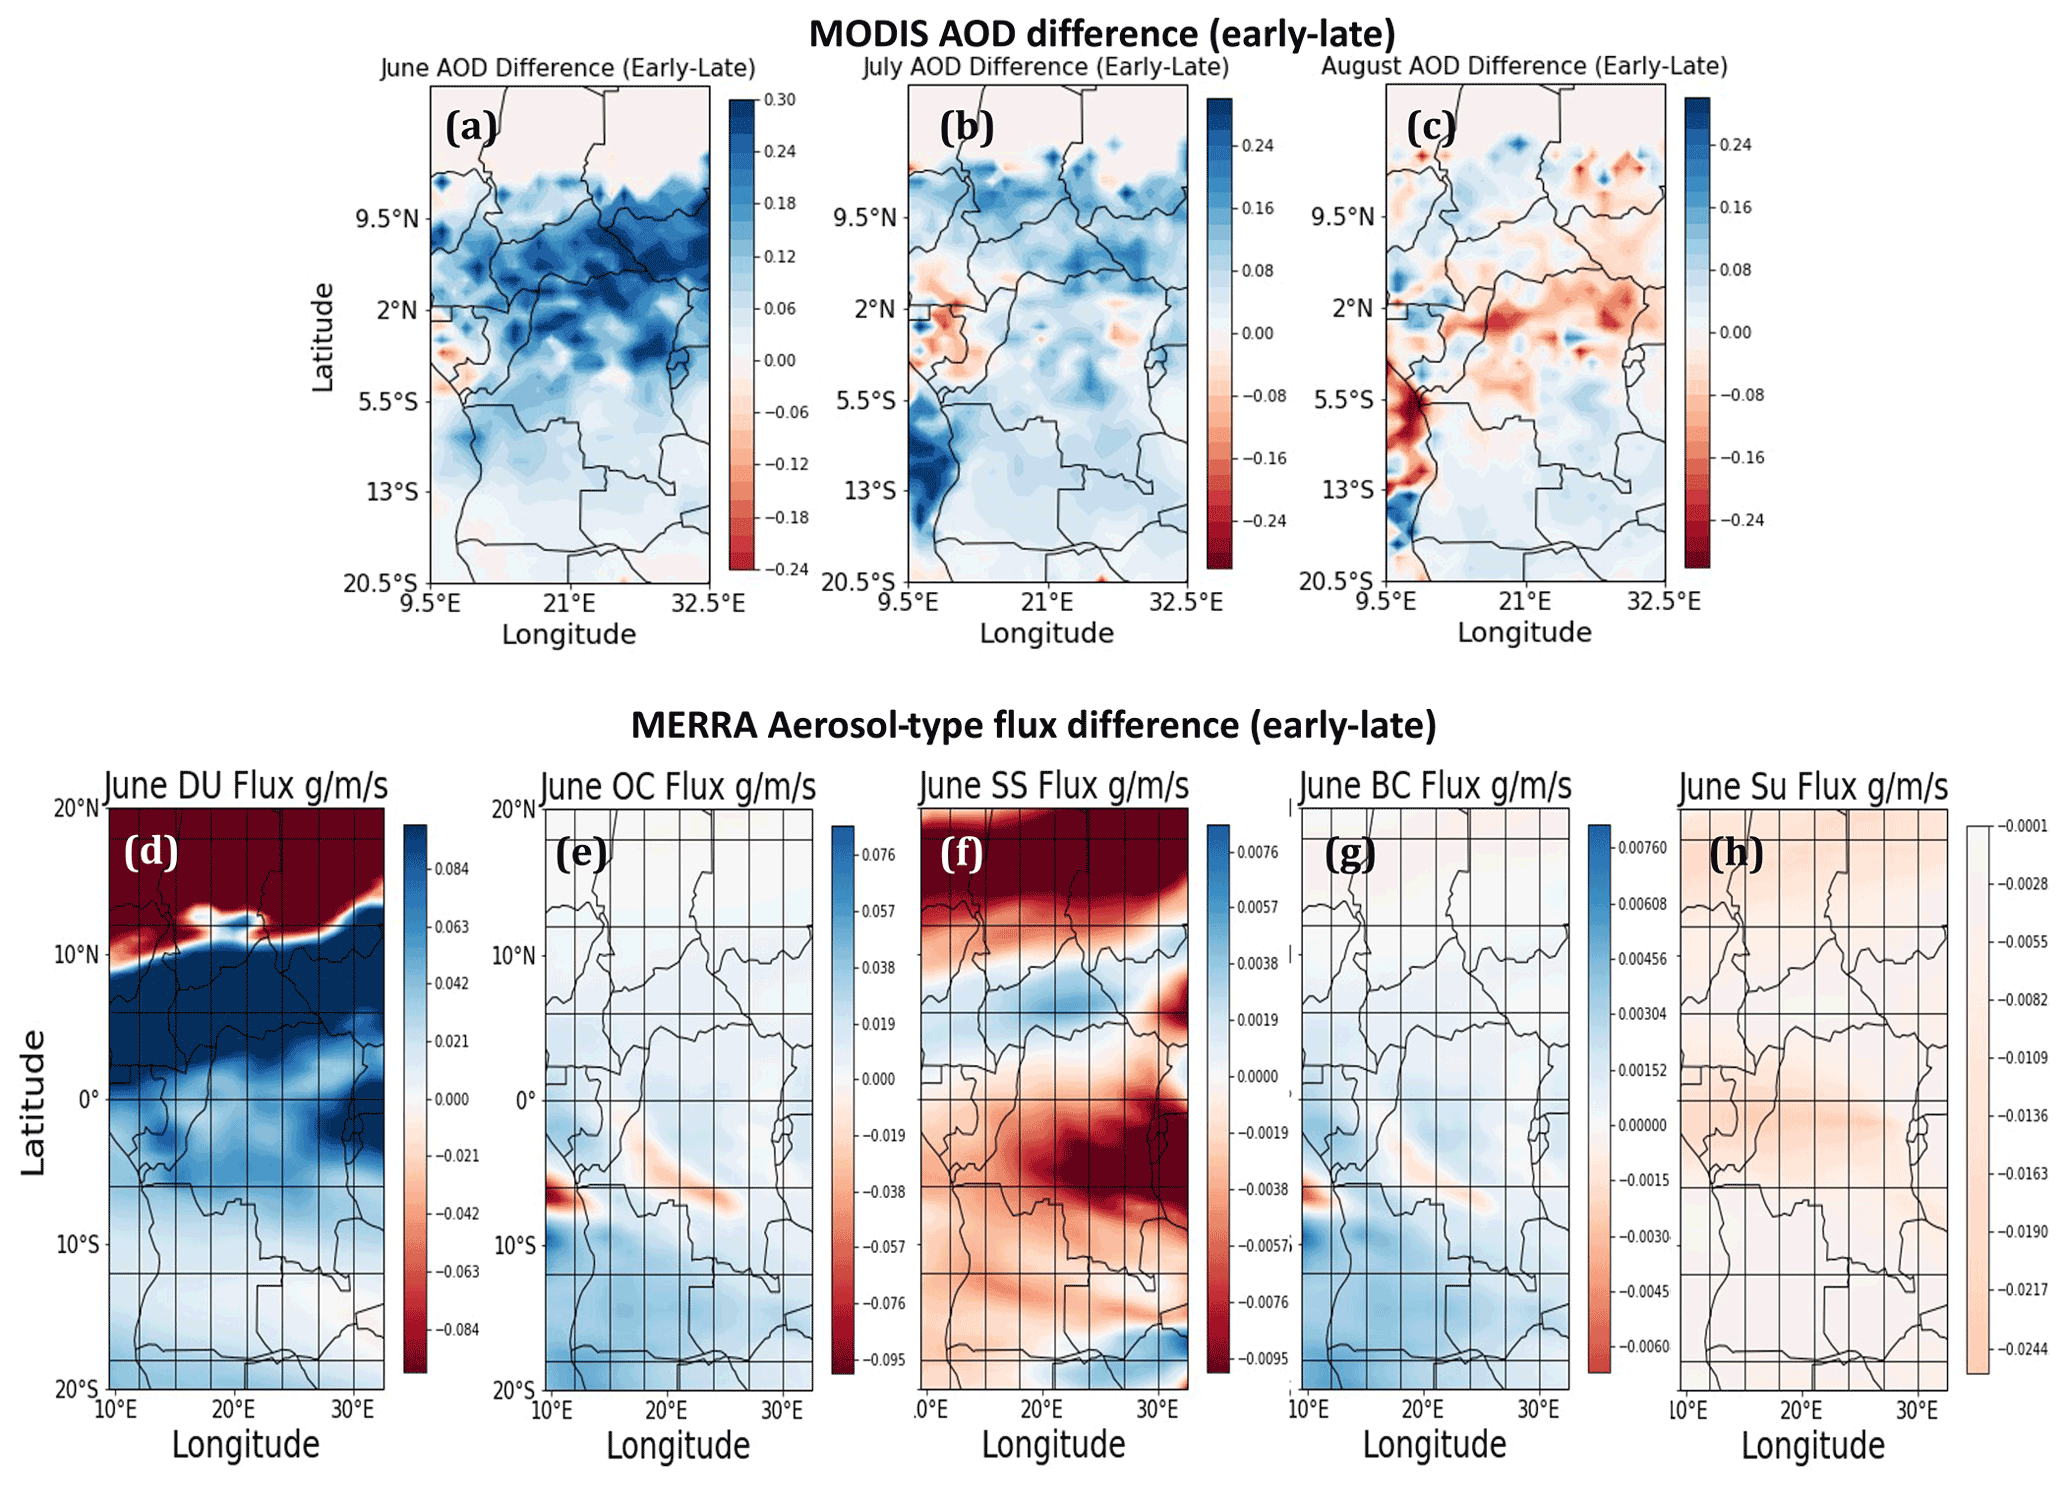
Figure 7Maps of MODIS AOD difference (δAOD) between the early- and late-onset years in (a) June, (b) July, and (c) August. Differences in MERRA-2 integrated aerosol mass flux for five different species, i.e., (d) dust, (e) organic carbon, (f) sea salt, (g) black carbon, and (h) sulfate between the early- and late-onset years during June are shown.
Maps of δAOD from MODIS data are shown in Fig. 7a–c that confirm that the largest difference in AOD is seen in June when δTs is the highest and the AEJ-S begins (Fig. 3a). We further analyze the integrated aerosol mass flux data sets from MERRA-2 reanalysis products to understand what species of aerosols dominate the higher aerosol loading over the rainforest in June. Our analyses show that there is a reasonable agreement between MODIS June AOD (Fig. 7a) and MERRA-2 dust mass flux (Fig. 7d). The differences in AOD between the early- and late-onset years is primarily due to the changes in the dust concentrations (Fig. 7d) based on the MERRA-2 integrated aerosol mass flux data sets (Randles et al., 2017). The cause of the dust appears to be the long-range transport from the eastern Saharan Desert and the Arabian Desert along the track of the AEJ-N. These results suggests that the strength and location of AEJ-N might play an important role in the aerosol transport from the eastern Saharan Desert and the Arabian Desert and, thus, on the aerosol concentration over the Congo rainforest and associated early wet season onset.
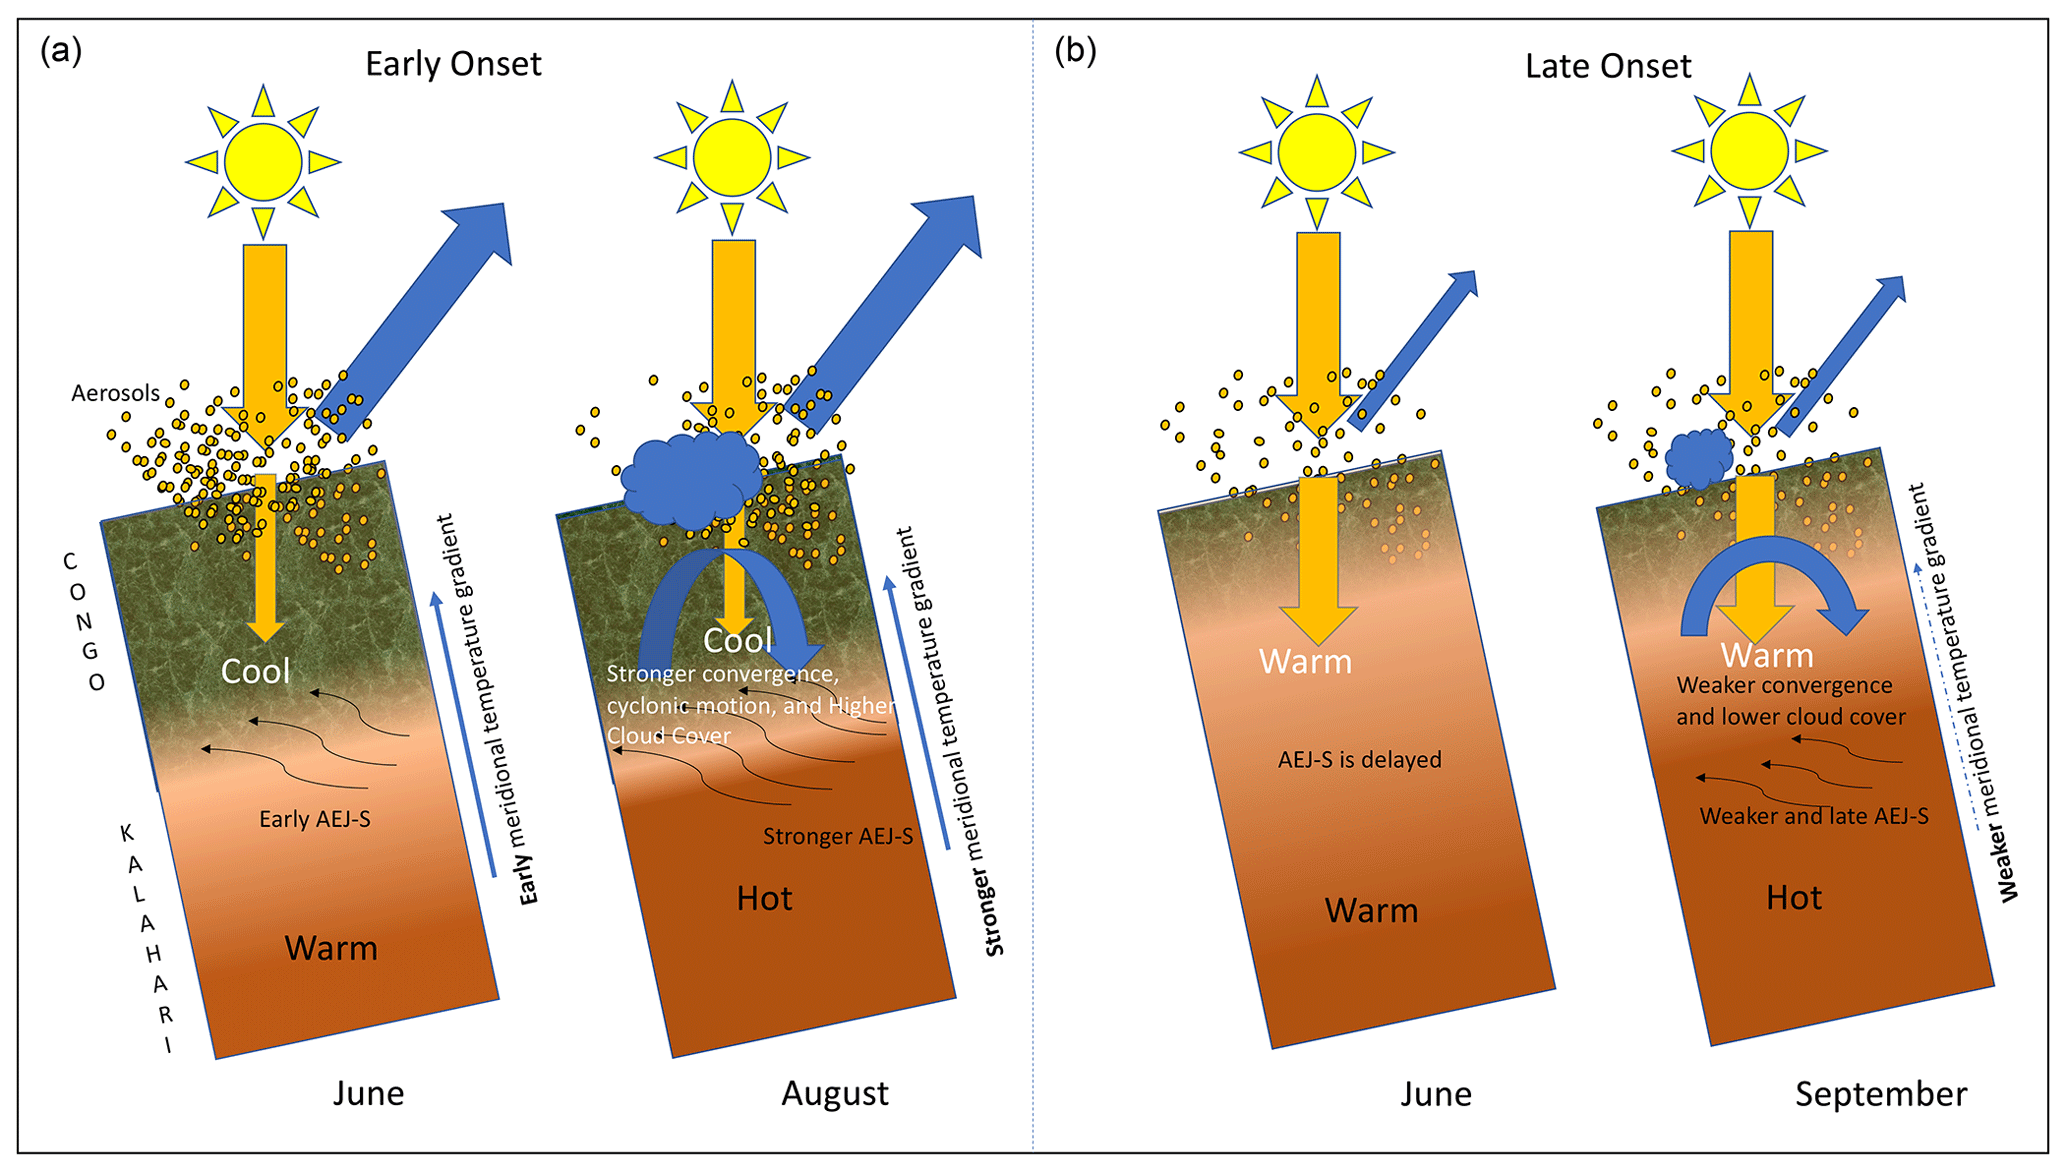
Schematics in Fig. 8 summarize the early- and late-onset mechanism and how aerosols play a vital role in such differences. We highlight the mechanism as follows:
-
Higher aerosol concentrations during the early-onset years enhance the reflection and scattering of the incoming solar energy in June. Thus, the rainforest receives a lesser amount of downward shortwave energy.
-
Consequently, the Ts decreases and is driven by the meridional temperature gradient between the rainforest and the Kalahari Desert, so the AEJ-S forms early.
-
As a result, the region experiences a relatively stronger convergence and the circulation is also relatively cyclonic in the early-onset years as compared to the late-onset years in June–July. High cloud cover (Fig. 2b) gradually increases and leads to a further reduction in all-sky δSWnet and δTs in August. High cloud cover and precipitation (Fig. 2a), which were insignificantly different in June–July, become significantly higher in the early-onset years (up to 11 %) in August and the wet season onsets in late August to early September.
-
As the equatorward convergence increases, a stronger cyclonic circulation develops over the region, high cloud cover increases that lead to a reduction in all-sky δSWnet and δTs, and the wet season onsets in late August to early September.
-
In contrast, aerosol concentrations are less during the late-onset years. Hence, a higher amount of solar energy reaches the surface and the rainforest Ts is higher than the early-onset years. Therefore, the meridional temperature gradient is weaker or becomes negative in the Southern Hemisphere with the Congo rainforest (Kalahari Desert) being warmer (cooler) during the boreal summer (austral winter; June–August). Consequently, the AEJ-S is delayed, domain experiences weaker convergence, and high cloud cover does not increase in August as in the early-onset years. In September, as the Sun moves southward, the Kalahari Desert warms up. Compared to the early-onset years, a weaker meridional temperature gradient develops across the rainforest and the desert since the rainforest Ts is higher (Fig. 3d) during the late-onset years. As a result, the AEJ-S is weaker. Not only is the wet season delayed and the dry season lengthens, the Congo rainforest also receives less precipitation.
The above analysis results highlight the interconnections between the aerosols' radiative effect and the wet season onset timing by decreasing Ts, increasing meridional temperature gradient, and influencing onset timing and strength of AEJ-S, as well as associated convergence. It is important to note that the meridional temperature gradient increases 2–3 months before the wet season onset due to the surface cooling, which is caused by the aerosols' dimming effect as the Kalahari Desert is still cold during that time of the year. Because the main driver of the jet is the meridional temperature gradient between the warm/dry Kalahari Desert and the moist Congo rainforest, a reduction in the rainforest Ts (Figs. 3a–d and 4b) in the summer leads to an earlier and stronger AEJ-S during the early-onset years. Our results highlight an important connection between the reductions in the clear-sky δSWnet in early summer (June to mid-July) due to aerosols, all-sky δSWnet in the late summer (August) due to a higher cloud cover, and early wet season onset.
These results indicate a plausible significant threat to the future of the Congo rainforest. Between 2003–2012, the regional temperature has increased by 1.1 ∘C, and the boreal summer dry season is increasing (Zhou et al., 2014). Thus, a projected increase in the global temperature anywhere between 1.1 to 5.4 ∘C by 2100 (https://www.climate.gov/news-features/understanding-climate/climate-change-global-temperature-projections, last access: 21 August 2021) might be enough to offset a net mean rainforest cooling of ∼ 1 ∘C required (Fig. 4b) for an early wet season onset over the region. This study shows that aerosols may have a significant impact on the wet season onset timing over the Congo rainforest by reducing the rainforest Ts. However, aerosols may not be the only factor behind the decrease in the rainforest Ts. As seen in Fig. 4, change in the rainforest δSWnet (Fig. 4c, d) is strongly correlated with the δAOD (Fig. 4a); however, the changes in δTs (Fig. 4c) do not always follow the changes in δSWnet, and δAOD and may also depend on the cloud cover. Further studies using model simulations are needed to understand the relative contribution of aerosols on the wet season onset to separate the roles of other meteorological and dynamical parameters that might also cause the reduction in Ts.
Our analysis, using MERRA-2 reanalysis data, indicates that the location and strength of the AEJ-N and the tropical easterly jet might play an important role in the AOD variation (Fig. 7). However, further analysis is required to tease out the role of these jets and their interannual variability in the dust mass flux and wet season onset. MERRA-2 reanalysis data suggest the possibility of long-range aerosol transport by the AEJ-N. A detailed analysis using satellite and ground-based measurements and model simulations can shed more light on the role of dynamics on the aerosol concentration. It is necessary to continue investigating the impacts of global warming, large-scale circulation change, land use, and canopy cover change due to deforestation on the wet season onset over the Congo rainforest. The microphysical effect of aerosols also needs further study.
All satellite data used in this study can be downloaded from the Earth Observing System Data and Information System (EOSDIS) Distributed Active Archive Centers (DAACs, 2021) at https://earthdata.nasa.gov/eosdis/daacs. Please contact the corresponding author for any questions about how to download the data that are publicly available and also regarding the codes written in IDL and Python. The links to download the individual satellite datasets have been provided in the Data and Methodology section (Sect. 2.1).
The supplement related to this article is available online at: https://doi.org/10.5194/acp-21-12855-2021-supplement.
SC, JHJ, HS, and RF designed the research and wrote the paper. SC analyzed the data.
The authors declare that they have no conflict of interest.
Publisher's note: Copernicus Publications remains neutral with regard to jurisdictional claims in published maps and institutional affiliations.
This work was conducted at Jet Propulsion Laboratory, California Institute of Technology, under contract with NASA. This work has partly been supported by NASA ROSES CCST program.
This research has partly been supported by NASA ROSES CCST program.
This paper was edited by Bernhard Mayer and reviewed by two anonymous referees.
Adebiyi, A. A. and Zuidema, P.: The role of the southern African easterly jet in modifying the southeast Atlantic aerosol and cloud environments, Q. J. Roy. Meteor. Soc.,142, 1574–1589, https://doi.org/10.1002/qj.2765, 2016.
Adler, R. F., Huffman, G. J., Chang, A., Ferraro, R., Xie, P., Janowiak, J., Rudolf, B., Schneider, U., Curtis, S., Bolvin, D., Gruber, A., Susskind, J., and Arkin, P.: The Version 2 Global Precipitation Climatology Project (GPCP) Monthly Precipitation Analysis (1979–Present), J. Hydrometeor., 4, 1147–1167, 2003.
Berrisford, P., Dee, D. P., Poli, P., Brugge, R., Fielding, M., Fuentes, M., Kållberg, P. W., Kobayashi, S., Uppala, S. and Simmons, A.: The ERA-Interim archive Version 2.0, 23, available at: https://www.ecmwf.int/node/8174 (last access: 21 August 2021), 2011.
Chakraborty, S., Guan, B., Waliser, D. E., da Silva, A. M., Uluatam, S., and Hess, P.: Extending the Atmospheric River Concept to Aerosols: Climate and Air Quality Impacts, Geophys. Res. Lett., 48, e2020GL091827, https://doi.org/10.1029/2020GL091827, 2021.
Cook, K. H.: Generation of the African easterly jet and its role in determining West African precipitation, J. Climate, 12, 1165–1184, https://doi.org/10.1175/1520-0442(1999)012<1165:GOTAEJ>2.0.CO;2, 1999.
Cook, K. H. and Vizy, E. K.: The Congo Basin Walker circulation: dynamics and connections to precipitation, Clim. Dynam., 12, 1165–1184, https://doi.org/10.1007/s00382-015-2864-y, 2016.
Dezfuli, A. K. and Nicholson, S. E.: The relationship of rainfall variability in western equatorial africa to the tropical oceans and atmospheric circulation. Part II: The boreal autumn, J. Clim., https://doi.org/10.1175/JCLI-D-11-00686.1, 2013.
Dommo, A., Philippon, N., Vondou, D. A., Sèze, G., and Eastman, R.: The June-September low cloud cover in Western Central Africa: Mean spatial distribution and diurnal evolution, and associated atmospheric dynamics, J. Climate, 31, 9585–9603, https://doi.org/10.1175/JCLI-D-17-0082.1, 2018.
EOSDIS Distributed Active Archive Centers (DAACs): https://earthdata.nasa.gov/eosdis/daacs, last access: 21 August 2021.
Erfanian, A., Wang, G., and Fomenko, L.: Unprecedented drought over tropical South America in 2016: Significantly under-predicted by tropical SST, Sci. Rep., 7, 5811, https://doi.org/10.1038/s41598-017-05373-2, 2017.
Fan, J., Wang, Y., Rosenfeld, D., and Liu, X.: Review of aerosol-cloud interactions: Mechanisms, significance, and challenges, J. Atmos. Sci., 73, 4221–4252, https://doi.org/10.1175/JAS-D-16-0037.1, 2016.
Gelaro, R., McCarty, W., Suárez, M. J., Todling, R., Molod, A., Takacs, L., Randles, C. A., Darmenov, A., Bosilovich, M. G., Reichle, R., Wargan, K., Coy, L., Cullather, R., Draper, C., Akella, S., Buchard, V., Conaty, A., da Silva, A. M., Gu, W., Kim, G.-K., Koster, R., Lucchesi, R., Merkova, D., Nielsen, J. E., Partyka, G., Pawson, S., Putman, W., Rienecker, M., Schubert, S. D., Sienkiewicz, M., and Zhao, B.: The Modern-Era Retrospective Analysis for Research and Applications, Version 2 (MERRA-2), J. Climate, 30, 5419–5454, https://doi.org/10.1175/JCLI-D-16-0758.1, 2017.
Gryspeerdt, E., Stier, P., White, B. A., and Kipling, Z.: Wet scavenging limits the detection of aerosol effects on precipitation, Atmos. Chem. Phys., 15, 7557–7570, https://doi.org/10.5194/acp-15-7557-2015, 2015.
Gueymard, C. A. and Yang, D.: Worldwide validation of CAMS and MERRA-2 reanalysis aerosol optical depth products using 15 years of AERONET observations, Atmos. Environ., 225, 117216, https://doi.org/10.1016/j.atmosenv.2019.117216, 2020.
Gupta, P., Remer, L. A., Levy, R. C., and Mattoo, S.: Validation of MODIS 3 km land aerosol optical depth from NASA's EOS Terra and Aqua missions, Atmos. Meas. Tech., 11, 3145–3159, https://doi.org/10.5194/amt-11-3145-2018, 2018.
Jackson, B., Nicholson, S. E., and Klotter, D.: Mesoscale convective systems over western equatorial Africa and their relationship to large-scale circulation, Mon. Weather Rev., 137, 1272–1294, https://doi.org/10.1175/2008MWR2525.1, 2009.
Jiang, Y., Zhou, L., Tucker, C. J., Raghavendra, A., Hua, W., Liu, Y. Y., and Joiner, J.: Widespread increase of boreal summer dry season length over the Congo rainforest, Nat. Clim. Change, 9, 617–622, https://doi.org/10.1038/s41558-019-0512-y, 2019.
Kaufman, Y. J., Tanre, D., and Remer, L. A.: SAFARI 2000 MODIS MOD04_L2 Aerosol Data, GRANT Format, for Southern Africa, ORNL DAAC, Oak Ridge, Tennessee, USA, https://doi.org/10.3334/ORNLDAAC/813, 2005.
Konzelmann, T., Cahoon, D. R., and Whitlock, C. H.: Impact of biomass burning in equatorial Africa on the downward surface shortwave irradiance: Observations versus calculations, J. Geophys. Res.-Atmos., 101, 22833–22844, https://doi.org/10.1029/96jd01556, 1996.
Laurent, B., Marticorena, B., Bergametti, G., Léon, J. F., and Mahowald, N. M.: Modeling mineral dust emissions from the Sahara desert using new surface properties and soil database, J. Geophys. Res.-Atmos., 113, D14218, https://doi.org/10.1029/2007JD009484, 2008.
Lavaysse, C., Chaboureau, J. P., and Flamant, C.: Dust impact on the west african heat low in summertime, Q. J. Roy. Meteor. Soc., 137, 1227–1240, https://doi.org/10.1002/qj.844, 2011.
Léon, J. F., Chazette, P., Pelon, J., Dulac, F., and Randriamiarisoa, H.: Aerosol direct radiative impact over the INDOEX area based on passive and active remote sensing, J. Geophys. Res.-Atmos., 107, INX2 5-1-INX2 5-10, https://doi.org/10.1029/2000JD000116, 2002.
Lewis, S. L., Brando, P. M., Phillips, O. L., Van Der Heijden, G. M. F., and Nepstad, D.: The 2010 Amazon drought, Science, 331, 554 pp., https://doi.org/10.1126/science.1200807, 2011.
Lewis, S. L., Sonké, B., Sunderland, T., Begne, S. K., Lopez-Gonzalez, G., van der Heijden, G. M. F., Phillips, O. L., Affum-Baffoe, K., Baker, T. R., Banin, L., Bastin, J. F., Beeckman, H., Boeckx, P., Bogaert, J., De Cannière, C., Chezeaux, E., Clark, C. J., Collins, M., Djagbletey, G., Djuikouo, M. N. K., Droissart, V., Doucet, J. L., Ewango, C. E. N., Fauset, S., Feldpausch, T. R., Foli, E. G., Gillet, J. F., Hamilton, A. C., Harris, D. J., Hart, T. B., de Haulleville, T., Hladik, A., Hufkens, K., Huygens, D., Jeanmart, P., Jeffery, K. J., Kearsley, E., Leal, M. E., Lloyd, J., Lovett, J. C., Makana, J. R., Malhi, Y., Marshall, A. R., Ojo, L., Peh, K. S. H., Pickavance, G., Poulsen, J. R., Reitsma, J. M., Sheil, D., Simo, M., Steppe, K., Taedoumg, H. E., Talbot, J., Taplin, J. R. D., Taylor, D., Thomas, S. C., Toirambe, B., Verbeeck, H., Vleminckx, J., White, L. J. T., Willcock, S., Woell, H., and Zemagho, L.: Above-ground biomass and structure of 260 African tropical forests, Philos. Trans. R. Soc. B Biol. Sci., 368,e 1625, https://doi.org/10.1098/rstb.2012.0295, 2013.
Li, W. and Fu, R.: Influence of cold air intrusions on the wet season onset over Amazonia, J. Climate, 19, 257–275, https://doi.org/10.1175/JCLI3614.1, 2006.
Loeb, N. G., Doelling, D. R., Wang, H., Su, W., Nguyen, C., Corbett, J. G., Liang, L., Mitrescu, C., Rose, F. G., and Kato, S.: Clouds and the Earth'S Radiant Energy System (CERES) Energy Balanced and Filled (EBAF) top-of-atmosphere (TOA) edition-4.0 data product, J. Climate, 31, 895–918, https://doi.org/10.1175/JCLI-D-17-0208.1, 2018.
Malhi, Y. and Wright, J.: Spatial patterns and recent trends in the climate of tropical rainforest regions, Philos. Trans. R. Soc. B Biol. Sci., 359, 311–329, https://doi.org/10.1098/rstb.2003.1433, 2004.
Marcella, M. P. and Eltahir, E. A. B.: The role of mineral aerosols in shaping the regional climate of West Africa, J. Geophys. Res., 119, 5806–5822, https://doi.org/10.1002/2012JD019394, 2014.
Marengo, J. A., Nobre, C. A., Tomasella, J., Oyama, M. D., de Oliveira, G. S., de Oliveira, R., Camargo, H., Alves, L. M., and Brown, I. F.: The drought of Amazonia in 2005, J. Climate, 21, 495–516, https://doi.org/10.1175/2007JCLI1600.1, 2008.
Mayer, A. L. and Khalyani, A. H.: Grass trumps trees with fire, Science, 334, 188–189, https://doi.org/10.1126/science.1213908, 2011.
Minnis, P., Sun-Mack, S., Young, D. F., Heck, P. W., Garber, D. P., Chen, Y., Spangenberg, D. A., Arduini, R. F., Trepte, Q. Z., Smith, W. L., Ayers, J. K., Gibson, S. C., Miller, W. F., Hong, G., Chakrapani, V., Takano, Y., Liou, K.-N., Xie, Y. and Yang, P.: CERES Edition-2 cloud property retrievals using TRMM VIRS and Terra and Aqua MODIS data – Part I: Algorithms, IEEE T. Geosci. Remote S., 49, 4374–4400, https://doi.org/10.1109/TGRS.2011.2144601, 2011.
N'Datchoh, E. T., Diallo, I., Konaré, A., Silué, S., Ogunjobi, K. O., Diedhiou, A., and Doumbia, M.: Dust induced changes on the West African summer monsoon features, Int. J. Climatol., 38, 452–466, https://doi.org/10.1002/joc.5187, 2018.
Neupane, N.: The Congo basin zonal overturning circulation, Adv. Atmos. Sci., 33, 767–782, https://doi.org/10.1007/s00376-015-5190-8, 2016.
Nicholson, S. E.: The ITCZ and the seasonal cycle over equatorial Africa, B. Am. Meteorol. Soc., 99, 337–348, https://doi.org/10.1175/BAMS-D-16-0287.1, 2018.
Nicholson, S. E. and Dezfuli, A. K.: The relationship of rainfall variability in western equatorial Africa to the tropical oceans and atmospheric circulation. Part I: The boreal spring, J. Climate, 99, 337–348, https://doi.org/10.1175/JCLI-D-11-00653.1, 2013.
Nicholson, S. E. and Grist, J. P.: The seasonal evolution of the atmospheric circulation over West Africa and equatorial Africa, J. Climate, 16, 1013–1030, https://doi.org/10.1175/1520-0442(2003)016<1013:TSEOTA>2.0.CO;2, 2003.
Owili, P. O., Lien, W. H., Muga, M. A., and Lin, T. H.: The associations between types of ambient PM2.5 and under-five and maternal mortality in Africa, Int. J. Env. Res. Pub. He., 14, 359, https://doi.org/10.3390/ijerph14040359, 2017.
Randles, C. A., da Silva, A. M., Buchard, V., Colarco, P. R., Darmenov, A., Govindaraju, R., Smirnov, A., Holben, B., Ferrare, R., Hair, J., Shinozuka, Y., and Flynn, C. J.: The MERRA-2 aerosol reanalysis, 1980 onward. Part I: System description and data assimilation evaluation, J. Climate, 30, 6823–6850, https://doi.org/10.1175/JCLI-D-16-0609.1, 2017.
Sitnov, S. A., Mokhov, I. I., and Likhosherstova, A. A.: Exploring large-scale black-carbon air pollution over Northern Eurasia in summer 2016 using MERRA-2 reanalysis data, Atmos. Res., 235, 104763, https://doi.org/10.1016/j.atmosres.2019.104763, 2020.
Staver, A. C., Archibald, S., and Levin, S. A.: The global extent and determinants of savanna and forest as alternative biome states, Science, 334, 230–232,https://doi.org/10.1126/science.1210465, 2011.
Susskind, J., Blaisdell, J. M. and Iredell, L.: Improved methodology for surface and atmospheric soundings, error estimates, and quality control procedures: the atmospheric infrared sounder science team version-6 retrieval algorithm, J. Appl. Remote Sens., 8, 084994, https://doi.org/10.1117/1.jrs.8.084994, 2014.
Tyukavina, A., Hansen, M. C., Potapov, P., Parker, D., Okpa, C., Stehman, S. V., Kommareddy, I., and Turubanova, S.: Congo Basin forest loss dominated by increasing smallholder clearing, Sci. Adv., 4, 11, https://doi.org/10.1126/sciadv.aat2993, 2018.
Vondou, D. A., Nzeukou, A., Lenouo, A., and Mkankam Kamga, F.: Seasonal variations in the diurnal patterns of convection in Cameroon-Nigeria and their neighboring areas, Atmos. Sci. Lett., 11, 290–300, https://doi.org/10.1002/asl.297, 2010.
Whittleston, D., Nicholson, S. E., Schlosser, A. and Entekhabi, D.: Climate models lack jet-rainfall coupling over West Africa, J. Clim., 30, 4625–4632, https://doi.org/10.1175/JCLI-D-16-0579.1, 2017.
Wright, J. S., Fu, R., Worden, J. R., Chakraborty, S., Clinton, N. E., Risi, C., Sun, Y., and Yin, L.: Rainforest-initiated wet season onset over the southern Amazon, P. Natl. Acad. Sci. USA, 4, 8481–8486, https://doi.org/10.1073/pnas.1621516114, 2017.
Xu, X., Wu, H., Yang, X. and Xie, L.: Distribution and transport characteristics of dust aerosol over Tibetan Plateau and Taklimakan Desert in China using MERRA-2 and CALIPSO data, Atmos. Environ., 237, 117670, https://doi.org/10.1016/j.atmosenv.2020.117670, 2020.
Zhou, L., Tian, Y., Myneni, R. B., Ciais, P., Saatchi, S., Liu, Y. Y., Piao, S., Chen, H., Vermote, E. F., Song, C., and Hwang, T.: Widespread decline of Congo rainforest greenness in the past decade, Nature, 509, 86–90, https://doi.org/10.1038/nature13265, 2014.