the Creative Commons Attribution 4.0 License.
the Creative Commons Attribution 4.0 License.
 | 31 Aug 2021
Source-specific light absorption by carbonaceous components in the complex aerosol matrix from yearly filter-based measurements
Vaios Moschos
Martin Gysel-Beer
Robin L. Modini
Joel C. Corbin
Dario Massabò
Camilla Costa
Silvia G. Danelli
Athanasia Vlachou
Kaspar R. Daellenbach
Sönke Szidat
Paolo Prati
André S. H. Prévôt
Urs Baltensperger
Understanding the sources of light-absorbing organic (brown) carbon (BrC) and its interaction with black carbon (BC) and other non-refractory particulate matter (NR-PM) fractions is important for reducing uncertainties in the aerosol direct radiative forcing. In this study, we combine multiple filter-based techniques to achieve long-term, spectrally resolved, source- and species-specific atmospheric absorption closure. We determine the mass absorption efficiency (MAE) in dilute bulk solutions at 370 nm to be equal to 1.4 m2 g−1 for fresh biomass smoke, 0.7 m2 g−1 for winter-oxygenated organic aerosol (OA), and 0.13 m2 g−1 for other less absorbing OA. We apply Mie calculations to estimate the contributions of these fractions to total aerosol absorption. While enhanced absorption in the near-UV has been traditionally attributed to primary biomass smoke, here we show that anthropogenic oxygenated OA may be equally important for BrC absorption during winter, especially at an urban background site. We demonstrate that insoluble tar balls are negligible in residential biomass burning atmospheric samples of this study and thus could attribute the totality of the NR-PM absorption at shorter wavelengths to methanol-extractable BrC. As for BC, we show that the mass absorption cross-section (MAC) of this fraction is independent of its source, while we observe evidence for a filter-based lensing effect associated with the presence of NR-PM components. We find that bare BC has a MAC of 6.3 m2 g−1 at 660 nm and an absorption Ångström exponent of 0.93 ± 0.16, while in the presence of coatings its absorption is enhanced by a factor of ∼ 1.4. Based on Mie calculations of closure between observed and predicted total light absorption, we provide an indication for a suppression of the filter-based lensing effect by BrC. The total absorption reduction remains modest, ∼ 10 %–20 % at 370 nm, and is restricted to shorter wavelengths, where BrC absorption is significant. Overall, our results allow an assessment of the relative importance of the different aerosol fractions to the total absorption for aerosols from a wide range of sources and atmospheric ages. When integrated with the solar spectrum at 300–900 nm, bare BC is found to contribute around two-thirds of the solar radiation absorption by total carbonaceous aerosols, amplified by the filter-based lensing effect (with an interquartile range, IQR, of 8 %–27 %), while the IQR of the contributions by particulate BrC is 6 %–13 % (13 %–20 % at the rural site during winter). Future studies that will directly benefit from these results include (a) optical modelling aiming at understanding the absorption profiles of a complex aerosol composed of BrC, BC and lensing-inducing coatings; (b) source apportionment aiming at understanding the sources of BC and BrC from the aerosol absorption profiles; (c) global modelling aiming at quantifying the most important aerosol absorbers.
- Article
(5534 KB) - Full-text XML
-
Supplement
(3185 KB) - BibTeX
- EndNote


Short-lived climate forcers emitted from anthropogenic activities, e.g. residential wood burning, are ubiquitous in the atmosphere (Pöschl, 2005; Fuzzi et al., 2015). The net cooling effect of particle emissions has been partially masking the warming effect of long-lived greenhouse gases (Ramanathan and Feng, 2009). Nevertheless, a fraction of carbonaceous aerosols may lead to atmospheric heating (Ramanathan and Carmichael, 2008), but their radiative forcing remains uncertain (IPCC, 2013).
Black carbon (BC) is a strong broadband absorber with a nearly wavelength-independent refractive index and negligible solubility in common solvents (Bond and Bergstrom, 2006; Moosmüller et al., 2009; Petzold et al., 2013; Samset et al., 2018; Corbin et al., 2019). Organic aerosol (OA) also comprises light-absorbing compounds, collectively known as brown carbon (BrC). There exist various forms of BrC, including conventional soluble molecules absorbing in the near-UV region and insoluble tar carbon with appreciable absorption extending to the infrared region (Corbin et al., 2019). These forms may exert a positive radiative forcing on the climate potentially rivaling that of BC (Feng et al., 2013; Wang et al., 2014), especially over biomass-burning-influenced regions (Liu et al., 2014b) and at higher altitudes (Zhang et al., 2017).
Accounting for the optical absorption properties of BrC, its interaction with BC and their mixing state with other particulate species is important for reducing the large uncertainty in the aerosol direct radiative forcing (Laskin et al., 2015; Gustafsson and Ramanathan, 2016; Samset et al., 2018; Saleh, 2020). While it is typically assumed that primary biomass burning dominates the BrC absorption, the importance of other sources with different absorption properties including secondary OA, formed through the oxidation of precursors, may be overlooked. A growing body of evidence suggests that aerosol ageing may be associated with both bleaching and/or formation of secondary BrC (Saleh et al., 2013; Zhong and Jang, 2014; Zhao et al., 2015; Kumar et al., 2018; Dasari et al., 2019). However, the net effect of these processes on the atmospheric BrC absorption remains elusive. Further, it is not yet established whether BrC from common urban sources is extractable or whether insoluble refractory BrC can also contribute to total absorption.
Various in situ measurement techniques, e.g. the single-particle soot photometer and the photo-acoustic aerosol absorption spectrometer, have made significant progress in reporting BC absorption enhancement due to the so-called lensing effects by coating materials (Moosmüller et al., 2009; Cappa et al., 2012; Lack et al., 2012; Pokhrel et al., 2017; Zanatta et al., 2018). Meanwhile, filter-based techniques, e.g. particle soot absorption photometer (PSAP) and aethalometer (Hansen et al., 1984; Drinovec et al., 2015), report multi-wavelength light attenuation through a particle-laden filter that has to be calibrated in order to approximate the atmospheric absorption (Moosmüller et al., 2009; Müller et al., 2011). Recently, the aethalometer has become the method of choice when simplicity, low price, widespread deployment and unattended robust operation over long time periods in the field are sought. An aethalometer-based source apportionment (SA) model (Sandradewi et al., 2008), hereafter denoted “the aethalometer SA model”, has been proposed to separate the contributions of wood burning and traffic emissions to equivalent BC, eBC (Petzold et al., 2013). The aethalometer SA model is based on differences in the spectral profiles between the two aerosol sources, with biomass burning emissions characterised by enhanced absorption at shorter wavelengths or high-absorption Ångström exponents (AAEs). Various upgraded versions of this approach were introduced thereafter (Favez et al., 2010; Herich et al., 2011; Martinsson et al., 2017; Zotter et al., 2017), and this approach is currently widely used for eBC source apportionment. However, it is unclear how this model responds to photochemical ageing, SOA formation and lensing (Martinsson et al., 2015; Garg et al., 2016; Dasari et al., 2019).
Two main approaches exist to estimate the absorption by individual aerosol components in heterogeneous atmospheric particle ensembles (Moffet et al., 2010). The first approach is based on online measurements and consists of a direct estimation of BrC absorption at shorter wavelengths by subtracting the estimated total BC absorption (assuming an AAE for bulk BC) from the total aerosol absorption. This rather convenient approach might lead to biased estimates (see Sect. 4) if the decoupling from potentially variable optical properties of pure BC and its absorption enhancement due to coating acquisition is not ensured. Alternatively, isolation of extractable BrC absorption by filter solvent extraction requires additional calculations for the conversion to atmospheric absorption, which are not straightforward (Liu et al., 2013; Shetty et al., 2019) because assumptions on BC–BrC particle size and mixing state are needed (see Sect. 2.1.4 and 2.3). Biomass burning BC, unlike fresh traffic BC (Cappa et al., 2012), is expected to be at least partially internally mixed with co-emitted BrC (Schwarz et al., 2008; Lack et al., 2012; Liu et al., 2014a, 2017; Shamjad et al., 2017). With ageing, BC from both sources may be further coated with non-refractory particulate matter species (BrC, non-absorbing OA, inorganics). This internal mixing typically results in an absorption enhancement of up to 1.5 at longer wavelengths (Fierce et al., 2016; Yuan et al., 2021). At shorter wavelengths, the lensing effect is theoretically predicted to be dampened due to the absorption of BrC (Lack and Cappa, 2010; Saleh et al., 2015; Luo et al., 2018). However, experimental evidence for lensing suppression has yet to be provided.
In this study, we report the total carbonaceous aerosol absorption based on yearly filter-based measurements from two sites in Switzerland. We determine the absorption of total solvent-extractable BrC and apply statistical methods to assign this absorption to different OA classes following the approach of Moschos et al. (2018). In addition, we derive the absorption of bare BC and its wavelength dependence and assess experimentally the influence of particulate BrC and its effect on filter-based lensing.
A schematic of the methodology, including the available instruments and datasets, is shown in Fig. S1.
2.1 Measurements
2.1.1 Measurements of aerosol species mass concentrations
Atmospheric aerosols of two size fractions (310 samples in total: 245 PM10 (particulate matter with an aerodynamic diameter d≤10 µm) and 65 PM2.5 (d≤2.5 µm)) were collected in Magadino and Zurich (Switzerland) during 2013–2014 on quartz fibre filters for laboratory measurements (Sect. S1). Magadino is a rural background site affected in winter by intense wood burning activity for residential heating, whereas Zurich is an urban background site affected by regional transport of anthropogenically dominated pollution in winter and spring. Both sites are affected by biogenic secondary emissions in summer (see Sect. S1, Fig. S2). The daily filter samples were analysed for the mass concentrations of elemental and organic carbon (Sunset OC–EC), water-soluble organic carbon (WSOC; measured with a total carbon analyser) and secondary inorganic ions (SIA: NO, SO, Cl− and NH4+; major SIA: NO and SO) by ion chromatography. Selected filters from Magadino were also measured for radiocarbon (14C) in the EC fraction using the Swiss4s protocol (Zhang et al., 2012) to determine the fossil fraction of EC (ECfossil). Factor contributions from different aerosol sources to water-soluble and total OA (Fig. S2) mass concentrations M (in µg m−3) were available for PM2.5–PM10 samples from Magadino (Vlachou et al., 2018) and PM10 samples from Magadino and Zurich (Daellenbach et al., 2017) based on offline aerosol mass spectrometer (Daellenbach et al., 2016) analysis coupled with positive matrix factorisation (offline AMS–PMF). Hereafter we refer to their PMF results as “Solution 1” and “Solution 2”, respectively. The determination of M was based on total OA (OC × OA OC; OC from Sunset and OA OC from offline AMS) and water-insoluble (WINS) OA (WINSOA = (OC-WSOC) × OA OC). The OA source components (factors) resolved by offline AMS–PMF may be related to primary emissions from traffic (HOAs), cooking (COAs), biomass burning (BBOAs), vehicular and tyre wear (sulfur-containing; SCOAs), and biological aerosols (PBOAs) as well as non-fossil secondary oxygenated aerosol in winter (WOOA) and in summer (SOOA) and from fossil precursors (fOOA). As explained below (Sect. 3.2), factors with low contribution to absorbance, including HOA, COA, SOOA and fOOA, were combined into one “other OA” factor for each AMS–PMF solution.
2.1.2 Measurements of particle size distributions and morphology
The particle size distribution was continuously measured in Zurich using a scanning mobility particle sizer (SMPS; 10 min time resolution). Daily averaged data were considered (Sect. S2) for optical calculations. A field-emission scanning electron microscope coupled to energy-dispersive X-ray spectroscopy (FE-SEM–EDS) was used (Sect. S2) to observe the general morphology and deposition characteristics of particles and to provide information on their elemental composition.
2.1.3 Measurement of total aerosol absorption coefficient
Aerosol attenuation was measured online at seven wavelengths using dual-spot aethalometers (AE33 model). For a selected set of 27 offline samples, we used the multi-wavelength absorption analyser (MWAA; Massabò et al., 2013) to determine the total aerosol absorption at five wavelengths. The MWAA measures the transmission and backward scattering at two fixed angles, which takes into account the scattering contributions to attenuation. The filter absorbance measured by MWAA has been successfully validated against both a polar photometer and a multi-angle absorption photometer (MAAP) (Massabò et al., 2013), which, in turn, has been validated against numerous in situ methods. AE33-based attenuation measurements were then normalised by the MWAA-based absorption measurements to derive calibration coefficients, C (Sect. S3.1), at different wavelengths using Eq. (S1). C values, shown in Fig. A1, decreased from 2.5 at 370 nm to 2.3 at 880 nm on average, with day-to-day variability of ∼ 15 % and no detectable systematic variation in time or between sites. Average wavelength-dependent C values were then applied to the loading-compensated AE33 attenuation coefficients, bATN,AE33, to obtain total aerosol absorption coefficients, babs,total (Eq. S2), for all samples at seven different wavelengths. The obtained range of C values for the Swiss urban–rural dataset was close to but statistically different from the widely used value of 2.14 derived for fresh, externally mixed soot from fossil fuel emissions collected on quartz fibre filters using the AE31 model (Weingartner et al., 2003). In addition, selected samples were extracted in water, then in methanol, and the resulting filters were sequentially measured by MWAA after extraction by each solvent to determine the wavelength dependence of the remaining aerosol (Sect. 3.4). The method is described in Sect. S3.1 and in Corbin et al. (2019), where it was applied for ship exhaust emissions.
2.1.4 UV–vis spectroscopy of methanol extracts
For all daily filter samples, j, absorbance spectra, Aj(λ), of aerosol extracts in ultrapure water or methanol (AMeOH) were determined (Sect. S3.2, Eq. S3) at 280–600 nm using an ultraviolet–visible (UV–vis) spectrophotometer (Ocean Optics) coupled to a long-path detection cell (length l=50 cm). The UV–vis spectrophotometer and detailed analytical protocol for absorbance measurements from extracts are described in our previous study for water (Moschos et al., 2018) and in the SI for MeOH. Methanol was selected based on the comparison of the absorbance obtained with five other solvents: water, acetonitrile, acetone, tetrahydrofuran and dichloromethane (Fig. S3). A dilution series of MeOH extracts at various concentrations showed linearity in the range of our extract concentrations and absorbance values below 500 nm (Fig. S4), indicating the applicability of the Lambert–Beer law. We assessed the water vs. methanol solvent effect on the extract absorbance (Mo et al., 2017) by comparing Aj(λ) for five ambient PM samples extracted in water and then diluted in methanol or in water in a 10 / 90 ratio. This ensured that identical organic samples were dissolved in the two different solvents in order to examine the influence of the solvent on UV–vis spectra of the BrC samples. This is typically not considered in the existing literature for BrC (Zhang et al., 2013; Kumar et al., 2018), although the solvent effects on molecular absorption have been extensively studied in organic chemistry (Reichardt, 2003). We observed in Fig. S5 higher absorbance in MeOH compared to water by a factor of 1.0–1.15 at wavelengths >370 nm, consistent with the blue shift observed when more protic solvents (such as water) are used (Han et al., 2003). We therefore scaled our Aj(λ) in water to those in MeOH using an average wavelength-dependent (for λ<470 nm) absorbance ratio from these measurements. The results from (i) the comparison between different solvents, (ii) the dilution series of the MeOH extracts at various concentrations and (iii) the assessment of the water vs. MeOH solvent effect indicate that the interactions of the BrC molecules with their matrix have little effect on their absorbance. This is in line with recent findings (McKay et al., 2018; Trofimova et al., 2019). We considered that Aj(λ) is only related to the organic particulate matter soluble in water or MeOH, whereas insoluble (filtered-out) black carbon, inorganic salts (confirmed based on Moschos et al., 2018) and other species (e.g. organometallic complexes) are not expected to contribute significantly to the observed Aj(λ). We also consider MeOH to extract the majority of absorbing organics (Fig. S6), as we show below based on the MWAA and Sunset OC mass measurements of aerosol filters upon extraction (Sect. 3.4).
The UV–vis provides mass absorption efficiency (MAE) spectra of an absorbing fraction, which are determined as the absorbance matrices A normalised by the dissolved mass M of this fraction:
The MAE can be related to the imaginary part of the refractive index, k, if the extractable (NR-PM) material density, ρsolute, is known (1.5 g cm−3 was assumed here):
While k is a material property that is independent of the geometry of the optical problem, MAE only relates to the absorption of the material in dilute solutions or in thin layers of the material in the pure form and cannot be directly applied to derive the absorption in the particle phase. We then use Mie calculations to determine the BrC mass absorption cross-section, MAC, in order to estimate the absorption of the organic fraction in the particle phase, as detailed in Sect. 2.3.
2.2 UV–vis–PMF to infer methanol-soluble OA-factor-specific MAE spectra
The UV–vis–PMF statistical model aims at retrieving MAE spectra for each OA factor previously identified from the offline AMS–PMF analyses (Sect. 2.1.1). The methodology has been thoroughly described in Moschos et al. (2018), where it was applied to water extracts. Briefly, the model minimises the residual difference between the observed Aj(λ) (model input; in Mm−1) and a reconstructed Aj(λ). The latter is the product of the mass concentration time series (M) of each AMS–PMF OA factor (model constraints; in µg m−3) and a matrix containing the factor-specific absorption efficiency spectra, MAE(λ) (model output; in m2 g−1). The actual implementation was more complex than just described. Fixing the time series required an exchange of the roles played by time and wavelength and workarounds with respect to normalisation (Moschos et al., 2018). This approach provides MAE specific to an OA factor in hypothetical pure form, i.e. extracted in a solvent and externally mixed from other aerosol components. This approach may facilitate optical (e.g. radiative forcing) calculations starting from fundamental, intensive material properties.
Here, we applied the UV–vis–PMF model to both methanol-soluble (AMeOH) and water-insoluble () absorbance matrices upon correcting for the water vs. methanol solvent effect up to 470 nm (Fig. S5). The AMS–PMF factor selection (BBOA, WOOA, other OA) for the UV–vis–PMF model is described in Sect. S4 and Table S1. We obtained a range of factor-specific k(λ) values by using the M data from two different offline AMS–PMF solutions as model constraints and by reducing the spatial and temporal coverage of the input absorbance matrices (Sect. S4). Based on this approach, we obtained for each factor a median spectrum and the interquartile range (IQR) from the different model runs. We proceed below with the methanol-derived k(λ) as representative of the total extractable BrC for optical calculations, assuming little structural changes in the chromophores upon dissolution (Mo et al., 2017; Lin et al., 2017; Dasari et al., 2019)
2.3 Determination of particulate BrC absorption
We used Mie calculations (Bohren and Huffman, 1998) to estimate the BrC absorption, ), at four AE33 wavelengths (370, 470, 520 and 590 nm) with Mie code programmed in the software package Igor Pro (WaveMetrics). The main inputs required for Mie calculations of light absorption coefficients are the particle size distribution (partially constrained here from SMPS measurements; Sect. 2.1.2) and the refractive index of the aerosol material in question. These calculations assume that the absorbing (BrC-containing) non-refractory particles are spherical with homogeneous internal composition in the particle phase (Sumlin et al., 2018; Li et al., 2020). In the literature, a constant MAC MAE ratio of 1.8–2.0 is often used to proceed from absorption measured in dilute solutions to absorption in the particle phase (Liu et al., 2013; Washenfelder et al., 2015; Shamjad et al., 2017; Zeng et al., 2020). Figure B1 shows the effect of particle size on the MAC MAE ratios computed using Mie calculations for materials with different k values, up to that of pure BC. A constant extractable aerosol density (ρsolute) of 1.5 g cm−3 and a wavelength-independent real part of the refractive index (n) of 1.5 (Lu et al., 2015) for all non-refractory (organic and inorganic) components were assumed, with respective values of 1.80 g cm−3 and 1.95 for BC (Bond and Bergstrom, 2006; Cappa et al., 2012; Kim et al., 2015; Luo et al., 2018). No correction for the solvent refractive index was applied, considering literature values for nMeOH=1.35 (Herráez and Belda, 2006) vs. n=1.3–1.6 in particle solutions (Nakayama et al., 2013; Moise et al., 2015).
Figure B1 shows that the MAC to MAE ratios (MAC MAE) are not constant and generally lower than used in the literature. The calculated MAC values based on the Rayleigh regime for individual BrC molecules were 0.75 times the UV–vis-based MAE values measured in solution, which is consistent with the range of 0.69–0.77 reported in previous studies (Sun et al., 2007; Liu et al., 2013; Nakayama et al., 2013). The MAC MAE is highest for weakly absorbing particles in sizes in the Mie regime, and drops again in the geometric regime. Unlike literature assumptions of a single MAC MAE value, here we have assessed the sensitivity of the MAC MAE on the material k and particle size. The methodology is detailed in Sect. S5. Briefly, we have considered two distinct size ranges: a smaller (120 nm) and larger size range (200–400 nm). The larger size is based on aerosol mass size distributions from Zurich (Fig. S7). The smaller range was considered to represent primary emissions (HOA + BBOA). It can be considered to be a reasonable lower limit, determined based on the volume size distributions and the contribution of primary emissions to the total aerosol mass. In the absence of particle size distribution measurements for Magadino, we assume the same values for the larger and smaller size ranges as in Zurich. We do not have mixing state data; however, with treating NR-PM as homogeneous spheres externally mixed from BC, we assessed the sensitivity of resulting BrC absorption estimations () to variations in mixing state and size of NR-PM components. Specifically, we have considered seven cases as detailed in Sect. S5, but here we only present the two extreme cases together with a central estimate obtained as (min + max) 2. The lowest estimate of corresponds to BBOA at 120 nm, externally mixed with inorganic components, while the oxygenated OA (OOA) factors are externally mixed from each other in the larger size range and externally mixed from inorganic components (case 6: average MAC MAE for total OA ∼ 1.3). The highest estimate corresponds to BBOA, OOA and inorganic components, all internally mixed in the larger size range (case 5: MAC MAE ∼ 1.6).
3.1 Absorption characteristics of the bulk methanol-extracted OA
The WSOA average concentration is 3.7 µg m−3 (total OA: 5.4 µg m−3) and 6.0 µg m−3 (total OA: 9.4 µg m−3) in summer and winter, respectively, accounting for ∼ 66 % of the total OA. Figure 1 presents the methanol-extracted aerosol absorption characteristics. Figure 1a shows the water / methanol 370 nm absorbance ratio for the full PM10 dataset, where the systematically lower average values observed at both sites in winter (Magadino: 0.73; Zurich: 0.74) compared to summer (Magadino: 0.82; Zurich: 0.88) indicate that MeOH extracts more absorbing matter than water when BBOA is prevalent. The coarse (PM10–PM2.5) aerosol fraction in Magadino during 2014 contributes on average 33 % to total OA mass (Fig. S8) but only ∼ 5 % to absorbance in MeOH at 370 nm, lower than in another study (Chen et al., 2019). The two organic fractions that dominate the coarse-mode OA are PBOA and SCOA, believed to be derived from vegetative detritus and non-exhaust car emissions, respectively (Bozzetti et al., 2016; Daellenbach et al., 2017; Vlachou et al., 2018). The low contribution of the coarse mode to the total absorbance suggests a negligible contribution of these two fractions to absorbance, as explained in Sect. S4 and shown in Table S1 and Figs. S8–S9.
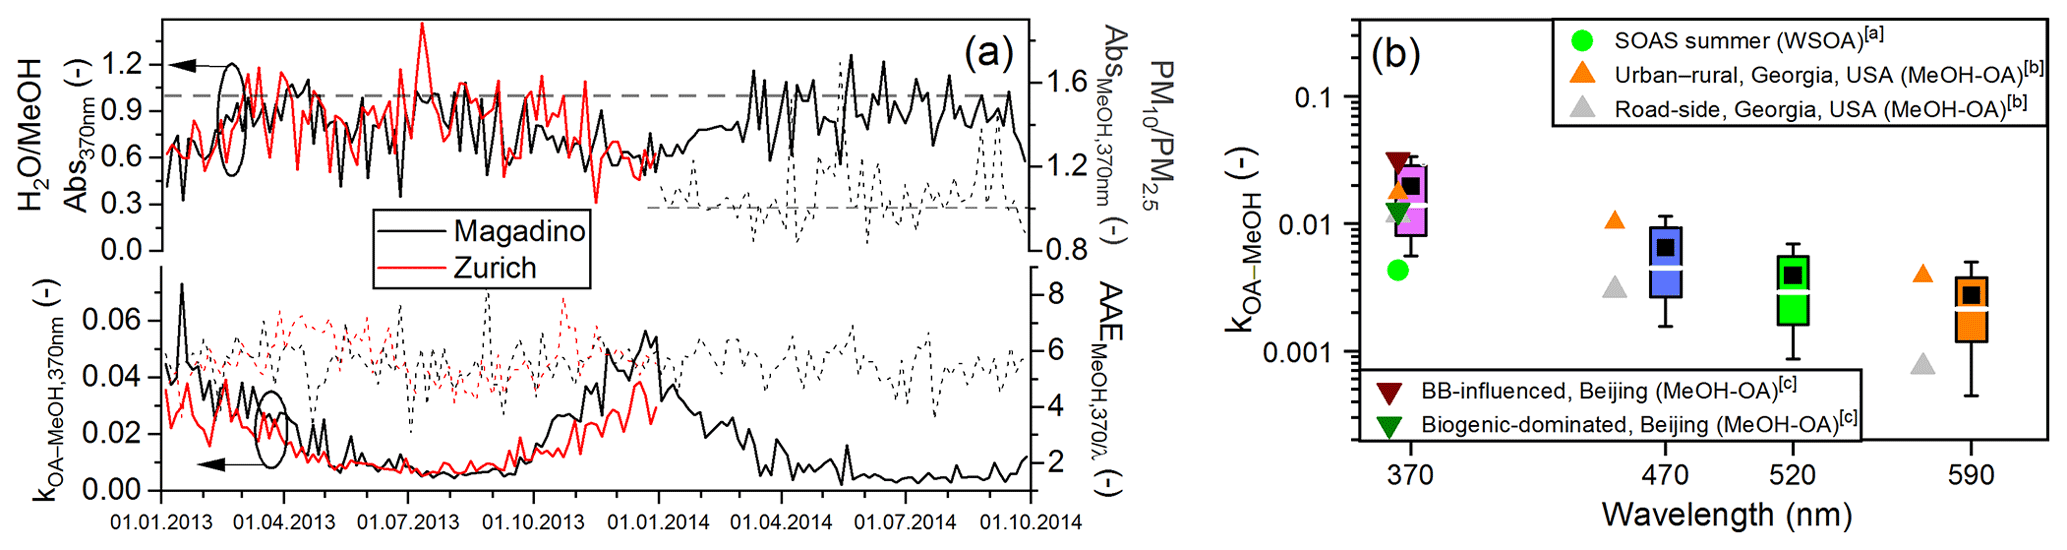
Figure 1(a) Time series at 370 nm of the water-to-methanol absorbance (A, or Abs) ratio (not corrected here for the solvent effect) and the PM10-to-PM2.5 absorbance ratio in methanol (horizontal dashed lines indicate ratios of 1.0) as well as the imaginary part of refractive index (k) of the bulk methanol-extracted organics (Eq. 2) and the AAE ( nm). The OA mass from AMS–PMF Solution 2 was used for all 2013 data for a direct comparison between Magadino and Zurich. (a) Box plots of the bulk mixed-source UV–vis-based kOA (total extractable OA, homogeneous and internally mixed without any inorganics or BC present) at four AE33 wavelengths for all 245 PM10 samples measured from Magadino and Zurich (white line and box: median and IQR; black squares and whiskers: mean and 1 standard deviation (SD)) compared to selected literature values for bulk extracted OA: (a) Washenfelder et al. (2015), (b) Liu et al. (2013), (c) Cheng et al. (2017). SOAS: “The Southern Oxidant and Aerosol Study”.
During winter (October–March), the bulk is 0.032 ± 0.013 in Magadino (where BBOA is prevalent) and 0.024 ± 0.007 in Zurich (where WOOA is prevalent), 2–3 times higher on average than the summer average value of 0.010 ± 0.006 observed at both sites. The full dataset absorption Ångström exponent, AAE ( nm), of the MeOH extracts is 5.6 ± 0.8. The average kOA-MeOH values of 0.020 at 370 nm and 0.003 at 590 nm (Fig. 1b) are in the same wide range as reported in previous field studies in Georgia, USA (Liu et al., 2013); Alabama, USA (Washenfelder et al., 2015); and Beijing (Cheng et al., 2017).
3.2 Absorption properties of methanol-soluble OA factors derived from UV–vis–PMF
We have applied UV–vis–PMF (Sect. 2.2) to infer the absorption properties of methanol-soluble OA factors previously identified from offline AMS–PMF analyses (Fig. S2; Daellenbach et al., 2017; Vlachou et al., 2018). Figure S10 shows the spectrally resolved relative contributions of the different OA fractions to the total measured absorbance in MeOH for both sites and seasons. In wintertime (October–March), the absorbance in Magadino is driven by two anthropogenic non-fossil (Vlachou et al., 2018) factors: primary BBOA and WOOA, the latter largely influenced by aged and transported biomass smoke. The other OA (Magadino: HOA, fOOA, SOOA; Zurich: HOA, COA, SOOA), processed and presented as one combined factor due to its weaker absorptivity, contributes less to absorbance (∼ 20 %) despite its predominance in terms of mass, especially in summer (e.g. biogenically dominated SOOA). The water-insoluble but methanol-soluble BBOA (WINS-BBOA; corrected for the water vs. methanol solvent effect) explains up to 30 % (averaged across 280–600 nm) of the total measured (explained and unexplained) absorbance in MeOH. The water-soluble methanol-soluble BBOA absorbance ratio is between 0.45 and 0.77, indicating that a non-negligible fraction of BrC in BBOA in this study is not water-soluble. This is consistent with the AMS–PMF recovery analysis estimating that two-thirds of the total BBOA mass is water-soluble (Daellenbach et al., 2017; Vlachou et al., 2018), whereas the OOA components are almost fully water-soluble (Sect. S4).
Figure 2 shows the k spectra of the different methanol-soluble OA source components derived from UV–vis–PMF, where (WINS-)BBOAs have been corrected for their extraction efficiency in methanol (Sect. S4; Fig. S6). The source-specific BrC absorptivity spans 3 orders of magnitude and depends on the source and the wavelength, with at all wavelengths, whereas the bulk kOA values (Fig. 1b) are in between the factor-specific ones. The estimated relative uncertainty for the retrieved factor-specific kBrC (Sect. S4 and Table S2) is ∼ 15 %–20 % on average below 400 nm for the methanol-soluble factors and up to 40 % for water-insoluble BBOA. We do not observe significant differences in the factor-specific k (and contributions) between UV–vis–PMF performed for different seasons and sites or using different AMS–PMF solutions as constraints. The water-insoluble but methanol-soluble BBOA fraction is more absorptive but mainly at shorter wavelengths (< 350 nm) and exhibits a steeper wavelength dependence of absorbance (AAE300−400 nm ∼ 6.1) compared to methanol-soluble BBOA (∼ 4.9). The associated near-UV absorbing compounds may be less polar nitro-aromatics (Mohr et al., 2013), polyphenols (Lin et al., 2016) and polycyclic aromatic hydrocarbons with absorption peaks at 300–400 nm or derivatives of them (Chen et al., 2019). WOOA exhibits similar AAE in MeOH (∼ 4.7) and water (Moschos et al., 2018), whereas other OA has the highest AAE of ∼ 7.1.
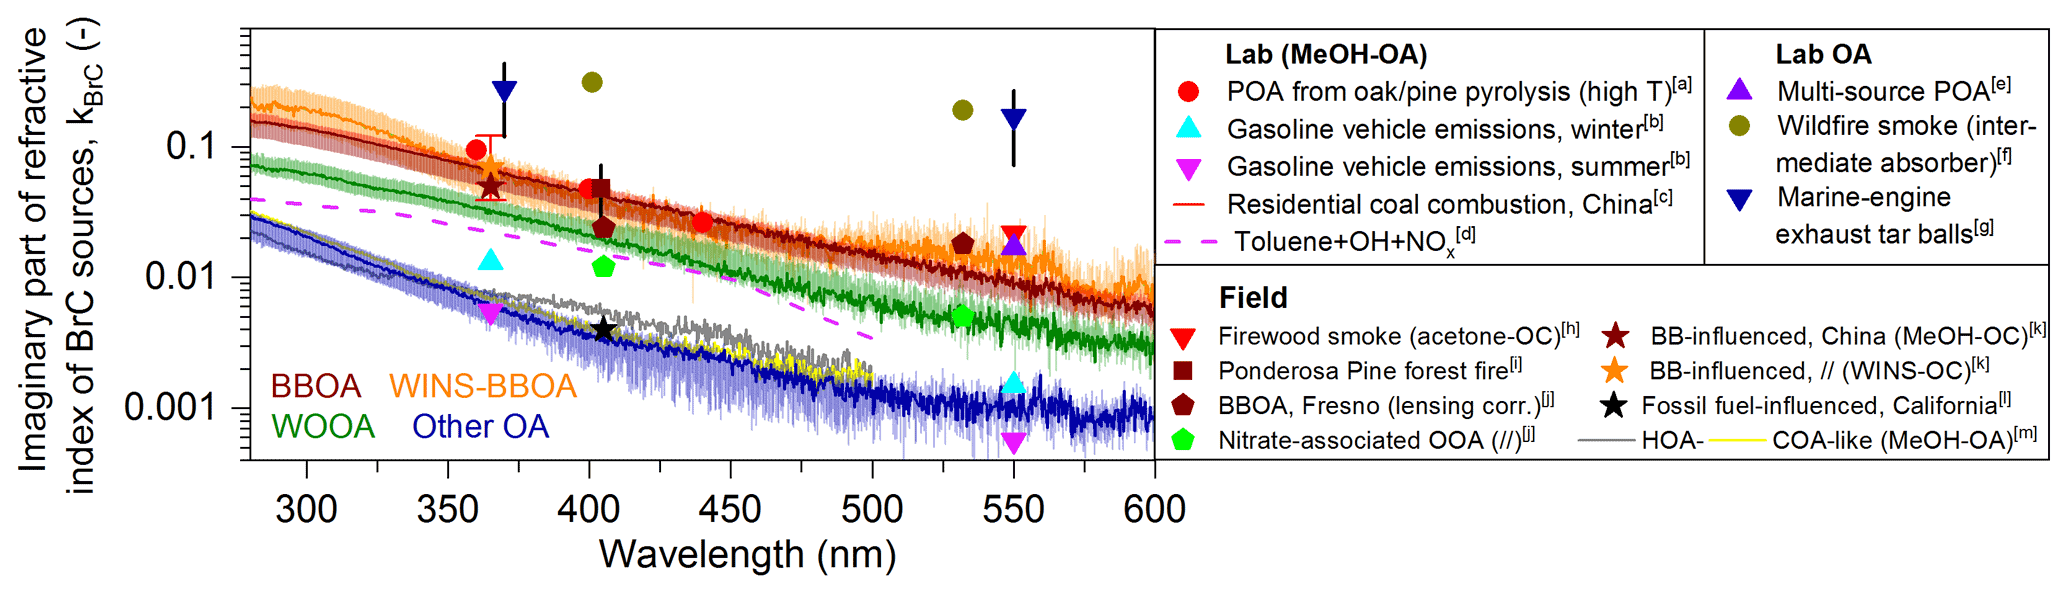
Figure 2Spectrally resolved median k values (MAE in Fig. S10) of the different methanol-soluble (water-soluble: Moschos et al., 2018) offline AMS–PMF-based OA source components ((WINS-)BBOA corrected for extraction efficiency in MeOH; WINS-BBOA corrected for the water vs. methanol solvent effect; other OA: HOA + COA + SOOA + fOOA), together with the IQR from different UV–vis–PMF sensitivity runs (Sect. S4 and Table S2). The retrieved kBrC values are compared to those of previous laboratory and field studies focusing on methanol-extractable or total organics: (a) Chen and Bond (2010), (b) Xie et al. (2017), (c) Li et al. (2019), (d) Liu et al. (2015), (e) Lu et al. (2015), (f) Adler et al. (2019), (g) Corbin et al. (2019), (h) Kirchstetter et al. (2004), (i) Lack et al. (2012), (j) Cappa et al. (2019), (k) Yan et al. (2020), (l) Cappa et al. (2012), (m) Moschos et al. (2018).
The retrieved kBBOA (0.062 at 370 nm; Table S2) is comparable to those of lab-generated primary OA from biomass burning (Chen and Bond, 2010) and the combustion of other solid fuels (Lu et al., 2015), e.g. residential coal burning in China (Li et al., 2019), as well as to ambient aerosols heavily influenced by biomass burning emissions (Cappa et al., 2019; Yan et al., 2020) including firewood smoke and savannah fires (Kirchstetter et al., 2004; Lack et al., 2012). However, it is significantly lower than values found for flaming-phase wood burning emissions (Kumar et al., 2018), tar carbon from wildfires (Adler et al., 2019) and insoluble marine-engine exhaust tar balls (Corbin et al., 2019); kWOOA (0.030 at 370 nm; Table S2) is lower than that of fresh BBOA and compares well with anthropogenic high-NOx toluene SOA (Liu et al., 2015a) in the near-UV and visible regions as well as with a nitrate-associated OOA recently reported in Fresno (Cappa et al., 2019). The “other OA” profile is similar to cooking- or fossil-fuel-influenced lab (Xie et al., 2017) and field (Cappa et al., 2012; Moschos et al., 2018) samples. The factor-specific k (or MAE) spectra can be used in future studies to estimate at all wavelengths the particulate atmospheric BrC absorption attributable to different sources in environments where these k spectra apply.
3.3 Factor-specific OA contribution to particulate absorption
In Fig. 3, we present the calculated time series of factor-specific BrC absorption in the particle phase, , for Zurich and Magadino at λ=370 nm (data for 470, 520 and 590 nm are shown in Fig. S11). In Magadino during winter, BBOA dominates the OA absorption with an average contribution of 84 % and daily values of 11 ± 9 Mm−1 at 370 nm. The absorption during summer is lower, with WOOA (∼ 0.5 Mm−1) and other OA (∼ 0.7 Mm−1) becoming more important in relative terms. In Zurich, all factors contribute significantly to total OA absorption at 370 nm (BBOA: 0.8 Mm−1; WOOA: 1.1 Mm−1; other OA: 0.5 Mm−1) with less distinct seasonal variability compared to Magadino. The average total extractable particulate BrC AAE for λ=370, 470, 520 nm (± day-to-day variability) is 6.0 ± 0.2 for Magadino winter, 5.2 ± 0.3 for Magadino summer and 5.5 ± 0.2 in Zurich.
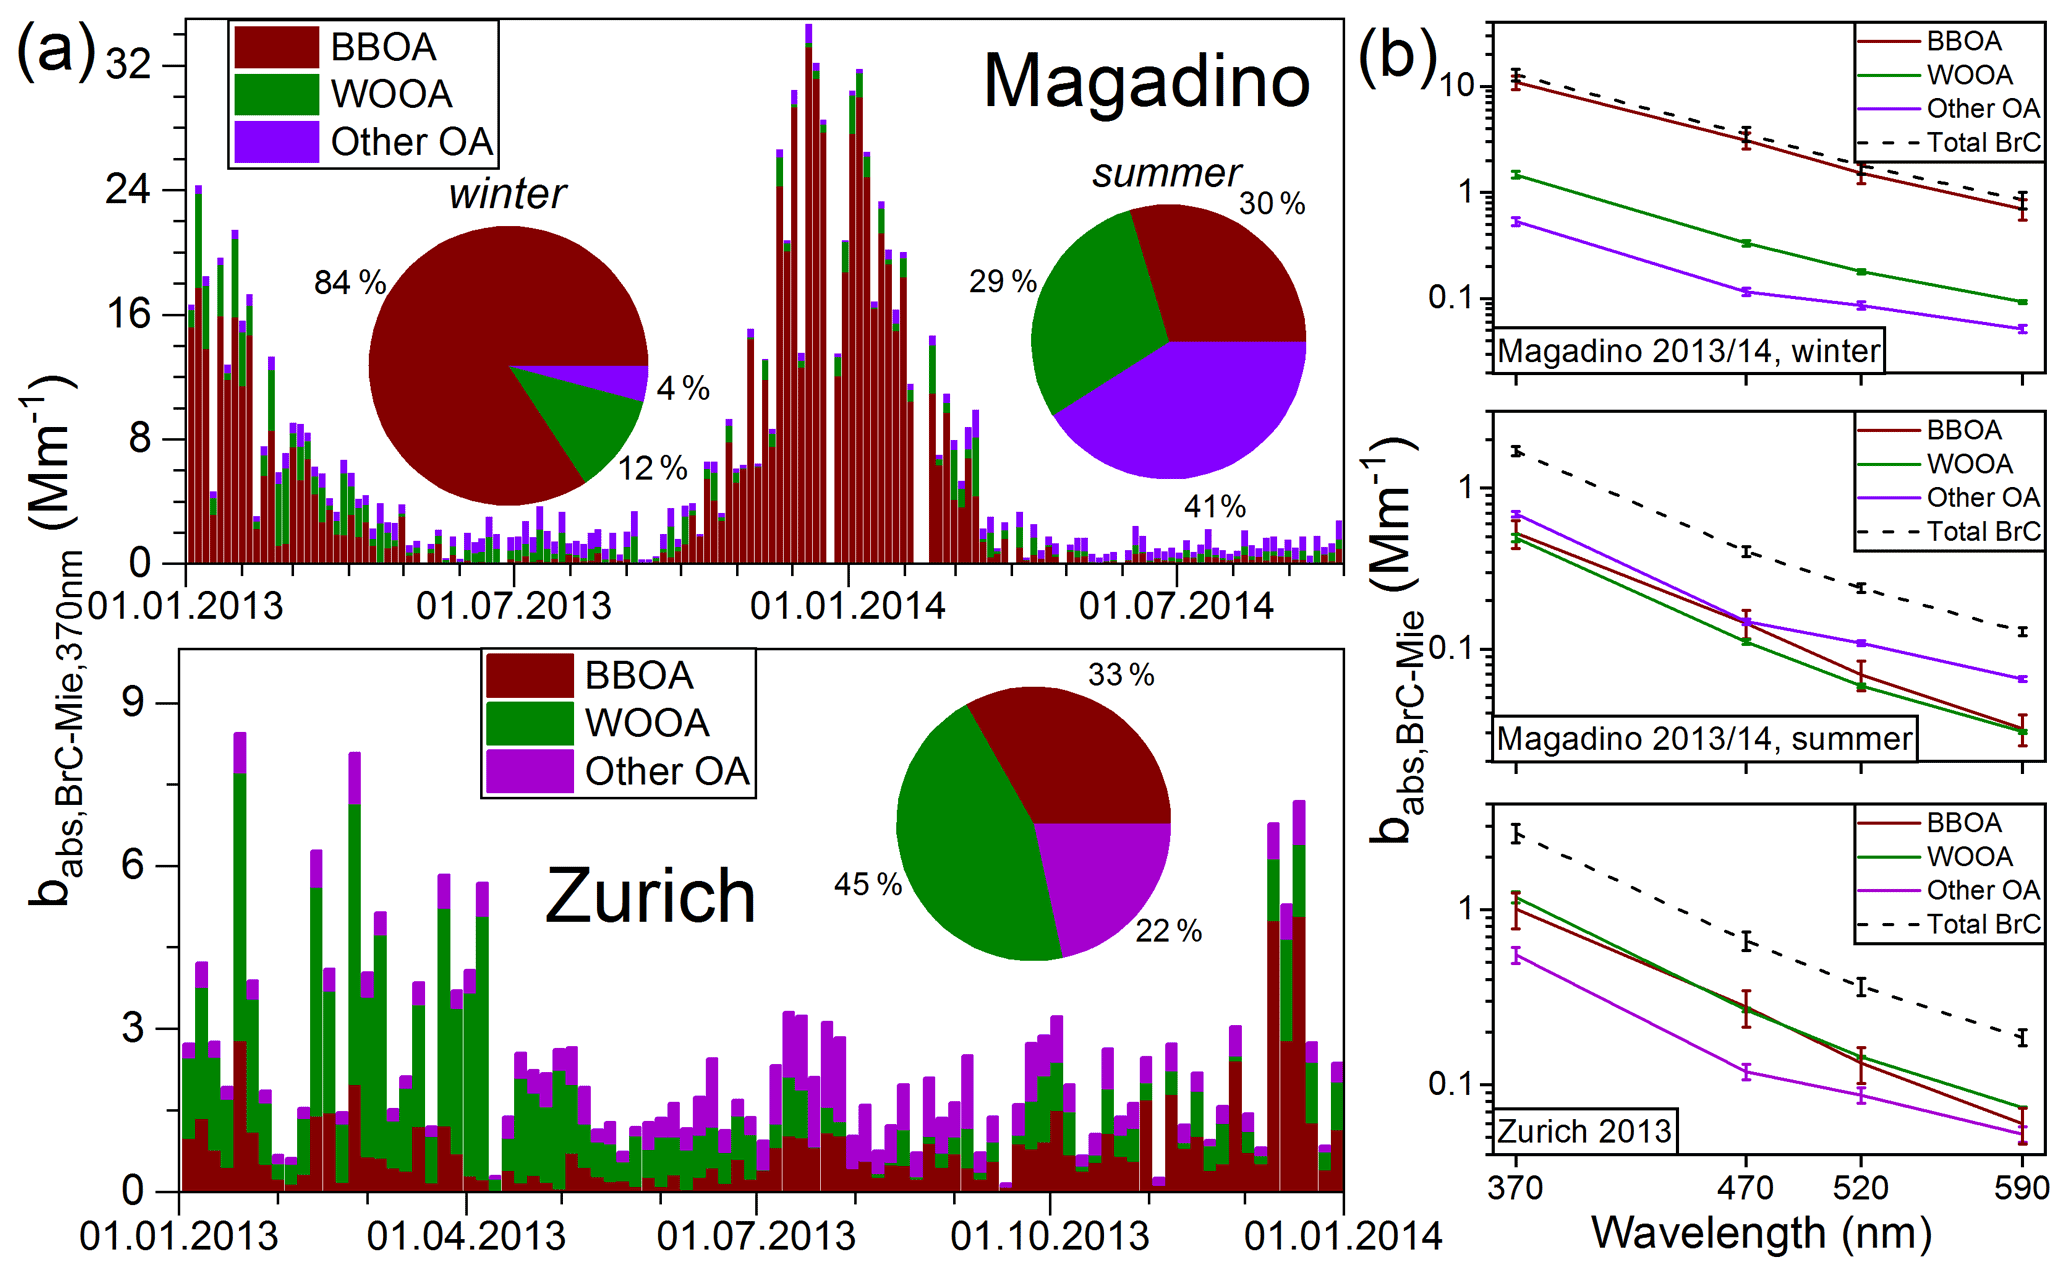
Figure 3(a) Time series of the cumulative BBOA, WOOA and other OA (Magadino: HOA + fOOA + SOOA; Zurich: HOA + COA + SOOA) average (from seven cases; Sect. S5) factor contributions to UV–vis–PMF-based Mie-predicted particulate BrC absorption at 370 nm for Magadino and Zurich. The insets show the seasonal and yearly average (summer: April–September) factor relative contributions to . Note the different temporal coverage and the different range of babs values between the upper and lower panel. (b) Factor-specific particulate BrC absorption coefficient at four AE33 wavelengths for three distinct cases. Error bars correspond to the MAC MAE uncertainty from the seven cases (Sect. S5).
Similar to the finding of Shamjad et al. (2017), our mixed-source MACBrC is not correlated with the bulk EC / BrC mass ratio (Fig. S12). This indicates that a lab-based parameterisation linking the brownness of (primary) biomass burning emissions to their BC content (Saleh et al., 2014) may have limited applicability to ambient data. This is because also other primary absorbing OA than biomass burning as well as secondary BrC can contribute to absorption, and EC derives from multiple sources (both wood burning and traffic in this study).
3.4 Residual AAE of extracted filters indicating absence of tar balls
We have conducted (sequential) extractions and MWAA measurements to determine the AAE of uncoated, pure BC and to examine the potential presence of (insoluble) tar carbon. The latter has been observed in atmospheric samples rich in fresh biomass burning or wildfire smoke (China et al., 2013) and exhibits absorption properties that differ from those of BC and conventional BrC (Corbin et al., 2019). Figure 4a shows that the AAE375−850 nm of 1.26 ± 0.27 for the untreated samples (black markers) measured with MWAA is larger than the AAE at longer wavelengths, consistent with the increasingly important BrC absorption at shorter wavelengths. Upon extraction in water (blue markers), the total AAE decreases to 1.04 ± 0.18 but remains higher than expected for BC, indicating the presence of water-insoluble absorbing non-BC components. This is consistent with the UV–vis–PMF results attributing up to 30 % of the measured absorbance in MeOH to water-insoluble biomass burning emissions (Sect. 3.2). The subsequent extraction with MeOH (red markers) further decreases the AAE to 0.93 ± 0.16 for all wavelength combinations (850 nm used as reference), in line with the higher absorbance of MeOH extracts compared to water. The resulting AAE is consistent with that of pure BC across all wavelengths, indicating that the absorption at shorter wavelengths is not dominated by insoluble biomass burning tar carbon in this study but by MeOH-soluble BrC. Previous laboratory work using the same technique observed that insoluble tar balls, with AAE values comparable to those of soluble BrC, can dominate the BrC absorption from residual fuel combustion in marine ship engines (Corbin et al., 2019). The absence of tar balls in our study may be related to the specific source of biomass burning organics in our region, i.e. wood burning for residential heating in high-efficiency stoves rather than in low-efficiency wildfires, although more measurements of direct emissions would be needed to confirm this. Our AAEbareBC of 0.93 ± 0.16, obtained using filter samples from both sites and seasons, thus covering all conditions, is within the predicted range for fresh, aged and/or compacted BC (Liu and Mishchenko, 2018; Liu et al., 2018) and experimental data from different emission types and BC ageing degree (Kirchstetter et al., 2004; Chung et al., 2012).
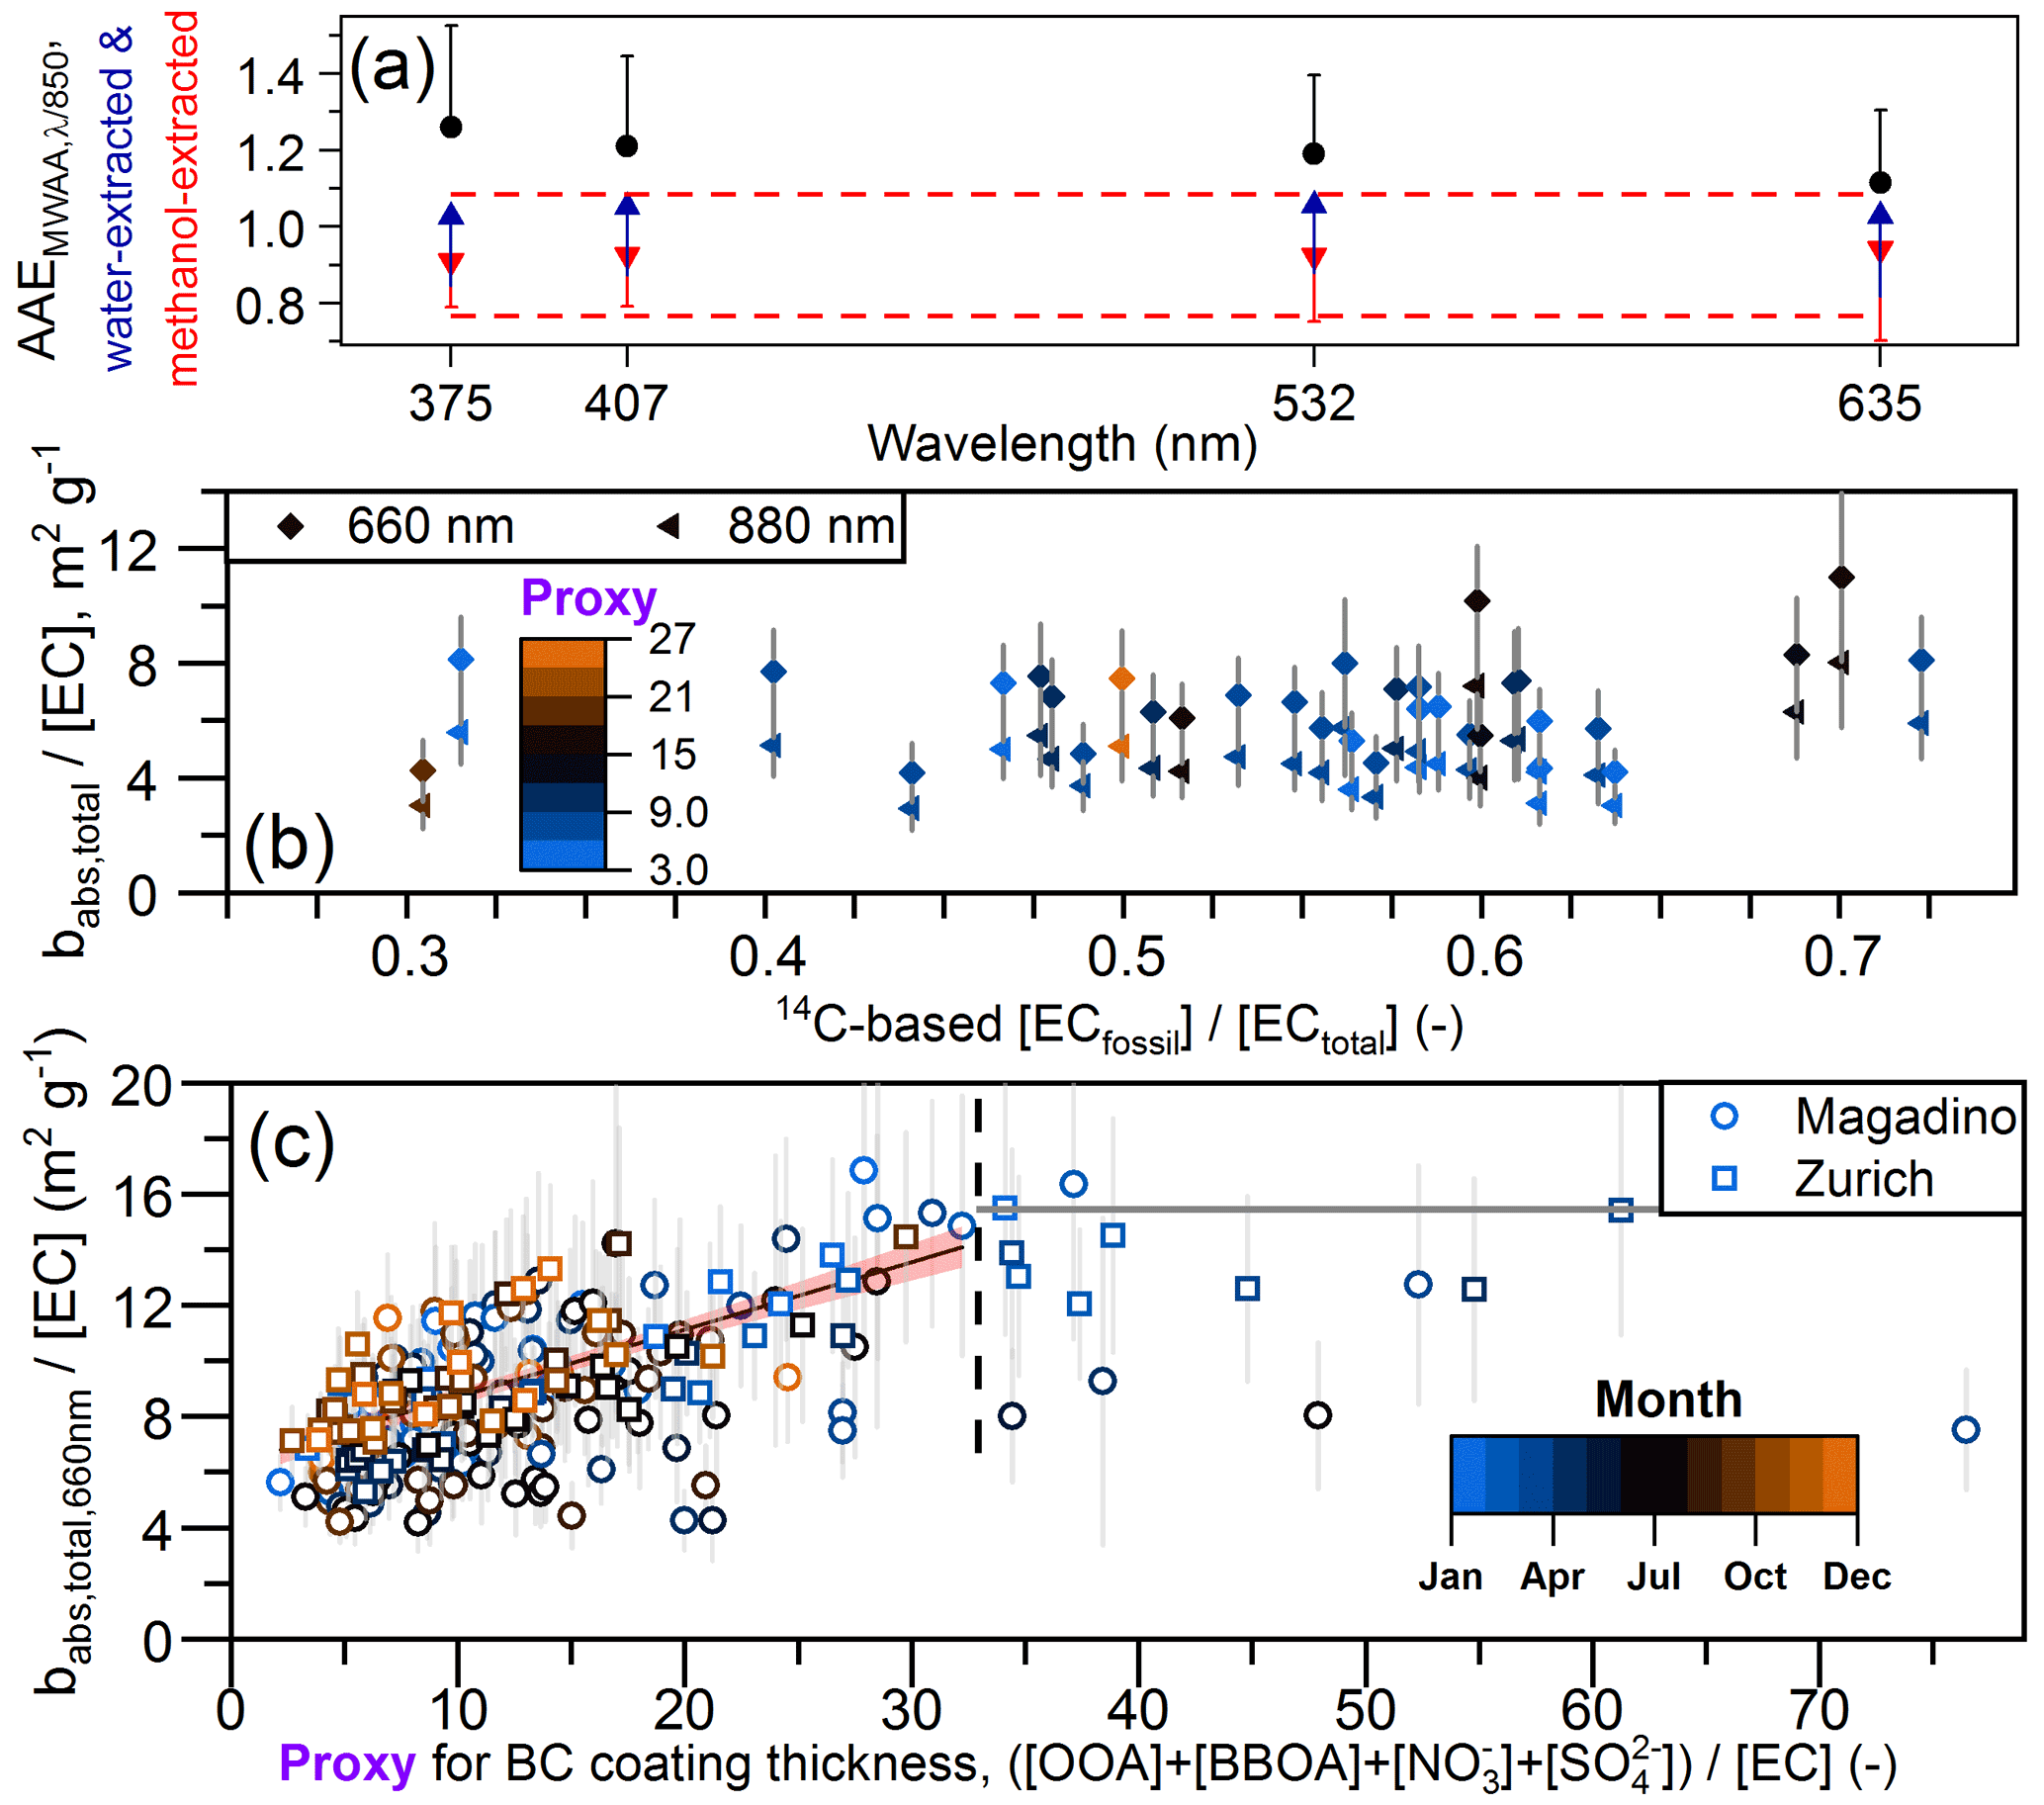
Figure 4(a) AAE of bare BC for nine different samples from both sites and seasons, measured with MWAA upon water and (sequential) methanol extraction for the removal of soluble BrC and coatings using 850 nm as reference wavelength. The error bars indicate 1 SD from all samples. The dashed red lines are a guide for the eye for the obtained range (± 1 SD) from all wavelengths upon methanol extraction. (a) Assessment of possible source-related MACBC variability at 660 and 880 nm (colour-coded with the proxy; see x axis in c), where extractable BrC does not contribute to particulate absorption, for year-long Magadino filter samples measured for 14C in the EC fraction, relevant also for the application of the aethalometer SA model. R2 for 660 nm is 0.11 (p=0.06) and 0.16 for 880 nm (p=0.02). (c) Calculation of MACbareBC (Fig. S14) as the intercept of uncertainty-weighted linear regression of MACBC,660 nm vs. a proxy for the BC coating thickness for proxy <33. Intercept: 6.3 ± 0.3 m2 g−1; slope: 0.242 ± 0.019 m2 g−1; Pearson's r=0.64. The grey line for larger proxy values indicates the upper limit (+ 1 SD) of the observed MACBC in this (lensing saturation) range.
Consistent with the aforementioned extractions, microscopic images of both treated and untreated samples also do not suggest a significant presence of tar balls. While the only spherical particles observed in untreated Zurich samples were non-carbonaceous, either Fe-bearing or containing K, Mg, Ca, Al and S, in Magadino winter both bare BC and pseudo-spherical carbonaceous particles are observed, the latter disappearing after extraction with water (Fig. S13), consistent with the solubility of BrC determined above. We have also measured the extraction efficiency of biomass-burning-dominated samples by determining the Sunset OC mass on solvent-extracted and untreated filters. Based on this exercise, we find that at least 93 % of the Sunset OC is MeOH-soluble (Fig. S6). These observations, together with the calculated MACbareBC discussed in Sect. 3.5, provide a clear indication that there is no (significant) background bias (Adler et al., 2019) due to the potential presence of insoluble, refractory (tar) BrC with typically lower MAC than that of BC (Corbin et al., 2019).
3.5 MACBC and filter-based lensing effect
We have used MWAA measurements to relate the AE33 attenuation to absorption coefficients (Sect. 2.1.3). This enabled us to use the AE33 data quantitatively with no need to assume a range of possible calibration values (Kasthuriarachchi et al., 2020). Specifically, we use Eq. (S1) to calculate wavelength-specific calibration values representing the correction for multiple scattering by particles and filter fibres and use these values to derive calibrated total absorption coefficients, babs,total (Eq. S2), from AE33 data when MWAA measurements are not available. MACBC is then estimated from the bulk measurements of absorption coefficients normalised by the EC mass (MACBC=babs,total [EC]) at longer wavelengths (> 600 nm), where BC is expected to dominate the absorption. Figure 4b displays the MACBC against the contribution of fossil emissions to EC derived from 14C analysis (Vlachou et al., 2018), showing no relationship between the two variables. This finding is in line with Zotter et al. (2017) and Herich et al. (2011), inferring that MACBC is largely source-independent, at least in Switzerland.
Figure 4c presents MACBC as a function of a proxy for the BC coating thickness, i.e. the ratio between the combined concentrations of major SIA, OOA and BBOA and EC (NR-PM EC; Table S4). While the variability in MACBC is not driven by the EC sources (Fig. 4b), MACBC increases linearly with NR-PM EC < 33 consistently, unlike for other tested proxies (including the total OA mass, OA / EC, OOA / OA, OOA / EC or sulfate / EC), indicating a filter-based BC lensing effect due to coating by multiple non-refractory components. The presence of coated BC particles is supported by the observation of compacted BC particles from SEM measurements (Fig. S13). We have examined the relationship between C660 nm and the proxy and found them to be independent, indicating that uncertainties in the aethalometer calibration do not affect the resulting relationships between Eabs and the proxy. While we attribute the filter-based (apparent) BC absorption enhancement to lensing, future studies should evaluate its potential dependence on chemical components that are externally mixed with BC, including tar balls absorbing at longer wavelengths (Sect. 3.4), as well as calibration uncertainties and/or the deposited particle morphology.
MACbareBC is then estimated from the intercept of the linear fit between MACBC and NR-PM EC (Fig. 4c). The obtained values of 6.3 ± 0.3 m2 g−1 at 660 nm and 4.5 ± 0.2 m2 g−1 at 880 nm show little variability among the different sites and seasons (Fig. S14) and are within the literature range. The value of MACbareBC,880 nm is consistent with that reported in a laboratory study of externally mixed BrC–BC emissions from residential wood-burning (4.7 ± 0.3 m2 g−1; Kumar et al., 2018), calculated as the slope of a linear fit between MWAA-calibrated aethalometer attenuation values vs. the Sunset EC mass. Also, a review of 10 recent direct measurements of absorption and mass with different in situ instruments (Liu et al., 2020) concluded that uncoated (freshly emitted) BC has a typical MAC of 6.6 ± 0.6 m2 g−1 at 660 nm (extrapolated from 8.0 ± 0.7 m2 g−1 at 550 nm using AAEbareBC=1.0), which is within 1 standard deviation of the value recommended earlier (Bond and Bergstrom, 2006). The data scattering from the fitted line can be attributed to measurement errors, variability in BC size or physical properties and in the internal mixing ratio of NR-PM coatings to BC (Liu et al., 2015b; Chakrabarty and Heinson, 2018) as well as the location of BC within BC-containing particles (Adachi and Buseck, 2013).
The filter-based BC absorption enhancement factor () reaches a maximum of 2.0–2.5 at NR-PM EC ∼ 33 for both sites and seasons (Fig. S14) before plateauing, which is in agreement with multiple European rural background sites (Zanatta et al., 2016) and with Mie theory calculations (Zanatta et al., 2018; Cappa et al., 2019). Detailed optical calculations (Wu et al., 2018) support our observed “lensing saturation” effect associated with the aforementioned plateau, although this effect may depend on the BC physical properties and morphology. Total coated-particle-to-BC mass ratios of up to 5 and 6–11 (total particle-core diameter ratios of ∼ 1.4 and up to 2.2, respectively) are in general representative of partially coated (not completely engulfed aggregates) and embedded, compacted and core-shell-like soot particles, respectively (Chakrabarty and Heinson, 2018; Liu et al., 2020). The aforementioned mass ratio range for embedded (aged, heavily coated) soot is significantly lower (at least 3 times) than the proxy value of 30–40 where our maximum BC absorption enhancement is observed. This indicates that a small fraction of NR-PM is expected to be internally mixed with EC, leading to a corresponding absorption enhancement. Finally, considering the day-to-day variability in filter-based Eabs,BC (Fig. 4c), the eBC mass concentration determined using the aethalometer may not be accurate when using a fixed manufacturer MACBC corresponding to an assumed constant Eabs,BC over time.
Figure 5 summarises filter-based Eabs,BC values at longer wavelengths from recent studies, calculated as the average MACBC from long time series normalised to a reference MAC for bare BC (Bond and Bergstrom, 2006). While it is not certain how close the filter-based BC lensing is to true lensing for airborne particles, given the tendency of the filter deposition process to destroy part of the BC coatings, literature data of filter-based Eabs,BC values are not significantly different from those based on in situ measurements (Yuan et al., 2021). The average filter-based Eabs,BC at near-source and urban sites is slightly lower than the global average; there is no increasing trend towards remote sites far from any direct emission influence, possibly due to measurement errors, calibration uncertainties and/or the collapse of the BC “core” for high proxy values. Our full dataset filter-based Eabs,BC at longer wavelengths (660 and 880 nm) of 1.36 ± 0.07 is in agreement with the global literature average values.
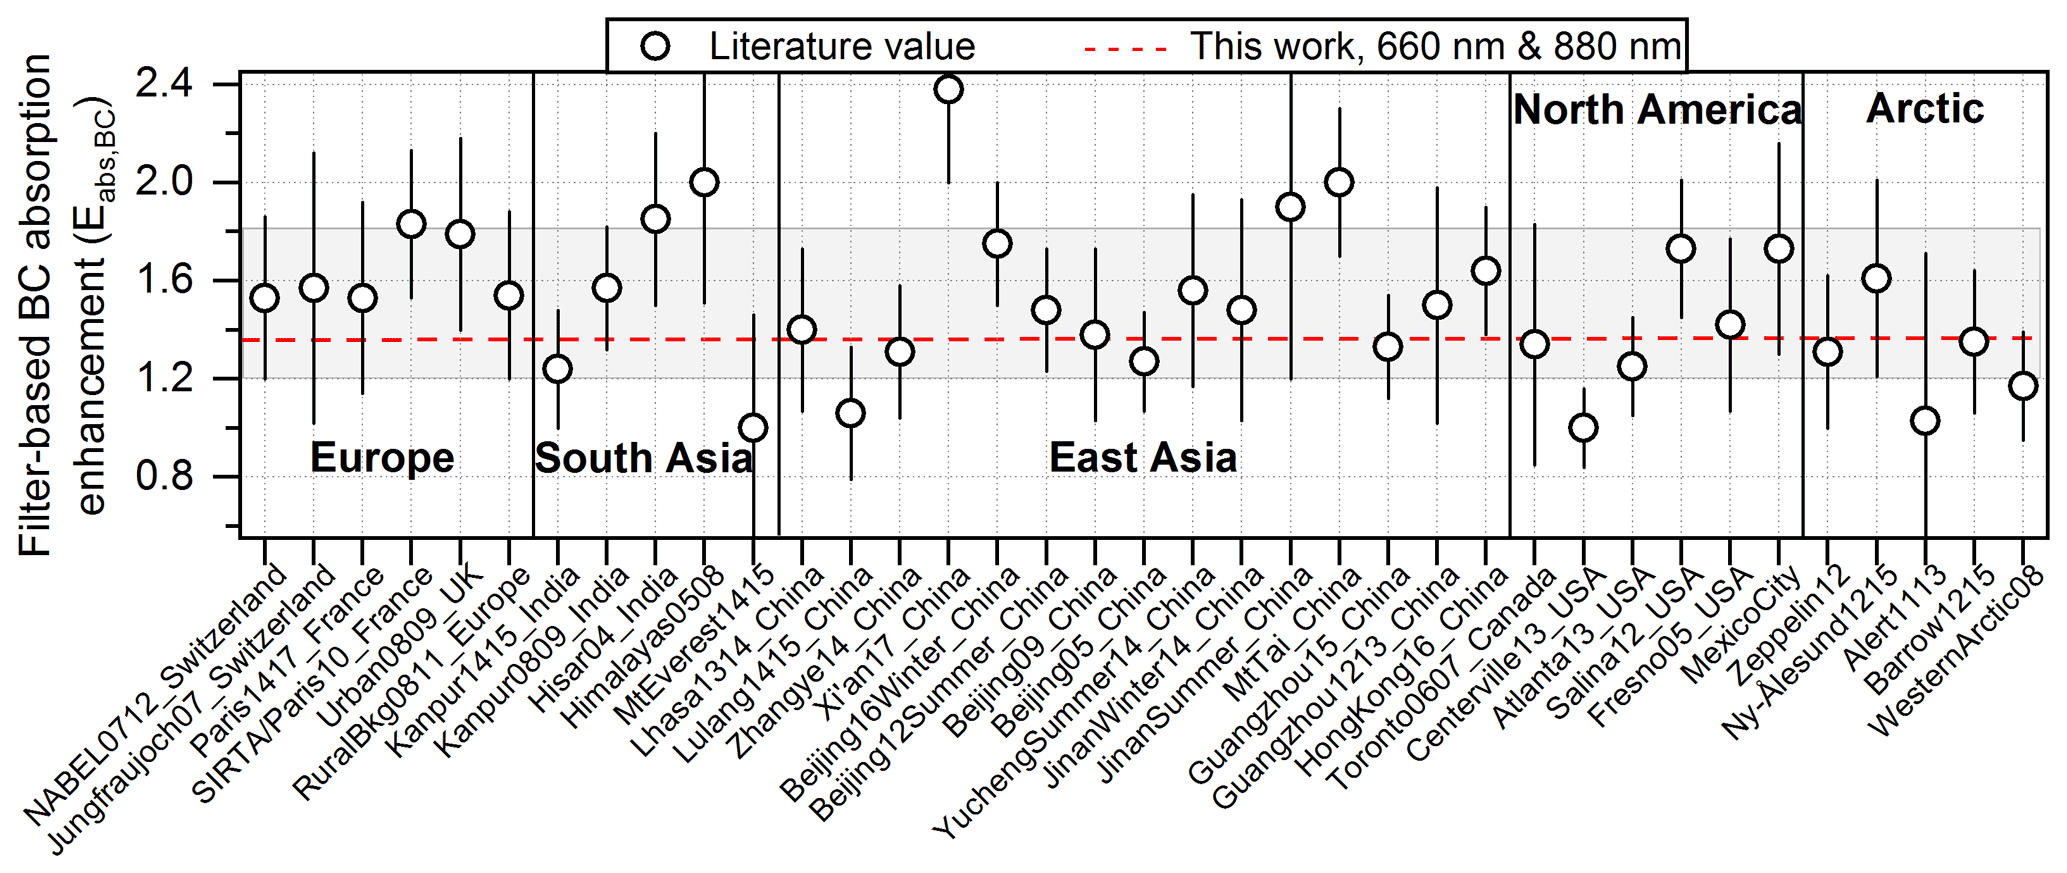
Figure 5Summary of campaign-average (error bars: ± 1 SD) filter-based BC absorption enhancement factor (Eq. C4) at longer wavelengths (> 600 nm), reported or inferred using or extrapolating an observational reference value for uncoated BC MAC (Bond and Bergstrom, 2006) with the most common instruments (aethalometer, PSAP, MAAP, Desert Research Institute (DRI) or Sunset OC–EC analyser) at various locations and years. The grey-shaded area shows the global average within 1 SD (1.5 ± 0.3). The horizontal dashed red line denotes the full dataset-average filter-based Eabs,BC obtained in this study > 600 nm (1.36), where BrC does not contribute to absorption (Figs. 1–3).
3.6 Optical closure of total absorption: black and brown carbon and filter-based lensing
In this section, we estimate the contributions of bare BC, BrC and filter-based lensing to the absorption at different wavelengths; the calculations are detailed in Appendix C. Briefly, we use the MACbareBC,660 nm and AAEbareBC to infer MACbareBC at shorter wavelengths, which we use to determine bare BC absorption coefficients (in Mm−1) for the daily samples by multiplying with the Sunset EC mass concentration. BrC absorption coefficients are determined based on Mie calculations in Sect. 2.3. We assign the difference between total measured minus the sum of calculated bare BC and BrC absorption coefficients to (filter-based) lensing. Results are displayed in Fig. 6 for Magadino winter, Magadino summer and Zurich yearly average.
Bare BC is found to contribute two-thirds of the particulate absorption in the near-UV-to-infrared wavelength range. Particulate BrC contributes significantly to absorption in the near-UV region despite having lower absorptivity than BC because the mass of BrC-containing OA is ∼ 10 times greater (Fig. S12). The average contributions (± 1 SD corresponding to day-to-day variability) of particulate BrC to total measured absorption are 30 ± 14 % at 370 nm, 10 ± 6 % at 470 nm, 6 ± 4 % at 520 nm and 4 ± 2 % at 590 nm. BrC absorption from mostly primary biomass burning emissions is relatively more important at the rural site during winter, with a contribution of 45 ± 15 % at 370 nm. Absorption not explained by bare BC + BrC and therefore attributed to filter-based BC lensing contributes to a similar extent as BrC in the 370–880 nm range. The ratio of BrC–BC lensing ranges between 0.25 ± 0.06 (urban site and rural summer) and 0.65 ± 0.14 (rural winter).
3.7 Observation of filter-based BC lensing suppression induced by BrC coatings
Figure 6 highlights a wavelength dependence of filter-based BC lensing (yellow area): compared to the average filter-based Eabs,BC of ∼ 1.4 at 660 and 880 nm (Fig. 5), the average filter-based Eabs,BC at 370 nm (Eq. C4) is significantly lower, around 1.1 (Magadino winter: 1.05; Magadino summer: 1.07; Zurich: 1.13), while BC lensing is expected to be nearly wavelength-independent if the coating is non-absorbing. In all three cases, the total measured absorption at 370 nm (orange markers in Fig. 6) is lower than the calculated total absorption obtained by adding the absorption by BrC and absorption by BC including transparent shell lensing extrapolated from 660 nm (grey lines in Fig. 6). This reduction amounts to 14 % for Magadino winter, 18 % for Magadino summer and 13 % for Zurich. For all three cases, the reduction is moderate but remains higher than our best estimates of quantifiable uncertainties, as discussed in Appendix C. The significance of this effect beyond uncertainties is further discussed below for Fig. 8. The respective reduction in the filter-based BC lensing, babs,lensBC, at 370 nm is 87 %, 82 % and 63 % for the three cases, respectively. When averaged across 370–880 nm, this reduction (yellow area vs. the area defined by the grey line minus the brown area minus the black area) becomes 16 %, 14 % and 11 %, respectively.
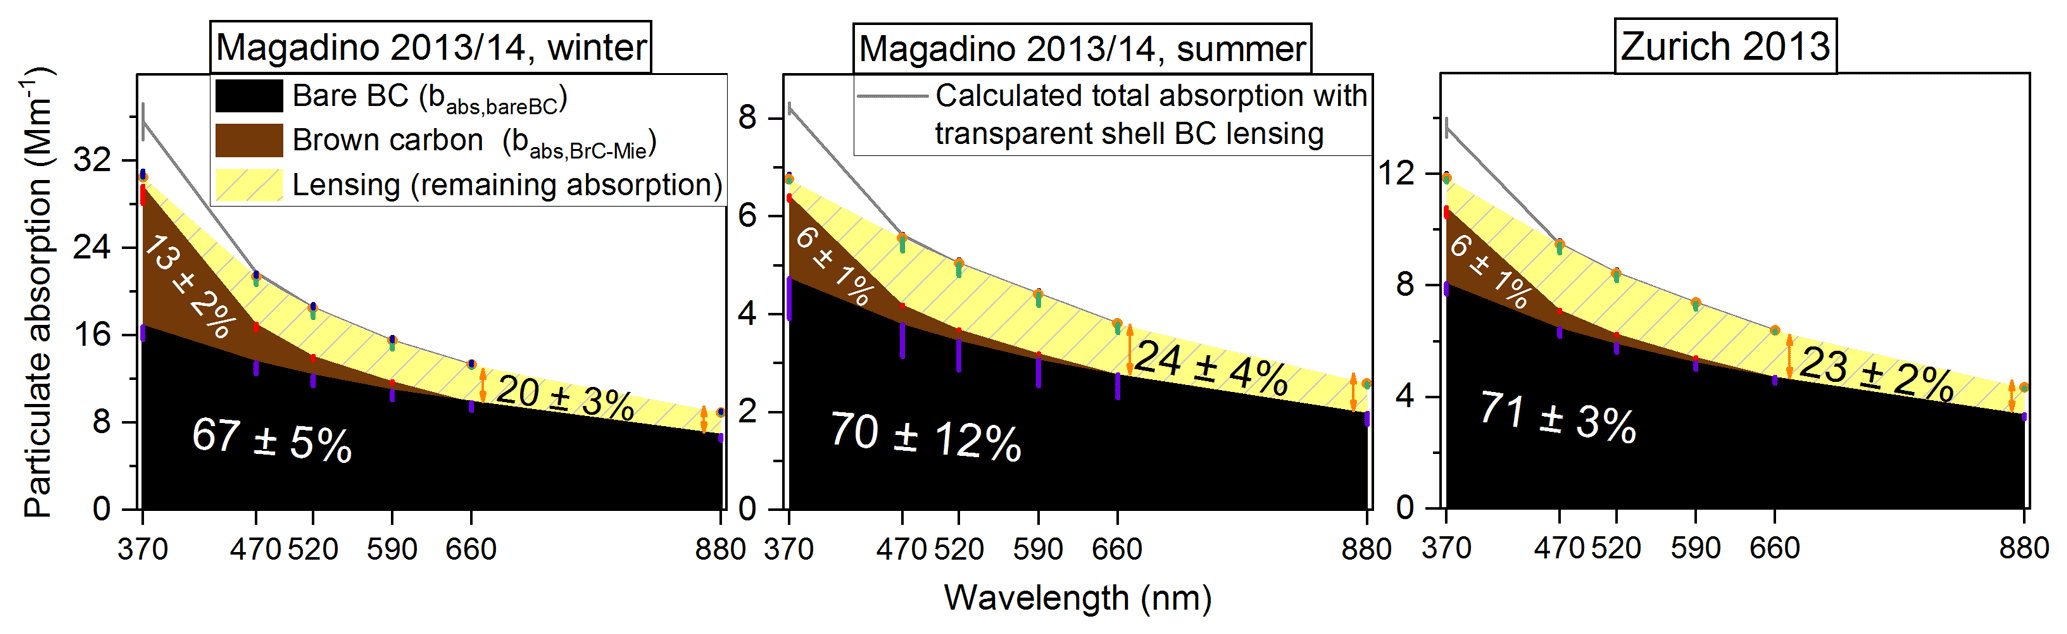
Figure 6Optical closure results at six AE33 wavelengths (x axis, linear scale), shown as cumulative contributions (labels) to total (calibrated) measured particulate absorption (y axis) of the different carbonaceous aerosol species (bare BC, extractable BrC) and the filter-based BC absorption enhancement (lensing) defined as “remaining absorption”. The total measured absorption, babs,total, is indicated with the orange circles (uncertainty: upward blue error bars). Note the different ranges of babs values (y axis) between the three cases. Orange arrows indicate the lensing contribution at longer wavelengths (660, 880 nm) for the three cases, with filter-based Eabs,BC being equal to (1.35 ± 0.10, 1.33 ± 0.10), (1.37 ± 0.24, 1.38 ± 0.17) and (1.35 ± 0.07, 1.33 ± 0.07) for Magadino winter, Magadino summer and Zurich, respectively. The error bars (minus direction shown; violet: BC; green: BC lensing; red: BrC) were computed by error propagation on the mean values (Eqs. C1–C3) using the Cλ (Fig. A1), MACbareBC,660 nm (Fig. S14), AAEbareBC (Fig. 4a) and (Sect. S5) relative errors (Appendix C). The grey line indicates calculated total absorption by adding the absorption by BrC and absorption by BC including transparent shell lensing (assumed to be wavelength-independent) extrapolated from 660 nm.
We now examine the relationship between the extent of filter-based lensing suppression and the contribution of BrC to the total absorption ( babs,total). For this, we compute the filter-based BC lensing ratio, which is a measure of the remaining lensing at a short wavelength compared to 660 nm, as defined in Eq. (3):
In Eq. (3), j represents a daily sample, babs,total is the total aerosol absorption coefficient (Eq. S2), is the Mie-predicted absorption coefficient for total extractable BrC (Eq. S6), AAEbareBC is the wavelength dependence of the residual absorption after methanol extraction of the filters (Sect. 3.4), and Eabs,BC is the filter-based BC absorption enhancement factor (Eq. C4). We plot the filter-based lensing ratio against babs,total in Fig. 7. Lensing suppression would result in lensing ratios below unity. Addition of externally mixed BrC to an aerosol would not alter the lensing ratio while increasing the babs,total, thereby moving a data point horizontally to the right. Adding externally mixed BC to an aerosol would decrease the lensing suppression and the fraction of absorption by BrC in such a way that the data point would move along a straight line towards the point (0,1). Figure 7 shows that the filter-based (or apparent) BC lensing ratio is reduced with an increasing contribution of BrC to the total absorption at 370 nm, indicating that lensing suppression occurs when BrC makes a substantial contribution to the total absorption.
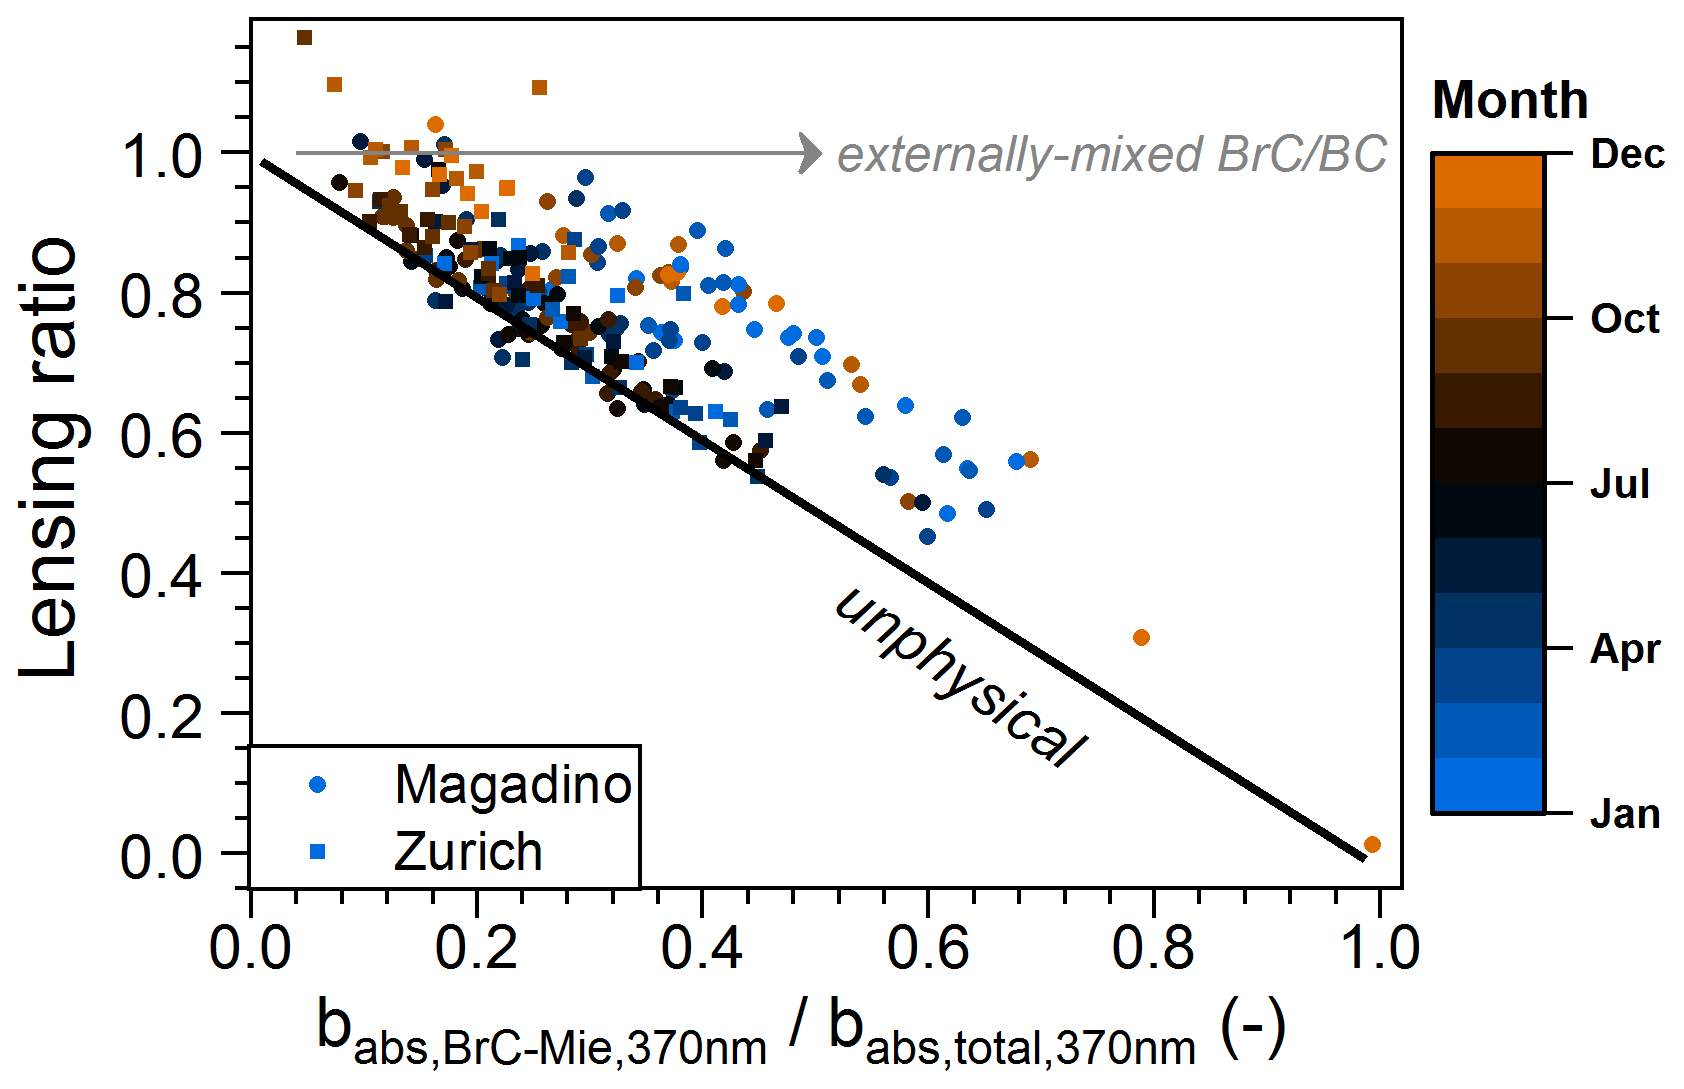
Figure 7Relationship between the filter-based lensing ratio, Eabs,370 nm Eabs,660 nm (Eq. 3; independent of MACbareBC), and the estimated average contribution of BrC to total absorption ( babs,total) at 370 nm, showing that the extent of filter-based lensing suppression is related to the presence of BrC. The solid black line is the – x+1 line below which data are physically forbidden (where the +1 intercept is based on the assumption that lensing by transparent shells is wavelength-independent). The addition of externally mixed BrC would result in an increase in the babs,total without a decrease in the lensing ratio, as indicated by the grey arrow. As a consequence, points near the black line are theoretically impossible if a substantial fraction of BrC is externally mixed from BC.
While Fig. 6 discusses the extent of filter-based lensing suppression by BrC coatings for dataset subsets, we present in Fig. 8 a framework allowing the quantitative examination of absorption suppression for all samples. The framework is based on two of the most commonly used parameters to describe the aerosol absorption: the total aerosol AAE370−660 nm and the contribution of BrC to the total absorption, babs,total. Lensing suppression can be seen as an increase in the babs,total without a commensurate increase in the total aerosol AAE370−660 nm. The extent of suppression is shown as the isopleth, calculated as the relative deviation of the measured total absorption from the predicted total absorption by adding the absorption by BrC and absorption by BC including transparent shell lensing extrapolated from 660 nm using AAEbareBC=0.93 (this is analogous to the difference between the orange markers and the grey line in Fig. 6). Uncertainty in the ratio used for the calibration of AE33 attenuation measurements translates into vertical error bars. Meanwhile, horizontal error bars include uncertainties in AE33 absolute calibration coefficients, C370 nm, and in the BrC absorption at 370 nm from Mie calculations without contingency for errors associated with deviations from spherical homogeneous particles (see Appendix C). It can be clearly seen that the measured absorption at 370 nm (Fig. 8a) is systematically lower than the predicted absorption, which provides an indication that lensing suppression occurs. Overprediction is observed for 84 % of data points. The P25–P75 (P: percentile) total absorption reduction range at 370 nm vs. 660 nm is 11 %–18 %. The contribution of BrC to the total absorption at 470 nm effectively remains around 3 times lower than at 370 nm. The differences between calculated and measured total absorption at 470 nm remain within our quantifiable uncertainties for the majority of data points (Fig. 8b), indicating that lensing suppression is trivial at this wavelength.
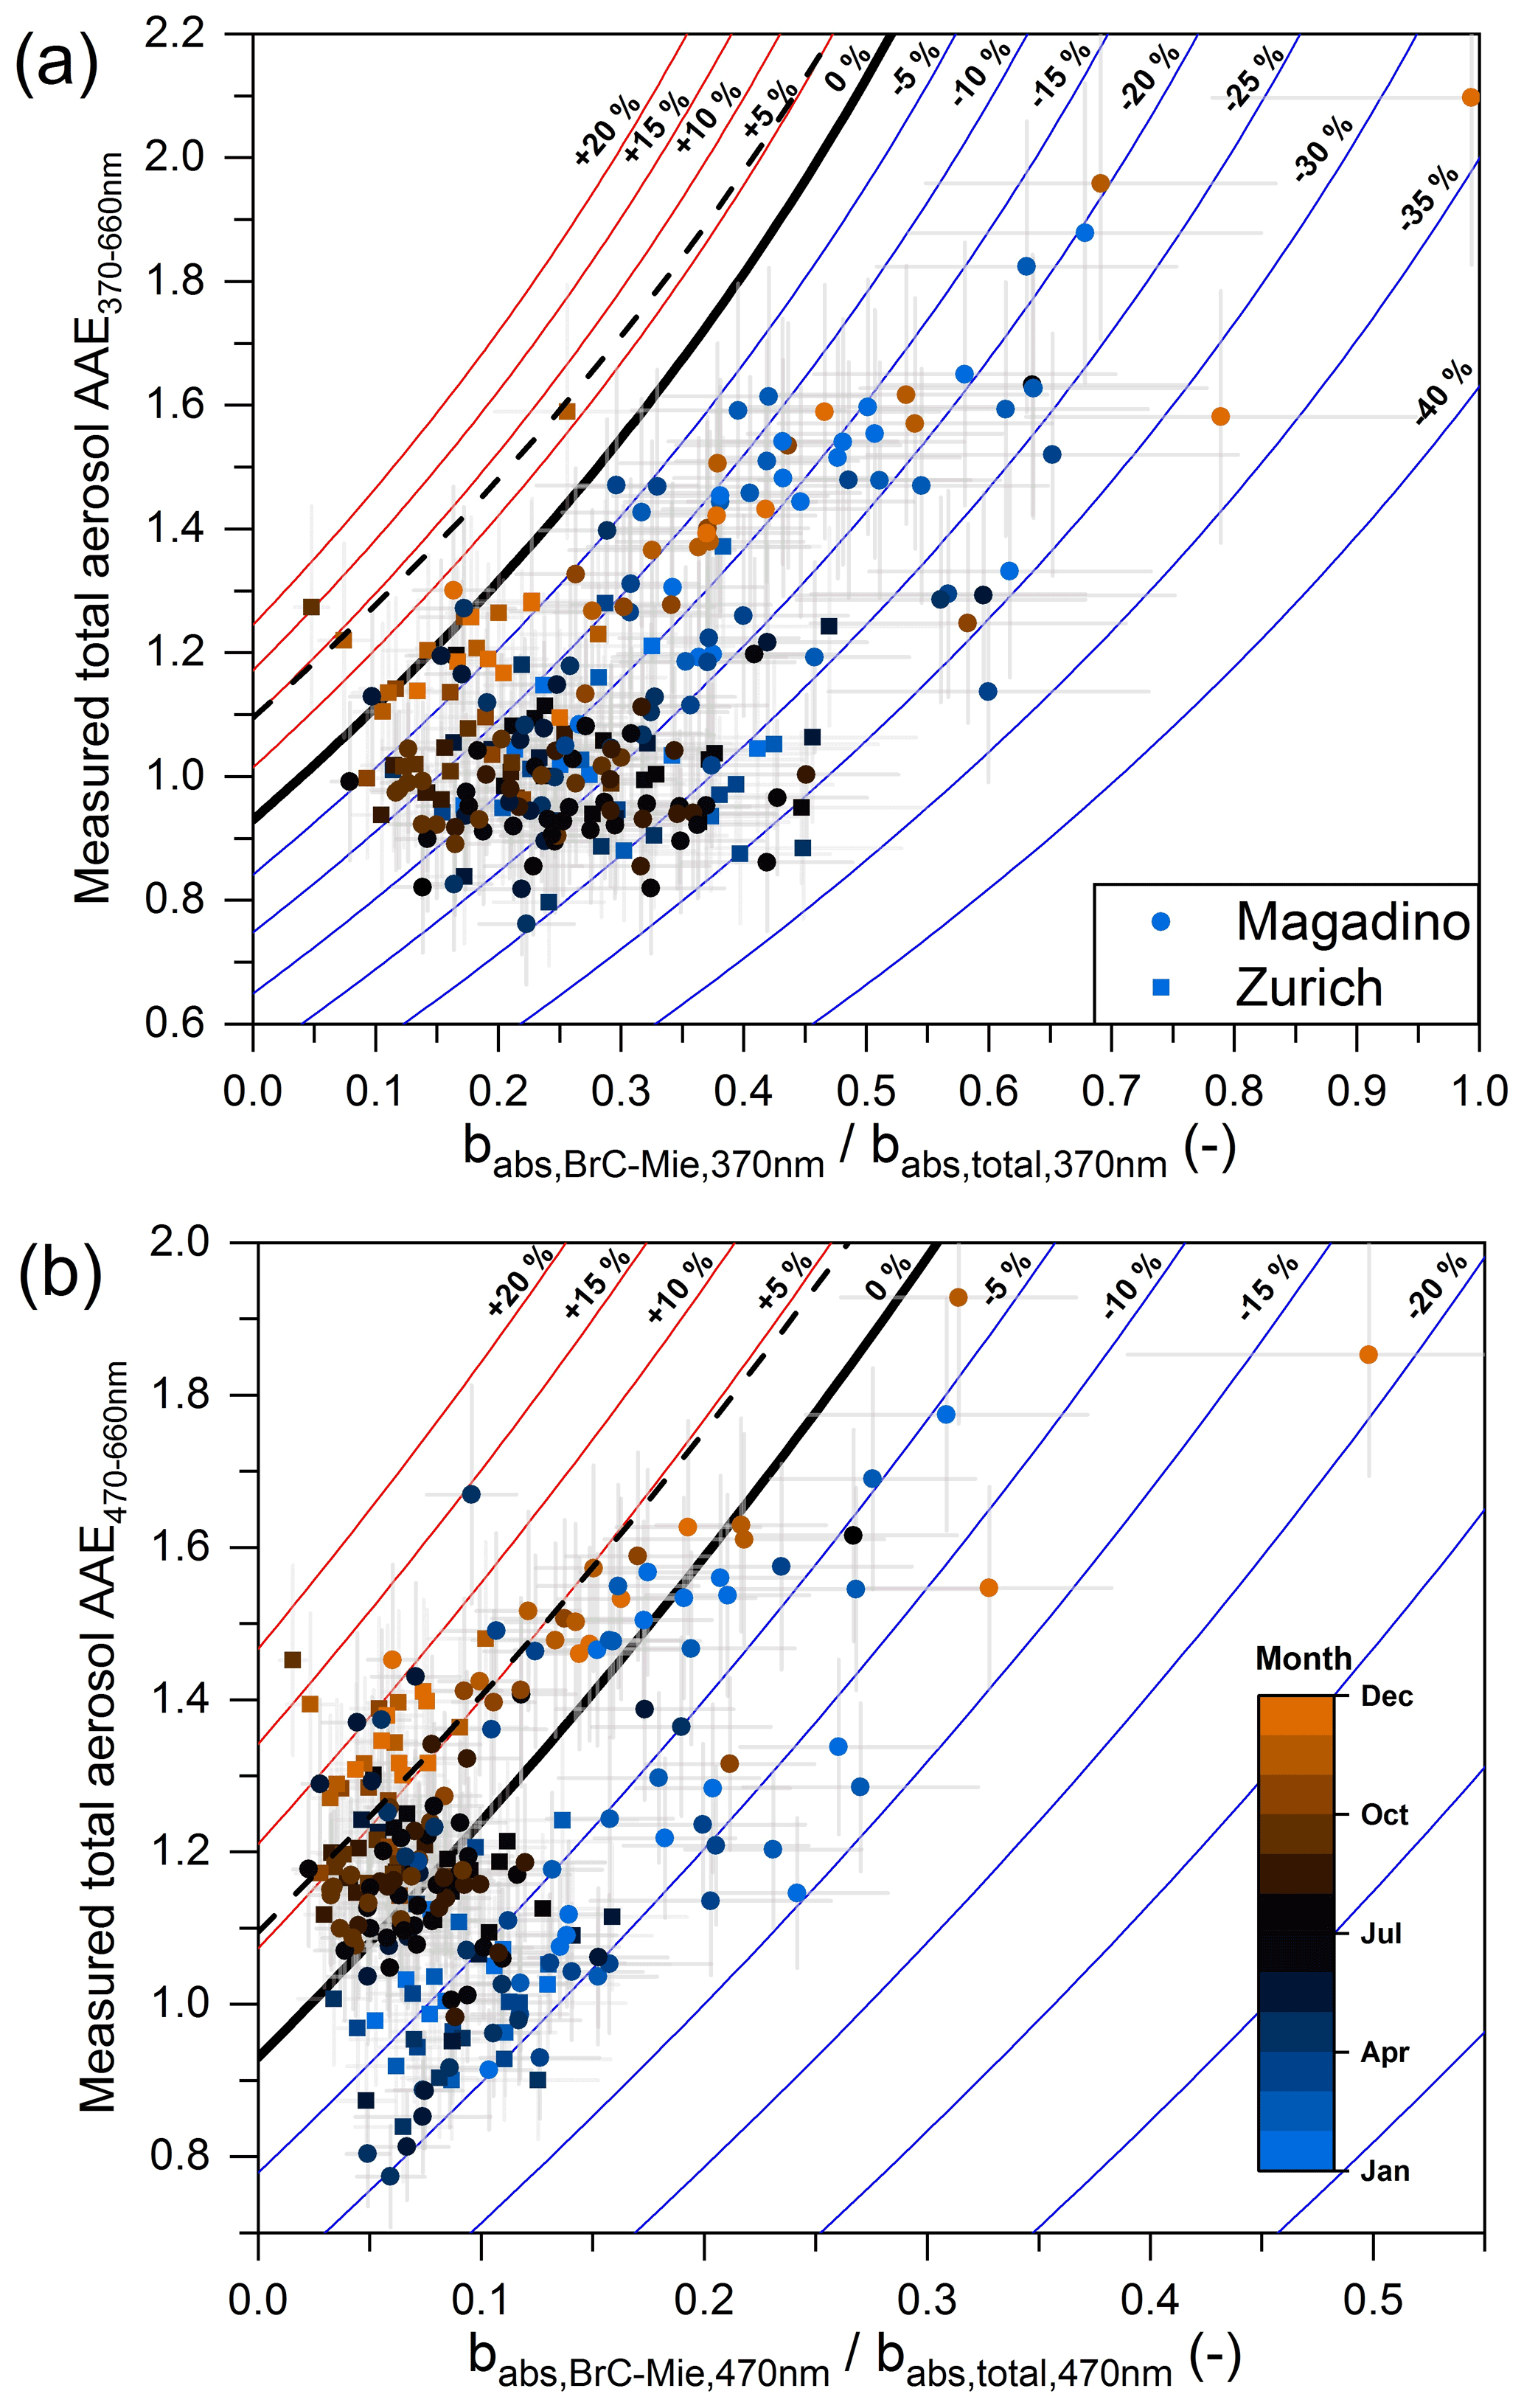
Figure 8Total measured aerosol AAE (referenced to 660 nm) vs. the ratio of calculated BrC absorption to measured total absorption at 370 nm (a) and 470 nm (b), showing the effect of BrC–BC interactions on the aerosol absorption profile. Uncertainty in the ratio C370 nm C660 nm used for the calibration of AE33 attenuation measurements translates into vertical error bars, while horizontal error bars include uncertainties in AE33 absolute calibration coefficients C370 nm and in the BrC absorption at 370 nm from Mie calculations without contingency for errors associated with assuming homogeneous spheres. The isopleths indicate the extent of total absorption under- or overestimation on the basis of a predicted absorption by BC and BrC, where (apparent) lensing by transparent BC coatings (using AAEbare BC=0.93) is assumed to be wavelength-independent (isopleth = (measured – predicted) predicted). The dashed line, which corresponds to additive absorption if transparent shell lensing was increasing with decreasing wavelength (by 10 % or 6 %, from 660 to 370 nm or 470 nm, respectively), serves to illustrate sensitivity of the closure to spectral extrapolation of transparent shell lensing. Overpredictions (negative isopleths) provide indication for a filter-based lensing suppression effect.
Our results provide the first experimental indication for potential BC lensing suppression in atmospheric aerosols at 370 nm wavelength, where BrC absorption is significant. The central estimate of filter-based is only ∼ 80 % of the expected value if BrC were entirely externally mixed from BC. The inferred observed (filter-based) BC lensing suppression has been predicted by theoretical calculations. Lack and Cappa (2010) demonstrated using Mie calculations that lensing can be suppressed with increasing shell absorptivity and/or thickness. The authors considered two cases. In the first case, they assumed a small BC core of 60 nm diameter coated with 40 nm of a material having a k of ∼ 0.05, which resulted in a BrC contribution to total absorption of 0.22. In this example, the Eabs,BC reduction at 400 nm (vs. 750 nm) was predicted to be only ∼ 5 %, which is at the low end of values found experimentally in our study for the same BrC contribution (for 0.15 < babs,total<0.30, the P25–P75 filter-based Eabs,BC reduction range at 370 nm vs. 660 nm is 13 %–23 %). In the second case, they modelled a large BC core of 300 nm diameter coated with 200 nm of the same material, which resulted in a similar BrC contribution to total absorption of 0.25. In this example, the Eabs,BC reduction at 400 nm was predicted to be as high as ∼ 30 %, which is much more important than values found here for the same BrC contribution. These calculations support our experimental findings of filter-based lensing suppression by BrC coatings. At the same time, the occurrence of this effect would require (i) large and compact BC cores, (ii) significant fraction of the BrC internally mixed with BC particles, and (iii) high effective absorptivity of the brown coatings. Plausibility of such properties remains speculative as we do not have auxiliary measurements to further support or discard them. In addition, we note that Mie calculations used in Lack and Cappa (2010) and here are highly simplified, and resulting estimates may differ from those using particle-resolved ensemble models (Fierce et al., 2020; Wu et al., 2020). In particular, core-shell models are less accurate for larger size parameters (when D>λ), considering also that particle-to-particle heterogeneity in composition is an important feature of lensing effects (Fierce et al., 2020). Therefore, the interpretation of our observations on the basis of core-shell models should be exercised with caution (Wu et al., 2018; Chakrabarty and Heinson, 2018), and additional controlled laboratory experiments and sophisticated modelling work would be needed to better constrain this effect. Finally, we note that our optical closure is limited in terms of interpretation of lensing effects due to unquantifiable uncertainties potentially associated with filter sampling artefacts, possible chemical interactions between airborne BrC molecules or with BC, and the use of simplified Mie calculations to obtain the particulate BrC absorption (Appendix C).
This study attempted to provide a holistic approach to understand the spectrally resolved absorption by atmospheric BrC and BC using long time series of daily samples from filter-based measurements. We determined the wavelength-dependent MAE in dilute bulk solutions for total methanol-extracted OA. The imaginary part of the refractive index of different OA fractions was estimated by applying UV–vis–PMF (Moschos et al., 2018). The resulting k370 nm values of methanol-soluble BBOA, WOOA and other OA were 0.06, 0.03 and 0.006, respectively. We attributed the totality of the NR-PM absorption at shorter wavelengths to methanol-extractable BrC and demonstrated that the oxygenated OA component linked to anthropogenic secondary OA can be as important as primary biomass smoke for BrC absorption, especially at the urban background site. As for BC, our results suggest that the MAC of bare BC particles is independent of its source, with a MAC of ∼ 6.3 m2 g−1 at 660 nm and an AAE of 0.93 ± 0.16. Our observations provide clear evidence for absorption-enhancement-associated non-refractory coatings, which increase the MAC of BC by a factor of ∼ 1.4 on average at longer wavelengths through the so-called lensing effect. This enhancement factor falls within the range of previously reported values, 1.5 ± 0.3, from studies all over the globe applying filter-based techniques.
We have performed optical closure between measured and calculated total absorption at near-UV wavelengths, where the latter is obtained by addition of the absorption by BrC constrained with UV–vis absorbance spectroscopy of filter extracts combined with Mie calculations and the absorption by BC including a transparent shell lensing constrained by the total absorption at 660 nm combined with extrapolation to near-UV wavelengths. Based on this closure, we provide first experimental indication of lensing suppression in real-world samples. The effect is moderate and remains restricted to shorter wavelengths, and additional controlled laboratory experiments and sophisticated modelling work would be needed in future studies to better constrain the lensing suppression effect, which we derive here based on simplified Mie calculations.
While the optical absorption closure approach presented here involves multiple assumptions and simplified concepts, our results provide useful experimental insights into understanding BrC–BC interactions and total atmospheric aerosol absorption as well as uncertainties in filter-based measurements for quantifying BrC absorption. If lensing suppression occurs due to internal mixing of BC and BrC as is apparently the case for many samples in our study, then the additional absorption by BrC would be partially compensated by a concurrent lensing factor reduction. As a consequence, very different results for the BrC contribution to total absorption may be obtained by following either of the two approaches: (i) estimation of the BrC contribution from extracts and Mie calculations (as considered in this study) or (ii) estimation of the BrC contribution from the total measured absorption minus the absorption by BC + transparent shell lensing. We attempted to calculate the BrC absorption by subtracting the total BC contribution from the total calibrated absorption (approach ii) using an AAE of 0.93 and considering that only BC contributes to light absorption at 660 nm. This approach led to considerably lower estimates of BrC absorption, i.e. around 64 % less on average at 370 nm compared to the average that we obtained with approach (i). Therefore, if lensing suppression occurs, the babs,BrC at shorter wavelengths obtained from the classical additive BC–BrC model (e.g. Zhang et al., 2020) could be biased low, or the total absorption calculated with the additive BC–BrC model and babs,BrC constrained through material properties and optical models neglecting mixing effects could be biased high.
Our study allows a better understanding of the interactions between BrC, BC and non-absorbing PM and their influence on the optical absorption profile of the aerosol, often described by the AAE. The AAE from aethalometer measurements is often used to distinguish between the eBC from wood burning emissions (high AAE) and from traffic emissions (low AAE). We show that the BrC fraction can vary without a concurrent variation in AAE between 370 nm and red to near-infrared wavelengths, potentially as a consequence of lensing suppression effects for internal mixtures of BC and BrC. This suggests that 470 nm may be a better choice than 370 nm for the short wavelength in the aethalometer SA model, which is often applied for eBC source apportionment. When BBOA contributes more than 30 %–40 % to OA mass (e.g. Magadino winter), the absorption of BBOA will dominate, but when the BBOA contribution to OA mass is close to 10 % (e.g. Magadino summer or Zurich), the less absorptive OOA can be expected to dominate the OA absorption in the absence of other highly absorptive primary BrC sources. Therefore, our results suggest that ageing produces light-absorbing OOA coatings, which may significantly contribute to BrC absorption. However, due to lensing at longer wavelengths and lensing suppression at shorter wavelengths, this high contribution may not be visible in the total aerosol AAE values, which cluster around ∼ 1–1.1.
Finally, we estimate the fraction of solar radiation absorbed by carbonaceous species in the 300–900 nm range for our dataset covering a wide range of conditions in the atmosphere. In Fig. 9, we compare the overall optical significance of atmospheric BrC, bare BC and BC lensing. This is based on the calculation of the rate of energy transfer (RET) per volume due to light absorption by total carbonaceous aerosol (RETtot) and the fractional RET (W) due to light absorption by a fraction X relative to that due to the total carbonaceous aerosol (RETX RETtot). Calculations are shown in Appendix D.
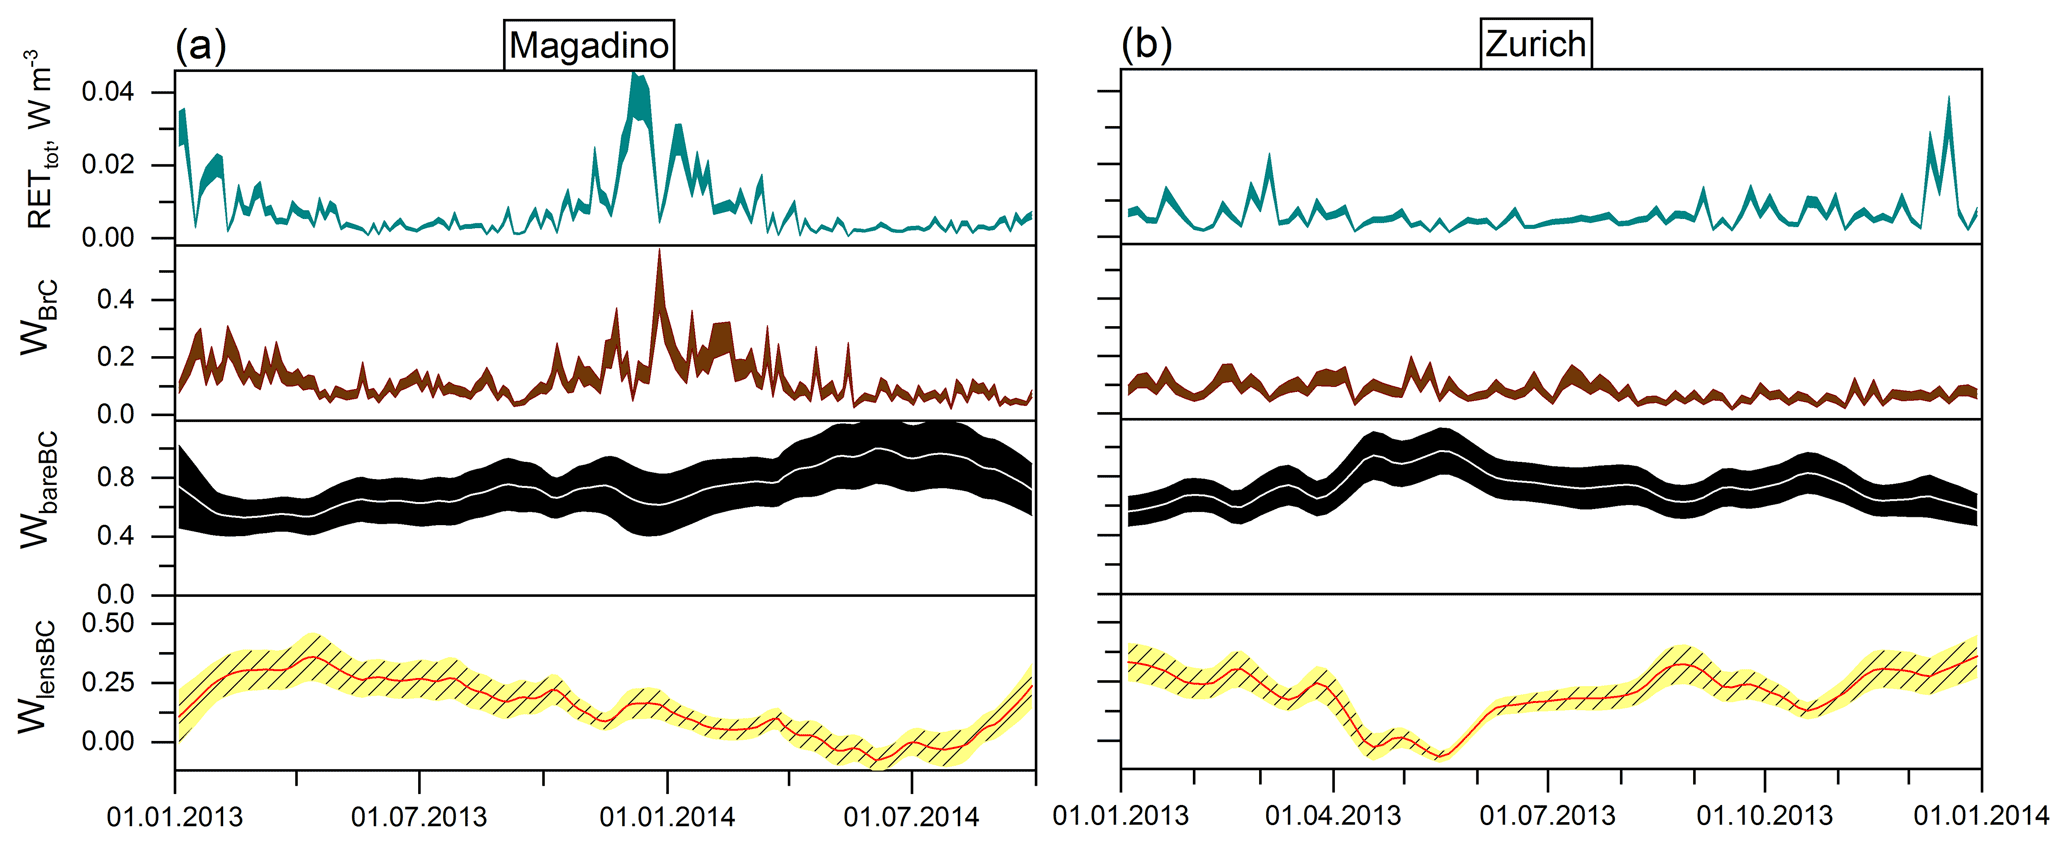
Figure 9Time series of the extractable Mie-predicted particulate BrC (brown), bare BC (black) and filter-based BC lensing (sparse light yellow) fractional contributions (W) to the rate of energy transfer per volume due to light absorption by total carbonaceous aerosol (RETtot; dark cyan) upon integration of the respective absorption spectra with the solar radiation spectrum at 300–900 nm (Eq. D1) for Magadino (a) and Zurich (b). Contributions are shown as surfaces indicating propagated errors covering the full range upon integration. Contributions by bare BC and lensing were smoothed for demonstration (central estimates are shown as white and red lines, respectively).
Figure 9 shows that the dominant contribution to solar radiation absorption stems from BC alone (around two-thirds), amplified by the lensing effect (min to max IQR: 3 %–34 %). Data with negative lensing contributions are not statistically different from zero and are mainly related to errors in the MACbareBC determination (Sect. 3.5). The average contributions by BrC vary between 8 ± 3 % (summer at both sites and Zurich) and 17 ± 7 % (Magadino winter) with a maximum of ∼ 40 %. The P5–P95 of the full-dataset WBrC considering the overall uncertainties is 3 %–26 %. Therefore, extractable particulate atmospheric BrC is an optically relevant carbonaceous component, especially at places affected by intense biomass or residential burning activity. Also, BrC can become the predominant absorbing species in the UV region (< 400 nm, ∼ 7 % of sun's energy), with calculated average contributions between 50 ± 16 % (Magadino winter) and 29 ± 11 % (rest of the data), and thus can potentially affect together with BC (Kirchstetter and Thatcher, 2012) photochemical processes and reactions occurring in the troposphere.
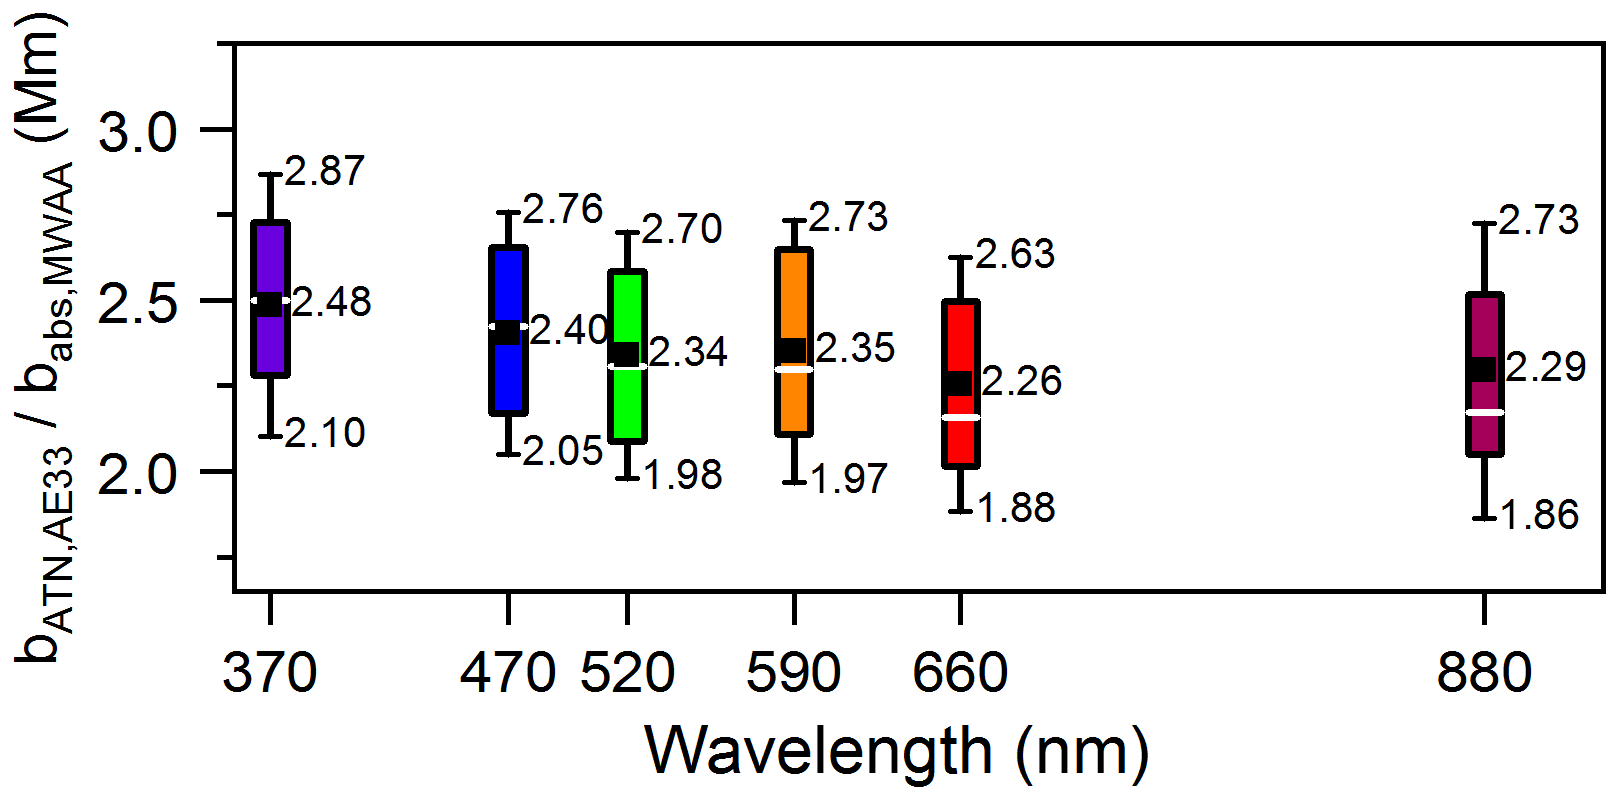
Figure A1Wavelength-specific AE33 calibration coefficients, C(λ), upon comparison of the loading-compensated AE33 attenuation with the MWAA absorption coefficient; Sects. 2.1.3; S3.1) for 27 quartz fibre filter samples from Magadino 2013 (PM10), Magadino 2014 and Zurich 2013 (PM2.5) (white line and box: median and IQR; black squares and whiskers: mean and 1 SD (labels)).
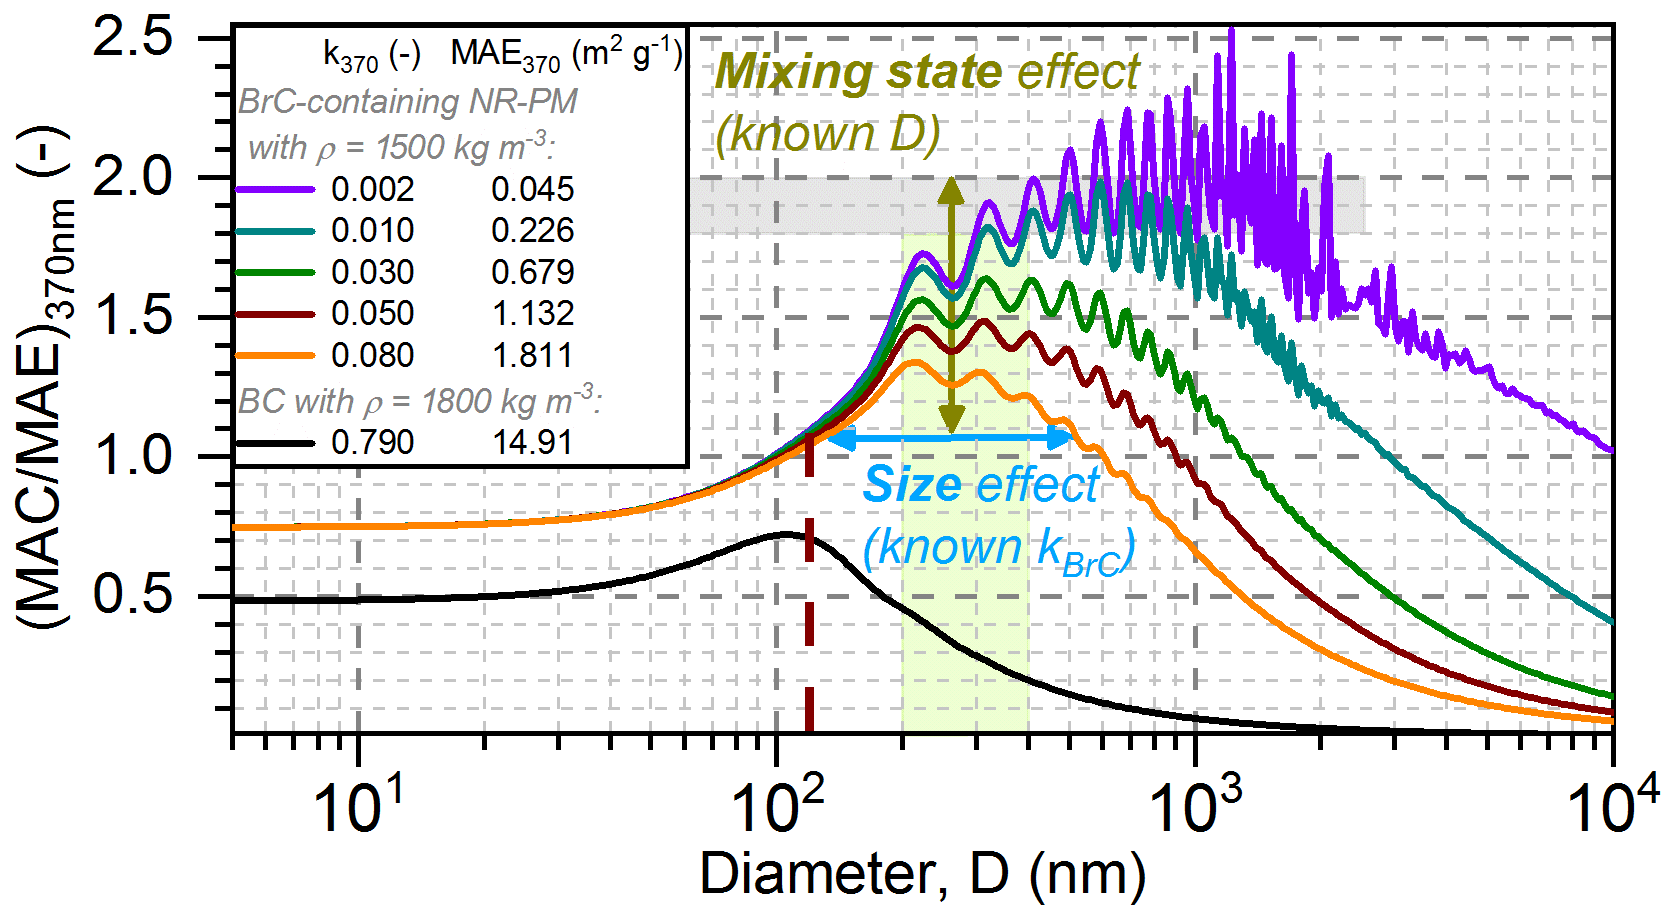
Figure B1Effect of particle size on the MAC MAE ratios at 370 nm for BrC-containing NR-PM particles with absorptivity up to that of pure BC. The different curve colours correspond to approximate absorptivity of individual methanol-extracted fractions determined by UV–vis–PMF (orange: WINS-BBOA; brown: methanol-soluble BBOA; green: WOOA; dark cyan and violet: range of “other OA” absorptivity). The light-green box and thick dashed brown line indicate the larger size range mode and the lower limit, respectively, considered for Mie calculations. The light-grey box indicates the MAC MAE range of 1.8–2.0 previously reported in the literature.
We detail here the methodology we followed to calculate the contribution of different fractions to total absorption measured by AE33. We used as direct input the estimated BrC absorption using Mie calculations (Sect. 2.3). We estimated the bare BC absorption at λ≥660 nm, , using EC time-resolved concentrations, [EC]j, and the MAC of bare BC at λ≥660 nm, MACbareBC(λ), based on Eq. (C1). The MACbareBC(λ) is estimated based on the extrapolation of MACBC(λ) at NR-PM EC ratios = 0 (Sect. 3.5). The EC relative error is defined as .
The bare BC absorption at < 660 nm was estimated using the AAE measured using the MWAA upon methanol extraction, AAEbareBC (Sect. 3.4), to extrapolate the bare BC absorption from 660 nm, .
BC lensing was attributed to the remaining absorption by subtracting the calculated absorption of bare BC and BrC from the total calibrated AE33 absorption:
The term represents the transparent shell lensing at longer wavelengths or the residual (BC) lensing at shorter wavelengths. We then define the time-resolved BC absorption enhancement factor at all wavelengths as follows:
We present below the quantifiable uncertainties used to produce the error estimates in Figs. 6 and 8 and discuss non-quantifiable uncertainties. We note that the uncertainties presented are lowest estimates.
C1 Quantifiable uncertainties
Figure 6:
-
Grey lines show the uncertainties at 370 nm, which include the standard error (SE; 1 standard deviation, SD; and the total number of points considered, N: SE = SD sqrt(N-1)) of and AAEbareBC, and the uncertainty on estimation. The latter includes the uncertainty in the bulk BrC MAC MAE ratio and the SE of the UV–vis measurements.
-
Orange markers (blue error bars) show SE of the C values calculated from Fig. A1.
-
The black line (violet error bars) shows uncertainties in MACbareBC (determined from the confidence interval in Fig. S14) and SE of AAEbareBC and EC mass concentration, propagated through Eqs. (C1)–(C2).
-
The brown line (red error bars) shows uncertainties on estimation (including the uncertainty in the bulk BrC MAC MAE ratio and the SE of the UV–vis measurement).
-
The yellow line (green error bars) shows propagated uncertainties using Eq. (C3).
Figure 8:
-
The y axes show percentage uncertainties from the 1 SD of the or the ratio. The average (± 1 SD) and ratios are 1.11 ± 0.14 and 1.07 ± 0.09, respectively.
-
The x axes show propagated uncertainties from the estimation as discussed above and the 1 SD of the C values calculated from Fig. A1.
C2 Non-quantifiable uncertainties
We list below potential errors that could not be quantified but could affect our results:
-
Sampling adsorption and desorption artefacts can be expected when mixing results from real-time vs. offline filter-based measurements.
-
We have extrapolated the behaviour of BC core with hypothetical transparent shell from 660 to 370 nm with constant AAE. We consider this to be a reasonable assumption (sensitivity is illustrated in Fig. 8) and therefore a minor source of uncertainties.
-
Chemical interactions between airborne BrC molecules in their concentrated media or with BC can potentially affect the BC–BrC contributions to the mixture absorption (Andersson, 2017).
-
The use of an oversimplified optical model, based on Mie calculations, to obtain the BrC absorption is most likely the greatest source of uncertainty that has not been considered in our analysis. Therefore, while our results show the first evidence of lensing suppression at shorter wavelengths, additional controlled laboratory experiments and sophisticated modelling work would be needed to better constrain this effect.
The optical significance of particulate extractable BrC (Sect. 2.3) was assessed using the solar radiation spectrum (actinic flux at the Earth's surface) and an approach similar to that of Kumar et al. (2018). The wavelength-dependent solar emission flux, S(λ) (in W m−2 nm−1), is given by Levinson et al. (2010), in which data were obtained from the clear-sky Air Mass 1 Global Horizontal (AM1GH) solar irradiance model. We calculated for each sample j the rate of energy transfer (RET) per volume (in W m−3) for each absorbing fraction X, i.e. particulate BrC, bare BC and BC lensing (where RETlensBC = RETtot–RETbareBC–RETBrC), and the fractional RET (W) to the air mass due to the absorption by each fraction X compared to that of total carbonaceous aerosol, according to Eq. (D1):
We used an exponential decay model fit (5 nm resolution) for the babs,j of a fraction obtained at six AE33 wavelengths (370–880 nm) because the wavelength range and increments of the aethalometer, the UV–vis spectrophotometer and the solar spectrum datasets were different. Absorptions in the range 300–370 nm were obtained by extrapolating with a constant AAE based on observed spectral dependence of each fraction and are therefore less accurate. The range 280–300 nm was not considered in our calculations since virtually no radiation below 300 nm can reach the Earth's surface, an approximation that could cause greater bias at high altitudes, where such UV radiation is not fully attenuated by the atmosphere above.
AAE, absorption Ångström exponent; AE33, aethalometer (33 model); AMS, aerosol mass spectrometry; BBOA, biomass burning organic aerosol; (e)BC, (equivalent) black carbon; BrC, brown carbon; EC, elemental carbon; IQR, interquartile range; MAC, mass absorption cross-section; MAE, mass absorption efficiency; MeOH, methanol; MWAA, multi-wavelength absorption analyser; NR-PM, non-refractory particulate matter; PMF, positive matrix factorisation; RET, rate of energy transfer; SD, standard deviation; SE: standard error; UV–vis, ultraviolet–visible spectroscopy; WINS, water-insoluble (but methanol-soluble); WOOA, winter-oxygenated organic aerosol.

Data related to this article are available at https://doi.org/10.5281/zenodo.5055757 (last access: 24 July 2021, Moschos and El Haddad, 2021).
The supplement related to this article is available online at: https://doi.org/10.5194/acp-21-12809-2021-supplement.
VM and IEH conceptualised and formulated the study. VM performed the UV–vis measurements of methanol and water extracts. DM performed MWAA measurements before and after extractions. CC performed and discussed the FE-SEM–EDX analyses. SS and AV performed the 14C measurements. KRD and AV performed the AMS–PMF analyses. VM performed the UV–vis–PMF analyses. RLM, MGB, VM and IEH created the theoretical framework for optical interpretations and performed the Mie calculations. VM, IEH, MGB, RLM and JCC interpreted the results. VM prepared the figures and wrote the manuscript. IEH, ASHP, UB and MGB supported and supervised the research. All authors reviewed and commented on the paper.
The authors declare that they have no conflict of interest.
Publisher's note: Copernicus Publications remains neutral with regard to jurisdictional claims in published maps and institutional affiliations.
We acknowledge Zsófia Jurányi for the Mie code programmed in the software package Igor Pro and Jihwan Choi and Katherine Rowlands for experimental assistance. The authors thank Denise Verhoeven and Julia Schmale for administrative support.
This research has been supported by the Horizon 2020 framework programme H2020 Excellent Science (grant no. ERA-PLANET 689443) and the Staatssekretariat für Bildung, Forschung und Innovation (grant no. 15.0159-1).
This paper was edited by Alex Lee and reviewed by three anonymous referees.
Adachi, K. and Buseck, P. R.: Changes of ns-soot mixing states and shapes in an urban area during CalNex, J. Geophys. Res.-Atmos., 118, 3723–3730, https://doi.org/10.1002/jgrd.50321, 2013.
Adler, G., Wagner, N. L., Lamb, K. D., Manfred, K. M., Schwarz, J. P., Franchin, A., Middlebrook, A. M., Washenfelder, R. A., Womack, C. C., Yokelson, R. J., and Murphy, D. M.: Evidence in biomass burning smoke for a light-absorbing aerosol with properties intermediate between brown and black carbon, Aerosol Sci. Tech., 53, 976–989, https://doi.org/10.1080/02786826.2019.1617832, 2019.
Andersson, A.: A model for the spectral dependence of aerosol sunlight absorption, ACS Earth Space Chem., 1, 533–539, https://doi.org/10.1021/acsearthspacechem.7b00066, 2017.
Bohren, C. F. and Huffman, D. R.: Absorption and scattering by a sphere, in Absorption and scattering of light by small particles, WILEY-VCH Verlag GmbH & Co. KGaA, Weinheim, Germany, 82–129, 1998.
Bond, T. C. and Bergstrom, R. W.: Light absorption by carbonaceous particles: An investigative review, Aerosol Sci. Tech., 40, 27–67, https://doi.org/10.1080/02786820500421521, 2006.
Bozzetti, C., Daellenbach, K. R., Hueglin, C., Fermo, P., Sciare, J., Kasper-Giebl, A., Mazar, Y., Abbaszade, G., El Kazzi, M., Gonzalez, R., Shuster-Meiseles, T., Flasch, M., Wolf, R., Krepelova, A., Canonaco, F., Schnelle-Kreis, J., Slowik, J. G., Zimmermann, R., Rudich, Y., Baltensperger, U., El Haddad, I., and Prevot, A. S.: Size-resolved identification, characterization, and quantification of primary biological organic aerosol at a European rural site, Environ. Sci. Technol., 50, 3425–3434, https://doi.org/10.1021/acs.est.5b05960, 2016.
Cappa, C. D., Onasch, T. B., Massoli, P., Worsnop, D. R., Bates, T. S., Cross, E. S., Davidovits, P., Hakala, J., Hayden, K. L., Jobson, B. T., Kolesar, K. R., Lack, D. A., Lerner, B. M., Li, S. M., Mellon, D., Nuaaman, I., Olfert, J. S., Petaja, T., Quinn, P. K., Song, C., Subramanian, R., Williams, E. J., and Zaveri, R. A.: Radiative absorption enhancements due to the mixing state of atmospheric black carbon, Science, 337, 1078–1081, https://doi.org/10.1126/science.1223447, 2012.
Cappa, C. D., Zhang, X., Russell, L. M., Collier, S., Lee, A. K. Y., Chen, C.-L., Betha, R., Chen, S., Liu, J., Price, D. J., Sanchez, K. J., McMeeking, G. R., Williams, L. R., Onasch, T. B., Worsnop, D. R., Abbatt, J., and Zhang, Q.: Light absorption by ambient black and brown carbon and its dependence on black carbon coating state for two California, USA, cities in winter and summer, J. Geophys. Res.-Atmos., 124, 1550–1577, https://doi.org/10.1029/2018jd029501, 2019.
Chakrabarty, R. K. and Heinson, W. R.: Scaling laws for light absorption enhancement due to nonrefractory coating of atmospheric black carbon aerosol, Phys. Rev. Lett., 121, 218701, https://doi.org/10.1103/PhysRevLett.121.218701, 2018.
Chen, Q., Mu, Z., Song, W., Wang, Y., Yang, Z., Zhang, L., and Zhang, Y. L.: Size-resolved characterization of the chromophores in atmospheric particulate matter from a typical coal-burning city in China, J. Geophys. Res.-Atmos., 124, 10546–10563, https://doi.org/10.1029/2019jd031149, 2019.
Chen, Y. and Bond, T. C.: Light absorption by organic carbon from wood combustion, Atmos. Chem. Phys., 10, 1773–1787, https://doi.org/10.5194/acp-10-1773-2010, 2010.
Cheng, Y., He, K. B., Engling, G., Weber, R., Liu, J. M., Du, Z. Y., and Dong, S. P.: Brown and black carbon in Beijing aerosol: Implications for the effects of brown coating on light absorption by black carbon, Sci. Total Environ., 599, 1047–1055, https://doi.org/10.1016/j.scitotenv.2017.05.061, 2017.
China, S., Mazzoleni, C., Gorkowski, K., Aiken, A. C., and Dubey, M. K.: Morphology and mixing state of individual freshly emitted wildfire carbonaceous particles, Nat. Commun., 4, 2122, https://doi.org/10.1038/ncomms3122, 2013.
Chung, C. E., Kim, S.-W., Lee, M., Yoon, S.-C., and Lee, S.: Carbonaceous aerosol AAE inferred from in-situ aerosol measurements at the Gosan ABC super site, and the implications for brown carbon aerosol, Atmos. Chem. Phys., 12, 6173–6184, https://doi.org/10.5194/acp-12-6173-2012, 2012.
Corbin, J. C., Czech, H., Massabò, D., de Mongeot, F. B., Jakobi, G., Liu, F., Lobo, P., Mennucci, C., Mensah, A. A., Orasche, J., Pieber, S. M., Prévôt, A. S. H., Stengel, B., Tay, L. L., Zanatta, M., Zimmermann, R., El Haddad, I., and Gysel, M.: Infrared-absorbing carbonaceous tar can dominate light absorption by marine-engine exhaust, npj Clim. Atmos. Sci., 2, https://doi.org/10.1038/s41612-019-0069-5, 2019.
Daellenbach, K. R., Bozzetti, C., Křepelová, A., Canonaco, F., Wolf, R., Zotter, P., Fermo, P., Crippa, M., Slowik, J. G., Sosedova, Y., Zhang, Y., Huang, R.-J., Poulain, L., Szidat, S., Baltensperger, U., El Haddad, I., and Prévôt, A. S. H.: Characterization and source apportionment of organic aerosol using offline aerosol mass spectrometry, Atmos. Meas. Tech., 9, 23–39, https://doi.org/10.5194/amt-9-23-2016, 2016.
Daellenbach, K. R., Stefenelli, G., Bozzetti, C., Vlachou, A., Fermo, P., Gonzalez, R., Piazzalunga, A., Colombi, C., Canonaco, F., Hueglin, C., Kasper-Giebl, A., Jaffrezo, J.-L., Bianchi, F., Slowik, J. G., Baltensperger, U., El-Haddad, I., and Prévôt, A. S. H.: Long-term chemical analysis and organic aerosol source apportionment at nine sites in central Europe: source identification and uncertainty assessment, Atmos. Chem. Phys., 17, 13265–13282, https://doi.org/10.5194/acp-17-13265-2017, 2017.
Dasari, S., Andersson, A., Bikkina, S., Holmstrand, H., Budhavant, K., Satheesh, S., Asmi, E., Kesti, J., Backman, J., Salam, A., Bisht, D. S., Tiwari, S., Hameed, Z., and Gustafsson, O.: Photochemical degradation affects the light absorption of water-soluble brown carbon in the South Asian outflow, Sci. Adv., 5, eaau8066, https://doi.org/10.1126/sciadv.aau8066, 2019.
Drinovec, L., Močnik, G., Zotter, P., Prévôt, A. S. H., Ruckstuhl, C., Coz, E., Rupakheti, M., Sciare, J., Müller, T., Wiedensohler, A., and Hansen, A. D. A.: The ”dual-spot” Aethalometer: an improved measurement of aerosol black carbon with real-time loading compensation, Atmos. Meas. Tech., 8, 1965–1979, https://doi.org/10.5194/amt-8-1965-2015, 2015.
Favez, O., El Haddad, I., Piot, C., Boréave, A., Abidi, E., Marchand, N., Jaffrezo, J.-L., Besombes, J.-L., Personnaz, M.-B., Sciare, J., Wortham, H., George, C., and D'Anna, B.: Inter-comparison of source apportionment models for the estimation of wood burning aerosols during wintertime in an Alpine city (Grenoble, France), Atmos. Chem. Phys., 10, 5295–5314, https://doi.org/10.5194/acp-10-5295-2010, 2010.
Feng, Y., Ramanathan, V., and Kotamarthi, V. R.: Brown carbon: a significant atmospheric absorber of solar radiation?, Atmos. Chem. Phys., 13, 8607–8621, https://doi.org/10.5194/acp-13-8607-2013, 2013.
Fierce, L., Bond, T. C., Bauer, S. E., Mena, F., and Riemer, N.: Black carbon absorption at the global scale is affected by particle-scale diversity in composition, Nat. Commun., 7, 12361, https://doi.org/10.1038/ncomms12361, 2016.
Fierce, L., Onasch, T. B., Cappa, C. D., Mazzoleni, C., China, S., Bhandari, J., Davidovits, P., Fischer, D. A., Helgestad, T., Lambe, A. T., Sedlacek III, A. J., Smith, G. D., and Wolff, L.: Radiative absorption enhancements by black carbon controlled by particle-to-particle heterogeneity in composition, P. Natl. Acad. Sci. USA, 117, 5196–5203, https://doi.org/10.1073/pnas.1919723117, 2020.
Fuzzi, S., Baltensperger, U., Carslaw, K., Decesari, S., Denier van der Gon, H., Facchini, M. C., Fowler, D., Koren, I., Langford, B., Lohmann, U., Nemitz, E., Pandis, S., Riipinen, I., Rudich, Y., Schaap, M., Slowik, J. G., Spracklen, D. V., Vignati, E., Wild, M., Williams, M., and Gilardoni, S.: Particulate matter, air quality and climate: lessons learned and future needs, Atmos. Chem. Phys., 15, 8217–8299, https://doi.org/10.5194/acp-15-8217-2015, 2015.
Garg, S., Chandra, B. P., Sinha, V., Sarda-Esteve, R., Gros, V., and Sinha, B.: Limitation of the use of the Absorption Angstrom Exponent for source apportionment of equivalent black carbon: A case study from the North West Indo-Gangetic Plain, Environ. Sci. Technol., 50, 814–824, https://doi.org/10.1021/acs.est.5b03868, 2016.
Gustafsson, O. and Ramanathan, V.: Convergence on climate warming by black carbon aerosols, P. Natl. Acad. Sci. USA, 113, 4243–4245, https://doi.org/10.1073/pnas.1603570113, 2016.
Han, W. G., Liu, T., Himo, F., Toutchkine, A., Bashford, D., Hahn, K. M., and Noodleman, L.: A theoretical study of the UV/Visible absorption and emission solvatochromic properties of solvent-sensitive dyes, Chem. Phys. Chem., 4, 1084–1094, https://doi.org/10.1002/cphc.200300801, 2003.
Hansen, A. D. A., Rosen, H., and Novakov, T.: The aethalometer — an instrument for the real-time measurement of optical absorption by aerosol particles. Sci. Total Environ., 36, 191–196, https://doi.org/10.1016/0048-9697(84)90265-1, 1984.
Herich, H., Hueglin, C., and Buchmann, B.: A 2.5 year's source apportionment study of black carbon from wood burning and fossil fuel combustion at urban and rural sites in Switzerland, Atmos. Meas. Tech., 4, 1409–1420, https://doi.org/10.5194/amt-4-1409-2011, 2011.
Herráez, J. V. and Belda, R.: Refractive indices, densities and excess molar volumes of monoalcohols + water, J. Solut. Chem., 35, 1315–1328, https://doi.org/10.1007/s10953-006-9059-4, 2006.
IPCC: Climate Change 2013: The physical science basis, Contribution of working group I to the fifth assessment report of the Intergovernmental Panel on Climate Change, edited by: Stocker, T. F., Qin, D., Plattner, G.-K., Tignor, M., Allen, S. K., Boschung, J., Nauels, A., Xia, Y., Bex, V., and Midgley, P. M., Cambridge University Press, Cambridge, United Kingdom and New York, NY, USA, 1535 pp., 2013.
Kasthuriarachchi, N. Y., Rivellini, L.-H., Adam, M. G., and Lee, A. K. Y.: Light absorbing properties of primary and secondary brown carbon in a tropical urban environment, Environ. Sci. Technol., 54, 10808–10819, https://doi.org/10.1021/acs.est.0c02414, 2020.
Kirchstetter, T. W., Novakov, T., and Hobbs, P. V.: Evidence that the spectral dependence of light absorption by aerosols is affected by organic carbon, J. Geophys. Res.-Atmos., 109, D21208, https://doi.org/10.1029/2004jd004999, 2004.
Kirchstetter, T. W. and Thatcher, T. L.: Contribution of organic carbon to wood smoke particulate matter absorption of solar radiation, Atmos. Chem. Phys., 12, 6067–6072, https://doi.org/10.5194/acp-12-6067-2012, 2012.
Kumar, N. K., Corbin, J. C., Bruns, E. A., Massabó, D., Slowik, J. G., Drinovec, L., Močnik, G., Prati, P., Vlachou, A., Baltensperger, U., Gysel, M., El-Haddad, I., and Prévôt, A. S. H.: Production of particulate brown carbon during atmospheric aging of residential wood-burning emissions, Atmos. Chem. Phys., 18, 17843–17861, https://doi.org/10.5194/acp-18-17843-2018, 2018.
Lack, D. A. and Cappa, C. D.: Impact of brown and clear carbon on light absorption enhancement, single scatter albedo and absorption wavelength dependence of black carbon, Atmos. Chem. Phys., 10, 4207–4220, https://doi.org/10.5194/acp-10-4207-2010, 2010.
Lack, D. A., Langridge, J. M., Bahreini, R., Cappa, C. D., Middlebrook, A. M., and Schwarz, J. P.: Brown carbon and internal mixing in biomass burning particles, P. Natl. Acad. Sci. USA, 109, 14802–14807, https://doi.org/10.1073/pnas.1206575109, 2012.
Laskin, A., Laskin, J., and Nizkorodov, S. A.: Chemistry of atmospheric brown carbon, Chem. Rev., 115, 4335–4382, https://doi.org/10.1021/cr5006167, 2015.
Levinson, R., Akbari, H., and Berdahl, P.: Measuring solar reflectance-Part I: Defining a metric that accurately predicts solar heat gain, Sol. Energy, 84, 1717–1744, https://doi.org/10.1016/j.solener.2010.04.018, 2010.
Li, M., Fan, X., Zhu, M., Zou, C., Song, J., Wei, S., Jia, W., and Peng, P.: Abundance and light absorption properties of brown carbon emitted from residential coal combustion in China, Environ. Sci. Technol., 53, 595–603, https://doi.org/10.1021/acs.est.8b05630, 2019.
Li, X., Xiao, M., Xu, X., Zhou, J., Yang, K., Wang, Z., Zhang, W., Hopke, P. K., and Zhao, W.: Light absorption properties of organic aerosol from wood pyrolysis: Measurement method comparison and radiative implications, Environ. Sci. Technol., 54, 7156–7164, https://doi.org/10.1021/acs.est.0c01475, 2020.
Lin, P., Aiona, P. K., Li, Y., Shiraiwa, M., Laskin, J., Nizkorodov, S. A., and Laskin, A.: Molecular characterization of brown carbon in biomass burning aerosol particles, Environ. Sci. Technol., 50, 11815–11824, https://doi.org/10.1021/acs.est.6b03024, 2016.
Lin, P., Bluvshtein, N., Rudich, Y., Nizkorodov, S. A., Laskin, J., and Laskin, A.: Molecular chemistry of atmospheric brown carbon inferred from a nationwide biomass burning event, Environ. Sci. Technol., 51, 11561–11570, https://doi.org/10.1021/acs.est.7b02276, 2017.
Liu, C., Chung, C. E., Yin, Y., and Schnaiter, M.: The absorption Ångström exponent of black carbon: from numerical aspects, Atmos. Chem. Phys., 18, 6259–6273, https://doi.org/10.5194/acp-18-6259-2018, 2018.
Liu, D., Allan, J. D., Young, D. E., Coe, H., Beddows, D., Fleming, Z. L., Flynn, M. J., Gallagher, M. W., Harrison, R. M., Lee, J., Prevot, A. S. H., Taylor, J. W., Yin, J., Williams, P. I., and Zotter, P.: Size distribution, mixing state and source apportionment of black carbon aerosol in London during wintertime, Atmos. Chem. Phys., 14, 10061–10084, https://doi.org/10.5194/acp-14-10061-2014, 2014a.
Liu, D., Whitehead, J., Alfarra, M. R., Reyes-Villegas, E., Spracklen, D. V., Reddington, C. L., Kong, S., Williams, P. I., Ting, Y.-C., Haslett, S., Taylor, J. W., Flynn, M. J., Morgan, W. T., McFiggans, G., Coe, H., and Allan, J. D.: Black-carbon absorption enhancement in the atmosphere determined by particle mixing state, Nat. Geosci., 10, 184–188, https://doi.org/10.1038/ngeo2901, 2017.
Liu, F., Yon, J., Fuentes, A., Lobo, P., Smallwood, G. J., and Corbin, J. C.: Review of recent literature on the light absorption properties of black carbon: Refractive index, mass absorption cross section, and absorption function, Aerosol Sci. Tech., 54, 33–51, https://doi.org/10.1080/02786826.2019.1676878, 2019.
Liu, H., Pan, X., Liu, D., Liu, X., Chen, X., Tian, Y., Sun, Y., Fu, P., and Wang, Z.: Mixing characteristics of refractory black carbon aerosols at an urban site in Beijing, Atmos. Chem. Phys., 20, 5771–5785, https://doi.org/10.5194/acp-20-5771-2020, 2020.
Liu, J., Bergin, M., Guo, H., King, L., Kotra, N., Edgerton, E., and Weber, R. J.: Size-resolved measurements of brown carbon in water and methanol extracts and estimates of their contribution to ambient fine-particle light absorption, Atmos. Chem. Phys., 13, 12389–12404, https://doi.org/10.5194/acp-13-12389-2013, 2013.
Liu, J., Scheuer, E., Dibb, J., Ziemba, L. D., Thornhill, K. L., Anderson, B. E., Wisthaler, A., Mikoviny, T., Devi, J. J., Bergin, M., and Weber, R. J.: Brown carbon in the continental troposphere, Geophys. Res. Lett., 41, 2191–2195, https://doi.org/10.1002/2013gl058976, 2014.
Liu, L. and Mishchenko, M.: Scattering and radiative properties of morphologically complex carbonaceous aerosols: A systematic modeling study, Remote Sens., 10, p. 1634, https://doi.org/10.3390/rs10101634, 2018.
Liu, P. F., Abdelmalki, N., Hung, H.-M., Wang, Y., Brune, W. H., and Martin, S. T.: Ultraviolet and visible complex refractive indices of secondary organic material produced by photooxidation of the aromatic compounds toluene and m-xylene, Atmos. Chem. Phys., 15, 1435–1446, https://doi.org/10.5194/acp-15-1435-2015, 2015a.
Liu, S., Aiken, A. C., Gorkowski, K., Dubey, M. K., Cappa, C. D., Williams, L. R., Herndon, S. C., Massoli, P., Fortner, E. C., Chhabra, P. S., Brooks, W. A., Onasch, T. B., Jayne, J. T., Worsnop, D. R., China, S., Sharma, N., Mazzoleni, C., Xu, L., Ng, N. L., Liu, D., Allan, J. D., Lee, J. D., Fleming, Z. L., Mohr, C., Zotter, P., Szidat, S., and Prevot, A. S. H.: Enhanced light absorption by mixed source black and brown carbon particles in UK winter, Nat. Commun., 6, 8435, https://doi.org/10.1038/ncomms9435, 2015b.
Lu, Z., Streets, D. G., Winijkul, E., Yan, F., Chen, Y., Bond, T. C., Feng, Y., Dubey, M. K., Liu, S., Pinto, J. P., and Carmichael, G. R.: Light absorption properties and radiative effects of primary organic aerosol emissions, Environ. Sci. Technol., 49, 4868–4877, https://doi.org/10.1021/acs.est.5b00211, 2015.
Luo, J., Zhang, Y., Wang, F., and Zhang, Q.: Effects of brown coatings on the absorption enhancement of black carbon: a numerical investigation, Atmos. Chem. Phys., 18, 16897–16914, https://doi.org/10.5194/acp-18-16897-2018, 2018.
Martinsson, J., Eriksson, A. C., Nielsen, I. E., Malmborg, V. B., Ahlberg, E., Andersen, C., Lindgren, R., Nystrom, R., Nordin, E. Z., Brune, W. H., Svenningsson, B., Swietlicki, E., Boman, C., and Pagels, J. H.: Impacts of combustion conditions and photochemical processing on the light absorption of biomass combustion aerosol, Environ. Sci. Technol., 49, 14663–14671, https://doi.org/10.1021/acs.est.5b03205, 2015.
Martinsson, J., Abdul Azeem, H., Sporre, M. K., Bergström, R., Ahlberg, E., Öström, E., Kristensson, A., Swietlicki, E., and Eriksson Stenström, K.: Carbonaceous aerosol source apportionment using the Aethalometer model – evaluation by radiocarbon and levoglucosan analysis at a rural background site in southern Sweden, Atmos. Chem. Phys., 17, 4265–4281, https://doi.org/10.5194/acp-17-4265-2017, 2017.
Massabò, D., Bernardoni, V., Bove, M. C., Brunengo, A., Cuccia, E., Piazzalunga, A., Prati, P., Valli, G., and Vecchi, R.: A multi-wavelength optical set-up for the characterization of carbonaceous particulate matter, J. Aerosol Sci., 60, 34–46, https://doi.org/10.1016/j.jaerosci.2013.02.006, 2013.
McKay, G., Korak, J. A., Erickson, P. R., Latch, D. E., McNeill, K., and Rosario-Ortiz, F. L.: The case against charge transfer interactions in dissolved organic matter photophysics, Environ. Sci. Technol., 52, 406–414, https://doi.org/10.1021/acs.est.7b03589, 2018.
Mo, Y., Li, J., Liu, J., Zhong, G., Cheng, Z., Tian, C., Chen, Y., and Zhang, G.: The influence of solvent and pH on determination of the light absorption properties of water-soluble brown carbon, Atmos. Environ., 161, 90–98, https://doi.org/10.1016/j.atmosenv.2017.04.037, 2017.
Moffet, R. C., Henn, T., Laskin, A., and Gilles, M. K.: Automated chemical analysis of internally mixed aerosol particles using x-ray spectromicroscopy at the carbon K-edge, Anal. Chem., 82, 7906–7914, https://doi.org/10.1021/Ac1012909, 2010.
Mohr, C., Lopez-Hilfiker, F. D., Zotter, P., Prevot, A. S., Xu, L., Ng, N. L., Herndon, S. C., Williams, L. R., Franklin, J. P., Zahniser, M. S., Worsnop, D. R., Knighton, W. B., Aiken, A. C., Gorkowski, K. J., Dubey, M. K., Allan, J. D., and Thornton, J. A.: Contribution of nitrated phenols to wood burning brown carbon light absorption in Detling, United Kingdom during winter time, Environ. Sci. Technol., 47, 6316–6324, https://doi.org/10.1021/es400683v, 2013.
Moise, T., Flores, J. M., and Rudich, Y.: Optical properties of secondary organic aerosols and their changes by chemical processes, Chem. Rev., 115, 4400–4439, https://doi.org/10.1021/cr5005259, 2015.
Moosmüller, H., Chakrabarty, R. K., and Arnott, W. P.: Aerosol light absorption and its measurement: A review, J. Quant. Spectrosc. Ra., 110, 844–878, https://doi.org/10.1016/j.jqsrt.2009.02.035, 2009.
Moschos, V. and El Haddad, I.: Dataset for “Source-specific light absorption by carbonaceous components in the complex aerosol matrix from yearly filter-based measurements” [data set], https://doi.org/10.5281/zenodo.5055757, last access: 24 July 2021.
Moschos, V., Kumar, N. K., Daellenbach, K. R., Baltensperger, U., Prévôt, A. S. H., and El Haddad, I.: Source apportionment of brown carbon absorption by coupling ultraviolet–visible spectroscopy with aerosol mass spectrometry, Environ. Sci. Tech. Lett., 5, 302–308, https://doi.org/10.1021/acs.estlett.8b00118, 2018.
Müller, T., Henzing, J. S., de Leeuw, G., Wiedensohler, A., Alastuey, A., Angelov, H., Bizjak, M., Collaud Coen, M., Engström, J. E., Gruening, C., Hillamo, R., Hoffer, A., Imre, K., Ivanow, P., Jennings, G., Sun, J. Y., Kalivitis, N., Karlsson, H., Komppula, M., Laj, P., Li, S.-M., Lunder, C., Marinoni, A., Martins dos Santos, S., Moerman, M., Nowak, A., Ogren, J. A., Petzold, A., Pichon, J. M., Rodriquez, S., Sharma, S., Sheridan, P. J., Teinilä, K., Tuch, T., Viana, M., Virkkula, A., Weingartner, E., Wilhelm, R., and Wang, Y. Q.: Characterization and intercomparison of aerosol absorption photometers: result of two intercomparison workshops, Atmos. Meas. Tech., 4, 245–268, https://doi.org/10.5194/amt-4-245-2011, 2011.
Nakayama, T., Sato, K., Matsumi, Y., Imamura, T., Yamazaki, A., and Uchiyama, A.: Wavelength and NOx dependent complex refractive index of SOAs generated from the photooxidation of toluene, Atmos. Chem. Phys., 13, 531–545, https://doi.org/10.5194/acp-13-531-2013, 2013.
Petzold, A., Ogren, J. A., Fiebig, M., Laj, P., Li, S.-M., Baltensperger, U., Holzer-Popp, T., Kinne, S., Pappalardo, G., Sugimoto, N., Wehrli, C., Wiedensohler, A., and Zhang, X.-Y.: Recommendations for reporting “black carbon” measurements, Atmos. Chem. Phys., 13, 8365–8379, https://doi.org/10.5194/acp-13-8365-2013, 2013.
Pokhrel, R. P., Beamesderfer, E. R., Wagner, N. L., Langridge, J. M., Lack, D. A., Jayarathne, T., Stone, E. A., Stockwell, C. E., Yokelson, R. J., and Murphy, S. M.: Relative importance of black carbon, brown carbon, and absorption enhancement from clear coatings in biomass burning emissions, Atmos. Chem. Phys., 17, 5063–5078, https://doi.org/10.5194/acp-17-5063-2017, 2017.
Pöschl, U.: Atmospheric aerosols: Composition, transformation, climate and health effects, Angew. Chem. Int. Edit., 44, 7520–7540, 2005.
Ramanathan, V. and Carmichael, G.: Global and regional climate changes due to black carbon, Nat. Geosci., 1, 221–227, 2008.
Ramanathan, V. and Feng, Y.: Air pollution, greenhouse gases and climate change: Global and regional perspectives, Atmos. Environ., 43, 37–50, https://doi.org/10.1016/j.atmosenv.2008.09.063, 2009.
Reichardt, C.: Solvents and solvent effects in organic chemistry, 3 Edn., Wiley-VCH Verlag GmbH & Co. KGaA, 329–388, 2003.
Saleh, R.: From measurements to models: Toward accurate representation of brown carbon in climate calculations, Curr. Pollut. Rep., 6, 90–104, https://doi.org/10.1007/s40726-020-00139-3, 2020.
Saleh, R., Hennigan, C. J., McMeeking, G. R., Chuang, W. K., Robinson, E. S., Coe, H., Donahue, N. M., and Robinson, A. L.: Absorptivity of brown carbon in fresh and photo-chemically aged biomass-burning emissions, Atmos. Chem. Phys., 13, 7683–7693, https://doi.org/10.5194/acp-13-7683-2013, 2013.
Saleh, R., Robinson, E. S., Tkacik, D. S., Ahern, A. T., Liu, S., Aiken, A. C., Sullivan, R. C., Presto, A. A., Dubey, M. K., Yokelson, R. J., Donahue, N. M., and Robinson, A. L.: Brownness of organics in aerosols from biomass burning linked to their black carbon content, Nat. Geosci., 7, 647–650, https://doi.org/10.1038/ngeo2220, 2014.
Saleh, R., Marks, M., Heo, J., Adams, P. J., Donahue, N. M., and Robinson, A. L.: Contribution of brown carbon and lensing to the direct radiative effect of carbonaceous aerosols from biomass and biofuel burning emissions, J. Geophys. Res.-Atmos., 120, 10285–10296, https://doi.org/10.1002/2015jd023697, 2015.
Samset, B. H., Stjern, C. W., Andrews, E., Kahn, R. A., Myhre, G., Schulz, M., and Schuster, G. L.: Aerosol absorption: Progress towards global and regional constraints, Curr. Clim. Change Rep., 4, 65–83, https://doi.org/10.1007/s40641-018-0091-4, 2018.
Sandradewi, J., Prévôt, A. S., Szidat, S., Perron, N., Alfarra, M. R., Lanz, V. A., Weingartner, E., and Baltensperger, U.: Using aerosol light absorption measurements for the quantitative determination of wood burning and traffic emission contributions to particulate matter, Environ. Sci. Technol., 42, 3316–3323, 2008.
Schwarz, J. P., Gao, R. S., Spackman, J. R., Watts, L. A., Thomson, D. S., Fahey, D. W., Ryerson, T. B., Peischl, J., Holloway, J. S., Trainer, M., Frost, G. J., Baynard, T., Lack, D. A., de Gouw, J. A., Warneke, C., and Del Negro, L. A.: Measurement of the mixing state, mass, and optical size of individual black carbon particles in urban and biomass burning emissions, Geophys. Res. Lett., 35, L13810, https://doi.org/10.1029/2008gl033968, 2008.
Shamjad, P. M., Satish, R. V., Thamban, N. M., Rastogi, N., and Tripathi, S. N.: Absorbing refractive index and direct radiative forcing of atmospheric brown carbon over Gangetic Plain, ACS Earth Space Chem., 2, 31–37, https://doi.org/10.1021/acsearthspacechem.7b00074, 2017.
Shetty, N. J., Pandey, A., Baker, S., Hao, W. M., and Chakrabarty, R. K.: Measuring light absorption by freshly emitted organic aerosols: optical artifacts in traditional solvent-extraction-based methods, Atmos. Chem. Phys., 19, 8817–8830, https://doi.org/10.5194/acp-19-8817-2019, 2019.
Sumlin, B. J., Oxford, C. R., Seo, B., Pattison, R. R., Williams, B. J., and Chakrabarty, R. K.: Density and homogeneous internal composition of primary brown carbon aerosol, Environ. Sci. Technol., 52, 3982–3989, https://doi.org/10.1021/acs.est.8b00093, 2018.
Sun, H. L., Biedermann, L., and Bond, T. C.: Color of brown carbon: A model for ultraviolet and visible light absorption by organic carbon aerosol, Geophys. Res. Lett., 34, L17813, https://doi.org/10.1029/2007gl029797, 2007.
Trofimova, A., Hems, R. F., Liu, T., Abbatt, J. P. D., and Schnitzler, E. G.: Contribution of charge-transfer complexes to absorptivity of primary brown carbon aerosol, ACS Earth Space Chem., 3, 1393–1401, https://doi.org/10.1021/acsearthspacechem.9b00116, 2019.
Vlachou, A., Daellenbach, K. R., Bozzetti, C., Chazeau, B., Salazar, G. A., Szidat, S., Jaffrezo, J.-L., Hueglin, C., Baltensperger, U., Haddad, I. E., and Prévôt, A. S. H.: Advanced source apportionment of carbonaceous aerosols by coupling offline AMS and radiocarbon size-segregated measurements over a nearly 2-year period, Atmos. Chem. Phys., 18, 6187–6206, https://doi.org/10.5194/acp-18-6187-2018, 2018.
Wang, X., Heald, C. L., Ridley, D. A., Schwarz, J. P., Spackman, J. R., Perring, A. E., Coe, H., Liu, D., and Clarke, A. D.: Exploiting simultaneous observational constraints on mass and absorption to estimate the global direct radiative forcing of black carbon and brown carbon, Atmos. Chem. Phys., 14, 10989–11010, https://doi.org/10.5194/acp-14-10989-2014, 2014.
Washenfelder, R. A., Attwood, A. R., Brock, C. A., Guo, H., Xu, L., Weber, R. J., Ng, N. L., Allen, H. M., Ayres, B. R., Baumann, K., Cohen, R. C., Draper, D. C., Duffey, K. C., Edgerton, E., Fry, J. L., Hu, W. W., Jimenez, J. L., Palm, B. B., Romer, P., Stone, E. A., Wooldridge, P. J., and Brown, S. S.: Biomass burning dominates brown carbon absorption in the rural southeastern United States, Geophys. Res. Lett., 42, 653–664, https://doi.org/10.1002/2014gl062444, 2015.
Weingartner, E., Saathoff, H., Schnaiter, M., Streit, N., Bitnar, B., and Baltensperger, U.: Absorption of light by soot particles: Determination of the absorption coefficient by means of aethalometers, J. Aerosol Sci., 34, 1445–1463, https://doi.org/10.1016/s0021-8502(03)00359-8, 2003.
Wu, Y., Cheng, T., Liu, D., Allan, J. D., Zheng, L., and Chen, H.: Light absorption enhancement of black carbon aerosol constrained by particle morphology, Environ. Sci. Technol., 52, 6912–6919, https://doi.org/10.1021/acs.est.8b00636, 2018.
Wu, Y., Cheng, T., and Zheng, L.: Light absorption of black carbon aerosols strongly influenced by particle morphology distribution, Environ. Res. Lett., 15, 094051, https://doi.org/10.1088/1748-9326/aba2ff, 2020.
Xie, M., Hays, M. D., and Holder, A. L.: Light-absorbing organic carbon from prescribed and laboratory biomass burning and gasoline vehicle emissions, Sci. Rep., 7, 7318, https://doi.org/10.1038/s41598-017-06981-8, 2017.
Yan, F., Kang, S., Sillanpaa, M., Hu, Z., Gao, S., Chen, P., Gautam, S., Reinikainen, S. P., and Li, C.: A new method for extraction of methanol-soluble brown carbon: Implications for investigation of its light absorption ability, Environ. Pollut., 262, 114300, https://doi.org/10.1016/j.envpol.2020.114300, 2020.
Yuan, J., Modini, R. L., Zanatta, M., Herber, A. B., Müller, T., Wehner, B., Poulain, L., Tuch, T., Baltensperger, U., and Gysel-Beer, M.: Variability in the mass absorption cross section of black carbon (BC) aerosols is driven by BC internal mixing state at a central European background site (Melpitz, Germany) in winter, Atmos. Chem. Phys., 21, 635–655, https://doi.org/10.5194/acp-21-635-2021, 2021.
Zanatta, M., Gysel, M., Bukowiecki, N., Müller, T., Weingartner, E., Areskoug, H., Fiebig, M., Yttri, K. E., Mihalopoulos, N., Kouvarakis, G., Beddows, D., Harrison, R. M., Cavalli, F., Putaud, J. P., Spindler, G., Wiedensohler, A., Alastuey, A., Pandolfi, M., Sellegri, K., Swietlicki, E., Jaffrezo, J. L., Baltensperger, U., and Laj, P.: A European aerosol phenomenology-5: Climatology of black carbon optical properties at 9 regional background sites across Europe, Atmos. Environ., 145, 346–364, https://doi.org/10.1016/j.atmosenv.2016.09.035, 2016.
Zanatta, M., Laj, P., Gysel, M., Baltensperger, U., Vratolis, S., Eleftheriadis, K., Kondo, Y., Dubuisson, P., Winiarek, V., Kazadzis, S., Tunved, P., and Jacobi, H.-W.: Effects of mixing state on optical and radiative properties of black carbon in the European Arctic, Atmos. Chem. Phys., 18, 14037–14057, https://doi.org/10.5194/acp-18-14037-2018, 2018.
Zeng, L., Zhang, A., Wang, Y., Wagner, N. L., Katich, J. M., Schwarz, J. P., Schill, G. P., Brock, C., Froyd, K. D., Murphy, D. M., Williamson, C. J., Kupc, A., Scheuer, E., Dibb, J., and Weber, R. J.: Global measurements of brown carbon and estimated direct radiative effects, Geophys. Res. Lett., 47, e2020GL088747, https://doi.org/10.1029/2020GL088747, 2020.
Zhang, Y. L., Perron, N., Ciobanu, V. G., Zotter, P., Minguillón, M. C., Wacker, L., Prévôt, A. S. H., Baltensperger, U., and Szidat, S.: On the isolation of OC and EC and the optimal strategy of radiocarbon-based source apportionment of carbonaceous aerosols, Atmos. Chem. Phys., 12, 10841–10856, https://doi.org/10.5194/acp-12-10841-2012, 2012.
Zhang, X., Lin, Y. H., Surratt, J. D., and Weber, R. J.: Sources, composition and absorption Ångström exponent of light-absorbing organic components in aerosol extracts from the Los Angeles Basin, Environ. Sci. Technol., 47, 3685–3693, https://doi.org/10.1021/es305047b, 2013.
Zhang, Y., Forrister, H., Liu, J., Dibb, J., Anderson, B., Schwarz, J. P., Perring, A. E., Jimenez, J. L., Campuzano-Jost, P., Wang, Y., Nenes, A., and Weber, R. J.: Top-of-atmosphere radiative forcing affected by brown carbon in the upper troposphere, Nat. Geosci., 10, 486–489, https://doi.org/10.1038/ngeo2960, 2017.
Zhang, Y., Albinet, A., Petit, J. E., Jacob, V., Chevrier, F., Gille, G., Pontet, S., Chretien, E., Dominik-Segue, M., Levigoureux, G., Mocnik, G., Gros, V., Jaffrezo, J. L., and Favez, O.: Substantial brown carbon emissions from wintertime residential wood burning over France, Sci. Total Environ., 743, 140752, https://doi.org/10.1016/j.scitotenv.2020.140752, 2020.
Zhao, R., Lee, A. K. Y., Huang, L., Li, X., Yang, F., and Abbatt, J. P. D.: Photochemical processing of aqueous atmospheric brown carbon, Atmos. Chem. Phys., 15, 6087–6100, https://doi.org/10.5194/acp-15-6087-2015, 2015.
Zhong, M. and Jang, M.: Dynamic light absorption of biomass-burning organic carbon photochemically aged under natural sunlight, Atmos. Chem. Phys., 14, 1517–1525, https://doi.org/10.5194/acp-14-1517-2014, 2014.
Zotter, P., Herich, H., Gysel, M., El-Haddad, I., Zhang, Y., Močnik, G., Hüglin, C., Baltensperger, U., Szidat, S., and Prévôt, A. S. H.: Evaluation of the absorption Ångström exponents for traffic and wood burning in the Aethalometer-based source apportionment using radiocarbon measurements of ambient aerosol, Atmos. Chem. Phys., 17, 4229–4249, https://doi.org/10.5194/acp-17-4229-2017, 2017.
- Abstract
- Introduction
- Materials and methods
- Results and discussion
- Summary and implications
- Appendix A: AE33 calibration coefficients
- Appendix B: MAC MAE at 370 nm
- Appendix C: Contribution of different fractions to total absorption and related uncertainties
- Appendix D: Optical significance of different absorbing fractions in the atmosphere
- Appendix E: Abbreviations
- Appendix F: Glossary
- Data availability
- Author contributions
- Competing interests
- Disclaimer
- Acknowledgements
- Financial support
- Review statement
- References
- Supplement