the Creative Commons Attribution 4.0 License.
the Creative Commons Attribution 4.0 License.
 | 30 Aug 2021
Impact of Athabasca oil sands operations on mercury levels in air and deposition
Ashu Dastoor
Andrei Ryjkov
Gregor Kos
Junhua Zhang
Jane Kirk
Matthew Parsons
Alexandra Steffen
Oil sands upgrading facilities in the Athabasca oil sands region (AOSR) in Alberta, Canada, have been reporting mercury (Hg) emissions to public government databases (National Pollutant Release Inventory (NPRI)) since the year 2000, yet the relative contribution of these emissions to ambient Hg deposition remains unknown. The impact of oil sands emissions (OSE) on Hg levels in and around the AOSR, relative to contributions from global (anthropogenic, geogenic and legacy) emissions and regional biomass burning emissions (BBE), was assessed using a global 3D-process-based Hg model, GEM-MACH-Hg, from 2012 to 2015. In addition, the relative importance of year-to-year changes in Hg emissions from the above sources and meteorological conditions to inter-annual variations in Hg deposition was examined. Surface air concentrations of Hg species and annual snowpack Hg loadings simulated by the model were found comparable to measured levels in the AOSR, suggesting consistency between reported Hg emissions from oil sands activities and Hg levels in the region. As a result of global-scale transport and the long lifetime of gaseous elemental Hg (Hg(0)), surface air concentrations of Hg(0) in the AOSR reflected the background Hg(0) levels in Canada. By comparison, average air concentrations of total oxidized Hg (efficiently deposited Hg species) in the AOSR were elevated up to 60 % within 50 km of the oil sands Hg emission sources. Hg emissions from wildfire events led to episodes of high ambient Hg(0) concentrations and deposition enrichments in northern Alberta, including the AOSR, during the burning season. Hg deposition fluxes in the AOSR were within the range of the deposition fluxes measured for the entire province of Alberta. On a broad spatial scale, contribution from imported Hg from global sources dominated the annual background Hg deposition in the AOSR, with present-day global anthropogenic emissions contributing to 40 % (< 1 % from Canada excluding OSE) and geogenic and legacy emissions contributing to 60 % of the background Hg deposition. In contrast, oil sands Hg emissions were responsible for significant enhancements in Hg deposition in the immediate vicinity of oil sands Hg emission sources, which were ∼ 10 times larger in winter than summer (250 %–350 % in winter and ∼ 35 % in summer within 10 km of OSE, 2012–2013). The spatial extent of the influence of oil sands emissions on Hg deposition was also greater in winter relative to summer (∼ 100 km vs. 30 km from Hg-emitting facilities). In addition, inter-annual changes in meteorological conditions and oil sands emissions also led to significantly higher inter-annual variations in wintertime Hg deposition compared to summer. In 2015, within 10 km of major oil sands sources, relative to 2012, Hg deposition declined by 46 % in winter but 22 % annually, due to a larger OSE-led reduction in wintertime deposition. Inter-annual variations in meteorological conditions were found to both exacerbate and diminish the impacts of OSE on Hg deposition in the AOSR, which can confound the interpretation of trends in short-term environmental Hg monitoring data. Hg runoff in spring flood, comprising the majority of annual Hg runoff, is mainly derived from seasonal snowpack Hg loadings and mobilization of Hg deposited in surface soils, both of which are sensitive to Hg emissions from oil sands developments in the proximity of sources. Model results suggest that sustained efforts to reduce anthropogenic Hg emissions from both global and oil sands sources are required to reduce Hg deposition in the AOSR.
- Article
(12080 KB) - Full-text XML
- BibTeX
- EndNote


Mercury (Hg) is a toxic element that accumulates in fish and mammals near the top of the food web, including humans (e.g., through consumption of contaminated fish), where it exhibits long-term toxic effects (UNEP, 2018). Hg is emitted to the atmosphere from geogenic sources such as volcanoes and the weathering of Hg-containing rocks; anthropogenic sources such as fossil fuel burning, metal smelting and artisanal gold mining; and the re-emission of Hg historically deposited from anthropogenic and natural sources onto soils, surface waters and vegetation (UNEP, 2013). Atmospheric Hg exists mainly in three forms: gaseous elemental mercury (Hg(0) or GEM), gaseous oxidized mercury (gaseous Hg(II); GOM) and particle-bound mercury (particle-bound Hg(II); PBM). The sum of GOM and PBM is referred to as total oxidized mercury (TOM), and the sum of gaseous mercury species (i.e., GEM and GOM) is referred to as total gaseous mercury (TGM) in this study. GEM/TGM and TOM are better indicators to compare observation and model estimates of mercury for the purpose of this study, because of speciation uncertainties associated with the determination of GOM and PBM species (Gustin et al., 2013). Deposition of atmospheric Hg species by rain and snow (i.e., wet deposition) and by interfacial uptake on various surfaces such as soils, vegetation, water and snowpack (i.e., dry deposition) are the pathways that contribute to Hg loadings in ecosystems. Typically, atmospheric GEM concentrations are found to be 2–3 orders of magnitude higher (in the low ng m−3 range) than GOM and PBM (typically in the lower pg m−3 range) because GEM is the dominant atmospheric Hg species emitted to air, and the reactivity of the latter (GOM and PBM) leads to efficient dry and wet deposition removal of these species close to sources. Stability and volatility of GEM result in its long lifetime in the atmosphere, of 6 months to 1 year, allowing for transport and distribution on a global scale and re-emission from planetary surfaces (UNEP, 2013).
On a global scale, dry deposition of GEM by vegetation uptake over land and wet deposition of TOM produced by atmospheric oxidation of GEM are the dominant pathways of Hg removal (Obrist et al., 2016; Wright et al., 2016; Zhou et al., 2021). Primary emissions of GOM and PBM from industrial sources are an important contributor to dry and wet depositions of Hg on a local to regional scale. Once Hg is deposited to surfaces, it can be reduced and re-emitted back as GEM to the air, and, thus, Hg redistributes and accumulates in the aquatic and terrestrial environments globally. Hg also inhibits enzymatic processes and reacts with organic compounds. This leads to the formation of toxic, and bioaccumulating, methyl-Hg, primarily in aquatic systems, which is the principal cause of a severe neurological syndrome known as “Minamata disease”. In order to reduce the amount of Hg released to the environment and limit its exposure to humans, an international treaty, the Minamata Convention on Mercury, was adopted in 2017 (UN, 2017).
Anthropogenic emissions of Hg to air from global sources stand at an estimated 2220 t yr−1 in 2015 (UNEP, 2018). Canadian anthropogenic Hg emissions were estimated at about 4.3 t yr−1 (less than 0.2 % of global anthropogenic emissions) in 2015, with an estimated 58 % coming from point sources such as coal-fired power plants and smelters and 42 % from area sources (Zhang et al., 2018; see Fig. 1). Anthropogenic Hg emissions in Canada have declined by 85 % from 1990 to 2010 (from ∼ 35 to 5 t yr−1), with major reductions from sectors such as the non-ferrous metal mining and smelting (−98 %), chemical industries (−95 %), waste (−76 %), iron and steel industries (−54 %), and electric power generation (−30 %) (CMSA, 2016). However, due to the steady increase in development of the oil sands, the upstream petroleum sector has shown increases in Hg emissions and accounted for approximately 4.6 % of the total Canadian Hg emissions in 2010 (CMSA, 2016).
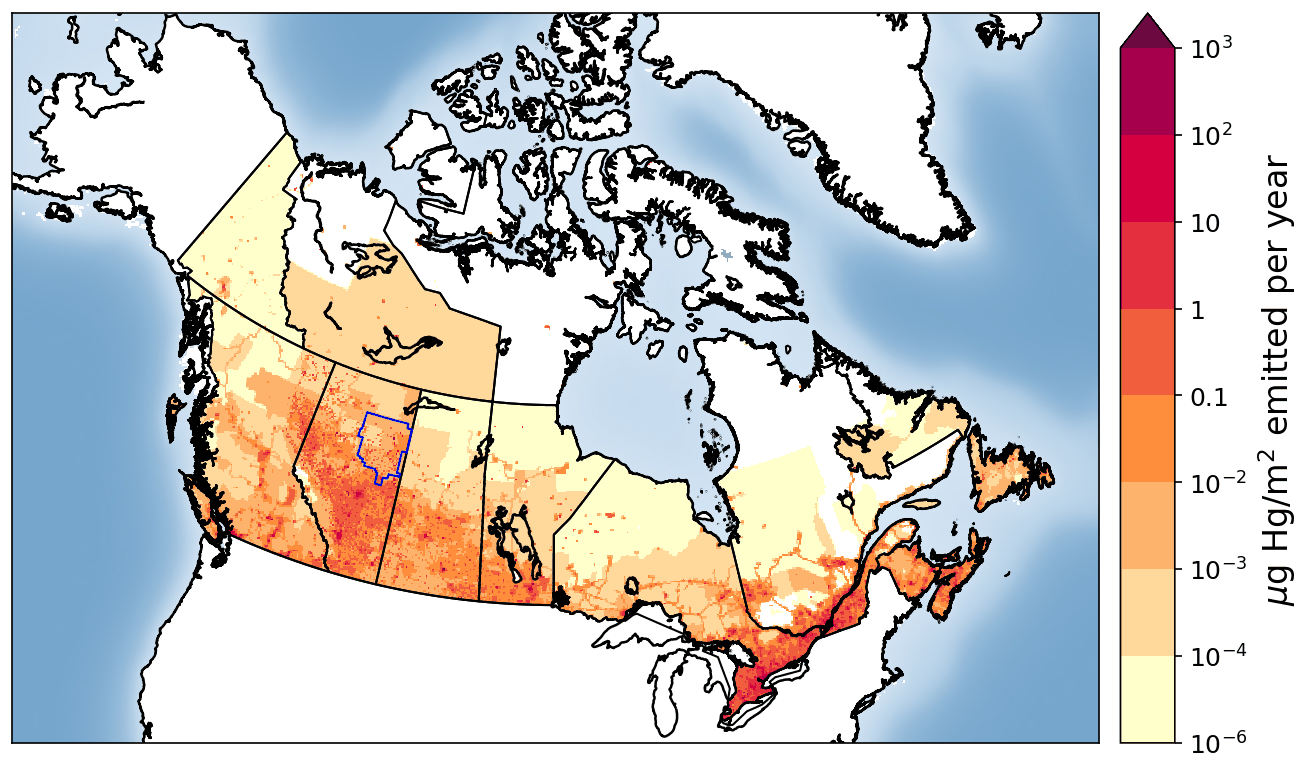
Figure 1Spatial distribution of anthropogenic Hg emissions in Canada in 2015 (∼ 4.3 t yr−1). The Athabasca oil sands region is indicated with an approximate rectangular blue shape within northeastern Alberta, bordering Saskatchewan.
The Athabasca oil sands region (AOSR) in the northeastern portion of the Canadian province of Alberta (see Fig. 1) is a zone of extensive natural resource development. The large natural deposits of bitumen, a heavy crude oil, contained in a mixture of water and clay (called “oil sands”) has led to establishment of large-scale mining and upgrading activities in the area north of Fort McMurray, Alberta (AB) (see map Fig. 2). Surface mining and in situ recovery methods are used to extract bitumen and then upgrade it to synthetic crude oil (Alexander and Chambers, 2016; Larter and Head, 2014). Point source emissions of organics and heavy metals, including Hg, originate from mining activities and upgrading facilities in the AOSR. The upgraders are operated by the companies Suncor, Syncrude and Canadian Natural Resources. The upgrading process also includes the removal of impurities consisting of sulfur and nitrogen-containing compounds by catalytic hydrotreatment, with volatile hydrogen sulfide and ammonia as by-products. Trace metals contained in the heavy asphaltene fraction are also removed by stabilization, rejection, or upgrading of asphaltenes (Jia, 2014). The yearly amounts of total Hg emissions from Athabasca oil sands facilities, for the years 2012 to 2015, were between 69 and 25 kg. These annual emissions exhibited an overall downward trend (for details see Table 1 and Fig. 3).
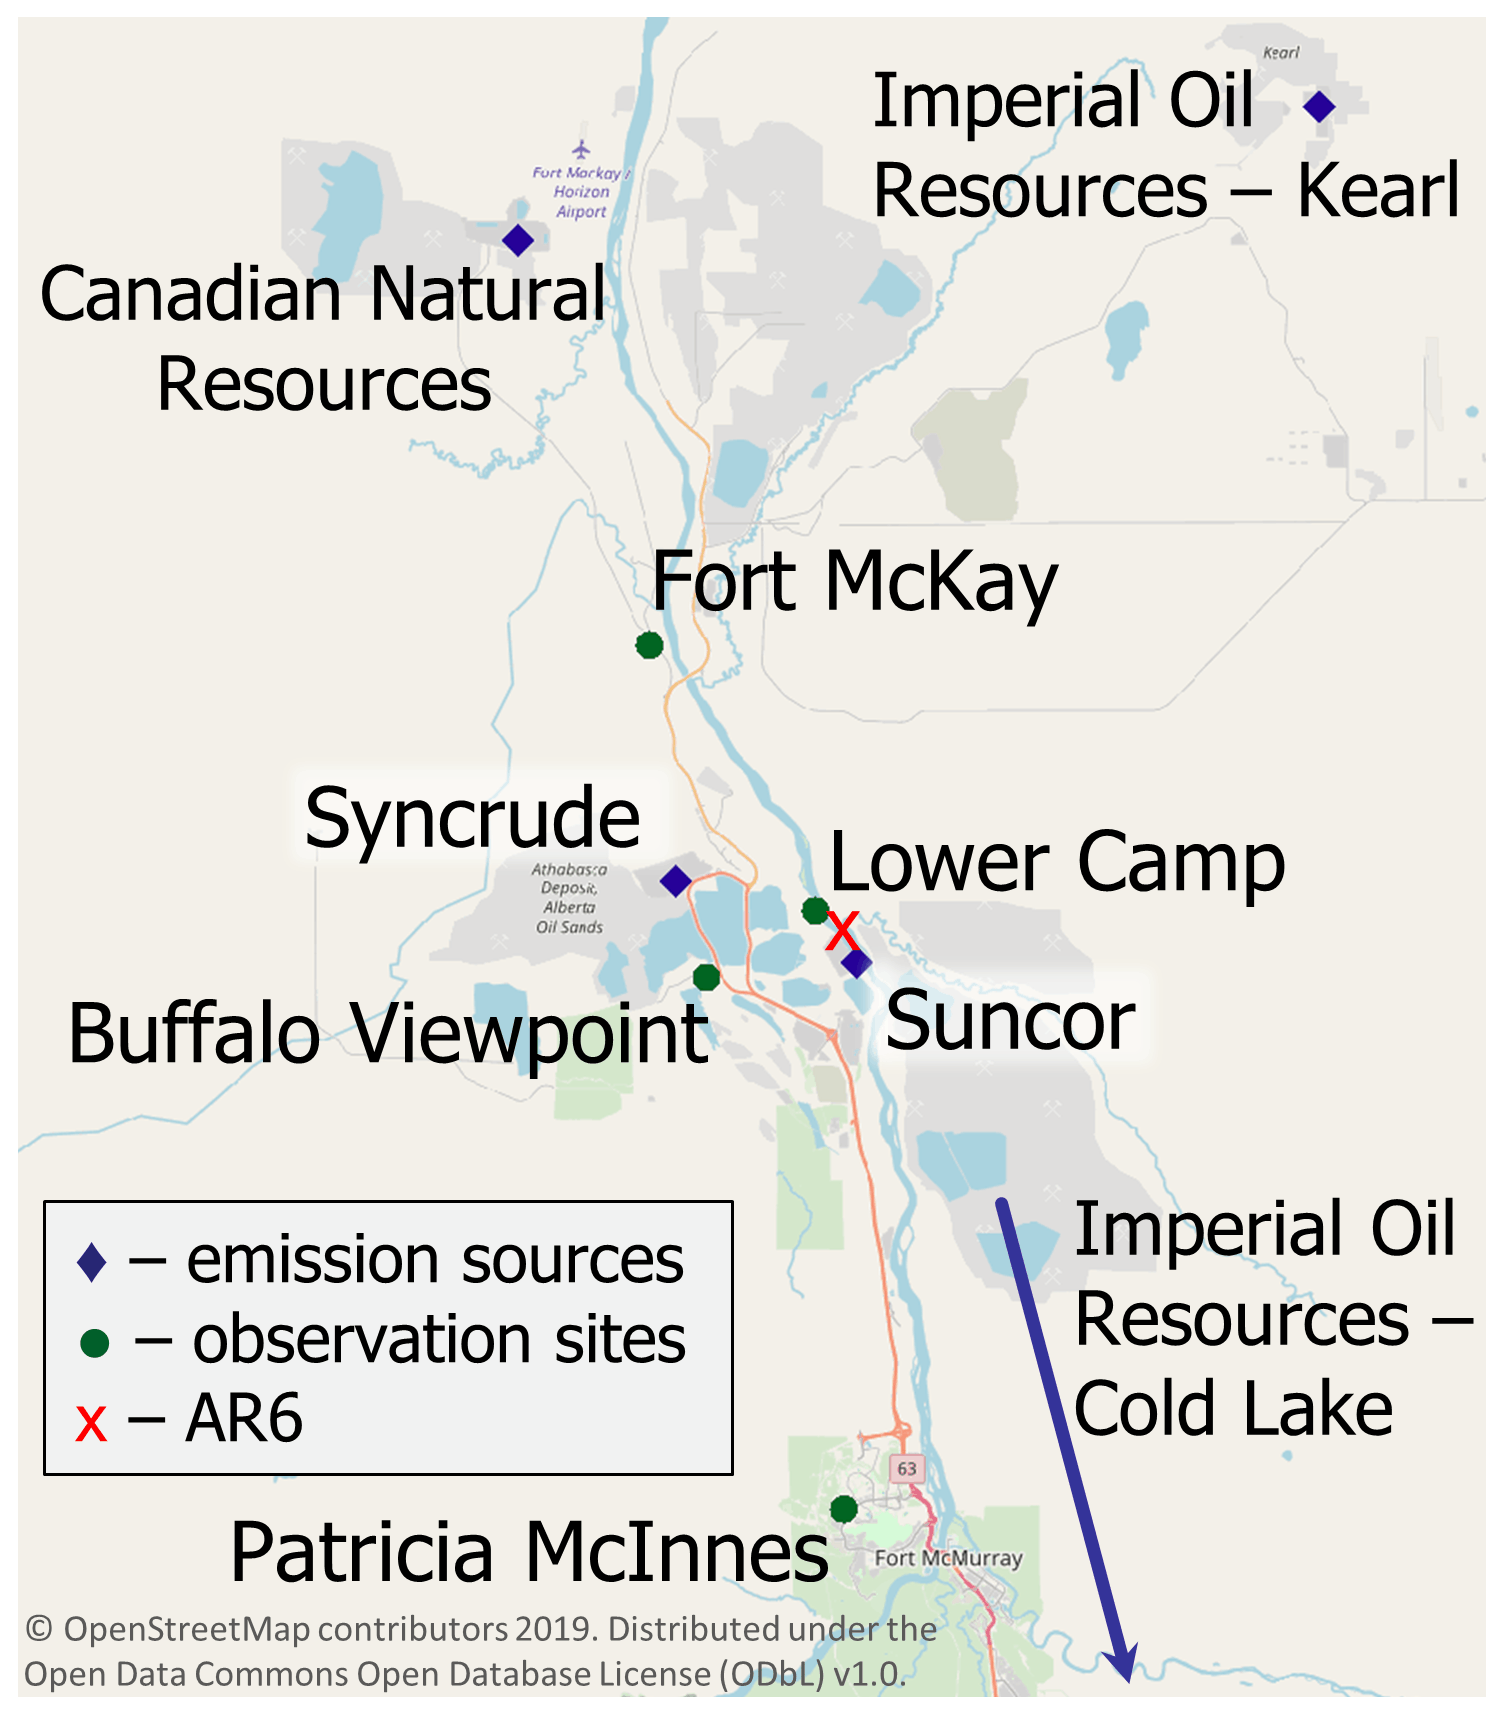
Figure 2Map of the AOSR with the main point sources for Hg emissions from oil sands developments and air observation sites. “AR6” marks the approximate midpoint of operations as defined by Kelly et al. (2010).
Kelly et al. (2010) reported increased concentrations of 13 different trace metals including Hg in the surface waters of the Athabasca River and its tributaries in the oil sands region. Observed concentrations were higher near oil sands operations than away from the potential sources. Comparison of upstream and downstream data showed consistently higher concentrations for downstream sites. A similar set of observations was made for Hg in surface snow samples, more specifically Hg bound to particulates. Concentrations in accumulated snow collected near oil sands developments in March averaged 861 ng m−2 compared to less than 100 ng m−2 for background measurements (Kelly et al., 2010). Several oil sands installations were identified as potential sources for the elevated observations of Hg, but no direct link between sources and observations was established. Specifically, upgraders were discussed as a source for high Hg levels in the region. Other potential sources included fly ash, road dust, land clearing and mining operations.
To address the lack of Hg monitoring and attribution of sources, as concluded by Kelly et al. (2010), several follow-up studies were conducted with the intention to establish a conclusive link between measured pollutant concentrations and potential sources in the AOSR (Kelly et al., 2010; Cooke et al., 2017; Kirk et al., 2014; Emmerton et al., 2018; Lynam et al., 2018; Willis et al., 2019, 2018; Gopalapillai et al., 2019). In addition to water and snow samples, other media have been investigated, such as air, biota and sediments. Cooke et al. (2017) studied lake sediment cores sampled from 20 lakes at various distances from oil sands operations, including two of them in the near vicinity (i.e., within 20 km) of the two major upgrading facilities (Suncor and Syncrude) within the region (or site AR6 as designated by Kelly et al., 2010) (Cooke et al., 2017). The cores provided trace metal data for approximately the past 100–250 years. The cores showed that Hg concentrations have increased by a factor of 3, reflecting the generally accepted scientific finding that global Hg has increased 3-fold as a result of anthropogenic activities since the industrial revolution. No additional increase in Hg concentrations was detected related to the beginning of oil sands operations in the late 1960s. This contrasts with Kelly et al. (2010) and the follow-up study by Kirk et al. (2014) that showed higher Hg loadings in the accumulated snowpack and surface water sampled closer to the mining and upgrading facilities in the AOSR in early spring (March), mostly consisting of PBM of atmospheric origin. While Hg levels were closely correlated with other trace metal concentrations originating from oil sands activities such as nickel and vanadium, no direct causal link with air emissions of Hg, as reported to the National Pollutant Release Inventory (NPRI), was established. Gopalapillai and coworkers recently reported temporal trends in snowpack loadings of total Hg (THg) and methyl mercury (MeHg) (and 44 other elements) (Gopalapillai et al., 2019). Using a composite of snowpack profile samples collected between 2011 and 2016 and data from previous campaigns, a decrease in THg loadings from an average of 510 ng m−3 in 2008 to 175 ng m−3 in 2016 was found within 8 km from AR6. However, due to the limited temporal coverage (with measurements for THg starting in 2008), the authors suggested a need for additional studies to understand the impact of Hg in the AOSR.
A recent study by Emmerton et al. (2018) examined lake water samples and related observed Hg and methyl-Hg concentrations to local geology, watershed conditions and oil sands activities, with the latter only contributing an estimated < 2 % of the overall Hg deposited (Emmerton et al., 2018). Long-range transport and biomass burning (i.e., forest fires) were suggested to be the major sources of Hg (Emmerton et al., 2018). Similarly, in a recent study of wet deposition data by Lynam et al. (2018), very low fluxes of Hg deposition were calculated, though the study sites used (AMS6, the Patricia McInnes observation site shown in Fig. 1) were located further away from emitters. Results suggested that dry deposition could, instead, be a more important pathway of Hg removal in the region (Lynam et al., 2018).
In an effort to explain the elevated Hg concentrations found in the snowpack and waters near oil sands mining and upgrading activities, tailings ponds were studied as a potential source of Hg emissions related to oil sands activities (Willis et al., 2018). However, the water in these ponds (i.e., the non-recycled portion of process water used to process mined bitumen) was found to be an insignificant source of THg and MeHg.
The above-mentioned studies illustrate recent progress in the ongoing effort to examine the link between observed concentrations and anthropogenic sources of Hg in the AOSR. However, in addition to local emissions, multiple other sources of mercury emissions impact the region, especially forest fires and worldwide anthropogenic and geogenic (contemporary and legacy) emissions that are atmospherically transported into the region. Owing to the much larger emissions of Hg from worldwide sources, compared to Canadian sources, and the long lifetime of Hg in air, imported Hg accounts for the majority of the Hg burden in Canada (CMSA, 2016), rendering the assessment of the impacts of domestic Hg emissions challenging using measurements alone. While Cooke et al. (2017) investigated the history of Hg deposition in lake catchments via the study of sediment cores, only two lakes sampled were close enough (within 20 km) to oil sands activities, whereas most sites were 20 to > 50 km away from the oil sands facilities.
After Hg is emitted to air from oil sands mining and upgrading activities, transport, transformation and deposition processes determine the distribution and amounts of Hg deposited to environmental media such as vegetation, soils and water bodies. The 3D process-based predictive atmospheric composition models include process representations (such as atmospheric transport, chemical transformations, aerosol particle formation and growth, and wet and dry deposition of gases and particles) and simulate spatiotemporal distributions of pollutants in air and deposition starting from emissions (anthropogenic and natural) as inputs. These models provide insight into transport and transformation pathways of pollutants and causal links between emissions and concentrations observed in environmental media. Models have been applied to study Hg source attribution on global and regional scales, answering questions such as how much a specific emission source contributes to local and regional air concentrations and deposition and how the pollutant burden changes as industrial activity and related emissions vary (UNEP, 2008; CMSA, 2016; UNEP, 2018). Model processes are typically constrained by evaluating simulated pollutant levels using observation data from ground-based monitoring networks and research campaigns. Additionally, aircraft measurement data provide observation data on the vertical scale.
Wildfires are important sources of Hg in northwestern Canada, and climate change is intensifying their frequency (Fraser et al., 2018). Biomass burning primarily releases legacy Hg previously deposited to foliage and soils (Friedli et al., 2001; De Simone et al., 2015). Using multivariate data analysis, Parsons et al. (2013) determined the contribution from local sources (i.e., oil sands activities) to be minimal compared to total gaseous Hg concentrations in the air in the AOSR; however, the authors noted significant episodes of regional forest fires impacting the observed Hg concentrations in the air during the summer months (Parsons et al., 2013).
Observations of atmospheric Hg in the AOSR are limited to surface air GEM concentrations and Hg loadings in snow. Summertime wet and dry deposition is not measured. Therefore, measured estimates of annual Hg deposition in AOSR are currently not possible. Furthermore, a quantification of the relative importance of different Hg emission sources responsible for Hg loadings in the AOSR is required to prioritize mitigation actions. The 3D mercury model, Global Environmental Multiscale – Modelling Air quality and CHemistry – Mercury (GEM-MACH-Hg), was applied to develop a comprehensive understanding of atmospheric Hg and deposition levels and pathways and the role of emissions from Athabasca oil sands activities (particularly from bitumen upgraders) in the spatiotemporal distribution of Hg deposition in AOSR. This study addresses the following questions:
-
How do air concentrations and ecosystem loadings of Hg species in AOSR compare to other regions in Canada?
-
What is the level and geographical extent of the contribution of Athabasca oil sands emissions to Hg in air and deposition?
-
How does the impact of oil sands development on Hg levels in the region compare with the impacts of two other major sources of Hg in the region, biomass burning and global emissions?
-
What controls the inter-annual variability in Hg levels in AOSR?
This is the first study that provides a direct connection between Athabasca oil sands Hg emissions and deposition of Hg in and around the AOSR. A similar approach using the model GEM-MACH-Hg was previously applied to the assessment of Hg source apportionment at national and global scales (CMSA, 2016; AMAP/UNEP, 2013; UNEP, 2018).
GEM-MACH-Hg (Dastoor et al., 2015) is the mercury version of Environment and Climate Change Canada's 3D process-based operational air quality forecast model GEM-MACH (Global Environmental Multiscale – Modelling Air quality and Chemistry; Makar et al., 2018; Whaley et al., 2018). GEM-MACH includes emissions of gases and aerosols and simulates meteorological processes, aerosol microphysics, tropospheric chemistry, and pollutant dry and wet removal processes from the atmosphere. In addition, GEM-MACH-Hg includes emissions, chemistry, and dry and wet removal processes of three Hg species (GEM, GOM and PBM) (Dastoor and Durnford, 2014; Dastoor et al., 2008; Durnford et al., 2012; Fraser et al., 2018; Kos et al., 2013; Zhou et al., 2021). The recent version of GEM-MACH-Hg, previously applied to the investigation of the importance of biomass burning emissions to the Hg burden in Canada (Fraser et al., 2018) and the role of vegetation Hg uptake (Zhou et al., 2021), was used in this study. Oxidation of GEM and gas–particle partitioning of oxidized Hg species (GOM and PBM) are the main chemical transformation processes, and dry deposition of GEM, GOM and PBM and wet deposition of GOM and PBM are the major removal pathways of Hg in the model. Since observations of snowpack Hg loadings at the end of the winter season are utilized for model evaluation in this study, a detailed representation of the air–cryosphere Hg exchange and transformation processes is important. GEM-MACH-Hg includes a dynamic multilayer air–snowpack–meltwater Hg parameterization, representing Hg accumulation by precipitation and dry deposition to snowpacks, vertical diffusion and redox reactions in snowpacks, and re-volatilization and meltwater run-off of Hg species (Durnford et al., 2012). Geospatially distributed global, regional and local emissions of Hg species (GEM, GOM and PBM) to air from primary geogenic and anthropogenic sources and re-emissions of previously deposited Hg (legacy Hg) from terrestrial and oceanic surfaces are included in the model.
Three geographical domains were utilized for the model simulations in this study: global, North America (NA) and AOSR. A geospatial resolution of 10 km was chosen for the NA domain, and its boundary conditions were determined by the global simulations conducted at latitude–longitude resolution. Model simulations for the AOSR were carried out at a finer geospatial resolution of 2.5 km for an extended AOSR domain with the approximate midpoint adjacent to the two largest upgrading facilities (called “AR6”) (Kelly et al., 2010) and extending as far north as Hay River, NT, and as far south as Red Deer, AB; the approximate western and eastern extents of the domain are marked, respectively, by Grande Prairie, AB, and Flin Flon, MB.
Geogenic emissions and re-emissions of legacy Hg in soils and oceans (∼ 4200 t yr−1) emitted as GEM were distributed as described in Durnford et al. (2012). Wildfire biomass burning Hg emissions are represented in the model simulations using the FINN (Fire INventory) fire emissions products (Wiedinmyer and Friedli, 2007; Wiedinmyer et al., 2011) together with vegetation-specific emission factors (EFs) as described in Fraser et al. (2018). FINN estimated biomass burning Hg emissions (emitted as GEM) were ∼ 600 Mg yr−1 globally; 10.8 (2012), 11.4 (2013), 15.5 (2014) and 11.1 (2015) Mg yr−1 in Canada; and 13.4 (2012), 10.5 (2013), 11.4 (2014) and 9.5 (2015) Mg yr−1 in the United States.
Contemporary global anthropogenic Hg emissions for 2015 (2224 Mg yr−1; subdivided into GEM, GOM and PBM) developed by the Arctic Monitoring and Assessment Programme (AMAP) (UNEP, 2018) were incorporated into the model for the global-scale simulations. For NA and AOSR domains, GEM-MACH-Hg includes monthly and diurnally varying anthropogenic Hg emissions in Canada developed by Zhang et al. (2018), based on the NPRI (NPRI, 2019) for the major point sources and the 2010 Air Pollutant Emission Inventory (APEI, 2019) for the area sources. Anthropogenic Hg emissions in the United States included in GEM-MACH-Hg were based on the 2011 National Emissions Inventory (NEI) (EPA), described in Zhang et al. (2018). Total anthropogenic emissions of Hg in Canada, the United States and worldwide were 4.3, 47 and 2224 Mg yr−1, respectively. The ratio in the total anthropogenic Hg emissions was approximately .
For the Hg emissions related to oil sands activities, the model's input consisted only of NPRI-reported air emissions. Possibility of fugitive dust from the disturbed landscape due to oil sands activities as a source of particulate-bound Hg emissions was noted by Kirk et al. (2014). Cooke et al. (2017) were unable to detect Hg from dust emissions in lake sediments. Comparison of modelled and observed Hg levels conducted in this study allowed an assessment of whether NPRI-reported oil sands emissions and area sources (APEI) in AOSR capture Hg emissions in the region comprehensively or whether there are other yet undetermined important sources of Hg emissions such as from fugitive dust in the AOSR.
NPRI is a mandatory reporting tool for a wide range of contaminants, including Hg, as prescribed by the Canadian Environmental Protection Act. Facilities are required to report Hg releases, if total work hours exceed 20 000 and if a reporting threshold of 5 kg yr−1 is met for Hg and Hg-containing compounds that were manufactured, processed or otherwise used (includes by-products) or contained in tailings and waste rock. For the AOSR domain, Hg emissions were updated in the model from 2012 to 2015 using the NPRI point source Hg emissions data for each year. A summary of Hg emissions from Athabasca oil sands upgrading facilities (NPRI) for 2012–2015 and the temporal trend from 2004–2017 are available in Table 1 and Fig. 3, respectively. Based on NPRI, total anthropogenic Hg emissions in Canada from the province of Alberta were 605 kg in 2015. Among these, fossil fuel burning activities such as coal-fired power plants, waste incineration facilities and other fossil fuel combustion contributed an estimated 221, 120 and 72 kg, respectively, which represents 68 % and, therefore, the bulk of total anthropogenic Hg emissions in Alberta. Iron and steel production together with the cement industry (emitting 55 and 46 kg, respectively) contribute another 14 %, and oil sands upgrading was a minor contributor (∼ 25 kg) in 2015.
Table 1Athabasca oil sands Hg emissions (all in kg yr−1) reported to NPRI by oil sands processing facilities and used in the model. For the location of facilities in the AOSR see Fig. 2.
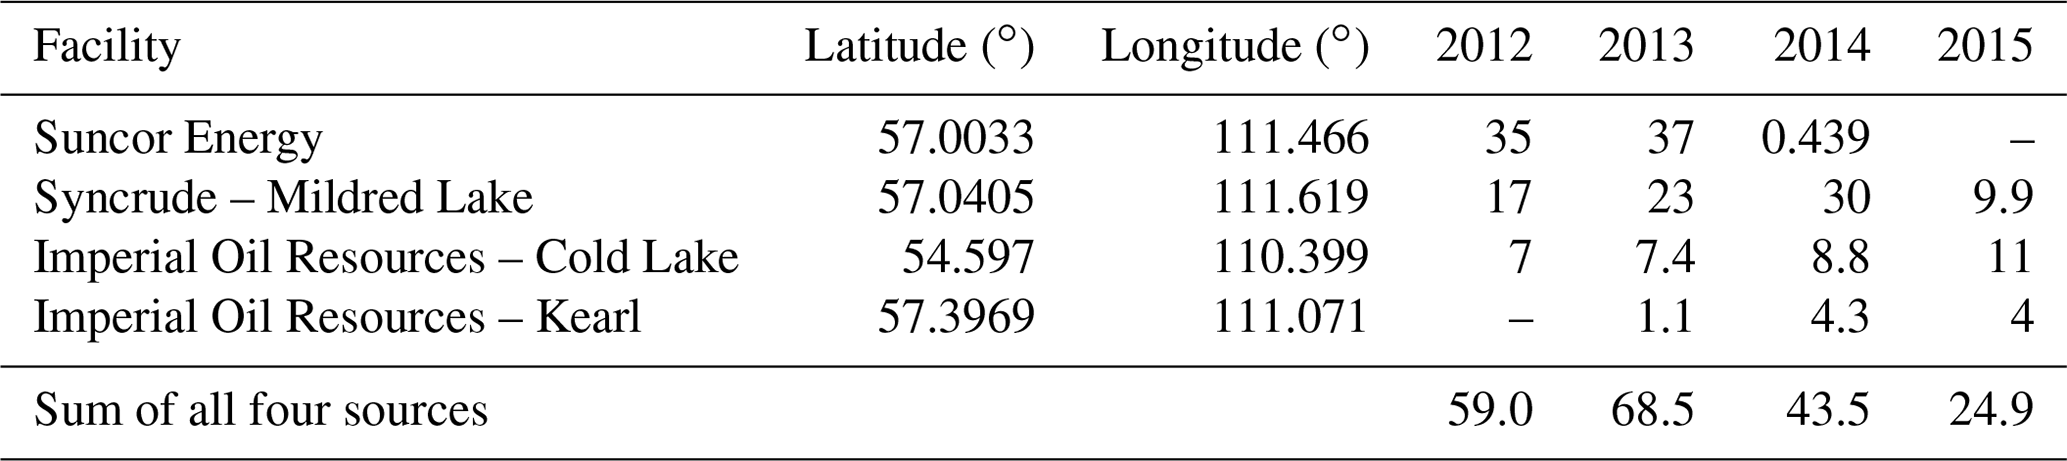
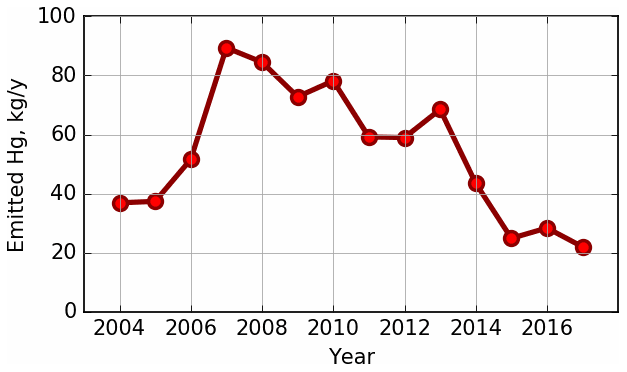
Figure 3Time series of total Hg emissions from oil sands processing facilities in the AOSR. Data were compiled from the NPRI database. Numerical values and individual contributions from 2012–2015 are available in Table 1.
Base model simulations at the three model simulation domains (i.e., global, NA and AOSR) were performed using all sources of Hg emissions (as described earlier) and meteorological conditions for the respective years from 2010–2015 to allow evaluation of modelled air concentrations with measured air concentrations for all available years in the AOSR. Snowpack Hg measurements in the AOSR started in 2012. Thus, the model–measurement comparison of snowpack Hg and the oil sands Hg emissions impact study was conducted for the years 2012–2015.
Multiple controlled model simulations from 2012–2015 were performed choosing appropriate geographic domains to assess the relative role of Athabasca oil sands Hg emissions on Hg burden in the AOSR. The impact of Athabasca oil sands emissions was assessed by zeroing out emissions of Hg from oil sands facilities in a controlled simulation using the AOSR domain. Contributions of Hg emissions from biomass burning (in North America) and global anthropogenic sources to the AOSR Hg levels were obtained by zeroing out emissions from these sources in controlled simulations on North America and global model domains, respectively. Source apportionment of the anthropogenic Hg deposition from worldwide sources was conducted using a series of global-scale controlled simulations by zeroing out anthropogenic Hg emissions in different source regions. In addition, controlled model simulations were performed to estimate the individual influences of meteorology, biomass burning emissions and oil sands emissions on the interannual variations in Hg deposition in the AOSR by successively adding these three temporal changes in 2013–2015.
Simulated air concentrations and deposition of Hg were evaluated with observations of Hg in air and snowpack in the AOSR. These measurements were recorded with instruments deployed for air quality monitoring purposes and to study the atmospheric deposition of Hg species in the AOSR (Parsons et al., 2013; Kirk et al., 2014; Gopalapillai et al., 2019). Air measurements were carried out at three sites in the AOSR: Patricia McInnes (2010–2018), Fort McKay (2014–2018) and Lower Camp (2012–2014). Measurements were made using Tekran 2537 Hg analysers for GEM and Tekran 1130/1135/2537 systems for speciated Hg (GOM and PBM) fitted with PM2.5 and PM10 inlets (see map in Fig. 2 for equipment placement and Figs. 4–6 for data). Standard operating procedures were provided by the Canadian Atmospheric Mercury Measurement Network (CAMNet; Steffen and Schroeder, 1999). Air measurements of oxidized Hg concentrations were carried out at only one site near Fort McKay in 2015 (Parsons et al., 2013). Since Hg deposition to snow is mainly derived from the ambient oxidized Hg concentrations, observations of snowpack Hg loadings provide additional constraint for modelled oxidized Hg concentrations in air.
Snow samples were collected from 2012 to 2015 at 454 sites located at varying distances from the major upgrading facilities (< 1–231 km) to estimate total seasonal Hg loadings in surface snow in the AOSR (Gopalapillai et al., 2019; Kirk et al., 2014). Specifically, 90 (2012), 86 (2013), 140 (2014) and 138 (2015) samples were obtained from sites located close to the AOSR emission sources (< 25 km) and at background sites further away from sources (> 120 km). Sample collection was carried out in early to mid-March of each year at approximate maximum snowpack depth based on Environment and Climate Change Canada's National Climate Data and Information Archive historical snow accumulation data (GoC, 2019). Kirk et al. (2014) employed ultra-clean handling and analysis protocols while taking care to avoid local contamination from transportation since sites were accessed by helicopter and snowmobile. Mercury analysis in the snow was carried out using cold vapour atomic fluorescence spectroscopy (Willis et al., 2018; Kirk et al., 2014; EPA, 1996; Bloom and Crecelius, 1983). The determined snowpack Hg loading at the end of the winter season represents the lower limit of the net wintertime dry and wet deposition of Hg. Hg deposited to snowpacks is partially reduced and re-volatilized to the air and lost during intra-seasonal snowpack melting. Summertime measurements of Hg deposition by scavenging in rain and direct uptake by vegetation, soils and waters were unavailable for model evaluation.
6.1 Evaluation of model-simulated mercury concentrations in air
GEM-MACH-Hg has been extensively evaluated with comprehensive worldwide (including Canada) observations, inter-compared with other Hg models and applied to mercury assessments in previous studies (Angot et al., 2016; Bieser et al., 2017; Dastoor et al., 2008; Dastoor and Durnford, 2014; Durnford et al., 2010, 2012; Fraser et al., 2018; Kos et al., 2013; Travnikov et al., 2017; Zhou et al., 2021; AMAP, 2013; CMSA, 2016; UNEP, 2018). Model evaluation of ambient Hg in the AOSR is presented in this study. Figures 4–6 provide a comparison of simulated (blue trace) and observed (red trace) daily averaged TGM concentrations in air at the three observation sites (Fig. 4: Patricia McInnis, 2010–2015; Fig. 5: Lower Camp, 2012–2014; and Fig. 6: Fort McKay, 2014–2015) and how the model captured biomass burning emissions (BBE) (green traces show modelled biomass burning contributions to TGM concentrations). While some observations are incomplete (e.g., June 2013, Patricia McInnis), the data provide a detailed picture of TGM surface concentrations near oil sands activities (see Fig. 2 for details). In general, data from all three observation sites and model simulation results agreed well with an average squared Pearson correlation coefficient of 0.6 and measured and modelled median TGM concentrations (±standard deviation) of 1.34 ± 0.21 and 1.39 ± 0.17 ng m−3 (2011–2015) at Patricia McInnis, 1.36 ± 0.17 and 1.36 ± 0.18 ng m−3 (2013) at Lower Camp, and 1.22 ± 0.23 and 1.33 ± 0.19 ng m−3 (2014–2015) at Fort McKay, respectively. The model captured the observed seasonal cycle (typical in the Northern Hemisphere) with spring maxima and autumn minima, shaped mainly by surface fluxes of Hg such as the dominance of re-emission fluxes of Hg from snow in winter and spring and uptake of Hg by vegetation in summer and autumn (Zhou et al., 2021). Transport of Hg from biomass burning (i.e., wildfires) events in northern and western Canada yielded distinct Hg concentration peaks in TGM concentrations in the AOSR (Figs. 4–6). For 2011, biomass burning provided a large contribution to overall TGM concentrations, which peaked during these events at Patricia McInnis; however, no concurrent observations were available for the months of May and June. During the large wildfire events in 2012 and 2015 (June–July), daily averaged TGM concentrations were generally < 2.5 ng m−3, which were accurately reproduced by the model. However, as shown in Fig. 5 for the Lower Camp site in August 2013, there are discrepancies between modelled and observed wildfire events. The impacts of biomass burning emissions on Hg burden in Canada and the uncertainties in wildfire Hg emissions associated with the characterization of wildfire events and emission levels using satellite and field data were described in a previous study (Fraser et al., 2018). Low TGM concentration events in winter and early spring, such as those in March 2014 at Patricia McInnis, were typically associated with clean air masses coming from the Arctic in AOSR. Model–measurement agreement of TGM levels in the air is within the respective model and measurement uncertainties and indicates that reported Hg emissions from AOSR facilities are reasonable.
GOM and PBM observations were conducted at Fort McKay (a region dominated by natural boreal forest) using PM2.5 (captures particle sizes < 2.5 µm) and PM10 (captures particle sizes < 10.0 µm) inlets in AOSR for 2015, but significant measurement data gaps were present particularly in winter and spring. Observed annual average concentrations were 1.02 ± 2.59 (GOM) and 3.47 ± 4.79 pg m−3 (PBM) using the PM2.5 inlet and 0.60 ± 1.11 (GOM) and 4.25 ± 8.23 pg m−3 (PBM) using the PM10 inlet in 2015; these observations suggest a dominance of PBM in fine particles (< 2.5 µm) at the Fort McKay site (17 km northwest of AR6). The model-simulated and observed average TOM air concentrations and standard deviation (±1σ) in 2015 were 4.74 ± 5.06 and 5.74 ± 7.20 pg m−3, respectively; observed data from both inlets were combined to reduce measurement gaps. Episodes of high concentrations of particulate Hg (up to 72.9 pg m−3), occurring predominantly on coarse (> 2.5 µm) particles, that were absent in the modelled PBM concentrations were observed in March. The sources of coarse particles in the AOSR are currently unknown, but fugitive dust from pet coke piles and roads as a result of oil sands mining activities was suggested by Gopalapillai et al. (2019). It should be noted that uncertainty of a factor of 2 or higher with oxidized Hg measurements has been reported (Kos et al., 2013; Gustin et al., 2015). Comparable average GOM and PBM concentrations of 1.89 ± 8.31 and 3.82 ± 4.90 pg m−3 (mean ± 1σ, 2009–2011), respectively, have been measured at a site 8 km from a coal-fired power plant in Genesee, AB (about 500 km southwest of Fort McMurray). Seasonal cycles at the two sites (Fort McKay and Genesee) were similar, with TOM maxima in May–June. Since Hg deposition to snow is primarily driven by the uptake of ambient oxidized Hg species in snowfall and snowpack, the robustness of model-simulated oxidized Hg in air was further tested by comparing modelled snowpack Hg loadings with measurements (see next section).
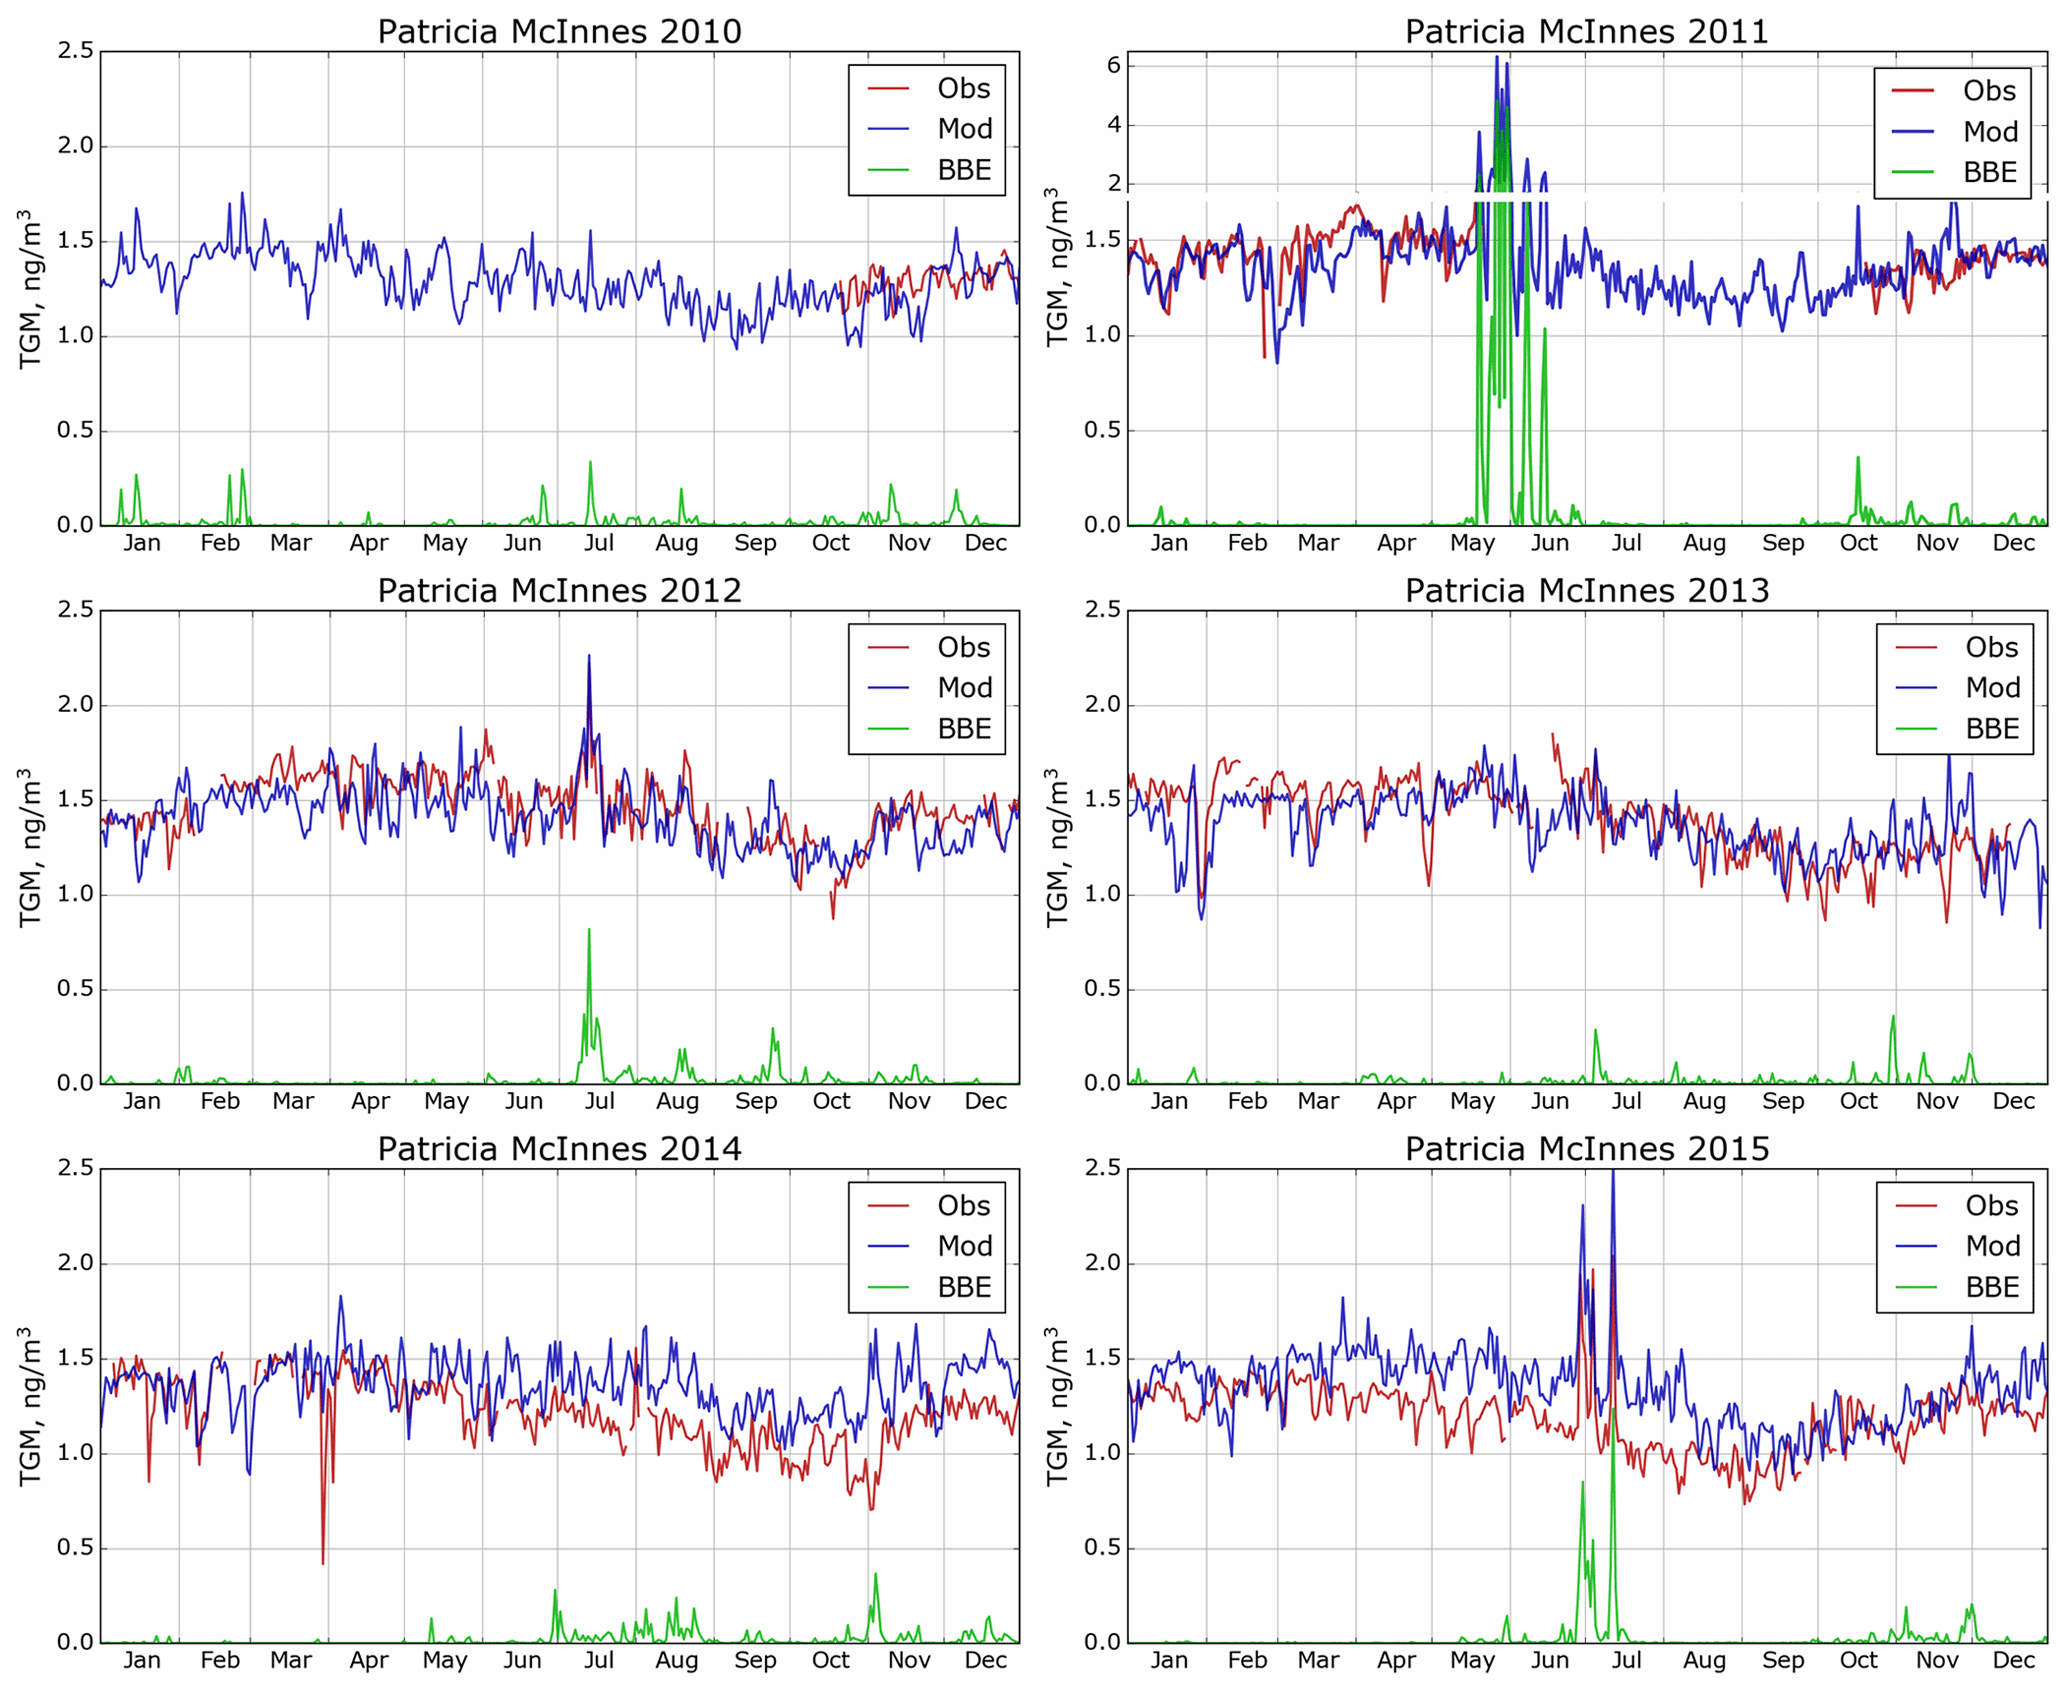
Figure 4Simulated and observed daily averaged surface air TGM concentrations in AOSR for the site Patricia McInnes (2010–2015). Obs – observations; Mod – model estimation; BBE – modelled biomass burning contributions. Note the larger range of the y axis to plot the strong biomass burning event in May and June of 2011.
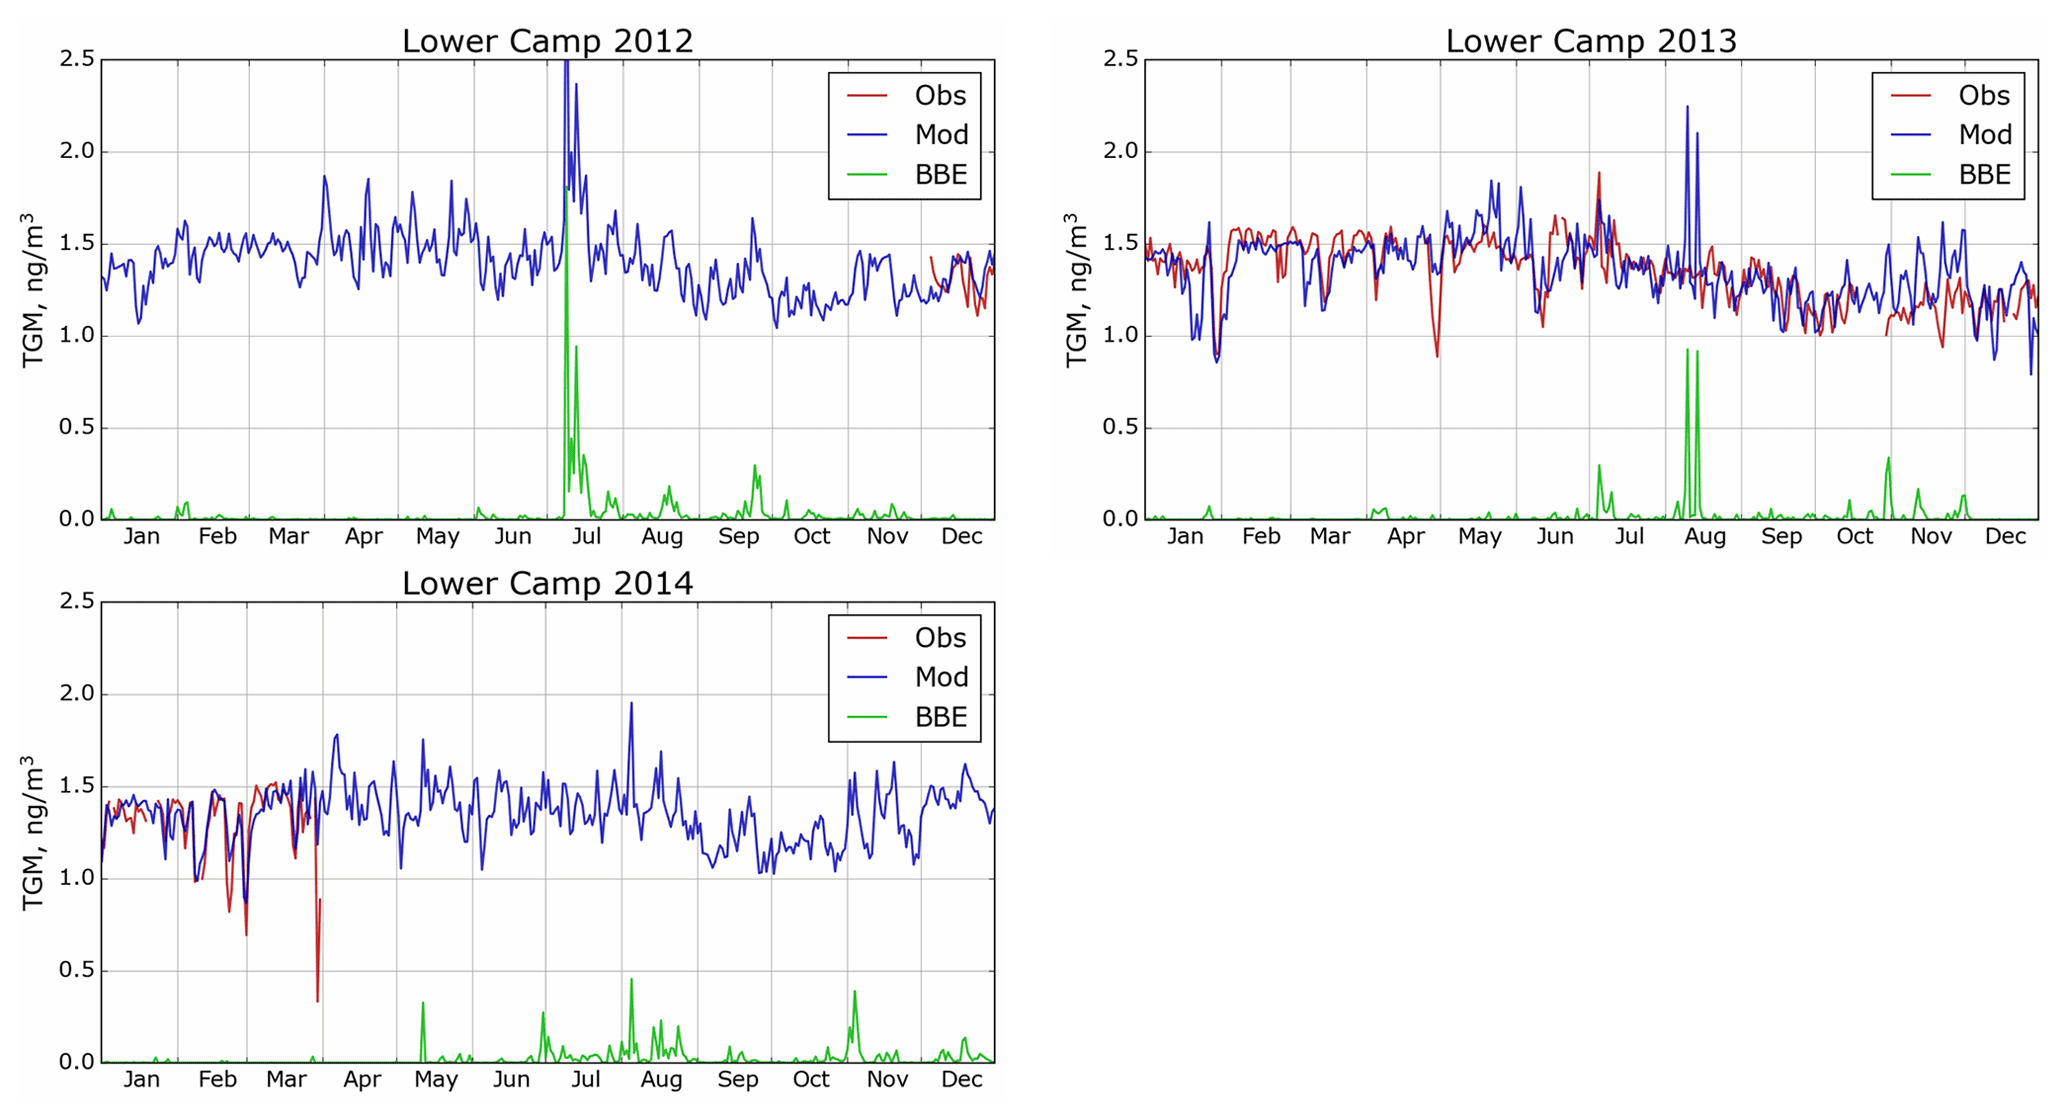
Figure 5Simulated and observed surface air TGM concentrations in AOSR for the site Lower Camp (2012–2014). Obs – observations; Mod – model estimation; BBE – modelled biomass burning contribution.
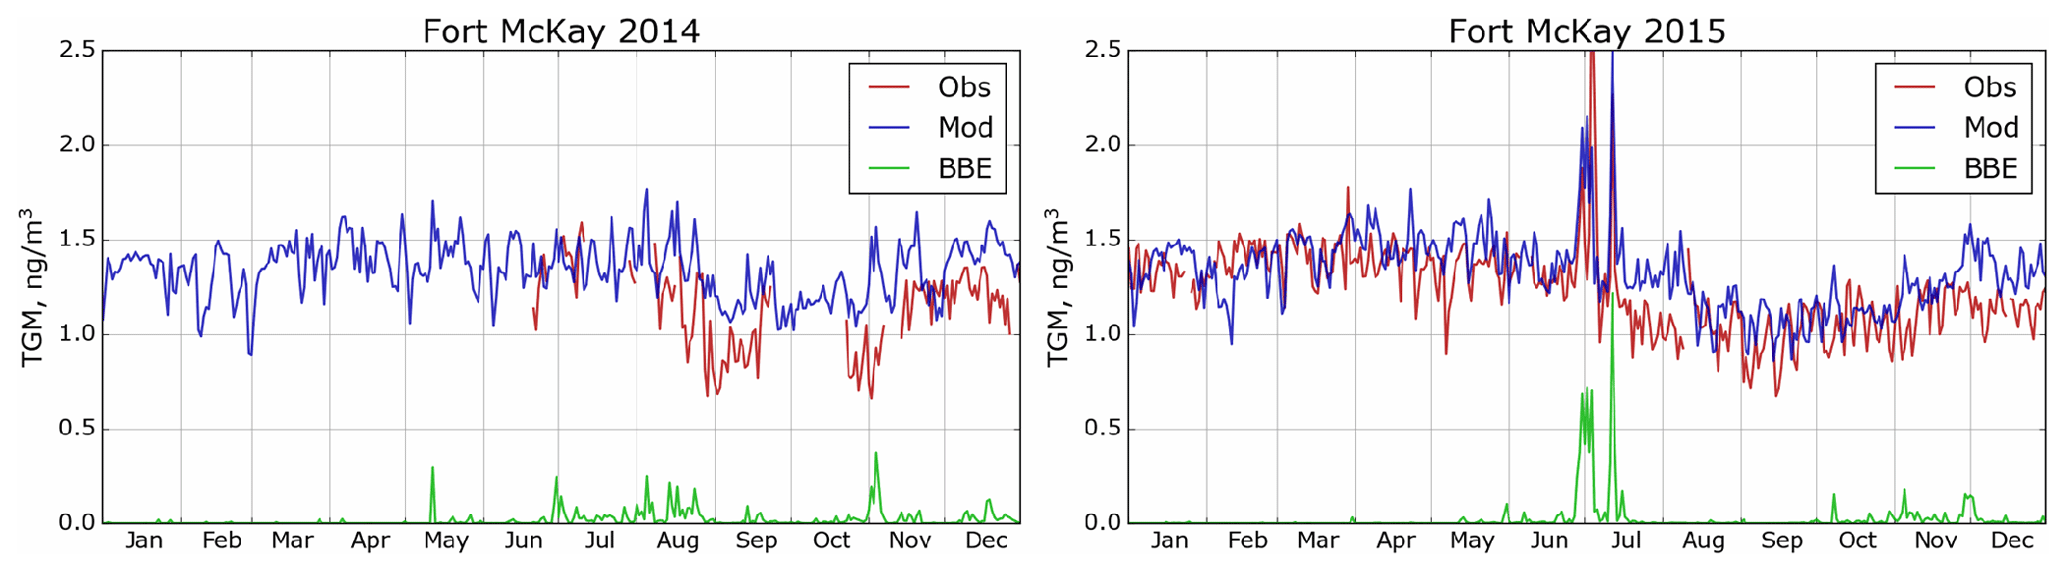
Figure 6Simulated and observed surface air TGM concentrations in AOSR for the site Fort McKay (2014 and 2015). Obs – observations; Mod – model estimation; BBE – biomass burning contributions.
For the purpose of comparing ambient GEM concentrations in the AOSR with other Canadian regions, Fig. 7 provides a map of modelled annual average surface air Hg concentrations of GEM for Canada in 2013. In general, model-estimated surface air GEM concentrations agreed well with available observations (in circles), including western Canada, the Pacific coast and the AOSR. There is a general gradient in GEM concentrations from higher concentrations in the west (1.5 ng m−3) to lower concentrations in the east (1.3 ng m−3). The average air concentrations of GEM in the AOSR (1.40 ng m−3, 2012–2015) reflected the background GEM levels in Canada. The simulated large-scale pattern in GEM concentrations is consistent with, and reflects, a dominant role of trans-Pacific transport of GEM from East Asian Hg sources into Canada and the high Arctic. GEM concentrations are slightly higher in major urban centres and regions of current and past anthropogenic activities such as energy production from coal-fired power plants and mining. The hotspot in Fig. 7 near the Saskatchewan–Manitoba border is the former copper–zinc smelter near Flin Flon, MB, which ceased operations in 2010 (Ma et al., 2012). The soils in the surrounding region remain heavily contaminated with Hg. The re-emission of accumulated legacy mercury in soils (Eckley et al., 2013) is responsible for the highly elevated GEM concentrations in air.
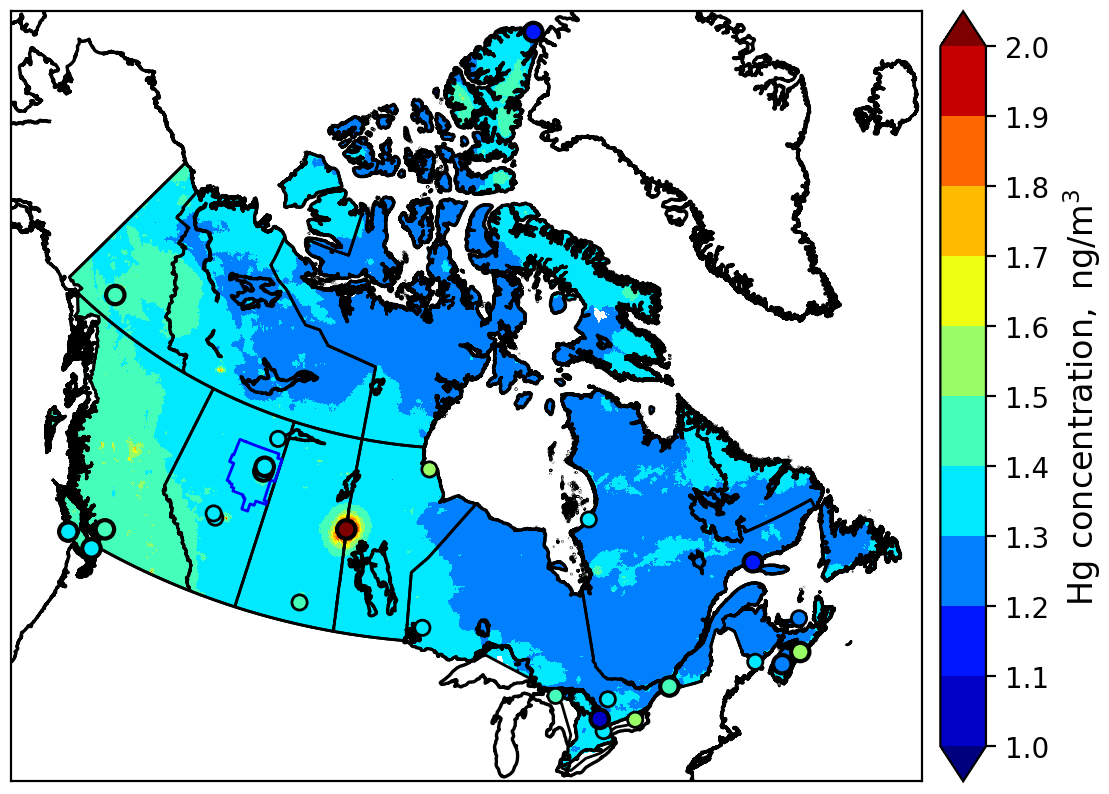
Figure 7Model-simulated spatial distribution of annual average surface air GEM concentrations in Canada in 2013; colours in circles show observed concentrations for 2013 (large circles) and previous years (small circles).
6.2 Evaluation of model-simulated mercury accumulation in snow
Figure 8 compares total Hg loadings in snow simulated by the model with observations (in circles) at the end of winter for the years 2012–2015 in the AOSR. Cooke et al. (2017) used dated lake sediment cores to reconstruct deposition trends and anthropogenic enrichment in the region, but several correction factors needed to be applied to estimate Hg deposition fluxes, and only two lakes were cored in the direct vicinity of oil sands operations. By comparison, seasonal snowpack Hg data provide the distribution of net total Hg deposition in the region with a large number of sampling sites a short distance (< 25 km) away from sources. However, it should be noted that Hg deposition in the snow is partially reduced and reemitted as well as adsorbed in surface soils due to diffusion and intra-seasonal melt; therefore, snowpack Hg represents the lower limit of net wintertime deposition. Observations at the sampling sites close to sources had the highest snowpack Hg loadings with decreasing concentrations as one moves further away from the immediate source region; the same spatial pattern was predicted by the model and is most evident for the years with the largest emissions (2012 and 2013; Fig. 8). Snow Hg contents at the background sites in the Peace–Athabasca Delta region in the north were significantly lower, which was also well reproduced by the model. The figure shows high spatiotemporal variability in snow Hg loadings, which are related to changes in meteorological factors as well as oil sands emissions (as discussed later). The decline in both snowfall amounts and oil sands emissions led to lower snow Hg loadings in 2014 and 2015. Figure 9 shows the model-simulated average snow depths in the AOSR and the observed depths at the Mildred Lake site close to the Syncrude upgrader. The model simulates snow amounts and interannual variations accurately. The model-estimated seasonal snow accumulations were 62, 183, 104 and 71 cm between October to May in 2012, 2013, 2014 and 2015, respectively. An intense intra-seasonal melting event at the end of February was predicted by the model in each year, which is in line with observations. The largest melting event occurred in 2015, which caused over half of the snow accumulation to melt and, thus, loss of half of seasonal snowpack Hg loadings. Modelled snow Hg loadings are in agreement with Gopalapillai et al. (2019), who reported a temporal decrease in snow Hg loadings near-field (< 8 km from AR6), from an average load of 510 ng m−2 in 2008 to 175 ng m−2 in 2016. Relative importance of inter-annual changes in meteorological conditions and oil sands emissions to wintertime Hg deposition is discussed in a later section.
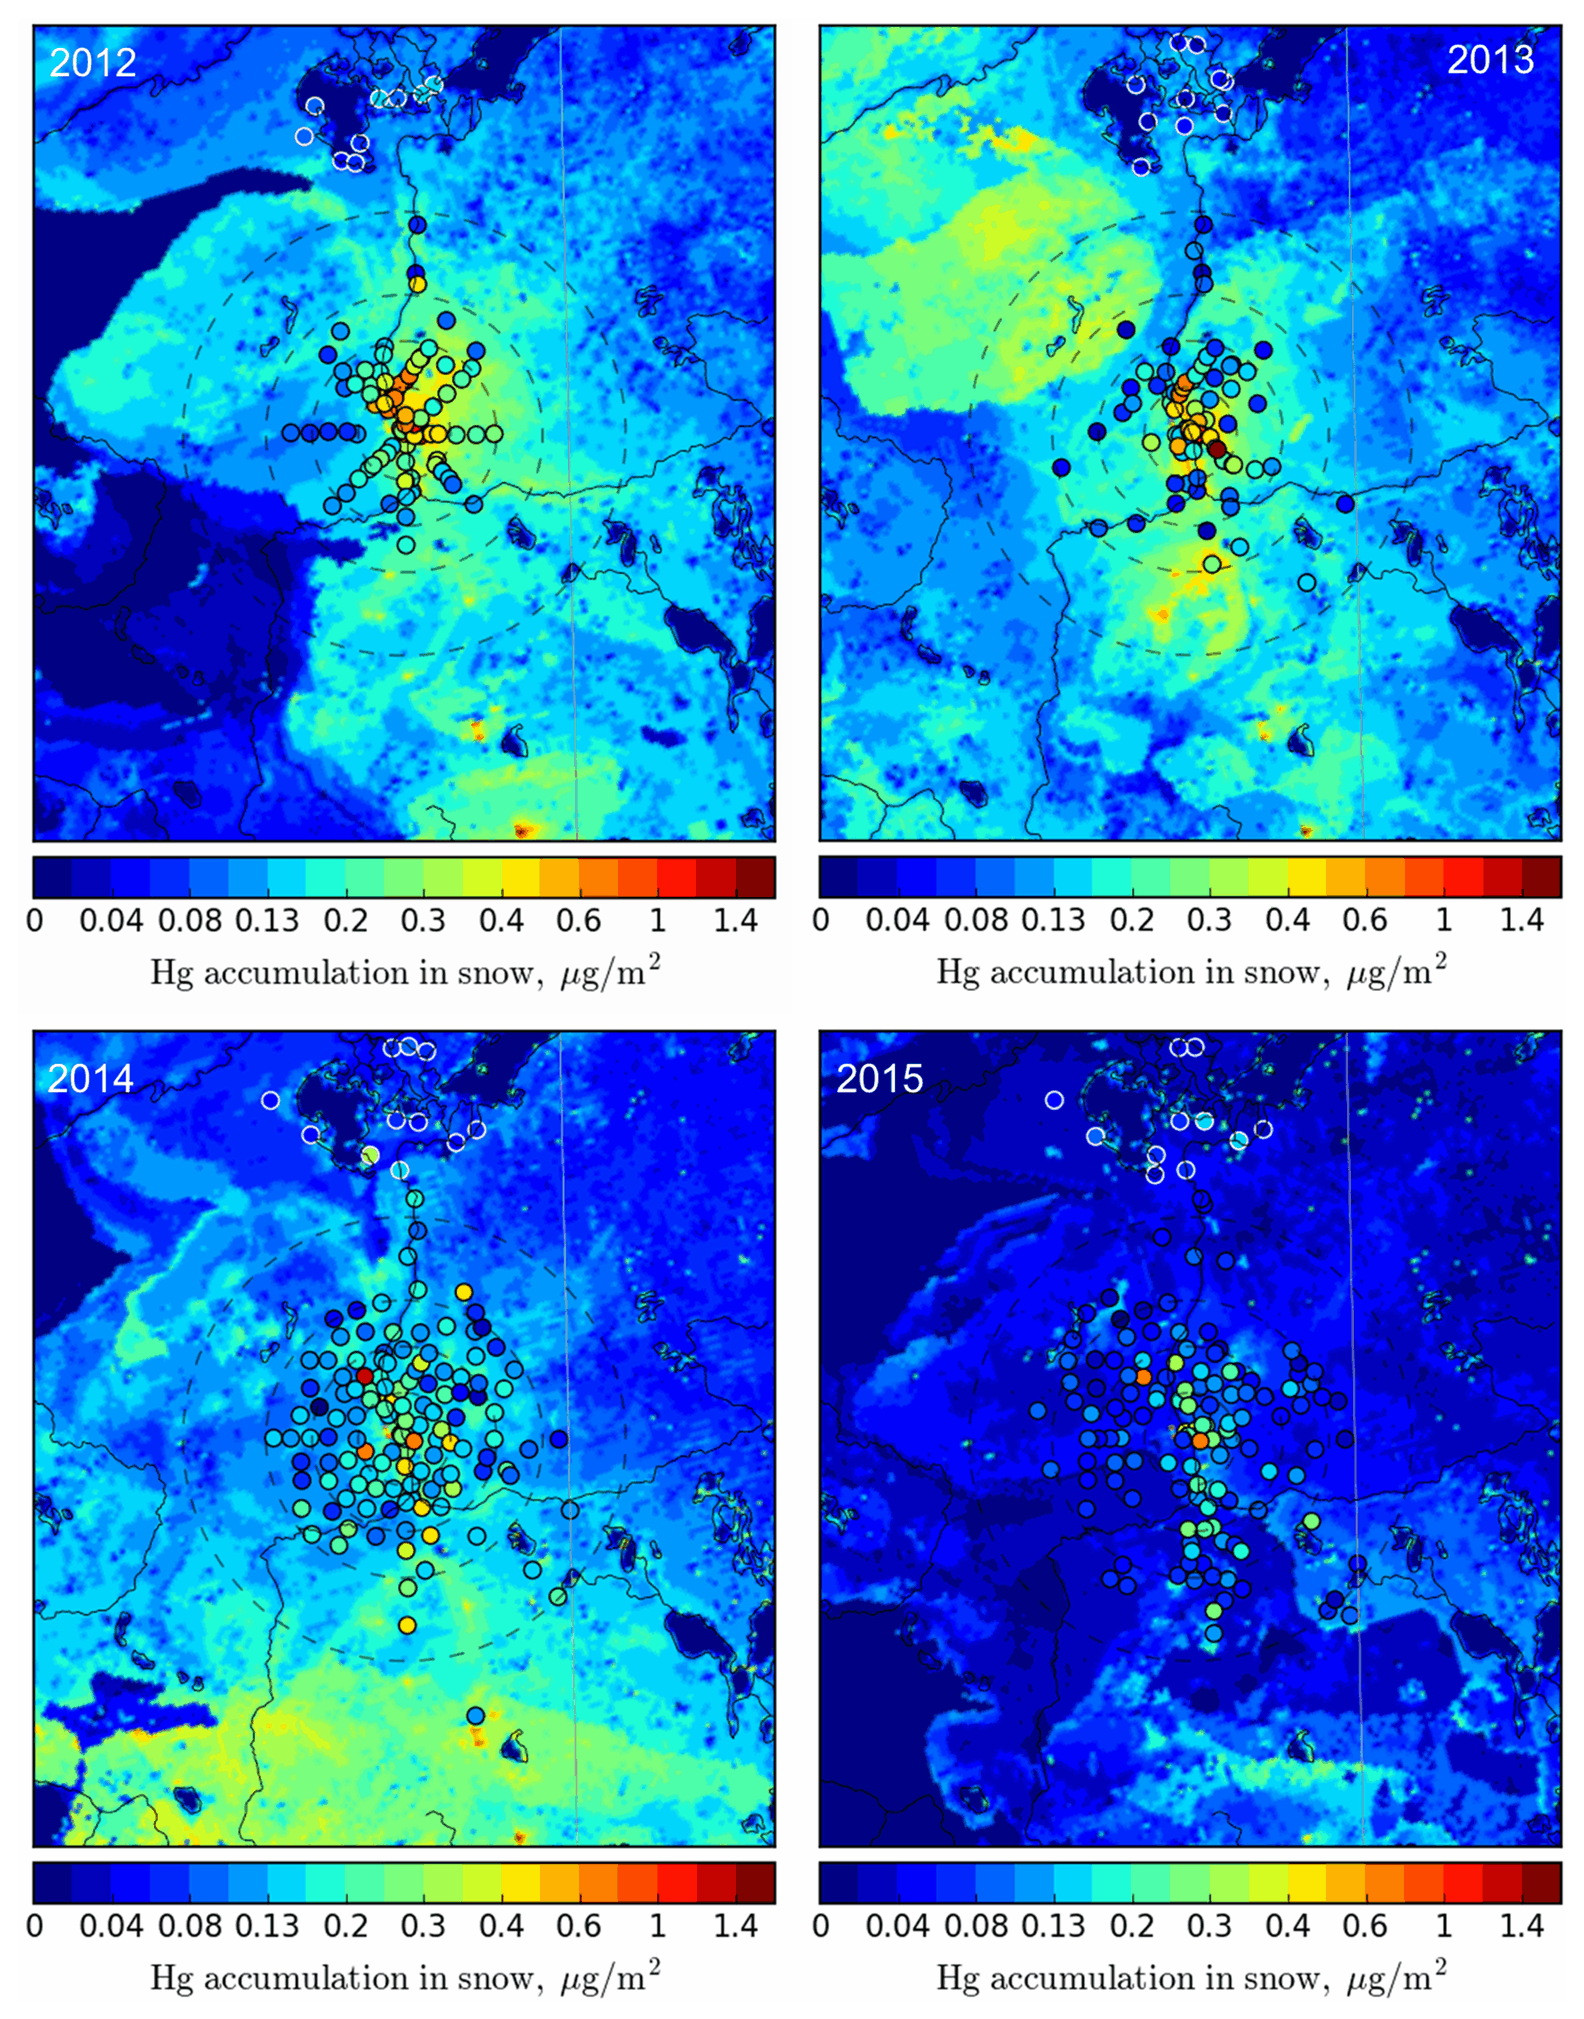
Figure 8Seasonally accumulated Hg loadings in snow in AOSR from 2012 to 2015: modelled (background map) and observed values (colours in circles). Circle radii: 25, 50, 75, 120 km.

Figure 9Daily averaged model-simulated (blue) and observed snow depths (green) (cm) in 2012–2015 in the AOSR. Modelled values are averaged over the entire AOSR domain, and the observation site is Mildred Lake, Alberta, a few kilometres east of the Syncrude oil sands upgrader.
Figure 10 compares average modelled and observed snow Hg loadings at the sampling locations within 25, 25–50, 50–75, 75–120 and > 120 km from AR6. Inter-annual changes in meteorology and oil sands emissions led to decreases in total Hg loads from 0.52 ± 0.21 to 0.22 ± 0.09 µg m−2 within 25 km of AR6 (from 2012 to 2015) in the snowpack for observation and from 0.39 ± 0.21 to 0.08 ± 0.06 µg m−2 for model estimates sampled at sites. The snow Hg loadings of up to 0.7 µg m−2 were simulated by the model in the immediate vicinity of Hg-emitting sources for 2012 (Fig. 8). Emitted amounts of Hg from oil sands facilities were reported to the NPRI with the caveat that not all emissions, e.g., emissions of mercury that are part of fugitive dust releases, are captured by the inventory. Brief episodes of Hg on larger particles (2.5–10 µm size) were observed at Fort McKay in late winter, likely originating from fugitive dust in the AOSR. These possible sources of Hg emissions and related deposition (in the vicinity of sources) were not included in the model. At > 120 km from AR6, snowpack loadings were very low for all years at < 0.1 µg m−2 with small inter-annual variability and indicate background Hg concentrations at this distance.
While the strong decrease away from the source is mirrored in Fig. 10 for the years 2012 and 2013 (dropping from about 0.4 µg m−2 at sites located < 25 km from AR6 to < 0.1 µg m−2 at sites > 120 km away), the weaker signature from Fig. 8 for the years 2014 and 2015 is more clearly represented in Fig. 10, consistent with declines in reported oil sands emissions (see Table 1 and Fig. 3). Modelled snow Hg loadings closer to the oil sands sources were lower compared to observed values in 2015. A sensitivity model simulation was conducted for 2015 by replacing NPRI reported Hg emissions from oil sands facilities in 2015 with 2014 values. The sensitivity model simulation matched the observed Hg loadings in the snow in 2015 at all distances; these results suggest that either NPRI Hg emissions from oil sands facilities were slightly under-represented or there was an unaccounted for area source (such as from fugitive dust) of Hg in 2015.
Model estimates and observations agreed well for all distances evaluated and demonstrate the model's ability in correctly simulating the impacts of changes in Hg emissions and physicochemical processes in the cryosphere. The high variability in the observed snowpack data within 50 km of AR6 indicates that there are likely other local sources around mining facilities that impact local deposition (such as fugitive dust from coke pile and roads). However, modelled estimates at sampling locations agreed with observed snow Hg loadings within 1 standard deviation and suggest that unaccounted for sources of Hg do not have a significant impact on deposition in the AOSR, likely due to their episodic nature as suggested by observed ambient concentrations of particle-bound mercury.
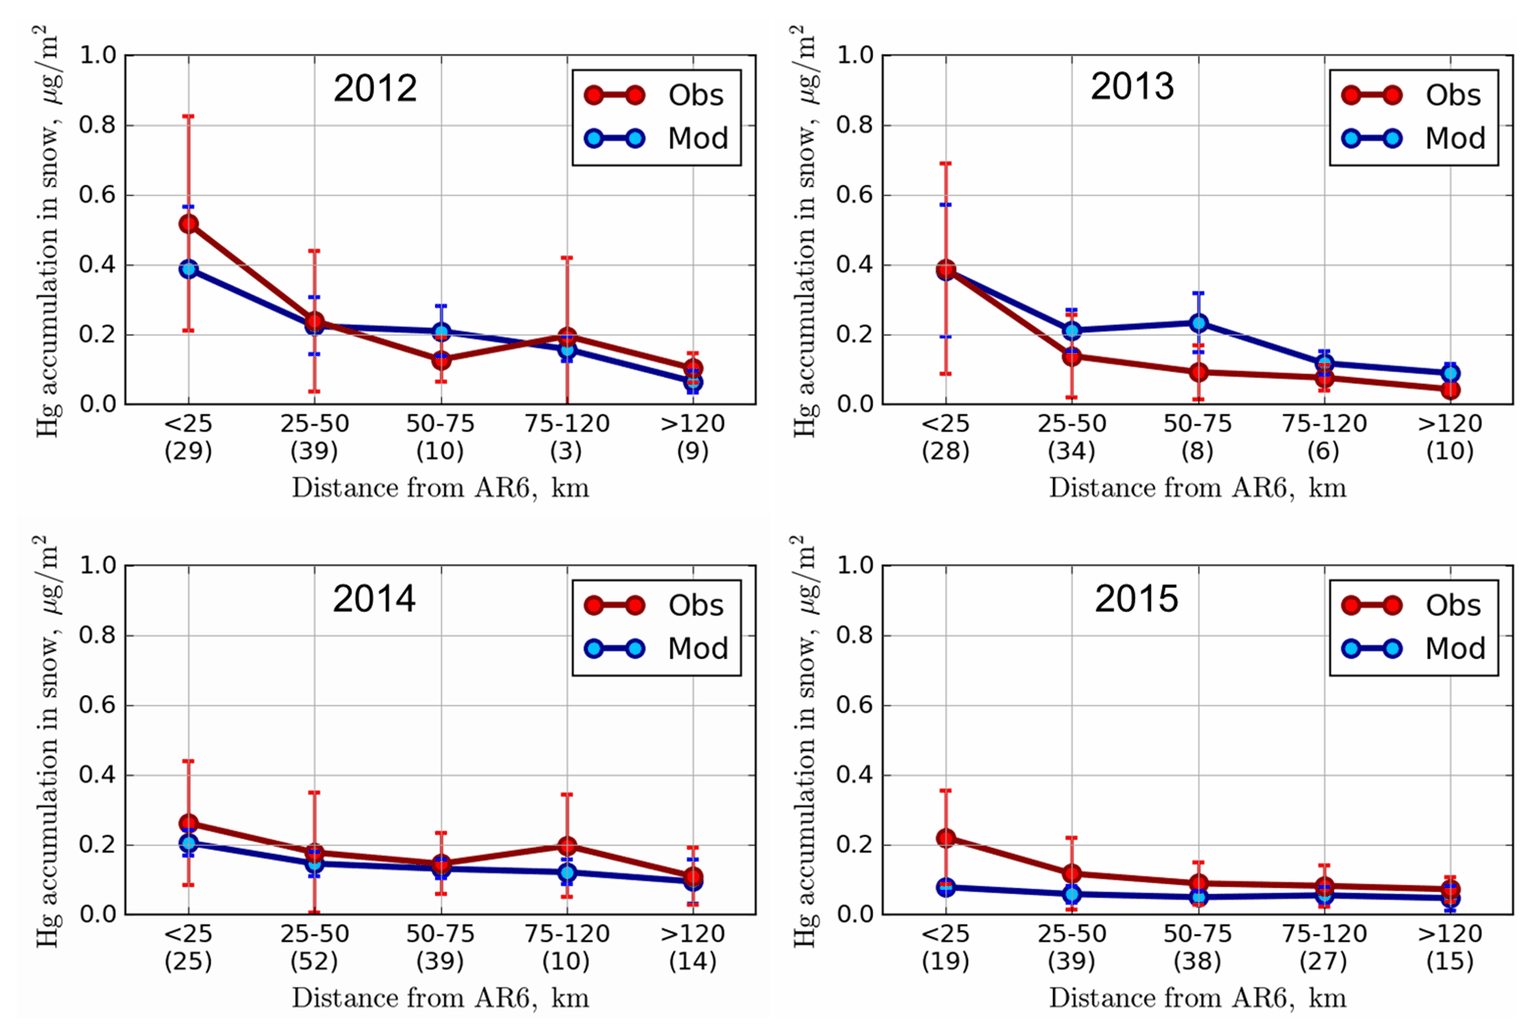
Figure 10Average modelled (µg m−2; blue) and observed (µg m−2; red) end-of-winter Hg loadings in snowpack within 25, 25–50, 50–75, and 75–120 and > 120 km distances from AR6 along with ±1 standard deviation. Modelled accumulated Hg in the snow was sampled at the observation sites. Numbers in parentheses provide the number of observation sampling sites in each distance cluster.
Comparison of modelled annual wet and total deposition (wet plus dry deposition) fluxes of Hg in the AOSR with other locations in Canada is presented in Fig. 11 for 2013. In general, spatial distributions of wet and total deposition fluxes followed patterns of precipitation (high in the east, south and mountainous regions of Canada), industrial activities (high in southern Canada), vegetation density (boreal and temperate forests) and Hg transport from the United States (higher in the east). Figure 11 shows good agreement with observed wet deposition fluxes (noted in circles) in coastal (Saturna Island, BC), rural (southern Alberta) and urban areas (Egbert, ON). While direct measurements of annual total deposition fluxes are not available, the distribution of Hg deposition fluxes in Canada was found to be consistent with Canada-wide lake sediment inferred deposition fluxes (Muir et al., 2009). Average annual total deposition fluxes in the AOSR were 16.9, 15.7, 18.3 and 17.5 µg m−2 in 2012, 2013, 2014 and 2015, respectively, slightly higher than in the other regions of northern Alberta (∼ 14 µg m−2 yr−1) and lower than average Hg deposition flux in southern Alberta (∼ 25 µg m−2 yr−1). The highest deposition up to 80 µg m−2 occurred in southern Ontario in Canada due to the presence of local anthropogenic mercury emissions in these regions.
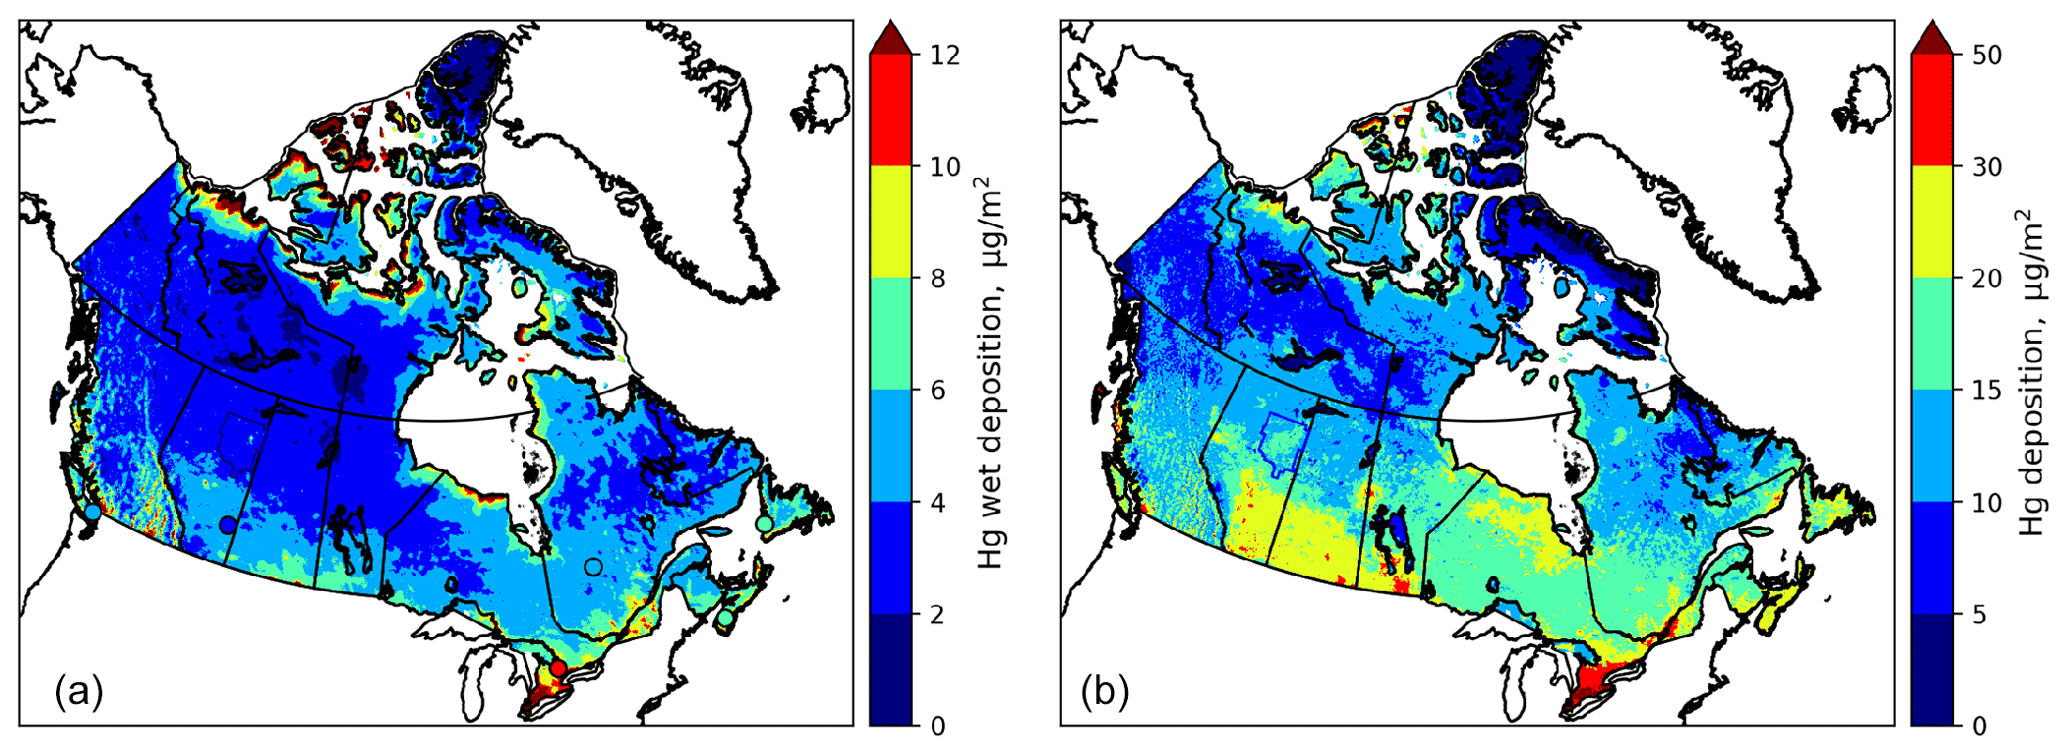
Figure 11Model-simulated and observed annual Hg wet deposition for 2013 (a) (colours in circles show observed wet deposition for 2013) and simulated annual total Hg deposition (b) (wet plus dry deposition) in Canada for 2013.
6.3 Impacts of oil sands developments and wildfires on mercury levels in air and deposition
Employing GEM-MACH-Hg, the impacts of Hg emissions from oil sands developments in the AOSR on surface air concentrations of Hg species (i.e., GEM and TOM), snowpack Hg loadings and annual Hg deposition were investigated for the years 2012–2015. Since northwest Canada is a region of high wildfire activity (Fraser et al., 2018), the relative role of Hg emissions from biomass burning in North America on the Hg burden in the AOSR was also examined.
Figures 12 and 13 provide spatial distributions of simulated annual average surface air concentrations of GEM (globally transported and the dominant ambient Hg species) and TOM (regionally transported and efficiently deposited Hg species) (left panels) for the years 2012 to 2015 along with their contributions (as percentage increases) from oil sands emissions (OSE, middle panels) and biomass burning emissions (BBE, right panels) in the AOSR and the surrounding region. GEM air concentrations were 1.4 ng m−3 in the AOSR in 2012–2015, which is within the range of GEM concentrations observed in Alberta (i.e., 1.2–1.5 ng m−3 in 2012). While annual average GEM concentrations were slightly elevated close to the major upgraders (> 1.5 within 5 km vs. 1.4 ng m−3 200 km away from AR6) in the AOSR, GEM concentrations were found to be elevated up to 1.8 ng m−3 in surrounding regions of the AOSR due to local wildfires in 2012–2015. Since the lifetime of GEM in the air is between 0.5–1 year, GEM concentrations are largely driven by global transport in the AOSR (and Canada) with only minor contributions from local emissions. Oil sands emissions increased atmospheric GEM concentrations up to 2.3 % in 2012 and 2013 and negligibly (up to 0.9 %) in low-OSE years 2014–2015, only very close to the upgraders (i.e., within 2.5 km). Wildfire activities are highly variable from year to year and can significantly impact GEM concentrations in the AOSR in summertime (Fraser et al., 2018). Biomass burning contributed to 1.0 %–2.2 % increases in average GEM concentrations in and around the AOSR (Fig. 12, right panels), making biomass burning a more important source of GEM than OSE in the region. Strong regional biomass burning events led to large increases in GEM concentrations of up to 35 % (2012–2015) in the AOSR and the surrounding regions.
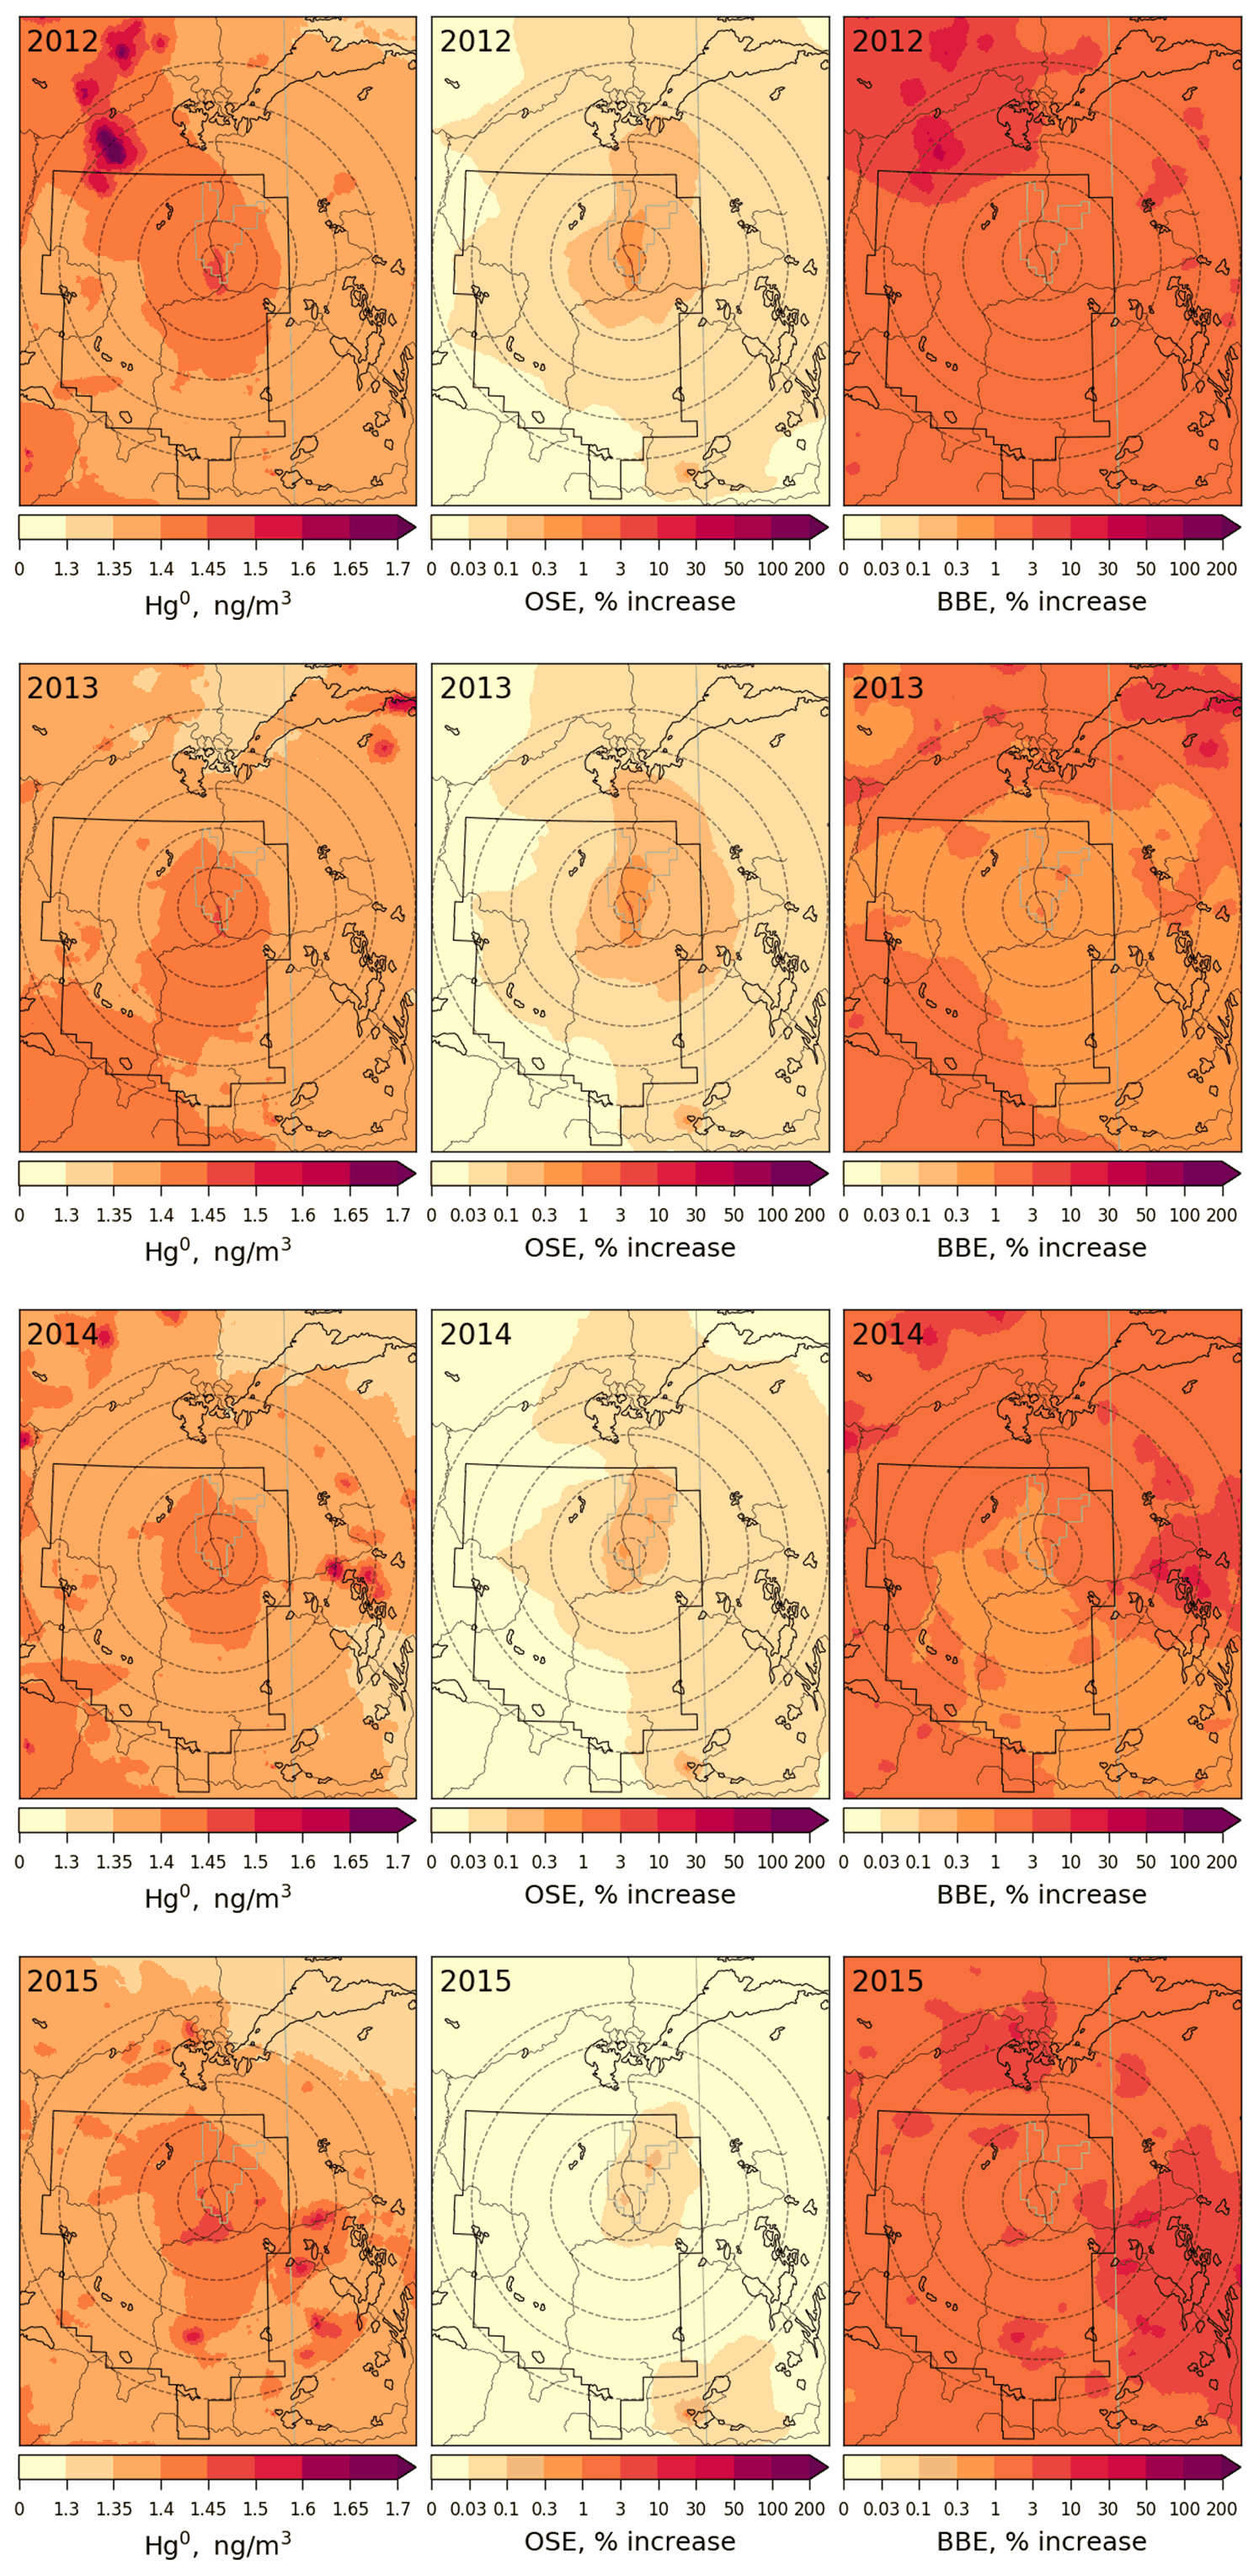
Figure 12Annual average surface air concentration of GEM (left) and concentration enrichments (%) due to Hg emissions from Athabasca oil sands operations (OSE, middle) and biomass burning in North America (BBE, right) for the years 2012 to 2015. The AOSR is marked as an approximate rectangle, and concentric distance circles are at 20, 50, 100, 150, 200 and 250 km from AR6.
While average surface air TOM concentrations in the AOSR were only 3.3 pg m−3 (consistent with observations), hot spots were modelled in the immediate vicinity of the major upgraders (> 25 pg m−3 within 5 km from AR6 in 2012–2013) in the AOSR (Fig. 13, left panels). In 2014–2015, TOM concentrations around AR6 were about half of 2012–2013 (12 pg m−3), consistent with reported changes in Hg emissions from the respective facilities. OSE are found to be the main and major contributor of oxidized Hg concentrations in surface air close to oil sands sources, increasing background concentrations over 30 % within 100 km and 60 % within 50 km from AR6 in 2012–2013, particularly in the northeast sector of the AOSR. Wildfire emissions played a minor role in ambient TOM concentrations in the region, contributing to < 1 % increases in 2012, 2013 and 2015, but increased to ∼ 6 % in 2014 as a result of higher wildfire activities. Hg emitted from oil sands operations as oxidized species is deposited efficiently by precipitation and uptake from terrestrial surfaces in the vicinity of the sources. By comparison, most of the GEM emissions are transported out of the region except for a small fraction being deposited locally via direct vegetation uptake and conversion to oxidized species and dry deposition. Oxidized Hg species emitted from global sources do not reach the AOSR via long-range transport due to their short-lived nature. As a result, OSE-related Hg deposition in the AOSR consists primarily of TOM, whereas long-range transport of GEM accounts for the deposition in the AOSR attributed to outside sources. Wildfire emissions are mostly assumed to be emitted as GEM as indicated by observations (Friedli et al., 2001).
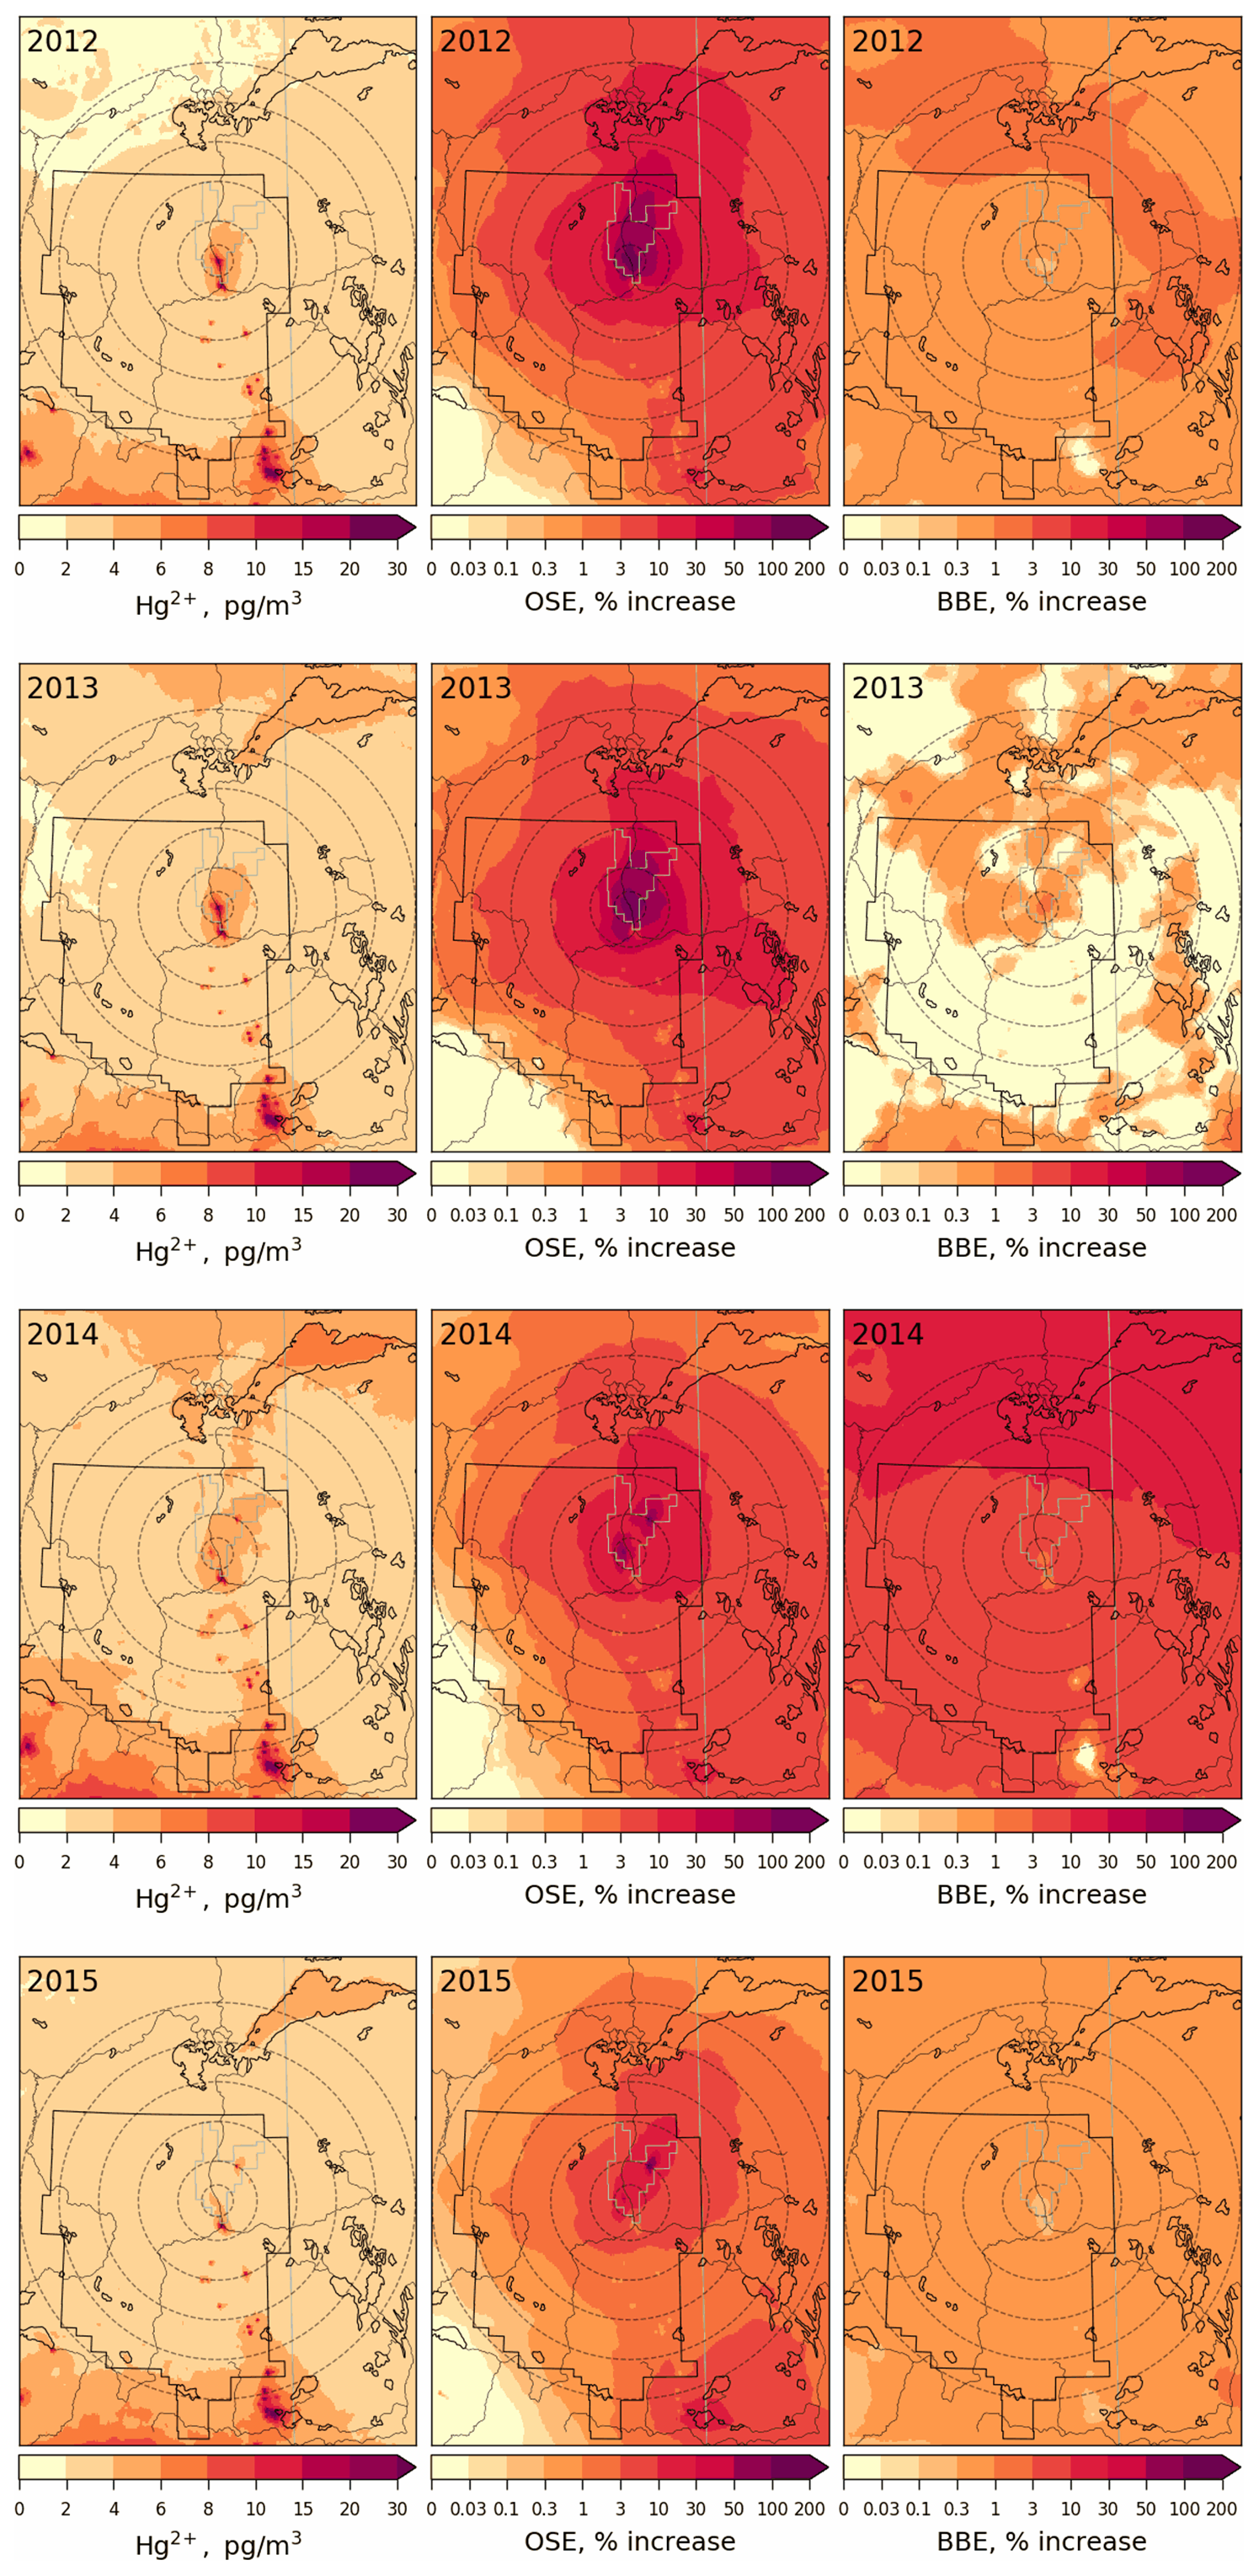
Figure 13Annual average surface air concentration of TOM (sum of GOM and PBM, left) and concentration enrichments (%) due to Hg emissions from Athabasca oil sands operation (OSE, middle) and biomass burning in North America (BBE, right) for the years 2012–2015. AOSR is marked as an approximate rectangle, and concentric distance circles are at 20, 50, 100, 150, 200 and 250 km from AR6.
Figures 14 and 15 provide spatial distributions of modelled annual total mercury deposition (Fig. 14, left panels) and seasonally accumulated Hg loadings in the snow (Fig. 15, left panels) and their source attributions to OSE (Fig. 14, middle panels; Fig. 15, right panels) and BBE (Fig. 14, right panels) in the AOSR in 2012–2015. Mercury deposition fluxes from 7–28 µg m−2 yr−1 (15.6–18.3 µg m−2 yr−1, averages) were modelled in the AOSR in 2012–2015, originating from all Hg emission sources – global primary and legacy anthropogenic and geogenic (including oil sands and biomass burning) emissions. Since the contribution of global transport of GEM to the ambient total Hg concentrations in the AOSR is much larger than the contributions of OSE and BBE (Fig. 12) and GEM concentrations are typically 2–3 orders of magnitude higher than TOM concentrations (which have higher contributions from OSE, Fig. 13), deposition of imported GEM makes up a major portion of the annual Hg deposition in the AOSR on a broad spatial scale, despite its lower Hg deposition efficiencies than TOM (Fig. 14). Similar to ambient TOM concentrations, modelling reveals the impact of OSE to Hg deposition to be greatest in the vicinity of upgraders, i.e., average increases of 17 %, 20 %, 8 % and 3 % within 20 km of AR6 in 2012, 2013, 2014 and 2015, respectively, and < 1 % beyond 50 km in all years. Model results reveal a larger impact of OSE on Hg deposition in the regions northeast of oil sands sources, consistent with observations and prevailing wind direction and speed (Kirk et al., 2014). Average Hg deposition contributions due to BBE (increases of 1.4 %–13 % ) were higher than OSE contributions (increases of 0.3 %–1.3 %) across 200 km of oil sands operations in 2012–2015. Wildfires in the region led to localized increases in Hg deposition of up to 193 % and 101 % in 2012 and 2014, especially northwest of the AOSR. Mercury emissions from electricity generation in southern Alberta accounted for a general decrease in Hg deposition fluxes from south to north around the AOSR.
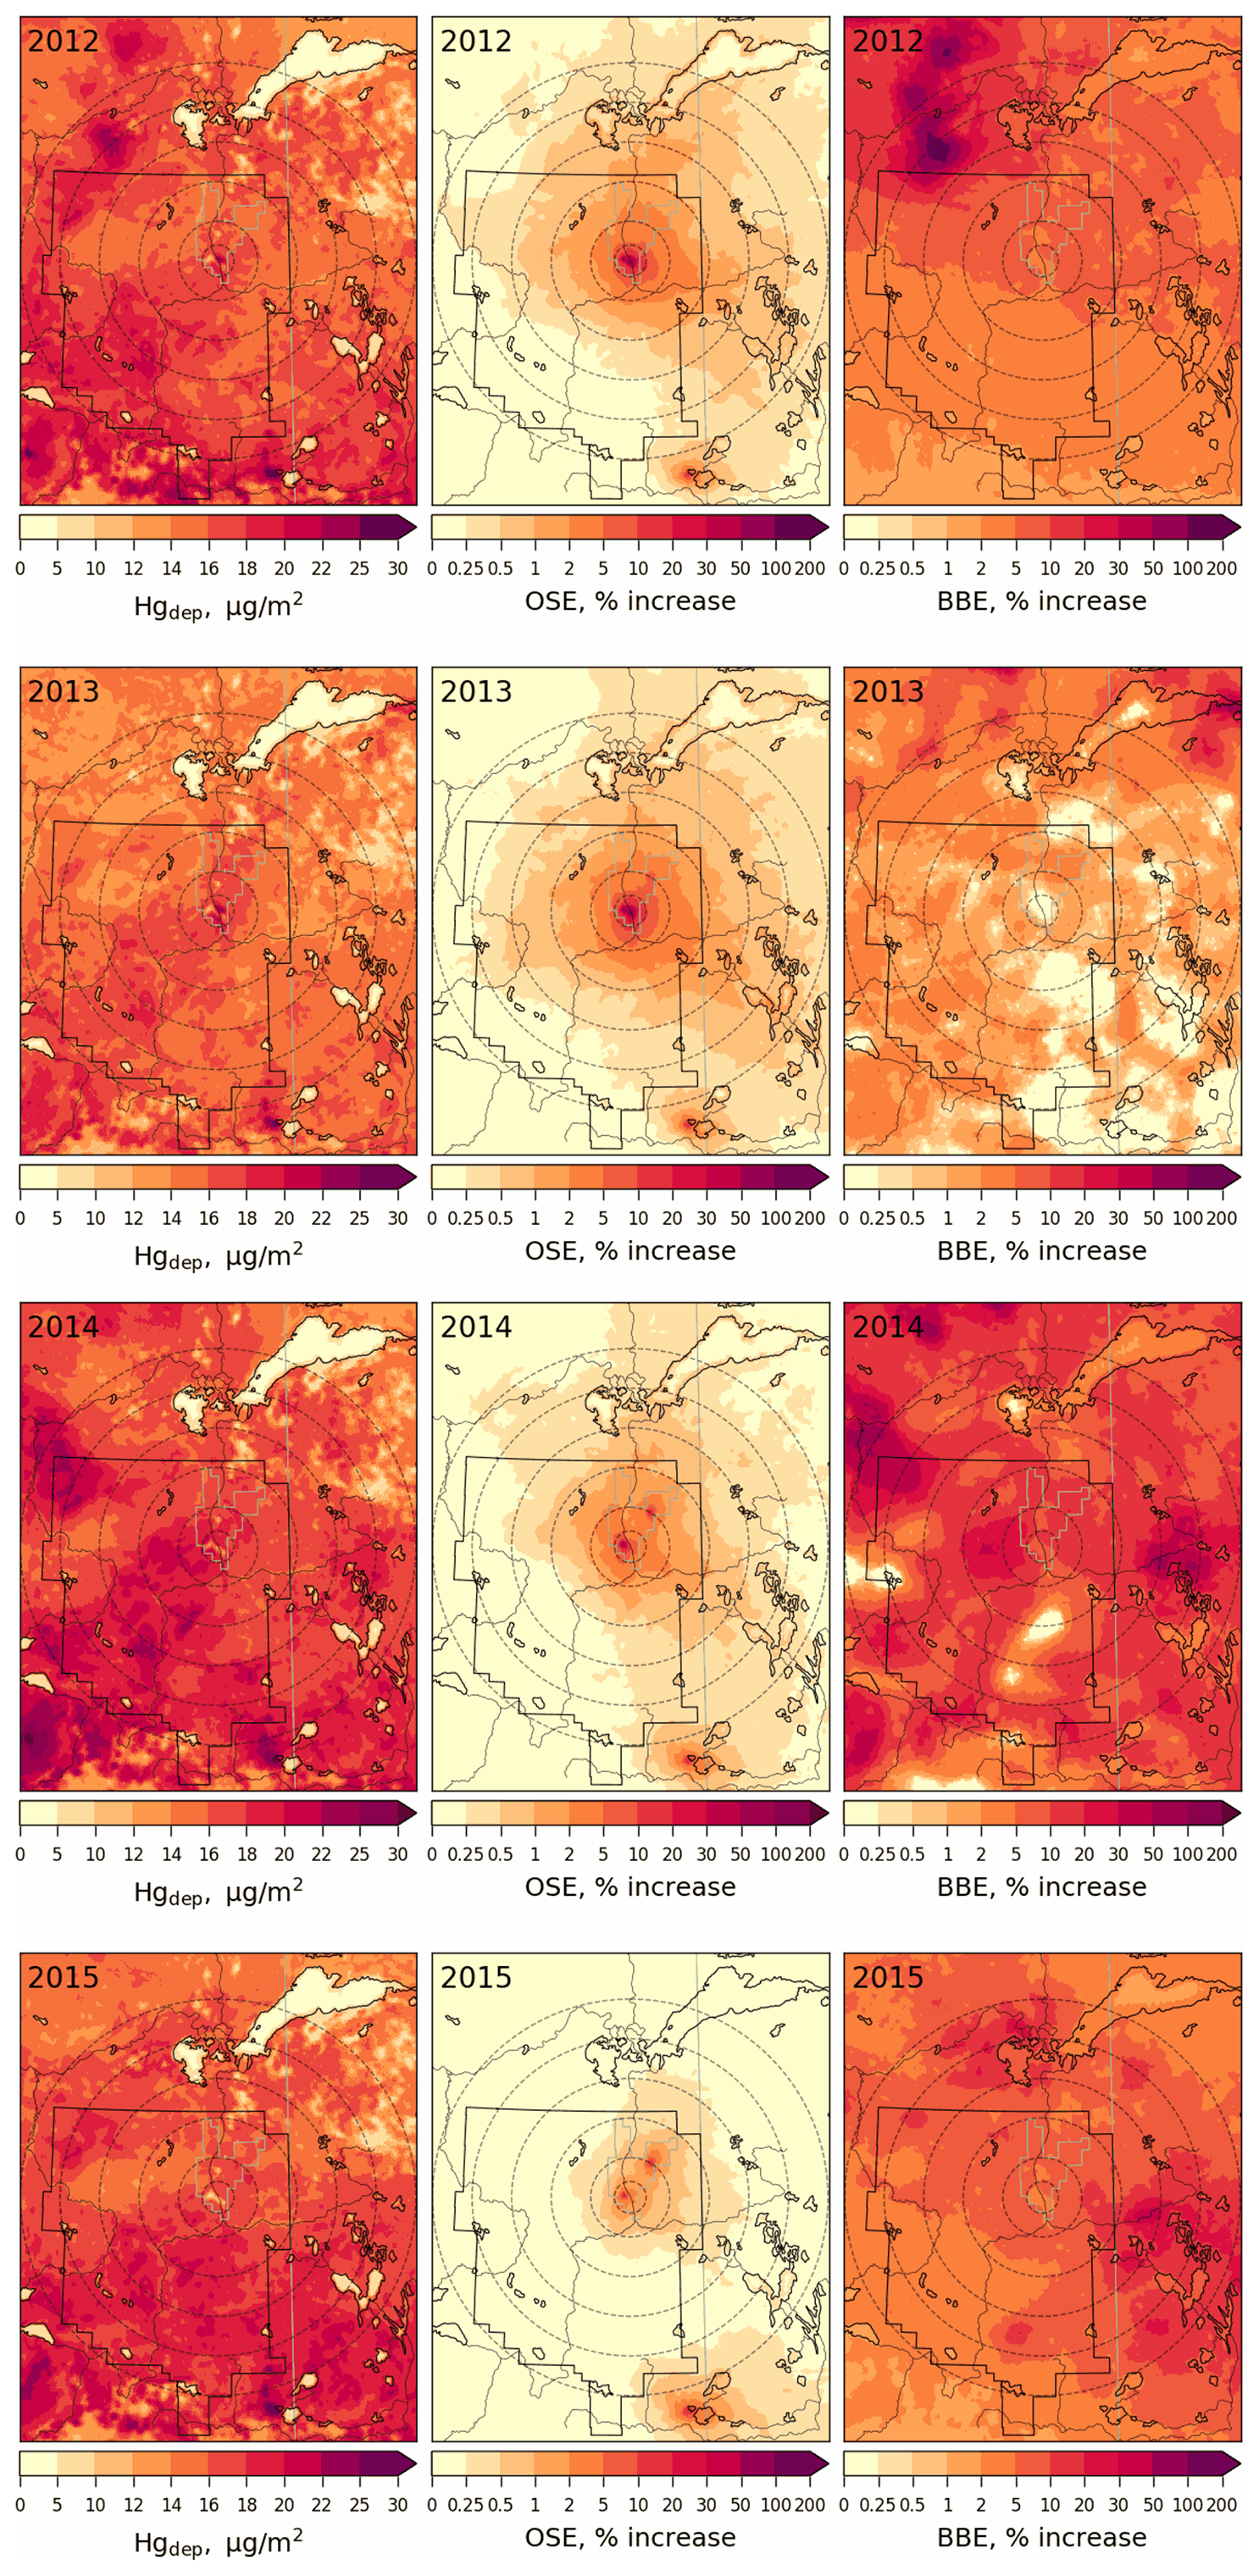
Figure 14Annual total Hg deposition flux (left) and deposition enrichments (%) due to Hg emissions from Athabasca oil sands operations (OSE, middle) and biomass burning in North America (BBE, right) in 2012–2015. The AOSR is marked as an approximate rectangle, and concentric distance circles are at 20, 50, 100, 150, 200 and 250 km from AR6.
Snowpack Hg accumulations from the start of the snow season to the end of winter (roughly coinciding with the maximum snow accumulation period) and their contributions from oil sands Hg emissions were estimated for 2012–2015 (Fig. 15). Background snow Hg loadings (without the impact of OSE, middle panels) were spatially highly variable (up to 1.4 µg m−2) in the region between 2012–2015. The higher snow Hg background levels resulted from both the regional transport of Hg from southern Alberta and spatial inhomogeneity in the accumulation of snow. Closer to OSE sources, total Hg loadings in snow reached up to 1.0 µg m−2 (< 20 km from AR6) in 2012–2014 (Fig. 15). In 2015, emissions from oil-sands-related activities were the lowest, and total Hg loadings corresponded to background emissions. The impact of OSE was notably greater on the snowpack Hg loadings, including the spatial extent, than on the annual Hg deposition (Fig. 15, right panels). Average increases of 55 %, 43 %, 35 % and 7 % in snow Hg amounts were simulated within 50 km of AR6 in 2012, 2013, 2014 and 2015, respectively, as a result of OSE. Regions northeast of the AOSR showed increases of 27 %–44 % in snow Hg levels in 2012 and 2013 and 3 %–24 % in 2014 and 2015 between 50–100 km from AR6. Model results support the conclusions of previous studies that oil sands Hg emissions have a large impact on snow Hg loadings near the oil sands emission sources with decreasing contributions away from AR6 (Kelly et al., 2010; Kirk et al., 2014). The distinctive pattern of higher snow Hg loadings in the northeast region surrounding the AOSR was also reported (Kirk et al., 2014). Model results reveal high spatiotemporal variability in background snow Hg loadings; this is related to variability in snowfall amounts and meteorological conditions affecting melting and snowpack Hg processes including redox, air–snow exchange and transport to soils.
Average annual Hg deposition fluxes in the AOSR were 13.3 (2015) to 18.5 (2013) µg m−2 yr−1 within 10 km, 15.0 (2015) to 16.9 (2013) µg m−2 yr−1 between 10–20 km, and ∼ 16 µg m−2 yr−1 50 km away from the major oil sands emission sources. In the AOSR, winter (and snow cover) can last up to 6 months (from November to April) with maximum snow depths in January–February. Winter (November–April) and summer (June–August) periods contributed to ∼ 20 % and 50 %, respectively, of annual Hg deposition in AOSR. In Fig. 16, 3 representative months in the winter (December to February) and summer (June to August) seasons, each, are chosen to present the inter-seasonal contrast in OSE impacts on Hg deposition along with the impact on annual deposition as a function of distance from AR6.
Seasonally, OSE accounted for the largest Hg deposition increases in winter months: ∼ 230 %–500 % (2013), 146 %–374 % (2012), 94 %–104 % (2014) and 40 %–43 % (2015) within 10 km; 75 % (2013), 57 % (2012), 25 % (2014) and 5 % (2015) at 20 km; and 24 %–33 % (2012–2013) and 6 %–12 % (2014–2015) at 50 km distance from the major oil sands upgraders. In summertime, lower deposition increases due to OSE were estimated, ∼ 13 %–56 % (2012–2013) and 3 %–7 % (2014–2015) within 10 km and < 7 % (2012 %–2015) at 20 km from AR6. Annually, OSE accounted for deposition increases of ∼ 24 %–70 % (2012–2013), 14 % (2014) and < 5 % (2015) within 10 km; 10 % (2012–2013) and < 5 % (2014–2015) at 20 km; and < 4 % (2012–2015) at 50 km from the major oil sands emission sources. These seasonal variations are consistent with inter-seasonal differences in Hg deposition pathways (i.e. the dominant role of GEM uptake by vegetation in summer from global sources and uptake of local TOM emissions by snowfall and snowpack as the main pathway in wintertime deposition) (Graydon et al., 2006; Obrist et al., 2016; Zhang et al., 2009). The influence of OSE on summertime and annual depositions is also more limited spatially (up to 30 km of OSE) than on wintertime deposition (up to 100 km of OSE), consistent with observations (Kirk et al, 2014; Gopalapillai et al., 2019).

Figure 15Seasonally accumulated Hg loadings in snow with all Hg emissions (left) and without Athabasca oil sands Hg emissions (middle) and enrichments (%) in seasonally accumulated Hg loadings in snow due to Athabasca oil sands Hg emissions (OSE, right) in 2012–2015. The AOSR is marked as an approximate rectangle, and concentric distance circles are at 20, 50, 100, 150, 200 and 250 km from AR6.
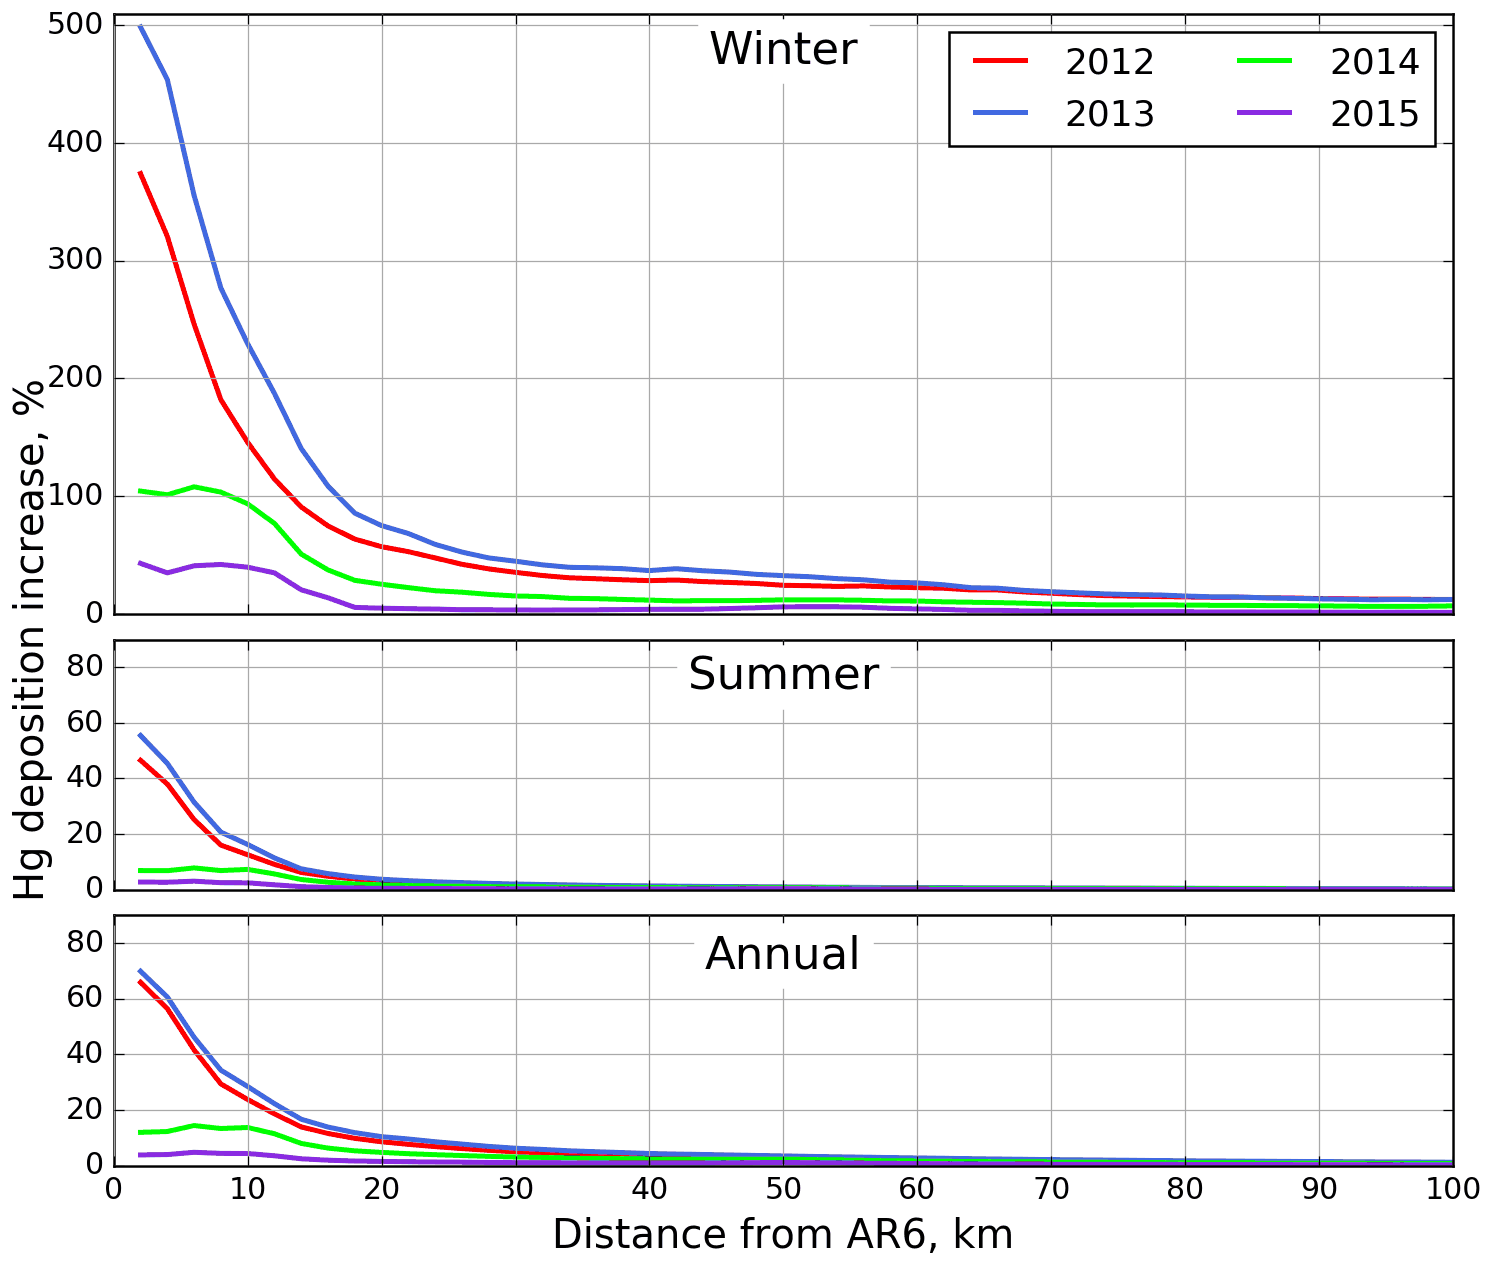
Figure 16Average Hg deposition enrichments (%) due to Athabasca oil sands emissions in winter from December to February (top), in summer from June to August (middle), and annually (bottom) for 2012 (red), 2013 (blue), 2014 (green) and 2015 (pink) by distance from AR6.
6.4 Process attribution of interannual variations in mercury deposition
The interannual differences noticed in Fig. 16 raise the question of the contributing factors to the interannual variability of Hg deposition in different seasons, especially close to the processing facilities (i.e., within a 10 and 20 km radius). The relative importance of variations in meteorological conditions and changes in OSE and BBE for the temporal changes in Hg deposition fluxes from 2012 to 2015 was analysed. Since meteorological changes are expected to occur regardless of changes in emissions, a controlled model simulation was first conducted by applying only meteorological changes from 2012 to 2015. Subsequently, two additional model simulations were performed by successively adding BBE and OSE changes from 2013–2015. The differences in these simulations provided the relative process contributions. It should be noted that, in addition to the changes in emissions, the BBE and OSE impacts on Hg deposition also depend on changes in meteorological conditions (synoptic as well as local scale); thus the results presented here are cumulative contributions of changes in meteorology and emissions. Figure 17 presents process attribution of interannual changes in winter (top), summer (middle) and annual (bottom) Hg deposition rates from 2012–2015 within 0–10 km (left) and 10–20 km (right) from AR6. The lower panels illustrate Hg deposition source contributions from global emissions (green; global anthropogenic (except oil sands), geogenic and re-emission), OSE (red) and BBE (purple), and the upper panels show process contributions of changes in meteorology (blue), oil sands (red) and biomass burning (purple) emissions to interannual changes in total Hg deposition.
While wintertime Hg deposition fluxes were relatively low (2.6–3.6 µg m−2, November–April; 0.3–0.8 µg m−2, December–February) in the AOSR, oil sands emissions were a major source of Hg deposition close to the oil sands sources as explained earlier, contributing to 70 %–80 % of deposition within 10 km of AR6 in years with high oil sands emissions (2012 and 2013). Wintertime (net) Hg deposition to northern landscapes is controlled by cryospheric processes, which exhibit strong interannual variations; therefore, interannual variation in wintertime Hg deposition is strongly controlled by meteorological conditions including snowfall amounts, wind speed, surface air temperature, solar insolation and intra-seasonal melting affecting air–snow–soil exchange processes of mercury (Faïn et al., 2013). In 2015, a large snowmelt event at the end of February effectively removed about half of the accumulated mercury in snow, resulting in much lower snow Hg content at the time of sampling (see Fig. 9).
Surface temperature and intra-seasonal melting have a large impact on how much of the deposited Hg in the snow is re-emitted back to the atmosphere and how much is adsorbed to surface soils, altering snow Hg loadings and net wintertime Hg deposition. Since 2013 experienced deeper snowpack and less inter-seasonal melting, a larger fraction of snowpack Hg was reduced and revolatilized, leading to a lower net Hg deposition despite slightly higher oil sands Hg emissions compared to 2012. Conversely, lower snowpack depth and a strong melting event at the end of February in 2015 allowed a large fraction of snowpack Hg to be transferred and retained in underlying soils, increasing net Hg deposition, particularly the background deposition contribution.
Within 10 km of major oil sands sources, wintertime variations in meteorology led to Hg deposition declines of 17 % in 2013 and 2014 and increases of 10 % in 2015 along with OSE-led deposition declines of 10 % (2013), 35 % (2014) and 56 % (2015). When combined, the net effect of these two factors was overall reductions in wintertime Hg deposition fluxes of 27 % (2013), 52 % (2014) and 46 % (2015), relative to 2012. At a distance of 10–20 km from the oil sands sources, changes in meteorology led to a 54 % increase in wintertime Hg deposition in 2015, but the overall deposition only increased by 19 %, because the decline in oil sands Hg emissions reduced the deposition by 35 %. River discharge rates and Hg concentrations are reported to be highest in the spring meltwater flood (between 3 and 16 ng L−1, up from typically < 2 ng L−1 at their lowest annual level) in tributaries of the Athabasca River and pose risk to the downstream environments (Kelly et al., 2010; Wasiuta et al., 2019). Since the ground is still frozen at the time of spring freshet, Hg runoff is derived from seasonal snowpack loadings and mobilization of Hg from surface soils, both of which are contaminated by oil sands emissions in proximity of the sources and show a sensitivity to changes in Hg emissions from oil sands developments.
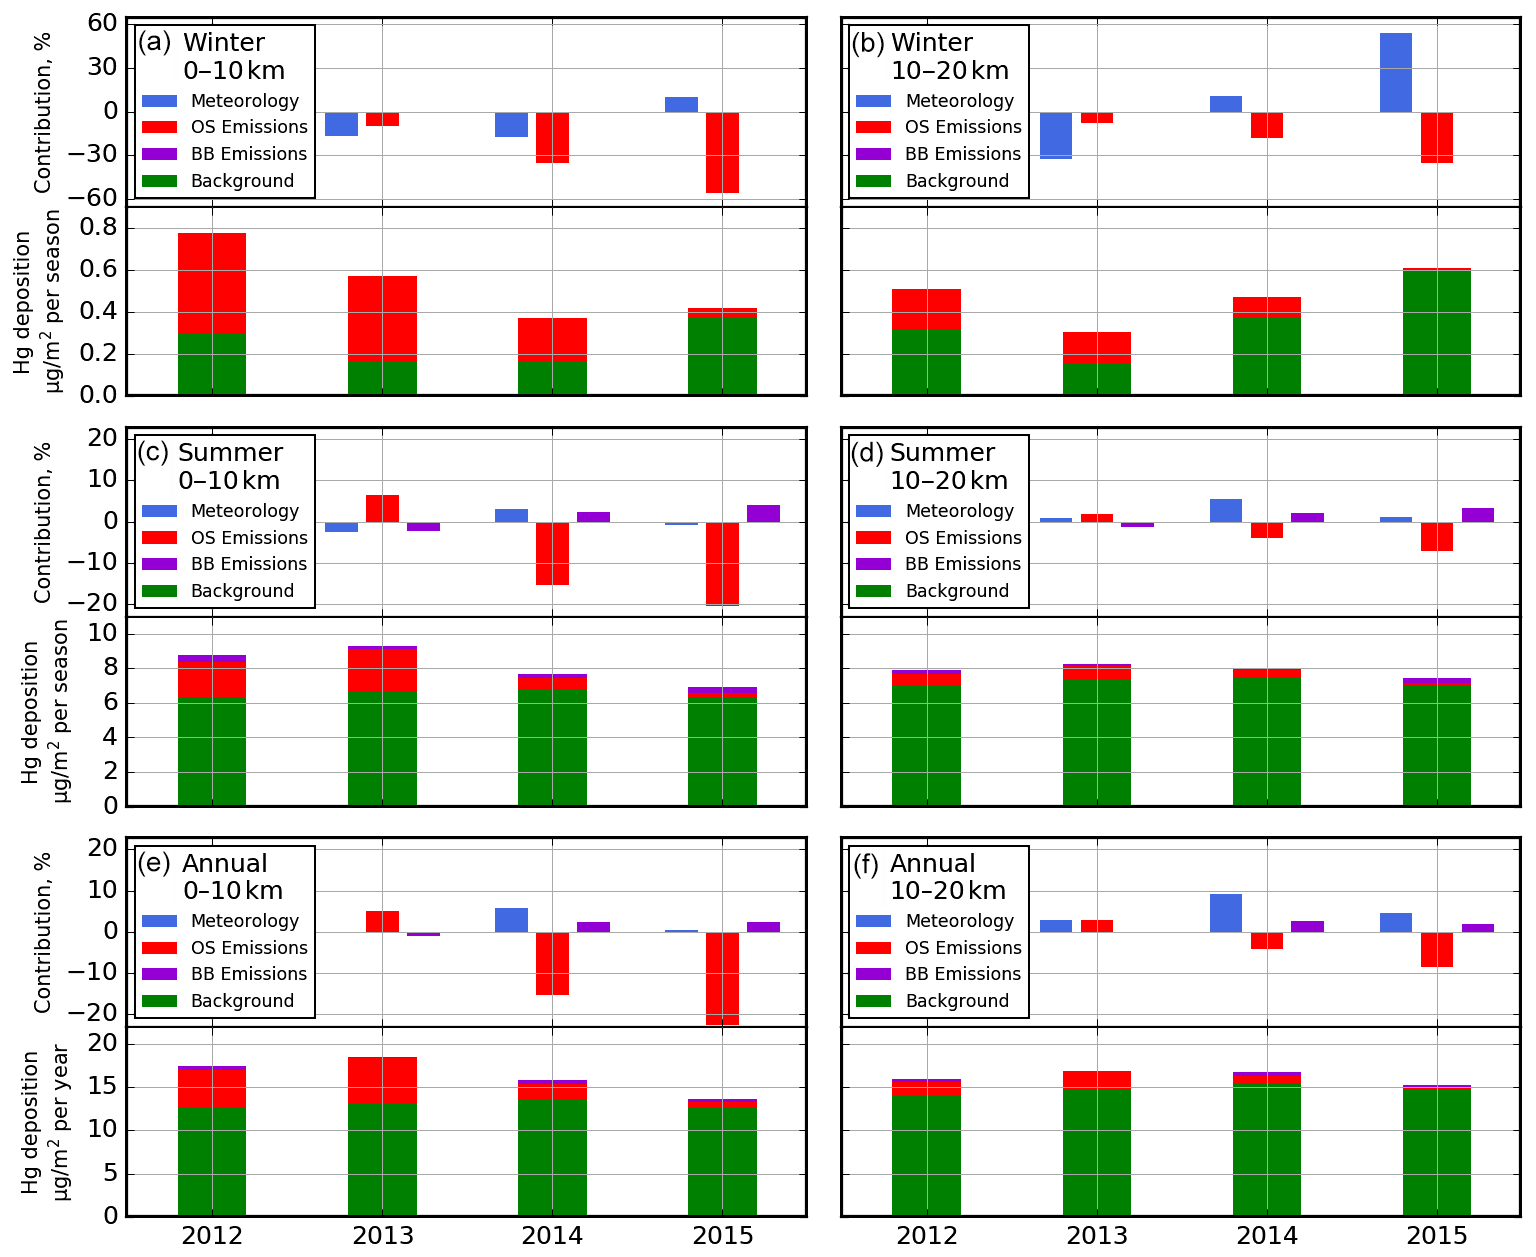
Figure 17(a, b) December–February, (c, d) June–August and (e, f) yearly averaged source apportionment of total Hg depositions in 2012–2015 and contributions of changes in meteorology, Athabasca oil sands emissions and biomass burning emissions (only in summer) (a, b) to the changes in total Hg depositions in 2013–2015 relative to 2012, within 10 km (a, c, e) and 10–20 km (b, d, f) of AR6.
Compared to winter, AOSR summertime background Hg deposition fluxes were significantly higher (∼ 6.3–7.5 µg m−2, 2012–2015) and less variable in space and time, and OSE contributions to total deposition were relatively lower (∼ 0.05–0.5 µg m−2 within 10 km and 0.01–0.2 µg m−2 from 10–20 km, 2012–2015). In addition, summertime biomass burning emissions contributed to Hg deposition of 0.1–0.4 µg m−2 (2012–2015). Summertime Hg deposition to terrestrial systems is temporally less variable than wintertime deposition as it is predominantly driven by Hg uptake by vegetation and soils followed by wet deposition. Changes in oil sands emissions played a more significant role than the meteorological factors in summertime inter-annual Hg deposition variations. Compared to 2012, changes in meteorology, biomass burning and oil sand emissions, respectively, led to changes in summertime Hg deposition fluxes by −3 %, −2 % and +7 % in 2013; +3 %, +2 % and −15 % in 2014; and −1 %, +4 % and −20 % in 2015, resulting in overall changes in Hg deposition by +2 % (2013), −10 % (2014) and −17 % (2015), within 10 km of major oil sands sources. Interannual variations in precipitation amounts and its impact on the wet deposition of Hg was the primary reason for the meteorology-related changes in summertime Hg deposition fluxes.
Since summertime deposition contributes to about half of the annual deposition, interannual changes and their responsible factors in annual Hg deposition fluxes had a similar pattern as summer, with a relatively larger impact of changes in OSE on Hg deposition fluxes in the immediate vicinity of oil sands sources. Relative to 2012, deposition increases were 6 (2014) and 1 % (2015) due to variations in meteorology and 2 % (2014–2015) due to biomass burning, and deposition declines were 15 (2014) and 23 % (2015) due to reduction in oil sands Hg emissions. This results in overall reductions in annual Hg depositions of 7 (2014) and 20 % (2015) within 10 km of AR6. These model results demonstrate that reduction in Hg emissions from oil sands processing activities lead to measurable declines in mercury deposition fluxes in AOSR. Further away from sources (right panel, Fig. 17), the changes in meteorology and oil sands emissions resulted in comparable changes in Hg deposition rates (+9 (2014) and +5 % (2015), meteorology; −4 (2014) and −9 % (2015), OSE) along with 3 (2014) and 2 (2015) % increases in deposition due to BBE, resulting in relatively smaller overall changes (+8 % (2014) and −2 % (2015)) in Hg deposition fluxes. Interestingly, land clearing in the AOSR contributes to reduced background Hg deposition fluxes due to the reduction in foliage Hg uptake; average background Hg deposition fluxes were about 1 µg m−2 lower within 10 km compared to Hg deposition fluxes 20 km away from the major oil sands activities.
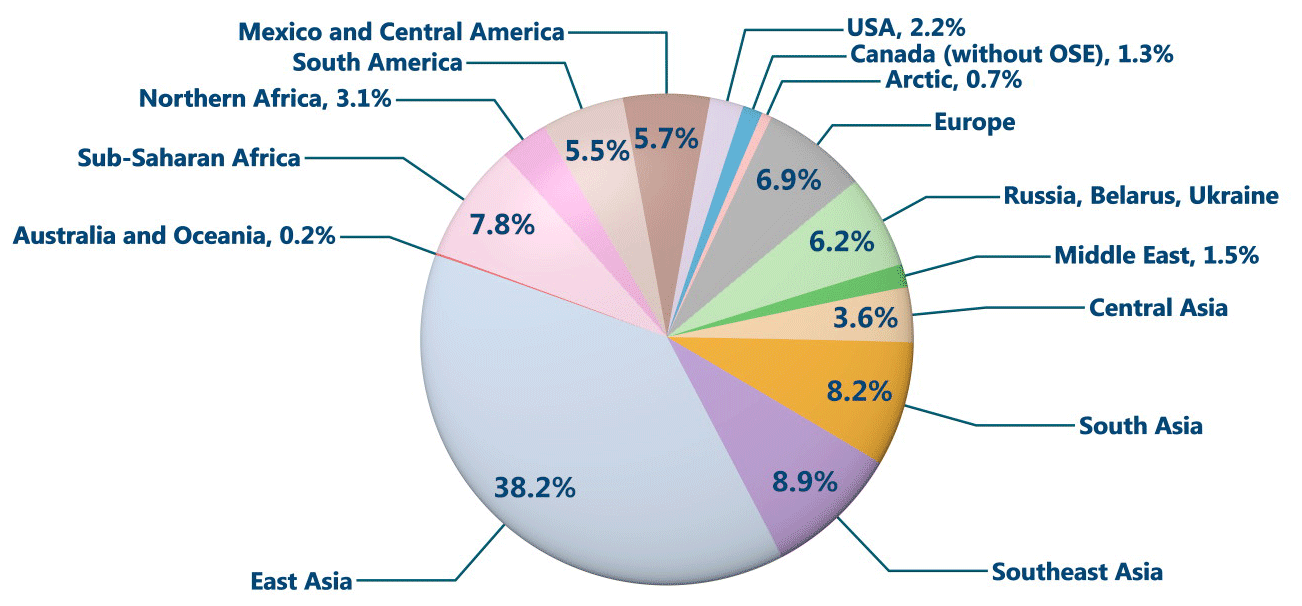
Figure 18Deposition contributions from global anthropogenic source regions (excluding Athabasca oil sands Hg emissions) to the average contemporary anthropogenic Hg deposition portion (40 % of total deposition) of the total deposition in Athabasca oil sands region in 2015.
6.5 Source apportionment of the background mercury deposition
As noticed in Figs. 14–16, background Hg (long-range transport from global source regions; excludes impact of oil sands emissions but includes impact of all other Hg emissions in Canada) is responsible for the majority of annual Hg deposition in the AOSR (except in winter in the vicinity of major oil sands Hg emission sources). The average annual background Hg deposition in the AOSR was 15.3–16.7 µg m−2 yr−1 in 2012–2015. This includes ∼ 40 % deposition from contemporary global anthropogenic Hg emissions (excluding Hg emissions from Athabasca oil sands activities) and ∼ 60 % from global geogenic emissions and re-emissions of legacy mercury deposition (of both anthropogenic and geogenic origin). The model was applied to investigate the relative proportions of background anthropogenic Hg deposition fluxes contributed from various worldwide emission source regions, including Canada, in the AOSR (Fig. 18). Almost 50 % of the background anthropogenic Hg deposition originated from East and Southeast Asia, a region of high economic activity and high energy demand, which is sourced for the most part by coal-fired power plants. The model estimated that foreign anthropogenic sources accounted for over 98 % of the background anthropogenic Hg deposition in the AOSR of which present-day emissions in East Asia, Southeast Asia, South Asia, sub-Saharan Africa, Europe and the United States contributed to approximately 38 %, 9 %, 8 %, 8 %, 7 % and 2 %, respectively. Emissions from present-day anthropogenic sources in Canada (excluding oil sands sources in AOSR) contributed to < 2 % of the background anthropogenic Hg deposition nationally including the AOSR. In proximity of oil sands activities, oil sand Hg emissions are a significant source of Hg deposition as demonstrated earlier in this study. By comparison, oil sands developments currently have a negligible impact on Hg deposition on a broader spatial scale in Canada. These results highlight the need for worldwide mitigation efforts, in addition to the local efforts, to reduce the risks of mercury contamination in the AOSR.
An assessment of mercury levels in air and deposition in the Athabasca oil sands region (AOSR) in Northern Alberta, Canada, was conducted to investigate the contribution of Hg emitted from oil sands activities to the surrounding landscape using a 3D process-based Hg model in 2012–2015. The model-simulated Hg burden in the region was first evaluated with multi-year observations of air concentrations of Hg and seasonally accumulated Hg in snow. Modelled surface air Hg concentrations and snow Hg loadings in AOSR matched measured values within the measurement and modelling uncertainty range and suggest that NPRI-reported emissions of Hg from oil sands operations are consistent with Hg burden in the region. Air concentrations of Hg(0) in the AOSR (1.4 ng m−3) were at a similar level as found in Northern Alberta and were within the range of concentrations in Canada (1.2–1.6 ng m−3). Background Hg(0) concentrations in Canada are dominated by long-range transport, with a slightly larger impact in the west, and, thus, contribution of oil sands activities to Hg(0) concentrations in AOSR was minimal (< 0.1 %, average enrichment). During the summer season, Hg emissions originating from regional wildfires were found to be an episodically important source of atmospheric Hg(0), with daily averaged concentrations peaking to 2.5 ng m−3 (Parsons et al., 2013; Fraser et al., 2018). Average total oxidized Hg concentrations (gaseous plus particulate) in the air were elevated above background by 55 % and 65 % in 2012 and 2013, respectively, and over 10 % in 2015 within 50 km of upgrading facilities (particularly in the northeast sector) in the AOSR as a result of oil sands emissions.
The level and spatial extent of the impact of oil sands emissions to winter, summer and annual Hg deposition fluxes were examined in years with high (2012–2013) and low (2014–2015) oil sands Hg emissions. Annual average total Hg deposition fluxes of 15.6–18.3 µg m−2 yr−1 were simulated in AOSR, with deposition in winter (November–April) and summer (June–August) contributing to 20 % and 50 %, respectively. The emission sources of Hg deposition in the AOSR are global anthropogenic (including Canadian emissions), natural and reemissions of legacy Hg deposition (including biomass burning emissions). Similar to other regions in Canada, on a broader scale, Hg deposition in the AOSR is dominated by mercury transported from global sources, with a small (and highly spatiotemporal variable) impact from regional biomass burning events. In proximity to oil sands sources, however, total Hg deposition in wintertime was largely driven by oil sands emissions. Deposition increases of up to 146 %–500 % occurred within 10 km of oil sands sources in the high-emission years 2012 and 2013; summertime and annual Hg deposition increases due to oil sands emissions were 13 %–56 % and 24 %–70 %, respectively, within 10 km of sources for the same years. In years with lower oil sands emissions (2014 and 2015), Hg deposition increases due to oil sands activities declined to 40 %–104 % in winter and 5 %–14 % annually within 10 km of oil sands sources. At 20 km from the oil sands operations, oil-sands-related Hg deposition enhancements were not as large, with increases of 57 %–75 % in winter and 10 % annually in 2012 and 2013. The spatial extent of the OSE influence on Hg deposition was also greater in winter relative to summer (∼ 100 km vs. 30 km from major Hg-emitting facilities).
Finally, factors contributing to the inter-annual variations (i.e., changes in meteorological conditions, oil sands emissions and wildfire emissions) in seasonal and annual Hg deposition fluxes and relative source attributions in AOSR were examined from 2012 to 2015. Wintertime (net) Hg deposition to northern landscapes is controlled by Hg deposition to snowpacks by direct uptake and via snowfall and post-depositional processes, which exhibit strong inter-annual variations. In winter, within 10 km of major oil sands sources, relative to 2012, variations in meteorology led to Hg deposition reduction by 17 % in 2014 and increase by 10 % in 2015, and decline in OSE lowered Hg deposition by 35 % (2014) and 56 % (2015), resulting in overall reductions in wintertime Hg deposition of 52 % (2014) and 46 % (2015). Gopalapillai et al. (2019) reported temporal decline in near-field snowpack total Hg loadings from an average load of 510 to 175 ng m−2 (2008 to 2016). At a distance of 10–20 km from the oil sands sources, changes in meteorology led to a 54 % increase in wintertime deposition in 2015 relative to 2012, and the decline in oil sands emissions led to a reduction in the deposition by 35 %, resulting in an overall increase in Hg deposition of 19 %. In summer, Hg deposition was temporally less variable, and changes in oil sands emissions played a more significant role in inter-annual variations in Hg deposition than the meteorological factors. Compared to 2012, changes in meteorology, biomass burning and oil sand emissions led to changes in summertime deposition by −3 %, −2 % and +7 % in 2013; +3 %, +2 % and −15 % in 2014; and −1 %, +4 % and −20 % in 2015, resulting in overall changes in Hg deposition by +2 %, −10 % and −17 % in 2013, 2014 and 2015, respectively, within 10 km of major oil sands sources. By comparison, annually, changes in meteorology and BBE in 2014–2015 (relative to 2012) led to Hg deposition increases of 1 %–6 % and 2 %, respectively, and decline in OSE lowered deposition by 15 %–22 %, resulting in overall reduction in Hg deposition of 7 %–20 % within 10 km of oil sands sources.
Oil sands Hg emissions are found to be important sources of Hg contamination to the local landscape in proximity of the processing activities, particularly in wintertime. Although Hg deposition is higher in summertime (mainly driven by long-range transport), oil sands Hg emissions contribute to a notably higher proportion of deposition in wintertime in the AOSR. Thus, the impact of oil sands emissions is more easily detected in snow Hg observations (Kirk et al., 2014). Wintertime Hg deposition rates are also more influenced by interannual changes in meteorological conditions compared to summer. Regarding the environmental importance of seasonal Hg deposition, it is likely that a major portion of summertime deposition remains bound to vegetation and subsequently transferred to soils, where it can be partially sequestered and partly reemitted back to air or mobilized in aquatic systems on long timescales of decades to centuries (Zhou et al., 2021). In contrast, wintertime deposition (and partially summertime wet deposition) can be transferred to the local aquatic system via runoff more readily (i.e, on an annual timescale). Model findings reveal that year-to-year changes in meteorological conditions not only significantly influence the rate of Hg deposition but, additionally, can either exacerbate or diminish the impact of changes in oil sands emissions on Hg deposition, particularly in winter. Thus, meteorological changes can confound the interpretation of trends in short-term monitoring data. In addition, meteorological changes related to climate change can influence the deposition trends. Accurate reporting of point and area Hg emissions related to oil sands activities, long-term monitoring of Hg in air and terrestrial ecosystems, and the application of process-based Hg models are crucial to understanding systematic changes in Hg levels and their causes in the AOSR.
GEM-MACH, the atmospheric chemistry library for the GEM numerical atmospheric model (© 2007–2013, Air Quality Research Division and National Prediction Operations Division, Environment and Climate Change Canada), is free software which can be redistributed and/or modified under the terms of the GNU Lesser General Public License as published by the Free Software Foundation – either version 2.1 of the license or any later version. The specific GEM-MACH-Hg version used in this work may be obtained on request to Ashu Dastoor (ashu.dastoor@canada.ca)
The emissions data used in the model may be obtained by contacting Junhua Zhang (junhua.zhang@canada.ca). The air monitoring network data are publicly available from the ECCC data portal (ECCC, 2021). The precipitation monitoring network data are publicly available from the Canadian Acid Precipitation Monitoring Network (CAPMoN, 2021). Snowpack data are accessible upon request to Jane Kirk (jane.kirk@canada.ca). The model results are available upon request to Ashu Dastoor (ashu.dastoor@canada.ca).
AD was responsible for the study concept and design, analysis of model simulations, and writing the manuscript. AR was responsible for GEM-MACH-Hg set-up and simulations, model evaluation, analysis, and graphics. GK was responsible for writing the manuscript. JZ was responsible for the creation of emissions files used in the model. JK was responsible for the provision of snowpack data. MP and AS were responsible for the provision of atmospheric data. All authors contributed to the editing of the manuscript.
The authors declare that they have no conflict of interest.
Publisher's note: Copernicus Publications remains neutral with regard to jurisdictional claims in published maps and institutional affiliations.
This article is part of the special issue “Research results from the 14th International Conference on Mercury as a Global Pollutant (ICMGP 2019), MercOx project, and iGOSP and iCUPE projects of ERA-PLANET in support of the Minamata Convention on Mercury (ACP/AMT inter-journal SI)”. It is not associated with a conference.
We thank our ECCC colleagues Paul Makar, Sandro Leonardelli and Stewart Cober and in the Pollutant Inventory and Reporting Division for their insightful comments and careful internal review of the manuscript.
This work was partially funded under the Oil Sands Monitoring (OSM) Program. It is independent of any position of the OSM Program.
This paper was edited by Aurélien Dommergue and reviewed by two anonymous referees.
Alexander, A. C. and Chambers, P. A.: Assessment of seven Canadian rivers in relation to stages in oil sands industrial development, 1972–2010, Environ. Rev., 24, 484–494, https://doi.org/10.1139/er-2016-0033, 2016.
AMAP and UNEP: Technical Background Report for the Global Mercury Assessment 2013, Arctic Monitoring and Assessment Programme, Oslo, Norway/UNEP Chemicals Branch, Geneva, Switzerland, 263 pp., 2013.
Angot, H., Dastoor, A., De Simone, F., Gårdfeldt, K., Gencarelli, C. N., Hedgecock, I. M., Langer, S., Magand, O., Mastromonaco, M. N., Nordstrøm, C., Pfaffhuber, K. A., Pirrone, N., Ryjkov, A., Selin, N. E., Skov, H., Song, S., Sprovieri, F., Steffen, A., Toyota, K., Travnikov, O., Yang, X., and Dommergue, A.: Chemical cycling and deposition of atmospheric mercury in polar regions: review of recent measurements and comparison with models, Atmos. Chem. Phys., 16, 10735–10763, https://doi.org/10.5194/acp-16-10735-2016, 2016.
APEI: Government of Canada, Air Pollutant Emissions Inventory, available at: https://www.canada.ca/en/environment-climate-change/services/pollutants/air-emissions-inventory-overview.html, last access: 25 July 2019.
Bieser, J., Slemr, F., Ambrose, J., Brenninkmeijer, C., Brooks, S., Dastoor, A., DeSimone, F., Ebinghaus, R., Gencarelli, C. N., Geyer, B., Gratz, L. E., Hedgecock, I. M., Jaffe, D., Kelley, P., Lin, C.-J., Jaegle, L., Matthias, V., Ryjkov, A., Selin, N. E., Song, S., Travnikov, O., Weigelt, A., Luke, W., Ren, X., Zahn, A., Yang, X., Zhu, Y., and Pirrone, N.: Multi-model study of mercury dispersion in the atmosphere: vertical and interhemispheric distribution of mercury species, Atmos. Chem. Phys., 17, 6925–6955, https://doi.org/10.5194/acp-17-6925-2017, 2017.
Bloom, N. S. and Crecelius, E. A.: Determination of mercury in seawater at sub-nanogram per liter levels, Mar. Chem., 14, 49–59, https://doi.org/10.1016/0304-4203(83)90069-5, 1983.
CAPMoN: Canadian Acid Precipitation Monitoring Network, available at: https://www.canada.ca/en/environment-climate-change/services/air-pollution/monitoring-networks-data/canadian-air-precipitation.html, last access: 16 August 2021.
CMSA: Canadian Mercury Science Assessment 2016, Clean Air Regulatory Agenda, 437–556, 2016.
Cooke, C. A., Kirk, J. L., Muir, D. C. G., Wiklund, J. A., Wang, X., Gleason, A., and Evans, M. S.: Spatial and temporal patterns in trace element deposition to lakes in the Athabasca oil sands region (Alberta, Canada), Environ. Res. Lett., 12, https://doi.org/10.1088/1748-9326/aa9505, 2017.
Dastoor, A. P. and Durnford, D. A.: Arctic Ocean: Is it a sink or a source of atmospheric mercury?, Environ. Sci. Technol., 48, 1707–1717, https://doi.org/10.1021/es404473e, 2014.
Dastoor, A. P., Davignon, D., Theys, N., Van Roozendael, M., Steffen, A., and Ariya, P. A.: Modeling dynamic exchange of gaseous elemental mercury at polar sunrise, Environ. Sci. Technol., 42, 5183–5188, 2008.
Dastoor, A., Ryzhkov, A., Durnford, D., Lehnherr, I., Steffen, A., and Morrison, H.: Atmospheric mercury in the Canadian Arctic. Part II: insight from modeling, Sci. Total Environ., 509–510, 16–27, https://doi.org/10.1016/j.scitotenv.2014.10.112, 2015.
De Simone, F., Cinnirella, S., Gencarelli, C. N., Yang, X., Hedgecock, I. M., and Pirrone, N.: Model study of global mercury deposition from biomass burning, Environ. Sci. Technol., 49, 6712–6721, 2015.
Durnford, D., Dastoor, A., Figueras-Nieto, D., and Ryjkov, A.: Long range transport of mercury to the Arctic and across Canada, Atmos. Chem. Phys., 10, 6063–6086, https://doi.org/10.5194/acp-10-6063-2010, 2010.
Durnford, D., Dastoor, A., Ryzhkov, A., Poissant, L., Pilote, M., and Figueras-Nieto, D.: How relevant is the deposition of mercury onto snowpacks? – Part 2: A modeling study, Atmos. Chem. Phys., 12, 9251–9274, https://doi.org/10.5194/acp-12-9251-2012, 2012.
ECCC: Environment and Climate Change Canada, Oil Sands Data Portal, available at: https://www.canada.ca/en/environment-climate-change/services/oil-sands-monitoring/monitoring-air-quality-alberta-oil-sands.html, last access: 16 August 2021.
Eckley, C. S., Parsons, M. T., Mintz, R., Lapalme, M., Mazur, M., Tordon, R., Elleman, R., Graydon, J. A., Blanchard, P., and St Louis, V.: Impact of closing Canada's largest point-source of mercury emissions on local atmospheric mercury concentrations, Environ. Sci. Technol., 47, 10339–10348, https://doi.org/10.1021/es401352n, 2013.
Emmerton, C. A., Cooke, C. A., Wentworth, G. R., Graydon, J. A., Ryjkov, A., and Dastoor, A.: Total Mercury and Methylmercury in Lake Water of Canada's Oil Sands Region, Environ. Sci. Technol., 52, 10946–10955, https://doi.org/10.1021/acs.est.8b01680, 2018.
EPA: Method 1669: sampling ambient water for trace metals at EPA water quality criteria levels, Washington, D.C., United States, Environmental Protection Agency, Office of Water, Engineering and Analysis Division, 1996.
EPA: United States Government: EPA Air Emissions Inventories, available at: https://www.epa.gov/air-emissions-inventories, last access: 25 July 2019.
Faïn, X., Helmig, D., Hueber, J., Obrist, D., and Williams, M. W.: Mercury dynamics in the Rocky Mountain, Colorado, snowpack, Biogeosciences, 10, 3793–3807, https://doi.org/10.5194/bg-10-3793-2013, 2013.
Fraser, A., Dastoor, A., and Ryjkov, A.: How important is biomass burning in Canada to mercury contamination?, Atmos. Chem. Phys., 18, 7263–7286, https://doi.org/10.5194/acp-18-7263-2018, 2018.
Friedli, H. R., Radke, L. F., and Lu, J. Y.: Mercury in smoke from biomass fires, Geophys. Res. Lett., 28, 3223–3226, 2001.
GoC: Government of Canada, Historical Climate Data, available at: https://climate.weather.gc.ca, last access: 19 February 2019.
Gopalapillai, Y., Kirk, J. L., Landis, M. S., Muir, D. C. G., Cooke, C. A., Gleason, A., Ho, A., Kelly, E., Schindler, D., Wang, X., and Lawson, G.: Source Analysis of Pollutant Elements in Winter Air Deposition in the Athabasca Oil Sands Region: A Temporal and Spatial Study, ACS Earth Space Chem. 3, 1656–1668, https://doi.org/10.1021/acsearthspacechem.9b00150, 2019.
Graydon, J. A., St. Louis, V. L., Lindberg, S. E., Hintelmann, H., and Krabbenhoft, D. P.: Investigation of Mercury Exchange between Forest Canopy Vegetation and the Atmosphere Using a New Dynamic Chamber, Environ. Sci. Technol., 40, 4680–4688, https://doi.org/10.1021/es0604616, 2006.
Gustin, M. S., Huang, J., Miller, M. B., Peterson, C., Jaffe, D. A., Ambrose, J., Finley, B. D., Lyman, S. N., Call, K., Talbot, R., Feddersen, D., Mao, H., and Lindberg, S. E.: Do We Understand What the Mercury Speciation Instruments Are Actually Measuring? Results of RAMIX., Environ. Sci. Technol., 47, 7295–7306, https://doi.org/10.1021/es3039104, 2013.
Gustin, M. S., Amos, H. M., Huang, J., Miller, M. B., and Heidecorn, K.: Measuring and modeling mercury in the atmosphere: a critical review, Atmos. Chem. Phys., 15, 5697–5713, https://doi.org/10.5194/acp-15-5697-2015, 2015.
Jia, L.: Oil Sands Bitumen Emulsion Upgrading by Using In Situ Hydrogen Generated through the Water Gas Shift Reaction, PhD Thesis, University of Waterloo, Waterloo, ON, Canada, available at: http://hdl.handle.net/10012/8969 (last access: 17 August 2021), 2014.
Kelly, E. N., Schindler, D. W., Hodson, P. V., Short, J. W., Radmanovich, R., and Nielsen, C. C.: Oil sands development contributes elements toxic at low concentrations to the Athabasca River and its tributaries, P. Natl. Acad. Sci. USA, 107, 16178–16183, https://doi.org/10.1073/pnas.1008754107, 2010.
Kirk, J. L., Muir, D. C. G., Gleason, A., Wang, X., Lawson, G., Frank, R. A., Lehnherr, I., and Wrona, F.: Atmospheric deposition of mercury and methylmercury to landscapes and waterbodies of the Athabasca oil sands region, Environ. Sci. Technol., 48, 7374–7383, 2014.
Kos, G., Ryzhkov, A., Dastoor, A., Narayan, J., Steffen, A., Ariya, P. A., and Zhang, L.: Evaluation of discrepancy between measured and modelled oxidized mercury species, Atmos. Chem. Phys., 13, 4839–4863, https://doi.org/10.5194/acp-13-4839-2013, 2013.
Larter, S. R. and Head, I. M.: Oil sands and heavy oil: origin and exploitation, Elements, 10, 277–283, 2014.
Lynam, M., Dvonch, J. T., Barres, J., and Percy, K.: Atmospheric wet deposition of mercury to the Athabasca oil sands region, Alberta, Canada, Air Qual. Atmos. Hlth., 11, 83–93, 2018.
Ma, J., Hintelmann, H., Kirk, J., and Muir, D.: Mercury concentrations and mercury isotope composition in lake sediment cores from the vicinity of a metal smelting facility in Flin Flon, Manitoba, Chem. Geol., 336, 96–102, https://doi.org/10.1016/j.chemgeo.2012.10.037, 2012.
Makar, P., Akingunola, A., Pabla, B., Stroud, C., Chen, J., Cheung, P., Moran, M., Gong, W., Zheng, Q., and Li, S. M.: Experimental Forecasting Using the High-Resolution Research Configuration of GEM-MACH, in: Air Pollution Modeling and its Application XXVI, edited by: Mensink C., Gong W., Hakami A., ITM 2018, Springer Proceedings in Complexity, Springer, Cham, https://doi.org/10.1007/978-3-030-22055-6_35, 2018.
Muir, D. C. G., Wang, X., Yang, F., Nguyen, N., Jackson, T. A., Evans, M. S., Douglas, M., Kock, G., Lamoureux, S., Pienitz, R., Smol, J. P., Vincent, W. F., and Dastoor, A.: Spatial trends and historical deposition of mercury in eastern and northern Canada inferred from lake sediment cores, Environ. Sci. Technol., 43, 4802–4809, 2009.
NPRI: Government of Canada, Access the reporting guide for the National Pollutant Release Inventory, available at: https://www.canada.ca/en/environment-climate-change/services/national-pollutant-release-inventory/report/access-reporting-guide.html, last access: 25 July 2019.
Obrist, D., Pearson, C., Webster, J., Kane, T., Lin, C., Aiken, G. R., and Alpers, C. N.: A synthesis of terrestrial mercury in the western United States: Spatial distribution defined by land cover and plant productivity, Sci. Total Environ., 568, 522–535, https://doi.org/10.1016/j.scitotenv.2015.11.104, 2016.
Parsons, M., McLennan, D., Lapalme, M., Mooney, C., Watt, C., and Mintz, R.: Total gaseous mercury concentration measurements at Fort McMurray, Alberta, Canada, Atmosphere 4, 472–493, https://doi.org/10.3390/atmos4040472, 2013.
Steffen, A. and Schroeder, W. H.: Standard Operating Procedures Manual Procedure for Total Gaseous Mercury Measurements-Canadian Atmospheric Mercury Measurement Network (CAMNet), Meteorological Service of Canada 4905, 1999.
Travnikov, O., Angot, H., Artaxo, P., Bencardino, M., Bieser, J., D'Amore, F., Dastoor, A., De Simone, F., Diéguez, M. D. C., Dommergue, A., Ebinghaus, R., Feng, X. B., Gencarelli, C. N., Hedgecock, I. M., Magand, O., Martin, L., Matthias, V., Mashyanov, N., Pirrone, N., Ramachandran, R., Read, K. A., Ryjkov, A., Selin, N. E., Sena, F., Song, S., Sprovieri, F., Wip, D., Wängberg, I., and Yang, X.: Multi-model study of mercury dispersion in the atmosphere: atmospheric processes and model evaluation, Atmos. Chem. Phys., 17, 5271–5295, https://doi.org/10.5194/acp-17-5271-2017, 2017.
UN: Minamata Convention on Mercury, 72, available at: http://www.mercuryconvention.org (last access: 17 August 2021), 2017.
UNEP: The Global Atmospheric Mercury Assessment: Sources, Emissions and Transport, UNEP-Chemicals, Geneva, 2008
UNEP: Global Mercury Assessment 2013: Sources, Emissions, Releases and Environmental Transport, UNEP Chemicals Branch, Geneva, Switzerland, 2013.
UNEP: Global Mercury Assessment, UN Environment Programme, Chemicals and Health Branch, Geneva, Switzerland, 2018.
Wasiuta, V., Kirk, J. L., Chambers, P. A., Alexander, A. C., Wyatt, F. R., Rooney, R. C., and Cooke, C. A.: Accumulating Mercury and Methylmercury Burdens in Watersheds Impacted by Oil Sands Pollution, Environ. Sci. Technol., 53, 12856–12864, https://doi.org/10.1021/acs.est.9b02373, 2019.
Whaley, C. H., Galarneau, E., Makar, P. A., Akingunola, A., Gong, W., Gravel, S., Moran, M. D., Stroud, C., Zhang, J., and Zheng, Q.: GEM-MACH-PAH (rev2488): a new high-resolution chemical transport model for North American polycyclic aromatic hydrocarbons and benzene, Geosci. Model Dev., 11, 2609–2632, https://doi.org/10.5194/gmd-11-2609-2018, 2018.
Wiedinmyer, C. and Friedli, H.: Mercury emission estimates from fires: An initial inventory for the United States, Environ. Sci. Technol., 41, 8092–8098, https://doi.org/10.1021/es071289o, 2007.
Wiedinmyer, C., Akagi, S. K., Yokelson, R. J., Emmons, L. K., Al-Saadi, J. A., Orlando, J. J., and Soja, A. J.: The Fire INventory from NCAR (FINN): a high resolution global model to estimate the emissions from open burning, Geosci. Model Dev., 4, 625–641, https://doi.org/10.5194/gmd-4-625-2011, 2011.
Willis, C. E., Kirk, J. L., St Louis, V. L., Lehnherr, I., Ariya, P. A., and Rangel-Alvarado, R. B.: Sources of Methylmercury to Snowpacks of the Alberta Oil Sands Region: A Study of In Situ Methylation and Particulates, Environ. Sci. Technol., 52, 531–540, https://doi.org/10.1021/acs.est.7b04096, 2018.
Willis, C. E., St Louis, V. L., Kirk, J. L., St Pierre, K. A., and Dodge, C.: Tailings ponds of the Athabasca Oil Sands Region, Alberta, Canada, are likely not significant sources of total mercury and methylmercury to nearby ground and surface waters, Sci. Total Environ., 647, 1604–1610, https://doi.org/10.1016/j.scitotenv.2018.08.083, 2019.
Wright, L. P., Zhang, L., and Marsik, F. J.: Overview of mercury dry deposition, litterfall, and throughfall studies, Atmos. Chem. Phys., 16, 13399–13416, https://doi.org/10.5194/acp-16-13399-2016, 2016.
Zhang, L., Wright, L. P., and Blanchard, P.: A review of current knowledge concerning dry deposition of atmospheric mercury, Atmos. Environ., 43, 5853–5864, 2009.
Zhang, J., Moran, M. D., Zheng, Q., Makar, P. A., Baratzadeh, P., Marson, G., Liu, P., and Li, S.-M.: Emissions preparation and analysis for multiscale air quality modeling over the Athabasca Oil Sands Region of Alberta, Canada, Atmos. Chem. Phys., 18, 10459–10481, https://doi.org/10.5194/acp-18-10459-2018, 2018.
Zhang, L., Wu, Z., Cheng, I., Wright, L. P., Olson, M. L., Gay, D. A., Risch, M. R., Brooks, S., Castro, M. S., Conley, G. D., Edgerton, E. S., Holsen, T. M., Luke, W., Tordon, R., and Weiss-Penzias, P.: The estimated six-year mercury dry deposition across North America, Environ. Sci. Technol., 50, 12864–12873, https://doi.org/10.1021/acs.est.6b04276, 2016.
Zhou, J., Obrist, D., Dastoor, A., Jiskra, M., and Ryjkov, A.: Vegetation uptake of mercury and impacts on global cycling, Nat. Rev. Earth Environ., 2, 269–284, https://doi.org/10.1038/s43017-021-00146-y, 2021.
- Abstract
- Introduction
- Objectives
- The model and emission inputs
- Model simulations
- Mercury observations in the AOSR
- Results and discussion
- Conclusions
- Code availability
- Data availability
- Author contributions
- Competing interests
- Disclaimer
- Special issue statement
- Acknowledgements
- Financial support
- Review statement
- References