the Creative Commons Attribution 4.0 License.
the Creative Commons Attribution 4.0 License.
 | 27 Aug 2021
Aerosol optical properties derived from POLDER-3/PARASOL (2005–2013) over the Western Mediterranean Sea – Part 2: Spatial distribution and temporal variability
Isabelle Chiapello
Paola Formenti
Lydie Mbemba Kabuiku
Fabrice Ducos
Didier Tanré
François Dulac
The Mediterranean atmosphere is impacted by a variety of natural and anthropogenic aerosols which exert a complex and variable pressure on the regional climate and air quality. This study focuses on the Western Mediterranean Sea (west of longitude 20∘ E) using the full POLarization and Directionality of the Earth's Reflectances version 3 (POLDER-3)/Polarization & Anisotropy of Reflectances for Atmospheric Sciences coupled with Observations from a Lidar (PARASOL) aerosol data record derived from the operational clear-sky ocean algorithm (collection 3) available from March 2005 to October 2013. This 8.5-year satellite data set includes retrievals at 865 nm of the total, fine-, and coarse-mode aerosol optical depth (AOD, AODF, and AODC, respectively), Ångström exponent (AE), and the spherical/non-spherical partition of the coarse-mode AOD (AODCS and AODCNS, respectively), that have been carefully validated over the study region (Formenti et al., 2018). Here, we analyze the spatial distribution, the seasonal cycle, and interannual variability of this ensemble of advanced aerosol products in three latitude bands (34–38, 38–42, and > 42∘ N) and for three sites (Ersa, Barcelona, Lampedusa) distributed on the western basin. POLDER-3 retrieves the high influence of north African desert dust over the region, which largely controls the spatial distributions (south-to-north decreasing gradient) and seasonal cycles (spring/summer maximum) of both AOD and coarse AOD, including its non-spherical component. In contrast, the coarse spherical component of AOD remains relatively homogenously low all year long over the region, whereas fine-mode AODs are generally more elevated in the eastern part of the region of study, especially north of the Adriatic Sea. From 2005 to 2013, annual POLDER-3 AOD evolution shows a decreasing trend of 0.0030 yr−1 in absolute value at 865 nm (0.0060 yr−1 at 550 nm). Such a downward evolution is much more pronounced and spatially extended for AODF (−0.0020 yr−1 at 865 nm) than for AODC. Our analysis also suggests that the North Atlantic Oscillation (NAO) index explains a significant part of the interannual variability of POLDER-3 AODC, reflecting its role on the frequency of Saharan dust transport over the region. Finally, the POLDER-3 data set highlights an improvement of air quality related to the fine aerosol component, with a marked evolution toward more frequent occurrence of clean conditions (≥ 75 % of daily AODF-865 nm<0.05) at the end of the period of study (2010–2013) over most of the Western Mediterranean Sea, and much less evidence of such a large-scale evolution for the coarse fraction. Therefore, despite the high and variable influence of mostly natural north African dust over the region, the POLDER-3 advanced aerosol data set appears sufficiently accurate to successfully resolve the concurrent downward trend of fine, primarily anthropogenic particles, most likely related to reduced emissions in the surrounding European countries.
- Article
(12642 KB) - Full-text XML
-
Supplement
(2714 KB) - BibTeX
- EndNote


Due to the contributions of diverse natural and anthropogenic sources and because of their relatively short lifetime in the troposphere, aerosols consist in a complex, timely, and spatially variable mixture of particles (Boucher, 2015). As aerosol impacts, especially in terms of air quality degradation and radiative forcing contribution to climate change, strongly depend on both very variable aerosol loads and properties, they require a dedicated reliable monitoring. Despite a number of measurement efforts deployed in the last decades (Laj et al., 2009; Pandolfi et al., 2018; Formenti, 2021; Laj et al., 2020), the variety of atmospheric particles, in terms of loads, size ranges, shapes, chemical compositions, and optical properties, remains partially characterized. Indeed, the monitoring of the spatial, temporal, and vertical variability of all these physicochemical parameters in both an accurate and comprehensive way is still a challenge. Significant advances have been achieved by intensive field experiments deploying detailed but limited in time and space in situ measurements of aerosol chemical, physical, and optical properties (e.g., Denjean et al., 2016; Di Biagio et al., 2016). In parallel, remote sensing observations, especially those from ground-based global aerosol networks, like AERONET (Aerosol Robotic Network) (Holben et al., 2001), and dedicated advanced aerosol satellite sensors, like MODIS (MODerate resolution Imaging Spectrometer) or POLDER (POLarization and Directionality of the Earth's Reflectances) (Tanré et al., 2011; Bréon et al., 2011; Remer et al., 2020), have made considerable progress in expanding in time and space the aerosol data sets acquired from field experiments. Thus, remote sensing has become an essential complementary tool, able to provide unique repetitive and large-scale view of aerosol loads and properties' evolution. The combination of both types of measurements, i.e., detailed in situ aerosol characterization and long-term repetitive aerosol properties monitored by space-borne sensors, is required to improve current understanding of their evolution in terms of loads and properties and to reduce uncertainties on their impacts.
This paper is dedicated to a regional aerosol analysis based on retrievals from the POLDER-3/PARASOL (Polarization & Anisotropy of Reflectances for Atmospheric Sciences coupled with Observations from a Lidar) satellite sensor over the period 2005–2013 in the Western Mediterranean Sea. This region, impacted by demographic pressure and air quality degradation, is under the influence of both anthropogenic and natural aerosols, emitted from different types of continental and marine sources (e.g., Lelieveld et al., 2002; Di Biagio et al., 2015; Ancellet et al., 2016; Chazette et al., 2016, Claeys et al., 2017; Michoud et al., 2017; Chazette et al., 2019). Therefore, in the recent years, it has experienced an increasing scientific interest, as shown by a number of studies dedicated to Mediterranean aerosol characterization through large-scale field experiments (e.g., Di Biagio et al., 2015; Mallet et al., 2016; Ricaud et al., 2018 and references therein), modeling efforts (Rea et al., 2015; Menut et al., 2016; Sič et al., 2016; Chrit et al., 2018; Drugé et al., 2019), and satellite observation analyses (Nabat et al., 2013; Floutsi et al., 2016).
Previous studies relying on daily, large-scale satellite aerosol observations (Dulac et al., 1992; Moulin et al., 1998; Antoine and Nobileau, 2006; Gkikas et al., 2013, 2016) have highlighted that the Mediterranean atmosphere is highly influenced by the sporadic transport of north African dust. This export causes a south-to-north decreasing gradient of aerosol loads and a seasonal east–west shift characterized by a later (summer) maximum for the western basin (Moulin et al., 1998; Floutsi et al., 2016). In addition, several long-term satellite data sets have revealed the large-scale control of the North Atlantic Oscillation on the interannual variability of retrieved aerosol loads in relation to this highly variable transport of dust over the region (Moulin et al., 1998; Antoine and Nobileau, 2006). Floutsi et al. (2016) climatology, based on 12 years of MODIS aerosol observations (2002–2014), has highlighted a decreasing trend of aerosol loads over the Mediterranean basin. Their MODIS data set, by showing a higher decreasing trend of fine-mode aerosol loads than that of the coarse fraction, strongly suggests a lowering of anthropogenic pollution particles' influence over the region, most likely linked to reduced human-related emissions. In agreement with other multiyear satellite studies (Gkikas et al., 2013), Floutsi et al. (2016) also assume a certain level of decrease of the transported desert dust particles, mainly over the western sub-basin.
Most of the satellite studies dedicated to interpretation of aerosol spatial and temporal variability over the Mediterranean region have been relying on MODIS retrievals (Barnaba and Gobi, 2004; Hatzianastassiou et al., 2009; Georgoulias et al., 2016), with some of them focusing of the eastern sub-basin (Georgoulias et al., 2016; Shaheen et al., 2020). Considering the complexity of the aerosol influences in the Mediterranean atmosphere and inherent uncertainties related to long-term satellite aerosol retrievals, our study aims to provide a first interpretation of an independent advanced aerosol satellite data set. For this purpose, we investigate the POLDER-3/PARASOL data set (Herman et al., 2005; Tanré et al., 2011), which offers the capacity for daily monitoring of the size-resolved aerosol properties over sea surfaces over its almost 9-year period of operation (Formenti et al., 2018).
At a global scale, a careful validation of POLDER-3 aerosol retrievals has been performed for derived total and fine aerosol optical depth (AOD), through statistical comparison to coincident Sun/sky photometer data of the AERONET network (Bréon et al., 2011). In a first dedicated paper (Part 1 of the present paper: Formenti et al., 2018), we led a regional comprehensive quality assessment of POLDER-3-derived aerosol parameters over the Western Mediterranean Sea, based on both aerosol measurements from 17 ground-based coastal and insular AERONET sites over the period 2005–2013, and in situ airborne observations available during summer 2012 and 2013 Chemistry-Aerosol Mediterranean Experiment (ChArMEx) experiments (Di Biagio et al., 2015; Mallet et al., 2016). Our analysis has highlighted the quality and robustness of POLDER-3 operational aerosol retrievals over oceans, especially total, fine, and coarse AOD (AOD, AODF, and AODC) at 865 nm, the Ångström exponent (AE), and the spherical and non-spherical partition of coarse-mode AOD (AODCS and AODCNS) over this region. In this paper, the advanced aerosol data set provided by POLDER-3 over its operating period, i.e., from March 2005 to October 2013, is investigated in terms of spatial variability and temporal evolution of aerosol load, size, and shape properties over the Western Mediterranean Sea.
The POLDER-3 (POLarization and Directionality of the Earth's Reflectances) instrument aboard the PARASOL (Polarization & Anisotropy of Reflectances for Atmospheric Sciences coupled with Observations from a Lidar) mission is dedicated to advanced aerosol monitoring (Tanré et al., 2011). PARASOL, launched in December 2004 in order to be part of the A-Train, was in operation from 4 March 2005 to 10 October 2013. Over this period, data availability was 91 %. The explanations for the 9 % loss of data are multiple: orbital maneuvers, instrument put on standby for security reasons, data transmission between the payload and the receiving station, and problems encountered with the stellar sensor. The POLDER-3 payload consisted of a digital camera with a 274 × 242-pixel charge-coupled device (CCD) detector array, wide-field telecentric optics and a rotating filter wheel enabling measurements in nine spectral channels from blue (443 nm) to near-infrared ranges (1020 nm). Polarization measurements were performed at 490, 670, and 865 nm. With an acquisition of a sequence of images every 20 s, the instrument could observe ground targets from up to 16 different angles, ±51∘ along track and ±43∘ across track (Tanré et al., 2011). The original pixel size is 5.3 km × 6.2 km at nadir. Algorithms have been developed to process the POLDER measurements in order to retrieve aerosol parameters at 18.5 × 18.5 km2 superpixel resolution (3 × 3 pixels). In this paper, we use the operational clear-sky ocean retrieval algorithm (Herman et al., 2005) derived from collection 3, corresponding to the latest update performed in 2014 that included calibration improvements (Fougnie, 2016). This algorithm, described in detail by Herman et al. (2005) and Tanré et al. (2011), has been slightly improved in collection 3 regarding non-spherical particles in the coarse mode (Formenti et al., 2018). Briefly, it is based on the total and polarized radiances measured at 670 and 865 nm. Using a look-up table (LUT) built on aerosol microphysical models (described in Table S1 in the Supplement of Formenti et al., 2018), the algorithm recalculates for each clear-sky pixel the observed polarized radiances at several observational angles. Importantly, in the aerosol models used for the inversion, aerosols are considered as non-absorbing (the imagery part of the refractive index is assumed as zero) and the real part of their refractive index is invariant between 670 and 865 nm. The aerosol number size distribution is lognormal and bimodal with an effective diameter smaller (larger) than 1.0 µm for the fine (coarse) mode. The coarse mode includes a non-spherical fraction based on the spheroidal model from Dubovik et al. (2006), whereas a Mie model for homogeneous spherical particles is used to calculate multi-spectral and multi-angle polarized radiances. As an improvement compared to former versions of the algorithm, the effective diameter of the spheroidal model is allowed to take two values (namely 2.96 and 4.92 µm) in collection 3 (Table S1 of Formenti et al., 2018). Within the coarse mode, the non-spherical fraction is set to five discrete values (0.00, 0.25, 0.50, 0.75, and 1.00, Tanré et al., 2011). A quality flag index (0 indicating the lowest and 1 the highest quality) is attributed to each superpixel depending on the inversion quality. As in Formenti et al. (2018), only POLDER-3 aerosol products derived from pixels with a quality flag ≥ 0.5 have been considered in our analysis. In the present study, we focus on the Western Mediterranean region, west of longitude 20∘ E, considering the main aerosol parameters derived by POLDER-3 ocean operational algorithm: (i) available for all clear-sky pixels: total, fine, and coarse aerosol optical depth (respectively, AOD, AODF, and AODC) at 865 nm, and Ångström exponent between 670 and 865 nm, (ii) available only when the geometrical conditions are optimal (scattering angle range of roughly 90–160∘): spherical and non-spherical fractions of the AOD in the coarse mode (fCS and fCNS respectively), allowing to assess AODCS and AODCNS (spherical and non-spherical coarse AOD, respectively) at 865 nm. The quality of these POLDER-3-derived aerosol parameters has been evaluated over the region of interest by Formenti et al. (2018), using co-located in situ airborne measurements from summer 2012 and 2013 field experiments and coincident ground-based AERONET data available from 17 insular and coastal sites over the whole POLDER-3 operational period (2005–2013). This first comprehensive regional evaluation has provided new assessments of uncertainties and highlighted the good quality of the collection 3 POLDER-3 aerosol data set over our area of interest (Table 4 of Formenti et al., 2018). In our regional analysis of spatial distribution and temporal variability of POLDER-3 aerosol retrievals, the AOD, AODF, and AODC derived at 865 nm will be complemented through an extrapolation with the Ångström exponent, by those at 550 nm, which is the standard wavelength of many aerosol satellite retrievals and model simulations (Nabat et al., 2013).
3.1 Mean regional and seasonal picture (2005–2013)
The climatological (March 2005–October 2013) seasonal maps of POLDER-3-derived AOD, AE, AODF, AODC, AODFAOD (i.e., fine-mode fraction or FMF), AODCNS, and AODCS at 865 nm over marine areas in the region 30–50∘ N, 10∘ W–20∘ E, i.e., mainly the Western Mediterranean Sea, are shown in Fig. 1. The total AOD (left panels) exhibits a pronounced seasonality with minimum values in winter (defined by the December–January–February months): AOD < 0.10 over most of the region of study. In spring (March–April–May), AOD shows an increase, especially intense over the southeastern part of the region between Italy and Africa, whereas the maximum AOD values (≥ 0.20) are reached in summer (June–July–August) over the whole southern part of the area. In autumn (September–October–November), the AODs over the region are mostly low, comparable to winter loads, except over the southeastern part of the domain, especially over the Ionian Sea, and off the coast of Tunisia, Libya, and south of Sicily, where they reach moderate values (range of 0.10–0.15). This area of enhanced aerosol transport is geographically similar to that associated with maximum AOD (∼ 0.20) in spring. In general, the seasonal POLDER-3 total AOD maps exhibit a well-established south-to-north gradient, with a decrease of values toward the northern part, reflecting the high influence of aerosol sources from the north African continent. This aerosol spatial distribution is consistent with that derived by other satellite sensors over the Mediterranean basin (for example, Moulin et al., 1998; Barnaba and Gobi, 2004; Papadimas et al., 2008). The AE865–670 nm seasonal maps (second column panels) highlight the influence of coarse aerosols (associated with low AE values) in the southern part of the region off the north African coast and higher contribution of fine particles along the coasts of Europe, especially over the Adriatic Sea, where AE values are equal to or higher than 1, in all seasons. AODF, AODC, and AODFAOD (FMF) seasonal maps, shown in the three central column panels, confirm this pattern of spatial variability, typical of coarse and fine aerosol repartition in the Mediterranean basin. The seasonal and spatial variability of AODCNS is close to that observed for AODC, whereas POLDER-3 retrievals of AODCS suggest a relatively homogeneous repartition of coarse spherical particles, with low values (AODCS<0.05), and no substantial spatial and seasonal variations (right panels of Fig. 1). Figure S1 of the Supplement complements these POLDER-3 seasonal maps at 865 nm, with AOD, AODF, AODC, and AODFAOD (i.e., FMF) extrapolated at 550 nm. At this wavelength, AODs reach higher values (≥ 0.30 during summer maximum), in agreement with the AOD550 nm range of retrievals from reference satellite sensors like MODIS and the Multi-angle Imaging SpectroRadiometer (MISR) over the region (Nabat et al., 2013). As expected, POLDER-3 AODF values are strongly enhanced (values up to 0.16–0.20) compared to 865 nm (< 0.08), whereas AODC values are only slightly modified. These ranges of values are consistent with the stronger wavelength dependence of AOD of small particles, characterized by high AE values, inducing a pronounced increase of AODF values toward shorter wavelengths. Thus, the spatial distribution of POLDER-3 AODF at 550 nm is characterized by maximum values (> 0.10) over the eastern part of the region of study and seasonal peaks in spring and summer. North of the Adriatic Sea, POLDER-3 highlights an area characterized by all-year persistent high values of AODF (> 0.12 at 550 nm), most probably reflecting accumulation of pollution particles due to influence of regional anthropogenic sources (for example, from northern Italy in the Po Valley). Such a spatial pattern is fully consistent with the recent analysis of Hansson et al. (2021), highlighting that polluted air masses coming from the north along the Adriatic Sea are affecting air quality in a large part of the Mediterranean.
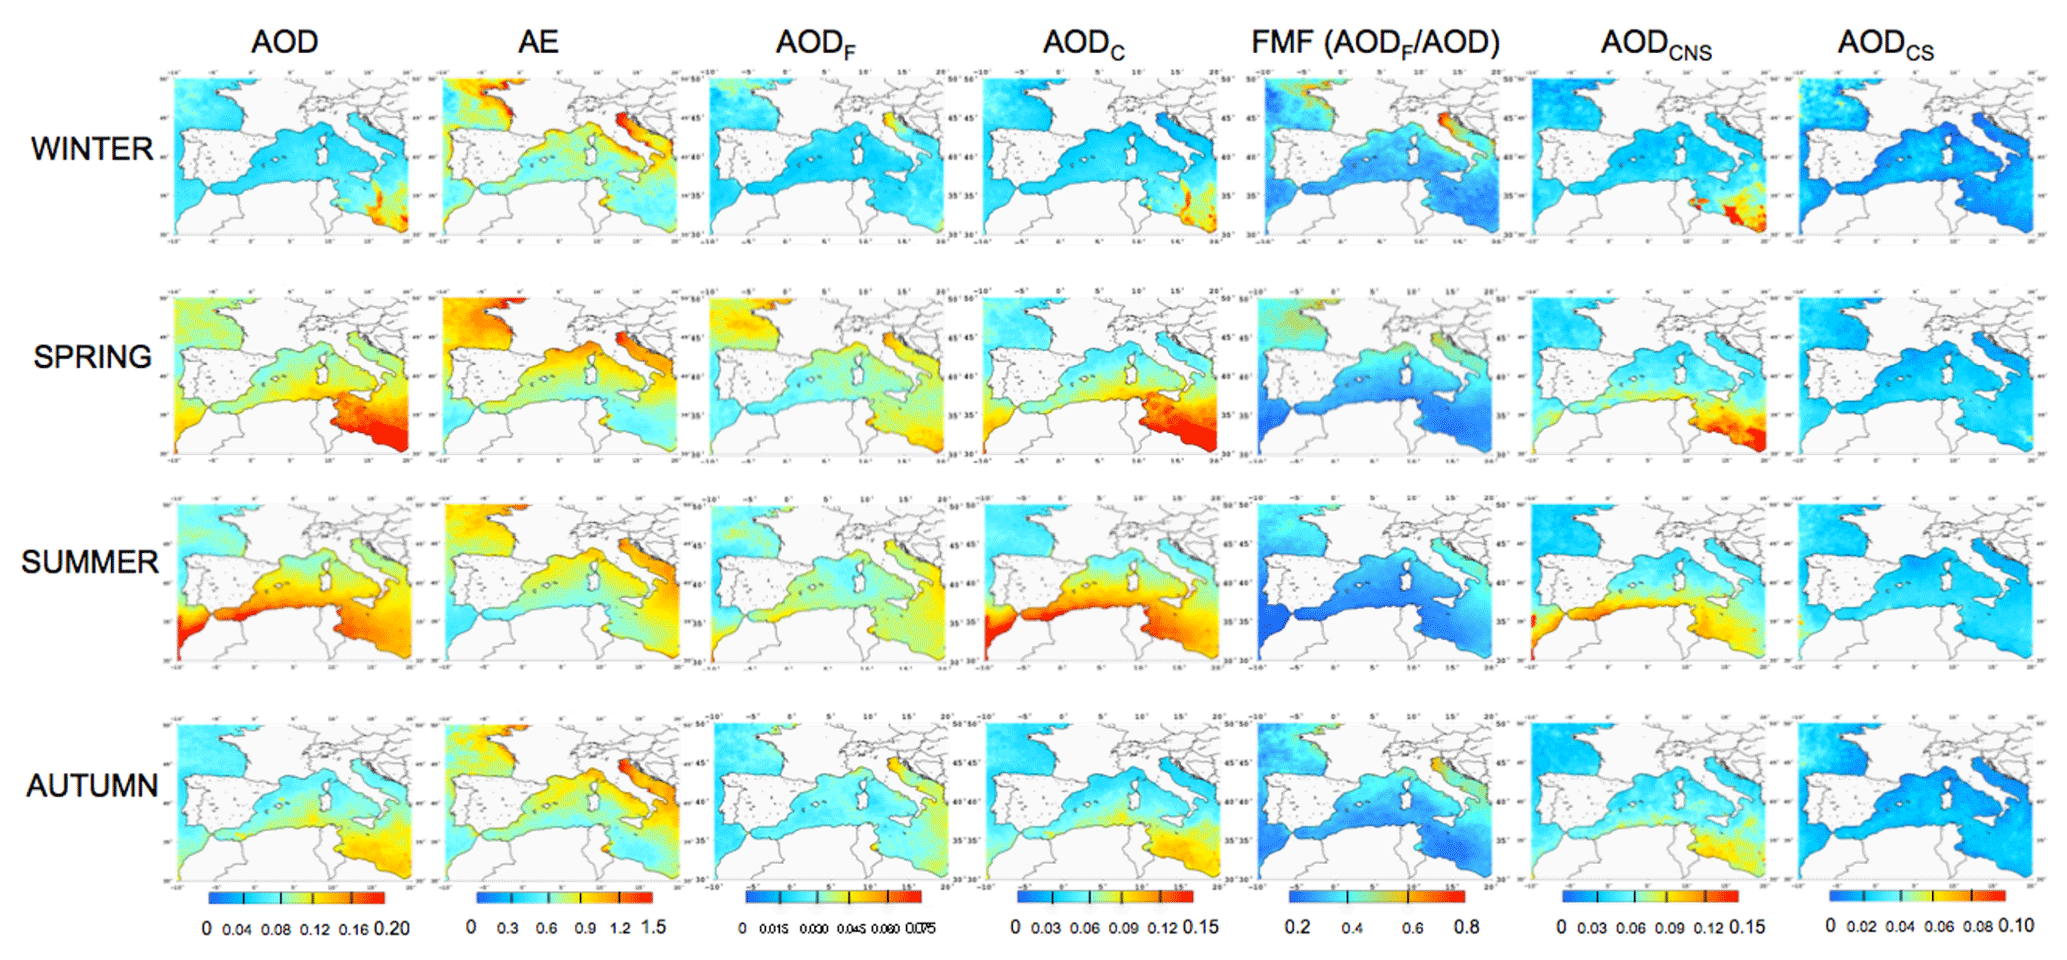
Figure 1Climatological seasonal maps for AOD, AE, AODF, AODC, FMF (derived from AODFAOD), AODCNS, and AODCS retrieved by POLDER-3 at 865 nm over the period March 2005–October 2013. Seasons are ordered from the top to the bottom: winter is December–January–February, spring is March–April–May, summer is June–July–August, and autumn is September–October–November.
3.2 Subregional features
In order to examine more deeply the seasonal variations of POLDER-3 aerosol retrievals accounting for the south-to-north gradient observed in Fig. 1, the area of study has been divided into three main latitudinal subregions. These regions are illustrated in Fig. 2. They correspond respectively to the northern part (north of latitude 42∘ N: zone 1 called NW MED), the central part (latitude band 38–42 ∘ N, zone 2 called CW MED), and the southern part (south of latitude 38∘ N: zone 3 called SW MED) of the Western Mediterranean Sea (6∘ W–20∘ E).
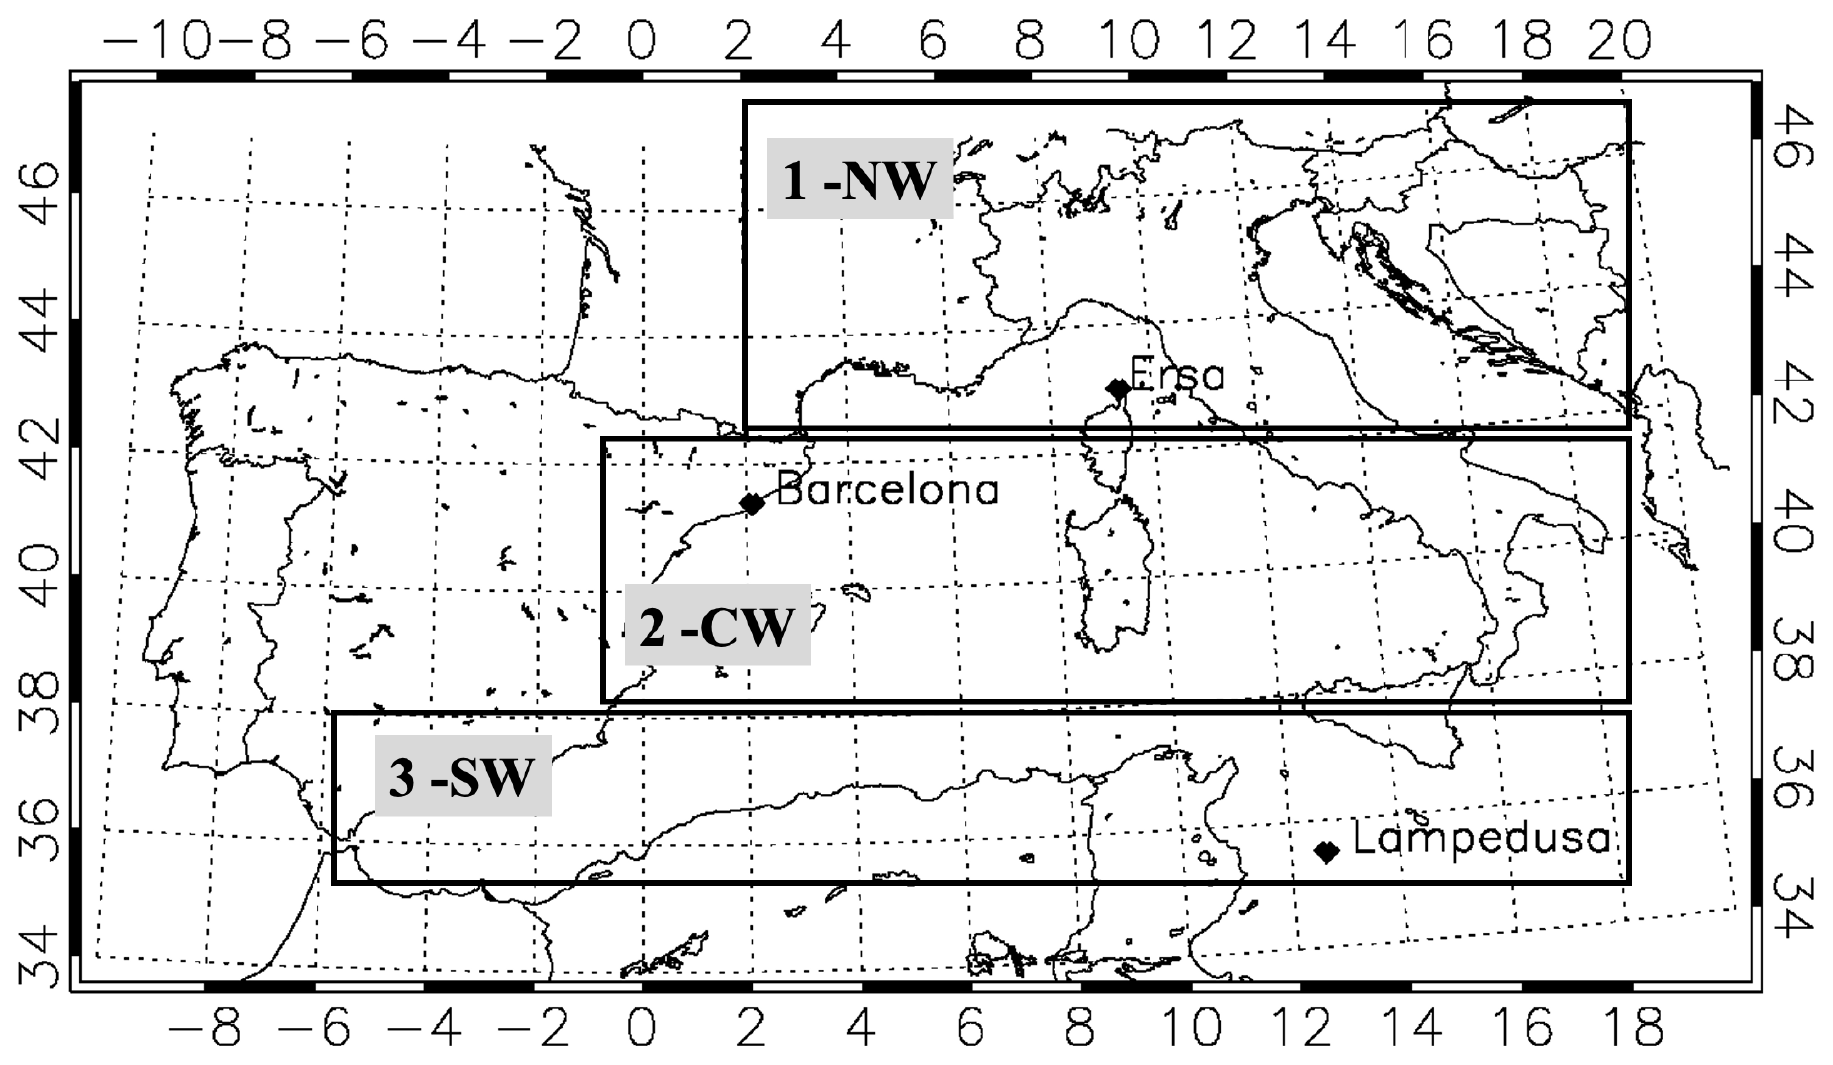
Figure 2Definition of the three geographical subregions used to analyze POLDER-3 aerosol retrievals over the area of study: (1) NW Med, 42–46∘ N, 2–20∘ E; (2) CW MED, 38–42∘ N, 1∘ W–20∘ E; (3) SW MED, 34–38∘ N, 6∘ W–20∘ E. The three sites considered in this study are reported, i.e., Ersa (43.00367∘ N, 09.35929∘ E), Barcelona (41.38925∘ N, 02.11206∘ E), and Lampedusa (35.51667∘ N, 12.63167∘ E).
Figure S2 of the Supplement reports the statistics of the POLDER-3 retrievals over the March 2005–October 2013 time period in each subregion, with mean and standard deviations, maximum and minimum values of number of available clear-sky superpixels (left column), and number of available days of observations for each month and year (right column). As expected, more POLDER-3 retrievals are available in summer than in winter months, due to the higher influence of cloudiness during the cold season. The number of days with aerosol retrievals by month and year for each subregion (right column) highlights that more than 50 % of daily POLDER-3 retrievals are available for most of the months of the whole time period. A few exceptions occur for some specific months, as July 2007 and July 2010, common at the three subregions due to missing data during these periods related to instrumental problems with the solar sensor (only 28 % and 14 % of data available, respectively). These statistics suggest that the cloudiness significantly reduces the number of POLDER-3 pixels available over each subregion from October to March (Fig. S2a, c, e), with a more limited impact on the number of available days of POLDER-3 observations (Fig. S2b, d, f).
Figure 3 illustrates the 8- or 9-year climatological mean over March 2005–October 2013 of monthly POLDER-3-derived aerosol parameters at 865 nm over the three subregions defined in Fig. 2. The averaged seasonal cycle of AOD is relatively similar over the northern and central parts of the basin, whereas the southern part shows generally higher total aerosol loads, and a more pronounced seasonal variability, with two maxima in April–May and July (mean AOD865 nm>0.15). This evolution is consistent with a dominant influence of African dust transport, which is known to begin over the eastern basin in spring and spread over the western basin in summer (Moulin et al., 1998; Floutsi et al., 2016). The mean monthly variations of the POLDER-3 AODF integrated over the three subregions are remarkably similar, in agreement with previous analysis based on ground-based AERONET observations suggesting that the aerosol fine mode is, to some extent, relatively homogeneously distributed over the Western Mediterranean region (Lyamani et al., 2015; Sicard et al., 2016). Conversely, the north–south gradient clearly appears for AODC (middle panel in the right column of Fig. 3), especially for the SW MED area, consistently with what is observed for total AOD. The seasonal variations of the monthly averaged AE (middle panel in the left column) reflect the north–south gradient of aerosol sizes, with an increased influence of smaller particles toward the north, a pattern confirmed by the monthly evolution of FMF (left column, bottom panel). The monthly averaged AODCS (right column, bottom panel) shows very low seasonal and spatial variability, as previously observed in Fig. 1, whereas the POLDER-3 mean AODCNS seasonal cycle illustrates much more pronounced monthly and north–south evolution, in coherence with those of AODC and total AOD. Figure S3 in the Supplement illustrates the climatological mean of monthly POLDER-3 AOD, AODF, AODC, and FMF extrapolated at 550 nm, confirming the patterns displayed Fig. 1, especially the marked increase of AODF values, and FMF at this wavelength. Thus, POLDER-3 FMFs (550 nm) are consistent with previous averaged estimates from MODIS over the Western Mediterranean, ranging from 55 % to nearly 70 % (Floutsi et al., 2016).

Figure 3The 9-year (March 2005–October 2013) climatological seasonal cycle of (left column) AOD (a), Ångström exponent (c), FMF (e); (right column) AODFine (b), AODCoarse (d), AODCoarse Spherical (continuous lines), and AODCoarse Non Spherical (dashed lines) (f), derived from POLDER-3 at 865 nm. The green, blue, and orange curves are, respectively, for the northern (NW MED), central (CW MED), and southern (SW MED) parts of Western Mediterranean basins (defined in Fig. 2).
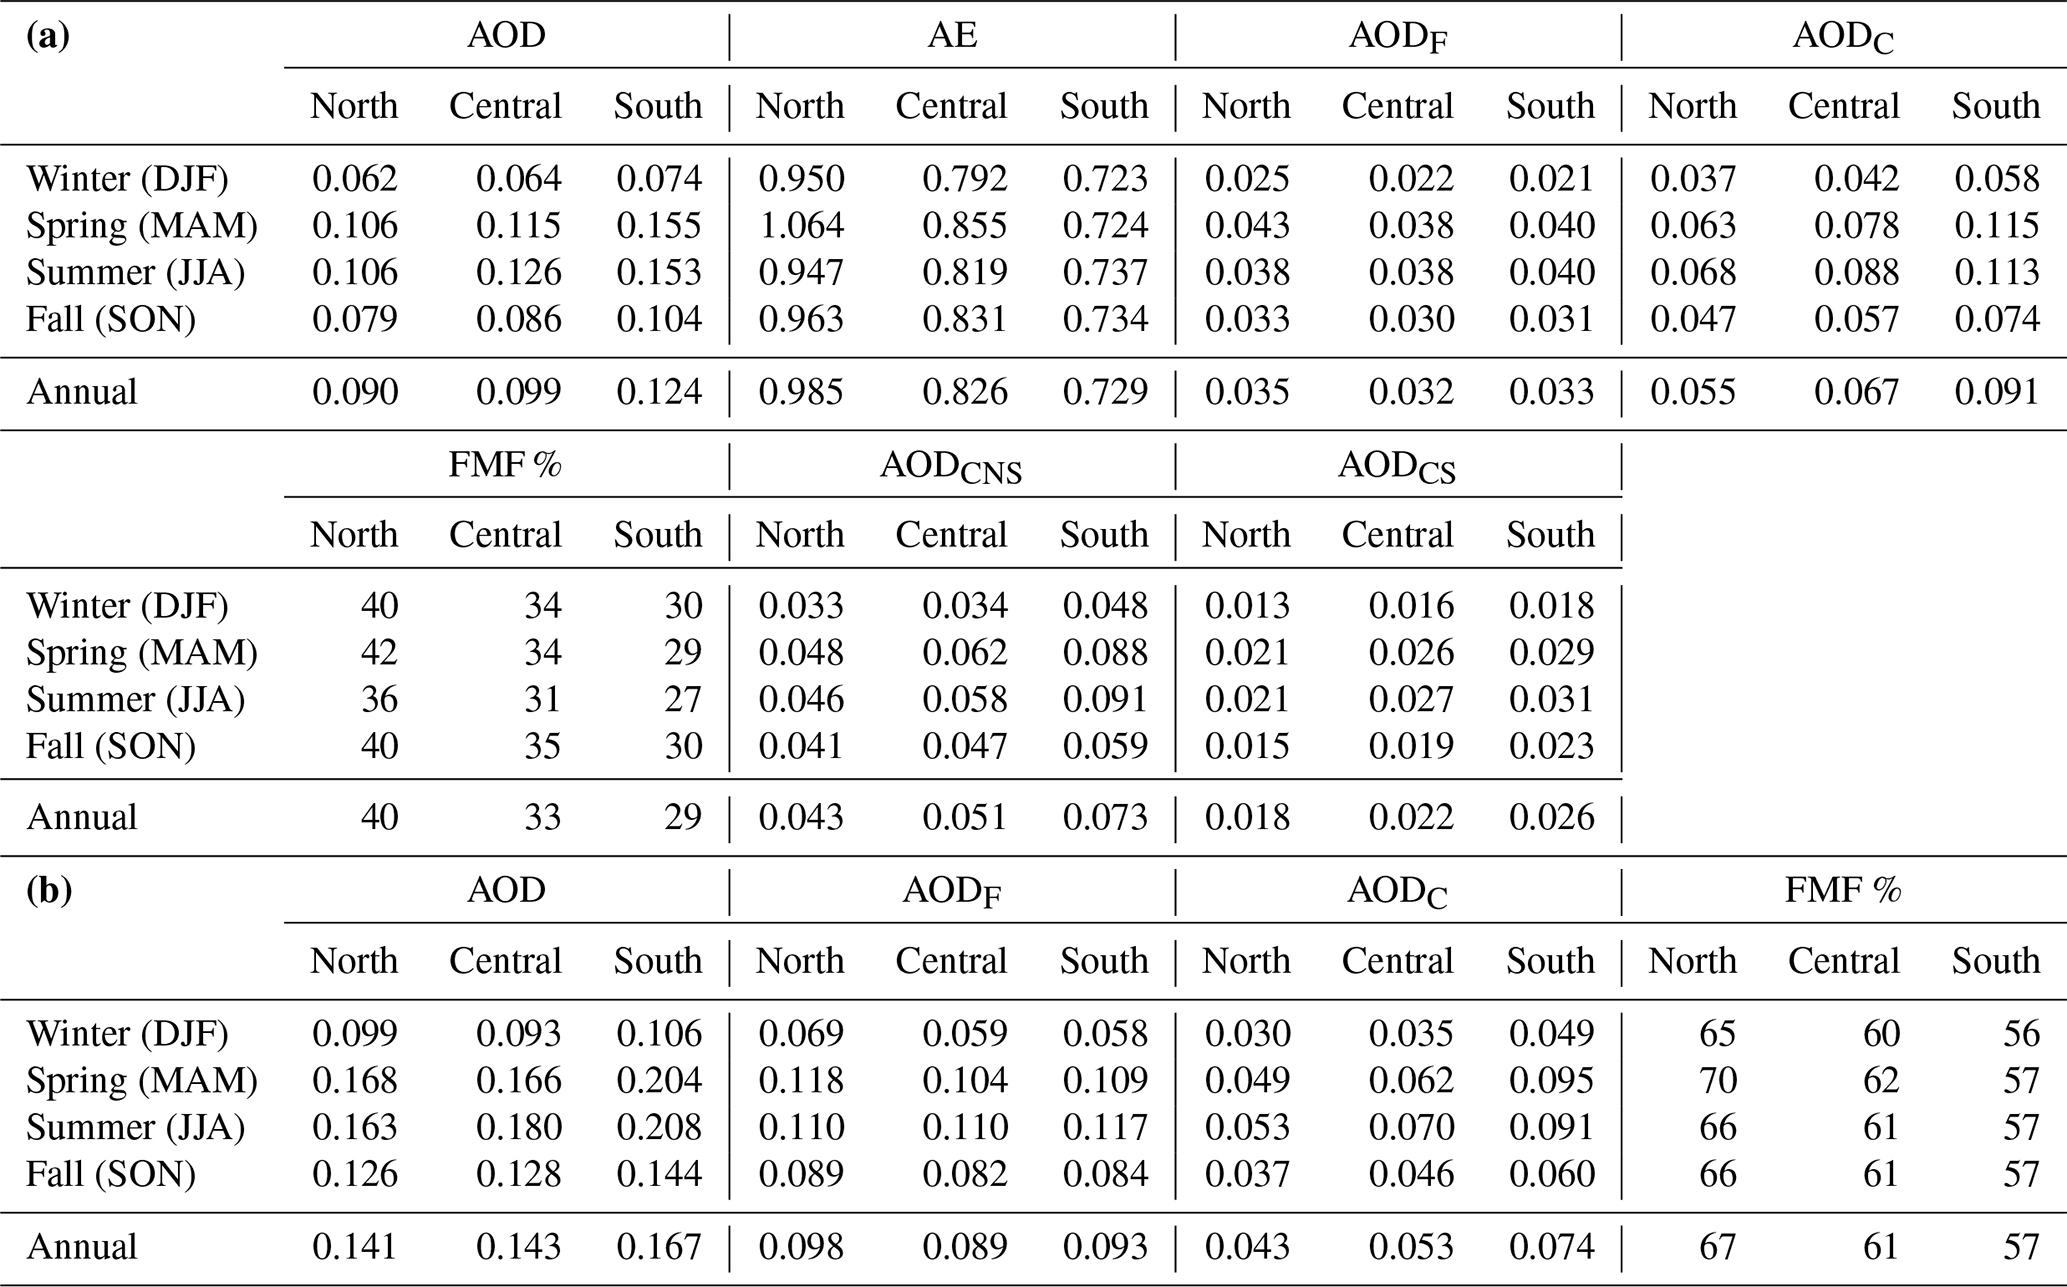
The POLDER-3 mean seasonal aerosol retrievals displayed in Figs. 1 and 3 at 865 nm are summarized in Table 1a; those extrapolated at 550 nm (Figs. S1 and S3) are in Table 1b. The multi-annual averages of AOD, AODC, and AODCNS at 865 nm in Table 1a confirm the north–south gradient with minimum values in the northern part (0.090, 0.055, and 0.043, respectively, for AOD, AODC, and AODCNS) compared to the southern part of the Western Mediterranean basin (0.124, 0.091, and 0.073, respectively). POLDER-3 AE and FMF mean multi-annual values consistently highlight an increase in the coarse component of AOD toward the south. In terms of multi-annual averages, the AODF remains relatively uniform, with some minor variations indicating minimum fine-mode aerosol loads in the central area (0.032 in CW MED), maximum in the northern part (0.035 in NW MED), and intermediate values in the southern part (0.033 in SW MED), with these variations being more pronounced at 550 nm (Table 1b). Seasonal multi-annual averages of AODF highlight differences of a factor 2 between minimum values in the south in winter (around 0.02 at 865 nm, 0.06 at 550 nm) and maxima in spring (around 0.04 at 865 nm, and 0.12 at 550 nm), especially in the northern part of the region. The POLDER-3-derived mean multi-annual AODCS values at 865 nm (Table 1a) reveal some seasonal variability, with maximum values in summer in the southern part (0.031) and minimum in winter in the northern part (0.013). Although the reasons for such an evolution are not fully understood, considering the similarity to that of AODCNS, this variability could be partly related to the influence of north African dust transport rather than fully representative of a background coarse sea-salt fraction (Claeys et al., 2017). Indeed, Saharan dust might include a spherical coarse aerosol fraction following mixing with soluble secondary components such as sulfate and nitrate (Drugé et al., 2019).
Table 1(a) The 8- (winter) or 9-year (March 2005–October 2013) climatological seasonal averaged values of POLDER-3 advanced aerosol products at 865 nm for the northern (NW MED), central (CW MED), and southern (SW MED) parts of Western Mediterranean basins (defined in Fig. 2). Maximum values are reported in red; minimum values are in blue. (b) Same as Table 1a for AOD, AODF, AODC, and FMF at 550 nm for the northern (NW MED), central (CW MED), and southern (SW MED) parts of Western Mediterranean basins (defined in Fig. 2).
3.3 Temporal evolution at selected sites
The previous regional analysis is complemented by the investigation of the POLDER-3 aerosol properties around three contrasted AERONET sites of the western basin: Ersa (43.00367∘ N, 9.35929∘ E; altitude 80 m), the northernmost site, located on northern coast of the island of Corsica, France; Lampedusa (35.51667∘ N, 12.63167∘ E; alt. 45 m), the southernmost site, located on the northwestern coast of the island of Lampedusa, Italy; Barcelona (41.38925∘ N, 2.11206∘ E; alt. 125 m), the westernmost site, located in a urban/coastal environment on the shore of northeastern Spain (Fig. 2). Ersa and Barcelona are sites under the influence of long-range Saharan dust transport, whereas Lampedusa is subject to short to medium-range dust transport. Ersa and Lampedusa are marine background sites with some anthropogenic influence; Barcelona is located in a heavily polluted environment. Ersa and Lampedusa were the two super-sites of the ChArMEx (Chemistry-Aerosol Mediterranean Experiment) collaborative research program, and Barcelona, which is also part of EARLINET/ACTRIS network, one of the secondary sites of this program (Mallet et al., 2016). In this context, the long-term AERONET routine aerosol measurements at these sites have been used for the comprehensive regional validation of POLDER-3 retrievals presented in Formenti et al. (2018). Here, we considered the same POLDER-3 data set by selecting superpixels within ±0.5∘ around the AERONET sites, corresponding to a maximum number of 17 at Ersa, 28 at Lampedusa, and 13 at Barcelona.
3.3.1 Monthly time series
Figures 4, 5, and 6 illustrate the month-to-month evolution from March 2005 to October 2013 of POLDER-3 retrievals at 865 nm, extracted at Ersa, Barcelona, and Lampedusa, respectively, including (a) AOD, (b) AODF and AODC, (c) AODCNS and AODCS, (d) AE865–670 and FMF. At these three sites, AE and FMF (Figs. 4d, 5d, 6d) show remarkably similar variability (correlation coefficients of r>0.9), indicating that the AE is a good proxy of the proportion of fine particle components relative to total AOD.
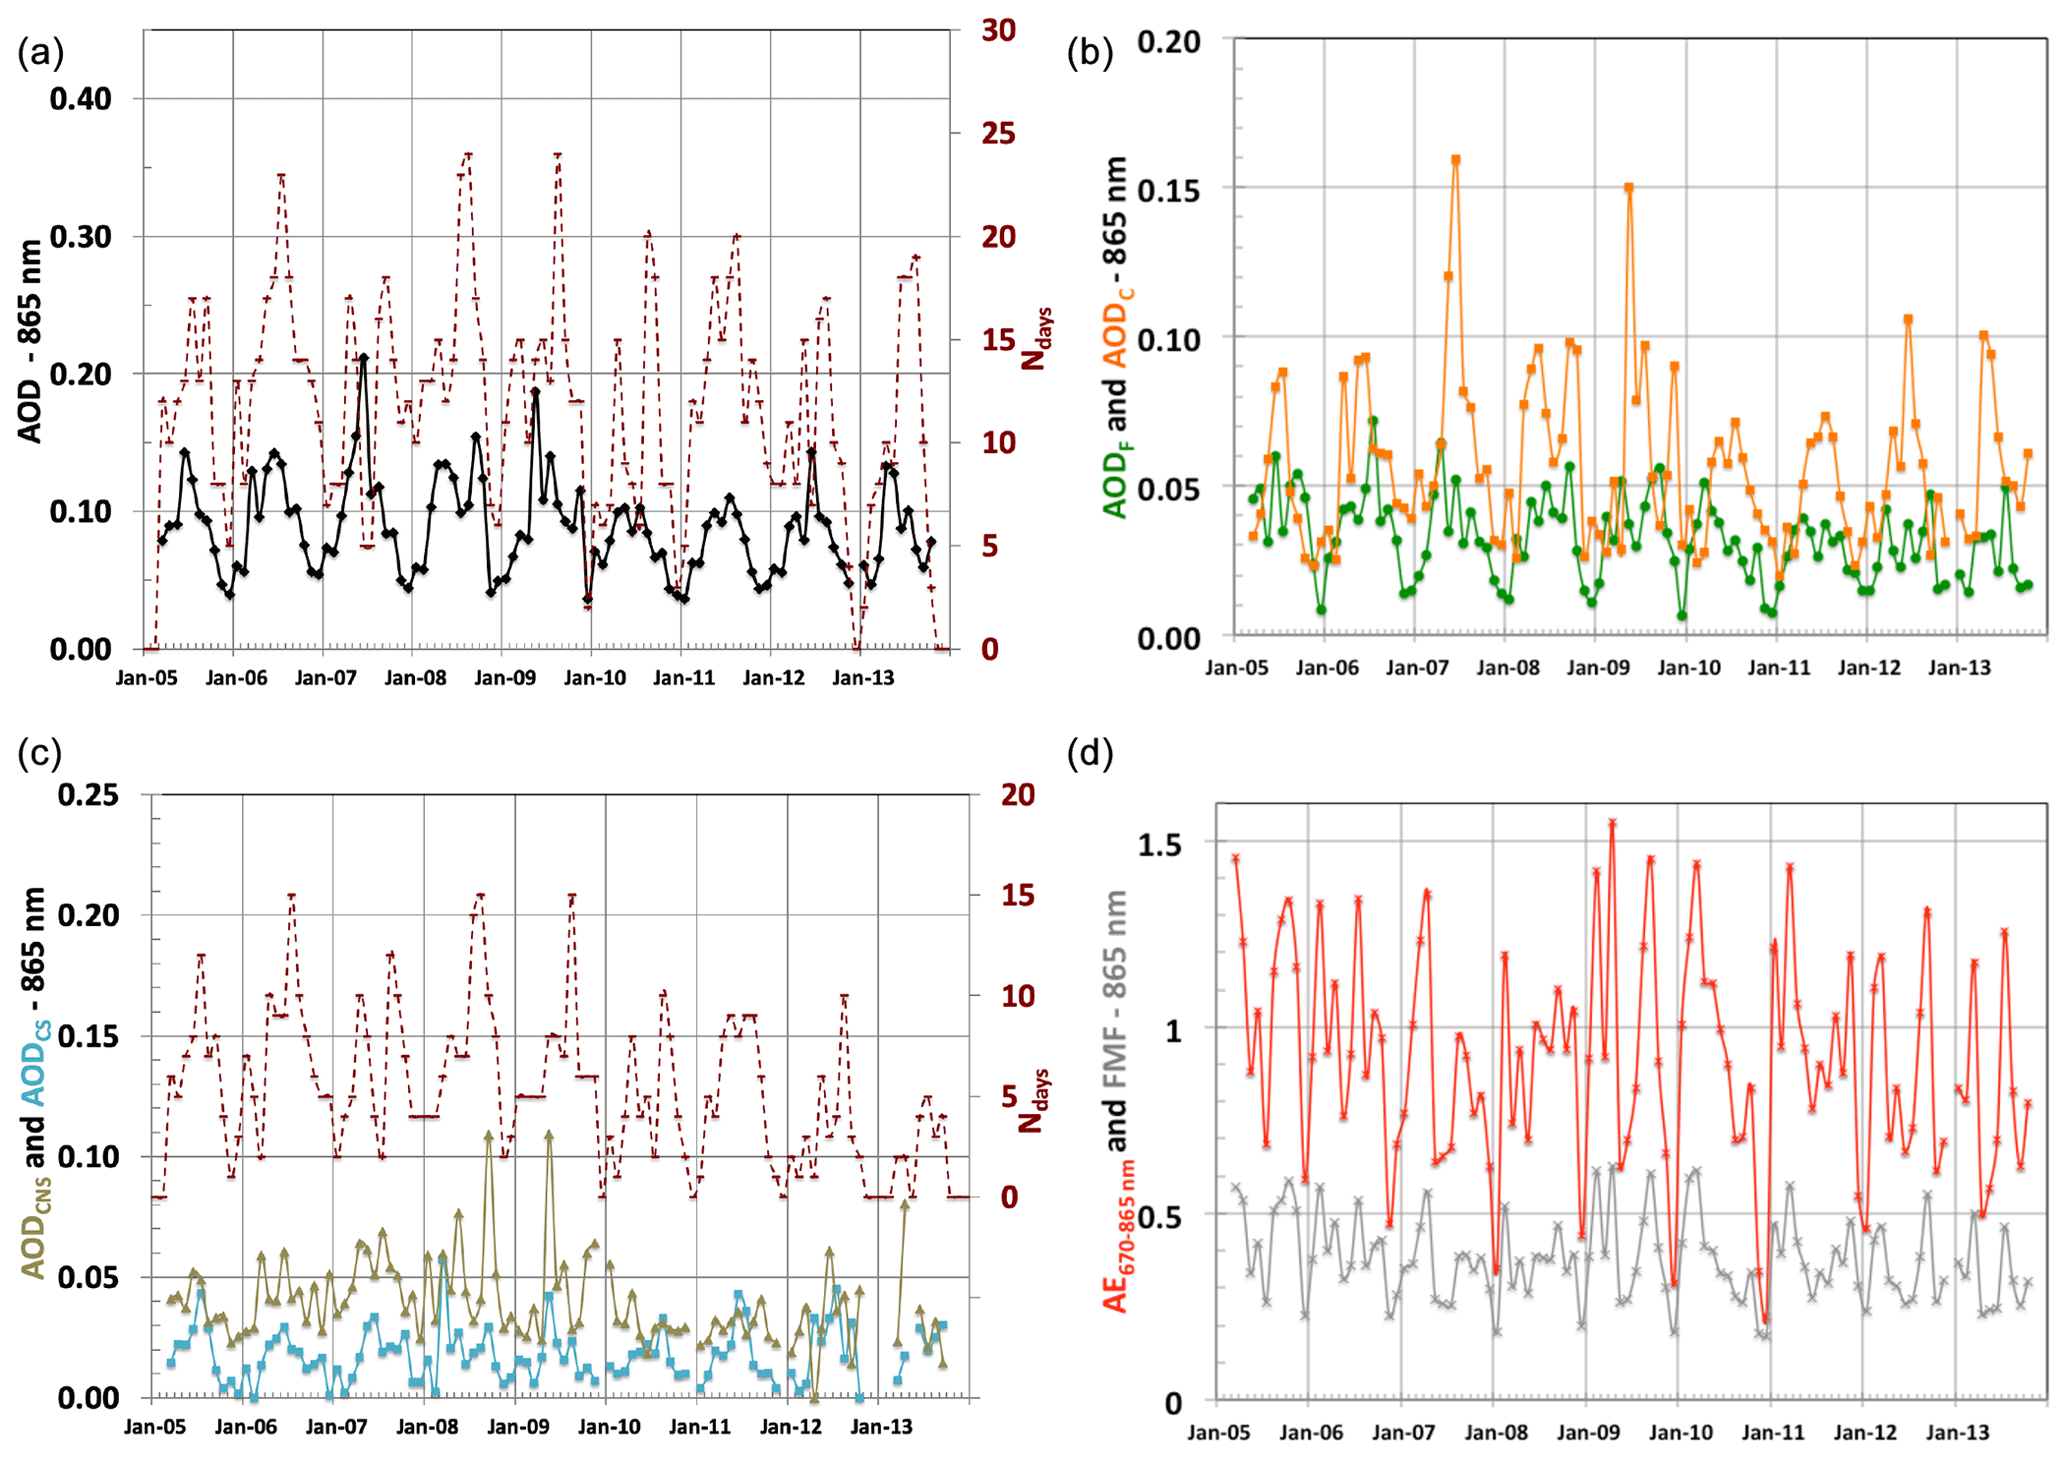
Figure 4POLDER-3 monthly mean retrievals of (a) AOD, (b) AODF and AODC, (c) AODCNS and AODCS, (d) AE865–670 and FMF at 865 nm at Ersa over the period 2005–2013. The number of days of observations available for each month is reported for all clear days (right axis; a) and for best viewing conditions (right axis; c) necessary for retrievals of AODCNS and AODCS.
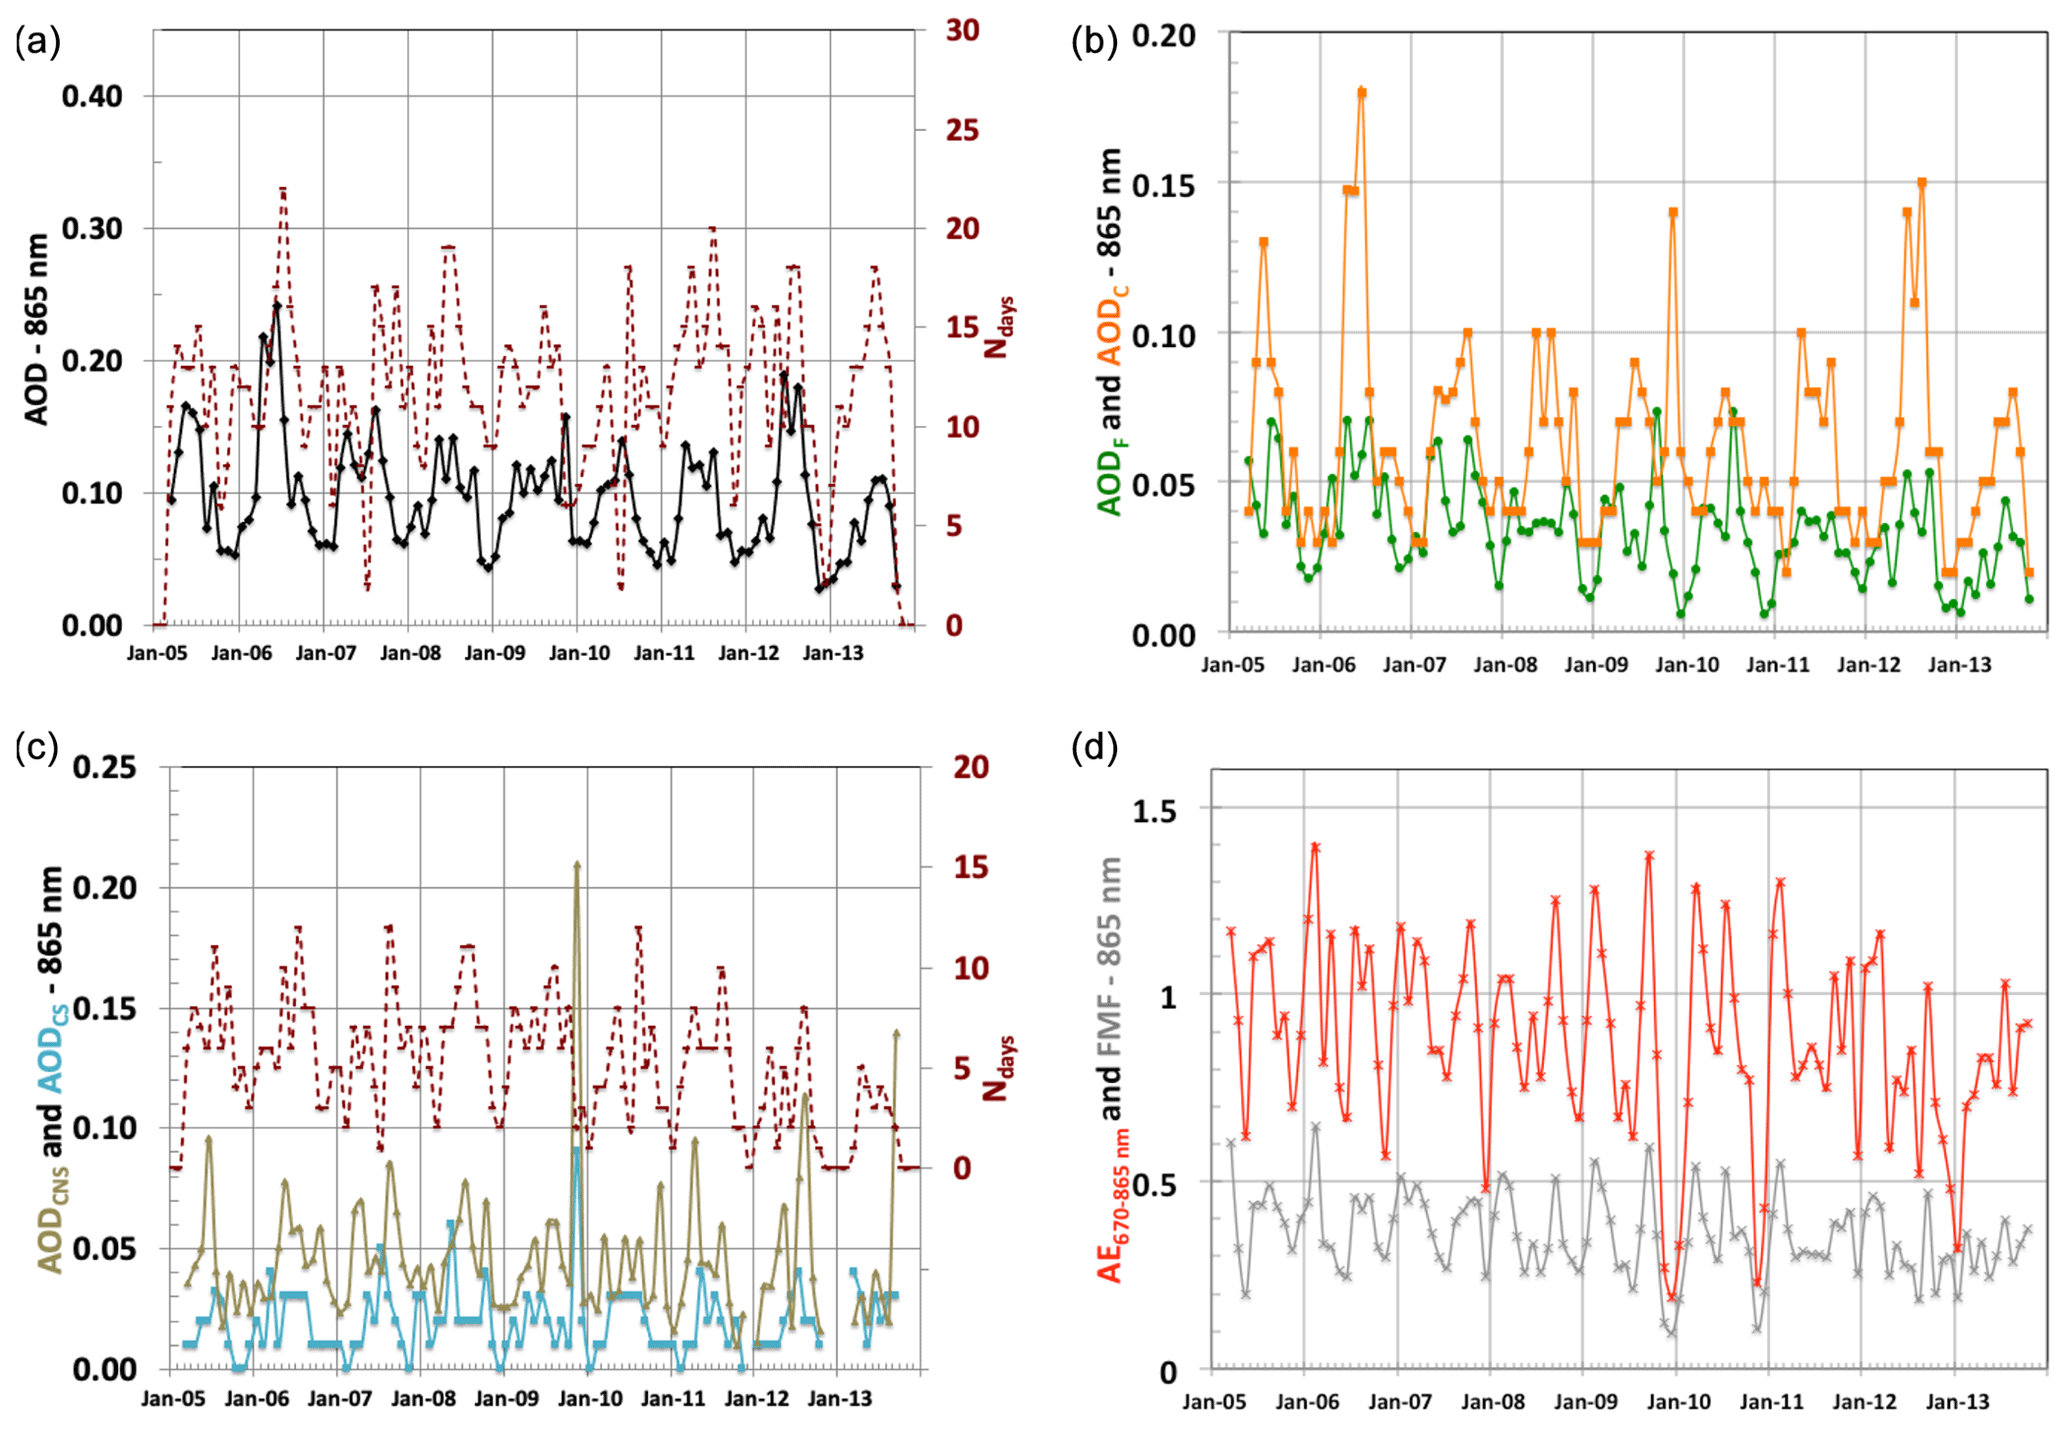
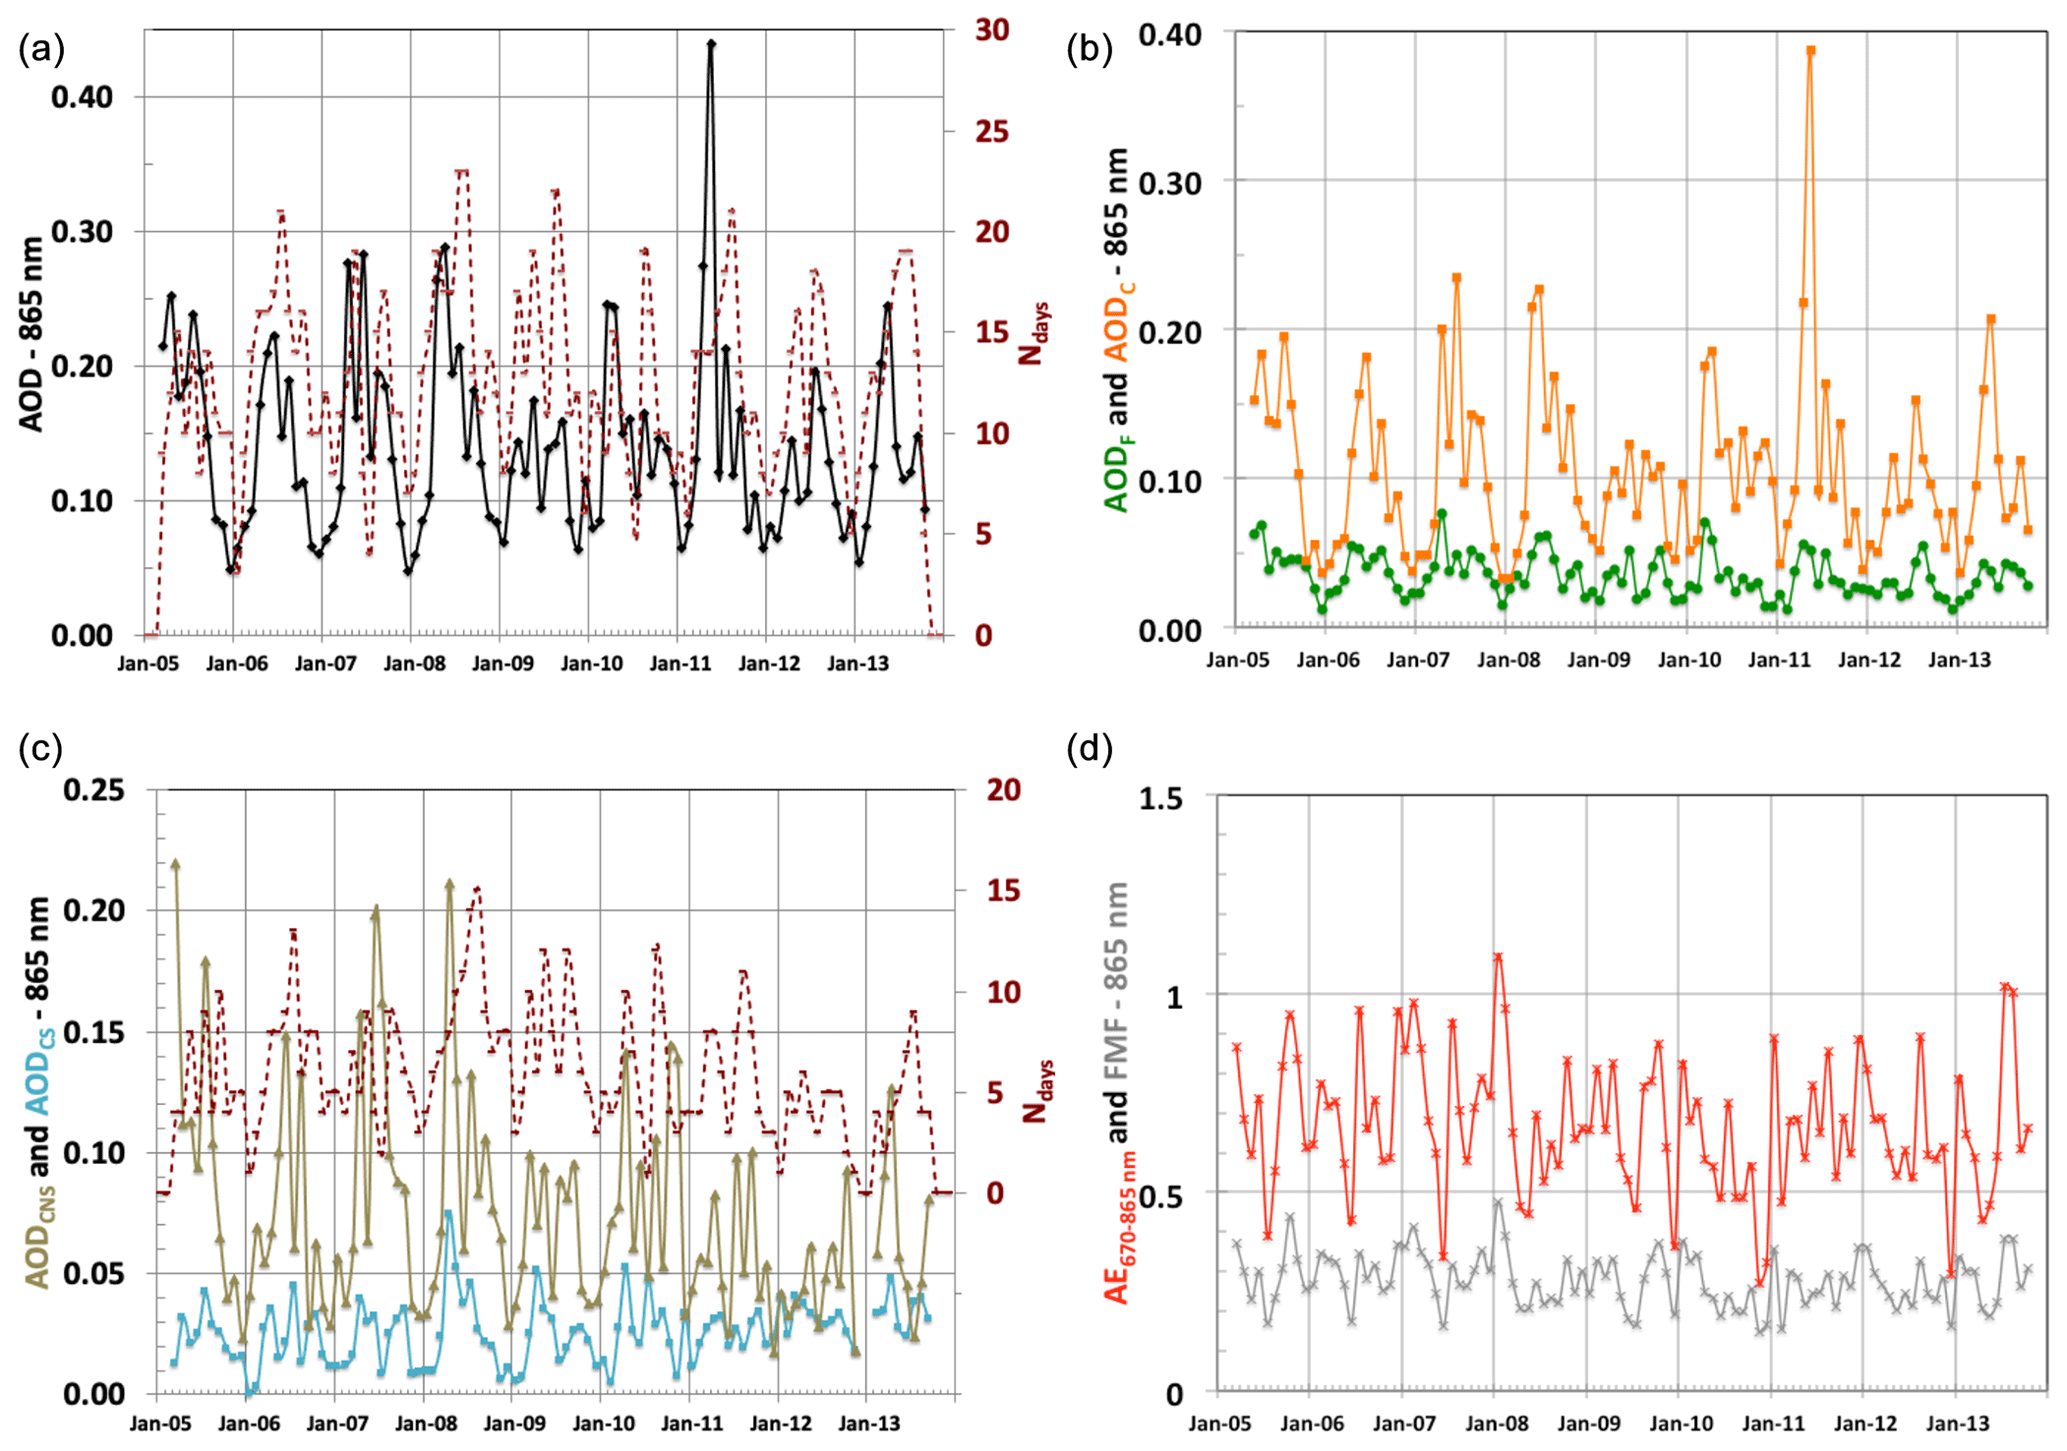
Figure 6Same as Fig. 4 for Lampedusa. Note that the scale of panel (b) is different from that in Figs. 4b and 5b.
The average monthly FMF of the AOD at 865 nm at Ersa is estimated at 37 % by POLDER-3 in all clear-sky conditions, with a range of monthly mean values between 18 % and 65 %. Consistently, considering only the POLDER-3 retrievals available in the best viewing conditions, the averaged repartitions in terms of aerosol size mode and shape contributions to the total AOD at 865 nm at Ersa are 36 % for the fine AOD, 44 % for the non-spherical coarse mode, and 20 % for the spherical coarse mode.
As a consequence of the influence of short- to medium-range Saharan dust transport in Lampedusa, POLDER-3 AODs show their highest monthly mean values at this site (up to 0.44 in May 2011, Fig. 6a) compared to both Ersa (max of 0.21 in June 2007, Fig. 4a) and Barcelona (max of 0.24 in June 2006, Fig. 5a). These maximum AOD values are associated with coincident maximum values of monthly mean AODC, with 0.39 in May 2011 in Lampedusa (Fig. 6b), 0.18 in June 2006 in Barcelona (Fig. 5b), and 0.16 in June 2007 in Ersa (Fig. 4b).
Figures 4–6 highlight that POLDER-3 monthly mean AOD values above 0.10 are much more frequent in Lampedusa (66 % frequency over the 104 months of POLDER-3 observations) than in Barcelona (43 % frequency) and Ersa (30 %). The contrast between the three sites is even more pronounced considering the AODC retrievals, with frequencies of monthly values above 0.10 reaching 44 %, 22 %, and 5 % for Lampedusa, Barcelona, and Ersa, respectively. Conversely, the monthly evolution of AODF reported in Figs. 4b, 5b, and 6b does not show such a marked contrast, nor with respect to the maximum values (0.072, 0.074, and 0.076 in Ersa, Barcelona, and Lampedusa, respectively), or the frequency of monthly mean values above 0.04 (27 %, 31 %, and 34 %, respectively).
The months with POLDER-3 mean derived FMF greater than 50 % represent a frequency of 10 % over the whole monthly data set in Barcelona (Fig. 5d) and 0 % in Lampedusa (Fig. 6d). Compared to their frequency in Ersa (17 %, Fig. 4d), POLDER-3 retrievals suggest that the influence of fine particles is more frequent in Ersa, possibly due to the transport of polluted air masses from highly industrialized regions (Po Valley, Marseille–Fos–Berre, for example) in the northern part of the basin (Mallet et al., 2016). These features could also reflect the high influence of desert dust at Lampedusa and to less extent at Barcelona, which may partly hide the possible influence of fine aerosols of anthropogenic origin at these two sites.
Over the whole POLDER-3 observing period, maximum monthly mean values of AODCS range from 0.058 in Ersa (March 2008, Fig. 4c) to 0.075 in Lampedusa (April 2008, Fig. 6c) and 0.090 in Barcelona (November 2009, Fig. 5c). Frequencies of monthly mean POLDER-3 AODCS values above 0.03 are 13 %, 31 %, and 38 % at Ersa, Barcelona, and Lampedusa, respectively. Such a variability suggests some impact of desert dust on AODCS, although the contribution of sea-salt particles or a combination of both aerosol types cannot be excluded. Maximum monthly AODCNS values range from 0.109 at Ersa (September 2008 and May 2009, Fig. 4c) to 0.210 at Barcelona (November 2009, Fig. 5b) and 0.220 at Lampedusa (March 2005, Fig. 6c). Frequencies of monthly mean POLDER-3 AODCNS values above 0.03 reach 91 % in Lampedusa, 70 % in Barcelona, and 67 % in Ersa. Considering only the POLDER-3 retrievals available in the best viewing conditions, the averaged contributions in terms of aerosol size and shapes at Barcelona are quite similar to those estimated at Ersa, with 34 % of fine AOD, 46 % of coarse non-spherical AOD, and 20 % of coarse spherical AOD at 865 nm. At Lampedusa, the averaged contribution of fine AOD is reduced to 26 %, with a higher contribution of coarse non-spherical AOD (55 %) and a rather constant relative contribution of coarse spherical AOD (19 %).
3.3.2 Daily time series
Figure 7 shows the frequency distributions for daily POLDER-3 AOD (a), AODF (b), AODC (c), AODCS, and AODCNS (d) at 865 nm at Ersa, Barcelona, and Lampedusa, their daily evolutions from 4 March 2005 to 10 October 2013 being reported in Fig. S4 of the Supplement. Table 2 presents a statistical summary of the daily POLDER-3 aerosol retrievals for these three sites.
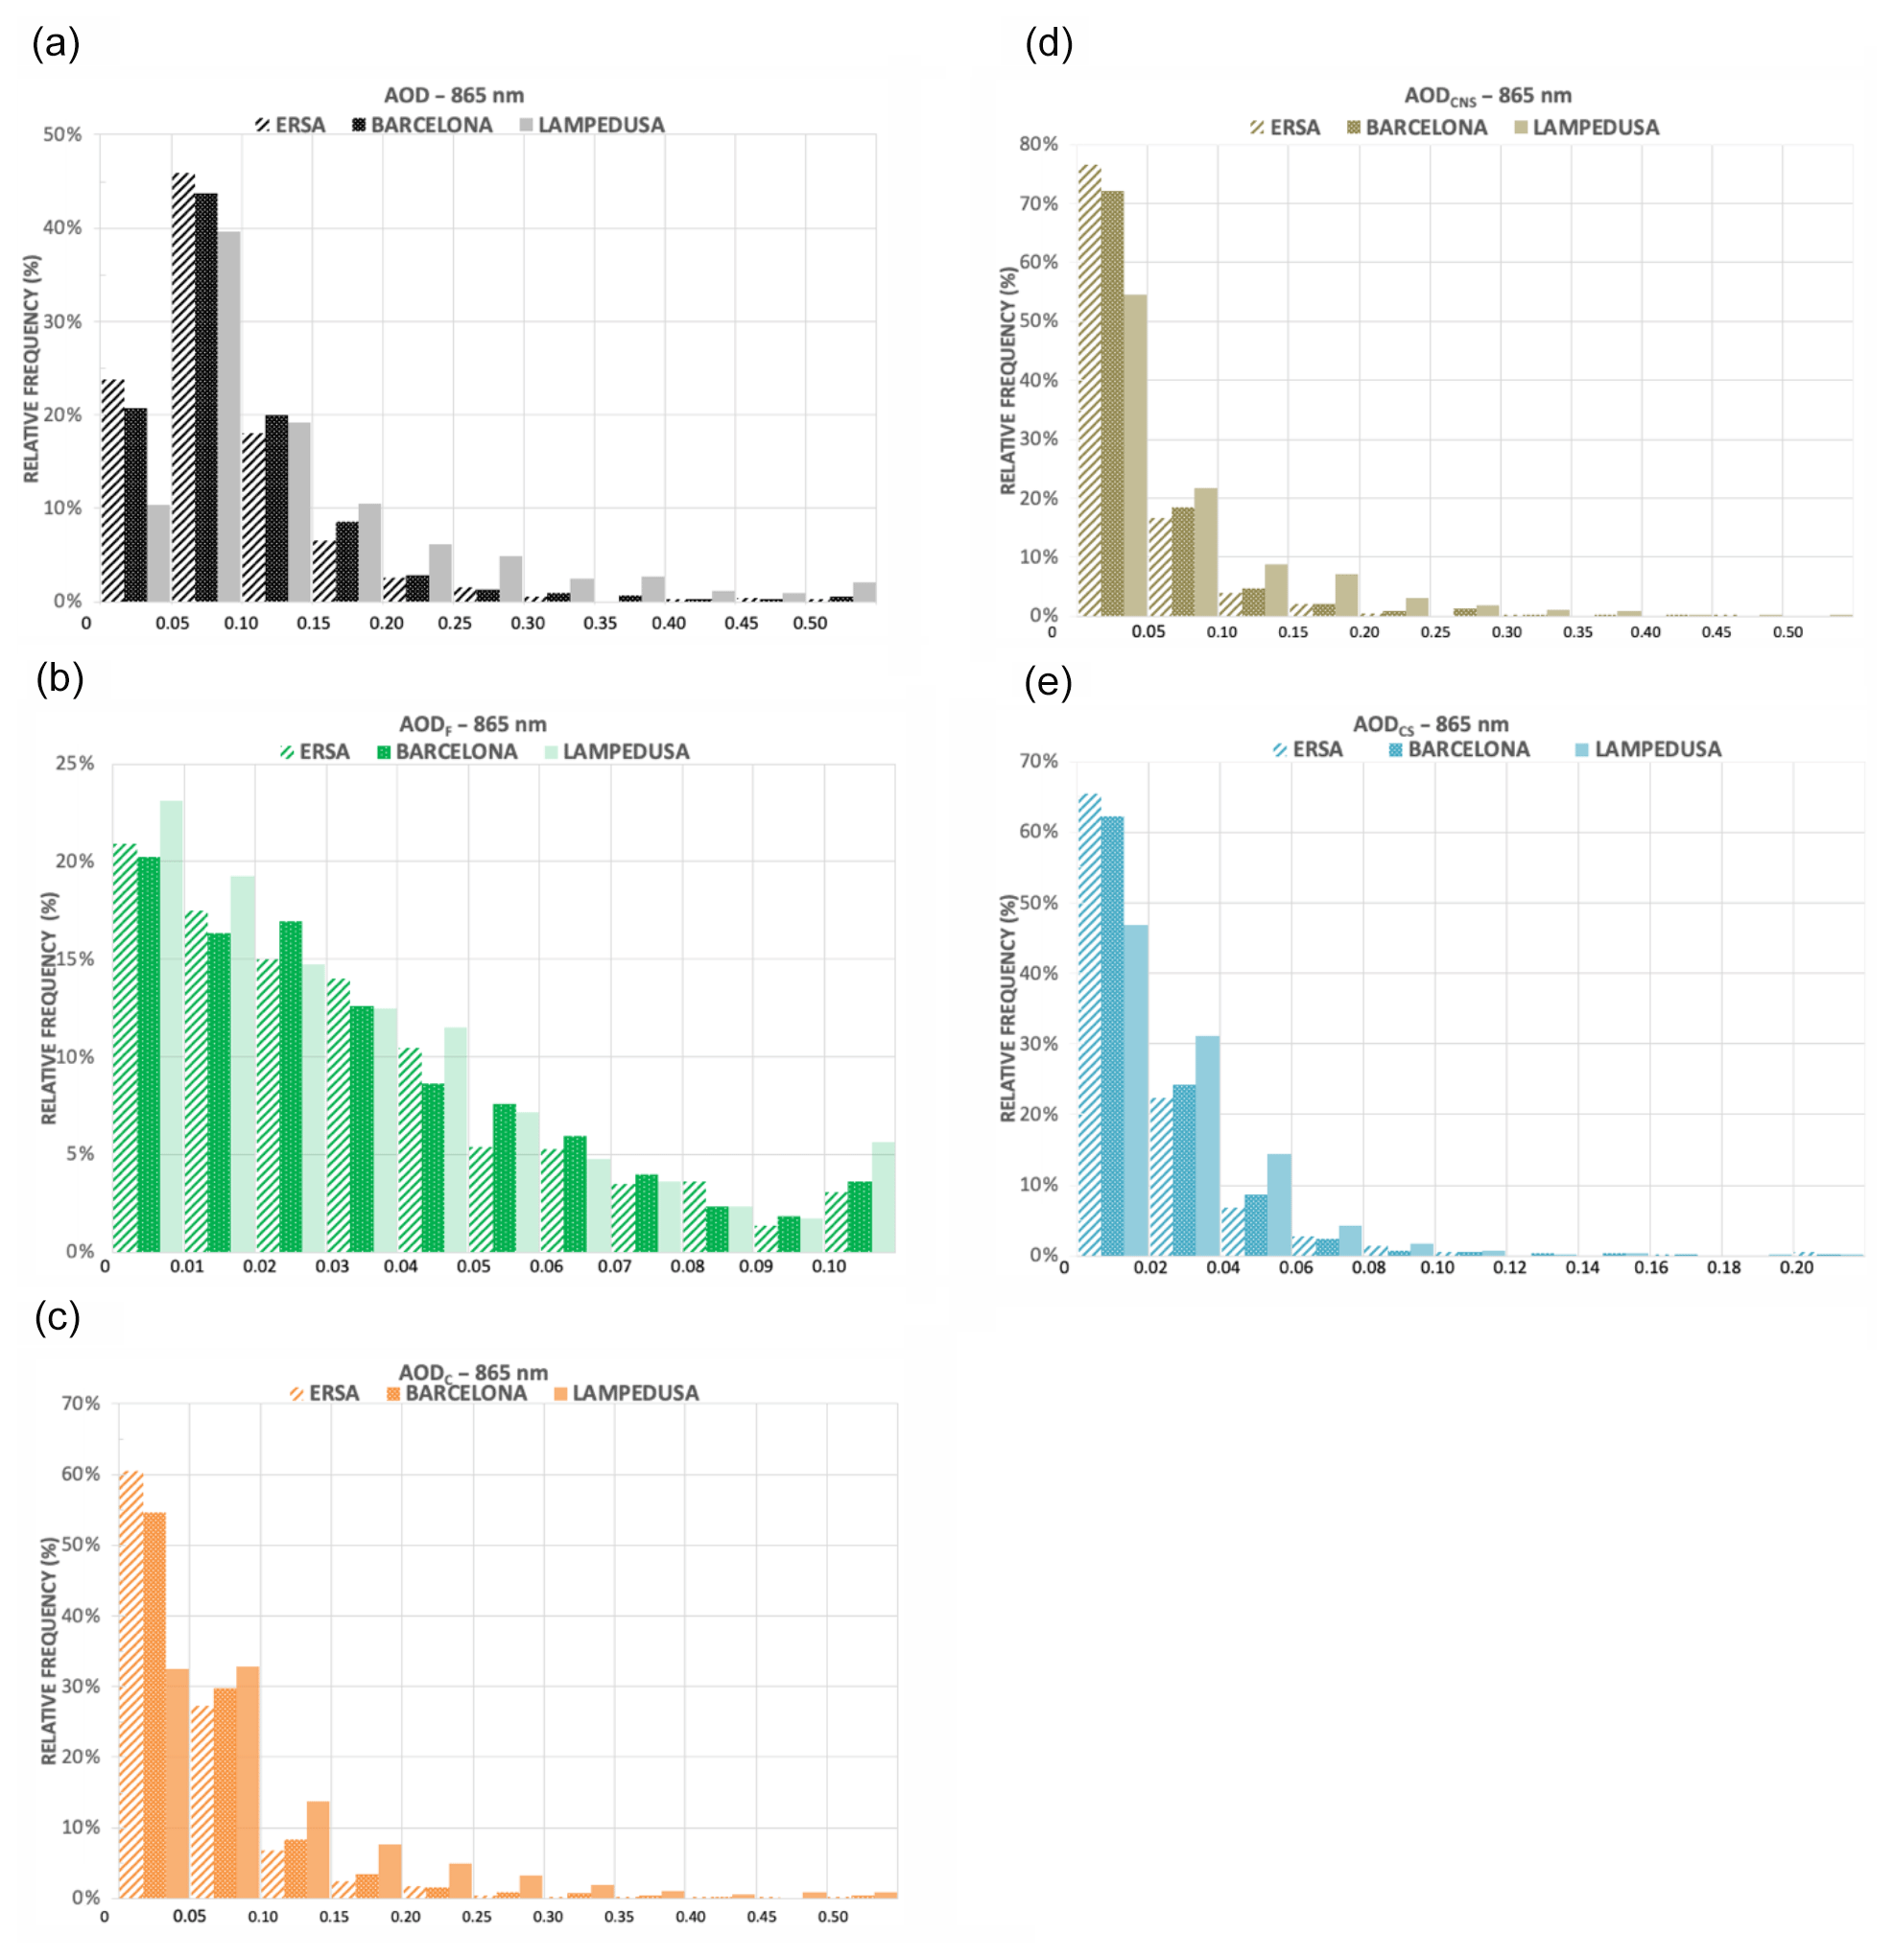
Figure 7Frequency histograms for POLDER-3 daily retrievals at 865 nm of (a) AOD, (b) AODF, (c) AODC, (d) AODCNS, and (e) AODCS at Ersa, Barcelona, and Lampedusa.
Table 2Statistics of POLDER-3 daily retrievals of AOD, AODF, AODC, AE, FMF, AODCS, and AODCNS at three main stations, Ersa, Barcelona, and Lampedusa, for the period March 2005–October 2013. The numbers of POLDER-3 retrievals available at each station for all clear-sky pixels (ACSPs) and for best viewing conditions (BVCs) are reported.
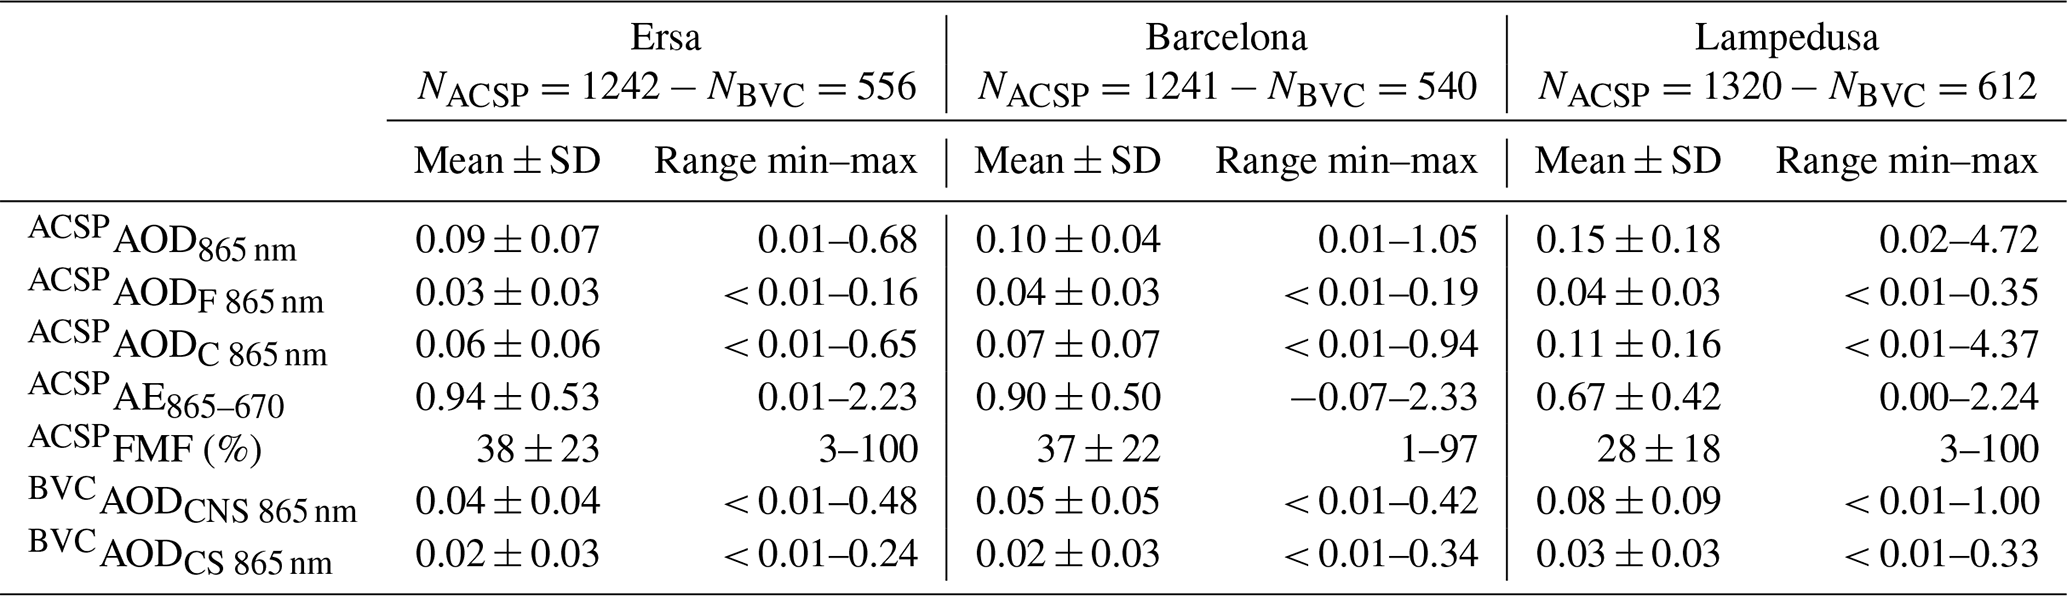
The range of AOD values varies from 0.01 to 0.68 at Ersa, 0.01 to 1.05 at Barcelona, and 0.02 to 4.72 at Lampedusa, indicating the occurrence of extreme AOD events at the southernmost site of Lampedusa. Daily AODs > 0.3 occur 9 % of the time in Lampedusa, less than 3 % of the time in Barcelona, and are rare in Ersa (1.5 % frequency). At the three sites, they are characterized by comparable size/shape properties typical of desert dust influence (low AE and FMF, dominant non-spherical aerosol fraction in the coarse mode). These POLDER-3 retrievals are consistent with the Gkikas et al. (2013) climatology of intense desert dust events in the Mediterranean, which recorded extreme dust episodes mostly in the southern part of central Mediterranean, where Lampedusa is located, with AOD550 nm values > 2.5 and up to 4.
The background aerosol conditions, corresponding to low POLDER-3 AOD865 nm (< 0.05) show an average occurrence of 22 % of the time in Ersa, 20 % in Barcelona, and only 9.5 % in Lampedusa. These features show that, over the March 2005–October 2013 period, POLDER-3 has recorded very low occurrence of pristine days, i.e., clean conditions associated with low aerosol loads, especially at Lampedusa.
As reported in Table 2, the average daily AOD (865 nm) is 0.09 (standard deviation 0.07) in Ersa, 0.10 (standard deviation 0.04) in Barcelona, and 0.15 (standard deviation 0.18) in Lampedusa, reflecting both higher frequency and intensity of aerosol episodes in Lampedusa, as illustrated in Fig. S4a. This is also verified for POLDER-3 retrievals of AODc and to a certain extent AODF, which reach their maximum values in Lampedusa (4.4 and 0.35, respectively). However, POLDER-3 shows that at 865 nm, the AODF is always lower than 0.2 (Fig. S4b), except at Lampedusa for a reduced number of days (4). At this site, peaks of AODF seem to be associated with peaks of AODC, suggesting the influence of desert dust on both aerosol size components, and/or the double influence of two different aerosol types (i.e., possibly both dust and anthropogenic). POLDER-3 AODCS and AODCNS time series, shown Fig. S4d, are more difficult to interpret because of sampling reduction by more than 50 % compared to POLDER-3 retrievals associated with ACSPs (i.e., AOD, AODF, AODC, AE), due to the necessity of the best viewing conditions (BVCs) for their retrieval, as reported in Table 2. Despite this limitation, Fig. S4d and Table 2 show high variability of both spherical and non-spherical aerosols in the coarse mode, with a larger range of daily values for AODCNS (up to 1.00 in Lampedusa) than for AODCS (maximum 0.34 in Barcelona). Considering the three sites, POLDER-3 mean retrievals of daily AODCNS (0.04–0.08) are on average more than 2 times larger than those of AODCS (0.02–0.03).
3.4 Interannual evolution
Annual maps of POLDER-3 AOD, AODC, and AODF at 865 nm are displayed for each of the 9 available observations years (2005 to 2013) in Fig. 8. The annual averages are computed over the period March–October only in order to consistently consider the 9 years in the whole available period. The leftover period of November–February is hopefully the period where AOD is the lowest in the region (Fig. 3). Figure 8 highlights a significant interannual variation in AOD (left column), characterized by elevated aerosol loads for specific years, as 2007 and 2008, and lower AOD ranges in 2009 and 2013. The interannual variations of POLDER-3 AODC (middle column) tend to be relatively similar to those of AOD, especially over the southern part of the basin. Figure 8 also suggests that the maximum values of AODF (right column) were observed in the first half of the period of study, with an evolution toward more moderate to low loads in fine particles apparent from 2010. Figure S5 of the Supplement confirms such an evolution with annual maps of POLDER-3 AODF extrapolated at 550 nm for each of the 9 observation years. The year 2007 appears highly polluted in fine particles over the whole basin. Over the most eastern part of the region, the intense plume observed by POLDER-3 can be related to the occurrence of devastating fires in Greece in the summer of 2007, producing large amounts of biomass burning aerosols transported downwind over the central Mediterranean (Kaskaoutis et al., 2011).
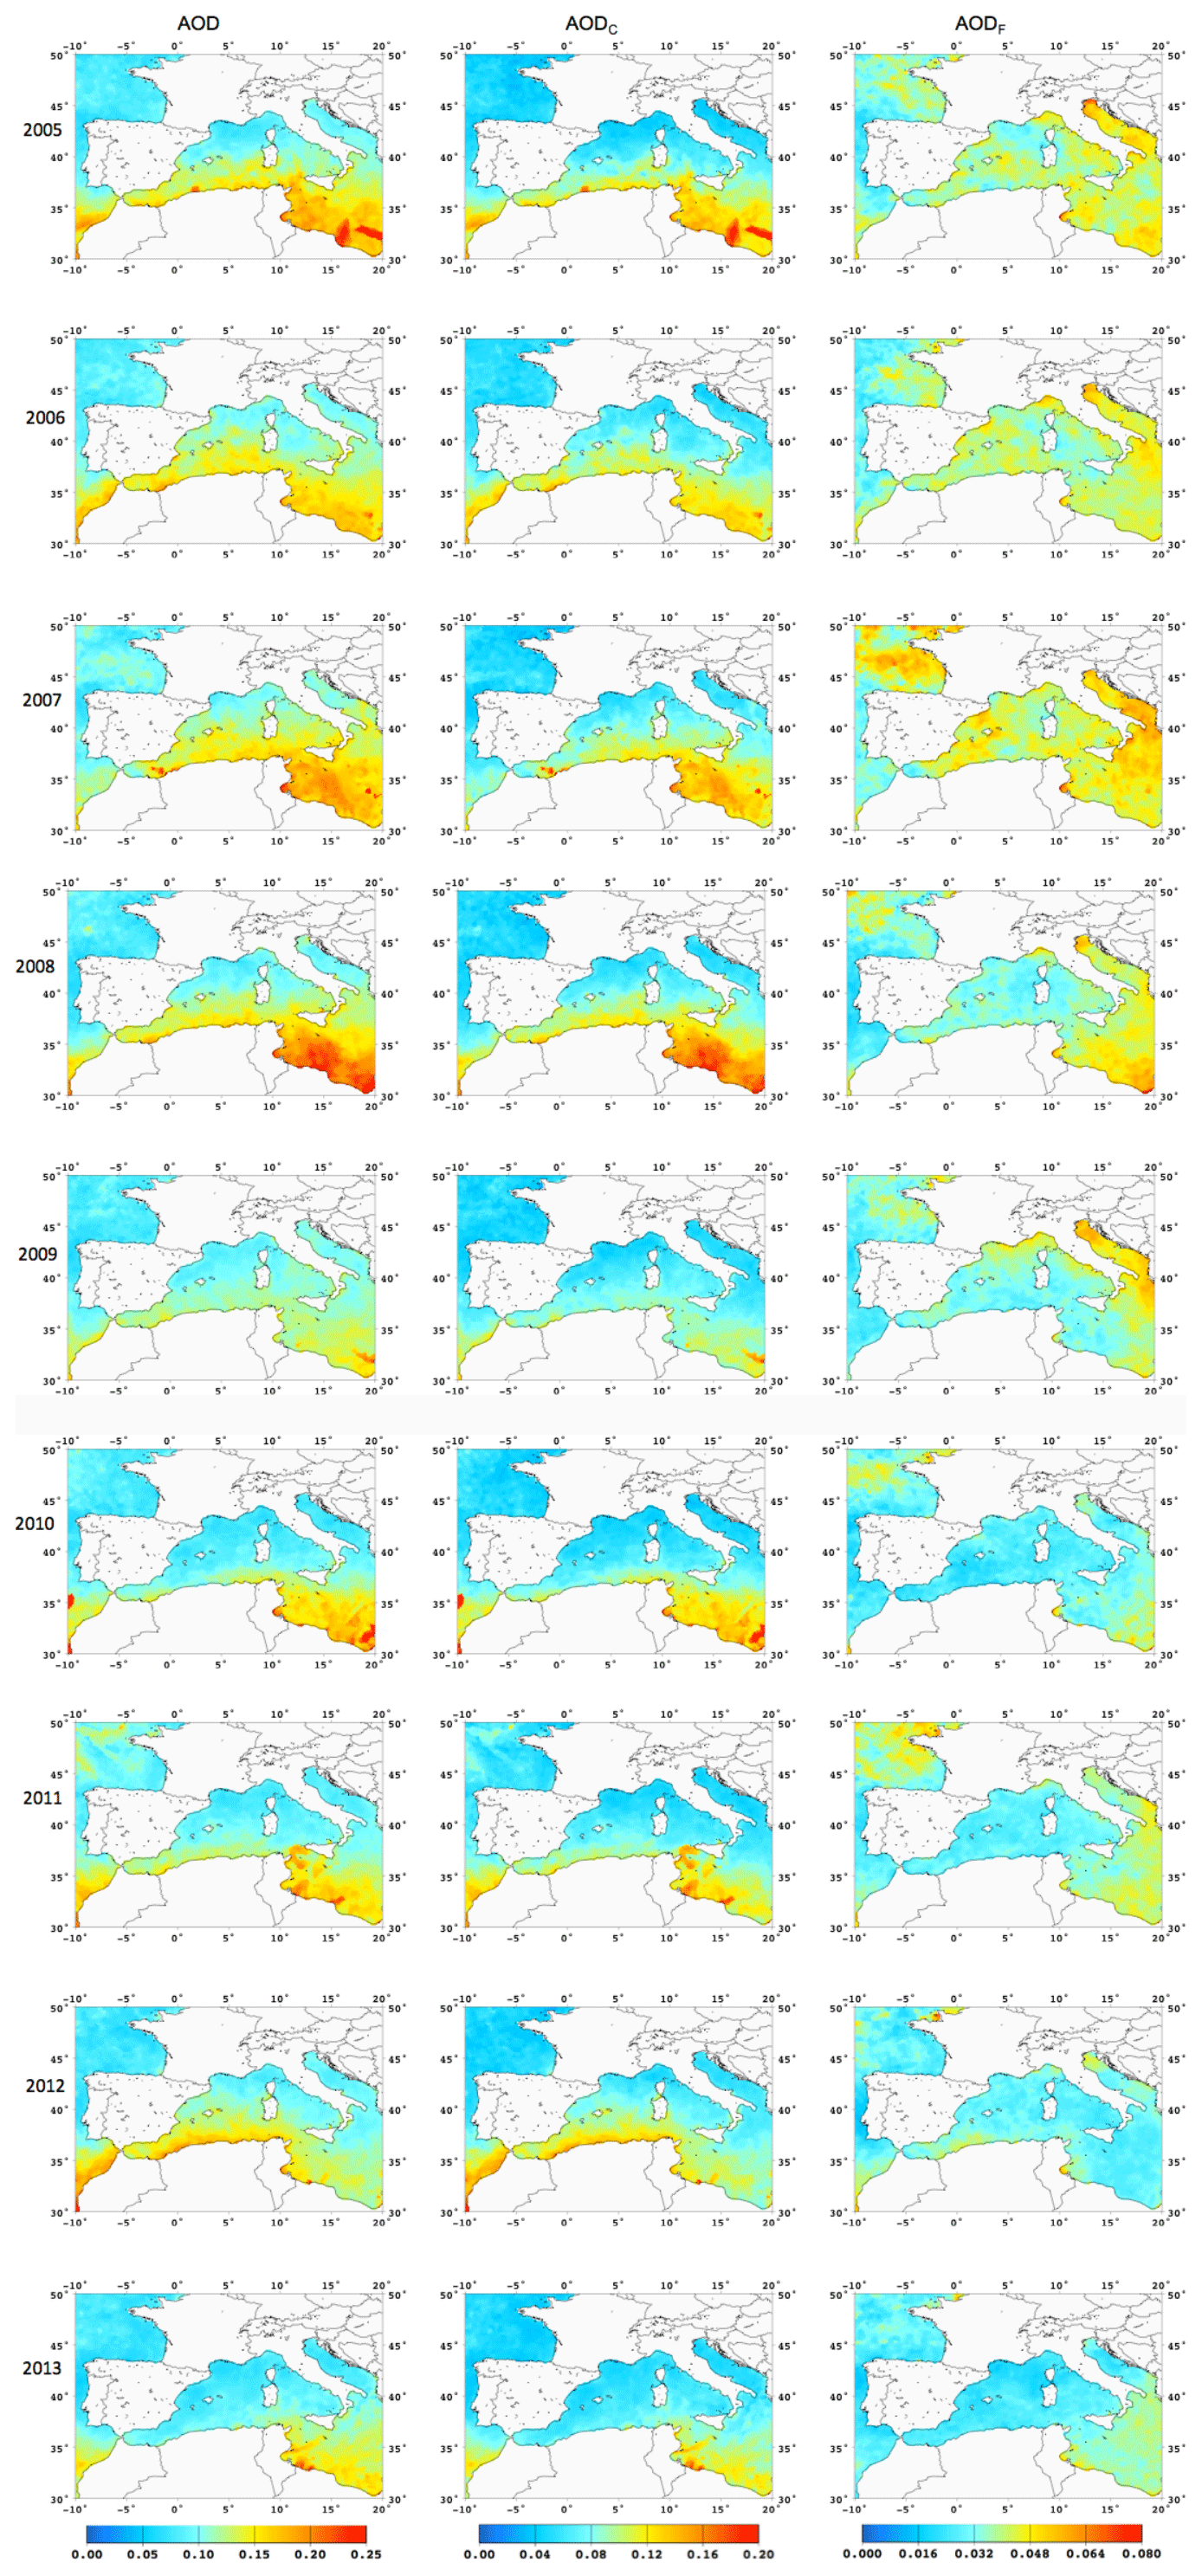
Figure 8March–October annual averages of POLDER-3 AOD (left), AODC (middle), and AODF (right) at 865 nm from 2005 to 2013.
In order to analyze further these interannual evolutions, Fig. 9 presents the time series of annual averages of POLDER-3 AOD, AODF, and AODC at 865 nm spatially averaged over the northern, central, and southern parts of the Western Mediterranean basins (left column, defined in Fig. 2) and extracted at Ersa, Barcelona, and Lampedusa (right column) for the period March 2005–October 2013. The associated monthly anomalies, computed by subtracting to each monthly averaged value of a specific year its corresponding long-term monthly average (2005–2013), are shown in Fig. S6 of the Supplement. Linear regressions are applied to both March–October annual averages and monthly anomalies of POLDER-3 AOD, AODF, and AODC evolution as a function of time. The values of the slopes, reported in Tables 3 and 4, provide the sign and magnitude of the trends at 865 nm. Slopes derived from the same analysis of POLDER-3 AOD, AODF, and AODC extrapolated at 550 nm are reported in Tables S1 and S2 of the Supplement.
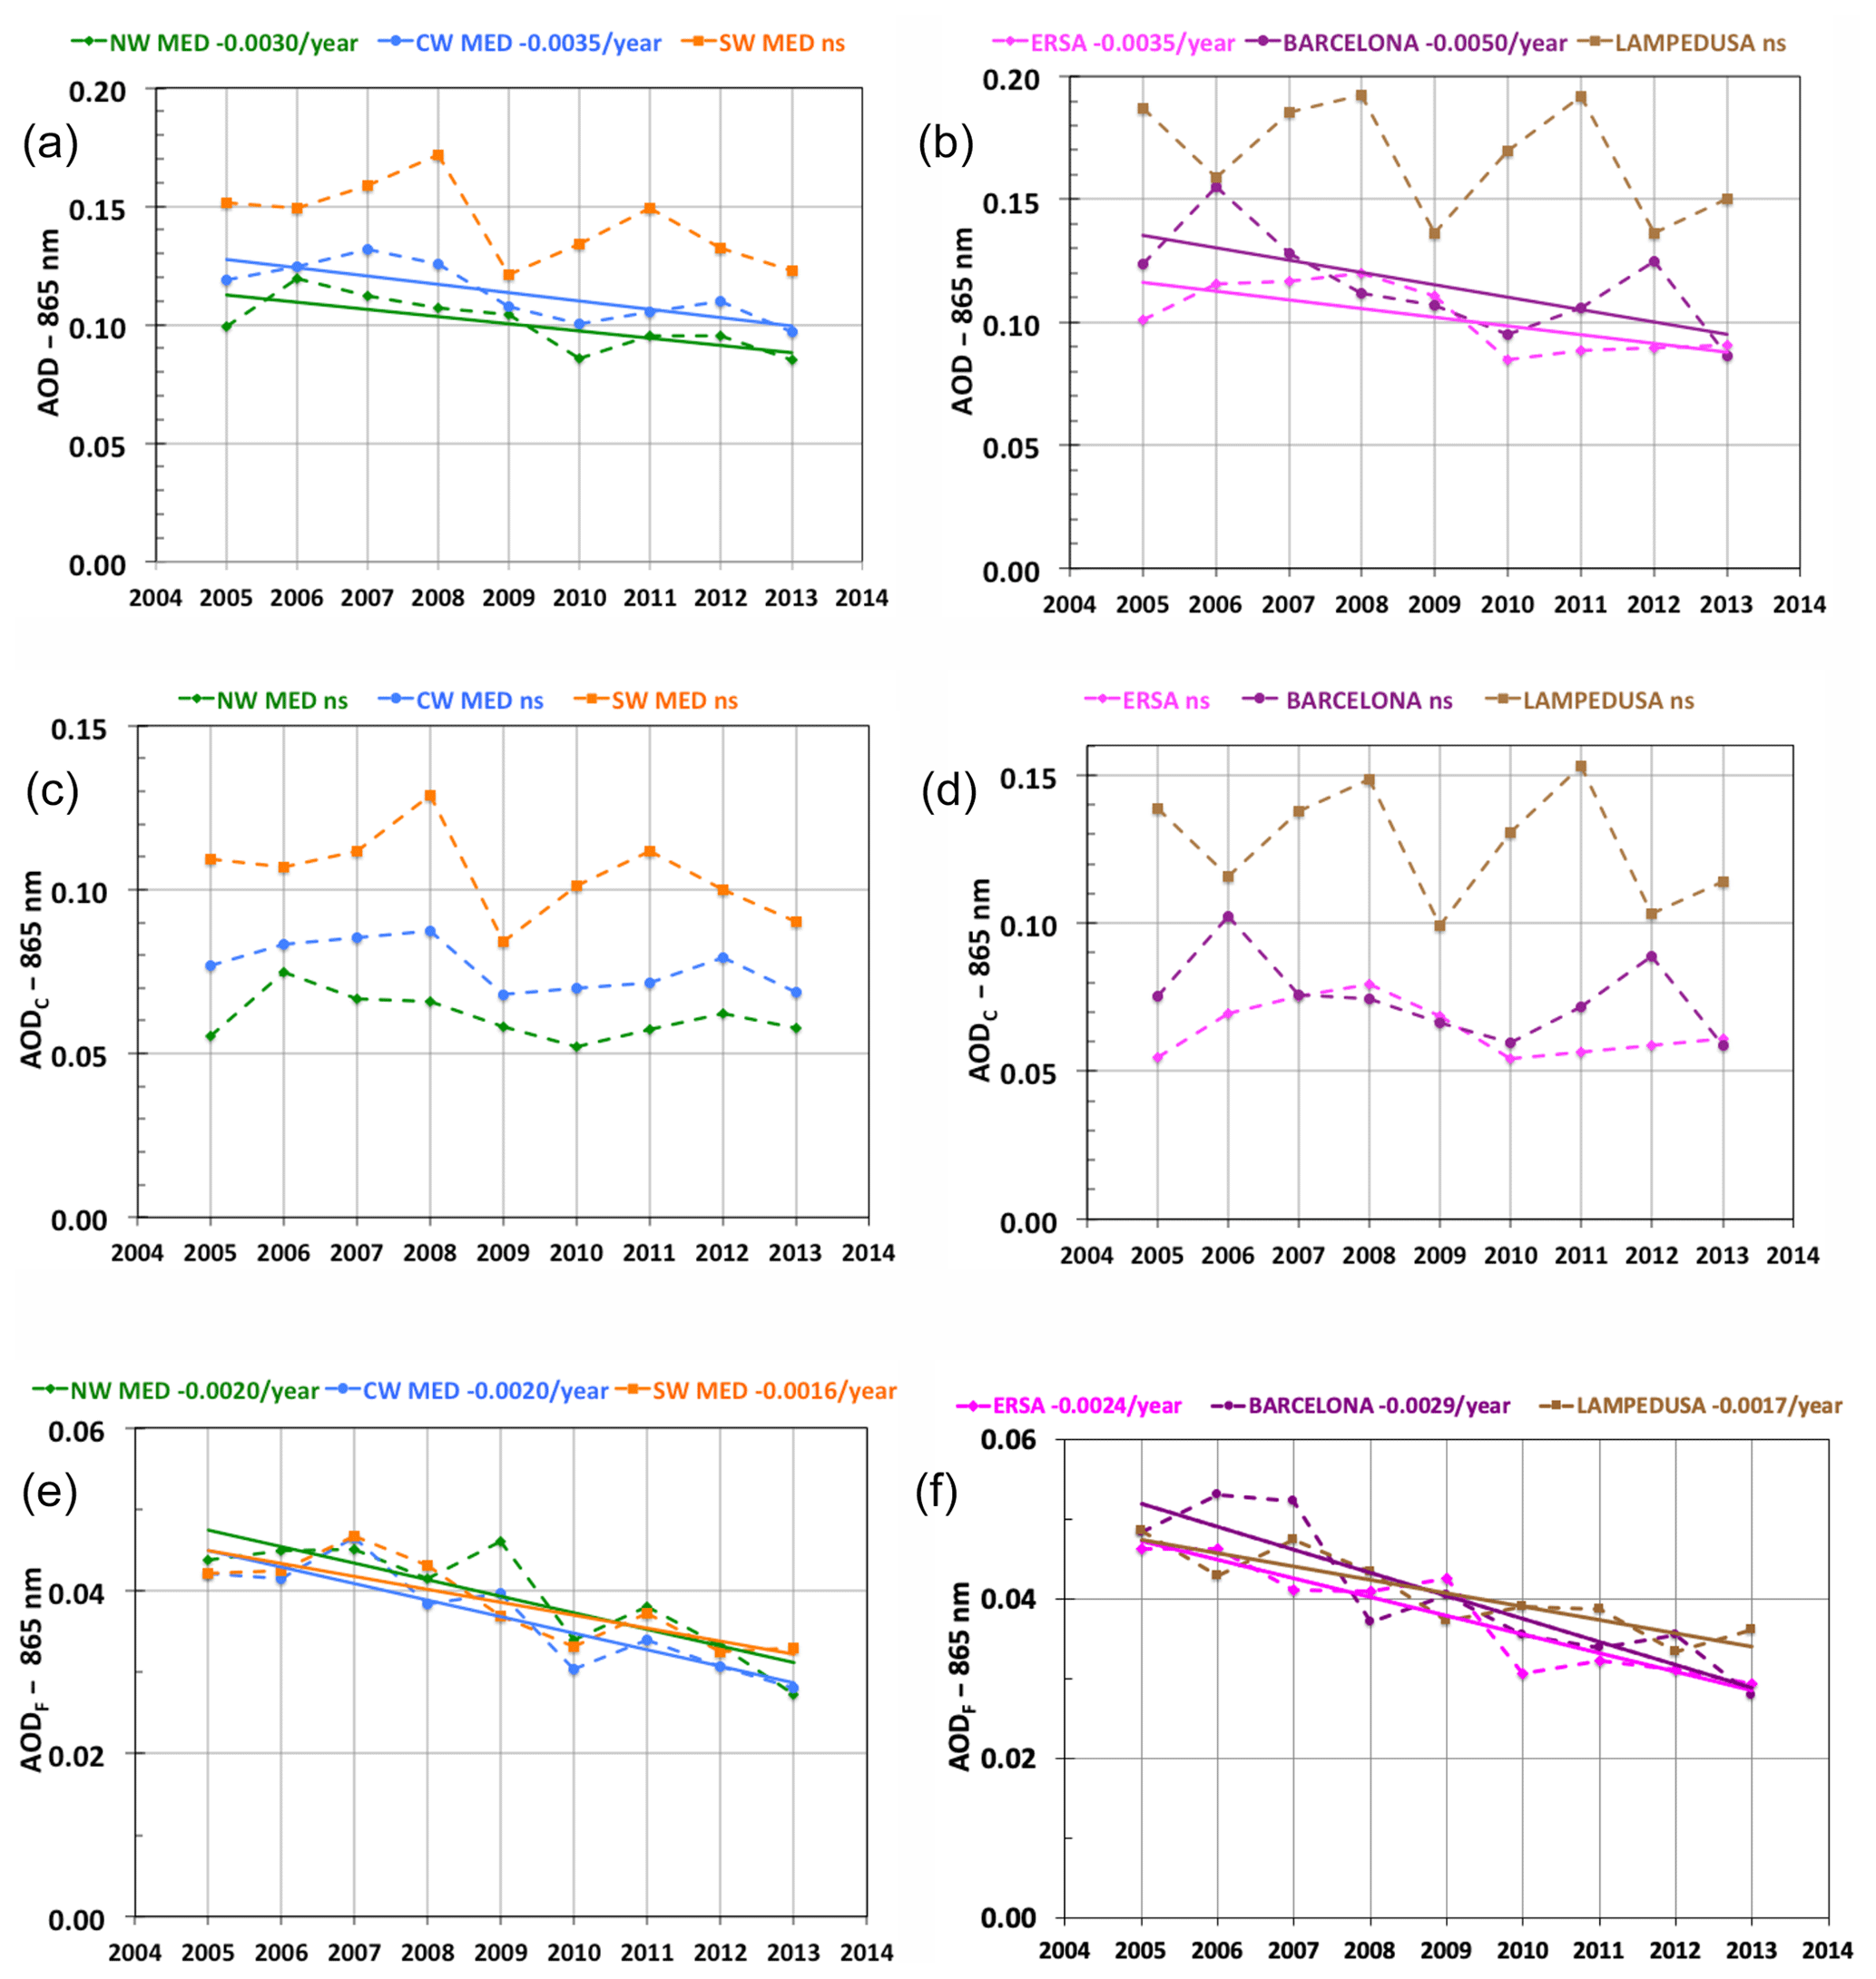
Figure 9March to October yearly means of POLDER-3 retrievals at 865 nm over the period 2005–2013: AOD (a, b), AODCOARSE (c, d), AODFINE (e, f). In the left column, spatial averages over the northern (NW MED, green curves), central (CW MED, blue curves), and southern (SW MED, orange curves) parts of Western Mediterranean basins (defined Fig. 2) are shown. In the right column, values extracted at Ersa (pink curves), Barcelona (purple curves), and Lampedusa (brown curves) are shown. Trends (yr−1) are plotted when significant according to the Student t test, as summarized in Table 3.
Table 3POLDER-3 865 nm AOD, AODCOARSE and AODFINE trends per year derived from March–October annual means and monthly mean anomalies over the 2005–2013 period for NW MED, CW MED, and SW MED. The corresponding annual evolutions are shown in Fig. 8. Trends (yr−1) are shown with their standard deviations (±1 s). Values in bold indicate statistically significant trends at the * 95 % confidence level and 99 % confidence level, as determined by the Student t test.

Table 4POLDER-3 865 nm AOD, AODCOARSE, and AODFINE trends per year derived from March–October annual means and monthly mean anomalies over the 2005–2013 period for Ersa, Barcelona, and Lampedusa. The corresponding annual evolutions are shown in Fig. 9. Trends (yr−1) are shown with their standard deviations (± 1 s). Values in bold indicate statistically significant trends at the * 95 % confidence level and 99 % confidence level, as determined by the Student t test.

Overall, this analysis reveals negative values of the trends for all the subregions and sites considered over our study region, highlighting that POLDER-3 has recorded a general decrease of aerosol loads over the Western Mediterranean Sea over the period 2005–2013. The decreasing trends recorded for AOD interannual evolution are found to be statistically significant, at least at the 95 % confidence level, over the northern and central parts of the study region and, consistently, at Ersa and Barcelona (top panels of Fig. 9). AODC interannual evolutions recorded by POLDER-3 suggest decreasing trends, although the confidence level of 95 % is only reached when considering monthly anomalies at Barcelona and for the three subregions (Table 3). The absolute values of the POLDER-3 AODC decreasing trends, especially in the northern part of the basin (NW MED, trend −0.0012 yr−1) suggest a moderate-to-low decreasing tendency, around −0.01 per decade. Interestingly, POLDER-3 AODF interannual evolutions for the three subregions (bottom panels of Figs. 9 and S6) clearly reveal robust decreasing trends, all statistically significant at the 99 % level (Student's t test). As reported in Table 3, considering the northern and central parts of the study region, AODF decreased by −0.0020 yr−1 at 865 nm (−0.005 yr−1 at 550 nm, Table S1), whereas the decrease found in the southern part is slightly lower, −0.0016 yr−1 at 865 nm (.004 yr−1 at 550 nm, Table S1). The POLDER-3 AODF interannual variability at Ersa, Barcelona, and Lampedusa confirms these downward evolutions, with decreasing trends statistically significant at the 99 % confidence level (Table 4). The decreasing trends seem to be more pronounced in Barcelona (.0026 yr−1) than in Lampedusa (≥ −0.0015 yr−1), with intermediate magnitudes at Ersa (.0019). Consistently, the decreasing trends derived from POLDER-3 AODF extrapolated at 550 nm vary between values around −0.007 yr−1 at Barcelona, −0.0050.006 yr−1 in Ersa, and −0.004 yr−1 in Lampedusa (Table S2). The POLDER-3 AODF marked decreasing in Barcelona is fully consistent with surface particulate concentrations (PM) downward trend analysis in Spain provided by Querol et al. (2014) and Pandolfi et al. (2016) over comparable time periods (2001–2012 and 2004–2014, respectively). Although Querol et al. (2014) discuss the effects of meteorological variability and the 2008 financial crisis, their main interpretation is the effect of major policy actions on air quality.
The year-to-year variations in the North Atlantic Oscillation (NAO) have been examined in several past studies to support interpretation of interannual changes of north African dust transport either recorded by different satellite sensors, especially over the Mediterranean in the 1990s and early 2000s (Moulin et al., 1997; Antoine and Nobileau, 2006) or simulated by regional models (Nabat et al., 2020). In the present paper, we investigate the relationship between the winter (December through March) NAO index defined by Hurrell (1995) and interannual variations of POLDER-3 AOD, AODF, and AODC from 2005 to 2013 over the three Western Mediterranean subregions and sites considered in this work. The winter NAO indexes for the 2005–2013 period were obtained from “The Climate Data Guide: Hurrell North Atlantic Oscillation (NAO) Index (station-based)” (https://climatedataguide.ucar.edu/climate-data/hurrell-north-atlantic-oscillation-nao-index-station-based, last access: 20 December 2019). The annual means of POLDER-3 AOD and AODF do not show any statistically significant correlation with the winter NAO Index, although the correlation coefficients for annual AOD reach 0.51 at Ersa, and 0.66 for CW MED. The annual averages of AODC confirm a link with the NAO for the CW MED region (r=0.70, with 95 % confidence level). At Ersa, we obtain r=0.54, which is not significant. These correlation levels, not observed in the southern areas of our study region (Lampedusa or SW MED), strongly suggest that the NAO exerts a control on north African dust transport rather than on their emissions over source regions. In order to go further, we examine the relative frequency of desert dust episodes (fD) by selecting the days associated with POLDER-3 AODC 865 nm ≥ 0.10 for the three subregions considered in our study. Figure 10 reports the results for the period 2005–2013 (March–October) along with the time series of the winter NAO index. A significant correlation is confirmed between the NAO index and fD for the central part of the Western Mediterranean region (blue curve, R=0.76, with a 95 % confidence level) and to a lesser extent for the northern part of the Western Mediterranean region (green curve, R=0.65, not significant). For the southern part of the region, the correlation is much lower (r=0.43), although some connection with NAO is apparent at the beginning of the period (2005–2009), the correlation being strongly degraded by the opposition observed in 2010 between extremely low NAO index (−4.64) and a relatively high fD value (36 %). It is noticeable that Salvador et al. (2014), in their analysis of interannual variations of African dust outbreaks for years 2001–2011 over the Western Mediterranean basin, excluded the year 2010 from their correlation plots with NAO indexes considering that it was associated with an atypically low value of the NAO index, most probably governed by anomalous atmospheric patterns. Interestingly, SW MED is the only one of our three regions where POLDER-3 has recorded a significant decreasing trend in fD of −2 % (±1 %) per year over the period 2005–2013 (R=0.68, with a 95 % confidence level).
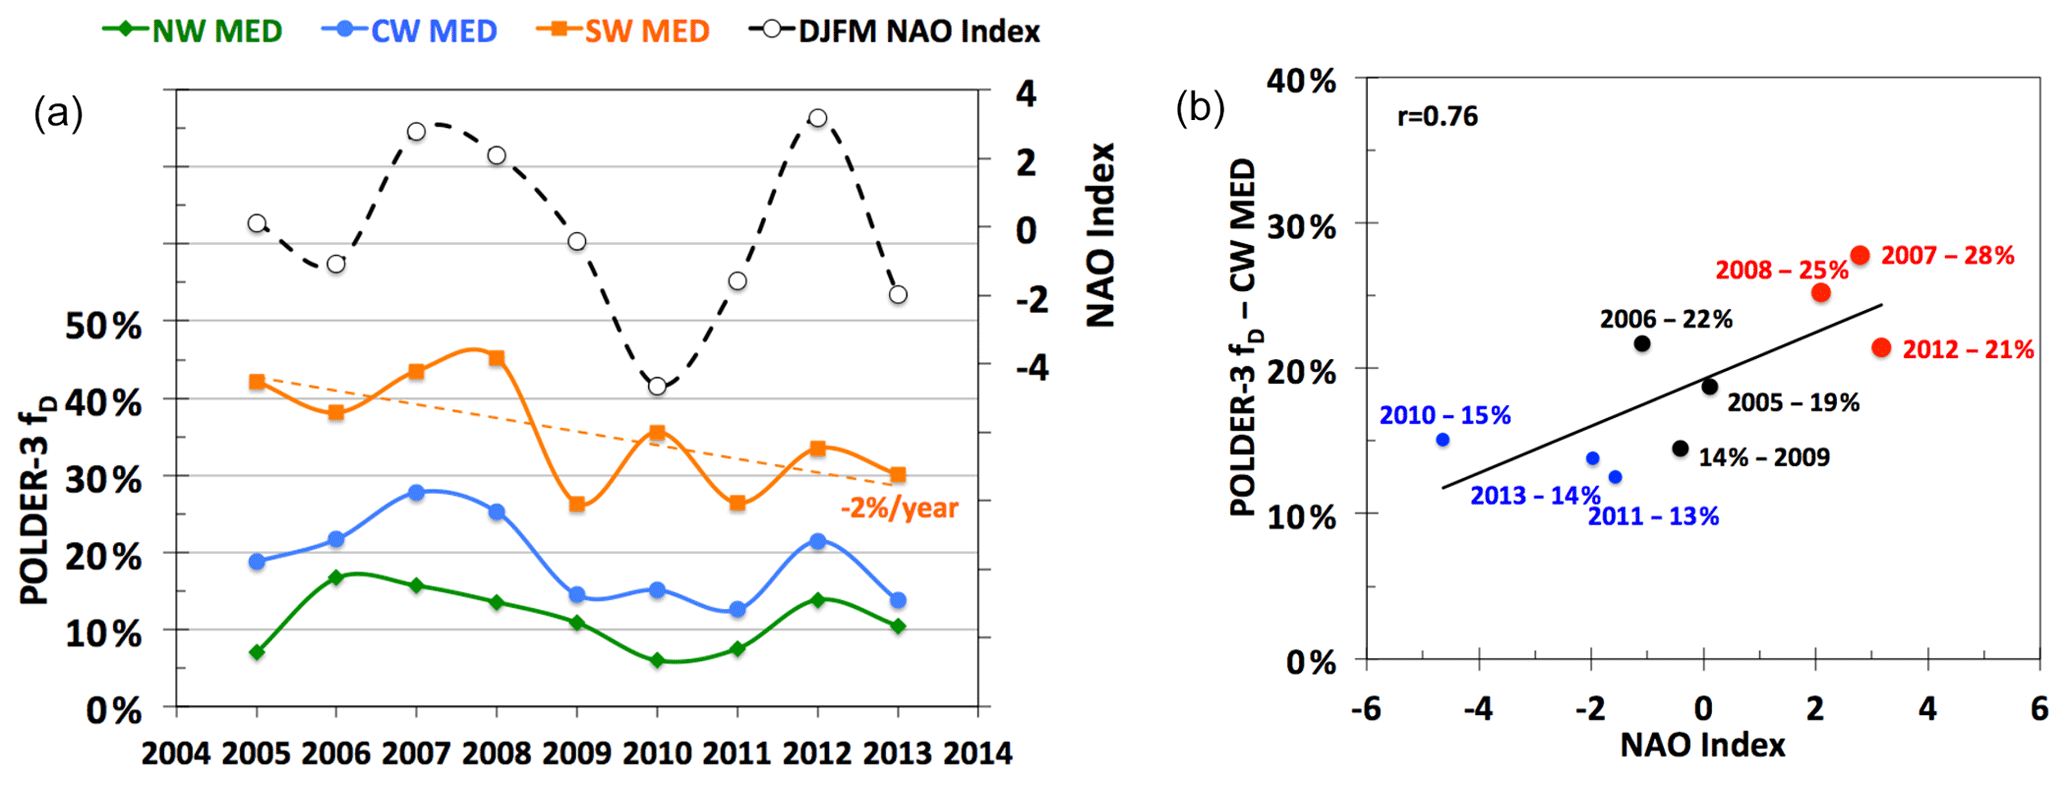
Figure 10(a) Time series of the NAO winter Index (scale on the right axis, open circles) and of the following annual relative frequency (fD) of POLDER-3 AODC at 865 nm ≥ 0.10 for the three subregions (NW MED in green, CW MED in blue, SW MED in orange) over the period March 2005–October 2013. The only significant trend of fD yr−1 is reported on the graph for SW MED. (b) Scatterplot of fD versus the preceding winter NAO index for the CW MED region.
Conversely, we also consider the relative frequency of occurrence of clean conditions associated with low aerosol loads recorded by POLDER-3 at 865 nm for the fine fraction (daily AODF<0.05), the coarse fraction (daily AODC<0.05), and the total aerosol (daily AOD ≤ 0.10), named fCF (clean fine), fCC (clean coarse), and fCT (clean total), respectively. Figure 11 reports the year-to-year evolutions of fCF (top panels), fCC (middle panels), and fCT (bottom panels) for the three subregions: NW MED, CW MED, and SW MED (left column) and Ersa, Barcelona, and Lampedusa (right column). Clearly, POLDER-3 records an increasing trend in the frequency of occurrence of clean conditions for the fine fraction of AOD, both for the three subregions and three sites. The fCF trends vary between +2 % yr−1 (SW MED and Lampedusa), +3 % yr−1 (CW MED, NW MED, Ersa), and +4 % yr−1 (Barcelona), with confidence levels of 99 % (except for SW MED, where only a 95 % confidence level is reached). In Barcelona, the increase is spectacular with clean conditions in fine particles occurring less than 60 % of the time between 2005 and 2007 (minimum in 2007, with 51 % frequency) and reaching values above 75 % in the 2011–2013 years (maximum in 2013, with 85 % frequency). Such an evolution is consistent with decreasing trends in surface PM2.5 at background sites in Spain and Europe reported in the literature over 2002–2010 (Cusack et al., 2012). Pandolfi et al. (2016) further observed decreasing trends between 2004 and 2014 in northeastern Spain, both at the background site of Barcelona and at the regional background site of Montseny, and mostly related them to decreases in industrial emissions and in secondary sulfate and nitrate fine particle concentrations. Regarding the coarse fraction of AOD, fCC records some significant year-to-year variability but no tendency, except for the SW MED subregion where a low, slightly positive trend (< + 1 % yr−1, not significant) is recorded over the period 2005–2013, suggesting a possible slow evolution toward cleaner conditions for the coarse aerosol fraction in the southern part of the basin. Considering the total aerosol loads (bottom panels of Fig. 11), the fCT evolution shows an increasing trend (between +2 % yr−1 and +3 % yr−1 with a 95 % confidence level) for the three subregions and three sites considered.
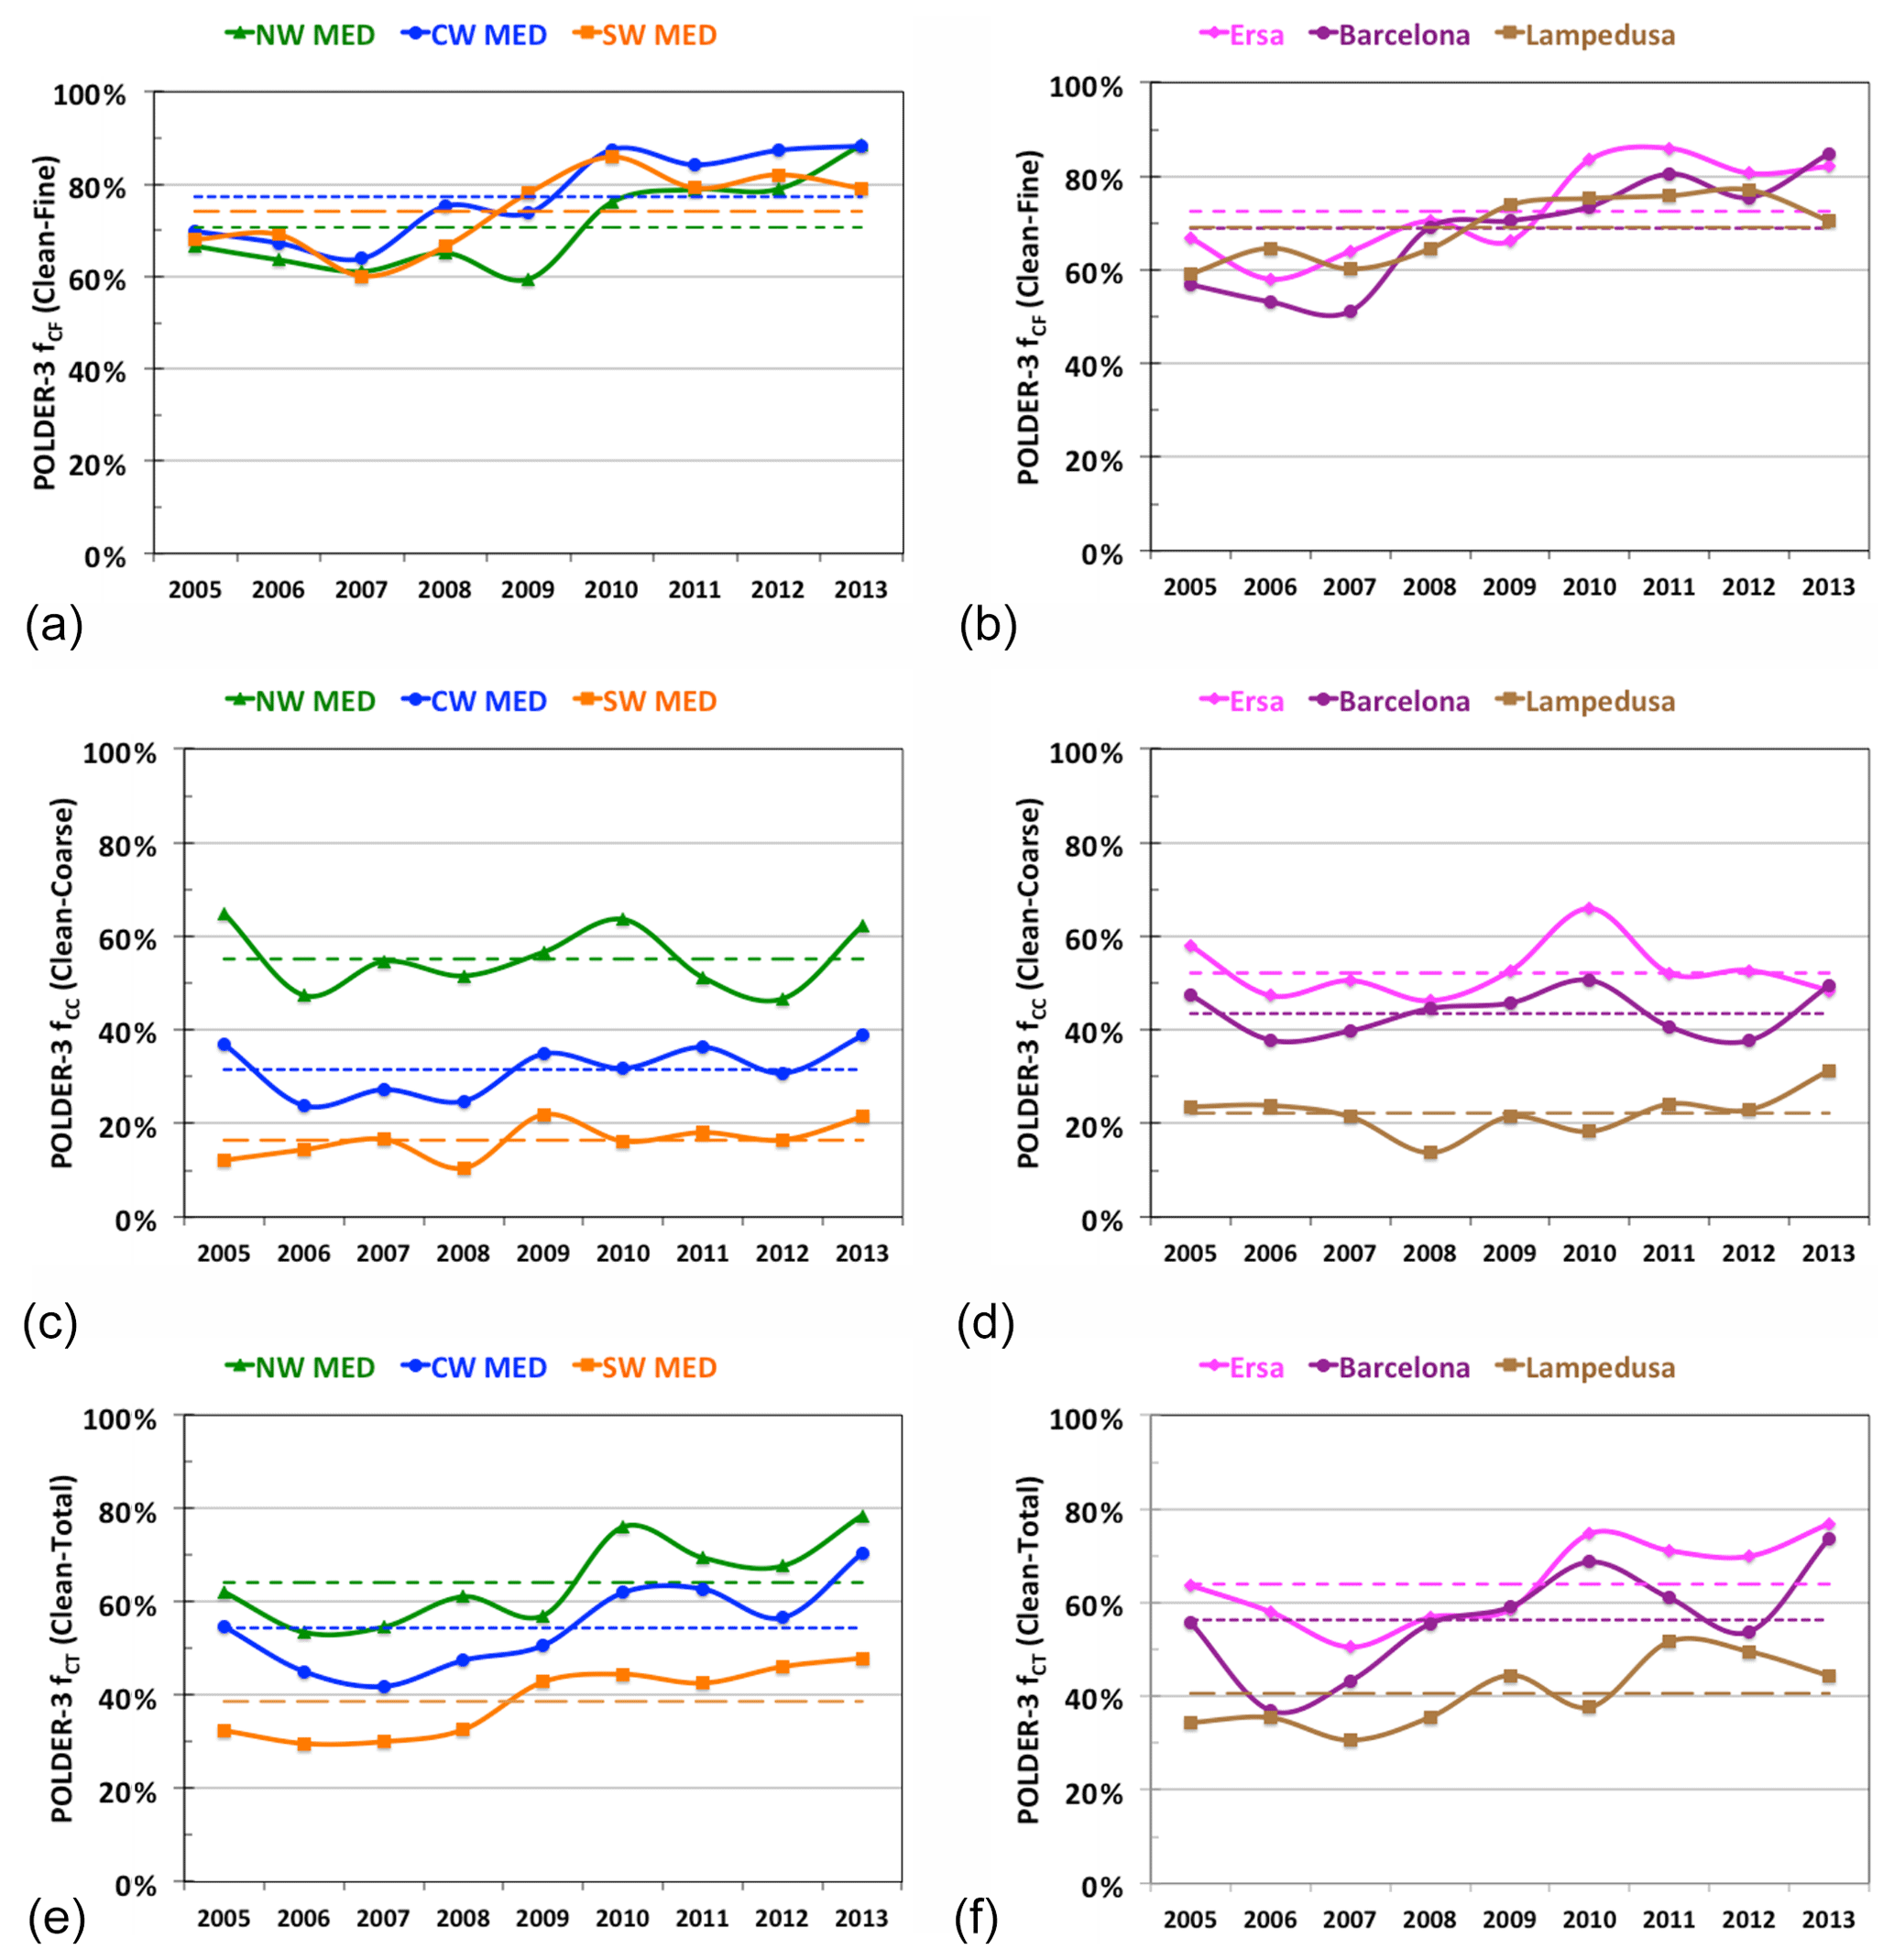
Figure 11(a, c, e) Time series of annual (March–October) relative frequencies of occurrence of clean conditions for the fine-mode aerosol component (POLDER-3 AODF 865 nm below 0.05, fCF; a), coarse-mode aerosol component (POLDER-3 AODC 865 nm below 0.05, fCC; c), and total aerosol (POLDER-3 AOD 865 nm lower than or equal to 0.10, fCT; e) over the period 2005–2013 for the three subregions (NW MED, CW MED, SW MED). The dashed lines indicate the multi-year annual averages of relative frequencies. (b, d, f) Same for the three sites (Ersa, Barcelona, and Lampedusa).
Figures 12 and 13 compare the 2005–2013 (March–October) mean values of AODF and AODC, respectively, with their anomalies for each year of the period. The year-to-year evolution of AODF is clearly characterized by positive anomalies in the first years of the period of study (especially 2005–2007), and negative anomalies for the most recent years. The spatial distributions of these anomalies indicate lower than long term means AODF over the eastern part of the region in 2012, and mostly over the northern and western parts of the region in 2013. Annual anomalies of AODC illustrated in Fig. 13 highlight elevated loads of coarse aerosols for specific years and areas of the region, as in 2008 in the southeastern part or in 2012 in the western part of the basin. In contrast, 2009 (southeastern part), 2010 (western part), and 2013 (most of the basin) appear to be associated with lower-than-long-term mean values of AODC. These POLDER-3 interannual evolutions tend to confirm the association between increased dust transport during positive NAO phases (+2.1 in 2008, +3.17 in 2012) and reduced dust export in negative NAO phases (−4.64 in 2010, −1.97 in 2013), in agreement with former studies over the region (Moulin et al., 1997; Antoine and Nabileau, 2006; Papadimas et al., 2008).

Figure 12POLDER-3 AODF at 865 nm averaged over the March–October period and the 9 years (2005–2013) (top left) and associated AODF anomalies for each year.
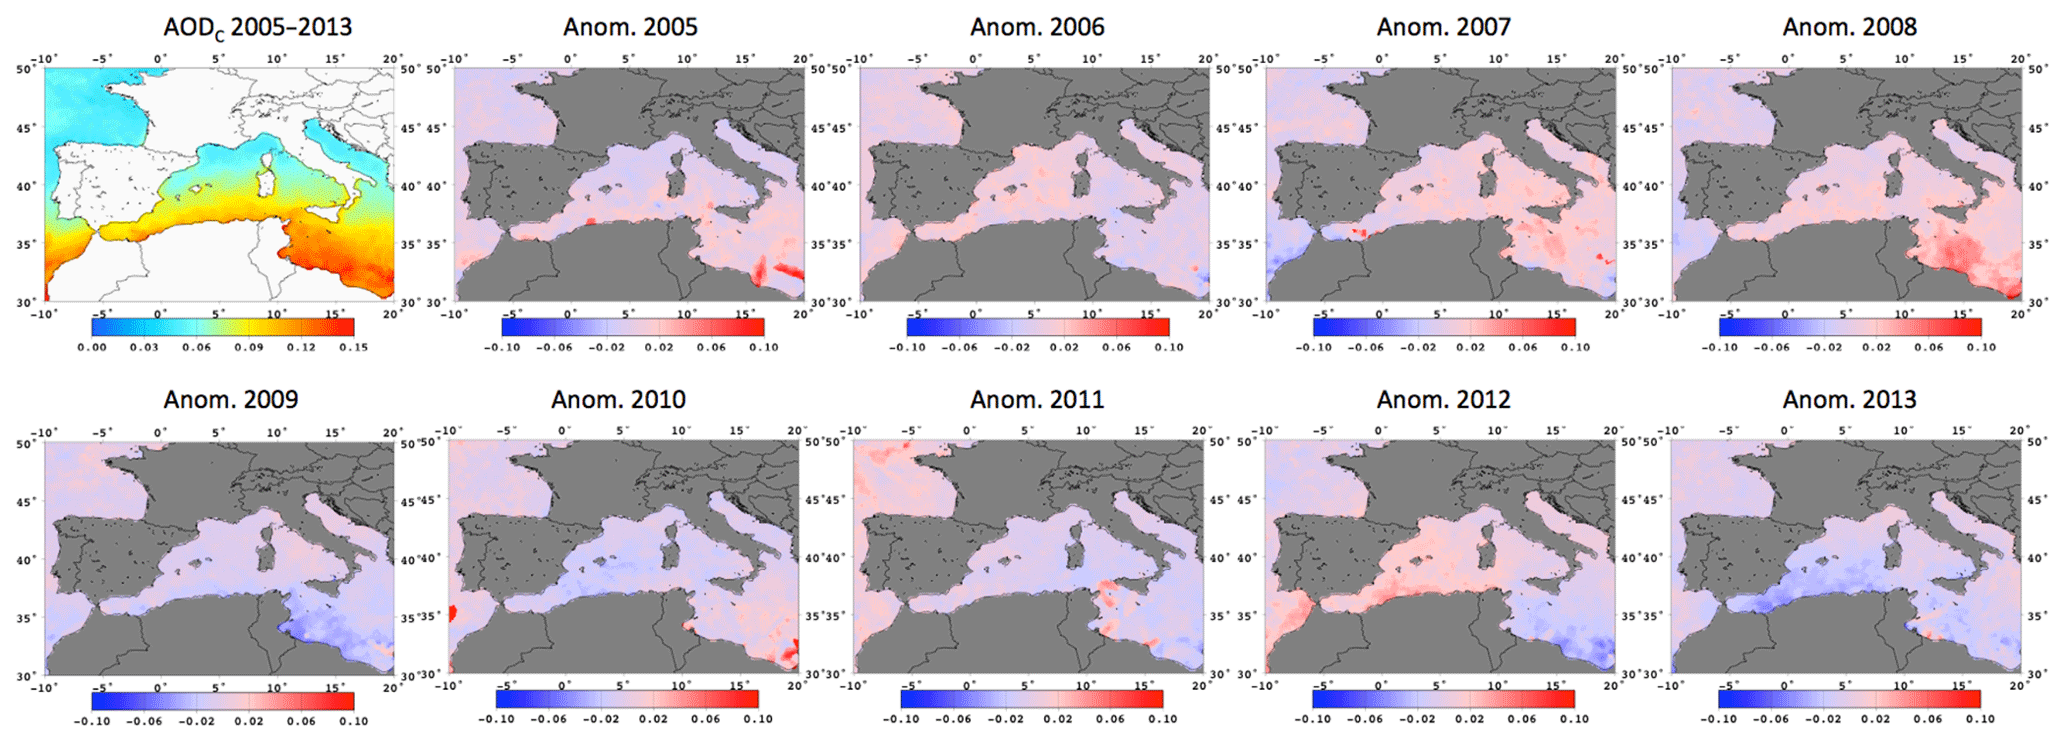
Figure 13POLDER-3 AODC at 865 nm averaged over the March–October period and the 9 years (2005–2013) (top left) and associated AODC anomalies for each year.
On the basis of the quality and robustness of the POLDER-3 clear-sky ocean operational aerosol retrievals over the Western Mediterranean (Formenti et al., 2018), in this paper, we investigated the spatial patterns and temporal variability of the POLDER-3 AOD in different particle size classes (total, fine, and coarse components) and shapes (coarse spherical and non-spherical contributions) over its whole observing period (2005–2013).
The POLDER-3 aerosol record confirms the high influence of north African desert dust over the region, with a marked maximum in AOD, along with its coarse and coarse non-spherical component in the southernmost part, associated with a decrease in AE and FMF, and a seasonal maximum occurring in spring and summer. In contrast, the coarse spherical component of AOD remains relatively homogenously low all year long over the region (AODCS<0.05). The POLDER-3 retrievals of the fine component of AOD show moderate spatial variability, with larger AODF in the eastern part of our region of study, especially north of the Adriatic Sea. At three sites representative of different typical aerosol conditions over the Western Mediterranean Sea (namely Ersa, Barcelona, and Lampedusa), POLDER-3 retrievals indicate averages contributions to total AOD at 865 nm ranging between 19 % and 20 % for coarse spherical particles, 26 % and 36 % for fine particles (maximum at Ersa), and 44 % and 55 % for coarse non-spherical particles (maximum at Lampedusa). At Lampedusa, POLDER-3 daily observations record the occurrence of intense or extreme aerosol events (AOD > 1 up to 4.7) consistently with the higher and more direct influence of severe desert dust episodes at this southernmost site. At these three sites, daily POLDER-3 AOD865 nm values above 0.3 are associated with low AE and FMF (mean values below 0.5 % and 21 %, respectively), as well as a dominance of the non-spherical particle fraction in the coarse mode (mean values above 71 %), typical of the desert dust influence. The background “clean” conditions associated with very low aerosol loads (POLDER-3 daily AOD865 nm values below 0.05) occur 22 % of the time around Ersa, 20 % around Barcelona and 9.5 % around Lampedusa over the POLDER-3 period (2005–2013), highlighting the scarcity of pristine days in this region, especially in its southern part.
Our analysis shows that the interannual evolutions of AOD, AODF, and AODC have negative trends over the period 2005–2013, more pronounced in time and space for AODF than for the AODAOD components. On average, the POLDER-3 AOD decreased by 0.0030 yr−1 at 865 nm (0.0060 yr−1 at 550 nm) over most of the region, with high contributions of decreasing fine-mode AOD (−0.0020 yr−1 at 865 nm, −0.0050 yr−1 at 550 nm). These decreasing tendencies are consistent with those reported in previous studies based on MODIS AOD at 550 nm, ranging from −0.0030 yr−1 (over 2002–2014, Floutsi et al., 2016) and −0.0067 yr−1 (over 2000–2006, Papadimas et al., 2008). We suggest a link between interannual evolution of winter NAO index and frequency of desert dust episodes (POLDER-3 AODC at 865 nm greater than 0.10, fD), especially over the central part of the Western Mediterranean Sea, along with a possible moderate diminution of frequency of dust spatially limited to the southern basin, as also indicated by Floutsi et al. (2016).
Our results strongly support the significant improvement in air quality for the fine-mode aerosol component over the Western Mediterranean region, with much less evidence of such a large-scale evolution for the coarse fraction. POLDER-3 analysis shows that aerosol year-to-year evolution over the period 2005–2013 is marked by significant positive trends of occurrences of clean conditions in terms of fine particles (classified as AODF 865 nm below 0.05), between +2 % yr−1 and +4 % yr−1 over the whole region. In Barcelona, for instance, clean conditions recorded by POLDER-3 AODF were as frequent as 75 % in the period 2010–2013.
Overall, our analysis contributes to emphasize the capacity of evolved aerosol dedicated satellite data set in distinguishing multi-influenced pluriannual evolutions in regions undergoing complex aerosol contributions, as in the Mediterranean basin. Such an approach may be investigated in other climate-sensitive regions of the world, subjected to specific anthropogenic pressures and meteorological patterns. In the Mediterranean, this POLDER-3 data set will be part of the validation exercise of regional climate model analysis in the framework of the flagship pilot studies of aerosols within CORDEX (Nabat et al., 2013, 2020).
POLDER-3 aerosol data were provided by CNES/LOA. More detailed information and access to POLDER-3/PARASOL aerosol products can be obtained at https://www.icare.univ-lille.fr/parasol/products (Bréon et al., 2016). POLDER-3/PARASOL Level-2 products, including data format and user manual are described at https://web-backend.icare.univ-lille.fr//projects_data/parasol/docs/Parasol_Level-2_format_latest.pdf (last access: 19 August 2021).
The supplement related to this article is available online at: https://doi.org/10.5194/acp-21-12715-2021-supplement.
IC and PF designed the data analysis. IC, PF, and LMK carried out the data analysis with significant contributions from FaD, FrD, and DT. FaD provided processed and quality-controlled POLDER-3/PARASOL data and maps in Figs. 1, 8, and 13. IC and PF wrote the manuscript with comments from all co-authors.
François Dulac is guest editor for the ACP Special Issue of the Chemistry and Aerosols Mediterranean Experiment (ChArMEx) (ACP/AMT inter-journal SI)”. The remaining authors declare that they have no conflict of interest.
Publisher's note: Copernicus Publications remains neutral with regard to jurisdictional claims in published maps and institutional affiliations.
This article is part of the special issue “CHemistry and AeRosols Mediterranean EXperiments (ChArMEx) (ACP/AMT inter-journal SI)”. It is not associated with a conference.
This work is part of the ChArMEx project supported by CNRS-INSU, ADEME, Météo-France, and CEA in the framework of the multidisciplinary program MISTRALS (Mediterranean Integrated Studies aT Regional And Local Scales; https://programmes.insu.cnrs.fr/en/mistrals-en/, last access: 19 August 2021). It has been supported by the French National Program of Spatial Teledetection (PNTS, https://programmes.insu.cnrs.fr/transverse/pnts/, last access: 19 August 2021, project no. PNTS-2015-03). Lydie Mbemba Kabuiku was granted by the French Environment and Energy Management Agency (ADEME) and National Center of Space Studies (CNES).
LOA participates in the CaPPA (Chemical and Physical Properties of the Atmosphere) project funded by the French National Research Agency (ANR) through the PIA (Programme d'Investissement d'Avenir) under contract ANR-11-LABX-0005-01, the Regional Council “Hauts-de-France” and the “European Funds for Regional Economic Development (FEDER)”. We would like to thank Marc Mallet and Pierre Nabat (CNRM-Toulouse, France) for fruitful discussions about the results of this paper.
This research has been supported by the Institut national des sciences de l'Univers (grant no. PNTS-2015-03).
This paper was edited by Evangelos Gerasopoulos and reviewed by two anonymous referees.
Ancellet, G., Pelon, J., Totems, J., Chazette, P., Bazureau, A., Sicard, M., Di Iorio, T., Dulac, F., and Mallet, M.: Long-range transport and mixing of aerosol sources during the 2013 North American biomass burning episode: analysis of multiple lidar observations in the western Mediterranean basin, Atmos. Chem. Phys., 16, 4725–4742, https://doi.org/10.5194/acp-16-4725-2016, 2016.
Antoine, D. and Nobileau, D.: Recent increase of Saharan dust transport over the Mediterranean Sea, as revealed from ocean color satellite (SeaWiFS) observations, J. Geophys. Res.-Atmos., 111, 1–19, https://doi.org/10.1029/2005JD006795, 2006.
Barnaba, F. and Gobbi, G. P.: Aerosol seasonal variability over the Mediterranean region and relative impact of maritime, continental and Saharan dust particles over the basin from MODIS data in the year 2001, Atmos. Chem. Phys., 4, 2367–2391, https://doi.org/10.5194/acp-4-2367-2004, 2004.
Boucher, O.: Atmospheric Aerosols – Properties and Climate Impacts, Springer, 311 pp., https://doi.org/10.1007/978-94-017-9649-1, 2015.
Bréon, F. M., Vermeulen, A., and Descloitres, J.: An evaluation of satellite aerosol products against sunphotometer measurements, Remote Sens. Environ., 115, 3102–3111, https://doi.org/10.1016/j.rse.2011.06.017, 2011.
Bréon, F. M., CNES Parasol team, and the ICARE team: POLDER/Parasol Level-2 Product Data Format and User Manual, available at: https://web-backend.icare.univ-lille.fr//projects_data/parasol/docs/Parasol_Level-2_format_latest.pdf (last access: 25 August 2021), 2016.
Chazette, P., Totems, J., Ancellet, G., Pelon, J., and Sicard, M.: Temporal consistency of lidar observations during aerosol transport events in the framework of the ChArMEx/ADRIMED campaign at Minorca in June 2013, Atmos. Chem. Phys., 16, 2863–2875, https://doi.org/10.5194/acp-16-2863-2016, 2016.
Chazette, P., Totems, J., and Shang, X.: Transport of aerosols over the French Riviera – link between ground-based lidar and spaceborne observations, Atmos. Chem. Phys., 19, 3885–3904, https://doi.org/10.5194/acp-19-3885-2019, 2019.
Chrit, M., Sartelet, K., Sciare, J., Pey, J., Nicolas, J. B., Marchand , N., Freney, E., Sellegri, K., Beekmann, M., and Dulac, F.: Aerosol sources in the western Mediterranean during summertime: a model-based approach, Atmos. Chem. Phys., 18, 9631–9659, https://doi.org/10.5194/acp-18-9631-2018, 2018.
Claeys, M., Roberts, G., Mallet, M., Arndt, J., Sellegri, K., Sciare, J., Wenger, J., and Sauvage, B.: Optical, physical and chemical properties of aerosols transported to a coastal site in the western Mediterranean: a focus on primary marine aerosols, Atmos. Chem. Phys., 17, 7891–7915, https://doi.org/10.5194/acp-17-7891-2017, 2017.
Cusack, M., Alastuey, A., Pérez, N., Pey, J., and Querol, X.: Trends of particulate matter (PM2.5) and chemical composition at a regional background site in the Western Mediterranean over the last nine years (2002–2010), Atmos. Chem. Phys., 12, 8341–8357, https://doi.org/10.5194/acp-12-8341-2012, 2012.
Denjean, C., Cassola, F., Mazzino, A., Triquet, S., Chevaillier, S., Grand, N., Bourrianne, T., Momboisse, G., Sellegri, K., Schwarzenbock, A., Freney, E., Mallet, M., and Formenti, P.: Size distribution and optical properties of mineral dust aerosols transported in the western Mediterranean, Atmos. Chem. Phys., 16, 1081–1104, https://doi.org/10.5194/acp-16-1081-2016, 2016.
Di Biagio, C., Doppler, L., Gaimoz, C., Grand, N., Ancellet, G., Raut, J.-C., Beekmann, M., Borbon, A., Sartelet, K., Attié, J.-L., Ravetta, F., and Formenti, P.: Continental pollution in the western Mediterranean basin: vertical profiles of aerosol and trace gases measured over the sea during TRAQA 2012 and SAFMED 2013, Atmos. Chem. Phys., 15, 9611–9630, https://doi.org/10.5194/acp-15-9611-2015, 2015.
Di Biagio, C., Formenti, P., Doppler, L., Gaimoz, C., Grand, N., Ancellet, G., Attié, J.-L., Bucci, S., Dubuisson, P., Fierli, F., Mallet, M., and Ravetta, F.: Continental pollution in the Western Mediterranean basin: large variability of the aerosol single scattering albedo and influence on the direct shortwave radiative effect, Atmos. Chem. Phys., 16, 10591–10607, https://doi.org/10.5194/acp-16-10591-2016, 2016.
Drugé, T., Nabat, P., Mallet, M., and Somot, S.: Model simulation of ammonium and nitrate aerosols distribution in the Euro-Mediterranean region and their radiative and climatic effects over 1979–2016, Atmos. Chem. Phys., 19, 3707–3731, https://doi.org/10.5194/acp-19-3707-2019, 2019.
Dubovik, O., Sinyuk, A., Lapyonok, T., Holben, B. N., Mishchenko, M., Yang, P., Eck, T. F., Volten, H., Muñoz, O., Veihelmann, B., van der Zande, W. J., Leon, J.-F., Sorokin, M., and Slutsker, I.: Application of spheroid models to account for aerosol particle nonsphericity in remote sensing of desert dust, J. Geophys. Res., 111, D11208, https://doi.org/10.1029/2005JD006619, 2006.
Dulac, F., Tanré, D., Bergametti, G., Buat-Ménard, P., Desbois, M., and Sutton, D.: Assessment of the African airborne dust mass over the western Mediterranean Sea using Meteosat data, J. Geophys. Res., 97, 2489–2506, https://doi.org/10.1029/91JD02427, 1992.
Floutsi, A. A., Korras-Carraca, M. B., Matsoukas, C., Hatzianastassiou, N., and Biskos, G.: Climatology and trends of aerosol optical depth over the Mediterranean basin during the last 12 years (2002–2014) based on Collection 006 MODIS-Aqua data, Sci. Total Environ., 551–552, 292–293, https://doi.org/10.1016/j.scitotenv.2016.01.192, 2016.
Formenti, P.: Mediterranean aerosol properties, Part VII in: Mediterranean Atmospheric Chemistry in the Mediterranean – Vol. 2, From Pollutant Sources to Impacts, edited by: Dulac, F., Sauvage, S., and Eric Hamonou, Springer, in press, 2021.
Formenti, P., Mbemba Kabuiku, L., Chiapello, I., Ducos, F., Dulac, F., and Tanré, D.: Aerosol optical properties derived from POLDER-3/PARASOL (2005–2013) over the western Mediterranean Sea – Part 1: Quality assessment with AERONET and in situ airborne observations, Atmos. Meas. Tech., 11, 6761–6784, https://doi.org/10.5194/amt-11-6761-2018, 2018.
Fougnie, B.: Improvement of the PARASOL Radiometric In-Flight Calibration Based on Synergy Between Various Methods Using Natural Targets, IEEE T. Geosci. Remote, 54, 2140–2152, https://doi.org/10.1109/TGRS.2015.2496322, 2016.
Georgoulias, A. K., Alexandri, G., Kourtidis, K. A., Lelieveld, J., Zanis, P., Pöschl, U., Levy, R., Amiridis, V., Marinou, E., and Tsikerdekis, A.: Spatiotemporal variability and contribution of different aerosol types to the aerosol optical depth over the Eastern Mediterranean, Atmos. Chem. Phys., 16, 13853–13884, https://doi.org/10.5194/acp-16-13853-2016, 2016.
Gkikas, A., Hatzianastassiou, N., Mihalopoulos, N., Katsoulis, V., Kazadzis, S., Pey, J., Querol, X., and Torres, O.: The regime of intense desert dust episodes in the Mediterranean based on contemporary satellite observations and ground measurements, Atmos. Chem. Phys., 13, 12135–12154, https://doi.org/10.5194/acp-13-12135-2013, 2013.
Gkikas, A., Basart, S., Hatzianastassiou, N., Marinou, E., Amiridis, V., Kazadzis, S., Pey, J., Querol, X., Jorba, O., Gassó, S., and Baldasano, J. M.: Mediterranean intense desert dust outbreaks and their vertical structure based on remote sensing data, Atmos. Chem. Phys., 16, 8609–8642, https://doi.org/10.5194/acp-16-8609-2016, 2016.
Hansson, H.-C., Tunved, P., Krejci, R., Freud, E., Kalivitis, N., Hennig, T., Maneas, G., and Gerasopoulos, E.: The Atmospheric Aerosol over Western Greece-Six Years of Aerosol Observations at the Navarino Environmental Observatory. Atmosphere, 12, 445, https://doi.org/10.3390/atmos12040445, 2021.
Hatzianastassiou, N., Gkikas, A., Mihalopoulos, N., Torres, O., and Katsoulis, B. D.: Natural versus anthropogenic aerosols in the eastern Mediterranean basin derived from multiyear TOMS and MODIS satellite data, J. Geophys. Res., 114, D24202, https://doi.org/10.1029/2009JD011982, 2009.
Herman, M., Deuzé, J. L., Marchand, A., Roger, B., and Lallart, P.: Aerosol remote sensing from POLDER/ADEOS over the ocean: Improved retrieval using a nonspherical particle model, J. Geophys. Res., 110, D10S02, https://doi.org/10.1029/2004JD004798, 2005.
Holben, B. N., Tanré, D., Smirnov, A., Eck, T. F., Slutsker, I., Abuhassan, N., Newcomb, W. W., Schafer, J. S., Chatenet, B., Lavenu, F., Kaufman, Y. J., Castle, J. Vande, Setzer, A., Markham, B., Clark, D., Frouin, R., Halthore, R., Karneli, A., O'Neill, N. T., Pietras, C., Pinker, R. T., Voss, K., and Zibordi, G.: An emerging ground-based aerosol climatology: Aerosol optical depth from AERONET, J. Geophys. Res.-Atmos., 106, 12067–12097, https://doi.org/10.1029/2001JD900014, 2001.
Hurrell, J. W.: Decadal trend in the North Atlantic Oscillation: Regional temperatures and precipitations, Science, 269, 676–679, https://doi.org10.1126/science.269.5224.676, 1995.
Kaskaoutis, D. G., Shailesh Kumar Kharol, Sifakis, N., Nastos, P. T., Anu Rani Sharma, Badarinath, K. V. S., and Kambezidis, H. D.: Satellite monitoring of the biomass-burning aerosols during the wildfires of August 2007 in Greece: Climate implications, Atmos. Environ., 45, 716–726, https://doi.org/10.1016/j.atmosenv.2010.09.043, 2011.
Laj, P., Klausen, J., Bilde, M., Plass-Duelmer, C., Pappalardo, G., Clerbaux, C., Baltensperger, U., Hjorth, J., Simpson, D., Reimann, S., and Coheur, P. F.: Measuring atmospheric composition change, Atmos. Environ., 43, 5351–5414, https://doi.org/10.1016/j.atmosenv.2009.08.020, 2009.
Laj, P., Bigi, A., Rose, C., Andrews, E., Lund Myhre, C., Collaud Coen, M., Lin, Y., Wiedensohler, A., Schulz, M., Ogren, J. A., Fiebig, M., Gliß, J., Mortier, A., Pandolfi, M., Petäja, T., Kim, S.-W., Aas, W., Putaud, J.-P., Mayol-Bracero, O., Keywood, M., Labrador, L., Aalto, P., Ahlberg, E., Alados Arboledas, L., Alastuey, A., Andrade, M., Artíñano, B., Ausmeel, S., Arsov, T., Asmi, E., Backman, J., Baltensperger, U., Bastian, S., Bath, O., Beukes, J. P., Brem, B. T., Bukowiecki, N., Conil, S., Couret, C., Day, D., Dayantolis, W., Degorska, A., Eleftheriadis, K., Fetfatzis, P., Favez, O., Flentje, H., Gini, M. I., Gregorič, A., Gysel-Beer, M., Hallar, A. G., Hand, J., Hoffer, A., Hueglin, C., Hooda, R. K., Hyvärinen, A., Kalapov, I., Kalivitis, N., Kasper-Giebl, A., Kim, J. E., Kouvarakis, G., Kranjc, I., Krejci, R., Kulmala, M., Labuschagne, C., Lee, H.-J., Lihavainen, H., Lin, N.-H., Löschau, G., Luoma, K., Marinoni, A., Martins Dos Santos, S., Meinhardt, F., Merkel, M., Metzger, J.-M., Mihalopoulos, N., Nguyen, N. A., Ondracek, J., Pérez, N., Perrone, M. R., Petit, J.-E., Picard, D., Pichon, J.-M., Pont, V., Prats, N., Prenni, A., Reisen, F., Romano, S., Sellegri, K., Sharma, S., Schauer, G., Sheridan, P., Sherman, J. P., Schütze, M., Schwerin, A., Sohmer, R., Sorribas, M., Steinbacher, M., Sun, J., Titos, G., Toczko, B., Tuch, T., Tulet, P., Tunved, P., Vakkari, V., Velarde, F., Velasquez, P., Villani, P., Vratolis, S., Wang, S.-H., Weinhold, K., Weller, R., Yela, M., Yus-Diez, J., Zdimal, V., Zieger, P., and Zikova, N.: A global analysis of climate-relevant aerosol properties retrieved from the network of Global Atmosphere Watch (GAW) near-surface observatories, Atmos. Meas. Tech., 13, 4353–4392, https://doi.org/10.5194/amt-13-4353-2020, 2020.
Lelieveld, J., Berresheim, H., Borrmann, S., Crutzen, P. J., Dentener, F. J., Fischer, H., Feichter, J., Flatau, P. J., Heland, J., Holzinger, R., Korrmann, R., Lawrence, M. G., Levin, Z., Markowicz, K. M., Mihalopoulos, N., Minikin, A., Ramanathan, V., De Reus, M., Roelofs, G. J., Scheeren, H. a, Sciare, J., Schlager, H., Schultz, M., Siegmund, P., Steil, B., Stephanou, E. G., Stier, P., Traub, M., Warneke, C., Williams, J., and Ziereis, H.: Global air pollution crossroads over the Mediterranean, Science, 298, 794–799, https://doi.org/10.1126/science.1075457, 2002.
Lyamani, H., Valenzuela, A., Perez-Ramirez, D., Toledano, C., Granados-Muñoz, M. J., Olmo, F. J., and Alados-Arboledas, L.: Aerosol properties over the western Mediterranean basin: temporal and spatial variability, Atmos. Chem. Phys., 15, 2473–2486, https://doi.org/10.5194/acp-15-2473-2015, 2015.
Mallet, M., Dulac, F., Formenti, P., Nabat, P., Sciare, J., Roberts, G., Pelon, J., Ancellet, G., Tanré, D., Parol, F., Denjean, C., Brogniez, G., di Sarra, A., Alados-Arboledas, L., Arndt, J., Auriol, F., Blarel, L., Bourrianne, T., Chazette, P., Chevaillier, S., Claeys, M., D'Anna, B., Derimian, Y., Desboeufs, K., Di Iorio, T., Doussin, J.-F., Durand, P., Féron, A., Freney, E., Gaimoz, C., Goloub, P., Gómez-Amo, J. L., Granados-Muñoz, M. J., Grand, N., Hamonou, E., Jankowiak, I., Jeannot, M., Léon, J.-F., Maillé, M., Mailler, S., Meloni, D., Menut, L., Momboisse, G., Nicolas, J., Podvin, T., Pont, V., Rea, G., Renard, J.-B., Roblou, L., Schepanski, K., Schwarzenboeck, A., Sellegri, K., Sicard, M., Solmon, F., Somot, S., Torres, B., Totems, J., Triquet, S., Verdier, N., Verwaerde, C., Waquet, F., Wenger, J., and Zapf, P.: Overview of the Chemistry-Aerosol Mediterranean Experiment/Aerosol Direct Radiative Forcing on the Mediterranean Climate (ChArMEx/ADRIMED) summer 2013 campaign, Atmos. Chem. Phys., 16, 455–504, https://doi.org/10.5194/acp-16-455-2016, 2016.
Menut, L., Siour, G., Mailler, S., Couvidat, F., and Bessagnet, B.: Observations and regional modeling of aerosol optical properties, speciation and size distribution over Northern Africa and western Europe, Atmos. Chem. Phys., 16, 12961–12982, https://doi.org/10.5194/acp-16-12961-2016, 2016.
Michoud, V., Sciare, J., Sauvage, S., Dusanter, S., Léonardis, T., Gros, V., Kalogridis, C., Zannoni, N., Féron, A., Petit, J.-E., Crenn, V., Baisnée, D., Sarda-Estève, R., Bonnaire, N., Marchand, N., DeWitt, H. L., Pey, J., Colomb, A., Gheusi, F., Szidat, S., Stavroulas, I., Borbon, A., and Locoge, N.: Organic carbon at a remote site of the western Mediterranean Basin: sources and chemistry during the ChArMEx SOP2 field experiment, Atmos. Chem. Phys., 17, 8837–8865, https://doi.org/10.5194/acp-17-8837-2017, 2017.
Moulin, C., Lambert, C. E., Dulac, F., and Dayan, U.: Control of atmospheric export of dust from North Africa by the North Atlantic Oscillation, Nature, 387, 691–694, https://doi.org/10.1038/42679, 1997.
Moulin, C., Lambert, C. E., Dayan, U., Masson, V., Ramonet, M., Bousquet, P., Legrand, M., Balkanski, Y. J., Guelle, W., Marticorena, B., Bergametti, G., and Dulac, F.: Satellite climatology of African dust transport in the Mediterranean atmosphere, J. Geophys. Res., 103, 13137, https://doi.org/10.1029/98JD00171, 1998.
Nabat, P., Somot, S., Mallet, M., Chiapello, I., Morcrette, J. J., Solmon, F., Szopa, S., Dulac, F., Collins, W., Ghan, S., Horowitz, L. W., Lamarque, J. F., Lee, Y. H., Naik, V., Nagashima, T., Shindell, D., and Skeie, R.: A 4-D climatology (1979–2009) of the monthly tropospheric aerosol optical depth distribution over the Mediterranean region from a comparative evaluation and blending of remote sensing and model products, Atmos. Meas. Tech., 6, 1287–1314, https://doi.org/10.5194/amt-6-1287-2013, 2013.
Nabat, P., Somot, S., Cassou, C., Mallet, M., Michou, M., Bouniol, D., Decharme, B., Drugé, T., Roehrig, R., and Saint-Martin, D.: Modulation of radiative aerosols effects by atmospheric circulation over the Euro-Mediterranean region, Atmos. Chem. Phys., 20, 8315–8349, https://doi.org/10.5194/acp-20-8315-2020, 2020.
Pandolfi, M., Alastuey, A., Pérez, N., Reche, C., Castro, I., Shatalov, V., and Querol, X.: Trends analysis of PM source contributions and chemical tracers in NE Spain during 2004–2014: a multi-exponential approach, Atmos. Chem. Phys., 16, 11787–11805, https://doi.org/10.5194/acp-16-11787-2016, 2016.
Pandolfi, M., Alados-Arboledas, L., Alastuey, A., Andrade, M., Angelov, C., Artiñano, B., Backman, J., Baltensperger, U., Bonasoni, P., Bukowiecki, N., Collaud Coen, M., Conil, S., Coz, E., Crenn, V., Dudoitis, V., Ealo, M., Eleftheriadis, K., Favez, O., Fetfatzis, P., Fiebig, M., Flentje, H., Ginot, P., Gysel, M., Henzing, B., Hoffer, A., Holubova Smejkalova, A., Kalapov, I., Kalivitis, N., Kouvarakis, G., Kristensson, A., Kulmala, M., Lihavainen, H., Lunder, C., Luoma, K., Lyamani, H., Marinoni, A., Mihalopoulos, N., Moerman, M., Nicolas, J., O'Dowd, C., Petäjä, T., Petit, J.-E., Pichon, J. M., Prokopciuk, N., Putaud, J.-P., Rodríguez, S., Sciare, J., Sellegri, K., Swietlicki, E., Titos, G., Tuch, T., Tunved, P., Ulevicius, V., Vaishya, A., Vana, M., Virkkula, A., Vratolis, S., Weingartner, E., Wiedensohler, A., and Laj, P.: A European aerosol phenomenology – 6: scattering properties of atmospheric aerosol particles from 28 ACTRIS sites, Atmos. Chem. Phys., 18, 7877–7911, https://doi.org/10.5194/acp-18-7877-2018, 2018.
Papadimas, C. D., Hatzianastassiou, N., Mihalopoulos, N., Querol, X., and Vardavas, I.: Spatial and temporal variability in aerosol properties over the Mediterranean basin based on 6- year (2000–2006) MODIS data, J. Geophys. Res., 113, D11205, https://doi.org/10.1029/2007JD009189, 2008.
Querol, X., Alastuey, A., Pandolfi, M., Reche, C., Pérez, N., Minguillón, M. C., Moreno, T., Viana, M., Escudero, M., Orio, A., Pallarés, M., and Reina, F.: 2001–2012 trends on air quality in Spain, Sci. Total Environ., 15, 957–969, https://doi.org/10.1016/j.scitotenv.2014.05.074, 2014.
Rea, G., Turquety, S., Menut, L., Briant, R., Mailler, S., and Siour, G.: Source contributions to 2012 summertime aerosols in the Euro-Mediterranean region, Atmos. Chem. Phys., 15, 8013–8036, https://doi.org/10.5194/acp-15-8013-2015, 2015.
Remer, L. R., Levy, R. C., Mattoo, S., Tanré, D., Gupta, P., Shi, Y., Sawyer, V., Munchak, L. A., Zhou, Y., Kim, M., Ichoku, C., Patadia, F., Li, R.-R., Gassoì, S., Kleidman, R. G., and Holben, B. N.: The Dark Target Algorithm for Observing the Global Aerosol System: Past, Present, and Future, Remote Sens., 12, 2900, https://doi.org/10.3390/rs12182900, 2020.
Ricaud, P., Zbinden, R., Catoire, V., Brocchi, V., Dulac, F., Hamonou, E., Canonici, J.-C., El Amraoui, L., Massart, S., Piguet, B., Dayan, U., Nabat, P.,, Sciare, J., Ramonet, M., Delmotte, M., di Sarra, A., Sferlazzo, D., di Iorio, T., Piacentino, S., Cristofanelli, P., Mihalopoulos, N., Kouvarakis, G., Pikridas, M., Savvides, C., Mamouri, R.-E., Nisantzi, A., Hadjimitsis, D., Attié, J.-L., Ferré, H., Kangah, Y., Jaidan, N., Guth, J., Jacquet, P., Chevrier, S., Robert, C., Bourdon, A., Bourdinot, J.-F., Etienne, J.-C., Krysztofiak, G., and Théron, P.: The GLAM airborne campaign across the Mediterranean basin, B. Am. Meteorol. Soc., 99, 361–380, https://doi.org/10.1175/BAMS-D-16-0226.1, 2018.
Salvador, P., Alonso-Pérez, S., Pey, J., Artíñano, B., de Bustos, J. J., Alastuey, A., and Querol, X.: African dust outbreaks over the western Mediterranean Basin: 11-year characterization of atmospheric circulation patterns and dust source areas, Atmos. Chem. Phys., 14, 6759–6775, https://doi.org/10.5194/acp-14-6759-2014, 2014.
Shaheen, A., Wu, R., and Aldabash, M.: Long-term AOD trend assessment over the Eastern Mediterranean region: A comparative study including a new merged aerosol product, Atmosph. Environ., 238, 117736, https://doi.org/10.1016/j.atmosenv.2020.117736, 2020.
Sič, B., El Amraoui, L., Piacentini, A., Marécal, V., Emili, E., Cariolle, D., Prather, M., and Attié, J.-L.: Aerosol data assimilation in the chemical transport model MOCAGE during the TRAQA/ChArMEx campaign: aerosol optical depth, Atmos. Meas. Tech., 9, 5535–5554, https://doi.org/10.5194/amt-9-5535-2016, 2016.
Sicard, M., Barragan, R., Dulac, F., Alados-Arboledas, L., and Mallet, M.: Aerosol optical, microphysical and radiative properties at regional background insular sites in the western Mediterranean, Atmos. Chem. Phys., 16, 12177–12203, https://doi.org/10.5194/acp-16-12177-2016, 2016.
Tanré, D., Bréon, F. M., Deuzé, J. L., Dubovik, O., Ducos, F., François, P., Goloub, P., Herman, M., Lifermann, A., and Waquet, F.: Remote sensing of aerosols by using polarized, directional and spectral measurements within the A-Train: the PARASOL mission, Atmos. Meas. Tech., 4, 1383–1395, https://doi.org/10.5194/amt-4-1383-2011, 2011.