the Creative Commons Attribution 4.0 License.
the Creative Commons Attribution 4.0 License.
 | 26 Aug 2021
Study of different Carbon Bond 6 (CB6) mechanisms by using a concentration sensitivity analysis
Le Cao
Simeng Li
Luhang Sun
Since the year 2010, different versions of the Carbon Bond 6 (CB6) mechanism have been developed to accurately estimate the contribution to air pollution by the chemistry. In order to better understand the differences in simulation results brought about by the modifications between different versions of the CB6 mechanism, in the present study, we investigated the behavior of three different CB6 mechanisms (CB6r1, CB6r2 and CB6r3) in simulating ozone (O3), nitrogen oxides (NOx) and formaldehyde (HCHO) under two different emission conditions by applying a concentration sensitivity analysis in a box model. The results show that when the surface emission is weak, the O3 level predicted by CB6r1 is approximately 7 ppb higher than that predicted by CB6r2 and CB6r3, specifically due to the change in the sink of acyl peroxy radicals with high-order carbons (i.e., species CXO3) in the mechanism and the difference in the ozone dependence on the isoprene emission. In contrast, although CB6r1 estimates higher values of NOx and HCHO than the other two mechanisms at an early stage of the simulation, the levels of NOx and HCHO estimated by these three CB6 mechanisms at the end of the 7 d simulation are mostly similar, when the surface emission is weak. After the increase in the surface emission, the simulated profiles of O3, NOx and HCHO obtained by CB6r2 and CB6r3 were found to be nearly the same during the simulation period, but CB6r1 tends to estimate substantially higher values than CB6r2 and CB6r3. The deviation between the O3 levels provided by CB6r1 and the other two CB6 mechanisms (i.e., CB6r2 and CB6r3) was found to be enlarged compared with the weak-emission scenario because of the weaker dependence of ozone on the emission of isoprene in CB6r1 than those in CB6r2 and CB6r3 in this scenario. Moreover, HCHO predicted by CB6r1 was found to be larger than those predicted by CB6r2 and CB6r3, which is caused by an enhanced dependence of HCHO on the emission of isoprene in CB6r1. Regarding NOx, it was found that CB6r1 gives a higher value than the other two mechanisms, which is caused by the relatively stronger connection between the NOx prediction and the release of NO and NO2 in CB6r1 due to the change in the product of the reaction between isoprene and NO3 in CB6r1. Consequently, more emitted NOx is involved in the reaction system denoted by CB6r1, which enables a following NOx formation and thus a higher NOx prediction of CB6r1.
- Article
(1061 KB) - Full-text XML
-
Supplement
(4169 KB) - BibTeX
- EndNote


Air pollution occurs when the concentration of particles or gases in the atmosphere is high, which brings a harmful effect to human beings and the environment of the earth. It was estimated that in 2007, approximately 3.45 million people were killed worldwide due to air pollution (Zhang et al., 2017a). Thus, one needs to investigate the physicochemical properties of air pollution so that the formulation of the control strategy by the government can be guided.
The atmospheric transport model (ATM) is an efficient tool for revealing factors dominating air pollution. Usually the ATM includes a variety of processes that are responsible for the concentration change in pollutants in the atmosphere, such as the production/consumption by the local chemistry, horizontal advection and vertical convection. By using ATMs, the contribution to the concentration change in the pollutants by each process can be numerically estimated.
Gas-phase chemical reaction mechanism is an essential part of the ATM. It can transform the emissions and the chemical reactions occurring in the atmosphere into the corresponding change in the species, which enables the following computations of the ATM. At present, several atmospheric gas-phase chemical reaction mechanisms have been proposed, such as the detailed Master Chemical Mechanism (MCM) (Jenkin et al., 1997, 2003, 2012, 2015; Saunders et al., 2003; Bloss et al., 2005) and the global chemical transport model MOZART (Model for Ozone and Related chemical Tracers) mechanism (Emmons et al., 2010). Among these chemical mechanisms, condensed mechanisms such as Carbon Bond Mechanisms (Gery et al., 1989; Zaveri and Peters, 1999; Yarwood et al., 2005, 2010) and SAPRC mechanisms (Carter, 2000a, b, 2010) are widely applied in ATMs due to their relatively small size and adequate accuracy. In these condensed mechanisms, different techniques are used to lump volatile organic compounds (VOCs) into functional groups, while the treatment of the inorganic chemistry is mostly similar.
The Carbon Bond Mechanism (CBM) is a kind of condensed mechanism, which lumps VOCs by chemical moiety (Gery et al., 1989; Stockwell et al., 2020). In CBMs, the carbon bond is treated as a reaction unit, and the carbon bonds with the same bonding state are treated as a group, while the exact location of the carbon bonds in the molecule is neglected. CBM is conveniently implemented in the ATMs because of its small size and high accuracy in predicting the concentration change in the pollutants. However, due to the lumping technique, biases are inevitably brought into computations. Thus, many updates were made to the CBM to reduce biases, such as adding an explicit representation of species with the same molecular type (e.g., species ALDX for higher-order aldehydes).
As mentioned above, the CBM has been updated for several generations. In 1989, CB-IV was proposed by Gery et al. (1989), and it was then widely used in many air quality models such as WRF-Chem (Grell et al., 2005) and CMAQ (Byun and Schere, 2006). In 2005, based on the CB-IV mechanism, Yarwood et al. (2005) released CB05 by explicitly adding higher-order aldehydes (ALDX) and internal olefins (IOLE) into the mechanism. A large number of smog chamber experiments were also used to validate CB05, and it was reported that CB05 behaves better than CB-IV against the chamber data (Yarwood et al., 2005). Later on, an update to CB05 was made by Whitten et al. (2010) by combining a new toluene mechanism with CB05, namely, the CB05TU mechanism. It was proven that the CB05TU mechanism improves upon the CB05 mechanism in simulating toluene-related reactions (Whitten et al., 2010).
The latest version of the CBM is CB6 (Yarwood et al., 2010), because it is the sixth generation of this mechanism family, and it was released to deal with the tightening of the ozone standard in the US. Long-lived and relatively abundant organic compounds formed by peroxy radical reactions (RO2-RO2) are taken into account in CB6. Moreover, the isoprene chemistry and the aromatic chemistry are extensively revised to improve the modeling of the formation of secondary organic aerosols (SOAs). It was shown that CB6 performs better in simulating the maximum value of ozone as well as the ozone formation rate compared with the CB05 mechanism (Yarwood et al., 2010). From then on, several updates were made to CB6, so that currently there are four versions of CB6 available, i.e., CB6r1, CB6r2, CB6r3 and CB6r4. In CB6r1, the mechanism previously proposed by Yarwood et al. (2010) was revised again (Yarwood et al., 2012), and several reactions and products were corrected. New experimental data (EUPHORE experiments) were also adopted to validate the CB6r1 mechanism (Yarwood et al., 2012). After that, in 2013, Ruiz Hildebrandt and Yarwood (2013) included the interactions between organic aerosols and total reactive nitrogen (NOy) in the mechanism and then gave the CB6r2 mechanism. In CB6r2, organic nitrates were divided into two groups, simple alkyl nitrates (NTR1) that remain in the gas phase and multi-functional nitrates (NTR2) that can partition into organic aerosols. Because of the inclusion of the multi-functional aerosol nitrates (i.e., NTR2), lower recycling efficiency of nitrogen oxides (NOx) from nitrates is acquired using CB6r2, leading to a lower ozone production relative to CB6r1 (Ruiz Hildebrandt and Yarwood, 2013). The third version of CB6 is CB6r3 (Emery et al., 2015), which was developed to account for the influence of the low temperature on the formation of organic nitrates. It aims at modeling the winter ozone formation event in the Uinta Basin in the US under cold conditions, and it was found that the inclusion of the temperature dependence in CB6r3 would cause an ozone reduction in winter environments due to an enhanced formation of organic nitrates (Emery et al., 2015). The latest version of the CB6 mechanism is CB6r4 (Emery et al., 2016), which was designed by combining CB6r3 with a 16-reaction skeletal iodine mechanism to consider the ozone depletion by the iodine chemistry. It was found that CB6r2 and CB6r4 perform similarly in simulating ozone across the continental US, but CB6r4 tends to predict a lower ozone than CB6r2, possibly due to the depletion of ozone by the iodine chemistry in the marine boundary layer (Emery et al., 2016). Currently, the CB6r3 mechanism is available in the latest version of the CMAQ model (Community Multiscale Air Quality model, available at https://www.epa.gov/cmaq, last access: 1 August 2020) (Byun and Schere, 2006), while CB6r2 and CB6r4 are both included in the CAMx model (Comprehensive Air Quality Model with Extensions, available at https://www.camx.com, last access: 1 August 2020) (ENVIRON, 2015; Ramboll Environment and Health, 2020).
Many investigations have been made using the CB6 mechanisms. To name a few, Luecken et al. (2019) used CB6r3 to simulate ozone, oxidized nitrogen (NOy) and hazardous air pollutants (HAPs) across the continental US. In their study, a comparison between CB6r3, CB05TU, and CB05 as well as the observational data was performed. It was shown that these chemical mechanisms behave similarly for the ozone prediction, and CB6r3 performs best in simulating the vertical distribution of peroxyacyl nitrates. Marvin et al. (2017) used five chemical mechanisms, including CB6r2, to evaluate the impact of the isoprene chemistry on the simulation of formaldehyde (HCHO) in the summertime southeastern US. They also suggested a set of modifications to CB6r2 that can improve the comparison of the modeled HCHO to observations. Zhang et al. (2017b) used the CAMx model (ENVIRON, 2015; Ramboll Environment and Health, 2020) with the implementation of the CB6r2 mechanism to estimate the biogenic isoprene emissions in the US by using two different emission models, BEIS (Pierce et al., 1998; Bash et al., 2016) and MEGAN (Guenther et al., 2006, 2012), and they found that the MEGAN model predicts more isoprene emissions than the BEIS model. Recently, by implementing seven different chemical mechanisms, including CB6r3, in a box model constrained by the observational data, Derwent (2017) investigated the responses of the ozone production rate and the mixing ratio of hydroxyl radicals (i.e., OH) to a reduction of NOx and VOCs in these chemical mechanisms. It was found that when the constrained values of NOx and VOCs in the box model are reduced, different mechanisms behave differently, especially in the prediction of OH. Later, Derwent (2020) used the same model to study the response of the OH mixing ratio to the representation of oxidation and degradation of VOCs in 13 different mechanisms, including CB6r3, and Derwent (2020) found that the influence brought about by aromatics such as toluene and o-xylene on the change in OH differs a lot between different chemical mechanisms.
Despite the studies mentioned above, the internal properties of these CB6 mechanisms such as the relationship between the ozone formation and the surface emissions are still not thoroughly investigated and compared. Moreover, the corresponding change brought about by the modifications between different versions of the CB6 mechanism also needs further investigation. Therefore, in this study, we performed a concentration sensitivity analysis of different versions of the CB6 mechanism (CB6r1, CB6r2, and CB6r3) to see the dependence of the formation of ozone (O3), nitrogen oxides (NOx, NO + NO2) and formaldehyde (HCHO) on each reaction of the mechanism as well as the surface emission and dry deposition. By doing that, we were able to figure out reasons causing the deviations between the results obtained by using different CB6 mechanisms. The factors dominating the formation and consumption of the focused species (O3, NOx and HCHO) in these mechanisms can also be revealed.
The structure of this paper is as follows. In Sect. 2, CB6 mechanisms used in this study are introduced, and the method used to analyze the mechanism as well as the governing equations are also described. Section 3 gives the results of the concentration sensitivity analysis and the related discussions. In Sect. 4, major conclusions achieved in this study are summarized. Future work is also prospected in this section.
In the present study, we first implemented different versions of the CB6 mechanism (i.e., CB6r1, CB6r2, and CB6r3) in a box model, KINAL (Turányi, 1990a), to simulate the temporal evolution of O3, NOx and HCHO under two different emission conditions. The surface emission intensity implemented in the model was assumed to be weak at first, which represents an emission condition in rural regions (Saylor and Ford, 1995; Sandu et al., 1997). By doing that, chemical reactions playing an important role in the change in the focused species can be indicated. Then, sensitivities of the focused species (O3, NOx and HCHO) to each reaction of the mechanisms were computed to reveal the influence brought about by the modifications between these CB6 mechanisms. Later, the surface emission was increased in the model, and a same procedure was performed on these mechanisms again, so that the behavior of these CB6 mechanisms under a typical heavily polluted condition in urban regions can be investigated.
The CB6 mechanisms studied in this paper contain approximately 80 chemical species and 220 reactions. The CB6r1 version contains 80 species and 222 reactions, and the CB6r2 version contains 81 species and 215 reactions. The CB6r3 version has 82 species and 221 reactions, including reactions accounting for the temperature dependence of the alkyl nitrate formation. Complete listings of all the reactions of these mechanisms are given in Table A1 of the Appendix. The updates in CB6r2 and CB6r3 compared with their previous version are also marked in Table A1. Compared with CB6r1, CB6r2 divides the organic nitrates generated from alkanes, olefins, aromatics and oxygenated VOCs (i.e., the species named NTR in CB6r1) into two groups, NTR1 that exists exclusively in the gas phase and NTR2 that can partition into organic aerosols. As a result of this speciation, in CB6r2, the organic nitrates, NTR1 and NTR2, undergo the following reactions:
Reaction (R1) denotes the photolysis of NTR1, which enables a recycling of NOx and a following ozone formation enhancement. Reaction (R2) represents an addition reaction leading to the conversion from NTR1 to NTR2. Reaction (R3) means that the organic nitrate partitioning within the aerosols undergoes hydrolysis and forms HNO3. Ruiz Hildebrandt and Yarwood (2013) reported that because of this speciation, CB6r2 has a lower recycling efficiency of NOx from organic nitrates than CB6r1. The levels of O3 and NOx predicted by CB6r2 are thus lower than those predicted by CB6r1.
Regarding CB6r3, it decomposes the formation process of alkyl nitrates from alkanes in CB6r2,
into seven reactions:
By making this modification, the dependence of the alkyl nitrate yield on the pressure and the temperature can be considered in CB6r3, especially under cold conditions. For this purpose, two new operators, XPRP and XPAR, were also added. Under a standard condition (pressure: 1 atm, temperature: 298 K), the formation of the alkyl nitrates (NTR1 and NTR2) in CB6r3 through Reactions (R7)–(R13) is equal to that in CB6r2 through Reactions (R4)–(R6) (Emery et al., 2015).
CB6r4 improves upon CB6r3 by adding a condensed iodine mechanism to consider the iodine-induced ozone destruction (Emery et al., 2016). However, CB6r4 was not investigated in this study, because the halogen chemistry is not the focus of the present study. A comparison between CB6r4 and other CB6 mechanisms in a halogen-rich environment is attributed to a future work.
We implemented the CB6 mechanisms mentioned above in a box model, KINAL (Turányi, 1990a), to capture the time variations of O3, NOx and HCHO by solving Eq. (1):
Table 1The initial air composition and the surface emission intensities used in two different simulation scenarios. This initial condition was adapted from Saylor and Ford (1995) and Sandu et al. (1997) and represents a heavily polluted environment with 70 % relative humidity.

In Eq. (1), c is a column vector of species concentrations. k is a vector of reaction rate constants and t denotes time. E represents a source term of the local surface emission, and in the present model the surface emission is parameterized as a group of reactions with products and a constant reaction rate but without reactants. D in Eq. (1) is a loss term representing the dry deposition process of atmospheric constituents, and this process is parameterized in the model as a series of reactions with reactants but without forming any product. KINAL is a box model provided for the analysis of complex reaction systems. Stiff kinetic differential equations can be solved in KINAL, and it was proved that KINAL performs robustly and efficiently (Turányi, 1990a, b; Cao et al., 2014, 2016, 2019). A background air composition (see Table 1), adapted from Saylor and Ford (1995) and Sandu et al. (1997), was used as the initial condition of the model. This air composition represents a heavily polluted atmosphere in which the background level of NOx is on the order of 1–100 ppb. Two different scenarios, “weak emission” and “strong emission”, were simulated, and the emission intensities belonging to these two scenarios are listed in Table 1. They denote typical emission conditions in rural regions and urban regions, respectively (Saylor and Ford, 1995; Sandu et al., 1997). A 7 d simulation was performed, and the simulation starts at noon (12:00) of the first day. The time variations of O3, NOx and HCHO were recorded every hour during the simulated period.
After obtaining the temporal evolution of O3, NOx and HCHO, relative concentration sensitivities of these species to different CB6 mechanisms were computed to reveal the dependence of these species on each reaction of the mechanism, surface emissions, and the rate of dry deposition for each atmospheric constituent. The relative concentration sensitivity can be expressed as
which shows the importance of the jth reaction for the concentration change in the ith chemical species. In Eq. (2), ci is the concentration of the ith chemical species, and kj denotes the rate constant of the jth reaction. is the absolute concentration sensitivity, and the unit of Sij depends on the order of the jth reaction. In order to compare the sensitivity coefficients belonging to different reactions, Sij is normalized by being multiplied by , so that a dimensionless sensitivity coefficient, , is obtained. The relative concentration sensitivity thus represents the percentage change in the ith species concentration due to a small perturbation in the rate of the jth reaction. The evaluation of the concentration sensitivity is helpful for discovering the interdependence between the solution of Eq. (1) and input parameters of the model such as the reaction rate constants and the intensity of the surface emission.
Seinfeld and Pandis (2006)Seinfeld and Pandis (2006)Seinfeld and Pandis (2006)Seinfeld and Pandis (2006)Seinfeld and Pandis (2006)Hauglustaine et al. (1994)Seinfeld and Pandis (2006)Hauglustaine et al. (1994)Seyfioglu et al. (2006)Table 2Dry deposition velocities used in model simulations for different atmospheric constituents.
The reaction rate constants of the mechanisms were taken from the IUPAC database (Atkinson et al., 2004, 2006, 2007, 2008; Crowley et al., 2010; Ammann et al., 2013) and NASA/JPL database (Sander et al., 2006), and a constant temperature of 298 K was assumed for the calculation of the reaction rates. Photolytic reaction rates were estimated by using the TUV (Tropospheric Ultraviolet and Visible) radiation model (Madronich and Flocke, 1997, 1999), assuming a 300 Dobson overhead ozone column and a 1 km measuring height. Data of cross section and quantum yield for each photolyzed species were taken from CMAQ model version 5.3 (Byun and Schere, 2006). When the local time resides between 04:30 (sunrise) and 19:30 (sunset), the photolytic reaction rates vary with the solar zenith angle (SZA), while the photolytic reactions are switched off if the local time is out of this range. With respect to the dry deposition process, a first-order rate coefficient (kd) indicating the loss caused by dry deposition is calculated using the following equation:
where vd denotes the dry deposition velocity, and the values of vd used in the present study for different atmospheric constituents are given in Table 2. L in Eq. (3) is the boundary layer height and is assumed to be 1 km in the model.
In the following section, computational results are presented and discussed.
We first show the temporal evolution of O3, NOx and HCHO obtained by using CB6r1, CB6r2, and CB6r3 under the given initial condition (see Table 1), applying a weak surface emission. The differences between the results using different mechanisms are also analyzed. Then the concentration sensitivities of the focused species (O3, NOx and HCHO) to different CB6 mechanisms are displayed to indicate the internal difference between these mechanisms. Later on, results with the implementation of a strong surface emission are shown. By doing that, the dependence of different CB6 mechanisms on the surface emission under a typical heavily polluted condition in urban regions can be compared and investigated.

Figure 1Simulated temporal evolution of O3, NOx and HCHO by using different versions of the CB6 mechanism when the surface emission is weak.
3.1 Temporal evolution of O3, NOx and HCHO (weak emission)
Figure 1 shows the temporal profiles of O3, NOx and HCHO predicted by CB6r1, CB6r2 and CB6r3 in the weak-emission scenario. Due to the small intensity of the surface emission in this scenario, the differences between these predictions are able to reflect different capabilities of these mechanisms in converting the initial concentrations into the change in the species. It is seen that under this condition, ozone profiles simulated by these three mechanisms show a notable deviation (see Fig. 1a). In most of the simulated period, the ozone mixing ratio predicted by CB6r1 is higher than those predicted by CB6r2 and CB6r3. Figure 1a shows that at the beginning of the simulation (before day 1.5), CB6r1 and CB6r3 behave similarly, while CB6r2 predicts a higher ozone. However, as the reaction proceeds (after day 1.5), CB6r2 starts to predict a lower ozone than CB6r1, and the simulated profile of CB6r2 approaches that obtained by CB6r3. In contrast, the ozone predicted by CB6r1 becomes higher than those predicted by CB6r2 and CB6r3. During the end of the 7 d simulation, the daily averaged ozone predicted by CB6r1 over the seventh day is approximately 7 ppb higher than those predicted by CB6r2 and CB6r3, and the ozone levels given by CB6r2 and CB6r3 are almost identical.
For NOx simulations, Fig. 1b shows that at the beginning of the simulation, NOx declines rapidly from the initial value (7 ppb) to less than 1 ppb due to the conversion to PAN (peroxyacetyl nitrate) and HNO3. At the end of the simulation, the mixing ratio of NOx becomes lower than 0.5 ppb. The major nitrogen-containing compound during this time period is HNO3, as PAN is thermally decomposed and photolyzed during the daytime. In the comparison of temporal profiles belonging to different mechanisms, CB6r1 consistently estimates a slightly higher NOx than the other two mechanisms, but the deviation between the estimations of these mechanisms becomes smaller towards the end of the 7 d simulation. However, it should be noted that the difference in the predicted NOx using different mechanisms may become larger when the surface emission intensity increases due to different capabilities in transforming emissions into the change in the species for each mechanism.
With respect to HCHO predictions, it is seen in Fig. 1c that the deviation between the results of these three mechanisms is more pronounced at the start stage of the simulation. During this time period, CB6r1 predicts a much higher HCHO than the other two mechanisms, especially at noon of every day. However, at the end of the simulation, although CB6r1 still estimates a higher HCHO than CB6r2 and CB6r3, the difference becomes smaller, and CB6r2 and CB6r3 give a similar HCHO.
In summary, we found that when the surface emission is weak, the ozone concentration predicted by CB6r1 is mostly higher than those obtained by using CB6r2 or CB6r3. When the end of the simulation approaches, ozone simulated by CB6r1 is approximately 7 ppb larger than that simulated by CB6r2 and CB6r3. In contrast to that, after a 7 d computation, the NOx and HCHO levels obtained by using these three CB6 mechanisms are more similar. At the beginning of the simulation, CB6r1 gives significantly higher values of NOx and HCHO than the other two CB6 mechanisms. However, when the end of the simulation comes, the difference tends to disappear.
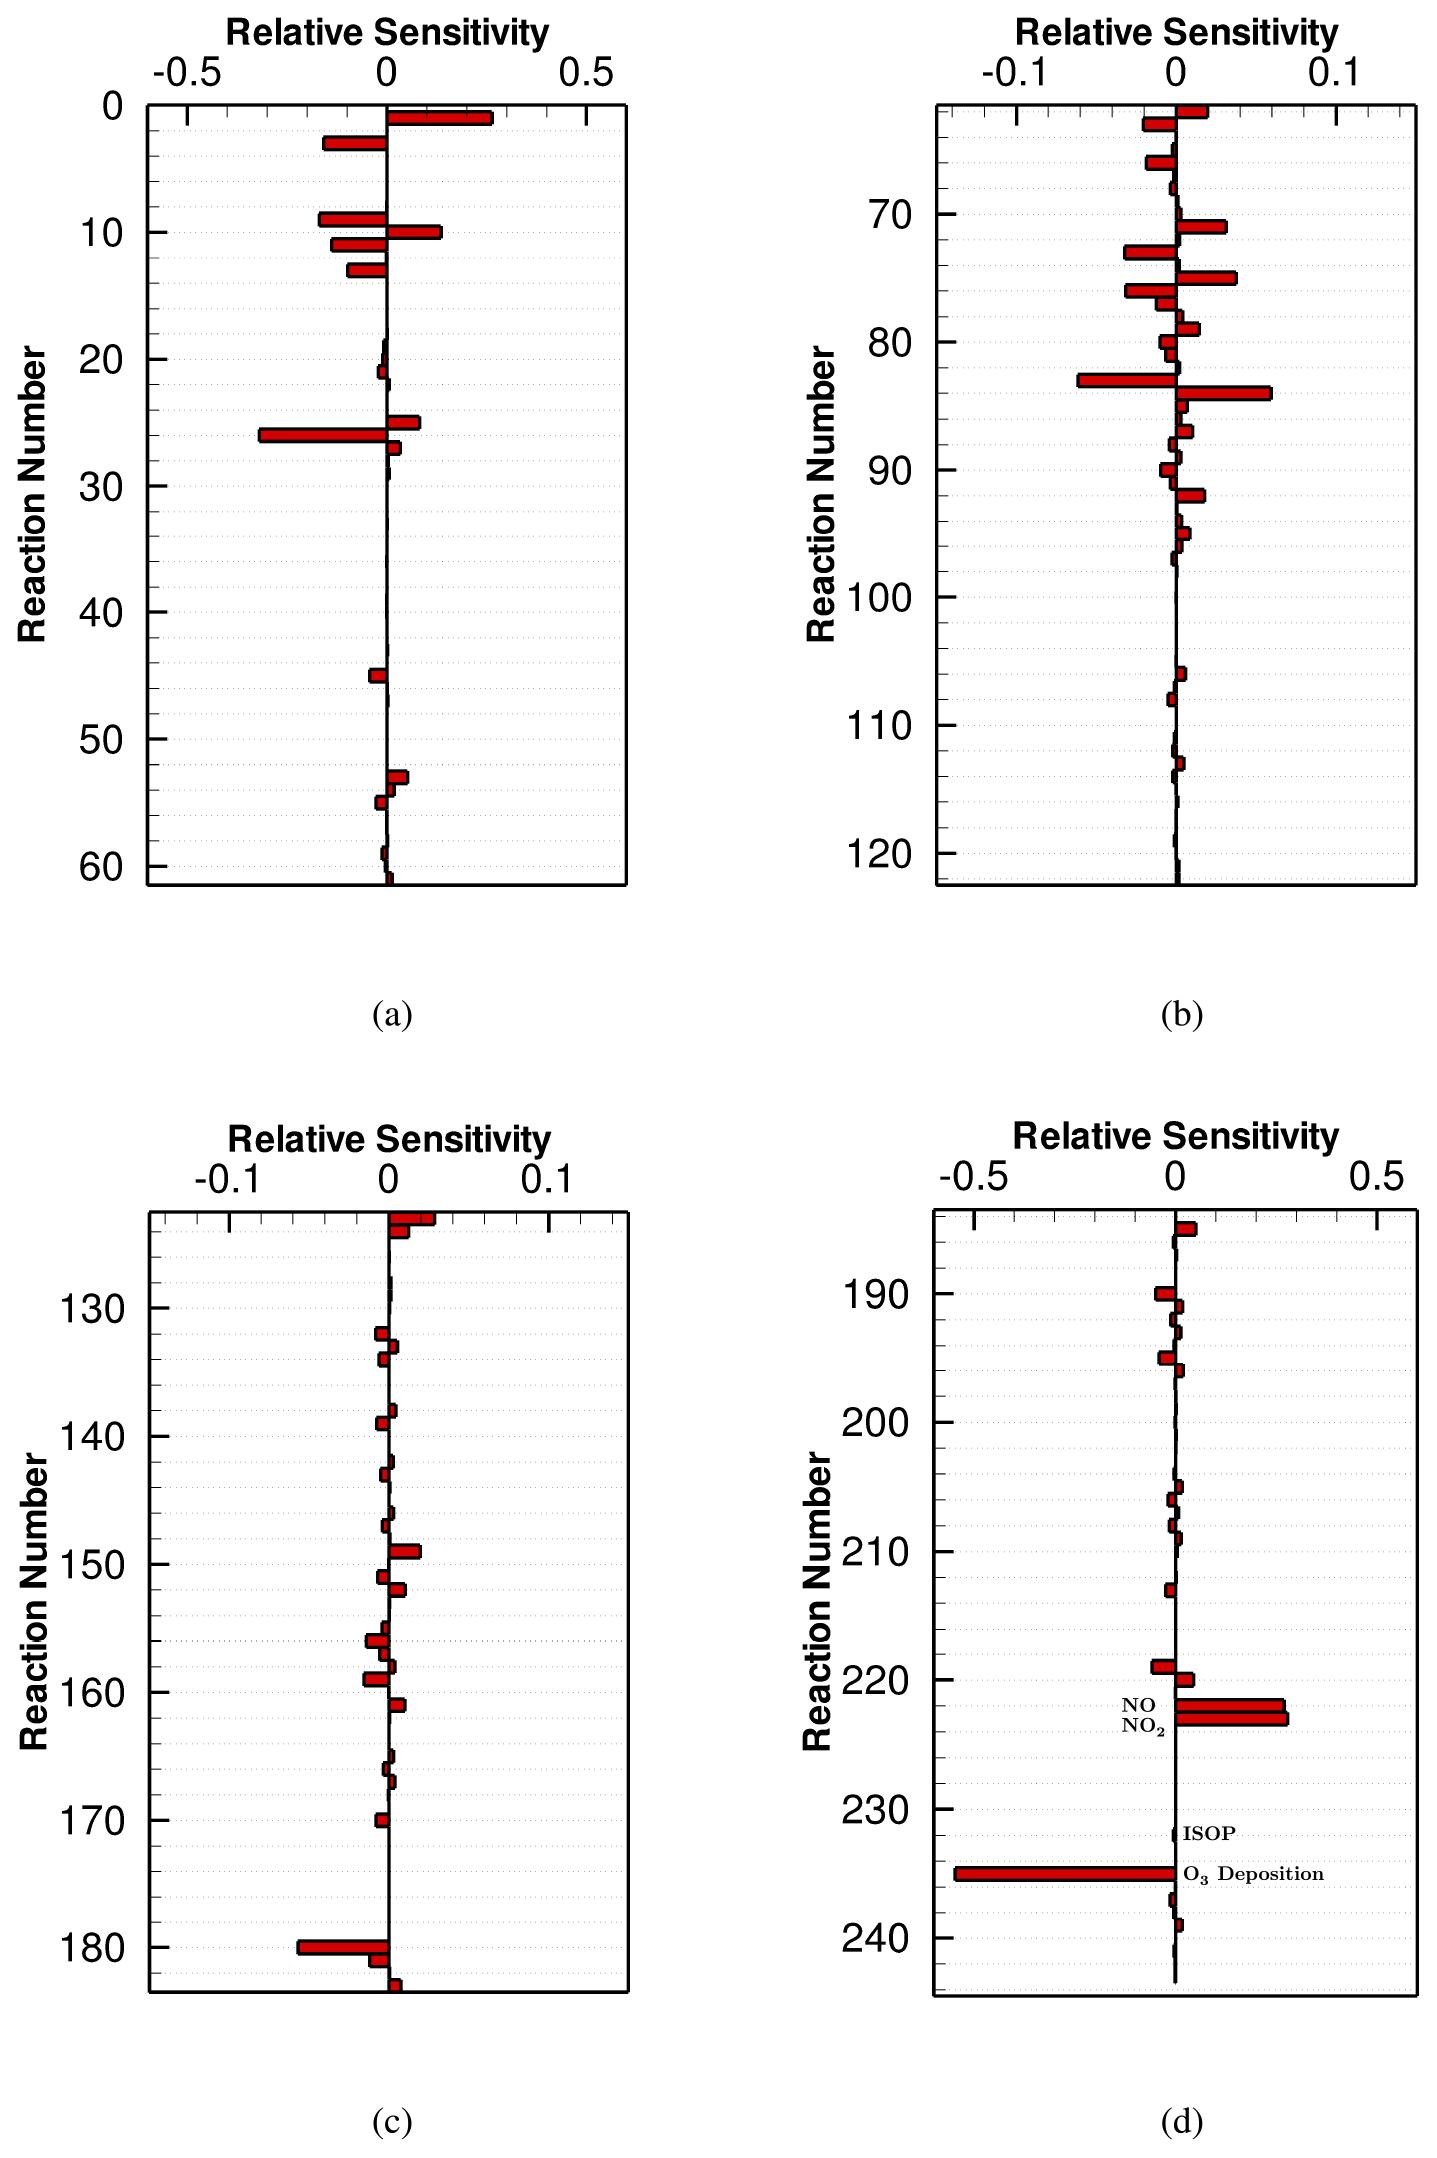
Figure 2Averaged ozone sensitivity to the CB6r3 mechanism over the seventh day, when the surface emission is weak. Note that the horizontal scales of the sub-figures are different. All the values of the sensitivities shown in this figure can be found in Table S1 in the Supplement.
3.2 Concentration sensitivity analysis of different CB6 mechanisms (weak emission)
We then conducted a concentration sensitivity analysis on different CB6 mechanisms under the weak-emission condition, and from these results we were able to identify the relative importance of each reaction in these mechanisms for the change in the focused species and discover the reasons causing the deviations between the simulation results of different CB6 mechanisms.
The ozone sensitivity to the CB6r3 mechanism averaged over the last day of the computation is shown in Fig. 2. A positive sensitivity means that an increase in the reaction rate would accelerate the formation of O3, while a negative value denotes a decline of O3 when the reaction rate increases. Note that Reactions (R222)–(R234) in Fig. 2d represent surface emissions belonging to different chemical species, and Reactions (R235)–(R243) denote dry depositions for different atmospheric constituents. It is seen from Fig. 2 that apart from the reactions standing for surface emissions and dry depositions, chemical reactions with large sensitivities mostly possess a reaction number less than 52 (i.e., before Reaction (R52) in the mechanism). Because Reactions (R1)–(R52) in the mechanism represent the inorganic chemistry while reactions after (R52) are mostly VOC-involved reactions (see Table A1 in the Appendix), it demonstrates an important role of the inorganic chemistry in this simulation, possibly due to the high initial value of NOx and the weak VOC emissions in this scenario. From the sensitivity analysis of CB6r3 shown in Fig. 2, we were also able to figure out the most important reactions for the change in ozone, which can be divided into two groups. The first reaction group includes Reactions (R1) , (R3) , (R25) , (R26) and (R45) , which are reactions denoting the inter-conversion of NOx and the loss of NOx through the formation of NO3 and HNO3. It demonstrates the significance of reactive nitrogen oxides in determining the final ozone level. The other important reaction group includes (R9) , (R10) , (R11) , and (R13) . These reactions represent the ozone loss due to the formation of hydroxyl radicals (i.e., OH). With respect to the other chemical reactions in the mechanism, their sensitivities are all smaller than 0.1 (see Fig. 2b, c and d), denoting a minor influence on the change in ozone by these chemical reactions.
Regarding the ozone sensitivities to surface emissions (i.e., Reactions R222–R234 in Fig. 2d) and dry depositions (i.e., Reactions R235–R243 in Fig. 2d), it is seen that although the implemented surface emission in this scenario is weak, the emission still exerts a strong influence on the change in ozone, indicated by relatively large sensitivity coefficients belonging to NO and NO2 emissions (∼ 0.3; see Fig. 2d). The values of the ozone sensitivities to the NO and NO2 emissions are comparable to those corresponding to chemical reactions denoting the inter-conversion of NOx (i.e., Reactions R1 and R3 in Fig. 2a). In contrast to that, although the emission intensity of isoprene in this scenario is relatively large, the dependence of ozone on the isoprene emission is minor, reflected by the small ozone sensitivity to the isoprene emission (i.e., Reaction R232 in Fig. 2d). In addition, it was also found in Fig. 2d that dry deposition is the largest sink of ozone in this weak-emission scenario, when CB6r3 is implemented.
We then computed the ozone sensitivities to the other two mechanisms (i.e., CB6r2 and CB6r1). Because these figures are similar to Fig. 2, we show these results in the Supplement of the paper (Figs. S1 and S2). The similarity between these figures also denotes a consistent treatment of the inorganic chemistry and a similar lumping technique of VOCs in these CB6 mechanisms. By comparing Fig. S1 in the Supplement with Fig. 2, we found that the averaged ozone sensitivity to CB6r2 over the last day is almost identical to the sensitivity to CB6r3, thus leading to a similar ozone prediction by these two mechanisms, which has been shown before (see Fig. 1a). The only major difference between the ozone sensitivities to CB6r2 and CB6r3 is that CB6r3 improves upon CB6r2 by adding Reactions (R217)–(R220) to include the temperature dependence of the alkyl nitrate formation. Therefore, the sensitivities of these reactions are absent for CB6r2, shown in Fig. S1. However, as mentioned above, under a condition of a 298 K temperature and 1 atm pressure, the formations of the alkyl nitrate in CB6r2 and CB6r3 are equivalent. Thus, the addition of these reactions in the CB6r3 mechanism would not significantly affect the predicted ozone in this scenario. However, at a different temperature, this update in CB6r3 may bring a large change in ozone, indicated by the relatively large sensitivities of ozone to Reactions (R219) and (R220) , shown in Fig. 2d.
We then tried to figure out reactions causing the higher ozone prediction of CB6r1. From a comparison between Figs. S1 and S2 in the Supplement, we found two factors heavily responsible for the higher ozone prediction of CB6r1. One is the modification of Reaction (R66) about the sink of CXO3 in CB6r1. CXO3 represents acyl peroxy radicals with three and higher carbons and is able to oxidize NO and thus form ozone. In CB6r1, the form of Reaction (R66) is , while in CB6r2, the form is . In CB6r1, the total amount of CXO3 is unaltered through Reaction (R66), thus leading to a negligible ozone sensitivity to Reaction (R66). However, the update of Reaction (R66) in CB6r2 causes this reaction to be a major sink of CXO3 in the mechanism. As a result, the ozone significance of Reaction (R66) increases in CB6r2. Moreover, due to this enhanced importance of Reaction (R66), it was found in CB6r2 that the significance of many other CXO3-related reactions, e.g., (R62) , (R63) , (R65) , (R67) , and (R110) drops from a moderate value in CB6r1 to a small value in CB6r2. The formation of ozone in CB6r2 is thus being suppressed due to the additional consumption of CXO3 through Reaction (R66). This finding also denotes an important role of CXO3 in determining ozone in the CB6 mechanisms. Thus, more attention should be paid to CXO3-related reactions in future mechanism developments. The significance of CXO3 in the mechanism for the conversion of NO to NO2 and the formation of ozone has also been identified by Luecken et al. (2008) in a model study on the behavior of three chemical mechanisms including CB-IV, CB05 and SAPRC99. Aside from the change in Reaction (R66), we also found that the ozone sensitivity to the isoprene emission shifts from a small value in CB6r2 and CB6r3 to a moderate positive value in CB6r1 (see Fig. S2d). Due to this sensitivity shift, when CB6r1 is used in the model, an enhanced emission of isoprene in this scenario would result in a significant elevation of the predicted ozone. The reason for this sensitivity shift is attributed to the modification of Reaction (R157) between CB6r1 and the other two mechanisms. In CB6r1, Reaction (R157) is in the form of , so that the emitted isoprene is partly converted to INTR (i.e., organic nitrates from isoprene reactions), while in CB6r2 and CB6r3 the product INTR is updated as NTR2. The product INTR in CB6r1 is able to react with OH, forming many organic compounds such as NTR, ALD2 and ALDX that can promote the ozone formation. In contrast, NTR2, the multi-functional nitrate formed through Reaction (R157) in CB6r2 and CB6r3, is then converted to HNO3, which is relatively inactive for the ozone formation. As a result, the influence caused by the isoprene emission on the change in ozone in CB6r2 and CB6r3 is weaker than that in CB6r1, which is also confirmed by the smaller ozone sensitivity to Reaction (R157) in CB6r2 and CB6r3. Moreover, because of the enhanced ozone dependence on the isoprene emission in CB6r1, the ozone sensitivities to many reactions that are associated with isoprene and the products of isoprene reactions, e.g., (R156) , (R92) , (R106) , and (R110) , in CB6r1 were also found to be larger than those in CB6r2 and CB6r3 (see Fig. S2). Thus, it can be concluded that the dependence of ozone in CB6r1 on the isoprene emission is different from that in CB6r2 and CB6r3 due to the change in the products of Reaction (R157), which will be discussed further in a later context.

Figure 3Averaged NOx sensitivity to the CB6r3 mechanism over the seventh day, when the surface emission is weak. Note that the horizontal scales of the sub-figures are different. All the values of the sensitivities shown in this figure can be found in Table S1.
The NOx sensitivity to the CB6r3 mechanism is displayed in Fig. 3. It is seen that in CB6r3, except for the reactions representing emissions and depositions, chemical reactions (R1) , (R3) and (R26) , are the most determining reactions for the change in NOx. It is because that the formation of NO3 in the presence of O3 is a major chemical pathway for the loss of NOx, especially in the nighttime. Other important chemical reactions for the change in NOx include Reaction (R9) , (R10) , (R11) , and (R25) , which are related to the formation of hydroxyl radicals (i.e., OH). It is not surprising as the reaction between OH and NO2 that forms HNO3 acts as a large sink of reactive nitrogen oxides. Regarding the other reactions in the mechanism, their sensitivities are much smaller, thus bringing a negligible influence on the change in NOx. With respect to the surface emissions, it can be found in Fig. 3 that the emissions of NO and NO2 would elevate the predicted level of NOx, which is natural. In contrast, the dependence of NOx on the isoprene emission is minor in this scenario using CB6r3, indicated by the corresponding small sensitivity (see Reaction R232 in Fig. 3d). Regarding the reactions signifying dry depositions, it was found in Fig. 3d that the dry deposition of ozone is able to strongly elevate the predicted level of NOx. The reason is that ozone is critical for the conversion of NO2 to NO3, which is a major loss of NOx in this scenario as discussed above. Thus, the decline of ozone due to dry deposition would substantially inhibit the formation of NO3, thus elevating the concentration of NOx.
The sensitivities of NOx to the other two CB6 mechanisms, CB6r2 and CB6r1, are shown in Figs. S3 and S4 in the Supplement, respectively. It was found that the sensitivity of NOx to CB6r2 shown in Fig. S3 is strongly similar to the sensitivity to CB6r3 displayed in Fig. 3. The largest change in the NOx sensitivity between CB6r3 and CB6r2 is the addition of reactions representing the temperature dependence of alkyl nitrate formation in CB6r3, i.e., Reactions (R217)–(R220) in Fig. 3d. However, as mentioned above, the scheme for the temperature dependence in CB6r3 is equivalent to that in CB6r2 under the situation used in this study. Thus, adding these reactions to CB6r3 would not exert a significant influence on the change in NOx. However, the moderate sensitivity coefficients belonging to Reactions (R219) and (R220) shown in Fig. 3d denote that under a different temperature condition, the change in NOx brought about by this update might be larger. Apart from this change, other reactions that largely modified between CB6r3 and CB6r2 possess a small sensitivity coefficient. Thus, choosing CB6r3 or CB6r2 in this weak-emission scenario would not significantly influence the predicted NOx. However, for the CB6r1 mechanism, Fig. S4d shows that the NOx sensitivity to the isoprene emission in CB6r1 is substantially larger than that in CB6r2 or CB6r3. It indicates that the dependence of NOx on the isoprene emission in CB6r1 is heavier than that in CB6r2 and CB6r3. The reason is also attributed to the change in Reaction (R157), which is similar to the conclusion achieved in the ozone sensitivity analysis discussed above. In CB6r1, the product INTR is generated through Reaction (R157) rather than NTR2 in CB6r2 and CB6r3. As a result, in CB6r1, the emitted isoprene can be more converted to organic compounds such as NTR. Then, the photolysis of NTR, i.e., Reaction (R92) , would increase the NOx concentration, leading to a higher NOx prediction of CB6r1 than those of CB6r2 and CB6r3. This mechanism is also indicated by the increased NOx sensitivity possessed by Reaction (R92) in CB6r1 compared to those in CB6r2 and CB6r3 (see Fig. S4).
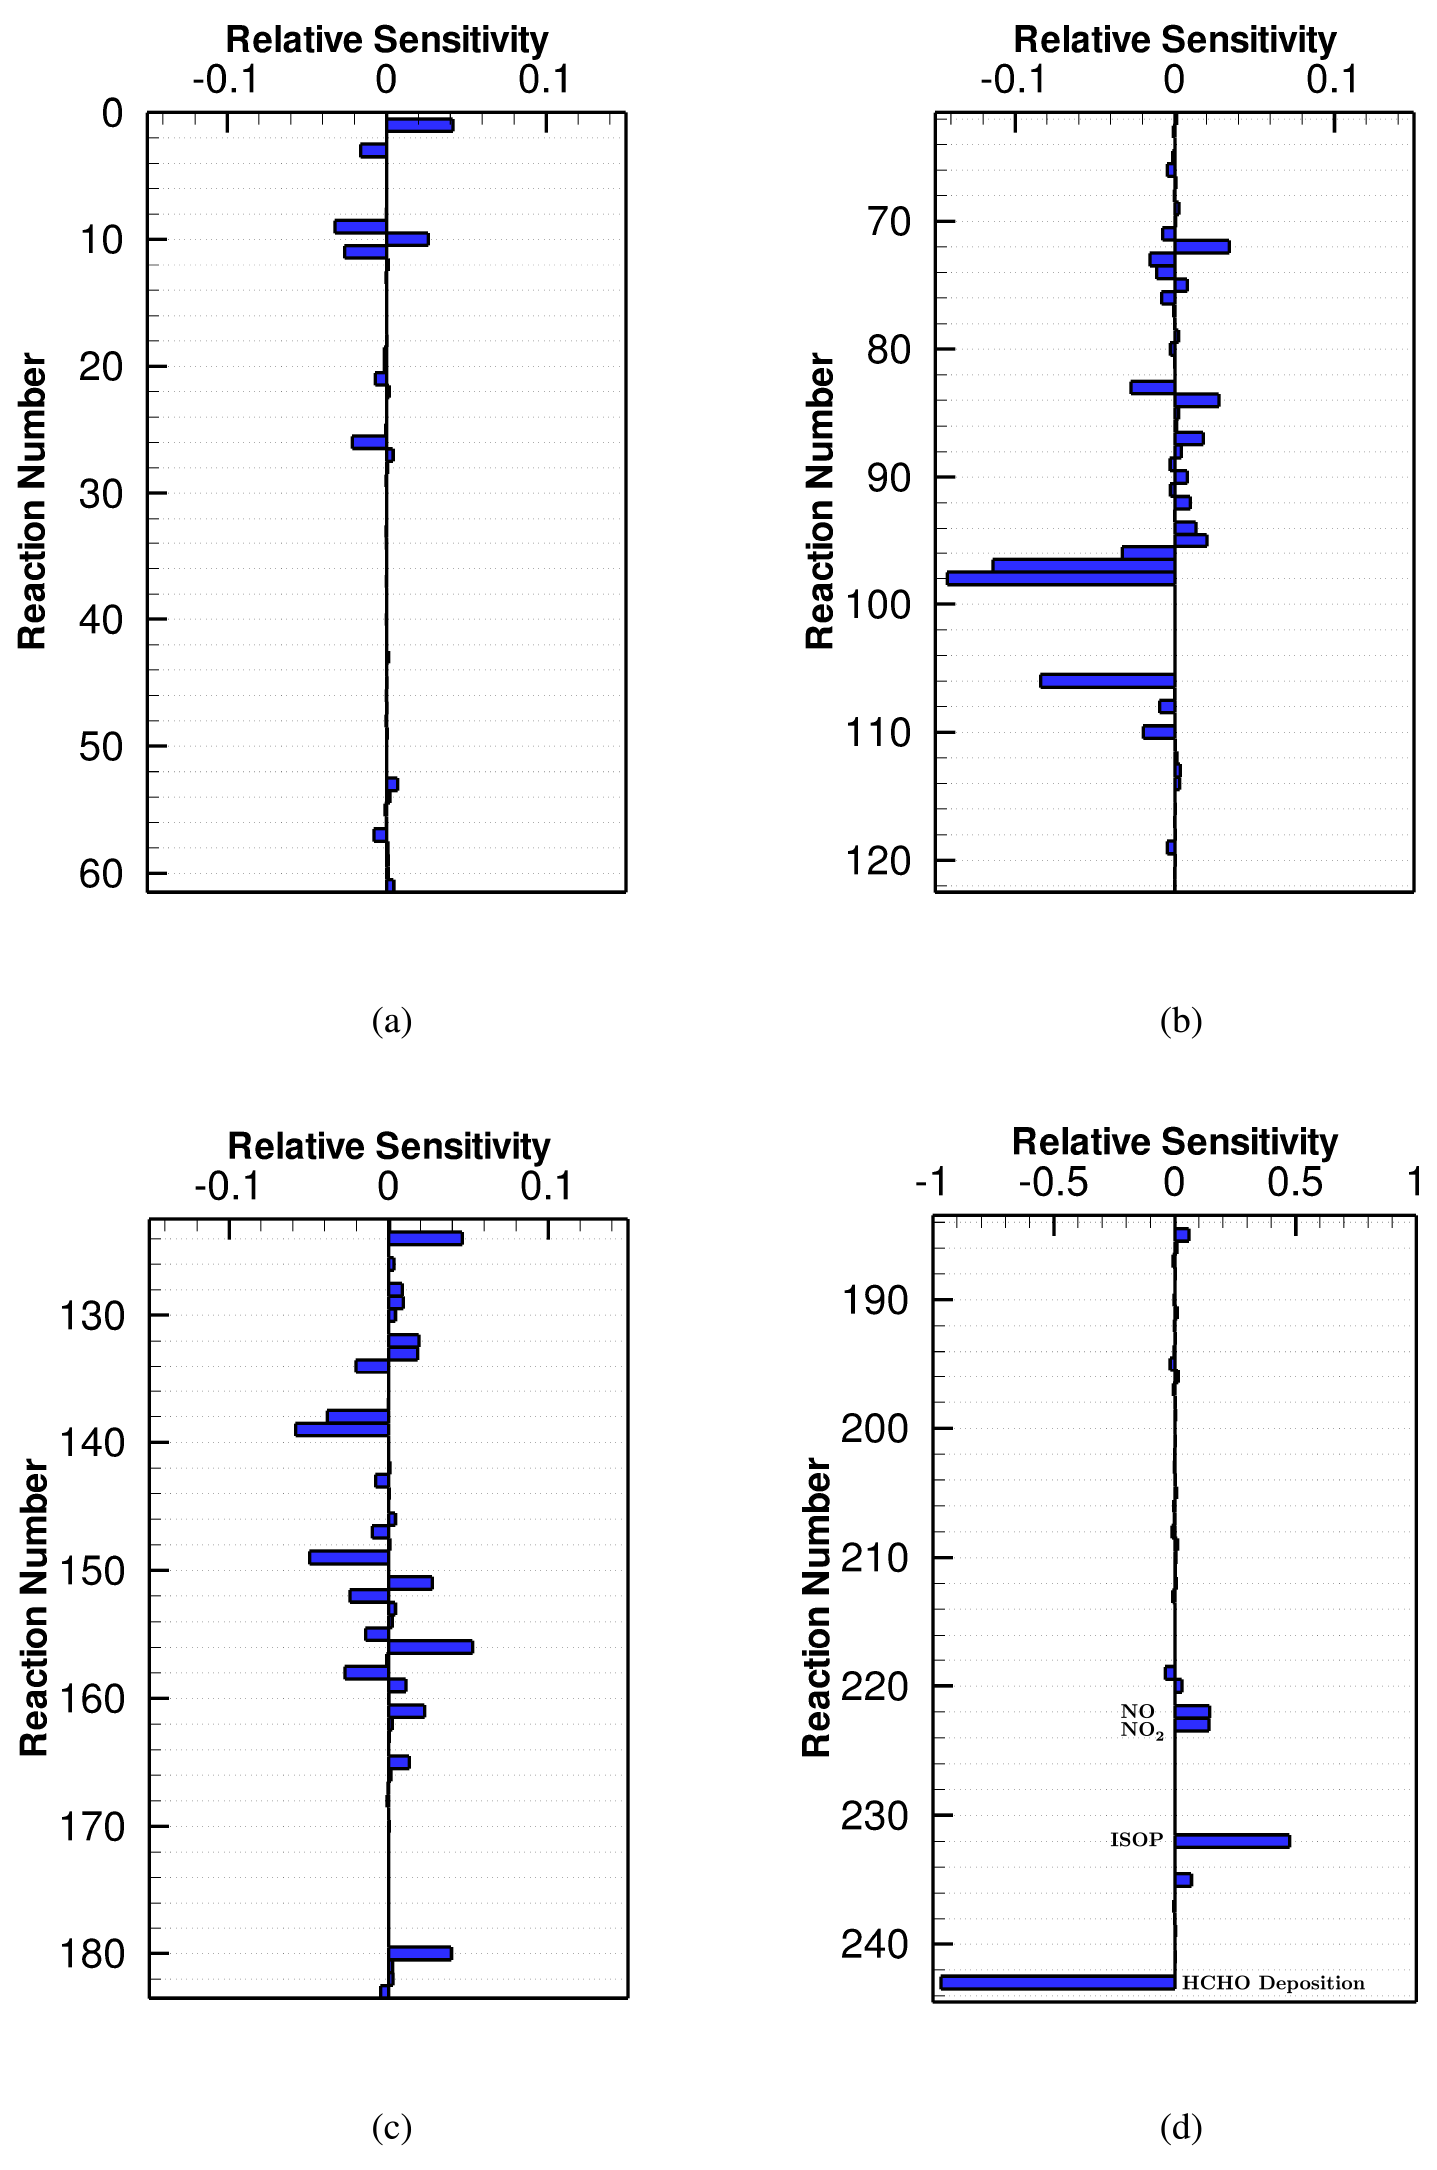
Figure 4Averaged HCHO sensitivity to the CB6r3 mechanism over the seventh day, when the surface emission is weak. Note that the horizontal scales of the sub-figures are different. All the values of the sensitivities shown in this figure can be found in Table S1.
At last, for the HCHO sensitivity, it is seen in Fig. 4 that in CB6r3, the largest HCHO decay pathway is the dry deposition, denoted by its most negative sensitivity coefficient (see Fig. 4d), and another major chemical pathway for the destruction of HCHO is the photolysis of HCHO, i.e., Reactions (R97) and (R98) , both of which possess relatively large absolute values of the HCHO sensitivity. In contrast, major HCHO formation pathways are found, including Reactions (R72) and (R124) . It is due to the large amount of CH4 in the initial condition, which is a major source of HCHO through its oxidation. Moreover, it was also found in Fig. 4c that Reaction (R156) plays an important role in the formation of HCHO, due to the emission of isoprene in this scenario. This strongly enhanced HCHO formation by the release of isoprene is also demonstrated by the large positive sensitivity coefficient possessed by the isoprene emission, i.e., Reaction (R232) in Fig. 4d. Thus, it can be concluded that, except for the initial amount of CH4, the emission intensity of isoprene is also a critical factor determining the predicted value of HCHO in this weak-emission scenario.
By comparing the HCHO sensitivity to CB6r3 shown in Fig. 4 with the HCHO sensitivities to CB6r2 (Fig. S5 in the Supplement) and CB6r1 (Fig. S6 in the Supplement), it was found that the largest change in the HCHO sensitivity between CB6r3 and CB6r2 is again the addition of reactions representing the temperature dependence in CB6r3. However, similar to the findings discussed above, the prediction of HCHO by CB6r3 is not heavily affected by the addition of these reactions under a standard condition and thus is similar to that by CB6r2. Most interestingly, different from the situations in simulating ozone and NOx, it was found in Fig. 4d that the reactions representing the temperature dependence (i.e., Reactions R217–R220) possess relatively small HCHO sensitivities (< 0.05). Thus, it can be expected that even under a different temperature condition, the influence on the HCHO prediction caused by the change in the temperature is also possibly small.
With respect to the HCHO sensitivity to CB6r1 (see Fig. S6), some changes were found. First, different from the small negative sensitivity to Reaction (R157) in CB6r2 and CB6r3, the HCHO sensitivity to Reaction (R157) in CB6r1 has a moderate positive value. We figured out that it is also caused by the difference in the product of this reaction between CB6r1 and the other two mechanisms. Through Reaction (R157), the emitted isoprene in CB6r1 can be more conveniently converted to active organic compounds such as NTR that can be oxidized and generate HCHO. Therefore, the predicted HCHO in CB6r1 is higher than that in CB6r2 and CB6r3 in this scenario (shown in Fig. 1c). This conclusion is also confirmed by the increased importance of Reaction (R92) in CB6r1 for the change in HCHO (see Fig. S6) and the elevated HCHO sensitivity to the isoprene emission in CB6r1 (∼ 0.53) compared to those in CB6r2 and CB6r3 (∼ 0.48). Another special finding from the analysis of the HCHO sensitivity to CB6r1 is that in CB6r1, a reverse in the signs of HCHO sensitivities to Reaction (R1) and (R3) occurs (see Fig. S6) compared to those in CB6r2 and CB6r3. The reason is also attributed to the difference in the HCHO dependence on the isoprene emission between CB6r1 and the other two mechanisms. The occurrence of Reaction (R3) is able to increase the ratio, which further promotes the formation of NO3. Because the reaction between NO3 and isoprene, i.e., Reaction (R157), plays a more important role in the prediction of HCHO in CB6r1 than in CB6r2/CB6r3 as discussed above, the occurrence of Reaction (R3) in CB6r1 can thus remarkably promote the formation of HCHO by accelerating the isoprene+NO3 reaction. In contrast, in CB6r2 or CB6r3, the reaction between isoprene and NO3 plays a relatively minor role in determining HCHO due to the product update from INTR to NTR2. Therefore, instead of accelerating the HCHO formation, NO2 formed through Reaction (R3) in CB6r2 and CB6r3 consumes OH and thus suppresses the formation of HCHO by retarding the oxidation of CH4. As a consequence, the sensitivity of HCHO to Reaction (R3) becomes negative in CB6r2 and CB6r3, shown in Figs. S5 and 4, respectively.
In general, the sensitivity analysis shows that when the surface emission is weak, one of the updates in CB6r2 and CB6r3 compared with CB6r1 that can strongly affect the ozone prediction is the change in the sink of CXO3, i.e., Reaction (R66). Because of this modification, the significance of many CXO3-related reactions also changes, causing a lower ozone prediction of CB6r2 and CB6r3 than that of CB6r1. Apart from that, the lower ozone predicted by CB6r2 and CB6r3 was also found contributed by the weaker dependence of ozone on the isoprene emission in CB6r2 and CB6r3 than that in CB6r1 due to the change in the product of the reaction between isoprene and NO3. By contrast, the ozone sensitivities to CB6r2 and CB6r3 are approximately the same, thus leading to a similar O3 prediction. With respect to NOx and HCHO, it was found that the difference in the product of the reaction between isoprene and NO3 causes a stronger dependence of NOx and HCHO on the emission of isoprene in CB6r1 than that in CB6r2 or CB6r3. As the isoprene emission in this scenario promotes the formation of NOx and HCHO, the levels of NOx and HCHO given by CB6r1 are slightly higher than those estimated by CB6r2 and CB6r3. In contrast, reactions that largely modified between CB6r2 and CB6r3 mostly have small sensitivities, so that these updates exert a negligible impact on the predictions of NOx and HCHO, and the predictions given by CB6r2 and CB6r3 are thus similar. However, under a different temperature condition, the predictions of O3 and NOx by CB6r3 might be largely different from those predicted by CB6r2 and CB6r1, indicated by the moderate values of the sensitivities belonging to the temperature-dependent reactions in CB6r3. In contrast, the estimation of HCHO might not be significantly affected, according to the small HCHO sensitivities to these temperature-dependent reactions in CB6r3.
3.3 Temporal evolution of ozone, NOx and HCHO (strong emission)
According to the discussions above, it is known that the difference between the estimations of atmospheric constituents using different CB6 mechanisms is not only caused by the change in the forms of reactions between these mechanisms, but also determined by the different dependence of the mechanism on surface emissions and dry depositions. Thus, we continued to increase the intensity of the surface emission to investigate the behavior of these CB6 mechanisms under a strong-emission condition. The emission intensity for each chemical species in this strong-emission scenario has been given in Table 1.
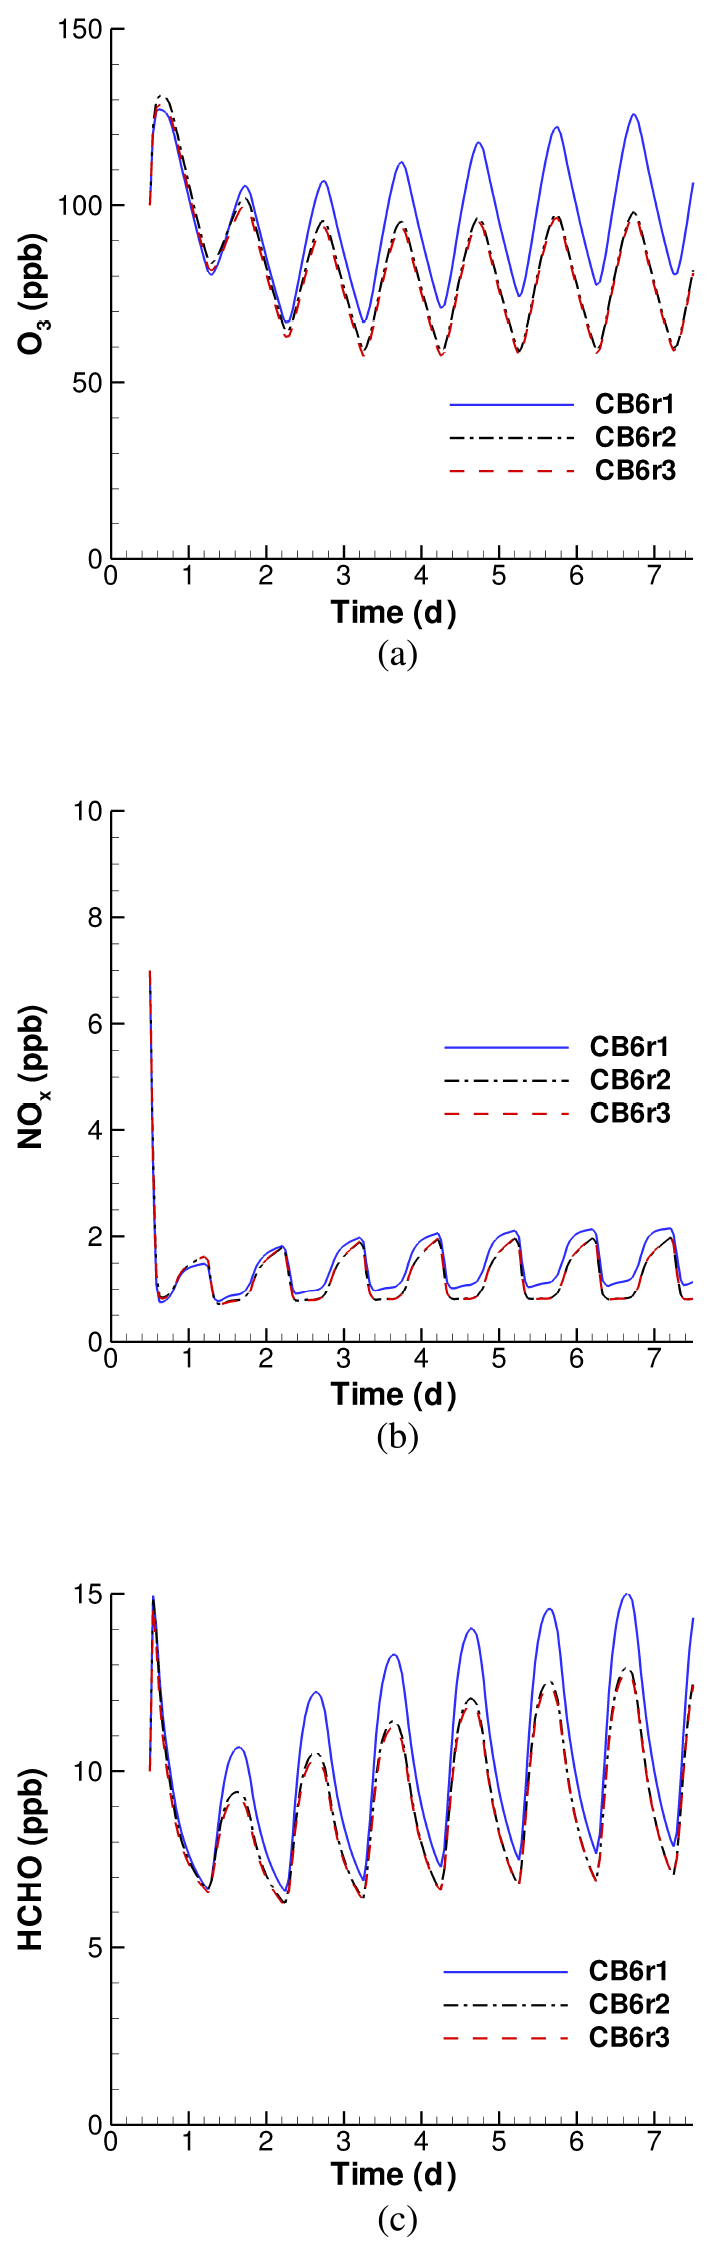
Figure 5Simulated temporal evolution of O3, NOx and HCHO by using different versions of the CB6 mechanism, when the surface emission is strong.
The temporal profiles of O3, NOx and HCHO in the strong-emission scenario is shown in Fig. 5. It is seen from Fig. 5a that after the increase in the surface emission, the ozone concentration remains steady during the whole simulated period instead of dropping to a low level in the weak-emission scenario. The ozone level at the end of the 7 d simulation is within a range of 60–130 ppb, much higher than that in the weak-emission scenario (∼ 20–40 ppb). By comparing ozone profiles obtained by using different CB6 mechanisms in Fig. 5a, we found the ozone predictions by CB6r2 and CB6r3 to be approximately the same, while CB6r1 predicts a much higher value. It was calculated that the averaged ozone over the seventh day predicted by CB6r1 is approximately 24 ppb higher than that predicted by CB6r2 or CB6r3. Thus, after the increase in the surface emission, the deviation in the predicted ozone between CB6r1 and the other two CB6 mechanisms is enlarged compared with that in the weak-emission scenario. It demonstrates that the CB6r1 mechanism has a stronger transformation ability in converting the surface emission into the change in ozone than the other two mechanisms. As a result, simulations using CB6r1 would yield a much higher ozone than that using CB6r2 or CB6r3 even though the same intensity of the surface emission is applied, and the deviation in the predicted ozone would become larger when the applied surface emission increases in the model. In a previous regional modeling of the air quality across the continental US (Ruiz Hildebrandt and Yarwood, 2013), it was reported that CB6r1 predicts a higher ozone than CB6r2. Thus, the results of the present study are consistent with the conclusions of Ruiz Hildebrandt and Yarwood (2013).
The change in NOx with time is displayed in Fig. 5b. It shows that NOx declines rapidly from the relatively high initial value (7 ppb) to a stable level, 1–2 ppb. This final value range is also much higher than that in the weak-emission scenario (< 0.5 ppb). An obvious diurnal variation of NOx is exhibited, and a peak value was found in the early morning of each day. Figure 5b also shows that CB6r2 and CB6r3 give similar NOx predictions, while CB6r1 behaves differently. CB6r1 predicts a higher NOx than CB6r2 and CB6r3 in most of the simulated period, and the difference grows when the end of the simulation approaches.
With respect to HCHO, we found that, due to the inclusion of the strong-surface emission in this scenario, the level of HCHO keeps increasing when the simulation proceeds. The emitted species that are responsible for the enhancement of HCHO will be investigated in a later context. The temporal change in HCHO shows a strong diurnal variation, in which it peaks in the afternoon and reaches the trough in the early morning of every day. The predicted HCHO profiles using CB6r2 and CB6r3 are found to be almost identical. In a box-model study of Marvin et al. (2017), they also found that using CB6r3 causes a negligible impact (< 1 %) on the simulated HCHO compared to using CB6r2, which is consistent with the findings of the present study. In contrast to that, CB6r1 consistently yields a higher value of HCHO than CB6r2 and CB6r3, and the deviation is more pronounced during the daytime. At the seventh day of the simulation, the peak value of HCHO at noon obtained by CB6r1 is around 14–15 ppb, while the lowest value is approximately 7 ppb. The deviation between the peak values of HCHO predicted by CB6r1 and the other two mechanisms is approximately 2.5 ppb. These values are all much higher than those in the weak-emission scenario (see Fig. 1c) due to the inclusion of the stronger surface emission.
In summary, due to the inclusion of a stronger surface emission, an enhancement of the predicted O3, NOx and HCHO was found compared with the weak-emission scenario. Moreover, simulated results of CB6r2 and CB6r3 are almost identical, while CB6r1 consistently gives higher values of O3, NOx and HCHO than the other two mechanisms. Moreover, the deviations between the estimations by CB6r1 and the other two CB6 mechanisms in this scenario were found to be enlarged compared to those in the weak-emission scenario, reflecting a stronger transformation ability of CB6r1 to convert the surface emissions into the change in atmospheric constituents.

Figure 6Averaged ozone sensitivity to the CB6r3 mechanism over the seventh day, when the surface emission is strong. All the values of the sensitivities shown in this figure can be found in Table S1.
3.4 Concentration sensitivity analysis of different CB6 mechanisms (strong emission)
The concentration sensitivity analysis was applied on these CB6 mechanisms again after implementing the strong surface emission. Figure 6 shows the ozone sensitivity to the CB6r3 mechanism. From a global view, it can be found that after increasing the surface emission, the importance of many reactions in the mechanism increases compared with the weak-emission case. Reactions that the significance changes the most are the following: (1) NOx-related reactions: (R1) and (R3) ; (2) terminal olefins (OLE)-related reactions: (R142) and (R143) ; (3) isoprene-related reactions: (R149) and (R157) . Moreover, Fig. 6d shows that the surface emissions of many chemical species exert a strong influence on the change in ozone, reflected by the relatively large ozone sensitivities to Reactions (R222)–(R234). It can be seen in Fig. 6 that the ozone sensitivities to the surface emissions are comparable to those belonging to the NOx-related reactions (i.e., R1 and R3). In addition, similarly to the weak-emission scenario, dry deposition, denoted by Reaction (R233) in Fig. 6d, acts as a major loss pathway of ozone, indicated by the large absolute value of its ozone sensitivity.
Among the surface emissions, the most influential emitted species for the change in O3 is NO (see Fig. 6d). It is not surprising as the oxidation of the emitted NO by the hydroperoxy radical and methylperoxy radicals would form O3. Aside from this, the release of NO2 would also increase the O3 level through its photolytic decomposition. In contrast to the NOx emissions, the increase in VOC emissions in this scenario would decrease the formation of O3, which is indicated in Fig. 6d by the negative ozone sensitivities to the VOC emissions. Moreover, it was found that the ozone sensitivity to the emissions of NOx is larger than that to the VOC emissions. This trend has also been revealed by Luecken et al. (2018), showing that the dependence of ozone on NOx is approximately 3 times as heavy as that on hydrocarbons in their model studies. In the present study, the most influential VOC for the change in O3 is found as ISOP (isoprene). Isoprene can react rapidly with OH and NO3, which substantially contributes to the formation and consumption of ozone. Thus, among the emissions of VOCs, more attention should be paid to the isoprene emission applied in air quality models in order to achieve a more accurate ozone prediction. In previous studies, it was shown that different biogenic emission models (e.g., MEGAN and BEIS) may yield different isoprene emission estimates (Bash et al., 2016; Zhang et al., 2017b). Thus, the choice of the biogenic emission model in the settings of the air quality model would strongly influence the modeled ozone according to the findings of the present study. Moreover, an enhancement of the emissions of terminal olefins (OLE), toluene (TOL), xylene and other polyalkyl aromatics (XYL) would also reduce the ozone level. From the response of the ozone concentration to the surface emission, we concluded that in this scenario, an emission control of NOx, especially NO, is effective in reducing O3, while an emission control of VOCs leads to an increase in ozone when CB6r3 is implemented.
The ozone sensitivities to the reactions of CB6r2 and CB6r1 as well as the surface emissions and dry depositions are shown in Figs. S7 and S8 in the Supplement. First, by comparing Fig. 6 with Fig. S7, we found that after the inclusion of the strong surface emission, the ozone sensitivities to CB6r3 and CB6r2 are still approximately the same. As a result, under this condition, O3 predicted by CB6r3 is almost equal to that predicted by CB6r2, which has been displayed in Fig. 5a. For the CB6r1 mechanism, the ozone sensitivity displayed in Fig. S8 shows a remarkable difference, especially in the dependence of O3 on the surface emission. It was found that in this strong-emission scenario, the dependence of O3 on the emission of isoprene is weaker in CB6r1 than that in CB6r2 and CB6r3 (see the sensitivity to Reaction (R233) in Fig. S8). By contrast, the ozone sensitivities to the emissions of other hydrocarbons in CB6r1 mostly stay unchanged. Thus, in CB6r1, the emitted VOC that O3 depends on the most becomes XYL (xylene and other polyalkyl aromatics) instead of ISOP (isoprene). As a result, the O3 destruction caused by the isoprene emission is suppressed in CB6r1. The importance of many isoprene-related reactions, such as Reaction (R149) , also becomes weaker in CB6r1 than that in CB6r2 and CB6r3. The reason for the lesser dependence of ozone on the isoprene emission in CB6r1 under this strong-emission condition is again attributed to the change in the product of Reaction (R157), i.e., ISOP+NO3. As discussed above in the weak-emission scenario, Reaction (R157) in CB6r1 is able to promote the formation of ozone by converting the emitted isoprene into organic nitrates such as INTR and NTR, which can be more conveniently recycled than the product NTR2 in CB6r2 and CB6r3. Because in this strong-emission scenario, the release of VOCs tends to suppress the ozone formation, the positive influence of the isoprene emission on the change in ozone brought by Reaction (R157) in CB6r1 can thus offset the negative dependence of ozone on the emission of isoprene, leading to a weaker dependence of ozone in CB6r1. This positive influence on the formation of ozone caused by Reaction (R157) in CB6r1 is also reflected by the shift of the ozone sensitivity to Reaction (R157) from negative in CB6r2 and CB6r3 to positive in CB6r1 (see Fig. S8) as well as the relatively large sensitivities possessed by INTR- and NTR-related reactions, i.e., (R170) INTR+OH and (R92) NTR+hν in CB6r1. Therefore, under the condition of a strong surface emission, due to the lesser dependence of O3 on the emitted isoprene, the O3 level predicted by CB6r1 is higher than that predicted by CB6r2 and CB6r3, which has been shown in Fig. 5a. In the weak-emission scenario shown before, we found the modification in Reaction (R66) about the sink of CXO3 to be another major factor causing the difference between the simulation results of CB6r1 and CB6r2/CB6r3. However, it can be seen in Fig. S8 that after increasing the surface emission, the ozone sensitivity to Reaction (R66) is negligible compared to the sensitivity to the surface emission. Therefore, the difference in the predicted ozone between different CB6 mechanisms is mostly caused by the change in the O3 dependence on the surface emission, especially the release of isoprene.
Figure 7Averaged NOx sensitivity to the CB6r3 mechanism over the seventh day, when the surface emission is strong. All the values of the sensitivities shown in this figure can be found in Table S1.
The sensitivities of NOx to the reactions of the CB6r3 mechanism as well as the surface emissions and dry depositions are displayed in Fig. 7. It can be seen that after the increase in the surface emission, the most dominant factor for the change in NOx is still the direct emission of NOx (i.e., Reactions (R222) and (R223) in Fig. 7d). Moreover, due to the enhanced NOx emission in this scenario, the significance of Reactions (R1) , (R3) and (R26) , which represent the inter-conversion of reactive nitrogen oxides and the loss of NOx due to the formation of NO3, increases compared with that in the weak-emission scenario. In contrast, for the reactions associated with the formation of OH, (R9) , (R10) , (R11) , and (R25) , which used to be important in the weak-emission scenario, their NOx sensitivities decrease. This is because, after the enhancement of the surface emission, the ozone level is elevated, so that NO2 is more involved in Reaction (R26) . As a result, the importance of the reaction between NO2 and OH for the change in NOx drops, leading to a lesser dependence of NOx on the formation of OH in this situation.
In this strong-emission scenario using CB6r3, the emitted species that NOx depends on the most is NO (see Fig. 7d), which is natural as the direct emission of NO would strongly increase NOx. The release of NO2 also elevates the NOx level predicted by CB6r3. In contrast to that, the release of different VOCs exerts a different influence on the concentration change in NOx. The emissions of ISO (isoprene) and OLE (terminal olefins) would increase the simulated level of NOx, while the emissions of TOL (toluene) and XYL (xylene and other polyalkyl aromatics) decrease it. Figure 7d also shows that the dependence of NOx on the emissions of VOCs is remarkably lower than that on the direct emissions of NOx, which is similar to the conclusion achieved in the ozone sensitivity analysis. In addition, Fig. 7d shows that in this scenario, the dry deposition of ozone still plays the role of enhancing the formation of NOx as that in the weak-emission scenario due to the deceleration of NO3 formation by the decline of ozone.
From a comparison between the NOx sensitivities to CB6r2 (shown in Fig. S9 in the Supplement) and CB6r3 (see Fig. 7), again we found that the NOx sensitivity to CB6r2 is almost identical to that to CB6r3, thus leading to a similar prediction of NOx by these two mechanisms. However, for CB6r1 (see Fig. S10 in the Supplement), the sensitivities of NOx to the surface emissions of NO and NO2 (0.84 and 0.13) are relatively larger than those in CB6r2 and CB6r3 (0.76–0.79 and 0.11). The reason for the heavier dependence of NOx on the surface emissions in CB6r1 is that the reaction between isoprene and NO3 in CB6r1 facilitates the formation of organic nitrates (i.e., NTR, INTR) as discussed above. The formed organic nitrates are then photolyzed or react with OH, forming NOx. As a result, the emitted NOx is more involved in the chemical system represented by CB6r1, leading to a higher dependence of NOx on the direct release of NO and NO2 in CB6r1. As a consequence, the NOx level predicted by CB6r1 is higher than those given by CB6r2 and CB6r3, with the same emission intensity of NOx.
Figure 8Averaged HCHO sensitivity to the CB6r3 mechanism over the seventh day, when the surface emission is strong. All the values of the sensitivities shown in this figure can be found in Table S1.
At last, we focused on the averaged sensitivities of HCHO to these three different CB6 mechanisms. Figure 8 shows the HCHO sensitivities to the chemical reactions, surface emissions and dry depositions for the CB6r3 mechanism. It was found that processes that play an important role in the change in HCHO include Reaction (R96) , Reaction (R97) , and Reaction (R98) , which are reactions consuming HCHO, and the dry deposition process denoted by Reaction (R243) in Fig. 8d. These important HCHO decay pathways are the same as those in the weak-emission case. In addition, a strong negative role of Reaction (R26) in determining HCHO is also identified under this strong-emission condition (see Fig. 8a). The reason is that in CB6r3, the emitted isoprene reacts with NO3 generated from Reaction (R26), forming NTR2. NTR2 is then converted to the inactive HNO3 and thus exerts a minor influence on the change in HCHO. Therefore, the occurrence of Reaction (R26) in CB6r3 can substantially suppress the formation of HCHO caused by the release of isoprene, especially under this strong NOx emission condition. It is also interesting to note that Reaction (R124) that used to strongly promote the formation of HCHO in the weak-emission scenario no longer possesses a large sensitivity. It denotes a decreased importance of the initial CH4 in the formation of HCHO after increasing the surface emission in the model. Instead, the release of VOCs would significantly promote the formation of HCHO.
From the dependence of HCHO on the surface emissions displayed in Fig. 8d, we found that an increase in the emission intensity of VOCs, especially isoprene and terminal olefins, would significantly enhance the HCHO formation, and the influence caused by the emissions of isoprene and terminal olefins is approximately equal, indicated by the similar sensitivities to these two emissions. This strong influence of the emissions of isoprene and other olefins on the change in HCHO has also been identified in many previous studies (Luecken et al., 2006, 2008; Wolfe et al., 2016; Marvin et al., 2017). Moreover, in the present study, we found that the increase in the NOx emission leads to an elevation of HCHO. It is because that the release of NOx would significantly increase the ozone level in this scenario. As Reaction (R156) is a major pathway for the formation of HCHO, reflected by the strong HCHO dependence on Reaction (R156) (see Fig. 8c), the increase in ozone due to the enhanced NOx emission would thus promote the formation of HCHO, leading to a positive dependence of HCHO on the release of NOx. It was also found in this study that HCHO is more sensitive to VOCs than NOx, which is in accordance with the conclusions achieved in the previous sensitivity study of HCHO to precursor species (Luecken et al., 2018). The reason is that HCHO can be formed under both NOx-rich and NOx-poor conditions, resulting in a weaker dependence of HCHO on the NOx emissions than that on the VOCemissions.
In a previous modeling study conducted by Luecken et al. (2019) using CB6r3, they found an underestimation of HCHO in a comparison with observations across the US. Luecken et al. (2019) suggested that the underestimation of HCHO might be caused by the uncertainties in biogenic emissions, including direct HCHO emissions and other VOC emissions. Based on our findings, we suggested that the underestimation of HCHO might be caused by the underestimation of isoprene and other alkene emissions. In contrast, the direct emission of HCHO may possibly only exert a minor impact on the change in HCHO, according to the sensitivity analysis of CB6r3 in the present study. In the study of Luecken et al. (2019), they also performed a sensitivity test by doubling the isoprene emission, and it was found that the simulated HCHO is elevated due to the enhancement of the isoprene emission. This is also in accordance with our findings in the present study.
By comparing the HCHO sensitivities to CB6r3 (Fig. 8) with those to CB6r2 (Fig. S11 in the Supplement), we noticed that the most dominant reactions for the change in HCHO are approximately the same in these two mechanisms, thus leading to a similar HCHO prediction by these two mechanisms. However, the sensitivity of HCHO to CB6r1 displayed in Fig. S12 in the Supplement shows that in CB6r1, the significance of the isoprene emission for the change in HCHO (∼ 0.39) is approximately 10 % higher than that in CB6r2 and CB6r3 (∼ 0.36). As a result, the same increment in the isoprene emission would lead to a relatively larger increase in HCHO predicted by CB6r1 relative to that predicted by CB6r2 or CB6r3. This is also the reason for the relatively higher HCHO prediction by CB6r1 shown in Fig. 5. Again, it is attributed to the higher ozone prediction of CB6r1 caused by the change in Reaction (R157). Because the major HCHO formation pathway in this simulation scenario is the reaction between isoprene and ozone, under the condition with higher ozone estimated by CB6r1, a larger amount of the emitted isoprene can be converted to HCHO, thus causing the higher HCHO prediction and the heavier dependence of HCHO on the isoprene emission in CB6r1. This finding again indicates the importance of revising the isoprene chemistry in future updates to the CB6 mechanism.
In summary, in the situation with the inclusion of the strong surface emission in the model, we found that the ozone level predicted by CB6r2 and CB6r3 depends heavily on the surface emission, especially the release of NO and isoprene. In contrast, the dependence of ozone on the isoprene is weaker in CB6r1. Aside from that, the importance of many isoprene-related reactions in CB6r1 for the change in ozone decreases, which is shown in the sensitivity analysis. These changes in the ozone sensitivity lead to a higher ozone prediction of CB6r1 relative to those of CB6r2 and CB6r3, even though a same surface emission condition is applied. With respect to the change in NOx, in CB6r2 and CB6r3, the most influential emissions are also the release of NO and isoprene. However, in CB6r1, the dependence of the predicted NOx on the surface emissions of NO and NO2 is heavier than that in CB6r2 and CB6r3 due to the change in the product of the reaction between isoprene and NO3, resulting in a higher NOx prediction of CB6r1. At last, for HCHO, the sensitivity analysis shows that the change in HCHO relies more on the emissions of VOCs than the emissions of NOx, and the enhancement of the VOC emissions, particularly isoprene and terminal olefins, would significantly promote the formation of HCHO. However, the dependence of HCHO on the release of isoprene in CB6r1 is stronger than that in the other two mechanisms, thus leading to a higher prediction of HCHO in CB6r1 under the same emission condition.
In the present study, we found that different versions of the CB6 mechanism perform differently in simulating O3, NOx and HCHO, although the same initial condition and the same intensity of the surface emission are set up. When the surface emission is weak, CB6r1 predicts a higher ozone value than the other two mechanisms, and the deviation is approximately 7 ppb. The sensitivity analysis suggests that the higher ozone prediction by CB6r1 is partly caused by the modification of the chemical loss pathways of acyl peroxy radicals with three and higher carbons (i.e., species CXO3) in the mechanism. Due to this modification, less CXO3 is consumed in CB6r1 than that in CB6r2 and CB6r3, resulting in a higher ozone prediction by CB6r1. Moreover, the ozone sensitivity to the isoprene emission in CB6r1 was found to be larger than those in CB6r2 and CB6r3, which also contributes to the higher ozone prediction of CB6r1 under the same isoprene emission condition. Regarding NOx and HCHO, the estimations given by CB6r1 are higher than those given by CB6r2 and CB6r3, but the deviations between the simulation results become smaller at the end of the 7 d computation. The sensitivity analysis also shows that the update in CB6r3 about the temperature dependence of organic nitrate formation might exert a strong influence on the predictions of ozone and NOx under a different temperature condition, while the impact of the temperature change on HCHO might be minor.
After implementing a strong surface emission in the model, we found the simulated levels of O3, NOx and HCHO to be elevated compared with those in the weak-emission scenario. It was also found that the ozone concentration predicted by CB6r2 and CB6r3 depends on the emissions of NO and isoprene the most, while in CB6r1 the dependence of ozone on the isoprene emission is weaker. Because in this simulation scenario the isoprene emission tends to suppress the ozone formation, ozone predicted by CB6r1 is higher than that predicted by CB6r2 and CB6r3 with the same emission intensity. With respect to the NOx prediction, in CB6r1, the association between the mixing ratio of NOx and the release of NO and NO2 was found to be stronger than that in CB6r2 and CB6r3. This is because the released NOx is more involved in the reaction system represented by CB6r1, thus leading to a higher NOx prediction of CB6r1 compared with that given by CB6r2 or CB6r3. At last, we found that the HCHO predictions of these three CB6 mechanisms rely mostly on the emissions of NO, isoprene and terminal olefins. However, in CB6r1, the association between HCHO and the isoprene emission is stronger, resulting in a higher HCHO prediction relative to those in CB6r2 and CB6r3 with the same isoprene emission.
The present study has its limitations. The conclusions achieved in this study are mostly valid under conditions that have been presented and analyzed in this box-model study, and these conditions may possibly differ from those present in 3-D model simulations of the atmosphere. Therefore, in the future, we plan to test the behavior of these CB6 mechanisms under different environmental conditions with different surface emission intensities, especially the conditions that are implemented in 3-D model studies of the atmosphere. The influence caused by varying the temperature on the concentration change in the focused species, especially for CB6r3, should also be investigated. Moreover, the latest version of the CB6 mechanism, CB6r4 (Emery et al., 2016), should be studied and compared with the three CB6 mechanisms investigated in the present study, particularly in a halogen-rich environment. In addition, the conclusions achieved in this box-model study need to be confirmed in simulations using multi-dimensional air quality models. At present, we are conducting 3-D simulations using CMAQ (Byun and Schere, 2006) and CAMx (ENVIRON, 2015; Ramboll Environment and Health, 2020) to discover the difference in modeling O3, NOx and HCHO by using these different versions of the CB6 mechanism, which is attributed to a future publication.
Table A1Complete listings of chemical reactions belonging to different CB6 mechanisms used in the present study. The updates between different versions of the CB6 mechanism are also marked. The abbreviation “–” denotes that there is no change in the form of this reaction between different CB6 mechanisms.
Notes: a Yarwood et al. (2012). b Ruiz Hildebrandt and Yarwood (2013). c Emery et al. (2015). d Added to the mechanism to represent surface emissions, not included in the original mechanism. e Added to the mechanism to represent dry depositions, not included in the original mechanism.
The source code of the model and the data of the computational results shown in this article can be acquired from the link https://faculty.nuist.edu.cn/caole/en/kyxm/72647/content/17260.htm#kyxm (Cao, 2021).
The supplement related to this article is available online at: https://doi.org/10.5194/acp-21-12687-2021-supplement.
LC conceived the idea of the article and wrote the python script for converting the data format. LC also configured and performed the computations. SL revised the chemical mechanisms and wrote the paper together with LC. LS revised the paper and gave valuable suggestions. All the authors listed read and approved the final manuscript.
The authors declare that they have no conflict of interest.
Publisher's note: Copernicus Publications remains neutral with regard to jurisdictional claims in published maps and institutional affiliations.
The numerical calculations in this paper have been done on the high-performance computing system in the High Performance Computing Center, Nanjing University of Information Science & Technology. The authors also like to thank Rolf Sander from the Max Planck Institute for Chemistry for his valuable suggestions on the improvements of the model.
This research has been supported by the National Key R&D Program of China (grant no. 2017YFC0209801) and the National Natural Science Foundation of China (grant no. 41705103).
This paper was edited by Holger Tost and reviewed by two anonymous referees.
Ammann, M., Cox, R. A., Crowley, J. N., Jenkin, M. E., Mellouki, A., Rossi, M. J., Troe, J., and Wallington, T. J.: Evaluated kinetic and photochemical data for atmospheric chemistry: Volume VI – heterogeneous reactions with liquid substrates, Atmos. Chem. Phys., 13, 8045–8228, https://doi.org/10.5194/acp-13-8045-2013, 2013. a
Atkinson, R., Baulch, D. L., Cox, R. A., Crowley, J. N., Hampson, R. F., Hynes, R. G., Jenkin, M. E., Rossi, M. J., and Troe, J.: Evaluated kinetic and photochemical data for atmospheric chemistry: Volume I – gas phase reactions of Ox, HOx, NOx and SOx species, Atmos. Chem. Phys., 4, 1461–1738, https://doi.org/10.5194/acp-4-1461-2004, 2004. a
Atkinson, R., Baulch, D. L., Cox, R. A., Crowley, J. N., Hampson, R. F., Hynes, R. G., Jenkin, M. E., Rossi, M. J., Troe, J., and IUPAC Subcommittee: Evaluated kinetic and photochemical data for atmospheric chemistry: Volume II – gas phase reactions of organic species, Atmos. Chem. Phys., 6, 3625–4055, https://doi.org/10.5194/acp-6-3625-2006, 2006. a
Atkinson, R., Baulch, D. L., Cox, R. A., Crowley, J. N., Hampson, R. F., Hynes, R. G., Jenkin, M. E., Rossi, M. J., and Troe, J.: Evaluated kinetic and photochemical data for atmospheric chemistry: Volume III – gas phase reactions of inorganic halogens, Atmos. Chem. Phys., 7, 981–1191, https://doi.org/10.5194/acp-7-981-2007, 2007. a
Atkinson, R., Baulch, D. L., Cox, R. A., Crowley, J. N., Hampson, R. F., Hynes, R. G., Jenkin, M. E., Rossi, M. J., Troe, J., and Wallington, T. J.: Evaluated kinetic and photochemical data for atmospheric chemistry: Volume IV – gas phase reactions of organic halogen species, Atmos. Chem. Phys., 8, 4141–4496, https://doi.org/10.5194/acp-8-4141-2008, 2008. a
Bash, J. O., Baker, K. R., and Beaver, M. R.: Evaluation of improved land use and canopy representation in BEIS v3.61 with biogenic VOC measurements in California, Geosci. Model Dev., 9, 2191–2207, https://doi.org/10.5194/gmd-9-2191-2016, 2016. a, b
Bloss, C., Wagner, V., Jenkin, M. E., Volkamer, R., Bloss, W. J., Lee, J. D., Heard, D. E., Wirtz, K., Martin-Reviejo, M., Rea, G., Wenger, J. C., and Pilling, M. J.: Development of a detailed chemical mechanism (MCMv3.1) for the atmospheric oxidation of aromatic hydrocarbons, Atmos. Chem. Phys., 5, 641–664, https://doi.org/10.5194/acp-5-641-2005, 2005. a
Byun, D. and Schere, K. L.: Review of the Governing Equations, Computational Algorithms, and Other Components of the Models-3 Community Multiscale Air Quality (CMAQ) Modeling System, Appl. Mech. Rev., 59, 51–77, https://doi.org/10.1115/1.2128636, 2006. a, b, c, d
Cao, L.: The source code and the data of computational results for “Study of different Carbon Bond 6 (CB6) mechanisms by using a concentration sensitivity analysis”, NUIST Information Platform [code and data set], available at: https://faculty.nuist.edu.cn/caole/en/kyxm/72647/content/17260.htm#kyxm, last access: 20 August 2021. a
Cao, L., Sihler, H., Platt, U., and Gutheil, E.: Numerical analysis of the chemical kinetic mechanisms of ozone depletion and halogen release in the polar troposphere, Atmos. Chem. Phys., 14, 3771–3787, https://doi.org/10.5194/acp-14-3771-2014, 2014. a
Cao, L., Wang, C., Mao, M., Grosshans, H., and Cao, N.: Derivation of the reduced reaction mechanisms of ozone depletion events in the Arctic spring by using concentration sensitivity analysis and principal component analysis, Atmos. Chem. Phys., 16, 14853–14873, https://doi.org/10.5194/acp-16-14853-2016, 2016. a
Cao, L., Gao, M., Li, S., Yi, Z., and Meng, X.: Sensitivity analysis of the dependence of the Carbon Bond Mechanism IV (CBM-IV) on the initial air composition under an urban condition, Atmospheric Environment, 215, 116 860, https://doi.org/10.1016/j.atmosenv.2019.116860, 2019. a
Carter, W. P.: Documentation of the SAPRC-99 chemical mechanism for VOC reactivity assessment, Tech. Rep. 329, California Air Resources Board, Riverside, CA, USA, 2000a. a
Carter, W. P.: Implementation of the SAPRC-99 chemical mechanism into the Models-3 framework, Tech. rep., United States Environmental Protection Agency, Riverside, CA, USA, 2000b. a
Carter, W. P.: Development of the SAPRC-07 chemical mechanism, Atmos. Environ., 44, 5324–5335, https://doi.org/10.1016/j.atmosenv.2010.01.026, 2010. a
Crowley, J. N., Ammann, M., Cox, R. A., Hynes, R. G., Jenkin, M. E., Mellouki, A., Rossi, M. J., Troe, J., and Wallington, T. J.: Evaluated kinetic and photochemical data for atmospheric chemistry: Volume V – heterogeneous reactions on solid substrates, Atmos. Chem. Phys., 10, 9059–9223, https://doi.org/10.5194/acp-10-9059-2010, 2010. a
Derwent, R.: Intercomparison of chemical mechanisms for air quality policy formulation and assessment under North American conditions, J. Air Waste Manage., 67, 789–796, https://doi.org/10.1080/10962247.2017.1292969, 2017. a
Derwent, R. G.: Representing Organic Compound Oxidation in Chemical Mechanisms for Policy-Relevant Air Quality Models under Background Troposphere Conditions, Atmosphere, 11, 171, https://doi.org/10.3390/atmos11020171, 2020. a, b
Emery, C., Jung, J., Koo, B., and Yarwood, G.: Final Report, Improvements to CAMx Snow Cover Treatments and Carbon Bond Chemical Mechanism for Winter Ozone, Tech. rep., Ramboll Environ, Novato, CA, USA, 2015. a, b, c, d
Emery, C., Koo, B., Hsieh, W., Wentland, A., Wilson, G., and Yarwood, G.: Technical Memorandum to Chris Misenis at U.S. EPA, Tech. rep., Ramboll Environ, Novato, CA, USA, 2016. a, b, c, d
Emmons, L. K., Walters, S., Hess, P. G., Lamarque, J.-F., Pfister, G. G., Fillmore, D., Granier, C., Guenther, A., Kinnison, D., Laepple, T., Orlando, J., Tie, X., Tyndall, G., Wiedinmyer, C., Baughcum, S. L., and Kloster, S.: Description and evaluation of the Model for Ozone and Related chemical Tracers, version 4 (MOZART-4), Geosci. Model Dev., 3, 43–67, https://doi.org/10.5194/gmd-3-43-2010, 2010. a
ENVIRON: User's Guide: Comprehensive Air Quality Model with Extensions (CAMx), Version 6.50, Tech. rep., Ramboll Environment and Health, Novato, CA, USA, 2015. a, b, c
Gery, M. W., Whitten, G. Z., Killus, J. P., and Dodge, M. C.: A photochemical kinetics mechanism for urban and regional scale computer modeling, J. Geophys. Res.-Atmos., 94, 12925–12956, 1989. a, b, c
Grell, G. A., Peckham, S. E., Schmitz, R., McKeen, S. A., Frost, G., Skamarock, W. C., and Eder, B.: Fully coupled “online” chemistry within the WRF model, Atmos. Environ., 39, 6957–6975, https://doi.org/10.1016/j.atmosenv.2005.04.027, 2005. a
Guenther, A., Karl, T., Harley, P., Wiedinmyer, C., Palmer, P. I., and Geron, C.: Estimates of global terrestrial isoprene emissions using MEGAN (Model of Emissions of Gases and Aerosols from Nature), Atmos. Chem. Phys., 6, 3181–3210, https://doi.org/10.5194/acp-6-3181-2006, 2006. a
Guenther, A. B., Jiang, X., Heald, C. L., Sakulyanontvittaya, T., Duhl, T., Emmons, L. K., and Wang, X.: The Model of Emissions of Gases and Aerosols from Nature version 2.1 (MEGAN2.1): an extended and updated framework for modeling biogenic emissions, Geosci. Model Dev., 5, 1471–1492, https://doi.org/10.5194/gmd-5-1471-2012, 2012. a
Hauglustaine, D. A., Granier, C., Brasseur, G. P., and Mégie, G.: The importance of atmospheric chemistry in the calculation of radiative forcing on the climate system, J. Geophys. Res.-Atmos., 99, 1173–1186, https://doi.org/10.1029/93JD02987, 1994. a, b
Jenkin, M. E., Saunders, S. M., and Pilling, M. J.: The tropospheric degradation of volatile organic compounds: a protocol for mechanism development, Atmos. Environ., 31, 81–104, https://doi.org/10.1016/S1352-2310(96)00105-7, 1997. a
Jenkin, M. E., Saunders, S. M., Wagner, V., and Pilling, M. J.: Protocol for the development of the Master Chemical Mechanism, MCM v3 (Part B): tropospheric degradation of aromatic volatile organic compounds, Atmos. Chem. Phys., 3, 181–193, https://doi.org/10.5194/acp-3-181-2003, 2003. a
Jenkin, M. E., Wyche, K. P., Evans, C. J., Carr, T., Monks, P. S., Alfarra, M. R., Barley, M. H., McFiggans, G. B., Young, J. C., and Rickard, A. R.: Development and chamber evaluation of the MCM v3.2 degradation scheme for β-caryophyllene, Atmos. Chem. Phys., 12, 5275–5308, https://doi.org/10.5194/acp-12-5275-2012, 2012. a
Jenkin, M. E., Young, J. C., and Rickard, A. R.: The MCM v3.3.1 degradation scheme for isoprene, Atmos. Chem. Phys., 15, 11433–11459, https://doi.org/10.5194/acp-15-11433-2015, 2015. a
Luecken, D., Hutzell, W., and Gipson, G.: Development and analysis of air quality modeling simulations for hazardous air pollutants, Atmos. Environ., 40, 5087–5096, https://doi.org/10.1016/j.atmosenv.2005.12.044, 2006. a
Luecken, D., Phillips, S., Sarwar, G., and Jang, C.: Effects of using the CB05 vs. SAPRC99 vs. CB4 chemical mechanism on model predictions: Ozone and gas-phase photochemical precursor concentrations, Atmos. Environ., 42, 5805–5820, https://doi.org/10.1016/j.atmosenv.2007.08.056, 2008. a, b
Luecken, D., Yarwood, G., and Hutzell, W.: Multipollutant modeling of ozone, reactive nitrogen and HAPs across the continental US with CMAQ-CB6, Atmos. Environ., 201, 62–72, https://doi.org/10.1016/j.atmosenv.2018.11.060, 2019. a, b, c, d
Luecken, D. J., Napelenok, S. L., Strum, M., Scheffe, R., and Phillips, S.: Sensitivity of Ambient Atmospheric Formaldehyde and Ozone to Precursor Species and Source Types Across the United States, Environ. Sci. Tech., 52, 4668–4675, https://doi.org/10.1021/acs.est.7b05509, 2018. a, b
Madronich, S. and Flocke, S.: Theoretical Estimation of Biologically Effective UV Radiation at the Earth's Surface, in: Solar Ultraviolet Radiation, edited by: Zerefos, C. S. and Bais, A. F., Springer Berlin Heidelberg, Berlin, Heidelberg, pp. 23–48, 1997. a
Madronich, S. and Flocke, S.: The Role of Solar Radiation in Atmospheric Chemistry, Springer Berlin Heidelberg, Berlin, Heidelberg, https://doi.org/10.1007/978-3-540-69044-3_1, pp. 1–26, 1999. a
Marvin, M. R., Wolfe, G. M., Salawitch, R. J., Canty, T. P., Roberts, S. J., Travis, K. R., Aikin, K. C., de Gouw, J. A., Graus, M., Hanisco, T. F., Holloway, J. S., Hübler, G., Kaiser, J., Keutsch, F. N., Peischl, J., Pollack, I. B., Roberts, J. M., Ryerson, T. B., Veres, P. R., and Warneke, C.: Impact of evolving isoprene mechanisms on simulated formaldehyde: An inter-comparison supported by in situ observations from SENEX, Atmos. Environ., 164, 325–336, https://doi.org/10.1016/j.atmosenv.2017.05.049, 2017. a, b, c
Pierce, T., Geron, C., Bender, L., Dennis, R., Tonnesen, G., and Guenther, A.: Influence of increased isoprene emissions on regional ozone modeling, J. Geophys. Res.-Atmos., 103, 25611–25629, https://doi.org/10.1029/98JD01804, 1998. a
Ramboll Environment and Health: User's Guide to the Comprehensive Air Quality Model with Extensions Version 7.10, Tech. rep., available at: http://www.camx.com/about/ (last access: 1 August 2021), Ramboll Environment and Health, Novato, CA, USA, 2020. a, b, c
Ruiz Hildebrandt, L. and Yarwood, G.: Interactions between Organic Aerosol and NOy: Influence on Oxidant Production, Tech. rep., University of Texas at Austin, Austin, Texas, USA, 2013. a, b, c, d, e, f
Sander, S. P., Finlayson-Pitts, B. J., Friedl, R. R., Golden, D. M., Huie, R. E., Keller-Rudek, H., Kolb, C. E., Kurylo, M. J., Molina, M. J., Moortgat, G. K., Orkin, V. L., Ravishankara, A. R., and Wine, P. W.: Chemical Kinetics and Photochemical Data for Use in Atmospheric Studies. Evaluation No. 15 (JPL Publication 06-2), Jet Propulsion Laboratory, Pasadena, CA, 2006. a
Sandu, A., Verwer, J., Loon, M. V., Carmichael, G., and Seinfeld, J.: Benchmarking stiff ODE solvers for atmospheric chemistry problems I: implicit versus explicit, Atmos. Environ., 31, 3151–3166, 1997. a, b, c, d
Saunders, S. M., Jenkin, M. E., Derwent, R. G., and Pilling, M. J.: Protocol for the development of the Master Chemical Mechanism, MCM v3 (Part A): tropospheric degradation of non-aromatic volatile organic compounds, Atmos. Chem. Phys., 3, 161–180, https://doi.org/10.5194/acp-3-161-2003, 2003. a
Saylor, R. D. and Ford, G. D.: On the comparison of numerical methods for the integration of kinetic equations in atmospheric chemistry and transport models, Atmos. Environ., 29, 2585–2593, https://doi.org/10.1016/1352-2310(95)00187-4, 1995. a, b, c, d
Seinfeld, J. and Pandis, S.: Atmospheric Chemistry and Physics: from air pollution to climate change, A Wiley-Intersciencie publications, Wiley, Hoboken, NJ, USA, 2006. a, b, c, d, e, f
Seyfioglu, R., Odabasi, M., and Cetin, E.: Wet and dry deposition of formaldehyde in Izmir, Turkey, Sci. Total Environ., 366, 809–818, https://doi.org/10.1016/j.scitotenv.2005.08.005, 2006. a
Stockwell, W. R., Saunders, E., Goliff, W. S., and Fitzgerald, R. M.: A Perspective on the Development of Gas-phase Chemical Mechanisms for Eulerian Air Quality Models, J. Air Waste Manage. Assoc., 70, 44–70, https://doi.org/10.1080/10962247.2019.1694605, 2020. a
Turányi, T.: KINAL – a program package for kinetic analysis of reaction mechanisms., Comput. Chem., 14, 253–254, 1990a. a, b, c
Turányi, T.: Sensitivity analysis of complex kinetic systems. Tools and applications, J. Math. Chem., 5, 203–248, https://doi.org/10.1007/BF01166355, 1990b. a
Whitten, G. Z., Heo, G., Kimura, Y., McDonald-Buller, E., Allen, D. T., Carter, W. P., and Yarwood, G.: A new condensed toluene mechanism for Carbon Bond: CB05-TU, Atmos. Environ., 44, 5346–5355, https://doi.org/10.1016/j.atmosenv.2009.12.029, 2010. a, b
Wolfe, G. M., Kaiser, J., Hanisco, T. F., Keutsch, F. N., de Gouw, J. A., Gilman, J. B., Graus, M., Hatch, C. D., Holloway, J., Horowitz, L. W., Lee, B. H., Lerner, B. M., Lopez-Hilifiker, F., Mao, J., Marvin, M. R., Peischl, J., Pollack, I. B., Roberts, J. M., Ryerson, T. B., Thornton, J. A., Veres, P. R., and Warneke, C.: Formaldehyde production from isoprene oxidation across NOx regimes, Atmos. Chem. Phys., 16, 2597–2610, https://doi.org/10.5194/acp-16-2597-2016, 2016. a
Yarwood, G., Rao, S., Yocke, M., and Whitten, G.: Updates to the carbon bond chemical mechanism: CB05, Tech. rep., U.S. Environmental Protection Agency, Novato, CA, USA, 2005. a, b, c
Yarwood, G., Jung, J., Whitten, G., Heo, G., J, M., and M, E.: Updates to the Carbon Bond Mechanism for Version 6 (CB6), in: 9th Annual CMAS Conference, Chapel Hill, NC, 11–13 October 2010, pp. 1–4, 2010. a, b, c, d
Yarwood, G., Heo, G., Carter, W. P. L., and Whitten, G. Z.: Final Report, Environmental Chamber Experiments to Evaluate NOx Sinks and Recycling in Atmospheric Chemical Mechanisms, Tech. rep., Texas Air Quality Research Program, The University of Texas at Austin, Riverside, CA, USA, 2012. a, b, c
Zaveri, R. A. and Peters, L. K.: A new lumped structure photochemical mechanism for large-scale applications, J. Geophys. Res.-Atmos., 104, 30387–30415, https://doi.org/10.1029/1999JD900876, 1999. a
Zhang, Q., Jiang, X., Tong, D., Davis, S. J., Zhao, H., Geng, G., Feng, T., Zheng, B., Lu, Z., Streets, D. G., Ni, R., Brauer, M., van Donkelaar, A., Martin, R. V., Huo, H., Liu, Z., Pan, D., Kan, H., Yan, Y., Lin, J., He, K., and Guan, D.: Transboundary health impacts of transported global air pollution and international trade, Nature, 543, 705–709, https://doi.org/10.1038/nature21712, 2017a. a
Zhang, R., Cohan, A., Biazar, A. P., and Cohan, D. S.: Source apportionment of biogenic contributions to ozone formation over the United States, Atmos. Environ., 164, 8–19, 2017b. a, b