the Creative Commons Attribution 4.0 License.
the Creative Commons Attribution 4.0 License.
 | 24 Aug 2021
Measurement report: Biogenic volatile organic compound emission profiles of rapeseed leaf litter and its secondary organic aerosol formation potential
Letizia Abis
Carmen Kalalian
Bastien Lunardelli
Tao Wang
Liwu Zhang
Jianmin Chen
Sébastien Perrier
Benjamin Loubet
Raluca Ciuraru
Christian George
We analysed the biogenic volatile organic compound (BVOC) emissions from rapeseed leaf litter and their potential to create secondary organic aerosols (SOAs) under three different conditions, i.e., (i) in the presence of UV light irradiation, (ii) in the presence of ozone, and (iii) with both ozone and UV light. These experiments were performed in a controlled atmospheric simulation chamber containing leaf litter samples, where BVOC and aerosol number concentrations were measured for 6 d. Our results show that BVOC emission profiles were affected by UV light irradiation which increased the summed BVOC emissions compared to the experiment with solely O3. Furthermore, the diversity of emitted VOCs from the rapeseed litter also increased in the presence of UV light irradiation. SOA formation was observed when leaf litter was exposed to both UV light and O3, indicating a potential contribution to particle formation or growth at local scales. To our knowledge, this study investigates, for the first time, the effect of UV irradiation and O3 exposure on both VOC emissions and SOA formation for leaf litter samples. A detailed discussion about the processes behind the biological production of the most important VOC is proposed.
- Article
(2084 KB) - Full-text XML
-
Supplement
(357 KB) - BibTeX
- EndNote


Nowadays, the crucial role played by volatile organic compounds (VOCs) as precursors of ozone and particles within the troposphere has been established (Hatfield and Huff Hartz, 2011). Sources of VOCs are either anthropogenic, i.e., related to human activities, or biogenic. Biogenic volatile organic compounds (BVOCs) are released from living and senescent vegetation, soils and microorganisms, or oceans (Kesselmeier and Staudt, 1999; Murphy et al., 2010). Such biogenic VOCs (BVOCs) have been estimated to contribute up to 90 % of the total VOC emissions (Guenther, 1995). Furthermore, the currently most accredited emission model for BVOC (MEGAN v2.1) estimates that 760 Tg C yr−1 is emitted into the troposphere (Sindelarova et al., 2014). Modelling studies have highlighted the impact of BVOCs on carbon monoxide (CO), hydroxyl radical (OH), and low-level ozone and thus the oxidative capacity of the troposphere (Granier et al., 2000; Pfister et al., 2008; Poisson et al., 2000). It was found that products resulting from the BVOC oxidation are significant precursors of secondary organic aerosols (SOAs) that affect the earth's radiative balance (Ziemann and Atkinson, 2012) and thus the climate and human health (De Gouw and Jimenez, 2009). In addition, between 11 % and 70 % of emitted BVOCs are converted into SOA, leading to a yearly production of 140–190 Tg C yr−1 of particles (Hallquist et al., 2009).
Due to the growing awareness about climate change and atmospheric pollution, the number of studies focusing on BVOCs has grown exponentially over the past 20 years, with a strong focus on forests and plants since they are the most important sources of BVOCs. However, little attention has been drawn to leaf litter and its contribution to SOA formation in the global BVOC emissions model, even though several studies reported a significant contribution to BVOC emissions, describing BVOCs emitted from leaf litter as potential contributors to SOA formation (Bigg, 2004; Faiola et al., 2014; Isidorov and Jdanova, 2002; Viros et al., 2020). The annual global leaf litter production has been estimated to be between 75 and 135 Pg dry matter (DM) per year, contributing to 10 % of the global annual emissions of acetone and methanol (Matthews, 1997; Warneke et al., 1999). It was found that the leaf litter's contribution to acetone and methanol emissions is due to the degradation processes driven by microorganisms or abiotic factors (i.e., temperature, radiation), processes known to release partially oxidized VOCs such as acetone and methanol (Warneke et al., 1999).
Rapeseed (Brassica napus) was chosen as model plant species in this study due to its wide geographic distribution and its importance as a crop. Rapeseed is grown to produce animal feed, edible vegetable oils, and biodiesel. Rapeseed was the third-leading source of vegetable oil in the world in 2000, after soybean and palm oil. It is the world's second-leading source of protein meal after soybean. France is the fifth largest producer worldwide of this specific crop (Fischer et al., 2014).
The development cycle of rapeseed is divided into three phases: (1) vegetative, (2) reproduction, and (3) maturation. For the vegetative phase, rapeseed is sown in August. This phase starts with an epigeous germination during the month of September. From September to December, the rapeseed stem will grow from 10 to 20 cm and produce about 20 leaves, forming a rosette. The reproduction phase starts after the winter, i.e., between February and March. It is during this time that the stem of the rapeseed goes up. Then we observe the beginning of the elongation. Flowering lasts between 4 and 6 weeks, and the maturation phase occurs when the siliques are formed (in June). In July, they are ready for harvest. It is in this period that we collected the rapeseed litter.
Rapeseed residues are often left on the field. The incorporation of crop residues into agricultural soils improves soil structure, reduces bulk density, reduces evaporation, and decreases erosion. Rapeseed in this rotation contributes to improving the organic matter content of the soil. Organic matter, which is essential to fertility, contributes to the supply of nitrogen, to the improvement of structural stability (less sensitivity to soil compaction and erosion), and to an increase in the storage capacity of water and mineral elements (i.e., improvement of the cation exchange capacity) (Tiefenbacher et al., 2021). Therefore, the litter associated with rapeseed is an important aspect of that process.
The volume of straw produced varies between 0.6 and 2.4 t of dry matter per hectare. This estimate takes into account the important losses of material that occur during mowing operations, and it corresponds to the volume of harvestable straw per hectare. Only half of the total volume produced is harvested, the rest is left in the field to return to the soil (FranceAgriMer, 2016).
The composition and amount of BVOCs emitted from leaf litter, alongside their associated reactivity, strongly depend on plant species, decomposition state, and environmental conditions such as temperature, ultraviolet (UV) light irradiation, and ozone concentration. Nevertheless, ozone concentration in rural areas has been estimated to be around 60 ppb with peaks reaching 80 ppb during the summer (Monks et al., 2015). This affects leaf litter directly through chlorosis and cellular damage (Diaz-de-Quijano et al., 2016). Also, ozone indirectly impacts biological and chemical processes such as photosynthesis, respiration, stomatal functioning (Yendrek et al., 2017), and the emissions of BVOCs (J. Yuan et al., 2017; X. Yuan et al., 2016, 2017). Another important factor affecting the degradation of leaf litter is UV light (Derendorp et al., 2011) which is responsible for increased emissions of short-length VOCs (i.e., C2–C5) especially in the presence of humid air (Derendorp et al., 2011).
This study aims to investigate the individual and combined effects of ozone and UV light irradiation on BVOC emission and the subsequent SOA formation from rapeseed litter, Brassica napus sp. Rapeseed litter was used because it is the third most cultivated species in France after wheat and maize (French National Statistics, 2019). We investigated the VOC emission profiles of the senescent rapeseed leaves for 6 d after they were collected. The experiments were carried out in a multiphase simulation chamber where leaf litter was exposed to (i) UV light (UV), (ii) ozone (O3), and (iii) a combination of both (UV_O3).
2.1 Samples collection
The leaves of rapeseed (Brassica napus sp.) used during the experiments were collected on 3 June 2019 in the AgroParisTech field, Thiverval-Grignon (48∘85′ N, 1∘95′ E). The Thiverval-Grignon site is located about 30 km west of Paris, in the north of France. The soil of this site is classified as Luvisol. It consists of 25 % clay, 70 % silt, and 5 % sand. The site is 15 ha, and the rapeseed leaves were collected using the random sampling method. To avoid inhomogeneous samples in terms of the decomposition stage, all of the leaves were cut directly from the stems but making sure that they were falling or about to fall. Overall, 3 kg of leaves was collected from different plants in the field (field area around 1 km2). The rapeseed litter used for the measurements was made of leaves at the beginning of senescence. The leaf samples were stored at −20 ∘C. The sampled litter was reused for all the measurements, throughout the experimentation, defrosting just the fraction of sample needed for the experiment. At the beginning of each experiment, the leaves had visually the same aspect and identical mass to volume ratio (as an indirect metric of their decomposition). In addition, the VOCs were monitored during the stabilization of the experimental conditions and showed identical patterns.
2.2 Samples preparation
The rapeseed leaves were acclimatized for about 2 h at 20 ∘C before being inserted into the multiphase simulation chamber. In this way, leaves reached room temperature (20 ∘C), which corresponds to the average temperature in the North of France during summertime. This was necessary for reproduction of the real-time conditions under which the rapeseed leaves start their decomposition. Once acclimatized, leaves were weighted and spread out to cover the whole surface of a FEP (fluorinated ethylene propylene) film (with a surface of 0.64 m2) (Fig. 1a). After 6 d of measurement, the surface covered by the rapeseed litter was estimated to be 0.45 m2 (Fig. 1b) using Adobe Photoshop software (V 21.1.1). Photoshop allowed for the manual selection of the pixels containing the litter; the pixels were converted into surface area (m2) using the following formula:
where Alitter is the area covered by the rapeseed litter 6 d after the beginning of the experiment, Pxlitter is the number of pixels in the litter area, and Px× m2 is the number of pixels per m2. The initial weight of rapeseed in the chamber ranged from 75 to 80 g. After 6 d of measurement, the weight decreased by 29 %–32 %. After being spread on the FEP, the samples were introduced into the multiphase simulation chamber.
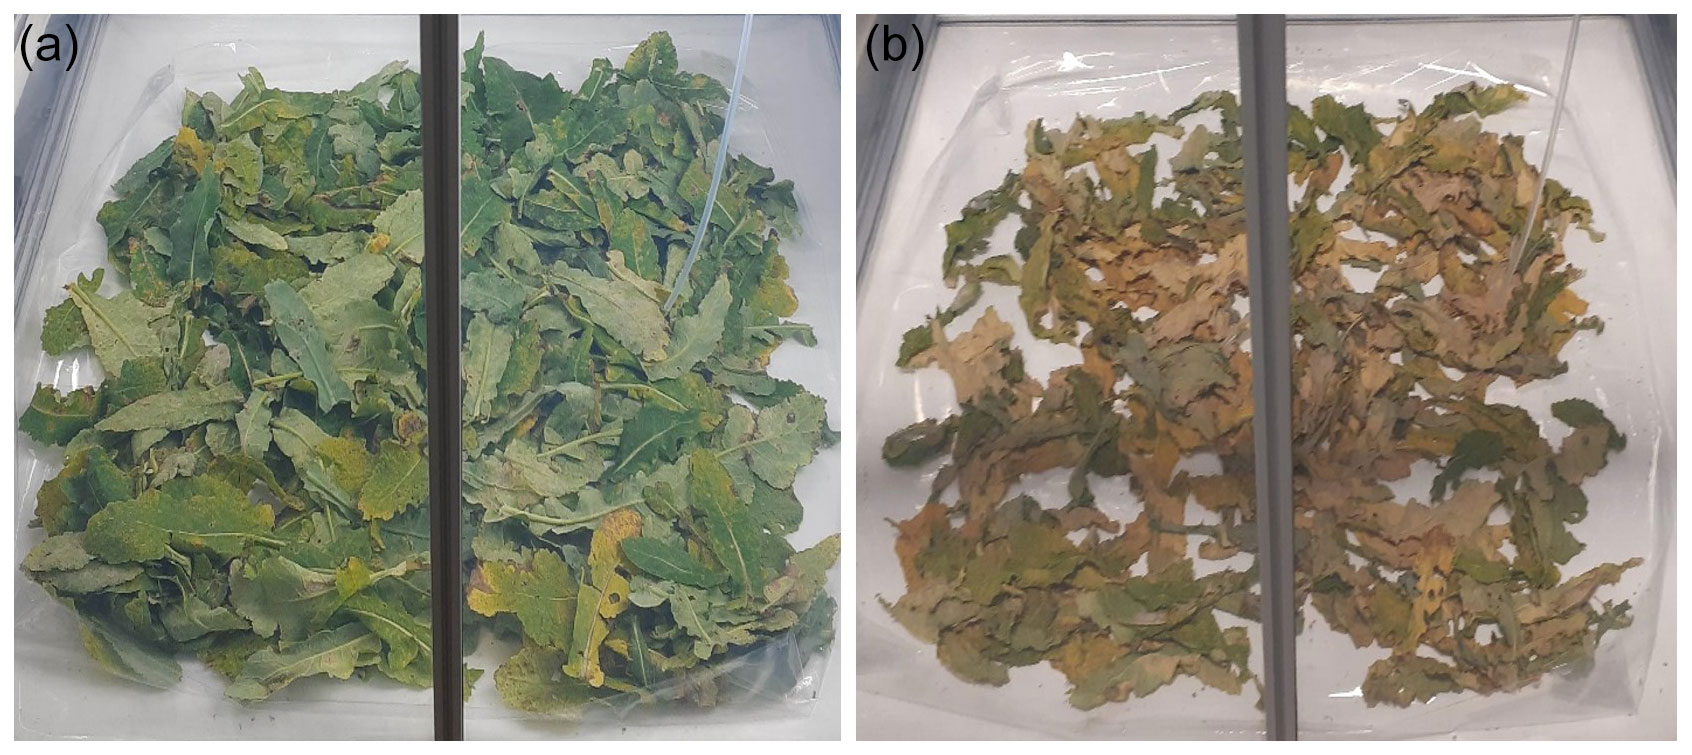
Figure 1Example of the rapeseed litter condition (a) during the first day of the VOC and particle measurements and (b) after 6 d of VOC and particle measurements.
2.3 Multiphase simulation chamber
The multiphase atmospheric simulation chamber is schematized in Fig. 2. The atmospheric chamber has a rectangular shape with 1 m length × 1 m width ×2 m height (total volume 2 m3). The chamber is made of FEP film. The chamber was continuously filled with 6 L min−1 of purified air, where 2 L min−1 of this total flow was directed inside a glass bubbler to maintain a constant relative humidity inside the chamber (RH = 50 ± 5 %) (Fig. 2). The overall air renewal time in the chamber was around 5 h 30 min, which allows for chemical reactions to occur. The chamber was equipped with 12 UV lamps (OSRAM lamps, Eversun L80W/79-R), with six on the left wall and six on the right wall of the chamber. The absolute irradiance within the chamber has been already reported by Alpert et al. (2017). Light produced from the UV fluorescent tubes had wavelengths between 300 to 400 nm. Alpert et al. (2017) also reported that measurements for λ < 300 nm yielded detection limit values on the order of 10−3 W m−2 nm−1; thus, total light output below 300 nm is negligible. The full spectrum is shown in Fig. S1 for completeness. In comparison, the solar spectrum at the earth's surface is shown. It was derived using the online quick Tropospheric Ultraviolet and Visible (TUV) calculator for a solar zenith angle of 0∘ (available at https://gml.noaa.gov/grad/solcalc/azel.html, last access: 20 September 2020).

Figure 2Scheme of the multiphase reaction chamber used for the study of the photoreactivity of the VOCs emitted from senescence rapeseed. The PTR-TOF-MS has been used for the VOCs detection; the ultrafine condensation particle counter (UCPC) and the SMPS have been used for the detection of the particle formation and measurement of the particle sizes respectively; and the O3 analyser detected the ozone inside the chamber, where P (pressure), T (temperature), and RH (relative humidity) have been constantly monitored during the entire experiment.
Temperature, relative humidity, and differential pressure (to ensure a slight overpressure in the chamber compared to laboratory air) were monitored using a combined sensor for temperature and relative humidity (Vaisala HUMICAP humidity and temperature probe HMP110; Vaisala differential pressure transmitter PDT101). Data about the monitored temperature are reported in Fig. S3. VOCs and particle formation were monitored using a high-resolution proton transfer reaction mass spectrometer (PTR-TOF-MS 8000, Ionicon Analytik) and a scanning mobility particle sizer spectrometer (SMPS – model 3080, TSI), respectively.
2.4 Experimental setup
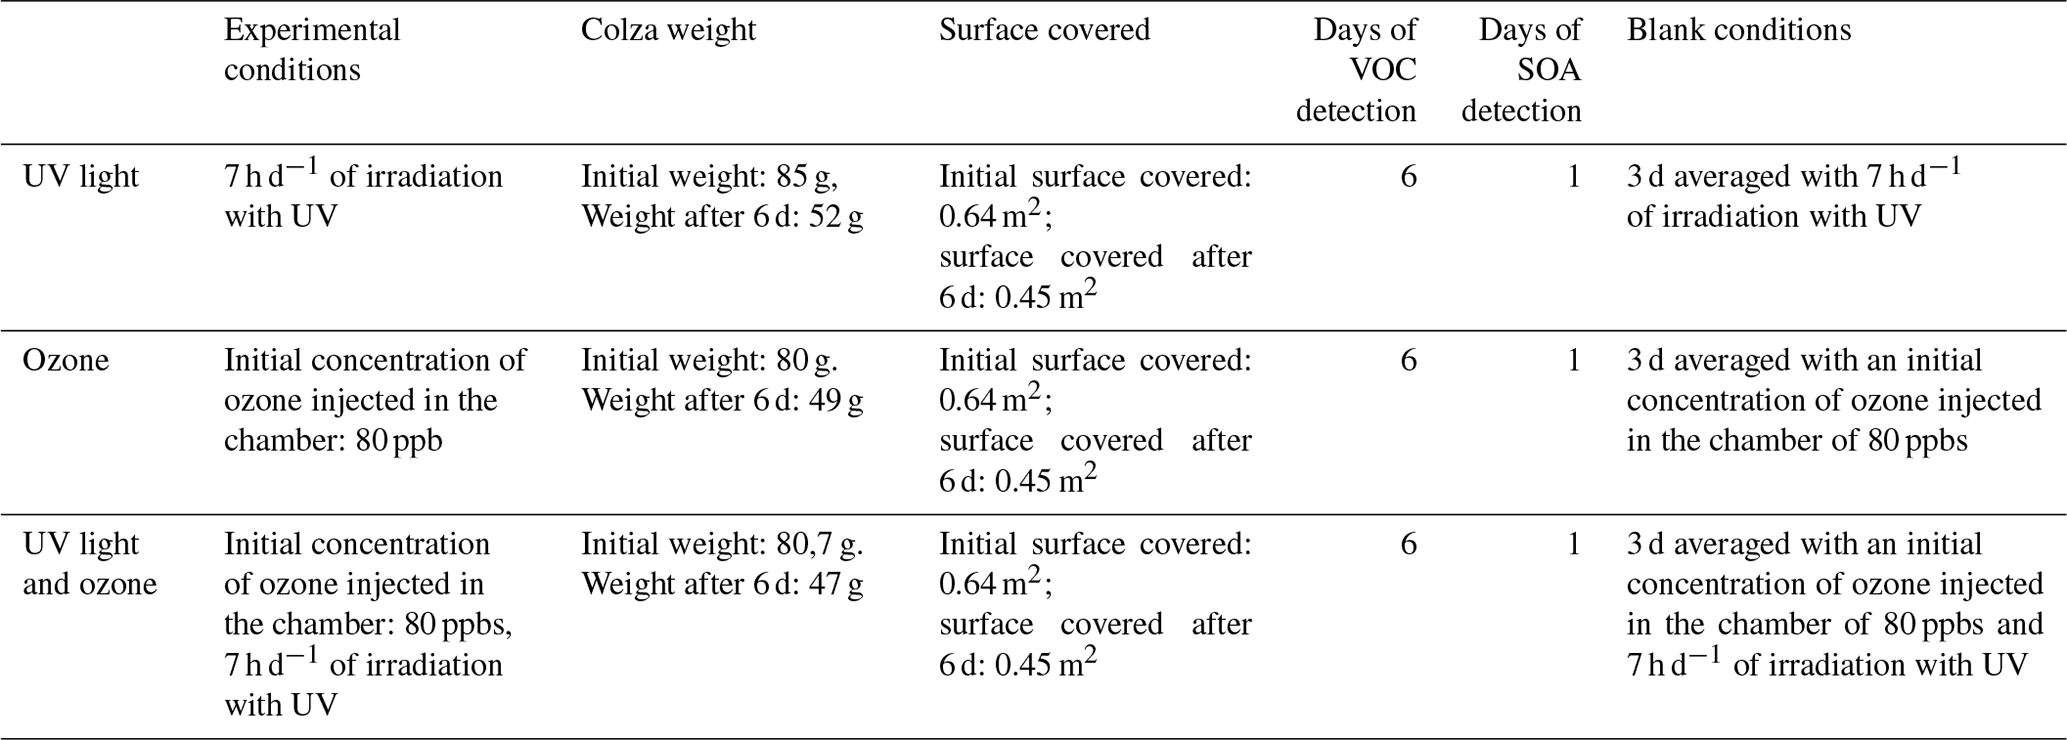
The rapeseed litter was studied within a multiphase simulation chamber. The rapeseed litter was tested under three different conditions to distinguish the potential factors influencing the VOC emissions and the particle formation. The chosen conditions were under (i) UV light irradiation, (ii) ozone, and (iii) ozone and UV light irradiation at the same time. The UV light irradiation was turned off and on following the night–day cycle; the UV light was turned on for a total of 7 h d−1. The ozone was injected into the chamber once a day at the same time that the UV light was turned on. The initial concentration of 80 ppb was progressively consumed during the day. Every sample was analysed during 6 d for each of the previously mentioned conditions. Table 1 summarizes the different experimental runs performed in this study. For each of the selected conditions, blank experiments were made for 3 d under the same conditions and subtracted from the following experiments.
2.5 Particle measurements
Particles were detected by means of an SMPS consisting of a differential mobility analyser (DMA, model 3085, TSI) and an ultrafine condensation particle counter (UCPC model 3776 high flow, TSI, d50>2.5 nm). During the experiments, the scanning particle size ranged from 2.5 to 79.1 nm, and both the sheath and sample flow rates were settled at 3 and 0.3 L min−1, respectively. The SMPS inlet was positioned at 180 cm above the rapeseed surface to observe the particle formation and growth. The density of the measured particles was assumed to be 1 g cm−3. The particle loss due to the impact of the chamber walls was calculated based on data from previous experiments performed on the same multiphase simulation chamber (Alpert et al., 2017; Bernard et al., 2016). The estimations of the particle loss used for the correction of the SMPS data are shown in Supplement Fig. S2.
2.6 VOCs measurement
VOCs were detected using the PTR-TOF-MS technique, which has been already described in detail by Müller et al. (2014). Ionization of the VOCs was carried out using the H3O+ mode. The pressure and voltage of the drift tube were respectively set to 2.2 mbar and 500 V with a temperature of 80 ∘C. Consequently, the ratio was about 123 Td (Townsend, where 1 Td = 10−17 V cm2). These parameters were maintained constant during the whole experiment to avoid different ionization conditions of the VOCs within the drift tube. The sample inlet of the PTR-TOF-MS was constantly heated at 60 ∘C to avoid product loss by absorption in the inlet tube. The instrument sampled every 30 s with a flow rate of 100 mL min−1, and the raw data were recorded using TofDaq software (Tofwerk AG, Switzerland). The PTR-TOF-MS has a mass resolution of 4500 m Δm. A calibration gas standard (TO-14A Aromatic Mix, Restek Corporation, Bellefonte, USA) containing 14 VOCs at a concentration of 100±10 ppb in nitrogen was used to calibrate and regularly assess the instrument performance, including mass resolution, mass accuracy, sensitivity, and relative mass-dependent transmission efficiency. The sensitivity of these compounds ranged between 15 and 70 cps ppb−1, depending on the actual mass. However, since it was not possible to calculate the exact sensitivity for all the detected compounds, we assumed that the proton reaction constant was always equal to cm3 s−1 (Cappellin et al., 2011; Kalalian et al., 2020); thus, the average sensitivity of 30 cps ppb−1 was applied for all the compounds. Moreover, the calibration of the spectra was performed via both an oxygen isotope of the ion source HO+ (21.022 ) and an ionized acetone molecule C3H7O+ (59.0449 ) as described by Cappellin et al. (2011). Those compounds were chosen for the calibration because their identification was straightforward for all the kinds of samples used in this study.
After calibrating the spectra, a peak table was created including the largest number of detected compounds. The threshold for the automatic research feature of the peak was set to 0.1 cps. Even if the peaks were automatically identified, a manual readjustment of every peak was performed to reduce the bias of the automatic peak research. The range of the detected masses was between 31 and 164 . Masses deriving from the water cluster, such as 37.03, 38.03, 39.03, and 55.03 , were not taken into account during the analysis of the dataset.
Furthermore, the mixing ratio (ppb) was calculated using the PTR viewer software (V3.2.8, Ionicon, Analytik GmbH) which used the equation described in Cappellin et al. (2011), and the VOC emissions fluxes (EVOC, in µg m−2 h−1) were calculated as follows:
where Fair is the net airflow (Fair=240 L h−1), [VOC]litter is the concentration (ppb) of the VOC emitted in the chamber with the samples, and [VOC]blank is the concentration (ppb) of the VOC measured in the empty chamber. MVOC is the molecular mass of the corresponding VOC (g mol−1), is the air molar volume at standard temperature and pressure (24.79 L mol−1 at 25 ∘C and 1 atm), Slitter-S is the exposed surface of litter to light when the experiment started, and Slitter-E is the exposed surface of litter to light when the experiment ended.
2.6.1 Peak identification method
The spectra were analysed using the Spectra Analyser tool of the PTR viewer software (version 3.2.8, Ionicon). This tool allowed identification of the compounds corresponding to each peak in the spectra by searching for the possible combinations of elements leading to the closest molecular weight. This identification of the VOC was also double-checked with literature reviews. Even if this method accounted for the most precise identification of the VOCs, it does not provide a certain identification of the compounds since (1) it is not possible to distinguish between two ion masses that are closer than the PTR-TOF-MS mass resolution, and (2) the PTR-TOF-MS does not distinguish between isomers (VOCs having the same molecular mass).
2.6.2 Data analysis
The database was filled with 217 variables corresponding to the number of detected masses for the three different conditions UV, O3, and UV_O3 (as mentioned previously). The statistical analysis of the entire dataset was performed using the R software (Version 1.2.5019 – © 2009–2019 RStudio). At first, we selected the variables that were normally distributed by the Shapiro–Wilk test (W>0.9). Secondly, we tested the homogeneity of the variance by the Levene-test to perform the analysis of variance (ANOVA) test followed by the Tukey post hoc test. Furthermore, we tested the differences between the conditions using the principal component analysis (PCA – package FactormineR). The PCA allowed a graphical representation of the whole dataset differentiating the VOCs emission profiles for the different tested conditions without bias. A table with the 30 most emitted compounds and their relative abundance at the three different conditions is presented in Table 1. Finally, the calculation of the Shannon index was performed. The Shannon index is a quantitative measure reflecting how many different VOCs were emitted from each sample. It was calculated with the diversity function of the vegan package (version 2.4-3) in R software (version 3.2.3). The diversity index was calculated as , where the sum is over all VOCs recorded in the mass table.
3.1 Ozone and UV light irradiation effect on the average VOC concentrations
VOC emissions were measured for 6 d for each condition. The summed VOC emissions from the different conditions showed a statistical difference for every day of measurement. Under UV irradiation (the first condition), the summed VOC emissions kept increasing until the fifth day of measurement, while during the last day it statistically decreased (Fig. 3a). Whereas, for the conditions O3 and UV_O3 (second and third conditions), the summed VOC emissions increased the second day and then slowly decreased from the third to the sixth day of measurement (Fig. 3b and c).
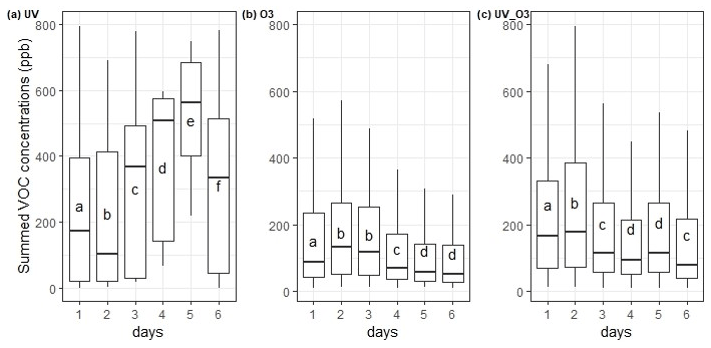
Figure 3Summed VOC concentrations for each day (24 h period) incubation condition (a) UV, (b) O3, and (c) UV_O3. Letters indicate the statistical difference obtained by the Tukey test.
Furthermore, the ANOVA test confirmed a difference between the averages of the summed VOC emissions per day. These results highlight a statistical increase of the summed VOC emissions under UV irradiation (first condition) and a statistical decrease of the summed VOC emissions over time for the O3 and the UV_O3 conditions. The summed VOC emissions were higher for the UV condition than for the UV_O3 condition. The condition with the lowest VOC emission rate was with ozone.
The VOC emission profiles of the different conditions are compared in Fig. 4. The PCA shows that the VOC profiles emitted during the UV condition were separated from the VOC profiles emitted from the UV_O3 and O3 conditions. Meanwhile the UV_O3 and the O3 conditions had very similar profiles since their ellipses are superposed (Fig. 4). The major differences in the emission profiles were led by the different concentrations of 10 compounds at the following values: 45.03, 45.99, 46.03, 47.02, 49.99, 59.049, 60.05, 73.03, 108.95, and 125.95. Those compounds are also among the 30 most emitted compounds through all three conditions (Table 1). The identification of the 30 most emitted compounds for the three different conditions is listed in Supplement Table S1.

Figure 4VOC profiles differences between UV light, UV_O3, and O3 conditions; each point represent 1 d measurement. The percentage of the variance explained by the two first components is shown on each axis (Dim1 and Dim2).
The 30 most emitted compounds represented 90 % of the summed VOC emissions for each condition. The list of the most emitted compounds between the O3 condition and UV_O3 conditions was similar, especially in terms of the types of emitted compounds. The three most emitted compounds for these two conditions were methanol (CH3OH+, 33.03 ), acetaldehyde (C2H4OH+, 45.03 ), and butyric acid (C4H8O2H+, 89.05 ), while for the UV condition the three most emitted VOCs were acetic acid (61.03 ), acetone (59.049 ), and methanol (33.03 ). The average contribution of the VOCs over the 6 measurement days showed a large difference for each condition. For instance, methanol contributed to 9 %, 32 %, and 50 %, for UV, O3, and UV_O3, respectively.
3.2 Evolution and diversity of the VOC emissions per day
For the UV light experiments, small changes were observed. For example, the average contribution of acetic acid ( 61.03) increased between 10 %–15 % during days 3 to 5 compared to days 1, 2, and 6, while that of methanol (33.03 ) increased by 5 % during days 2 and 3. However, the other most emitted VOCs contribution was constant during that time (Fig. 5a). For the O3 condition, the most important change in the average contribution is represented by the mass 33.03 , which increased by 7 % between the fourth and the sixth day (Fig. 5b). It is also worth mentioning that masses 42.03 and 49.99 contributed to less than 0.01 % of the total VOC emissions during the first and second day of measurements, while after 3 d their contribution increased by an 80-fold and 200-fold change, reaching 0.8 % and 2 % of the VOC relative abundance, respectively. The average contribution of the mass 89.06 decreased over time from 5 % during the first day to 0.5 % during the sixth day of measurements. Similar behaviour was reported for the mass 73.06 , where its average contribution increased to 8 % during the second and third measurement day and then decreased to 0.5 % of the average contribution during the sixth day. Analysing the UV_O3 condition, we noticed that the variation in the VOC contribution per day is higher than for the other conditions. In addition, the results in Fig. 5c reported that the mass 71.05 was strongly emitted during the sixth day of measurement (30 %), whereas this VOC emission did not reach 0.01 % of the contribution in the previous days. The average contribution of the mass 33.03 decreased over time, passing from 70 % on the first and second day to 30 % on the sixth day of measurements.
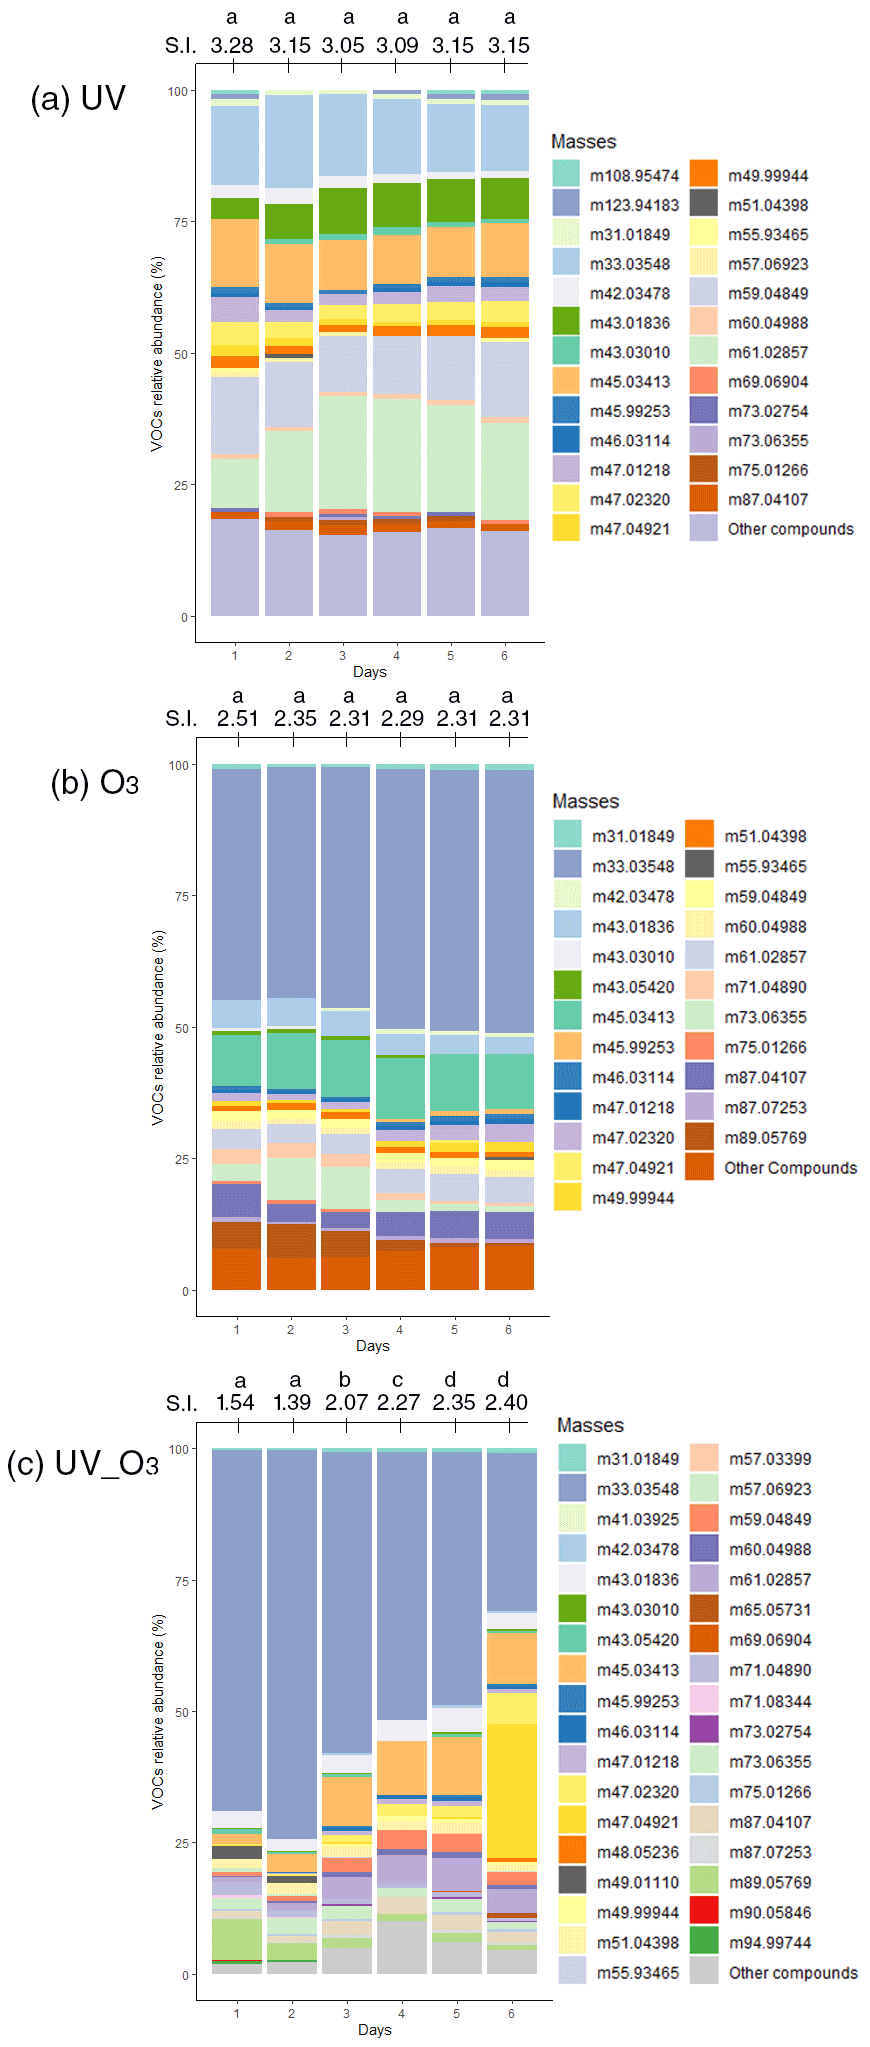
Figure 5VOC relative abundance for rapeseed litter samples under (a) UV light (b) O3, and (c) UV_O3 conditions. S.I. is the Shannon index representing the diversity of the VOC (for each day). Letters indicate significant differences of the S.I. according to the Tukey test with p value < 0.05.
Moreover, the Shannon index, representing the diversity of emitted VOC, was calculated for each day of measurements to highlight an increase or a decrease of the VOC diversity with time. The VOC Shannon index showed that there were no statistical differences in terms of VOC diversity that were observed for the UV light condition (S.I. 3.05–3.28) and O3 condition (p value > 0.05). Concurrently, the UV_O3 condition results showed a statistically significant increase of the VOC diversity with time (from 1.54 to 2.4). The Shannon index of the VOC also showed a significantly larger Shannon index for the UV condition compared to the UV_O3 condition (3.15 compared to 2). An intermediate value of 2.35 was obtained for the O3 condition.
3.3 Ozone and UV light irradiation effect on particle formation
Concurrently with the detection of VOC emissions, we also investigated particle formation for the three different conditions. Under UV irradiation, nucleation started 1 h after switching on the UV light (Fig. 6a). The initial nucleation produced a dense number of particles between 5×10⁴ and 8×10⁴ particles cm−3. Then, the number of particles decreased, while their diameter increased from 2 to 40 nm. Likewise, under the ozone condition (Fig. 6b), a nucleation event also started 1 h after the injection of 80 ppb of ozone. However, compared to the UV light irradiation experiment, the ozone injection led to a lower number of particles formed (2.5×10⁴ particles cm−3) with a smaller diameter (< 17 nm). Nevertheless, when the UV light irradiation was combined with ozone injection (third condition), the nucleation was stronger than the first two cases, reaching a maximum of 3.5×10⁵ particles cm−3 for particle diameters between 2 and 12 nm (Fig. 6c). Ozone depletion was also faster than in the case where only O3 was used (i.e., condition two).
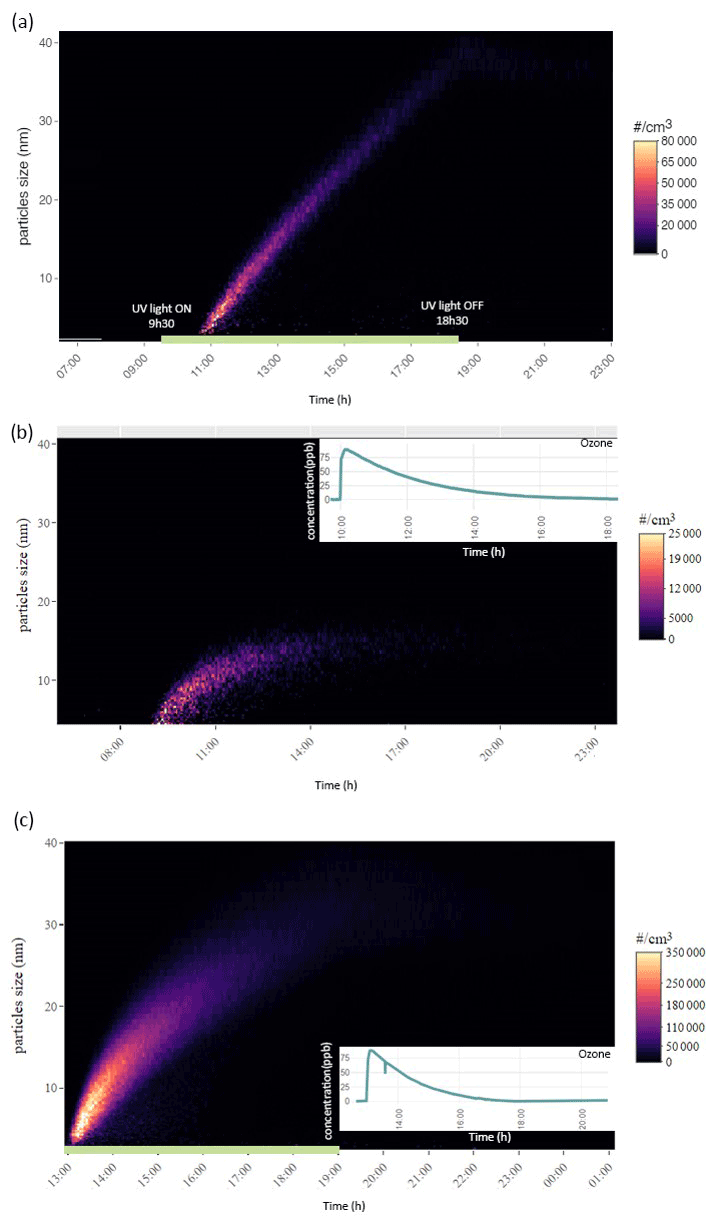
Figure 6Temporal evolution of particle number and size distribution, ordinate represents the electrical mobility diameter (nm) and the colour scale the particle number concentration. Particle formation for the first day of measurement under (a) UV light irradiation, (b) ozone injection and (c) UV light irradiation and ozone injection combined. The green horizontal line represents the timeline where the UV light were switched on for (a) the UV light have been turned on at 09:30 LST and turned off at 18:30 LST, for (c) the UV light have been turned on at 12:30 LST and turned off at 19:00 LST. Panels (b) and (c) also display the ozone concentration timeline during the particle formation.
Furthermore, in Fig. 7 the group of eight VOCs was positively correlated with temperature for the UV_O3 condition. The positive correlation means that VOC emissions increased with the temperature. Those compounds have a Spearman coefficient higher than −0.80. For the other VOC not displayed in Fig. 7, correlations lower than 0.8 were found.
4.1 UV light and ozone affect the diversity of the VOC emission profiles
For the O3 and UV_O3 experiments, the VOC diversity decreased while the methanol contribution increased. Potard et al. (2017) observed similar behaviours in their experiment, which consisted of measuring VOC emissions from soils receiving different types of amendment: the highest methanol average contribution corresponded to the lowest VOC diversity. Moreover, differentiated VOC profiles have been highlighted in the PCA (Fig. 4) between the UV light experiment and the O3 and UV_O3 experiments. Several mechanisms are regulating the VOC emissions and thus affecting the VOC diversity. These mechanisms are discussed in detail in the following paragraphs.
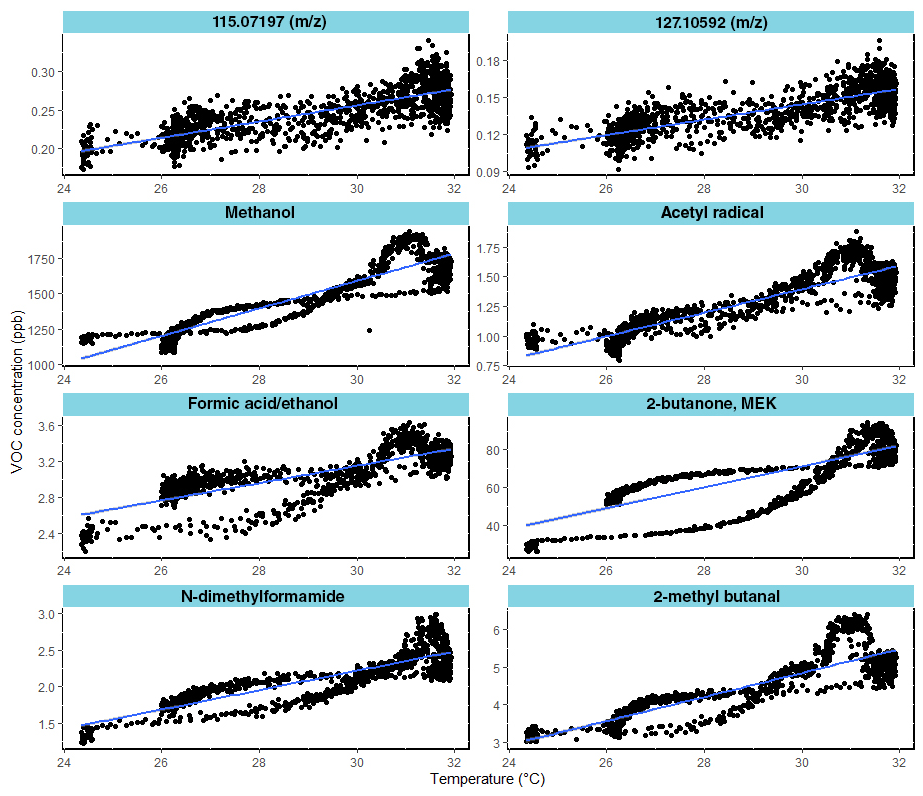
Figure 7Correlation between VOC mixing ratios and temperature under the UV_O3 condition. The eight most correlated VOC are shown (Pearson correlation coefficients >0.8).
4.2 Effect of ozone and UV light irradiation on the most emitted compounds
Acetic acid (C2H4O2, 61.03 ) and formic acid (CH2O2 47.02 ). Organic acids such as acetic and formic acid are mostly emitted from living plants (Kesselmeier and Staudt, 1999) and from the foliage of trees and crops with fluxes of 35 µg m−2 h−1 (Paulot et al., 2011). Viros et al. (2021) also detected acetic and formic acid from senescent litter with a flux of 0.05 and 0.98 µg m−2 h−1, respectively. In this study, the emission rates of the two organic acids ranged from 0.76 to 64.28 µg m−2 h−1 for acetic acid and from 0.23 to 9.12 µg m−2 h−1 for formic acid. Mozaffar et al. (2018) described that the acetic acid emissions were affected by temperature, as they recorded lower emissions in the early morning than during the late afternoon. This could explain the higher emissions of acetic acid observed in our study where the temperature reached 30 ∘C, which is higher than the conditions encountered by Viros et al. (2021), i.e., 22 ∘C. Mozaffar et al. (2018), while analysing BVOCs from senescent maize leaf litter, reported an acetic acid contribution to the total BVOC emission of up to 26 %. Similar results were obtained in our study where the contribution of the acetic acid reached 20 % of the total VOC emissions under UV light conditions.
Methanol (CH4OH+, 33.03 ). Methanol was the most emitted compound in O3 and UV_O3 conditions. Methanol emission from plants is ubiquitous (Bracho-Nunez et al., 2011; Gonzaga Gomez et al., 2019; Harley et al., 2007; Wiß et al., 2017). Moreover, methanol is the most emitted VOC from crops and other plants such as Cistus albidus, Coronilla valentina, and Prunus persica (Harley et al., 2007) and it often contributes to more than half of the overall VOC emissions. Hence, in our study, the average methanol contribution to the total VOCs emission is between 8.9 % (under UV) and 50 % (under UV and O3). Gonzaga Gomez et al. (2019) measured VOC emissions from rapeseed using dynamic chambers and reported that methanol contributed from 56 % to 77 % of the summed VOC emissions. These values are higher than in the current study. The reason behind this difference could be that Gonzaga Gomez et al. (2019) measurements were performed over the whole growing plant, while in our experiment we only analysed the emission from the leaf litter. Furthermore, the emissions of methanol from leaves depend on the phenological stage of the plant (Wiß et al., 2017), which could be another factor differentiating this study from that of Gonzaga Gomez et al. (2019). In fact, in this study, we measured mature leaves in the last phenological state, while Gonzaga Gomez et al. (2019) analysed leaving plants in the flowering and grain filling stages. Mature leaves are known to emit less methanol than young ones (Harley et al., 2007). Methanol is produced via the demethylation of the pectin by pectin methylesterase (PME) activity. This process occurs during cell wall growth, which is an intense process happening during the early stage of leaf expansion (Fall and Benson, 1996). Comparing the results obtained for the UV_O3 condition with that of Harley et al. (2007), where their experimental conditions were the closest to those used here, we found that the methanol emissions were in the same range. The emission flux of methanol under the UV_O3 condition in the current study is 0.22 ± 0.03 µg g−1 h−1, while Harley et al., 2007) reported fluxes ranging from 0.2 to 2.7 µg g−1 h−1 for mature leaves. Moreover, under the UV condition, our results show a higher emission rate of methanol, which is in line with previous studies that demonstrated how the UV light increased the methanol emissions from leaves (Derendorp et al., 2011; Harley et al., 2007). Greenberg et al. (2012) detected a methanol flux of 1.3 µg m−2 h−1 from litter corresponding to 0.4 % of the total emission above the canopy, estimated to be 300 µg m−2 h−1. In this study, the methanol flux from leaf litter ranged from 4.6 to 28.4 µg m−2 h−1 depending on the experimental conditions. Hence, our results suggest that the contribution to the total above-canopy methanol emissions of the rapeseed litter could range from 2 % to 10 %.
Acetaldehyde (C2H4OH+, 45.03 ). Acetaldehyde was the second most emitted compound for the O3 condition and the third and the fourth most emitted for the UV_O3 and UV experiments, respectively. In general, the mechanisms leading to acetaldehyde emissions are still uncertain. The most accredited hypothesis is that these emissions are correlated with different types of stress such as ozone exposure and leaf damage (chlorosis) caused by the sunlight (Seco et al., 2007). In this study, leaves were under high ozone concentration (60–80 ppb) and intense UV irradiation, which could have accelerated the senescence period of the rapeseed leaves inside the chamber. As a result of these stressing conditions, we obtained larger acetaldehyde emissions than in previous studies. For instance, Greenberg et al. (2012) reported a VOC flux for leaf litter under the canopy of 0.3 µg m−2 h−1, corresponding to 0.2 % of the total above canopy acetaldehyde emissions, while in this study the emission flux ranged from 1.97 ± 0.01 µg m−2 h−1 for the UV_O3 condition to 26.7 ± 0.2 µg m−2 h−1 for the UV condition. The total above-canopy acetaldehyde emissions reported by Greenberg et al. (2012) were 200 µg m−2 h−1. As for methanol, our study suggests a higher contribution (ranging from 2 % to 13 %) to the total above canopy acetaldehyde emissions from leaf litter.
However, Hörtnagl et al. (2014) reported a burst of 1900 µg m−2 h−1 after a meadow cutting. Nonetheless, another pathway for the production of acetaldehyde is ethanol oxidation at the leaf level, forming acetaldehyde (Niinemets et al., 2014; Seco et al., 2007). This process only occurs in anaerobic conditions since it is the consequence of the ethanolic fermentation pathway. Hence, acetaldehyde can be formed in leaf tissues, but this pathway cannot be the main reason for the acetaldehyde emissions detected in this study, because the leaf litter was not in an anoxic environment. The magnitude of the acetaldehyde emission rate detected is similar to the one detected by Bachy et al. (2016) from soil hosting C4 crops (7 ± 9 µg m h−1). Therefore, we underline the possibility that rapeseed leaf litter might contribute to tropospheric acetaldehyde emissions at the same level as soil and plants under environmental stress conditions.
Acetoin (C4H8O2H+, 89.06 ). Acetoin was the second and third most emitted compound for the conditions UV_O3 and O3 respectively with an average contribution to the summed VOC emissions between 9 % and 11 %. This compound has already been reported as one of the most emitted compounds from bacteria dwelling in rapeseed samples (Wagner et al., 2018). These bacteria have been identified as Enterobacter, Klebsiella, Serratia, Staphylococcus, and Streptomyces (Schulz and Dickschat, 2007). The pyruvate metabolic pathway of the microorganisms just listed allows for the production of the acetoin molecule by the decarboxylation of acetolactate (Schulz and Dickschat, 2007). The large production of this compound can be attributed to the presence of bacteria colonizing the leaves' surfaces and also to the favourable conditions for bacteria growth, such as the optimal temperature (T=25 ∘C) (Membre et al., 2005) and humid atmosphere (RH = 50 %) (Mceldowney and Fletcher, 2008) in our experiments.
Acetone (C3H6OH+, 59.049 ). This compound was largely emitted from litter under UV irradiation. The average contribution of acetone was 13 % under UV light, 1.64 % when influenced by both UV and ozone, and 2 % when the litter was exposed to ozone only. Acetone has been reported to be one of the most emitted compounds by plants and litter (Gonzaga Gomez et al., 2019; Greenberg et al., 2012). Greenberg et al. (2012) reported an average flux of 0.3 µg m−2 h−1 between 11:00 and 17:00. In this study, the emissions of acetone were 10 times higher under UV irradiation. Based on Greenberg et al. (2012), the current estimates of litter contribution to the above canopy acetone emissions is 0.1 %. However, the flux reported in Table 2 suggest that the litter contribution to acetone emission, in the absence of ozone, could be as large as 6 %.
Table 2The average of 30 most emitted compound during the 6 d of measurement for the three different conditions: UV light irradiation, ozone, and UV light irradiation and ozone at the same time. The flux was calculated using the averaged surface of the leaf litter between the initial covered surface (0.64 m2) and the final covered surface (0.45 m2). Within the columns , the compounds highlighted as the most differentiating between the VOC profiles by the PCA are in bold. A tentative identification of the compound here listed is reported in Supplement Table S1.
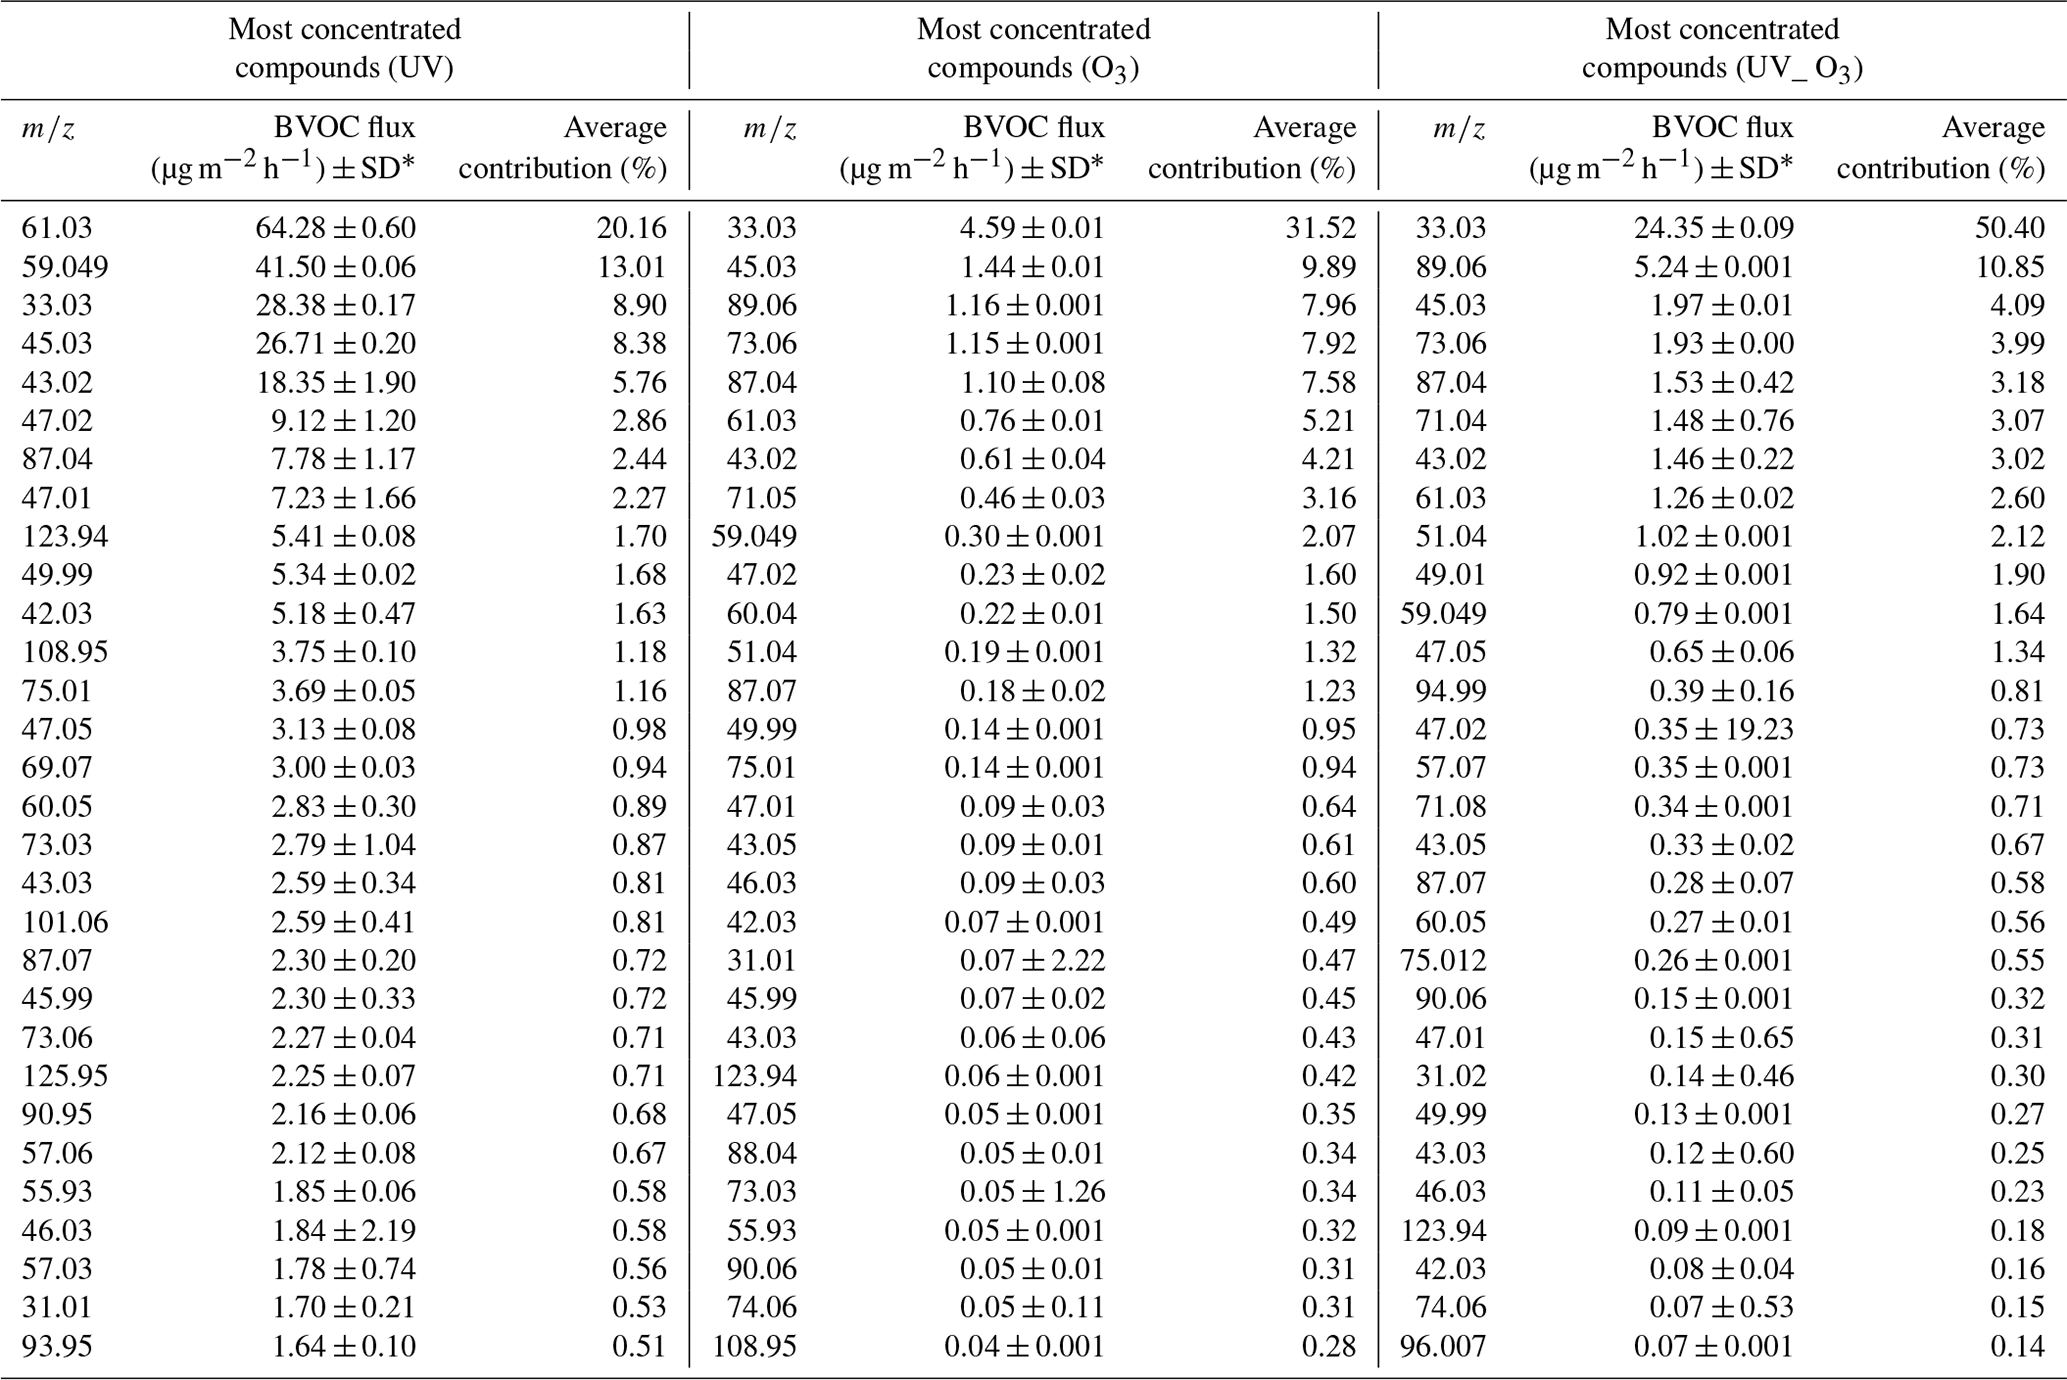
* Conversion to µg g h−1 can be obtained by substituting the averaged surface with the grams of dry matter (45 g).
In the study of Gonzaga Gomez et al. (2019), where the VOC detection has been performed at a different phenological stage of the rapeseed plant, acetone was detected among the most emitted VOCs from leaves and was correlated with sunlight, because the highest emission peak of acetone occurred at midday. These findings are in line with the higher emissions of acetone in the UV light experiment but not with the UV_O3 experiment. Cojocariu et al. (2005) found that under stress conditions such as high O3 concentration, acetone concentration increased in Fagus sylvatica. This is in contrast with the results of this study where the O3 concentration seems to reduce the acetone emissions. The biogenic nature of the source of acetone cannot be confirmed since, as reported by Das et al. (2003), acetone emissions could be the result of photochemical reactions of other VOCs. Decaying and senescing plants may be another direct source of acetone (Warneke et al., 1999; Jacob et al., 2002; Karl et al., 2003).
Other emitted compound
Isoprene (C5H8H+, 69.07 ). In this study, isoprene was the 30th most emitted compound only in the experiment without O3. Its average contribution in the UV light experiment was 1 % with a flux rate of 3.00 ± 0.03 µg m−2 h−1 or 0.02 µg g−1 h−1, which is almost 20 times lower than the emissions reported by Morrison et al. (2016), where the maximum detected flux of isoprene from rapeseed was 0.35 µg g−1 h−1. This difference is probably due to the different samples. Indeed, Morrison et al. (2016) investigated branches, while here only the emissions from senescent leaves were considered. However, the flux rate of isoprene reported by this study is in line with those reported by Gonzaga Gomez et al. (2019), i.e., 0.035 µg g−1 h−1. Isoprene can also be emitted from microorganisms such as bacteria and fungi. Isoprene is an intermediate product of the mevalonate pathway which leads to the production of essential organic compounds within the microorganism's cells (Hess et al., 2013). Isoprene is therefore a metabolite directly related to the presence of microorganisms in soil and plants (Hess et al., 2013).
Table 3Comparison of the SOA formation from leaves litter samples reported in this study and the literature.

4.3 Temperature effect on the BVOC emissions
Higher temperatures increase chemical reaction rates, cellular diffusion rates, and the vapour pressure of the VOCs. As a consequence, BVOC emission rates are dependent on temperature. In this study, we identified eight VOCs emitted from rapeseed litter which were highly correlated with temperature. Among the most correlated ones, we identified methanol and methyl ethyl ketone (MEK), in agreement with previous reports investigating such temperature dependence from rapeseed plants (Gonzaga Gomez et al., 2019). Harley et al. (2007) detected methanol emissions from six different plant species. Their results reported a correlation between its emission and the temperature of the leaves and stomatal conductance. The mechanisms behind this behaviour have been explained by Niinemets and Reichstein (2003). Methanol is produced within the cell walls, and it diffuses in the liquid phase following the diffusion gradient until it reaches the surface of the cell walls. Then, methanol diffuses in the gas phase into the substomatal cavity and is released as VOC in the ambient air through the stomata. In our study, stomata lock open as a consequence of cellular death (Prats et al., 2006), and the increased temperature accelerated the diffusion process releasing methanol as the most emitted compound from rapeseed leaf litter.
4.4 SOA formation from leaf litter BVOC emissions
To our knowledge, an investigation of SOA formation from leaf litter samples has only been reported by the study of Faiola et al. (2014). Faiola et al. (2014) reported the maximum peak volume of SOA particles obtained through the oxidation of the emitted VOCs by the injection of 130 ppb of O3 under controlled atmospheric conditions. The experiment was similar to the one performed here where only 80 ppbs of ozone was injected (O3 condition). Comparing the O3 experiment in this study with the experiment under the dry conditions of Faiola et al. (2014) (Table 3), the maximum volume of SOA particles in our study has the same order of magnitude as the volume reported by Faiola et al. (2014). The most important difference between this study and the previous one is the concentration of the monoterpenes detected. In Faiola et al. (2014) monoterpenes contributed to 80 % of the total VOC emissions. Monoterpenes, together with isoprene and sesquiterpenes, are considered to be the three primary classes of VOCs forming SOA (Sakulyanontvittaya et al., 2008). Isoprene is the most emitted compound from vegetation (Sindelarova et al., 2014) with a relatively small aerosol yield (Henze and Seinfeld, 2006). On the other hand, monoterpenes have been known to widely contribute to SOA formation (Griffin et al., 1999). In this study, monoterpenes were found to be lower than our PTR-TOF-MS detection limit, and isoprene was only the 30th most emitted compound under UV light irradiation. For instance, furfural has been reported as a precursor of SOA formation, with an aerosol yield ranging from 0.3 % to 3 % depending on the ozone concentration (Colmenar et al., 2020). Acetaldehyde and acetone have been reported to be taken up into the aerosol phase and to participate in the aerosol-phase reactions (Barsanti and Pankow, 2004). Those reactions generate products with a relatively low vapour pressure, which leads to an additional partitioning from the gas phase, increasing the organic particulate mass (Limbeck et al., 2003; Tong et al., 2006). In this study, acetaldehyde and acetone were found to be correlated with SOA formation from rapeseed leaf litter and to be largely emitted from 60 to 40 and from 17 to 12 ppb respectively in the UV_O3 condition. The observed particle formations highlighted the high oxidation potential of the UV light irradiation with a volume of particle production per day higher than the one found for the O3 experiment (Table 2). Moreover, the combination of ozone and UV light produced a larger maximum aerosol volume peak than the one reported in Faiola et al. (2014) for both dry and wet conditions and the largest aerosol volume per day compared to the O3 and UV light experiments (Table 3).
Furthermore, we observed particles in the range from 2.5 to 79.1 nm, while Faiola et al. (2014) detected them between 20 and 730 nm. In this study, for the O3 experiment, the percentage of particles under 20 nm contributed to 38 % of the total aerosol volume (Table 3). Therefore, aerosol formation from leaf litter was certainly underestimated in this previous study due to the importance of particles below 20 nm.
This study highlighted the possibility that VOC emissions from rapeseed leaf litter, which is one of the three most cultivated crops in France and worldwide, could have been underestimated. We reported substantial SOA formation for the different studied conditions. In the experiment with UV and O3, the aerosol volume measured in the chamber was 790 µm3 cm−3. It is important to stress that these results may correspond to lower limits for SOA production since (i) the UV lamps had about seven times lower light intensity at 365 nm than actual solar radiation and (ii) the detection of the particles was performed up to 79.1 nm; consequently, the formation of particles having greater diameters was not detected. We, therefore, suggest that SOA formation from leaf litter may have an atmospheric impact. This study also highlights the need for further studies to quantify the possible impact of the SOA formation from leaf litter at a larger scale.
In this work, we detected the VOC from rapeseed litter samples for 6 d under three different conditions: UV light irradiation, ozone injection, and UV light combined with ozone injection. The experiments were performed under controlled conditions within an atmospheric simulation chamber. The results showed that BVOC emissions from senescent rapeseed litter impact SOA formation and that the combination of UV light irradiation and ozone injection increased the BVOC emission profile's diversity. UV light irradiation was found to affect the production of SOA more than the O3 injection. In the presence of both UV light and O3, SOA formation was 9 and 52 times higher than from solely UV light or ozone, respectively.
Low emissions of isoprene were detected, even though the production of SOA was not negligible. The densest portion of particles produced by litter samples had a diameter lower than 20 nm, which might have caused an underestimation of the SOA formation from litter in other studies that detected a range of particles with a diameter higher than 20 nm.
The code is available under request at letizia.abis@tu-berlin.de.
Data are available for download at https://doi.org/10.25326/0JXT-M252 (George, 2021).
The supplement related to this article is available online at: https://doi.org/10.5194/acp-21-12613-2021-supplement.
LA took charge of the conceptualization, data curation, investigation, formal analysis, methodology, visualization, and writing. CK handled the methodology, investigation, writing, review and editing. BL handled the methodology and investigation. TW, LZ, and JC took care of the data curation and investigation. SP took care of the investigation, methodology and resources. BL performed writing, review, editing, and investigation. RC performed the conceptualization, data curation, methodology, writing, review and editing, funding acquisition, and project administration, supervision, and validation. CG took care of the methodology, writing, review and editing, funding acquisition, and project administration, supervision and validation.
The authors declare that they have no conflict of interest.
Publisher's note: Copernicus Publications remains neutral with regard to jurisdictional claims in published maps and institutional affiliations.
This article is part of the special issue “Simulation chambers as tools in atmospheric research (AMT/ACP/GMD inter-journal SI)”. It is not associated with a conference.
This work received funding from the Agence de la transition écologique (ADEME) under the Cortea program (RAVISA grant agreement no. 1762C0006) and the European Commission (EC) under the European Union's Horizon 2020 research and innovation program (Eurochamp 2020 grant agreement no. 730997).
This research has been supported by the Agence de l'Environnement et de la Maîtrise de l'Energie (grant no. RAVISA grant agreement no. 1762C0006) and the European Commission, Horizon 2020 Framework Programme (grant no. EUROCHAMP-2020 (730997)).
This paper was edited by Jason Surratt and reviewed by Sasho Gligorovski and two anonymous referees.
Alpert, P. A., Ciuraru, R., Rossignol, S., Passananti, M., Tinel, L., Perrier, S., Dupart, Y., Steimer, S. S., Ammann, M., Donaldson, D. J., and George, C.: Fatty Acid Surfactant Photochemistry Results in New Particle Formation, Sci. Rep., 7, 12693, https://doi.org/10.1038/s41598-017-12601-2, 2017.
Bachy, A., Aubinet, M., Schoon, N., Amelynck, C., Bodson, B., Moureaux, C., and Heinesch, B.: Are BVOC exchanges in agricultural ecosystems overestimated? Insights from fluxes measured in a maize field over a whole growing season, Atmos. Chem. Phys., 16, 5343–5356, https://doi.org/10.5194/acp-16-5343-2016, 2016.
Barsanti, K. C. and Pankow, J. F.: Thermodynamics of the formation of atmospheric organic particulate matter by accretion reactions – Part 1: aldehydes and ketones, Atmos. Environ., 38, 4371–4382, https://doi.org/10.1016/j.atmosenv.2004.03.035, 2004.
Bernard, F., Ciuraru, R., Boréave, A., and George, C.: Photosensitized Formation of Secondary Organic Aerosols above the Air/Water Interface, Environ. Sci. Technol., 50, 8678–8686, https://doi.org/10.1021/acs.est.6b03520, 2016.
Bigg, E. K.: Gas emissions from soil and leaf litter as a source of new particle formation, Atmos. Res., 70, 33–42, https://doi.org/10.1016/j.atmosres.2003.10.003, 2004.
Bracho-Nunez, A., Welter, S., Staudt, M., and Kesselmeier, J.: Plant-specific volatile organic compound emission rates from young and mature leaves of Mediterranean vegetation, J. Geophys. Res.-Atmos., 116, D16, https://doi.org/10.1029/2010JD015521, 2011.
Cappellin, L., Biasioli, F., Granitto, P. M., Schuhfried, E., Soukoulis, C., Costa, F., Märk, T. D., and Gasperi, F.: On data analysis in PTR-TOF-MS: From raw spectra to data mining, Sens. Actuat. B, 155, 183–190, https://doi.org/10.1016/j.snb.2010.11.044, 2011.
Cojocariu, C., Escher, P., Häberle, K.-H., Matyssek, R., Rennenberg, H., and Kreuzwieser, J.: The effect of ozone on the emission of carbonyls from leaves of adult Fagus sylvatica, Plant Cell Environ., 28, 603–611, https://doi.org/10.1111/j.1365-3040.2005.01305.x, 2005.
Colmenar, I., Martín, P., Cabañas, B., Salgado, S., Villanueva, F., and Ballesteros, B.: Evaluation of the SOA Formation in the Reaction of Furfural with Atmospheric Oxidants, Atmosphere, 11, 927, https://doi.org/10.3390/atmos11090927, 2020.
Das, M., Kang, D., Aneja, V. P., Lonneman, W., Cook, D. R., and Wesely, M. L.: Measurements of hydrocarbon air–surface exchange rates over maize, Atmos. Environ., 37, 2269–2277, https://doi.org/10.1016/S1352-2310(03)00076-1, 2003.
De Gouw, J. and Jimenez, J. L.: Organic Aerosols in the Earth's Atmosphere, Environ. Sci. Technol., 43, 7614–7618, https://doi.org/10.1021/es9006004, 2009.
Derendorp, L., Holzinger, R., and Röckmann, T.: UV-induced emissions of C2–C5 hydrocarbons from leaf litter, Environ. Chem., 8, 602–611, https://doi.org/10.1071/EN11024, 2011.
Diaz-de-Quijano, M., Kefauver, S., Ogaya, R., Vollenweider, P., Ribas, À., and Peñuelas, J.: Visible ozone-like injury, defoliation, and mortality in two Pinus uncinata stands in the Catalan Pyrenees (NE Spain), Eur. J. Forest Res., 135, 687–696, https://doi.org/10.1007/s10342-016-0964-9, 2016.
Faiola, C. L., VanderSchelden, G. S., Wen, M., Elloy, F. C., Cobos, D. R., Watts, R. J., Jobson, B. T., and VanReken, T. M.: SOA Formation Potential. of Emissions from Soil and Leaf Litter, Environ. Sci. Technol., 48, 938–946, https://doi.org/10.1021/es4040045, 2014.
Fall, R. and Benson, A. A.: Leaf methanol – the simplest natural product from plants, Trends Plant Sci., 1, 296–301, https://doi.org/10.1016/S1360-1385(96)88175-0, 1996.
Fischer, R. A., Byerlee, D., and Edmeades, G.: Crop yields and global food security: will yield increase continue to feed the world? ACIAR Monograph No. 158, Australian Centre for International Agricultural Research, Canberra, 2014.
FranceAgriMer: L'Observatoire National des Ressources en Biomasse (ONRB): Evaluation des ressources disponibles en France, FranceAgriMer, 2016.
French National Statistics: Chiffres et analyses: la statistique agricole, available at: https://agreste.agriculture.gouv.fr/agreste-web/ (last access: 20 August 2021), 2019.
George, C.: Atmospheric simulation chamber study: rapseed litter + None – Modelled data, AERIS [data set], https://doi.org/10.25326/0JXT-M252, 2021.
Gonzaga Gomez, L., Loubet, B., Lafouge, F., Ciuraru, R., Buysse, P., Durand, B., Gueudet, J. C., Fanucci, O., Fortineau, A., Zurfluh, O., Decuq, C., Kammer, J., Duprix, P., Bsaibes, S., Truong, F., Gros, V., and Boissard, C.: Comparative study of biogenic volatile organic compounds fluxes by wheat, maize and rapeseed with dynamic chambers over a short period in northern France, Atmos. Environ., 214, 116855, https://doi.org/10.1016/j.atmosenv.2019.116855, 2019.
Granier, C., Pétron, G., Müller, J.-F., and Brasseur, G.: The impact of natural and anthropogenic hydrocarbons on the tropospheric budget of carbon monoxide, Atmos. Environ., 34, 5255–5270, https://doi.org/10.1016/S1352-2310(00)00299-5, 2000.
Greenberg, J. P., Asensio, D., Turnipseed, A., Guenther, A. B., Karl, T., and Gochis, D.: Contribution of leaf and needle litter to whole ecosystem BVOC fluxes, Atmos. Environ., 59, 302–311, https://doi.org/10.1016/j.atmosenv.2012.04.038, 2012.
Griffin, R. J., Cocker, D. R., Seinfeld, J. H., and Dabdub, D.: Estimate of global atmospheric organic aerosol from oxidation of biogenic hydrocarbons, Geophys. Res. Lett., 26, 2721–2724, https://doi.org/10.1029/1999GL900476, 1999.
Guenther, A.: A global model of natural volatile organic compound emissions, J. Geophys. Res., 100, 8873–8892, https://doi.org/10.1029/94JD02950, 1995.
Hallquist, M., Wenger, J. C., Baltensperger, U., Rudich, Y., Simpson, D., Claeys, M., Dommen, J., Donahue, N. M., George, C., Goldstein, A. H., Hamilton, J. F., Herrmann, H., Hoffmann, T., Iinuma, Y., Jang, M., Jenkin, M. E., Jimenez, J. L., Kiendler-Scharr, A., Maenhaut, W., McFiggans, G., Mentel, T. F., Monod, A., Prévôt, A. S. H., Seinfeld, J. H., Surratt, J. D., Szmigielski, R., and Wildt, J.: The formation, properties and impact of secondary organic aerosol: current and emerging issues, Atmos. Chem. Phys., 9, 5155–5236, https://doi.org/10.5194/acp-9-5155-2009, 2009.
Harley, P., Greenberg, J., Niinemets, Ü., and Guenther, A.: Environmental controls over methanol emission from leaves, Biogeosciences, 4, 1083–1099, https://doi.org/10.5194/bg-4-1083-2007, 2007.
Hatfield, M. L. and Huff Hartz, K. E.: Secondary organic aerosol from biogenic volatile organic compound mixtures, Atmos. Environ., 45, 2211–2219, https://doi.org/10.1016/j.atmosenv.2011.01.065, 2011.
Henze, D. K. and Seinfeld, J. H.: Global secondary organic aerosol from isoprene oxidation, Geophys. Res. Lett., 33, 9, https://doi.org/10.1029/2006GL025976, 2006.
Hess, B. M., Xue, J., Markillie, L. M., Taylor, R. C., Wiley, H. S., Ahring, B. K., and Linggi, B.: Coregulation of Terpenoid Pathway Genes and Prediction of Isoprene Production in Bacillus subtilis Using Transcriptomics, PLOS ONE, 8, e66104, https://doi.org/10.1371/journal.pone.0066104, 2013.
Hörtnagl, L., Bamberger, I., Graus, M., Ruuskanen, T. M., Schnitzhofer, R., Walser, M., Unterberger, A., Hansel, A., and Wohlfahrt, G.: Acetaldehyde exchange above a managed temperate mountain grassland, Atmos. Chem. Phys., 14, 5369–5391, https://doi.org/10.5194/acp-14-5369-2014, 2014.
Isidorov, V. and Jdanova, M.: Volatile organic compounds from leaves litter, Chemosphere, 48, 975–979, https://doi.org/10.1016/S0045-6535(02)00074-7, 2002.
Jacob, D. J., Field, B. D., Jin, E. M., Bey, I., Li, Q., Logan, J. A., Yantosca, R. M., and Singh, H. B.: Atmospheric budget of acetone, J. Geophys. Res.-Atmos., 107, D10, https://doi.org/10.1029/2001JD000694, 2002.
Karl, T., Guenther, A., Spirig, C., Hansel, A., and Fall, R.: Seasonal variation of biogenic VOC emissions above a mixed hardwood forest in northern Michigan, Geophys. Res. Lett., 30, 23, https://doi.org/10.1029/2003GL018432, 2003.
Kesselmeier, J. and Staudt, M.: Biogenic Volatile Organic Compounds (VOC): An Overview on Emission, Physiology and Ecology, J. Atmos. Chem., 33, 23–88, https://doi.org/10.1023/A:1006127516791, 1999.
Limbeck, A., Kulmala, M., and Puxbaum, H.: Secondary organic aerosol formation in the atmosphere via heterogeneous reaction of gaseous isoprene on acidic particles, Geophys. Res. Lett., 30, 19, https://doi.org/10.1029/2003GL017738, 2003.
Matthews, E.: Global litter production, pools, and turnover times: Estimates from measurement data and regression models, J. Geophys. Res.-Atmos., 102, 18771–18800, https://doi.org/10.1029/97JD02956, 1997.
Mceldowney, S. and Fletcher, M.: The effect of temperature and relative humidity on the survival of bacteria attached to dry solid surfaces, Lett. Appl. Microbiol., 7, 83–86, https://doi.org/10.1111/j.1472-765X.1988.tb01258.x, 2008.
Membre, J., Leporq, B., Vialette, M., Mettler, E., Perrier, L., Thuault, D., and Zwietering, M.: Temperature effect on bacterial growth rate: quantitative microbiology approach including cardinal values and variability estimates to perform growth simulations on/in food, Int. J. Food Microbiol., 100, 179–186, https://doi.org/10.1016/j.ijfoodmicro.2004.10.015, 2005.
Monks, P. S., Archibald, A. T., Colette, A., Cooper, O., Coyle, M., Derwent, R., Fowler, D., Granier, C., Law, K. S., Mills, G. E., Stevenson, D. S., Tarasova, O., Thouret, V., von Schneidemesser, E., Sommariva, R., Wild, O., and Williams, M. L.: Tropospheric ozone and its precursors from the urban to the global scale from air quality to short-lived climate forcer, Atmos. Chem. Phys., 15, 8889–8973, https://doi.org/10.5194/acp-15-8889-2015, 2015.
Morrison, E. C., Drewer, J., and Heal, M. R.: A comparison of isoprene and monoterpene emission rates from the perennial bioenergy crops short-rotation coppice willow and Miscanthus and the annual arable crops wheat and oilseed rape, GCB Bioenergy, 8, 211–225, https://doi.org/10.1111/gcbb.12257, 2016.
Mozaffar, A., Schoon, N., Bachy, A., Digrado, A., Heinesch, B., Aubinet, M., Fauconnier, M.-L., Delaplace, P., du Jardin, P., and Amelynck, C.: Biogenic volatile organic compound emissions from senescent maize leaves and a comparison with other leaf developmental stages, Atmos. Environ., 176, 71–81, https://doi.org/10.1016/j.atmosenv.2017.12.020, 2018.
Müller, M., Mikoviny, T., Feil, S., Haidacher, S., Hanel, G., Hartungen, E., Jordan, A., Märk, L., Mutschlechner, P., Schottkowsky, R., Sulzer, P., Crawford, J. H., and Wisthaler, A.: A compact PTR-ToF-MS instrument for airborne measurements of volatile organic compounds at high spatiotemporal resolution, Atmos. Meas. Tech., 7, 3763–3772, https://doi.org/10.5194/amt-7-3763-2014, 2014.
Murphy, J. G., Oram, D. E., and Reeves, C. E.: Measurements of volatile organic compounds over West Africa, Atmos. Chem. Phys., 10, 5281–5294, https://doi.org/10.5194/acp-10-5281-2010, 2010.
Niinemets, Ü. and Reichstein, M.: Controls on the emission of plant volatiles through stomata: A sensitivity analysis, J. Geophys. Res.-Atmos., 108, D7, https://doi.org/10.1029/2002JD002626, 2003.
Niinemets, Ü., Fares, S., Harley, P., and Jardine, K. J.: Bidirectional exchange of biogenic volatiles with vegetation: emission sources, reactions, breakdown and deposition, Plant Cell Environ., 37, 1790–1809, https://doi.org/10.1111/pce.12322, 2014.
Paulot, F., Wunch, D., Crounse, J. D., Toon, G. C., Millet, D. B., DeCarlo, P. F., Vigouroux, C., Deutscher, N. M., González Abad, G., Notholt, J., Warneke, T., Hannigan, J. W., Warneke, C., de Gouw, J. A., Dunlea, E. J., De Mazière, M., Griffith, D. W. T., Bernath, P., Jimenez, J. L., and Wennberg, P. O.: Importance of secondary sources in the atmospheric budgets of formic and acetic acids, Atmos. Chem. Phys., 11, 1989–2013, https://doi.org/10.5194/acp-11-1989-2011, 2011.
Pfister, G., Emmons, L., Hess, P., Lamarque, J.-F., Orlando, J., Walters, S., Guenther, A., Palmer, P., and Lawrence, P.: Contribution of isoprene to chemical budgets: a model tracer study with the NCAR CTM MOZART-4, J. Geophys. Res., 113, D05308, https://doi.org/10.1029/2007JD008948, 2008.
Poisson, N., Kanakidou, M., and Crutzen, P. J.: Impact of Non-Methane Hydrocarbons on Tropospheric Chemistry and the Oxidizing Power of the Global Troposphere: 3-Dimensional Modelling Results, J. Atmos. Chem., 36, 157–230, https://doi.org/10.1023/A:1006300616544, 2000.
Potard, K., Monard, C., Le Garrec, J.-L., Caudal, J.-P., Le Bris, N., and Binet, F.: Organic amendment practices as possible drivers of biogenic Volatile Organic Compounds emitted by soils in agrosystems, Agr. Ecosyst. Environ., 250, 25–36, https://doi.org/10.1016/j.agee.2017.09.007, 2017.
Prats, E., Gay, A. P., Mur, L. A. J., Thomas, B. J., and Carver, T. L. W.: Stomatal lock-open, a consequence of epidermal cell death, follows transient suppression of stomatal opening in barley attacked by Blumeria graminis, J. Exp. Bot., 57, 2211–2226, https://doi.org/10.1093/jxb/erj186, 2006.
Sakulyanontvittaya, T., Guenther, A., Helmig, D., Milford, J., and Wiedinmyer, C.: Secondary Organic Aerosol from Sesquiterpene and Monoterpene Emissions in the United States, Environ. Sci. Technol., 42, 8784–8790, https://doi.org/10.1021/es800817r, 2008.
Schulz, S. and Dickschat, J. S.: Bacterial volatiles: the smell of small organisms, Nat. Prod. Rep., 24, 814–842, https://doi.org/10.1039/B507392H, 2007.
Seco, R., Penuelas, J., and Filella, I.: Short-chain oxygenated VOCs: Emission and uptake by plants and atmospheric sources, sinks, and concentrations, Atmos. Environ., 41, 2477–2499, https://doi.org/10.1016/j.atmosenv.2006.11.029, 2007.
Sindelarova, K., Granier, C., Bouarar, I., Guenther, A., Tilmes, S., Stavrakou, T., Müller, J.-F., Kuhn, U., Stefani, P., and Knorr, W.: Global data set of biogenic VOC emissions calculated by the MEGAN model over the last 30 years, Atmos. Chem. Phys., 14, 9317–9341, https://doi.org/10.5194/acp-14-9317-2014, 2014.
Tiefenbacher, A., Sandén, T., Haslmayr, H.-P., Miloczki, J., Wenzel, W., and Spiegel, H.: Optimizing Carbon Sequestration in Croplands: A Synthesis, Agronomy, 11, 882, https://doi.org/10.3390/agronomy11050882, 2021.
Tong, C., Blanco, M., Goddard, W. A., and Seinfeld, J. H.: Secondary Organic Aerosol Formation by Heterogeneous Reactions of Aldehydes and Ketones: A Quantum Mechanical Study, Environ. Sci. Technol., 40, 2333–2338, https://doi.org/10.1021/es0519785, 2006.
Viros, J., Santonja, M., Temime-Roussel, B., Wortham, H., Fernandez, C., and Ormeno, E.: Volatilome of Aleppo Pine litter over decomposition process, Ecol. Evol., 11, 6862–6880, https://doi.org/10.1002/ece3.7533, 2021.
Wagner, C., Bonte, A., Brühl, L., Niehaus, K., Bednarz, H., and Matthäus, B.: Micro-organisms growing on rapeseed during storage affect the profile of volatile compounds of virgin rapeseed oil, J. Sci. Food Agric., 98, 2147–2155, https://doi.org/10.1002/jsfa.8699, 2018.
Warneke, C., Karl, T., Judmaier, H., Hansel, A., Jordan, A., Lindinger, W., and Crutzen, P.: Acetone, methanol, and other partially oxidized volatile organic emissions from dead plant matter by abiological processes: Significance for atmospheric HO(X) chemistry, Global Biogeochem. Cy., 13, 9–15 https://doi.org/10.1029/98GB02428, 1999.
Wiß, F., Ghirardo, A., Schnitzler, J.-P., Nendel, C., Augustin, J., Hoffmann, M., and Grote, R.: Net ecosystem fluxes and composition of biogenic volatile organic compounds over a maize field–interaction of meteorology and phenological stages, GCB Bioenergy, 9, 1627–1643, https://doi.org/10.1111/gcbb.12454, 2017.
Yendrek, C. R., Erice, G., Montes, C. M., Tomaz, T., Sorgini, C. A., Brown, P. J., McIntyre, L. M., Leakey, A. D. B., and Ainsworth, E. A.: Elevated ozone reduces photosynthetic carbon gain by accelerating leaf senescence of inbred and hybrid maize in a genotype-specific manner, Plant Cell Environ., 40, 3088–3100, https://doi.org/10.1111/pce.13075, 2017.
Yuan, J., Zhao, M., Li, R., Huang, Q., Raza, W., Rensing, C., and Shen, Q.: Microbial volatile compounds alter the soil microbial community, Environ. Sci. Pollut. Res., 24, 22485–22493, https://doi.org/10.1007/s11356-017-9839-y, 2017.
Yuan, X., Calatayud, V., Gao, F., Fares, S., Paoletti, E., Tian, Y., and Feng, Z.: Interaction of drought and ozone exposure on isoprene emission from extensively cultivated poplar, Plant Cell Environ., 39, 2276–2287, https://doi.org/10.1111/pce.12798, 2016.
Yuan, X., Feng, Z., Liu, S., Shang, B., Li, P., Xu, Y., and Paoletti, E.: Concentration- and flux-based dose–responses of isoprene emission from poplar leaves and plants exposed to an ozone concentration gradient, Plant Cell Environ., 40, 1960–1971, https://doi.org/10.1111/pce.13007, 2017.
Ziemann, P. J. and Atkinson, R.: Kinetics, products, and mechanisms of secondary organic aerosol formation, Chem. Soc. Rev., 41, 6582–6605, https://doi.org/10.1039/C2CS35122F, 2012.