the Creative Commons Attribution 4.0 License.
the Creative Commons Attribution 4.0 License.
 | 13 Aug 2021
Measurement report: Effect of wind shear on PM10 concentration vertical structure in the urban boundary layer in a complex terrain
Piotr Sekuła
Jakub Bartyzel
Bogdan Bochenek
Łukasz Chmura
Michał Gałkowski
Mirosław Zimnoch
The paper shows wind shear impact on PM10 vertical profiles in Kraków, southern Poland. The data used consist of background data for two cold seasons (September 2018 to April 2019 and September 2019 to April 2020) and data for several case studies from November 2019 to March 2020. The data are composed of PM10 measurements, model data, and wind speed and direction data. The background model data come from operational forecast results of the AROME model. PM10 concentration in the vertical profile was measured with a sightseeing balloon. Significant spatial variability of the wind field was found. The case studies represent the conditions with much lower wind speed and a much higher PM10 level than the seasonal average. The inversions were much more frequent than on average too. Wind shear turned out to be the important factor in terms of PM10 vertical profile modification. It is generated due to the relief impact, i.e. the presence of a large valley, blocked on one side with the hills. The analysis of PM10 profiles from all flights allows us to distinguish three vertical zones of potential air pollution hazards within the valley (about 100 m deep) and the city of Kraków: (1) up to about 60 m a.g.l. – the zone where during periods of low wind speed, air pollution is potentially the highest and the duration of such high levels is the longest, i.e. the zone with the worst aerosanitary conditions; (2) about 60–100 m a.g.l. – transitional zone where the large decrease in PM10 levels with height is observed; (3) above 100–120 m a.g.l. – the zone where air quality is significantly better than in zone 1, either due to the increase in the wind speed or due to the wind direction change and advection of different, clean air masses.
- Article
(3715 KB) - Full-text XML
- BibTeX
- EndNote


Particulate matter (PM) concentration remains one of the most relevant air-quality concerns in urban environments (Thürkow et al., 2021). Exposure to ambient PM concentration with diameter below 10 µm (PM10) can cause lung irritation, cellular damage, coughing asthma, and cardiovascular diseases (Jeong, 2013). Particles with diameter below 1 µm (i.e. fine and ultrafine particles which constitute in most cases the majority of PM10 fraction) have the strongest impact on health because they can reach the deepest portions of the airways or even the bloodstream (Franchini and Mannucci, 2007, 2011). Presence of the particulate matter in the ambient air is the result of multiple physio-chemical processes, including local emission, chemical transformation, long-range transport, vertical mixing and deposition, most of which are dependent on meteorological conditions across a large range of spatial and temporal scales (Zhang et al., 2015; Zhou et al., 2020; Thürkow et al., 2021).
Local meteorological conditions determine primarily the dispersion of air pollutants and their removal (Trompetter et al., 2013), but they also affect chemical and physical processes linked to the origin of the primary and secondary aerosols (Zhou et al., 2020). One of the most studied meteorological phenomena is the occurrence of above-ground air temperature gradient inversion, which has a direct impact on the vertical distribution of the concentration of PM10 and its individual components, e.g. black carbon (Zhou et al., 2020) or organic PM10 tracers like levoglucosan (Marynowski et al., 2020). Numerous studies indicate that an important factor that affects the pollution profile is the wind profile (Li and Han, 2016; Zhou et al., 2020), occurrence of low-level jets (Li et al., 2012, 2019) or downward flows of pollutants (Han et al., 2018) which may strongly modify the diurnal cycle of a pollutant concentration in the lowest part of the troposphere.
The vertical structure of the pollutant concentration strongly depends on many factors, including season, meteorological conditions (Wang et al., 2018), topography (Trompetter et al., 2013; Strbova et al., 2017), and seasonal variability of local emissions and long-range transport (Li and Han, 2016). Due to this fact it is necessary to continuously study the spatial and vertical distributions of air pollution concentration in urbanized areas to better determine its sources and processes leading to abundant air pollution.
Research on the vertical structure of air pollution has been carried out in the past using several methods: stationary point measurements in the profile using the available infrastructure (e.g. Marynowski et al., 2020), balloon flights (e.g. Han et al., 2018; Renard et al., 2020), airplane or unmanned aerial vehicle (UAV) (Liu et al., 2020), lidar (Li and Han, 2016; Wang et al., 2020) or the use of satellite data (Ferrero et al., 2019). The highest vertical resolution can be achieved with the use of an aircraft (plane, balloon, UAV); however, these methods have certain limitations, e.g. lifting capacity, limited flight time and limited maximum reachable altitude, and they cannot operate during unfavourable weather conditions.
Throughout the previously published studies focused on the topic of lower-tropospheric air pollution, several types of the pollution concentration vertical profiles can be distinguished:
-
two layers with significantly different concentration, i.e. high concentration in the stratum from the ground level to a certain height, then a transition layer with a rapid decrease in pollutant concentration with height and a stratum with a low concentration in the profile above; usually linked to thermal inversion occurrence (Strbova et al., 2017; Wang et al., 2018; Samad et al., 2020);
-
a large, constant decrease in a pollutant concentration with height, resulting e.g. from a strong surface emission of a pollutant during stable conditions, from katabatic flows bringing the pollutants (Strbova et al., 2017), and from removal of the pollutants from the upper layers;
-
the occurrence of a layer with increased concentration of air pollution at a certain height, connected to vertical diffusion (Strbova et al., 2017) or diffusion of plumes from elevated sources (Xu et al., 2019);
-
a slight decrease in air pollution with height connected to the occurrence of strong vertical movements (Strbova et al., 2017) or removal of local air pollution due to synoptic processes linked to the advection of air masses.
It is noteworthy that many recent studies of air pollution concentration's vertical structure in cities were realized mainly for areas with little variation in the topography (e.g. Paris, Renard et al., 2020, Tianjin, Han et al., 2018), including coastal areas (Guangzhou, Zhou et al., 2020, Shanghai, Zhang et al., 2017). In fact, the understanding and the quantification of pollutant dispersion over complex terrain are much more difficult than over flat areas, as dispersion processes are affected by atmospheric interactions with the orography at different spatial scales (Giovannini et al., 2020). Studies presenting vertical profiles of pollutants' concentration in urbanized valleys are still necessary to better understand the impact of meteorology and topography on air pollutant dispersion (Strbova et al., 2017; Zhao et al., 2019; Samad et al., 2020).
A key parameter affecting pollutant concentration during the daytime is the height of the atmospheric boundary layer (ABL), which determines the volume of atmosphere available for pollutant dispersion. Turbulent mixing is a key factor which controls the evolution of the ABL depth (Giovannini et al., 2020). One of the important factors is the wind shear as it may essentially modify the structure of mean flow and turbulence in the convective boundary layer (CBL), e.g. by stretching and decoupling of the turbulent structures' production or separation of a single-layer CBL into a two-layer structure (Fedorovich and Conzemius, 2008; Rodier et al., 2017). Studies presenting the impact of ABL dynamics on vertical pollutant structure indicate that a low-level jet combined with a strong wind shear affects the transportation of the pollution e.g. by removing it (Trompetter et al., 2013) or bringing it in (pushing into the residual layer) and by favouring the growth of ABL height and weakening the stability of the atmosphere (Li et al., 2019).
The present study is focused on the impact of wind shear on the vertical profile of PM10 concentration in Kraków, southern Poland, a city located in a large valley. The properties of the ABL, including the vertical profile of wind speed and direction, are strongly modified by both the relief and the synoptic situation, and so are the air pollution's dispersion conditions, which in turn affects the pollutants concentration's profile. Those circumstances are of the highest importance in a city located in a valley as the built-up areas are located both in the valley bottom as well as on its slopes, i.e. in a vertical profile of the land form. Kraków is a good study area for such considerations as it is located in diversified environmental conditions (described in detail in Sect. 2), and despite various legal actions aimed at reducing local PM10 emissions, daily limit values for PM10 are still exceeded during cold seasons. Moreover, Kraków is representative of many cities located in central Europe where aerosanitary conditions are relatively worse in comparison to the cities in the western part of the continent, as presented e.g. in the reports of the European Environment Agency (EEA, 2020). Poor air quality is, on the one hand, the result of PM10 emissions, which in the case of Poland are among the highest in Europe (Statista, 2021), with however a decreasing trend in recent years (Voivodeship Inspectorate of Environmental Protection, 2017). However, high PM10 concentrations are also linked to long-range transport of air pollution from other countries (Godłowska et al., 2015). In the Lesser Poland region (Małopolska) where Kraków is located, the main source of PM10 is the emission from the municipal and housing sector (78.9 % of the annual emission), from transportation (5 %), and from industry (7.8 %). In Kraków, the emissions related to vehicle traffic account for as much as 12 % of annual emission (Chief Inspectorate of Environmental Protection, 2020). Understanding the meteorological processes leading to the enhanced concentration levels is one of the key factors to enable the development strategies for inhabited areas to further reduce the number of smog episodes. To date no studies presenting temporal variability of PM10 concentration in the vertical profile in the cold season have been reported in that region.
Kraków is a large valley city located in the Wisła River valley, which is parallel to the border of the Carpathian Mountains to the south and the border of the Polish Uplands to the north (Fig. 1). About 100 km south of Kraków, there is the highest ridge of the Carpathians, the Tatra Mountains. Kraków is the second largest city of Poland, located in the Lesser Poland region (Małopolska), with an area of 326.8 km2 and the official number of inhabitants reaching 771 000 (as of December 2018, Statistical Office in Kraków, 2019). The Kraków agglomeration consists of the city itself and highly populated towns and villages which surround it, with the total number of inhabitants estimated to exceed 1 million. The city's area belongs to three different geographical regions and geological structures, i.e. the Polish Uplands, the Western Carpathians, and the basins of the Carpathian Foredeep in between (Bokwa, 2009). The central part of the city is located in the Wisła River valley, at an altitude of about 200 m a.s.l. In the western part of Kraków, the valley is as narrow as 1 km. However, in the eastern part of the city, the valley widens to about 10 km, and there is a system of river terraces. East of the city's borders, the Raba River enters the Wisła River with a valley cutting the Carpathian Foothills from the south to the north. The hilltops bordering the city to the north and the south reach about 100 m above the river valley floor, similar to the hilltops in the western part of the valley, which means that the city is located in a semi-concave land form (open only to the east) and sheltered from the prevailing western winds (Fig. 1). The local-scale processes linked to the impact of relief include, for example, katabatic flows, cold-air pool (CAP) formation, frequent air temperature inversions, and much lower wind speed in the valley floor than at the hilltops (e.g. Hess, 1974). According to the studies on thermal stratification obtained for Kraków by using sodar measurements with hourly resolution, in the months from October to March, the mean monthly frequency of stable atmosphere conditions varies from 58.1 % in March to 74.0 % in December (Godłowska, 2019). All factors mentioned above contribute to the poor natural ventilation of the city and the occurrence of high PM10 levels, especially in the heating season.
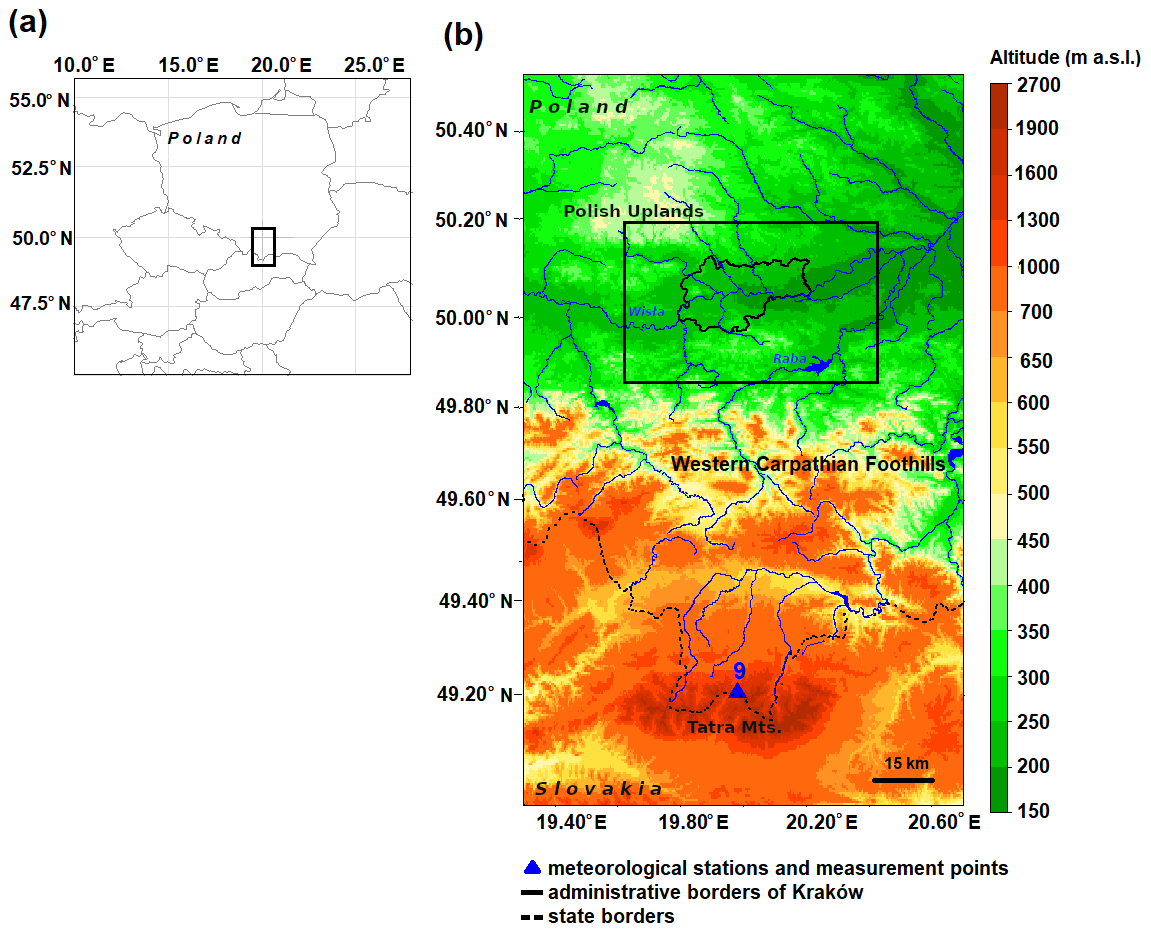
Figure 1Location of the region studied: (a) in central Europe; (b) in southern Poland. Explanations: station no. 9 as in Table 2. The black frame in (b) represents the analysed area shown in Fig. 2.
3.1 Surface measurements
The data used consist of background data for two cold seasons (September 2018 to April 2019 and September 2019 to April 2020) and data for several case studies from November 2019 to March 2020. The background data are composed of PM10 measurements from seven stations, model data, and wind speed and direction data from four meteorological stations. The data for case studies come from seven stations with PM10 measurements, model analyses, and eight meteorological stations (wind speed and direction, air temperature, air humidity and cloudiness) (Fig. 2, Tables 1 and 2).
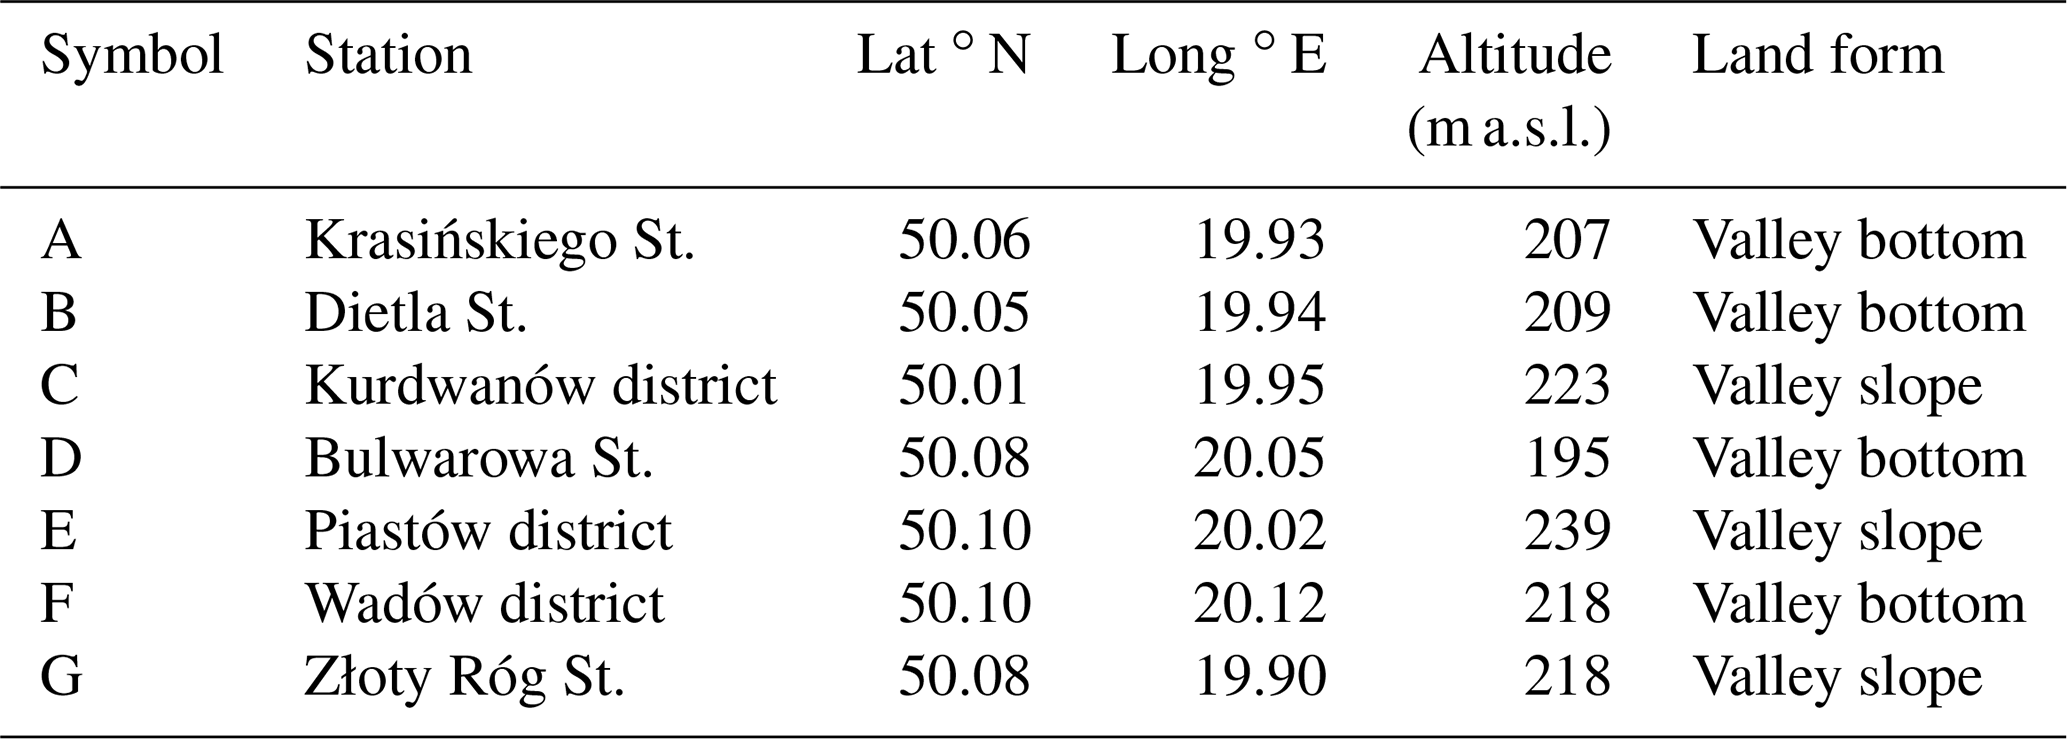
Data on PM10 concentrations in Kraków come from databases of the National Inspectorate of Environmental Protection (NIEP) (https://powietrze.gios.gov.pl/pjp/archives, last access: 21 April 2021). Mean hourly data from seven measurement points were used (Table 1). The measurement points represent several parts of the city and are located in various types of land form and land use/land cover (see Fig. 2 for the location of the measurement points):
- A.
Krasińskiego St.: street canyon in the city centre, in the bottom of the Wisła River valley, with a very busy municipal transportation route and intensive traffic;
- B.
Dietla St.: a busy cross-road in the city centre, at the bottom of the Wisła River valley, with intensive tram, bus and car traffic;
- C.
Kurdwanów district: suburban area with a large district of blocks of flats, in the southern part of the city, about 50 m above the valley floor;
- D.
Bulwarowa St.: suburban area with a large district of blocks of flats, located close to the steelworks, in the eastern part of the city, at a terrace of the Wisła River;
- E.
Piastów district: suburban area with a large district of blocks of flats, in the eastern part of the city, on the upland slope, about 50 m above the valley floor;
- F.
Wadów district: suburban area with agriculture activity and loose residential build-up, located close to the steelworks, at a river terrace in the eastern part of the Wisła valley;
- G.
Złoty Róg St.: suburban area with a large district of blocks of flats and residential build-up, on the upland slope, in the western part of the city.
Table 1Location of air pollution monitoring stations in Kraków.
Background data on wind conditions in the Wisła River valley and the neighbouring hilltop were obtained from the stations of the Institute of Meteorology and Water Management – National Research Institute (IMWM-NRI) (Balice, Igołomia and Libertów) and the station of AGH University of Science and Technology (AGH UST), located in Reymonta St. (city centre) on the roof of the Faculty of Physics and Applied Computer Science. Wind speed and direction data of hourly resolution were used. Table 2 and Fig. 2 show the locations of the stations and the range of measurements.
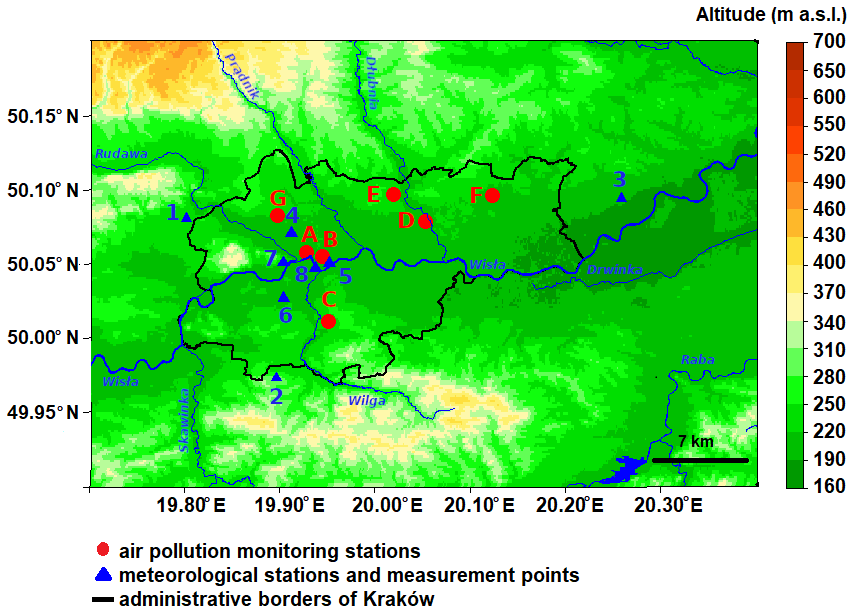
Figure 2Location of the region studied at the junction of the Wisła River valley, Polish Uplands and Western Carpathian Foothills. Explanations: numbers and letters as in Tables 1 and 2.
3.2 Modelling systems
The Aire Limitée Adaptation Dynamique Développement InterNational (ALADIN) system is a numerical weather prediction (NWP) system developed by the international ALADIN consortium for operational weather forecasting and research purposes (Termonia et al., 2018). Part of the consortium's development work is to provide several configurations of limited-area models (LAMs), which were precisely validated to be used for operational weather forecasting at the 16 partner institutes. These configurations are called the ALADIN canonical model configurations (CMCs). Currently there are three canonical model configurations: (1) ALADIN baseline CMC, (2) Application of Research to Operations at Mesoscale (AROME) CMC, and (3) ALADIN–AROME (ALARO) CMC. AROME CMC and ALARO CMC are operationally used in IMWM-NRI, together with the CY43T2.
The background model data come from operational forecast results of the AROME model. Operational model AROME CMC 2 km has a horizontal resolution of 2 km × 2 km and 70 vertical levels, and the forecast length is 30 h. The size of the AROME CMC 2 km domain is 799×799 points centered on the geographical point 19.3∘ E, 52.3∘ N. The location of the lowest model level is at 9 m above ground level, and the model top is located at 65 km above ground level. During the analysed periods the model version was changed from CY40T1 to CY43T2 (11 February 2020). Seasonal verification of the AROME CMC model forecast results showed compliance of the new version with the previous one (Bochenek et al., 2020).
The ALARO model was used to prepare lateral boundary data for the AROME model. ALARO CMC CY43T2 is a non-hydrostatic model, with a horizontal resolution of 4×4 km and 70 vertical levels. The model configurations ALARO CMC and AROME CMC have been validated by the ALADIN team at IMWM-NRI for CY43T2 for resolutions 4 km × 4 km and 2 km × 2 km, respectively. Due to ongoing work on the assimilation of surface data in the ALARO model in the ALADIN Poland group, data assimilation was not used in this research, and models were run in dynamical adaptation mode.
Archival forecasts of the AROME CMC model with a temporal resolution of 1 h (forecast hours from the 6th to 29th) were used to study the characteristics of vertical wind and temperature profiles in the valley, with a special focus on three height levels (50, 100 and 200 m a.g.l.), as the valley depth is about 100 m. Analyses were conducted at four selected points, representing Balice meteorological station, the TV tower with vertical profile measurements, the city centre, and Bulwarowa St. (PM10 measurements). The points mentioned are located along the valley bottom in the W–E cross section.
3.3 Vertical profile observations and data verification
For the period from November 2019 to March 2020, additional data for the case studies are available. They consist of measurements of PM10 concentration in the vertical profile, performed on 31 d selected. The PM10 profiles' measurements were carried out in cooperation with the company Balon Widokowy sp. z o. o. (http://balonwidokowy.pl/, last access: 21 April 2021) which operates commercially the sightseeing balloon in Kraków. The PM10 measurements were conducted up to a maximum altitude of almost 300 m a.g.l. Balloon flights were performed in the western part of the city, at the Wisła River, in the city centre, close to the air quality monitoring stations Krasińskiego St. and Dietla St.
Measurements of PM10 concentration in the vertical profile were conducted by the Personal Dust Monitor (PoDust v1.1) system based on the low-cost Plantower PMS1003 optical dust sensor and Arduino platform presented in Fig. 2. The measurement system was attached to the outside of the balloon basket. It was built based on the Arduino Mega 2560 microcontroller, responsible for communication with the sensors, storing the measurements with 1 s resolution on the memory card, and sending information in real time to the database using a WiFi connection. To reduce the impact of water vapour on PM10 measurement during the fog conditions, the sensor inlet was heated up to 60 ∘C. To provide information on an actual location and other environmental conditions, the system was equipped with a GPS receiver and thermo/hygro/baro sensor providing e.g. the altitude estimated with combined GPS and barometer signals.
The measurement campaign covered the period from 28 November 2019 to 3 March 2020, during which 317 flights were conducted (31 d, 634 vertical profiles). Maximum flight altitude varied between 78 and 284 m a.g.l., depending on the vertical wind profile and the number of passengers. Typical flight altitude during the sightseeing flight was 150 m a.g.l., but during low wind speed at higher altitudes and low passenger load, the maximum altitude was increased. The measurements were performed at different hours. The balloon's flight speed does not exceed 1 m s−1 (ascent up to 0.8 m s−1, descent approximately up to 0.6 m s−1); flight time (ascent/descent) depended on the maximum altitude and ranged from 2–3 min (for maximum height 100 m a.g.l.) up to 6–10 min (for maximum height 300 m a.g.l.).
The frequency of flights depended on meteorological conditions and the number of customers. The decision to fly on a given day was first made based on the current forecast (available at https://m.meteo.pl/ and https://meteo.imgw.pl, last access: 21 April 2021) analysed by the flight operator. The factors determining the impossibility of flying are the occurring or forecasted wind gusts above 8 m s−1, the risk of storms or the incoming atmospheric front, balloon icing, too low air temperature (below −10 ∘C), atmospheric precipitation or low visibility. More than 70 % of the flights were performed up to 180 m above ground level, and flights reaching over 200 m above ground level made up only 15 % of the cases. Almost 50 % of the vertical profiles were conducted between 12:00 and 15:00 UTC, while profiles from 15:00 to 20:00 UTC constitute 23 % of the cases (Fig. A1). The flight altitude depended on the wind speed in the whole vertical profile of the balloon range, which was measured directly during the flight. Figure 3 presents a comparison of PM10 measurements from the balloon device, conducted at 2 m a.g.l., and measurements from the nearby Krasińskiego station. As the measurements from the Krasińskiego station are of hourly resolution, linear interpolation of two adjacent measurements was applied to obtain the same data resolution as for the balloon. The intersection point of the straight line matching the graph has been set to 0 because tests on the Plantower sensor have shown the correct measurement for a concentration close to 0 µg m−3.
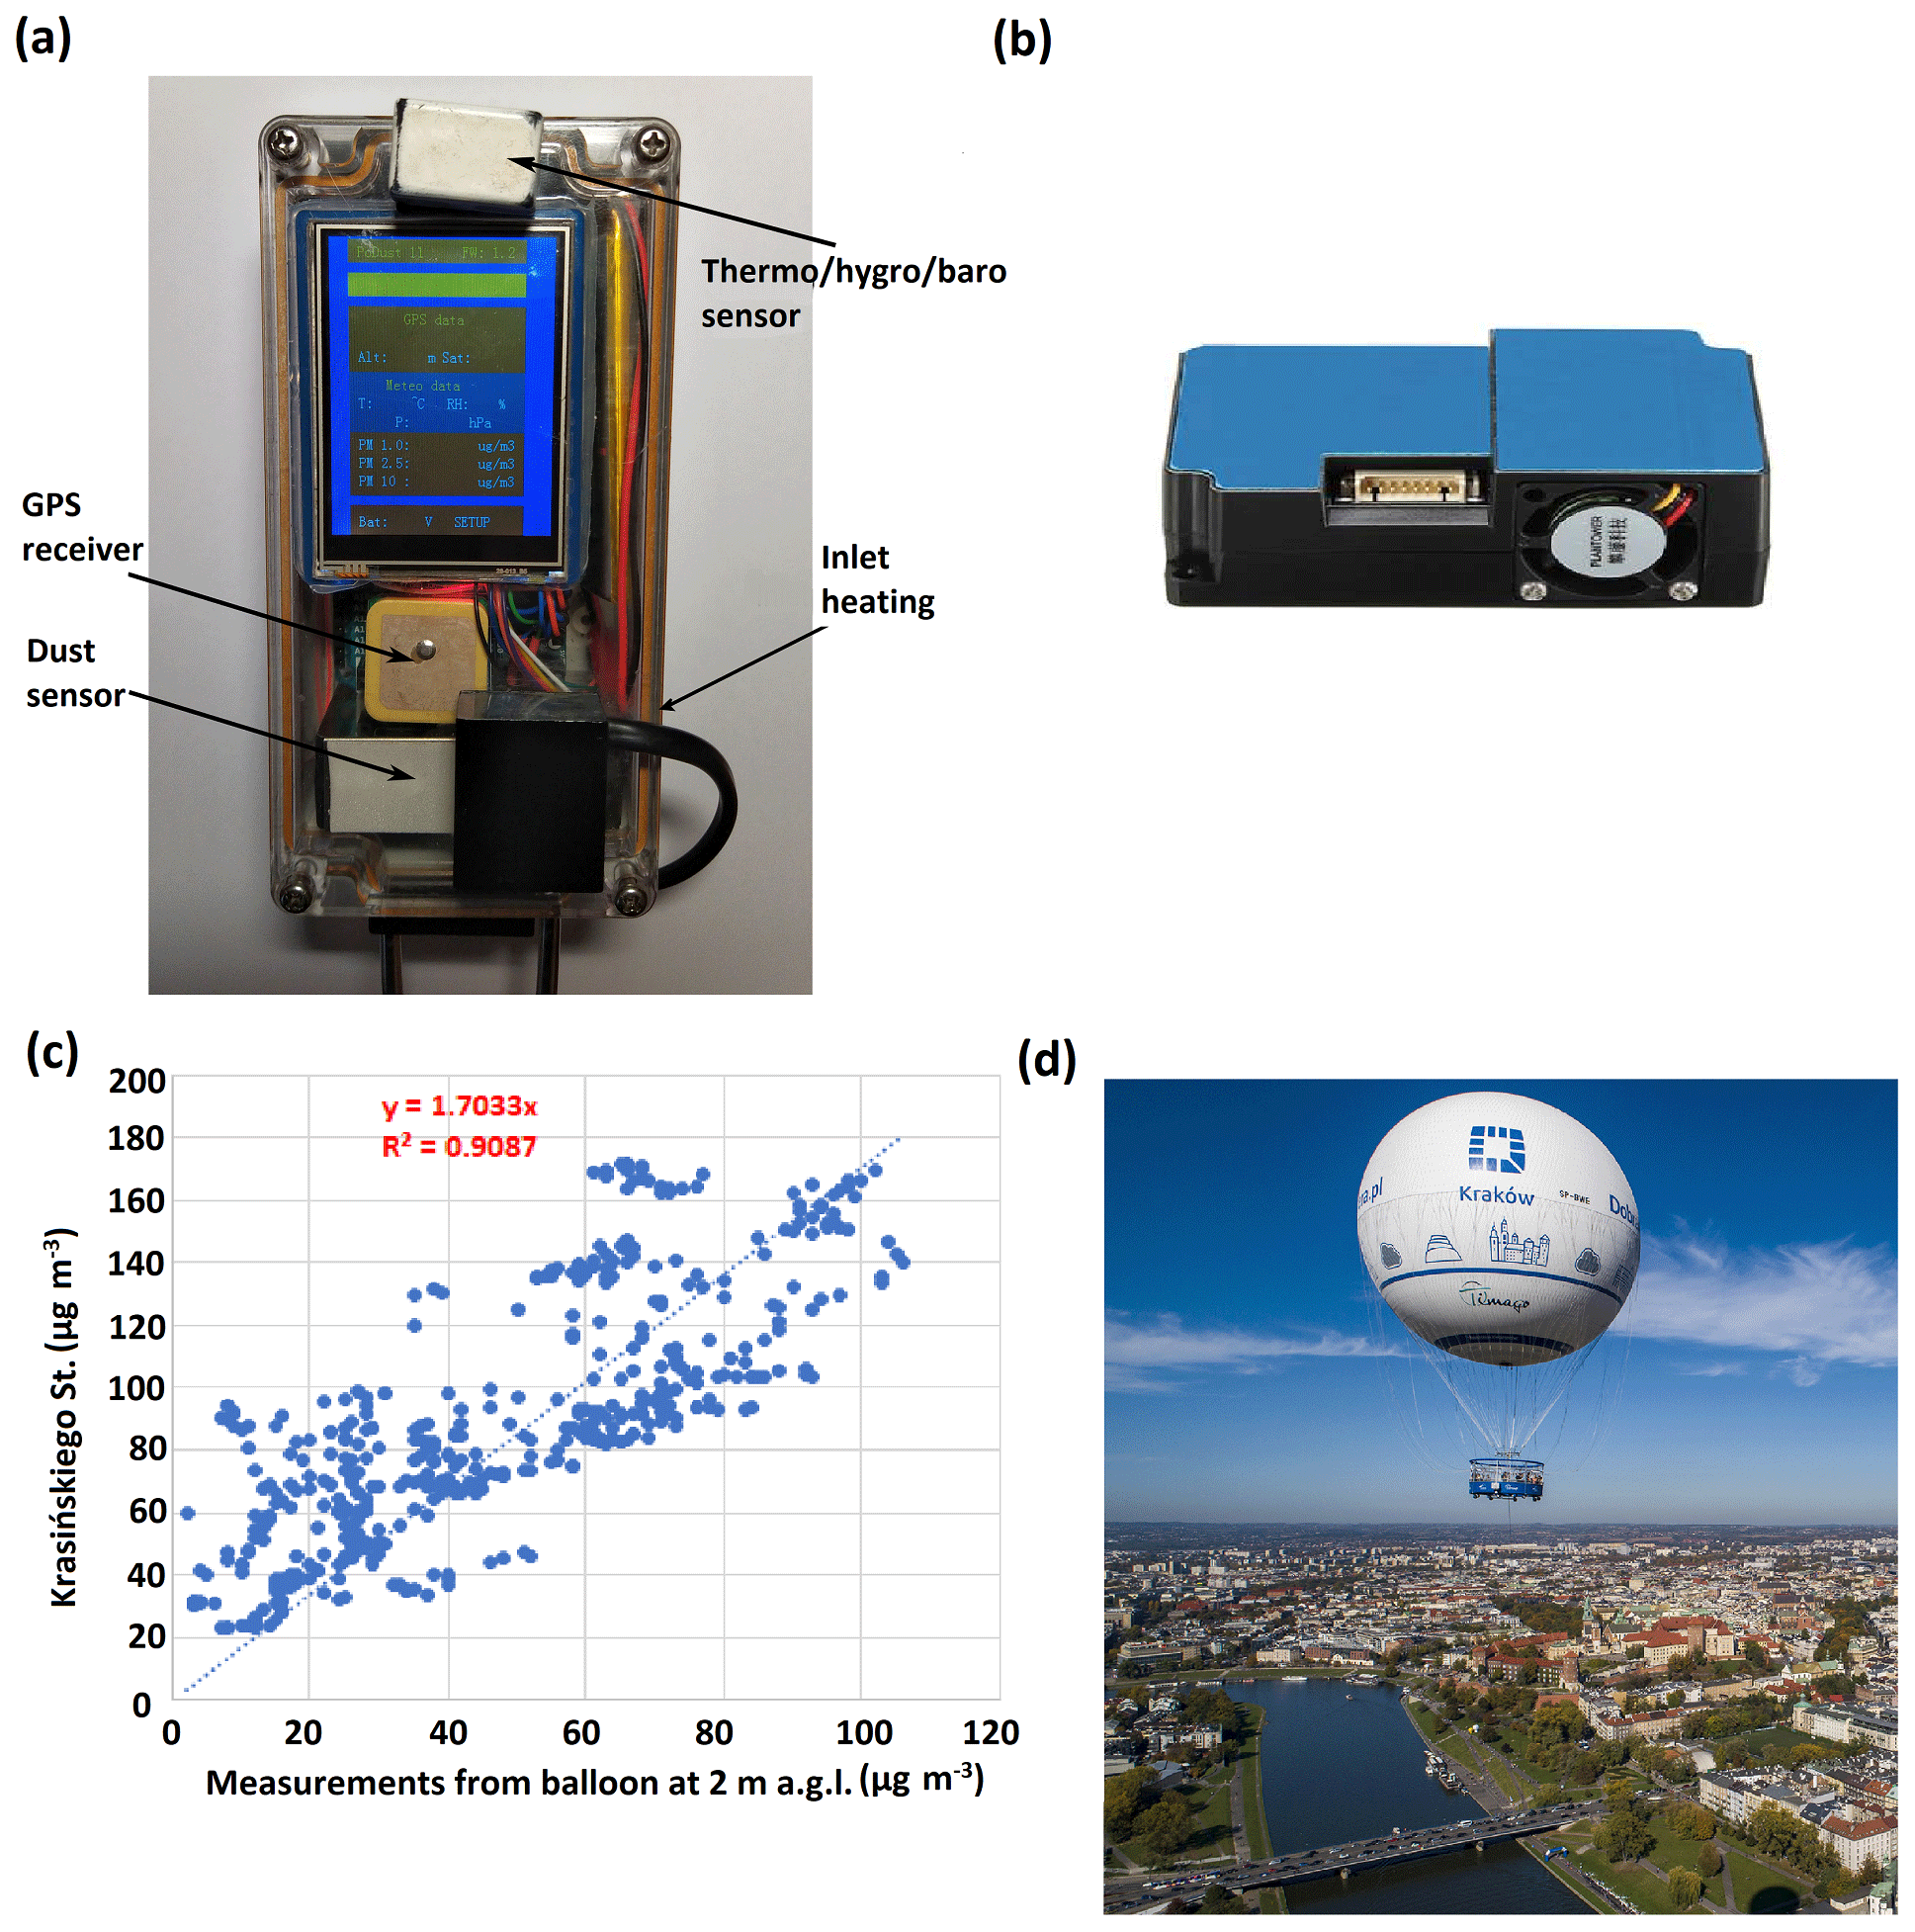
Figure 3Self-designed and built air pollution measuring system (a), low-cost sensor Plantower PMS1003 PM component (b), correlation of measurements from balloon location and closest air pollution station (Krasińskiego St.) with fitted regression curve and R squared factor (c) and (d) sightseeing balloon (source: http://balonwidokowy.pl, last access: 21 April 2021).
Data on meteorological conditions, on synoptic and local scales, for Kraków for days with balloon flights were obtained from the meteorological stations already mentioned above and additionally from two stations administered by the Jagiellonian University (JU) (Campus JU, Botanical Garden) and one station administered by IMWM-NRI (Kasprowy Wierch, in the Tatra Mountains). The JU also administers measurements at the television tower (the technical details can be found in Bokwa, 2010); the tower belongs to the Emitel company.
Due to the possible effect of foehn occurrence on ABL modification, potential foehn occurrence was determined based on the criteria of Ustrnul (1992) and on the analysis of the measurement data from the synoptic stations Kasprowy Wierch (wind speed and direction) and Balice (wind speed and direction and air humidity). One of the criteria determining foehn occurrence in Kraków is the presence of altocumulus lenticularis clouds (Ac len), which are one of the effects of mountain waves. Information about Ac len cloud occurrence was obtained from the station in the Botanical Garden in Kraków. Data on air temperature in the vertical profile of the Wisła River valley were obtained from stationary measurements at the altitudes 2, 50 and 100 m a.g.l. from the TV tower located in the western part of the valley. Table 2 and Figs. 1 and 2 show the locations of the stations and the range of measurements.
Table 2Locations of meteorological stations in Kraków and its vicinities, station Kasprowy Wierch, balloon measurement point and meteorological elements used in the study.
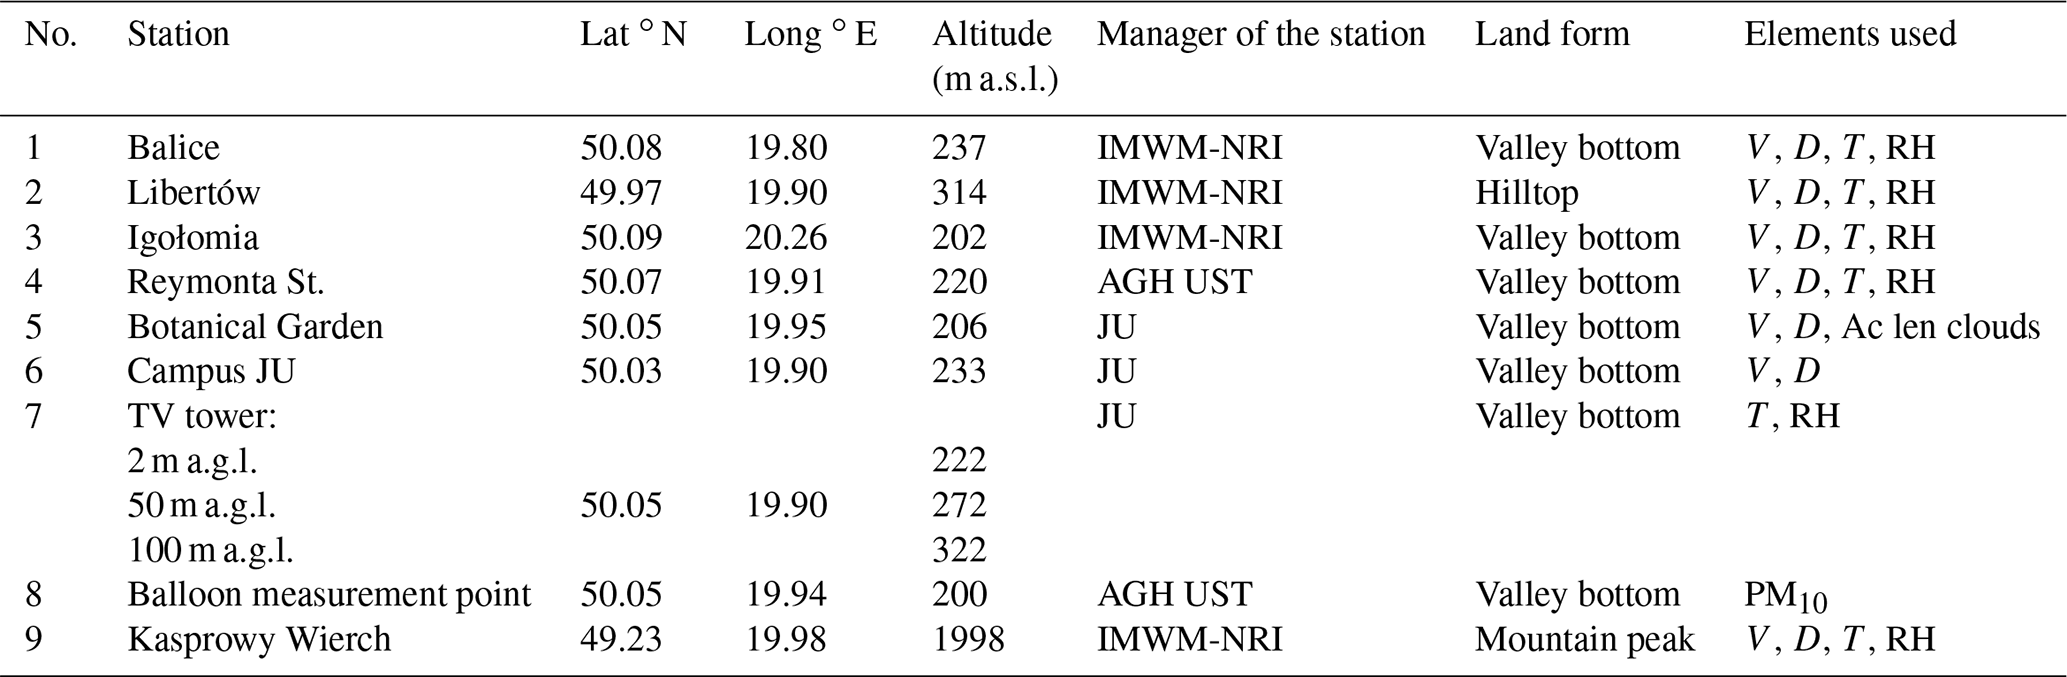
Explanations: AGH UST – AGH University of Science and Technology, JU – Jagiellonian University. More information about the measurement points administered by JU can be found in Bokwa (2010). V – wind speed, D – wind direction, T – air temperature, RH – relative humidity.
For the analysis of case study data, a different model configuration was used than for background data from the two cold seasons. Non-operational configuration of the AROME CMC 1 km × 1 km CY43T2 (AROME CMC 1 km) was applied. Operational model ALARO CY43T2 was used to prepare lateral boundary data for AROME model version CY43T2. Non-hydrostatic model AROME CMC 1 km has a horizontal resolution of 1 km × 1 km and 87 vertical levels; the forecast length was 30 h. The size of the AROME CMC 1 km domain was 810×810 points centered on geographical point 20∘ E, 50∘ N. The location of the lowest model level is at 9 m a.g.l., and the model top is located at 50 km a.g.l. Details concerning the height of the lowest model levels up to 3 km altitude, information about parametrization schemes used in the AROME model and a topographic map of the model domain are included in Tables A1 and A2 and Fig. A2. The data obtained with the model were used to provide vertical profiles of wind speed and direction, air temperature, relative humidity and turbulent kinetic energy (TKE) with 1 h temporal resolution in the points representative of the western, central and eastern parts of the city, corresponding to the measurements in Balice, Bulwarowa St. and the balloon measurement point, respectively. Additionally, N–S cross sections through the valley at those points were obtained for the same elements. For selected cases, wind, TKE and air temperature fields at selected levels were obtained for the whole area of Kraków and its surroundings.
Verification of forecast results of AROME CMC 1 km was performed for 24 h periods (i.e. from the 6th to 29th hours of forecast with 1 h resolution) for the selected 31 d of the case study period. Data obtained from four meteorological stations (Balice, Libertów, Igołomia and Reymonta St.) were used to verify the model forecast of air temperature, air humidity and wind components in the valley bottom and at the hilltop. The values of the root mean square error (RMSE) between observation and forecast were lower than 2 ∘C for air temperature, 1.5 m s−1 for wind speed and 14 % for relative humidity at all the meteorological stations. Air temperature and humidity measurements at 50 and 100 m a.g.l. from the TV tower station were used to verify model forecast of atmosphere stratification in the western part of the Wisła River valley. Values of RMSE and difference (bias) for air temperature and humidity for both altitudes (i.e. 50 and 100 m) are similar: on average RMSE was equal to 1.5 ∘C for air temperature and 9.5 % for relative humidity.
Data analysis for the background period (i.e. two cold seasons) included calculation of standard characteristics for particular elements studied in order (1) to determine their spatial variability in the study area, (2) to define wind shear conditions, and (3) for further use in the verification of the representativeness of the case study period. The indices used included wind roses for the ground stations, wind speed histograms for three levels (50, 100 and 200 m a.g.l.), air temperature gradients, differences in PM10 concentrations between the stations, and the correlation between PM10 concentrations and wind speed.
The analysis of vertical profiles of PM10 concentration for individual days of the measurement campaign indicated that there were three characteristic vertical profiles of PM10 concentration.
-
Group I: a profile with constant bracing throughout the vertical profile (slight fluctuations)
-
Group II: a profile with a significant linear decrease in concentration from the ground level up to a certain height
-
Group III: “S”-shaped profile (sigmoid curve)
For the case study period, first the PM10 concentration vertical profiles were classified with a subjective method of fitting the sigmoid curve to each vertical profile. For this purpose, the logistic curve was used which was determined by the equation
where b is the slope around the inflection point, c is the lower asymptote, d is the higher asymptote, and e is a parameter determining the X value producing a response half way between d and c. The parameter b can be positive or negative and, consequently, Y may increase or decrease as X increases.
In the first step, all possible parameters b, c, d, and e were determined. If the lower asymptote c was below 0, the fitting curve was repeated with a default value of parameter c equal to 0 (minimum PM10 concentration in the atmosphere).
Additionally, in order to better analyse the S-shaped fitted curve, a linear curve was fitted close to the inflection point to determine the intersection with the asymptotes c and d (variables y1 and y2). Differences between y1 and y2 represented transition layer depth.
In order to separate vertical profiles into the three groups, boundary conditions were determined.
-
Group I: PM10 concentration at the ground layer (below 10 m a.g.l.) was lower than 30 µg m−3 (275 vertical profiles) or the difference between PM10 concentration at the ground layer and in the upper layer (i.e. close to the maximum flight altitude) was less than 25 µg m3 (208 vertical profiles).
-
Group II: the difference between PM10 concentration at the ground layer and in the upper layer was greater than 25 µg m3 and variable y2 was in the range [] m a.g.l. (determined experimentally for this data set) (17 vertical profiles).
-
Group III: the difference between PM10 concentration at the ground layer and in the upper layer was greater than 25 µg m3 and the variable y2 was greater than 30 m a.g.l. (134 vertical profiles).
Figure 4 presents an example of vertical profiles from Groups II and III with a fitted sigmoid curve and variables b, c, d, e, y1 and y2. It should be mentioned that fitting the sigmoid curve to vertical profiles of PM10 concentration is useful in the analysis due to the estimation of the PM10 concentration in the upper layer (by assuming that the vertical profile of the parameter has a shape consistent with the function) and determination of the transition layer.
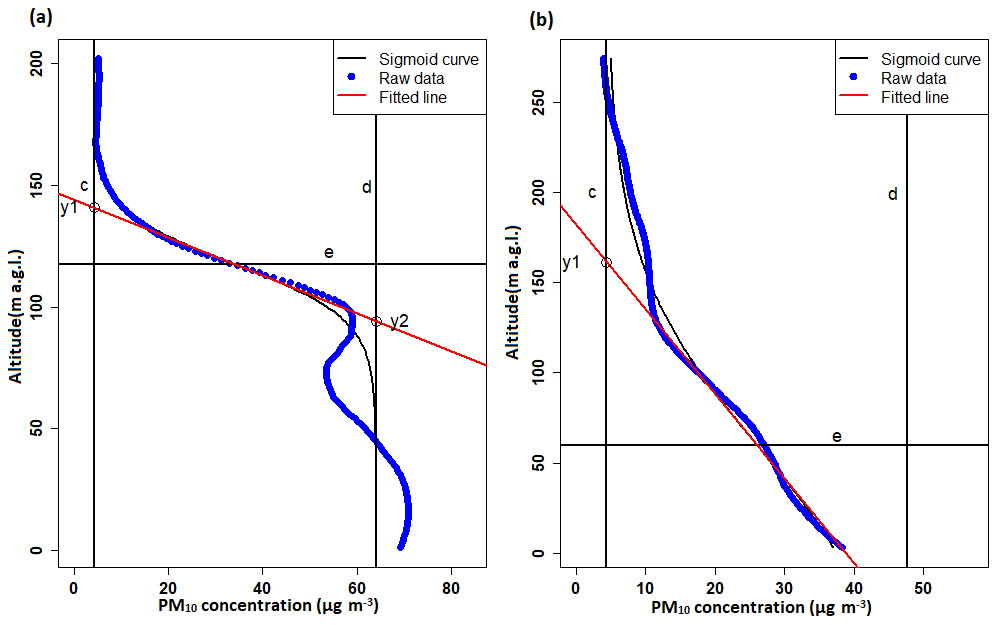
Figure 4Vertical profiles of the PM10 concentration with the fitted sigmoid curve and estimated optimal parameters representing the “S”-shaped profile, group III (a), and significant linear decrease from ground level, group II (b).
Three groups/patterns of PM10 concentration vertical profiles were obtained, and for each of them all meteorological data were analysed in order to determine their significance in controlling the air pollution vertical structure.
4.1 Spatial and temporal variability of anemological conditions
Analysis of the data on wind speed and direction from three meteorological stations in the Wisła valley (Balice, Reymonta St., Igołomia) and one station at the nearby hilltop (Libertów) for the two cold seasons (September 2018 to April 2019 and September 2019 to April 2020) indicated significant spatial variability of that element due to the complexity of the land forms and the presence of urban structures. However, the differences of the wind structure between both seasons were negligible. In terms of spatial variability, the average frequency of weak wind (up to 2 m s−1) varied from 43 % in Balice to 61 % in Reymonta St.; in Libertów and Igołomia the values reached 50 % and 53 %, respectively. For the wind speed ≥4 m s−1, the highest average frequency was measured in Balice (27 %), while in Libertów and Reymonta St. it did not exceed 10 %, and in Igołomia it reached 21 %. Wind speed ≥10 m s−1 was noted in Igołomia and Balice only. Dominant wind directions are strongly linked to the relief impact. In Balice those are SW and NE, in Igołomia and Reymonta St. W and E, and in Libertów it is the western sector: SW to WNW (Fig. A3).
Similar calculations were also performed for the case study period, i.e. 31 d during which the flights were conducted, within the period from 28 November 2019 to 3 March 2020, in order to check whether these results can be treated as representative of the whole cold period. The frequency of wind speed ≤ 2 m s−1 was much larger than the average value for both seasons, from 62 % in Balice to 83 % in Reymonta St., while the frequency of wind speed ≥ 4 m s−1 was much smaller, from 0.1 % in Reymonta St. to 7.9 % in Balice. Dominant wind directions for the case study period did not differ significantly from the average values for both seasons. Therefore, the case study period can be considered to represent days with very low wind speed at the station level.
On the basis of archival forecasts of the AROME operational model, the characteristics of vertical wind profiles in the valley for four points located in the valley bottom in a W–E cross section (i.e. Balice, TV tower, city centre, and Bulwarowa St.), for the two seasons, were examined at three levels, 50, 100 and 200 m a.g.l., and for every hour of the day. The analysis did not show significant differences between the seasons. For nearly 50 % of the cases, the velocity at 50 m a.g.l. in the valley did not exceed 4 m s−1. Wind speed at levels 100 and 200 m a.g.l. did not exceed 10 and 12 m s−1 for more than 90 % of the cases, respectively.
Wind direction forecasts at the three levels were used to analyse the frequency of significant wind direction change in the vertical profile (wind shear) between levels 50 and 100, 100 and 200 and 50 and 200 m a.g.l. The minimum value of significant wind direction change between two vertical levels was set to 20∘ on the basis of analyses. Wind shear studies were performed for diurnal (i.e. 06:00 to 17:00 UTC) and nocturnal (i.e. 18:00 to 05:00 UTC) periods. For the point representing the city centre and located close to the balloon sounding site, for both cold seasons, the percentage of wind shear which lasted more than 4 h (between levels 50 and 200 m a.g.l.) equalled 9.5 % and 31.9 % during daytime and nighttime, respectively. The values for the case study period reached 42 % and 52 %, and for the wind shear which lasted over 4 h it was 23.7 % and 46.2 %.
On the basis of the above comparisons, it is possible to conclude that on the days which belong to the case study period, wind speed was much lower than on average during both cold seasons, while wind shear occurred much more frequently.
4.2 Spatial and temporal PM10 concentrations' variability
The analysis of data on PM10 concentration from all monitoring points operated by NIEP and described in Sect. 3, from both cold periods analysed, was performed in order to determine to what extent the measurements of the PM10 vertical profile realized close to the city centre, in the western, narrow part of the valley, are representative of other areas of the city. First, significant differences were found between both of the analysed cold seasons: in the season 2019–2020, the mean concentrations were lower than in the previous cold season at all stations, except Bulwarowa St. The number of days with mean daily concentration ≤ 50 µg m−3 increased by as much as 15 % in Kurdwanów district and Dietla St., with a simultaneous decrease in the number of days with mean daily concentration 50–100 (−10 % in Kurdwanów district and −8 % in Dietla St.). The number of days with an average daily concentration ≥ 50 µg m−3 in the season 2019–2020 ranged between 35 and 63 for most of the stations except Krasińskiego St., located close to the balloon site, where the number of such days was equal to 101. In the season 2019–2020, days with a mean daily concentration of 100–150 µg m−3 occurred at four stations only, Krasińskiego St.: 14 d, Bulwarowa St.: 7 d, Kurdwanów district: 4 d, and Złoty Róg St.: 3 d, while in 2018–2019, such high concentrations occurred almost at the same stations, but the numbers were significantly higher, e.g. 28 d in Krasińskiego St. and from 12 to 14 d in Złoty Róg St., Dietla St., and Kurdwanów district. The maximum PM10 hourly concentration reached 378 µg m−3 in Dietla St. on 18 February 2019. Therefore, it can be stated that the western part of the city, located in the narrow part of the valley floor, experiences much worse air pollution concerning PM10 than the eastern part, located in the wide part of the valley. The vertical PM10 measurements can be then considered representative of the western part of the valley.
As weak winds prevailed during the case study periods, hourly PM10 concentrations were analysed for particular wind speed ranges, and wind measurements from Reymonta St. were used (i.e. representative of the western part of the city). Concerning high PM10 levels, which are the most dangerous for human health, the percentage of the cases with wind speeds below 1 m s−1 (during both the cold seasons) when the concentration was higher than 100 µg m−3 varied from 7.3 % (Wadów district), 10 %–11 % (Dietla St., Bulwarowa St. and Piastów district), 13.6 % at Złoty Róg St., to 15.3 % at Kurdwanów district and 25.7 % at Krasińskiego St. For cases ≥ 150 µg m−3, the values varied from 0.7 %–0.8 % (Bulwarowa St., Piastów and Wadów district), 1.6 % at Dietla St., 1.9 % at Złoty Róg St., to 4.1 % at Kurdwanów district and 5.7 % at Krasińskiego St. The data show large differences in PM10 horizontal distribution within the city and a relatively high frequency of PM10 dangerous concentrations, as high as double the allowed mean daily level.
Figure A4 shows the correlation between PM10 concentrations at individual air pollution stations and the wind speed at Reymonta St. The logarithmic curves were fitted to the data.
Due to the fact that PM10 levels differ significantly between the two cold periods analysed (i.e. 2018–2019 and 2019–2020), PM10 data for the case study period were compared with the data for the whole season 2019–2020 only in order to check their representativeness for the season. During the case study period, hourly PM10 concentrations ≤ 50 µg m−3 reached from 23 % for Krasińskiego St. to 50 %–60 % for the Dietla St., Piastów and Wadów districts, while during the whole cold season 2019–2020 they were much more frequent and varied from 57 % for Krasińskiego St. to over 80 % for the Dietla St., Piastów and Wadów districts. In parallel, values ≥ 150 µg m−3 for most of the stations were up to 3 % (with a minimum in Dietla St. 0.4 %), but in Krasinskiego St. they reached 7 %, while for the whole season the highest value was 1.3 %. That means that the case studies represent not only the conditions with much lower wind speed than the seasonal average, but also the conditions with a much higher PM10 level than on average.
4.3 Vertical air temperature gradient
Based on the high-resolution forecasts of the AROME CMC 1 km model, an analysis of the vertical temperature gradient between the model level 50 and 220 m a.g.l. for the city centre, for the case study period, against the background data from two cold seasons, has been performed. The presence of a thermal inversion is an important factor which limits the PM10 dispersion conditions and therefore contributes to its high levels. The gradient values were calculated separately for the daytime (06:00–17:00 UTC) and nighttime (18:00–05:00 UTC), as the phenomenon is usually much more frequent during the nighttime than the daytime. The frequency of a gradient greater than 0.5 ∘C/100 m (i.e. thermal inversion) in the nighttime was rather similar in the case study period (48 %) and in the cold seasons (38 %), while during the daytime, the value for the case study period was much larger than for both seasons (32 % and 7 %, respectively). This means that during the study period, the inversions were much more frequent than on average in the cold season, which contributed to the much higher PM10 concentrations mentioned above.
The frequency of thermal inversion is linked to wind speed (Table A3). An analysis of the temperature gradient versus wind speed at 50 m a.g.l. was performed for the both cold seasons, jointly. The studies indicated that for wind speed < 2 m s−1 the frequency of the gradient greater than 0.5 ∘C/100 m was 45 %, and for wind speed 2–4 m s−1 it decreased to 31 % of the cases. High PM10 concentrations in the study period were then the effect of joint impact of low wind speed and thermal inversion, generated by the city location in the concave land form.
4.4 Vertical profiles of PM10 concentration
There were three types of PM10 vertical profiles distinguished (Fig. 5):
-
type I – almost constant value of PM10 concentration in the vertical profile (small fluctuations, weak decrease);
-
type II – strong decrease in PM10 concentration in the vertical profile;
-
type III – the occurrence of three layers of PM10 concentration: (1) constant concentration in the lower part of the profile, (2) transition layer above, and (3) the upper layer where a sudden drop in PM10 concentration is observed.
Out of 31 analysed days, type I was observed on 27 d, type II on 8 d and type III on 13 d. For 10 out of 31 d, two types of profiles were observed on 4 d and all three types on 6 d (Table A4). Occurrence of different profile types during a single day indicates significant fluctuations of meteorological conditions.
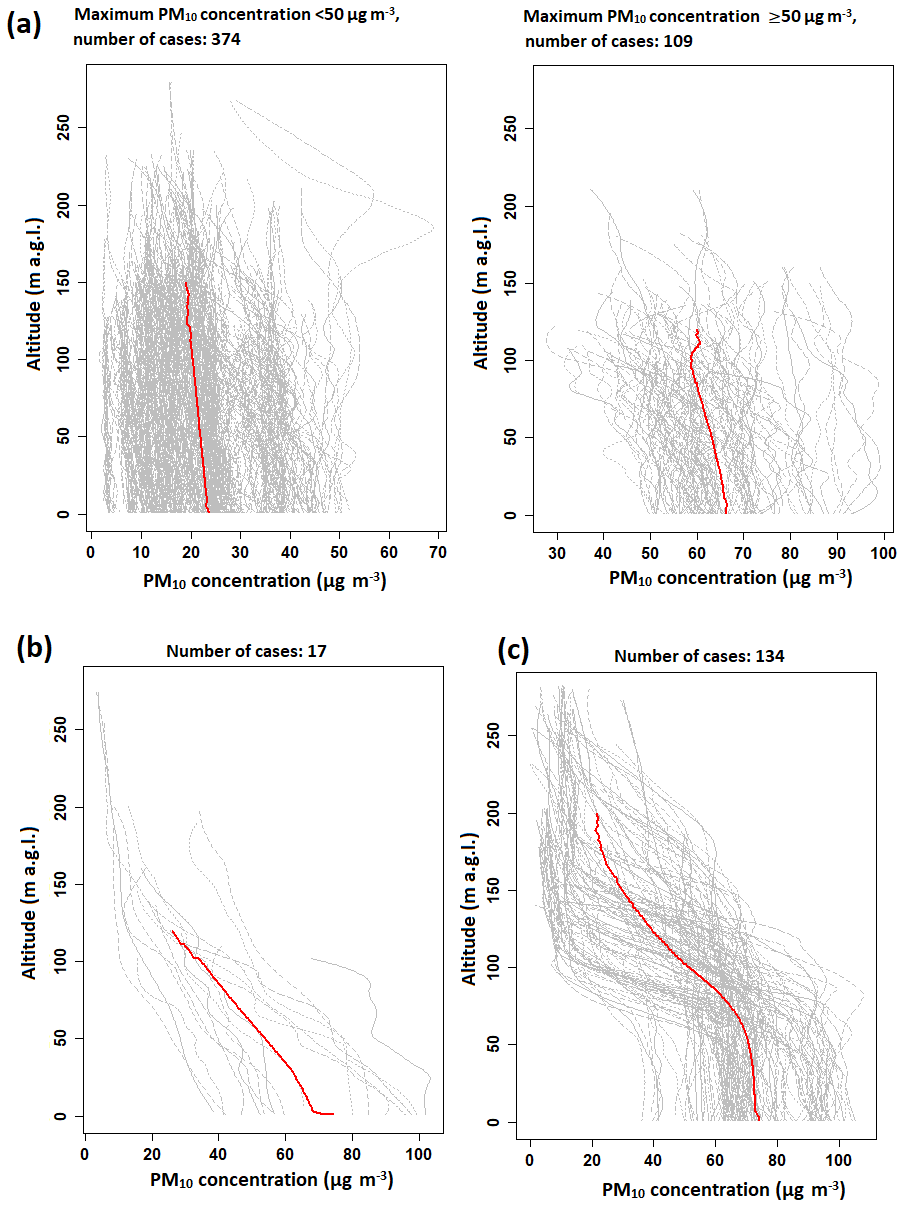
Figure 5Classification of PM10 vertical profiles into the three main types: (a) type I (it is presented in two plots due to a wide range of PM10 concentration values); (b) type II; (c) type III. Explanations: grey lines – individual vertical profiles of PM10 concentration; red lines – mean profiles of a certain type.
Vertical profiles assigned to type III differ a lot in the position and thickness of the transition layer. The dominant pattern in Fig. 5c is characterized by a sudden drop in pollution at the valley top which is about 100 m a.g.l. The transition layer was further determined by using variables y1 and y2 estimated from the sigmoidal curve fitted to the data (Sect. 3.3).
Figure 6 presents characteristics of the transition layer for all selected vertical profiles.
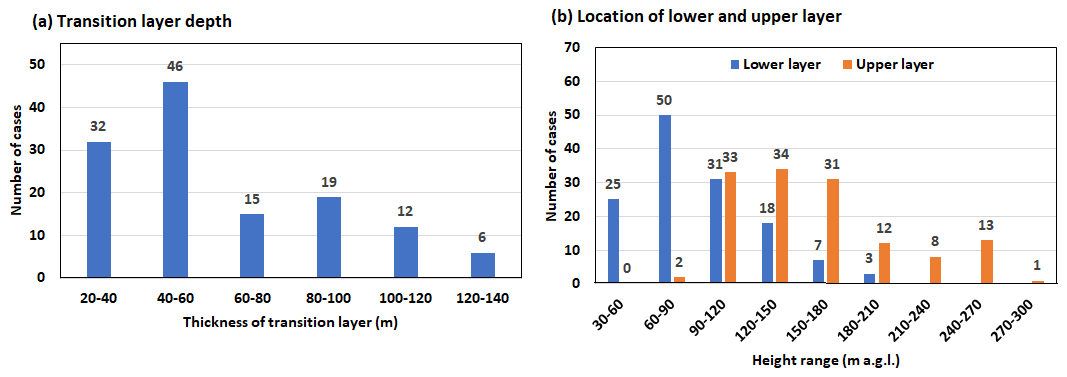
Figure 6Characteristics of the transition layer in the vertical profiles of PM10 concentrations in type 3.
It should be noted that the vertical profiles in type I could have been the lower part of profiles of type III; the low flight maximum altitude, associated with the occurrence of a strong wind, did not allow us to continue the measurements higher and verify the hypothesis.
4.5 Impact of relief and meteorological conditions on PM10 concentration vertical profiles
4.5.1 Type I
On 18 out of 27 d analysed, mechanical and thermal turbulence led to strong convection. However, the effect of mechanical turbulence was a quick increase in convection-layer thickness during the day, followed by its sudden decrease in the evening, while thermal turbulence caused gradual development of the convection layer and its lower thickness. The upper limit of the convection layer was defined with the application of TKE profiles and reached 300–500 m a.g.l. The flights' heights on those days did not exceed those values, which was the reason for the almost constant PM10 concentration observed.
On 5 out of 27 d analysed, the convection layer was controlled by the thermal turbulence. Its thickness did not exceed 200 m a.g.l., and wind shear was observed above, but the flights reached only 150 m a.g.l. Therefore, the upper layer with – most probably – much lower PM10 concentrations could not be observed. Such a scenario is an example of a modification of the turbulence at the top of CBL, i.e. a reduction of vertical mixing efficiency by wind shear, presented e.g. in Rodier et al. (2017).
4.5.2 Type II
The sudden decrease in PM10 concentration with height in profile type II was an effect of two processes: an increase in pollutant emission near the ground and removal of the pollution from the upper layers. The latter was due to mechanical turbulence caused by the presence of the wind shear. The wind shear was the effect of an increase in wind speed in the vertical profile close to the valley top and significant wind direction change in the vertical profile starting from close to the ground layer caused by the complex topography impact (6 of 8 selected days). Sudden decrease in PM10 concentration at all selected days was observed at evening hours (on 17 December 2019, also at morning hours) after weakening of convection movements and wind speed close to the ground. During 1 d out of 8 d selected, the occurrence of turbulence was caused by the presence of mountain waves which strongly modified convection movements. The analysis of the flights showed that vertical distribution of PM10 concentration characterized by a significant decrease with height starting from close to the ground level was a short-time phenomenon which can occur during e.g. a momentary lack of convective movements or a passage of an atmospheric front.
The case study of 27 January 2020 is presented below as an example of the processes described above (Figs. 7–8). In the early morning hours until 09:00 UTC, there was a humid cold pool in the valley, and drier and warmer air moved over the valley from the west. Between 06:00 and 12:00 UTC, there was a gradual break of the inversion and a decrease in humidity in the profile observed at 50 and 100 m a.g.l. at the tower station (Fig. 7b, c). Until 12:00 UTC, the PM10 concentration at the ground stations did not change significantly (Fig. 7d); after 12:00 UTC an increase in PM10 concentration was visible in the vertical profile. The increased concentration of PM10 at Krasińskiego St. compared to other stations was maintained until 17:00 UTC. The difference in concentration between the ground-level measurement from the balloon point and Krasińskiego St. was in the range of 50–70 µg m−3 for most of the time.

Figure 7Vertical profiles of PM10 concentration (a), vertical profiles of air temperature (b) and (c) relative air humidity from the TV tower and (d) hourly concentration of PM10 in air pollution from ground-level measurements during balloon soundings on 27 January 2020. Explanation: valley depth is the altitude of the hilltops surrounding the valley marked at 100 m a.g.l. with a dashed line in (a).
Figure 8 presents vertical profiles of wind shear direction and speed, calculated with the data from two neighbouring vertical levels, for the measurement period from 10:00 to 16:00 UTC on 27 January 2020. Wind speed components from the first 14 vertical levels (Table A1) from AROME model analysis were used in those calculations. Analysis of vertical profiles of wind shear for the period 10:00–13:00 UTC indicates that in the layer 120–150 m a.g.l., wind speed in the vertical profile increased significantly, and above this layer there was a sudden change in wind direction in the vertical profile. The height of local maximum of wind shear speed coincides with the maximum altitude of balloon flight (from 100 m a.g.l. at first flight to 150 m a.g.l. from the second to fifth flights).
Vertical profiles of TKE indicated that convection layer during this day reached up to 200–220 m a.g.l.; isolines of TKE equal to 0.01 and 0.04 m2 s−2 are presented in Fig. 8e. Flights between 10:00 and 14:00 UTC indicated a constant PM10 concentration value in the profile up to 150 m a.g.l. Linear decrease in PM10 concentration above 150 m a.g.l. was noticed at higher flights around 12:30 and 14:00–14:30 UTC. The consequence of the disappearance of the convection layer (which began at 13:00 UTC) and mechanical pollution removal from the layers above the valley was visible at flights after 14:30 UTC. The strongest decrease in the concentration in the vertical profile was observed during the last flight; the height of the ground layer with stable PM10 concentration did not exceed the mean height of the buildings in the city (30 m a.g.l.), and above this layer there was a linear decrease in PM10 concentration. The decrease in concentration in the layer up to 150 m a.g.l. was related to the occurrence of a wind shear (Fig. 8d).
During the period between 13:00 and 16:00 UTC, vertical profiles of wind shear speed (Fig. 8c) in the layer up to 300 m a.g.l. did not exceed 1 m s−1 for most of the cases, while wind shear direction changed significantly in layer from ground level up to 300 m a.g.l., with visible local peaks at selected levels.
During the night, there was a separation of the valley wind and topographically channeled airflow; i.e. the wind in the valley weakened, and at the valley top the wind speed increased (Fig. 8e).
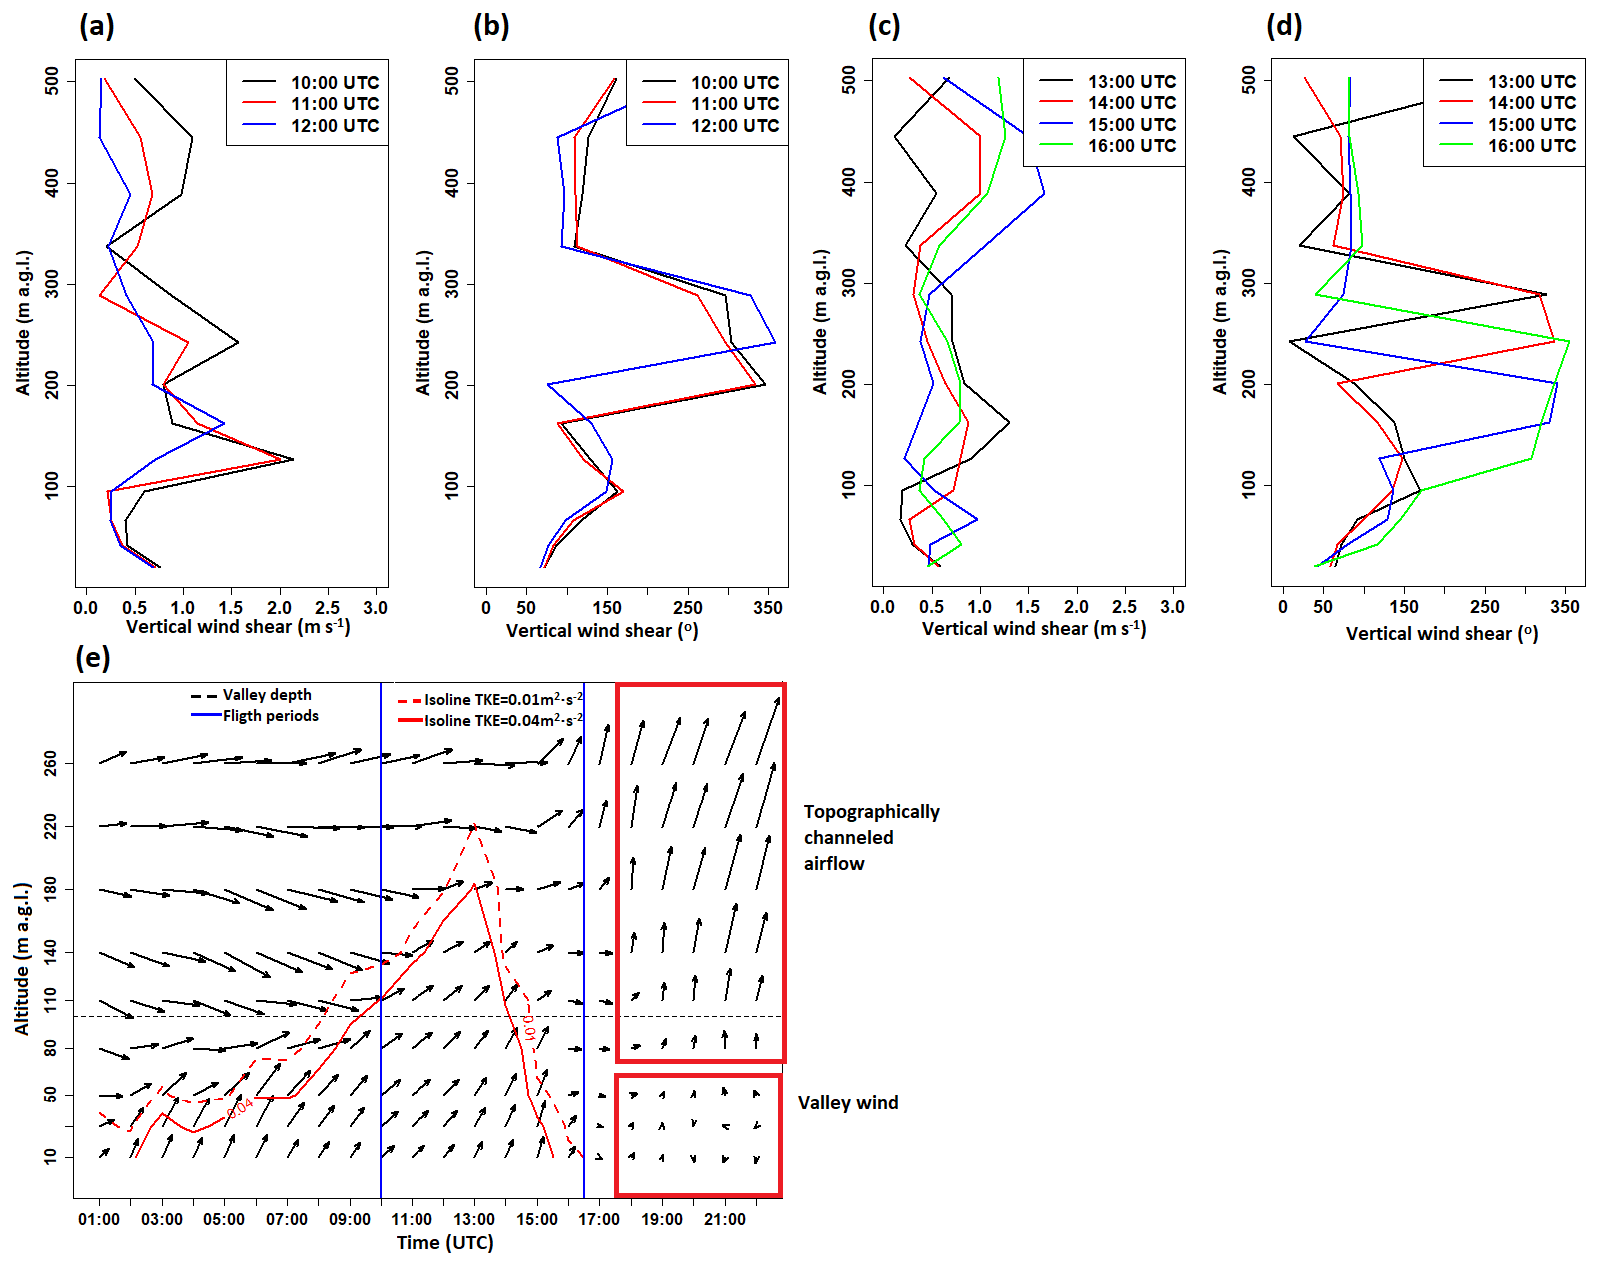
Figure 8Vertical profiles of wind shear between 10:00 and 16:00 UTC, 27 January 2020: wind shear speed (a, c) and direction (b, d). Wind profile forecast with added isolines of TKE equal to 0.01 and 0.04 m2 s−2 for the point representing the city centre. Measurement period is marked with blue vertical lines. Explanation: valley depth is the altitude of the hilltops surrounding the valley marked at 100 m a.g.l. with a dashed line in (e).
4.5.3 Type III
Type III of the PM10 concentration vertical profile was found on more than 40 % of measurement days (13 out of 31 d). The vertical wind profiles indicated that during most of the selected days a strong wind shear was observed close to the valley top (i.e. about 100 m a.g.l.) or at the upper layers. Wind shear occurred either in a thin layer (i.e. as a sudden change between two neighbouring vertical model levels, in a layer up to 50 m thick) or in a thick layer (100–200 m). The occurrence of the wind shear was also accompanied by an sudden increase in wind speed in the vertical profile (6 of 13 analysed days) or sudden change in wind direction in the vertical profile (3 of 13 analysed days), which was responsible for pollution removal from the upper layer. Wind direction observed at the lower layer was determined by the local topography (valley wind), whereas at the upper layer there was regional topographically channeled airflow. The separation of the two atmospheric layers by a strong wind shear for selected cases was reinforced by the advection of warmer air (on 8 d out of 13 analysed). In case of a cold pool occurrence in the valley (6 of 13 d), the vertical transport of air pollution was hindered by the thermal inversion intensification.
Data of 28 November 2019 were used as an example of profile type III. Vertical profiles of air humidity and air temperature measurements from the TV tower indicated the presence of a persistent ground thermal inversion intensified by warm and dry air advection from the south-west (Fig. 9a, b). On that day, foehn conditions were not met at Kasprowy Wierch and Balice stations; however, the cross section of the AROME CMC 1 km model indicated the occurrence of foehn in the south-western Western Carpathians (not shown). This phenomenon could partially contribute to the warm air advection from the south-west. Additionally, data from the air pollution measurement stations showed significant spatial variability of PM10 concentration in Kraków (Fig. 9e). The maximum hourly PM10 concentration difference between measurement points was equal to 170 µg m−3. Ground measurements at the balloon site were similar to those from Piastów district, and differences between the balloon site and Krasińskiego St. were in the range from 89 to 107 µg m−3.
Until 13:00–14:00 UTC on 28 November 2019, the AROME model predicted the occurrence of a hydraulic jump on the southern and south-western slopes of the highlands at a distance of 25–30 km from the city centre (upward air movement); this phenomenon has been presented in the SW–NE cross section (Fig. 9c–d, symbol HJ). The occurrence of hydraulic jump caused a weakening of the horizontal wind in the valley and the occurrence of a strong wind shear marked on the SW–NE cross section (Fig. 9c, marked by horizontal red line).
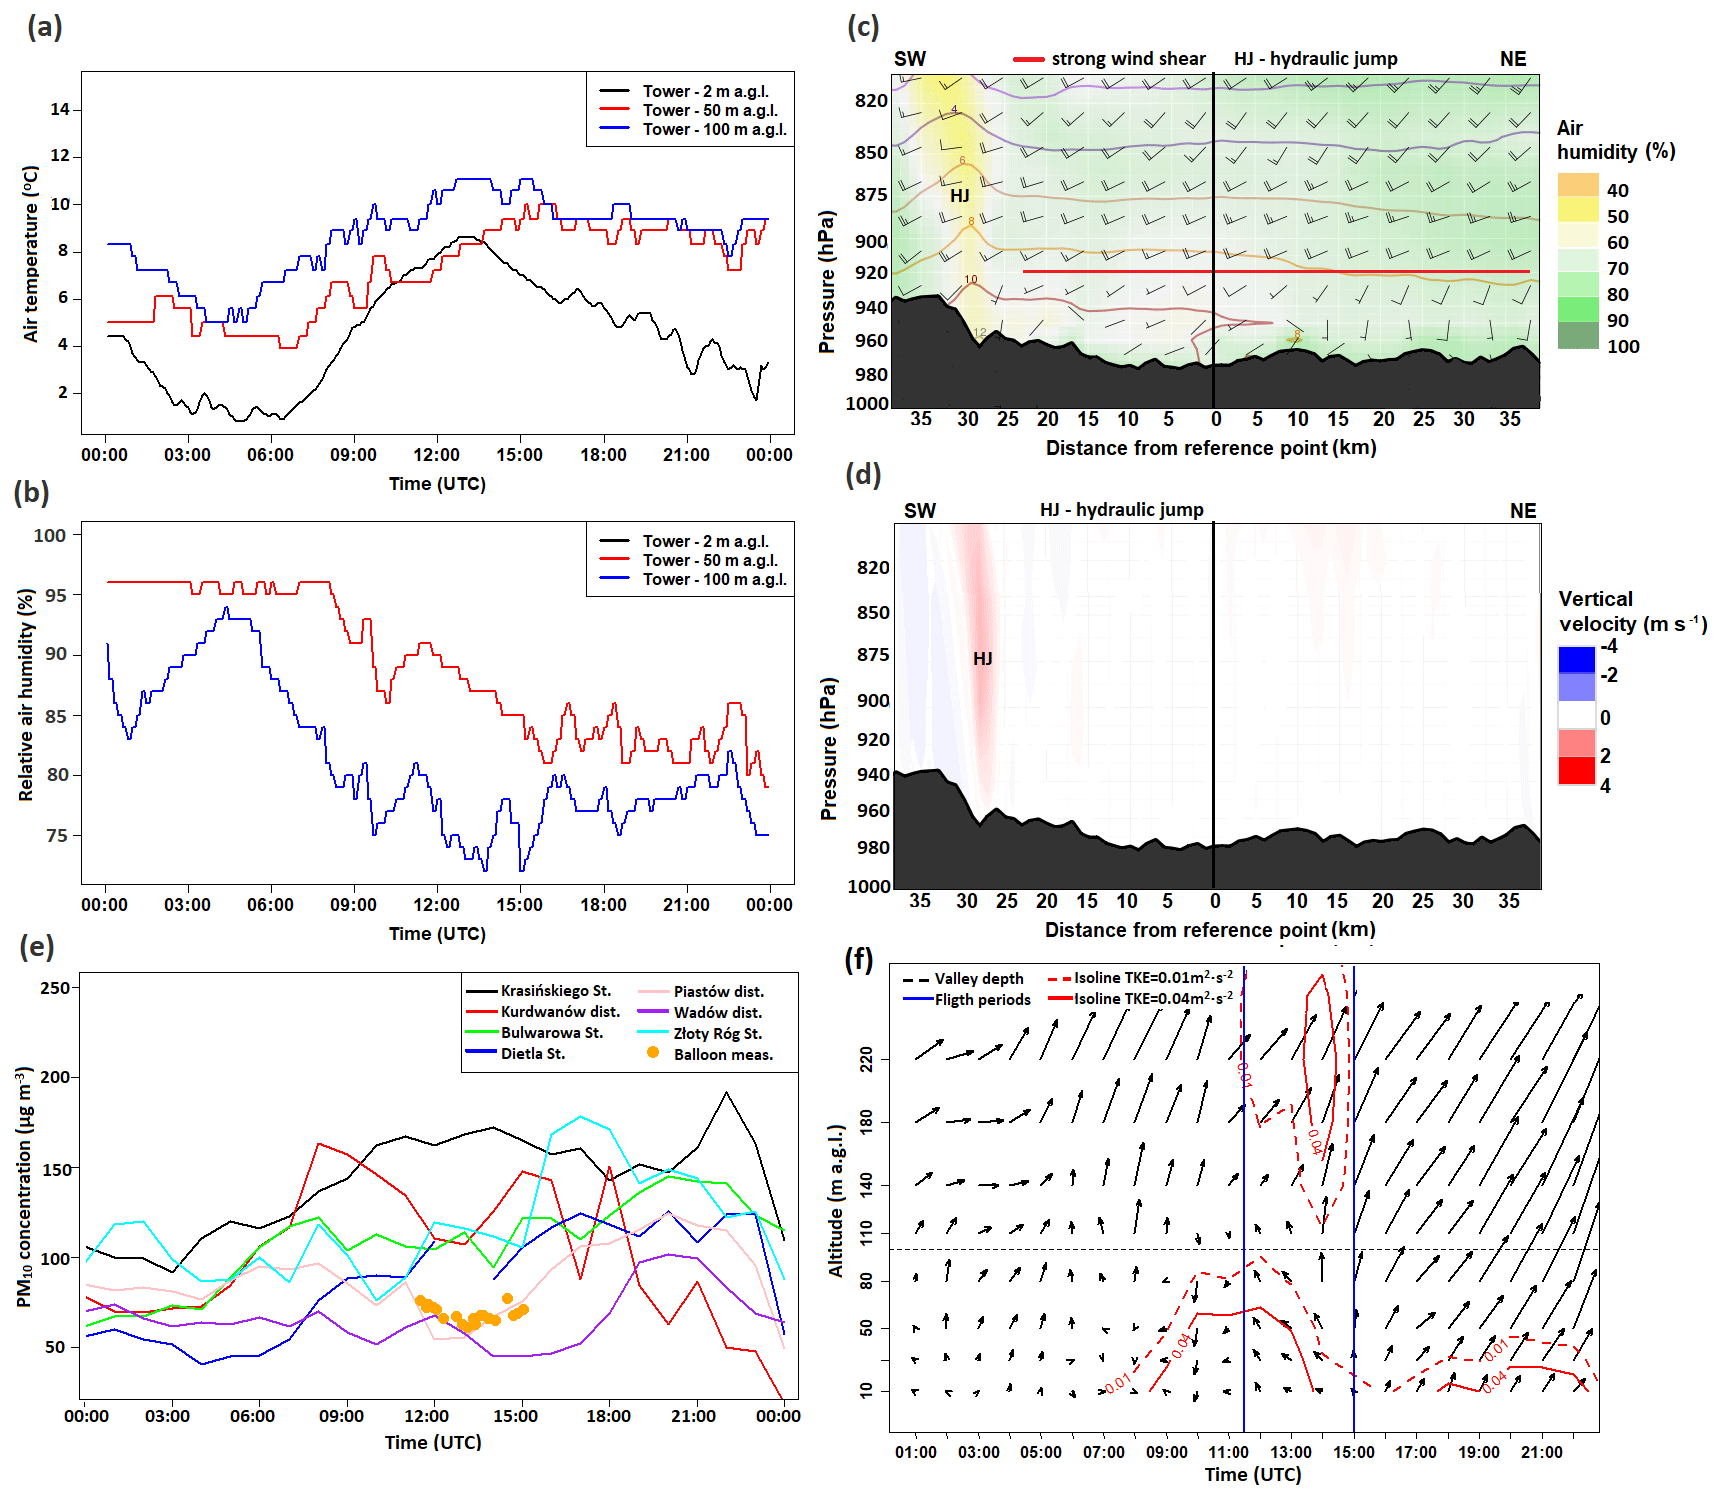
Figure 9Vertical profiles of air temperature (a) and relative air humidity (b) from the TV tower on 28 November 2019; SW–NE cross section for the city centre of air temperature (contour lines), air humidity (background), and wind speed (in knots) and direction (graphical symbols) (c) and vertical velocity (d) at 11:00 UTC 28 November 2019; hourly concentration at air pollution stations on 28 November 2019 with added ground balloon measurements (e); wind profile forecast with added isolines of TKE equal to 0.01 and 0.04 m2 s−2 for the city centre with a marked measurement campaign period by the blue vertical on 28 November 2019 (f). Explanation: valley depth is the altitude of the hilltops surrounding the valley marked at 100 m a.g.l. with a dashed line at (f); the red and blue colour scales at the cross section of vertical velocity in (d) indicate upward and downward movements, respectively.
The height of the transition layer did not exceed the valley top, and the differences between the individual vertical PM10 concentration profiles were not significant (Fig. 10a, b). The height of the transition layer was mostly determined by the height of the convection layer (the maximum predicted height of the convection layer was equal to 100 m a.g.l. at 12:00 UTC); vertical profiles of wind shear speed between 10:00 and 13:00 UTC indicated the occurrence of a local maximum value above the convection layer at ca. 130 m a.g.l. (Fig. 10c, d). The limited range of the convection layer on 28 November 2019 was the result of high cloudiness during the daytime. After 13:00 UTC the wind shear speed in a layer up to 300 m a.g.l. decreased to 1–1.5 m s−1, and the height of the local maximum decreased to 70–100 m a.g.l.
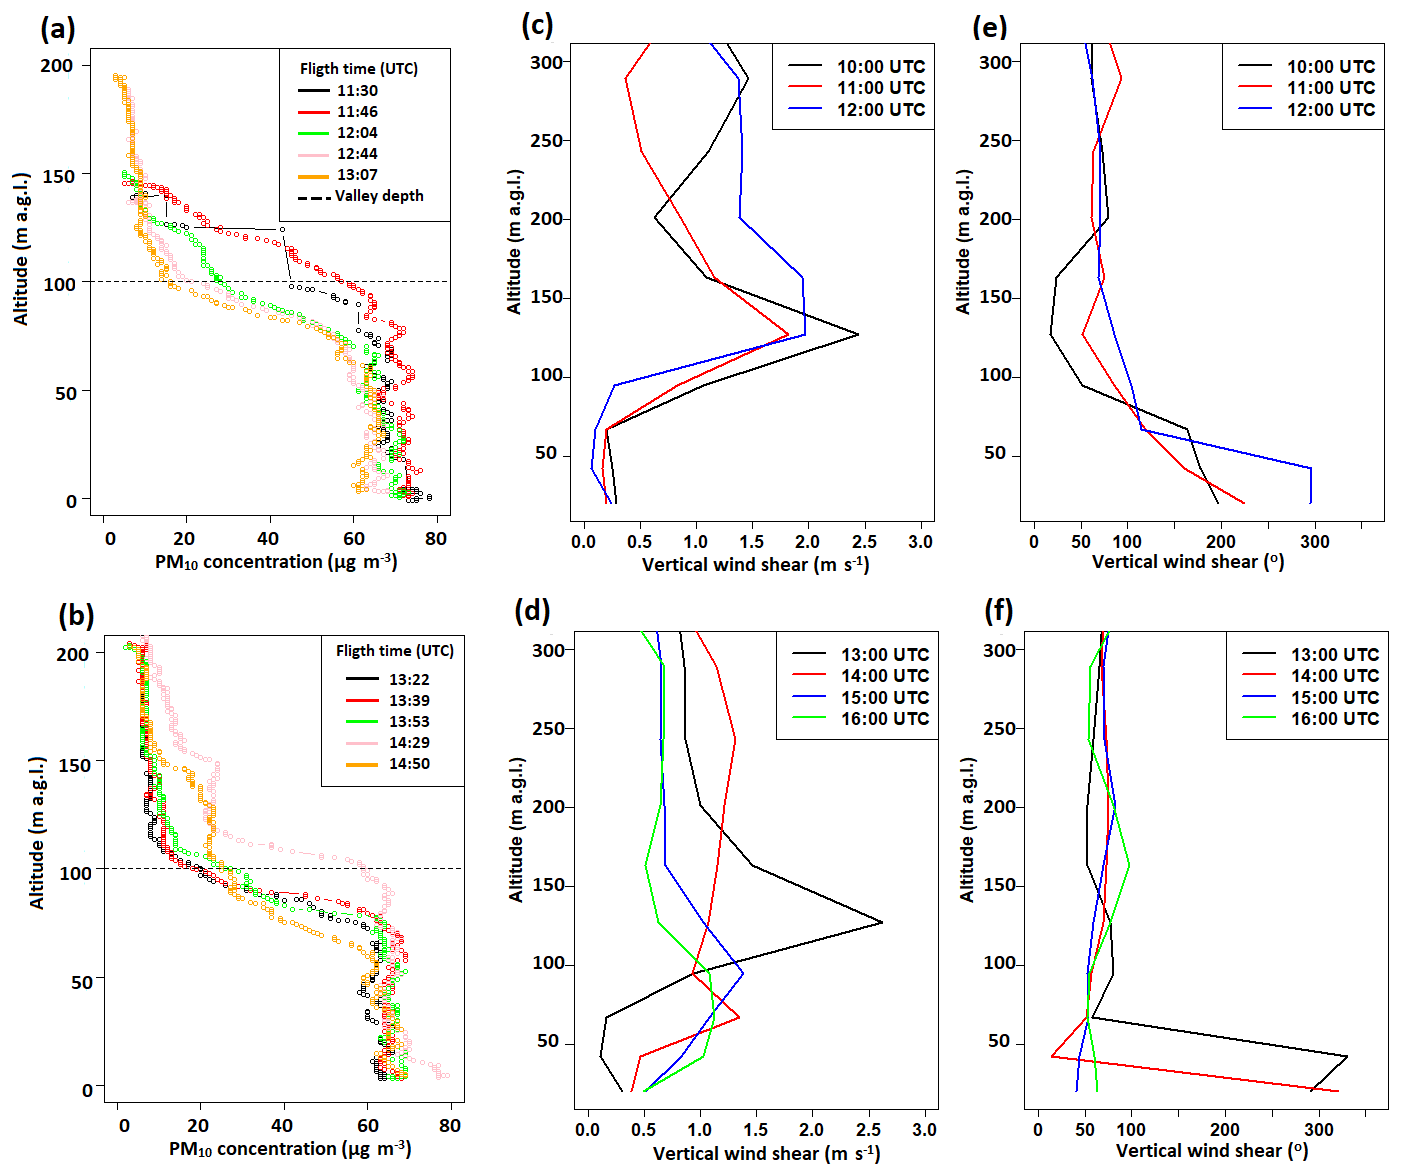
Figure 10Vertical profiles of PM10 concentration (a–b) and vertical profiles of wind shear speed (c–d) and direction (e–f) on 28 November 2019. Explanation: valley depth is the altitude of the hilltops surrounding the valley marked at 100 m a.g.l. with a dashed line in (a) and (b).
Similar situations with significant wind direction change in the vertical profile and weak wind speed were presented e.g. in Vergeiner (2004) and Li et al. (2012, 2015) for mountain valleys, during hydraulic jump occurrence. In the upper layer, wind direction is constant, while wind speed increases with height.
For the cases classified into group III, the occurrence of the transition layer was described by three parameters: half-way altitude (parameter e) and the altitude of the lower and upper transition layers (Fig. 6). Several meteorological factors were considered responsible for changes in those parameters. One of them was the height of the convection layer determined with the TKE vertical profile. It was checked whether predicted TKE for model vertical levels closest to the half-way altitude (below and above) decreased below 0.01 m2 s−2. Another condition was whether between two model vertical levels closest to the model to half-way altitude (below and above) or for the two closest vertical levels above there was significant wind shear defined as wind shear speed > 1.5 m s−1 or whether vertical wind direction change between two neighbouring levels was greater than 20∘. Both conditions for a vertical wind profile were analysed separately, and in case they were met, the height of the lower model layer from the two analysed ones was considered the final result.
For some cases, the conditions presented above occurred together at the same moment, in particular cases at the close altitude (e.g. TKE and wind shear occurrence on 6 d of 13 selected – 44 vertical profiles).
Figure 11 presents a comparison of altitude of half way for the PM10 vertical profile and predicted height of the convection layer (based on the TKE) and the layer at which strong wind shear was observed. For 41 of 134 PM10 vertical profiles, none of the conditions was met.
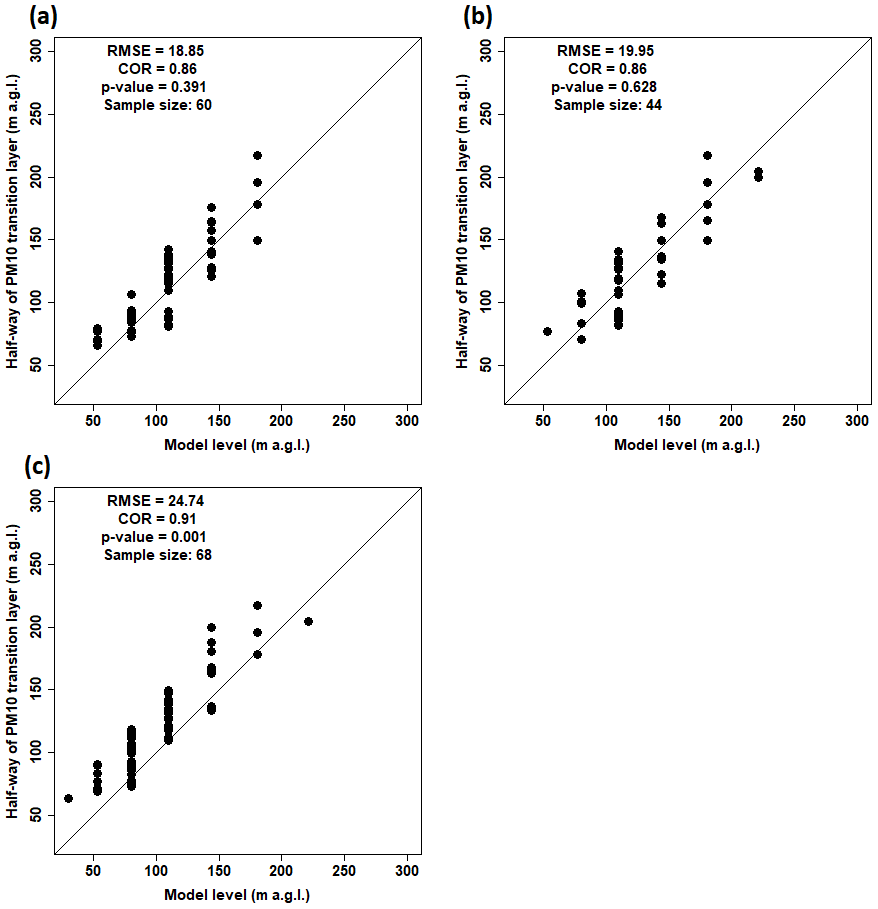
Figure 11The observed height of half-way altitude of the PM10 concentration's transition layer and (a) predicted height of the convection layer, (b) the strong wind shear speed, and (c) wind shear direction. Explanations: RMSE: root mean square error, COR: Pearson correlation coefficient, p value: p value calculated with the Mann–Whitney U test.
Analysis of results presented in Fig. 11 shows that for 60 vertical profiles of 134 analysed, an important factor in the S-shaped vertical PM10 profile was the height of the convection layer (10 measurement days). For 44 of 134 vertical profiles of the PM10 concentration, the altitude of wind shear speed higher than 1.5 m s−1 was close to the height of half-way altitude for PM10 (6 measurement days), while for wind shear direction was observed for 68 vertical profiles (7 measurement days). Values of root mean square error and Pearson correlation coefficient are comparable between all three groups (correlation coefficient greater than 0.85); however, a Mann–Whitney U shows that samples where the dominant factor is wind shear direction median altitude is shifted in comparison with the observations (p value equal to 0.001).
Altitudes of wind shear occurrence connected with change in wind direction in the vertical profile were in most cases lower than the height of half way (50 of 66 cases), in contrast to the cases with strong wind shear speed, where in 55 % of the cases strong wind shear was predicted above the height of half-way altitude (24 of 44 cases). For the turbulent kinetic energy vertical profile, in 33 % of the analysed cases the height of half-way altitude was lower than convection-layer height.
Studies presenting the complex thermal structure of the boundary layer (e.g. Wang et al., 2018; Xu et al., 2019) indicate that local pollutants are mostly trapped in the lowest layer. The occurrence of a multi-layer vertical structure in the boundary layer was noticed during the foehn periods, too, where warm air advection caused the intensification of the air temperature inversion and CAP and reduction of the available air volume for mixing the pollutants (e.g. sandwich foehn occurrence: Vergeiner, 2004; Drechsel and Mayr, 2008; Li et al., 2015). In the present paper, for the days with balloon flights, the occurrence of PM10 profile type III was connected with the advection of air masses from the south. Such an advection direction may be linked to the foehn wind occurrence in the Tatra Mountains. Therefore, we checked whether such advection is linked to high PM10 concentration differences between the measurement points within the city, especially between the western, narrow part of the valley and the eastern, wide part. For both cold seasons, cases of PM10 concentration differences > 50 µg m−3 which lasted at least 5 h constituted 10.9 % of the study period. For half of the cases, the dominating wind direction noted in Libertów was from the sector 130–270∘. In both cold seasons, wind direction from the sector 130–270∘ was noted in 52.6 % of the cases, which shows that it is an important factor controlling PM10 spatial patterns, but the impact is diversified.
Research presenting the impact of PBL dynamics confirms that during convective conditions (mechanical and thermal turbulence) vertical distribution of PM concentrations is uniform (Strbova et al., 2017; Wang et al., 2018; Li et al., 2019). Mechanical turbulence can be caused by strong wind shear connected to low-level jet (LLJ) (Li et al., 2019), mountain waves (Zängl, 2003), hydraulic jump (Kishcha et al., 2017), rotors (Kunin et al., 2019) or passage of an atmospheric front. In the present study, wind shear turned out to be the most important factor in terms of PM10 vertical profile modification. In the case of the study area under investigation, the wind shear is generated due to the relief impact, i.e. the presence of a large valley, blocked on one side by the hills. Studies presented in Sheridan (2019) indicate that the valley width is an important parameter affecting the interactions between CAP and air flow above the valley. For valleys whose depth exceeds the depth scale of the nocturnal stable boundary layer, processes related to daytime insolation may be not strong enough to break the cold-air pool.
The data used included both measurement and model data which allowed us to verify, as much as possible, the numerical weather predictions. Prognosis of e.g. wind field and TKE is highly dependent on the inclusion of various topographical features in the model formula. Local-scale phenomena like low-level jets, cold pool occurrence, and katabatic flows are often under-represented in the model analysis, so the verification with observations is needed.
The meteorological and PM10 data for the study periods were compared to the data for the whole of the two cold seasons, and it was found that they are representative of the situations with very low wind speed and higher than the usual air pollution. Therefore, the analyses' outcomes are valid for those periods within the cold season when the aerosanitary conditions are the worst. Additionally, the results obtained may be considered representative of cities located in large river valleys of central Europe and applied in the studies concerning the air quality there.
The results of our study present how the wind shear generated on a local scale by the diversified relief's impact can be a factor which might significantly modify the spatial pattern of PM10 concentration. We focused mainly on the events characterized by high surface-level PM10 concentrations in the city centre, as such situations are the most dangerous and the most important from the point of view of the inhabitants' health. High PM10 concentrations are usually linked to low wind speed occurrence, and all PM10 concentration vertical profiles were obtained in such conditions due to safety regulations concerning the balloon operation. The flights' height depended on the height at which the wind speed was too high to continue the uplift. Vertical profiles of PM10 concentration are also strongly dependent on the thickness of the convective layer. We have distinguished three main types of PM10 concentration vertical profiles, with type II being the least numerous and observed sporadically, usually as an intermediate short-term form occurring during the development of either type I or type III. In fact, the air layer inside the valley with constant high PM10 values of vertical concentrations described as type I was usually found to be only a lowermost section of type III, but the whole profile could not be observed as the wind speed at higher levels was too high to continue the flight. Type III presents the situation where the impact of the wind shear on the PM10 concentration profile is not linked mainly to the change in wind speed, like in type I, but to the change in wind direction in the vertical profile; the wind speed had to remain low within the whole profile as otherwise the balloon flight could not be realized. In type III, the sudden decreases in PM10 concentrations above the layer with its high constant values are due to the advection of different air masses on a regional scale. The analysis of PM10 profiles from all flights allows us to distinguish three vertical zones of potential air pollution hazard within the valley (about 100 m deep) and the city of Kraków:
-
up to about 60 m a.g.l. – the zone where during periods of low wind speed, air pollution is potentially the highest and the duration of such high levels is the longest, i.e. the zone with the worst aerosanitary conditions;
-
about 60–100 m a.g.l. – transitional zone where the large decrease in PM10 levels with height is observed;
-
above 100–120 m a.g.l. – the zone where air quality is significantly better than in zone 1, either due to the increase in the wind speed or due to the wind direction change and advection of different, clean air masses
Further research is planned, including night balloon measurements during high PM10 concentration episodes. Additionally, we plan to determine the share of particles of various size fractions in the air pollution with the sensors where the light scattering method is applied.
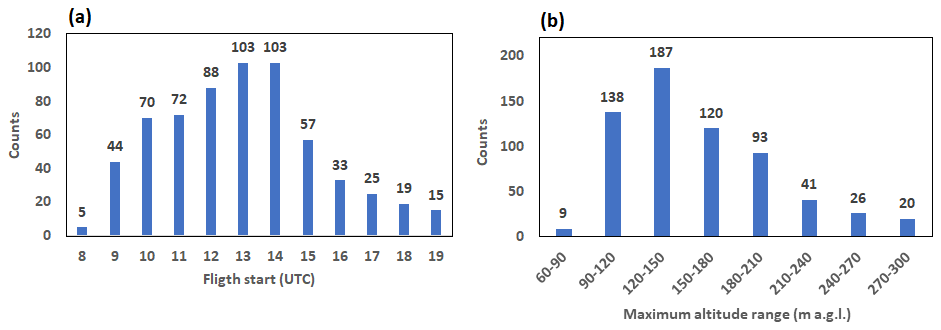
Table A1Height of the lowest 87 model vertical levels (v.l.s) up to 3 km of altitude, used in forecast.
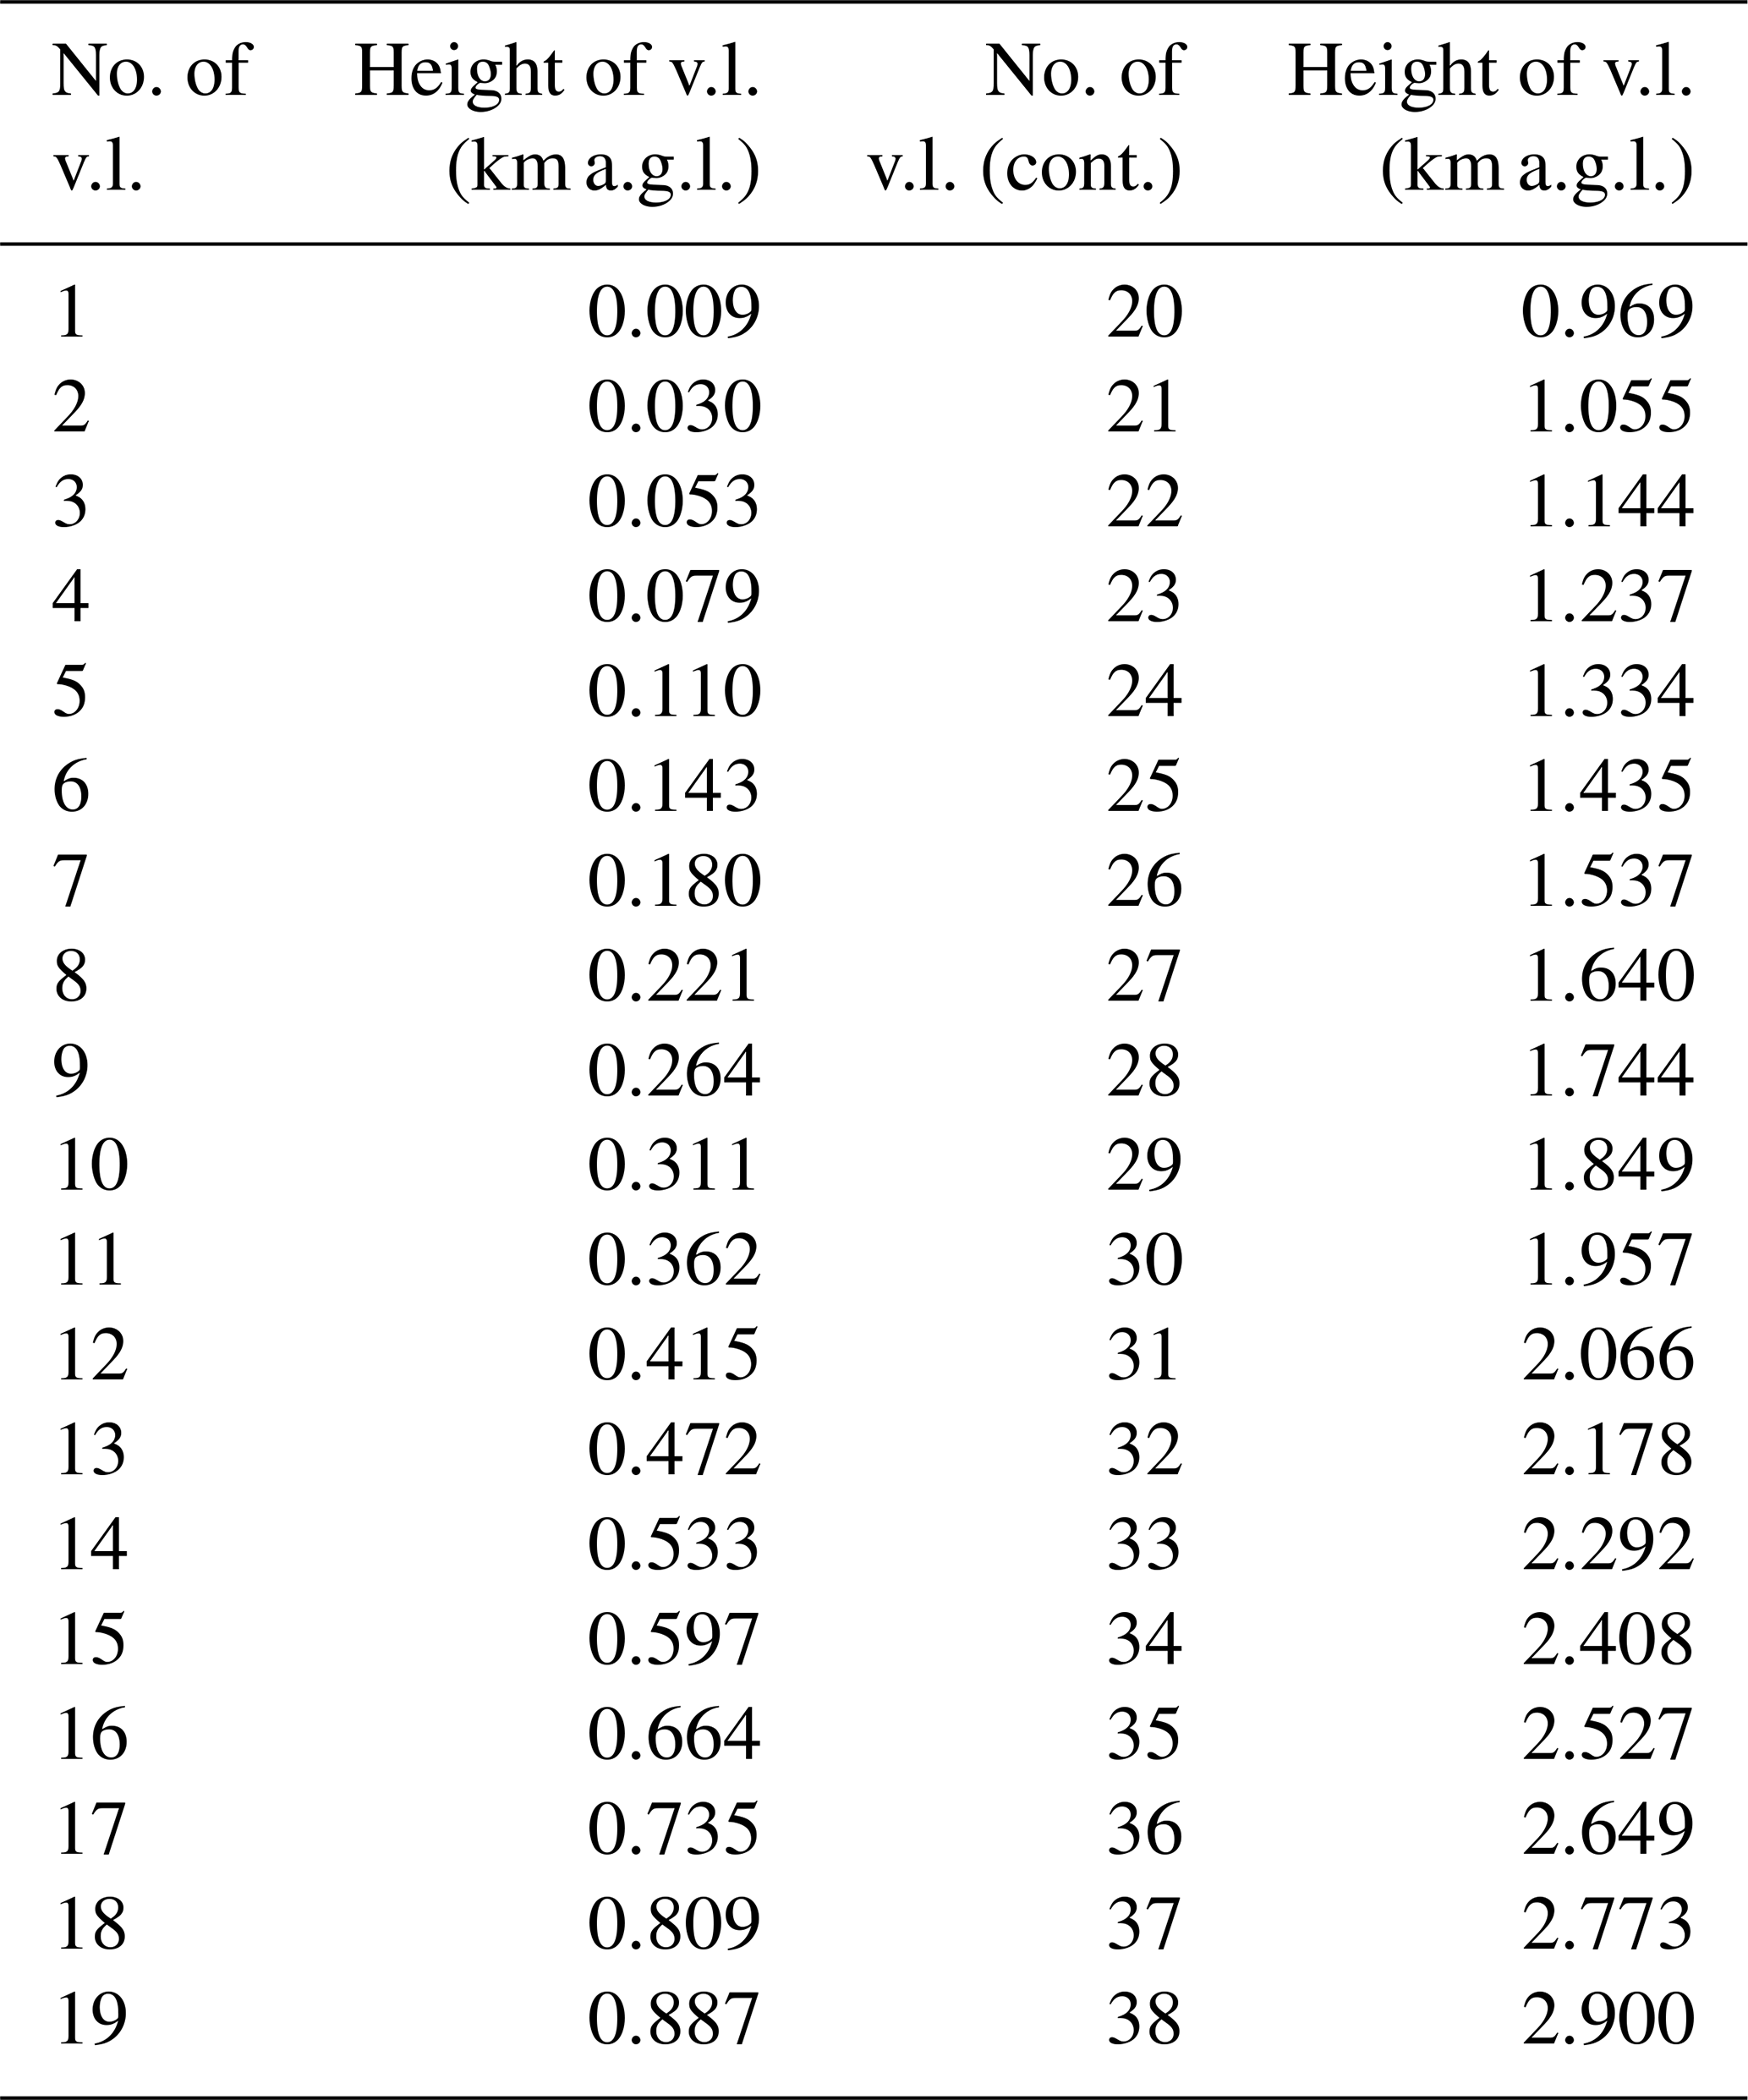

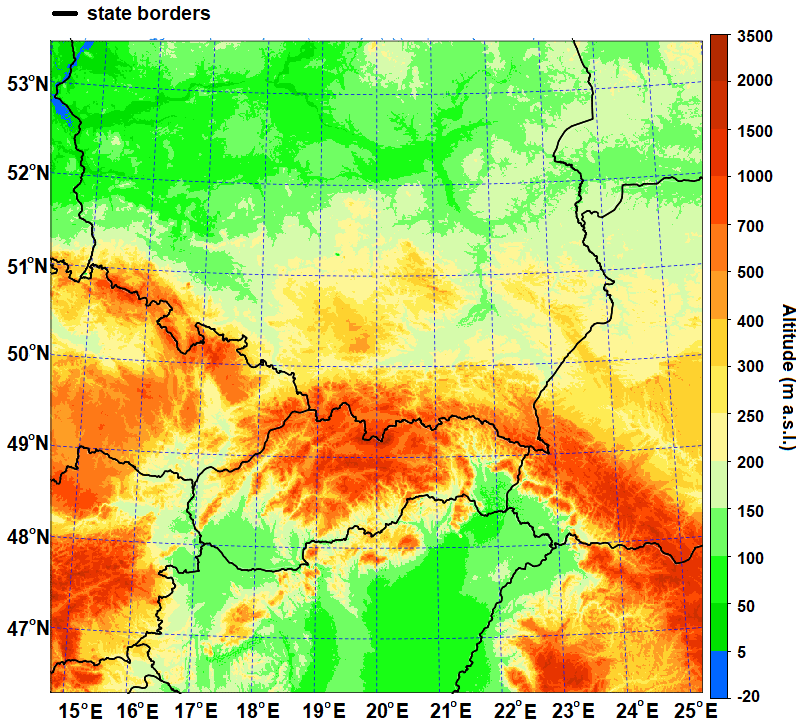
Figure A2Orography map of the AROME model domain with resolution 1 km × 1 km.

Figure A3Wind rose for three stations located in the Balice valley (a), Reymonta St. (b), Igołomia (c) and one at the nearest hilltop stations Libertów (d) for cold seasons 2018–2020.
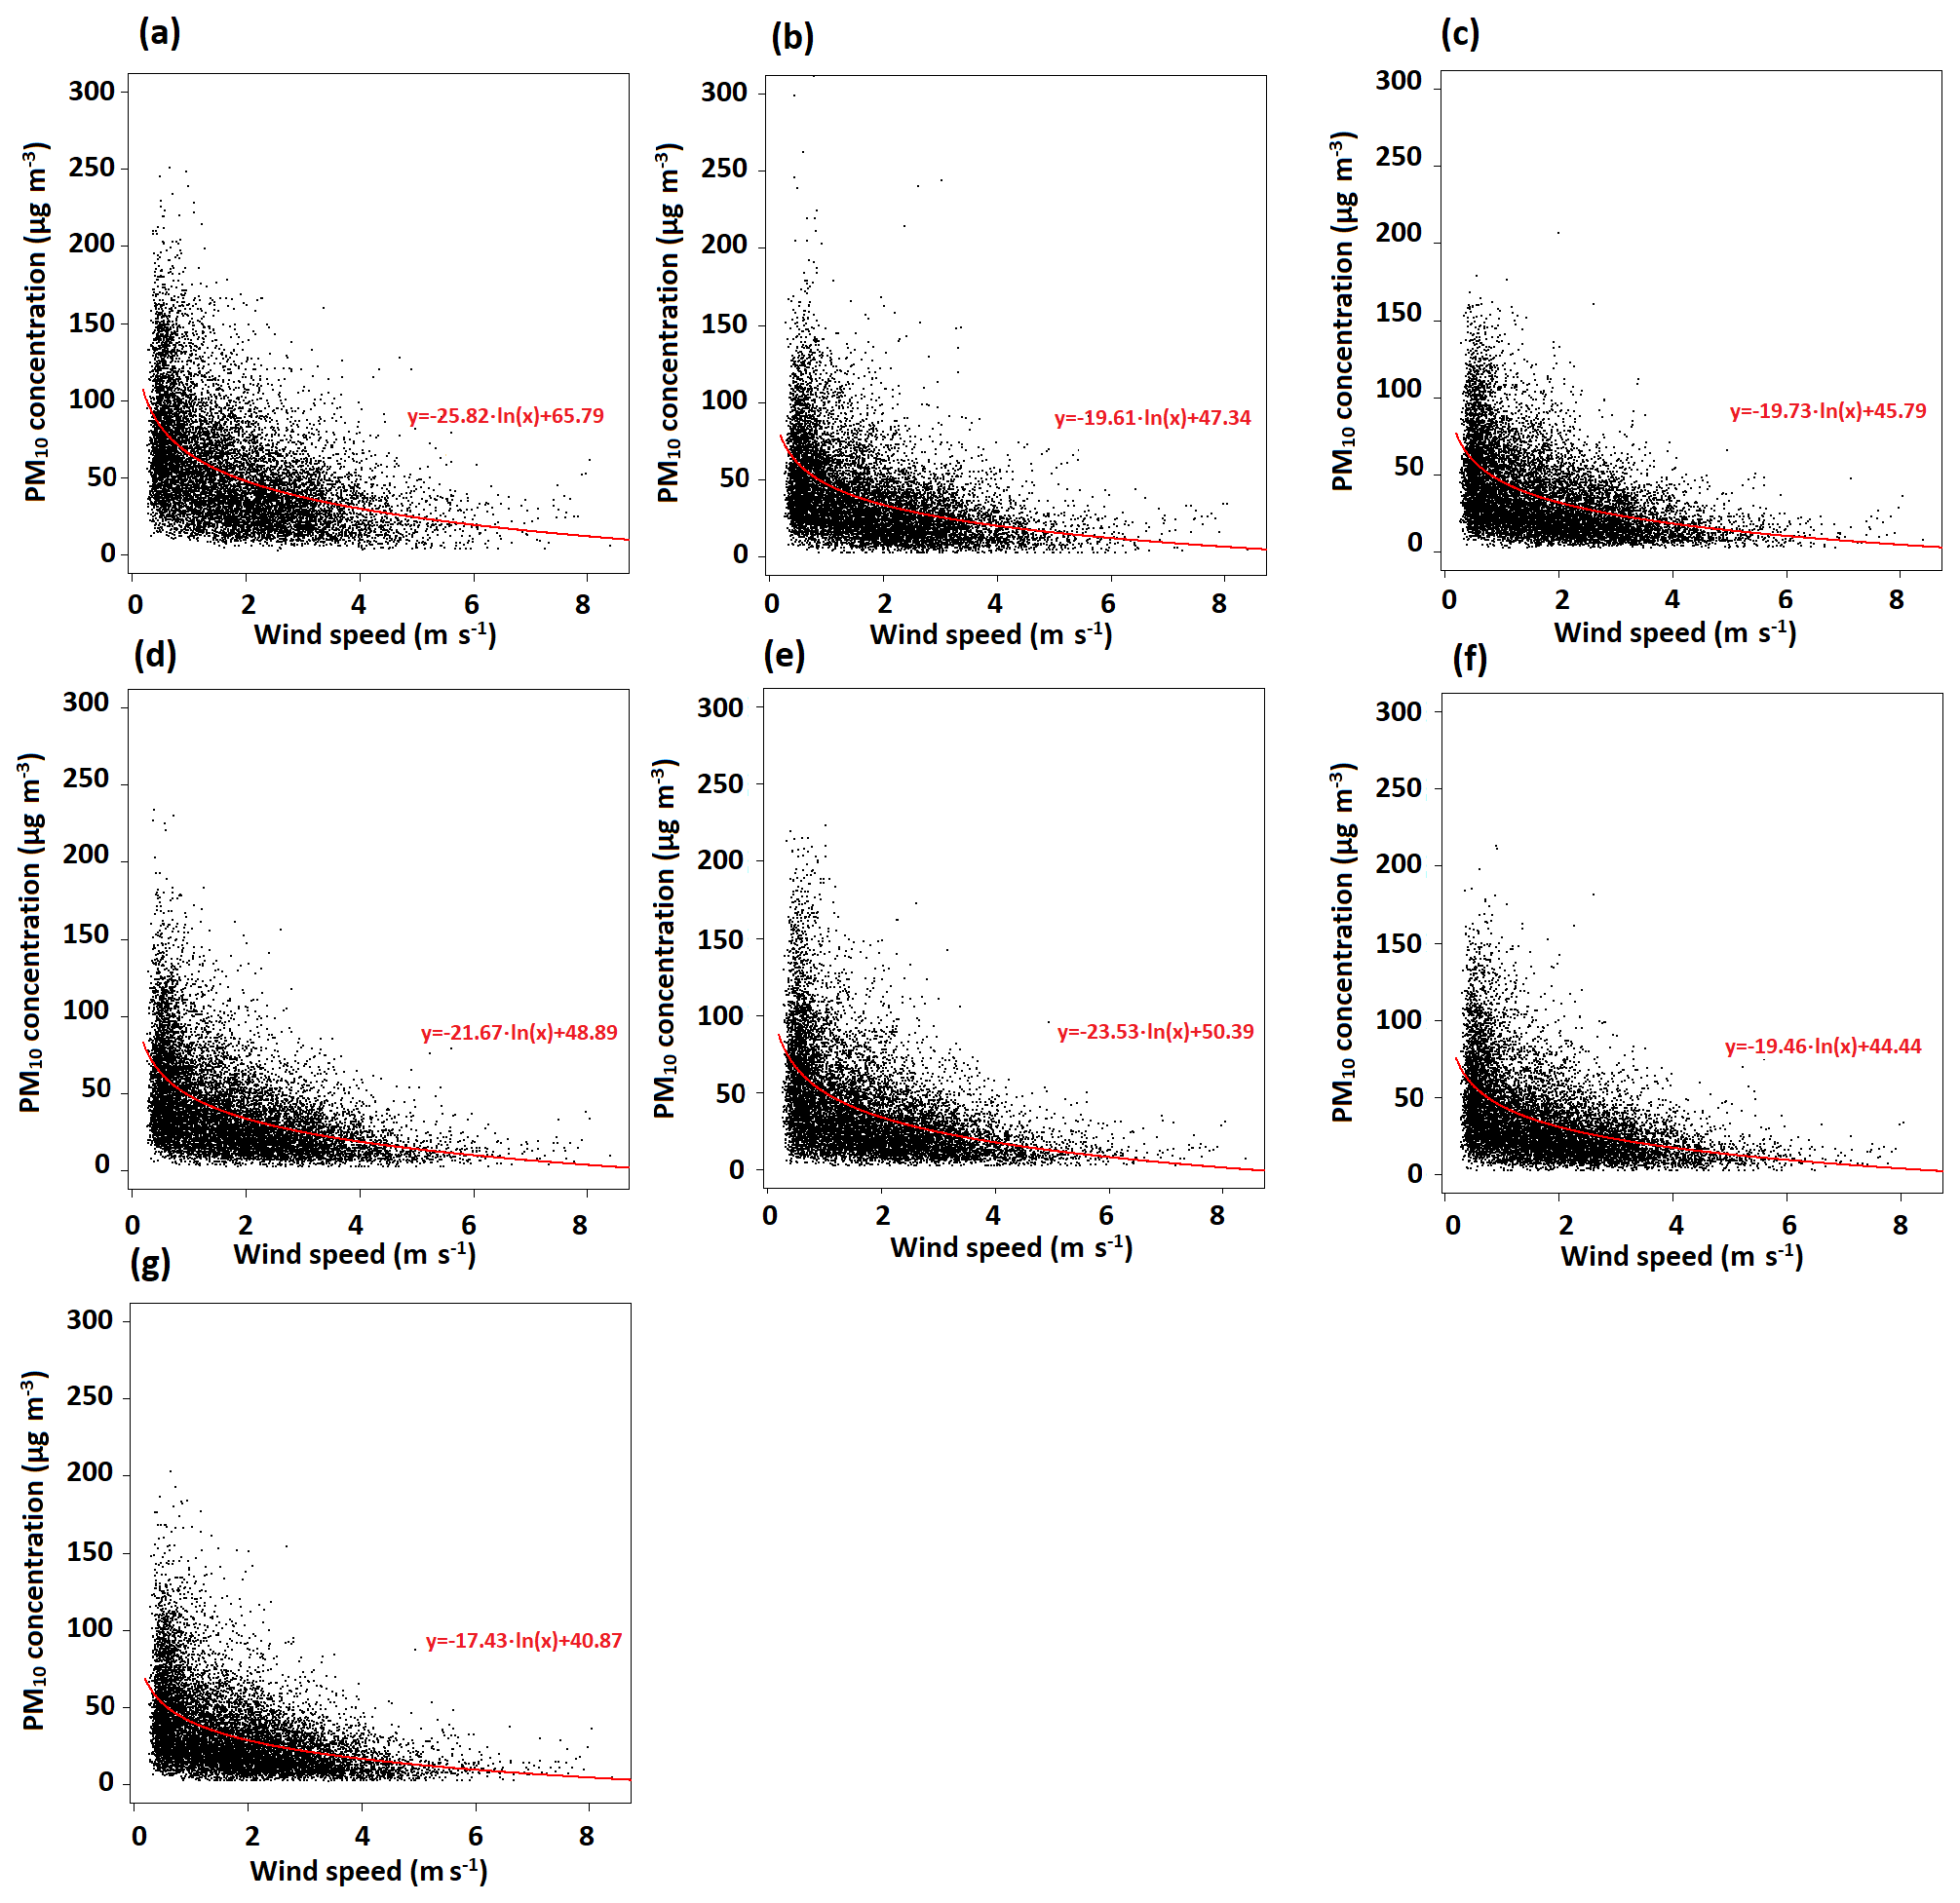
Figure A4Analysis of hourly PM10 concentration at air pollution stations in Kraków compared to wind speed from Reymonta St. station: (a) Krasińkiego St., (b) Dietla St., (c) Bulwarowa St., (d) Złoty Róg St., (e) Kurdwanów district, (f) Piastów district, (g) Wadów district. To presented data is fitted the logarithmic curve, and in the lower-right corner is included the curve equation.
Table A3Distribution of the temperature gradient between levels 200 and 50 m a.g.l. depending on the wind speed at a height of 50 m a.g.l. for the city centre in two cold seasons 2018–2020 obtained from the AROME model forecast.
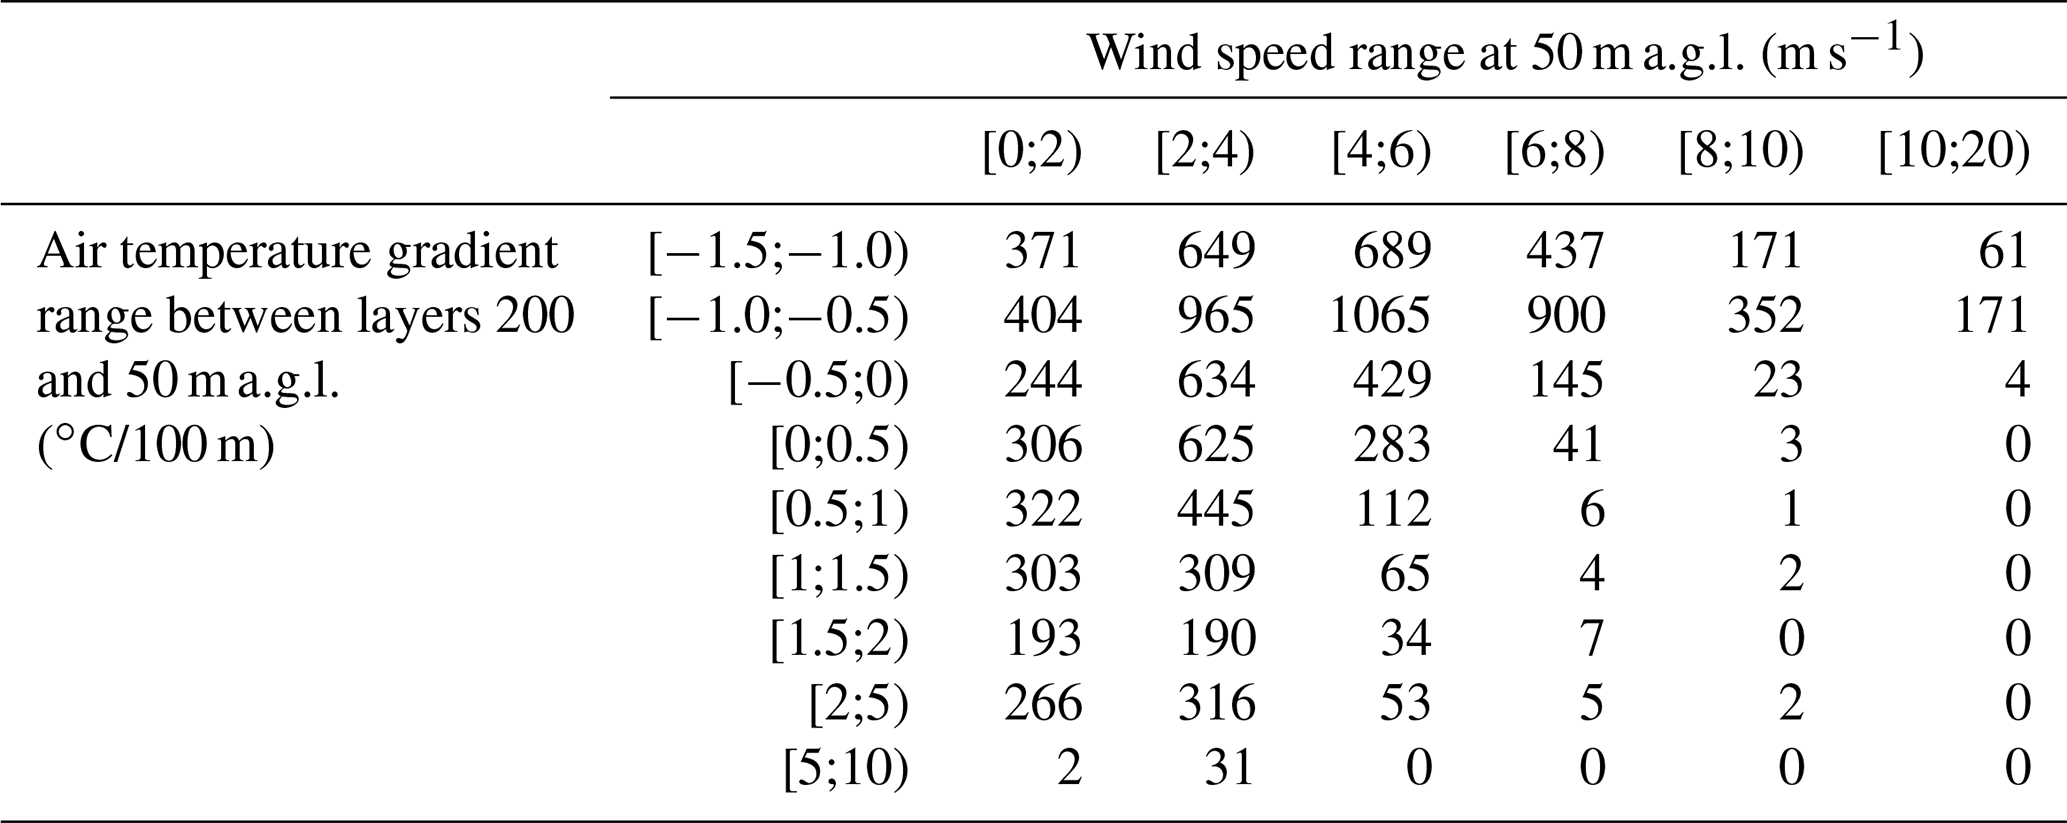
Table A4List of the measurement campaign with the specified PM10 profile observed during the selected day.

The model data were obtained with the meteorological model available upon request from the ACCORD consortium: http://www.umr-cnrm.fr/accord/ (ACCORD, 2021). The data were processed with MS Excel and R software (https://www.rdocumentation.org/packages/drc/versions/2.5-12/topics/drm, The R Foundation, 2021).
The observational data and some prognostic data administered by the Institute of Meteorology and Water Management, National Research Institute (2021), are available at https://danepubliczne.imgw.pl. Data on PM10 concentrations from the measurement points of the National Inspectorate of Environmental Protection (2021) are available at https://powietrze.gios.gov.pl/pjp/ archives.
Measurement data acquired and administered by the AGH-University of Science and Technology and Jagiellonian University will be made available upon the request to Mirosław Zimnoch and Anita Bokwa, respectively.
All the authors conceptualized the study and worked on gathering data resources. PS and BB worked on model analyses, and PS and AB analyzed the other data. PS, AB, BB, and MZ wrote the original draft. PS prepared all the figures. All the authors reviewed and edited the paper. All the authors have given their approval to the final version of the paper.
The authors declare that they have no conflict of interest.
Publisher's note: Copernicus Publications remains neutral with regard to jurisdictional claims in published maps and institutional affiliations.
The authors wish to thank Balon Widokowy sp. z o.o. for providing a tethered balloon for the measurement of PM10 vertical profiles in Kraków.
This research was partly funded by EU Project POWR.03.02.00-00-I004/16 (PS) and a Ministry of Science and Higher Education subsidy, project no. 16.16.220.842- B02.
This paper was edited by Roya Bahreini and reviewed by Tadeusz Niedzwiedz and one anonymous referee.
ACCORD: A Consortium for COnvection-scale modelling Research and Development, Meteorological model ALADIN, available at: http://www.umr-cnrm.fr/accord, last access: 21 April 2021.
Benard, P., Vivoda, J., Masek, J., Smolikova, P., Yessad, K., Smith, C., Brozkova, R., and Geleyn, J. F.: Dynamical kernel of the Aladin-NH spectral limited-area model: Revised formulation and sensitivity experiments, Q. J. Roy. Meteor. Soc., 136, 155–169, https://doi.org/10.1002/qj.522, 2010.
Bochenek, B. Sekuła, P., Jerczyński, M., Kolonko, M., Szczęch-Gajewska, M., Woyciechowska, J., and Stachura, G.: ALADIN in Poland, 30th ALADIN Wk and HIRLAM ASM 2020, Ljubljana, Slovenia,available at: http://www.umr-cnrm.fr/aladin/IMG/pdf/poster_poland.pdf (last access: 21 April 2021), 30 March–3 April 2020.
Bokwa, A.: Miejska wyspa ciepła na tle naturalnego zróżnicowania termicznego obszaru położonego we wklęsłej formie terenu (na przykładzie Krakowa) [Urban heat island against the background of natural thermal diversity of the area located in a concave terrain (on the example of Kraków city)], Prace Geograficzne IGiGP UJ, 122, 111–132, 2009.
Bokwa, A.: Wieloletnie zmiany struktury mezoklimatu miasta na przykładzie Krakowa [Long-term changes in the structure mesoclimate of the city on the example of Kraków city], IGiGP UJ, Kraków, 296 pp., 2010.
Bougeault, P. and Lacarrere, P.: Parameterization of orography-induced turbulence in a mesobeta-scale model, Mon. Weather Rev., 117, 1872–1890, https://doi.org/10.1175/1520-0493(1989)117<1872:pooiti>2.0.co;2, 1989.
Chief Inspectorate of Environmental Protection: Roczna ocena jakości powietrza w wojewódzctwie Małopolskim. Raport wojewódzki za rok 2019 [Annual assessment of air quality in Lesser Poland region, Report for the year 2019], available at: https://powietrze.gios.gov.pl/pjp/rwms/publications/card/1163 (last access: 10 May 2021), 2020 (in Polish).
Cuxart, J., Bougeault, P., and Redelsperger, J. L.: A turbulence scheme allowing for mesoscale and large-eddy simulations, Q. J. Roy. Meteor. Soc., 126, 1–30, https://doi.org/10.1002/qj.49712656202, 2000.
Drechsel, S. and Mayr, G. J.: Objective Forecasting of Foehn Winds for a Subgrid-Scale Alpine Valley, Weather Forecast., 23, 205–218, https://doi.org/10.1175/2007WAF2006021.1, 2008.
EEA: Air quality in Europe – 2020 report, available at: https://www.eea.europa.eu//publications/air-quality-in-europe-2020-report (last access: 10 May 2021), 2020.
Fedorovich, E. and Conzemius, R.: Effects of wind shear on the atmospheric convective boundary layer structure and evolution, Acta Geophys., 56, 114–141, https://doi.org/10.2478/s11600-007-0040-4, 2008.
Ferrero, L., Riccio, A., Ferrini, B. S., D'Angelo, L., Rovelli, G., Casati, M., Angelini, F., Barnaba, F., Gobbi, G. P., Cataldi, M., and Bolzacchini, E.: Satellite AOD conversion into ground PM10, PM2.5 and PM1 over the Po valley (Milan, Italy) exploiting information on aerosol vertical profiles, chemistry, hygroscopicity and meteorology, Atmos. Pollut. Res., 10, 1895–1912, https://doi.org/10.1016/j.apr.2019.08.003, 2019.
Franchini, M. and Mannucci, P. M.: Short-term effects of air pollution on cardiovascular diseases: outcomes and mechanisms, J. Thromb. Haemost., 5, 2169–2174, https://doi.org/10.1111/j.1538-7836.2007.02750.x, 2007.
Franchini, M. and Mannucci, P. M.: Thrombogenicity and cardiovascular effects of ambient air pollution, Blood, 118, 2405–2412, https://doi.org/10.1182/blood-2011-04-343111, 2011.
Giovannini, L., Ferrero, E., Karl, T., Rotach, M. W., Staquet, C., Castelli, S. T., and Zardi, D.: Atmospheric Pollutant Dispersion over Complex Terrain: Challenges and Needs for Improving Air Quality Measurements and Modeling, Atmosphere, 11, 32, https://doi.org/10.3390/atmos11060646, 2020.
Godłowska, J.: Wpływ warunków meteorologicznych na jakość powietrza w Krakowie. Badania porównawcze i próba podejścia modelowego [Influence of meteorological conditions on air quality in Kraków city. Comparative research and an attempt at a model approach], IMGW-PIB, Warszawa, 2019.
Godłowska, J., Hajto, M. J., and Tomaszewska, A. M.: Spatial analysis of air masses backward trajectories in order to identify distant sources of fine particulate matter emission, Archives of Environmental Protection, 41, 28–35, https://doi.org/10.1515/aep-2015-0015, 2015.
Han, S. Q., Hao, T. Y., Zhang, Y. F., Liu, J. L., Li, P. Y., Cai, Z. Y., Zhang, M., Wang, Q. L., and Zhang, H.: Vertical observation and analysis on rapid formation and evolutionary mechanisms of a prolonged haze episode over central-eastern China, Sci. Total Environ., 616, 135–146, https://doi.org/10.1016/j.scitotenv.2017.10.278, 2018.
Hess, M.: Klimat Krakowa [Climate of Kraków], Folia Geogr. Ser. Geogr.-Phys., 8, 45–102, 1974.
Institute of Meteorology and Water Management, National Research Institute: Meteorological and hydrological data from the measurement stations in Poland, available at: https://danepubliczne.imgw.pl, last access: 21 April 2021.
Jeong, S. J.: The Impact of Air Pollution on Human Health in Suwon City, Asian Journal of Atmospheric Environment, 7–4, 227–233, https://doi.org/10.5572/ajae.2013.7.4.227, 2013.
Kishcha, P., Starobinets, B., and Alpert, P.: Modelling of foehn-induced extreme local dust pollution in the Dead Sea valley, in: Air Pollution Modeling and its Applications XXV, edited by: Mensink, C. and Kallos, G., Springer Proceedings in Complexity, Springer, Cham, 433–437, https://doi.org/10.1007/978-3-319-57645-9_68, 2017.
Kunin, P., Alpert, P., and Rostkier-Edelstein, D.: Investigation of sea-breeze/foehn in the Dead Sea valley employing high resolution WRF and observations, Atmos. Res., 229, 240–254, https://doi.org/10.1016/j.atmosres.2019.06.012, 2019.
Li, J. W. and Han, Z. W.: Aerosol vertical distribution over east China from RIEMS-Chem simulation in comparison with CALIPSO measurements, Atmos. Environ., 143, 177–189, https://doi.org/10.1016/j.atmosenv.2016.08.045, 2016.
Li, X., Xia, X. G., Xin, Y., Ma, Y. F., Yang, J., Li, J. L., and Yang, X. H.: An examination of boundary layer structure under the influence of the gap winds in Urumqi, China, during air pollution episode in winter, JAPCA J. Air Waste Ma., 62, 26–37, https://doi.org/10.1080/10473289.2011.617628, 2012.
Li, X., Xia, X., Wang, L., Cai, R., Zhao, L., Feng, Z., Ren, Q., and Zhao, K.: The role of foehn in the formation of heavy air pollution events in Urumqi, China, J. Geophys. Res.-Atmos., 120, 5371–5384, https://doi.org/10.1002/2014jd022778, 2015.
Li, X. L., Ma, Y. J., Wei, W., Zhang, Y. H., Liu, N. W., Hong, Y., and Wang, Y.: Vertical Distribution of Particulate Matter and its Relationship with Planetary Boundary Layer Structure in Shenyang, Northeast China, Aerosol Air Qual. Res., 19, 2464–2476, https://doi.org/10.4209/aaqr.2019.06.0311, 2019.
Liu, C., Huang, J. P., Wang, Y. W., Tao, X. Y., Hu, C., Deng, L. C., Xu, J. P., Xiao, H. W., Luo, L., Xiao, H. Y., and Xiao, W.: Vertical distribution of PM2.5 and interactions with the atmospheric boundary layer during the development stage of a heavy haze pollution event, Sci. Total Environ., 704, 135329, https://doi.org/10.1016/j.scitotenv.2019.135329, 2020.
Marynowski, L., Łupikasza, E., Dąbrowska-Zapart, K., Małarzewski, Ł., Niedźwiedź, T., and Simoneit, B. R. T.: Seasonal and vertical variability of saccharides and other organic tracers of PM10 in relation to weather conditions in an urban environment of Upper Silesia, Poland, Atmos. Environ., 242, 117849, https://doi.org/10.1016/j.atmosenv.2020.117849, 2020.
Masson, V., Le Moigne, P., Martin, E., Faroux, S., Alias, A., Alkama, R., Belamari, S., Barbu, A., Boone, A., Bouyssel, F., Brousseau, P., Brun, E., Calvet, J.-C., Carrer, D., Decharme, B., Delire, C., Donier, S., Essaouini, K., Gibelin, A.-L., Giordani, H., Habets, F., Jidane, M., Kerdraon, G., Kourzeneva, E., Lafaysse, M., Lafont, S., Lebeaupin Brossier, C., Lemonsu, A., Mahfouf, J.-F., Marguinaud, P., Mokhtari, M., Morin, S., Pigeon, G., Salgado, R., Seity, Y., Taillefer, F., Tanguy, G., Tulet, P., Vincendon, B., Vionnet, V., and Voldoire, A.: The SURFEXv7.2 land and ocean surface platform for coupled or offline simulation of earth surface variables and fluxes, Geosci. Model Dev., 6, 929–960, https://doi.org/10.5194/gmd-6-929-2013, 2013.
National Inspectorate of Environmental Protection: Data on air pollution in Poland, available at: https://powietrze.gios.gov.pl/pjp, last access: 21 April 2021.
Pergaud, J., Masson, V., Malardel, S., and Couvreux, F.: A Parameterization of Dry Thermals and Shallow Cumuli for Mesoscale Numerical Weather Prediction, Bound.-Lay. Meteorol., 132, 83–106, https://doi.org/10.1007/s10546-009-9388-0, 2009.
Renard, J. B., Michoud, V., and Giacomoni, J.: Vertical Profiles of Pollution Particle Concentrations in the Boundary Layer above Paris (France) from the Optical Aerosol Counter LOAC Onboard a Touristic Balloon, Sensors, 20, 1111, https://doi.org/10.3390/s20041111, 2020.
Rodier, Q., Masson, V., Couvreux, F., and Paci, A.: Evaluation of a Buoyancy and Shear Based Mixing Length for a Turbulence Scheme, Front. Earth Sci., 5, 17, https://doi.org/10.3389/feart.2017.00065, 2017.
Samad, A., Vogt, U., Panta, A., and Uprety, D.: Vertical distribution of particulate matter, black carbon and ultra-fine particles in Stuttgart, Germany, Atmos. Pollut. Res., 11, 1441–1450, https://doi.org/10.1016/j.apr.2020.05.017, 2020.
Sheridan, P. F.: Synoptic-flow interaction with valley cold-air pools and effects on cold-air pool persistence: Influence of valley size and atmospheric stability, Q. J. Roy. Meteor. Soc., 145, 1636–1659, https://doi.org/10.1002/qj.3517, 2019.
Statista: PM10 emissions in the European Union (EU-28) in 2018, available at: https://www.statista.com/statistics/879414/pm10-particulate-matter-emission-contributions-european-union-eu-28/, last access: 10 May 2021.
Statistical Office in Kraków: Statistical yearbook of Kraków 2019, available at: https://krakow.stat.gov.pl/en/publications/statistical-yearbook/statistical-yearbook-of-krakow-2019,4,11.html (last access: 10 May 2021), 2019.
Strbova, K., Raclavska, H., and Bilek, J.: Impact of fugitive sources and meteorological parameters on vertical distribution of particulate matter over the industrial agglomeration, J. Environ. Manage., 203, 1190–1198, https://doi.org/10.1016/j.jenvman.2017.06.001, 2017.
Termonia, P., Fischer, C., Bazile, E., Bouyssel, F., Brožková, R., Bénard, P., Bochenek, B., Degrauwe, D., Derková, M., El Khatib, R., Hamdi, R., Mašek, J., Pottier, P., Pristov, N., Seity, Y., Smolíková, P., Španiel, O., Tudor, M., Wang, Y., Wittmann, C., and Joly, A.: The ALADIN System and its canonical model configurations AROME CY41T1 and ALARO CY40T1, Geosci. Model Dev., 11, 257–281, https://doi.org/10.5194/gmd-11-257-2018, 2018.
The R Foundation: R software, available at: https://www.rdocumentation.org/packages/drc/versions/2.5-12/topics/drm, last access: 21 April 2021.
Thürkow, M., Kirchner, I., Kranenburg, R., Timmermans, R. M. A., and Schaap, M.: A multi-meteorological comparison for episodes of PM10 concentrations in the Berlin agglomeration area in Germany with the LOTOS-EUROS CTM, Atmos. Environ., 244, 117946, https://doi.org/10.1016/j.atmosenv.2020.117946, 2021.
Trompetter, W. J., Grange, S. K., Davy, P. K., and Ancelet, T.: Vertical and temporal variations of black carbon in New Zealand urban areas during winter, Atmos. Environ., 75, 179–187, https://doi.org/10.1016/j.atmosenv.2013.04.036, 2013.
Ustrnul, Z.: Infulence of foehn winds on air-temperature and humidity in the Polish Carpathians, Theor. Appl. Climatol., 45, 43–47, https://doi.org/10.1007/bf00865992, 1992.
Vergeiner, J.: South foehn studies and a new foehn classification scheme in the Wipp and Inn valley, PhD thesis, Univ. of Innsbruck, Austria, 2004.
Voivodeship Inspectorate of Environmental Protection: Raport o stanie środowiska w województwie małopolskim w 2017 roku [Report about the state of the environment in the Małopolska Voivodeship in 2017], 2017, Kraków, available at: http://www.krakow.pios.gov.pl/Press/publikacje/raporty/raport17/raport2017.pdf (last access: 10 May 2021), 2017 (in Polish).
Wang, D. X., Stachlewska, I. S., Song, X. Q., Heese, B., and Nemuc, A.: Variability of the Boundary Layer Over an Urban Continental Site Based on 10 Years of Active Remote Sensing Observations in Warsaw, Remote Sensing, 12, 33, https://doi.org/10.3390/rs12020340, 2020.
Wang, H., Sun, Z. B., Li, H. Y., Gao, Y., Wu, J., and Cheng, T. T.: Vertical-distribution Characteristics of Atmospheric Aerosols under Different Thermodynamic Conditions in Beijing, Aerosol Air Qual. Res., 18, 2775–2787, https://doi.org/10.4209/aaqr.2018.03.0078, 2018.
Xu, Y. W., Zhu, B., Shi, S. S., and Huang, Y.: Two Inversion Layers and Their Impacts on PM2.5 Concentration over the Yangtze River Delta, China, J. Appl. Meteorol. Clim., 58, 2349–2362, https://doi.org/10.1175/jamc-d-19-0008.1, 2019.
Zängl, G.: Deep and shallow south foehn in the region of Innsbruck: Typical features and semi-idelized numerical simulations, Meteorol. Atmos. Phys., 83, 237–261, https://doi.org/10.1007/s00703-002-0565-7, 2003.
Zhang, H. L., Wang, Y. G., Hu, J. L., Ying, Q., and Hu, X. M.: Relationships between meteorological parameters and criteria air pollutants in three megacities in China, Environ. Res., 140, 242–254, https://doi.org/10.1016/j.envres.2015.04.004, 2015.
Zhang, K., Wang, D. F., Bian, Q. G., Duan, Y. S., Zhao, M. F., Fei, D. N. A., Xiu, G. L., and Fu, Q. Y.: Tethered balloon-based particle number concentration, and size distribution vertical profiles within the lower troposphere of Shanghai, Atmos. Environ., 154, 141–150, https://doi.org/10.1016/j.atmosenv.2017.01.025, 2017.
Zhao, S. P., Yu, Y., Qin, D. H., Yin, D. Y., Du, Z. H., Li, J. L., Dong, L. X., He, J. J., and Li, P.: Measurements of submicron particles vertical profiles by means of topographic relief in a typical valley city, China, Atmos. Environ., 199, 102–113, https://doi.org/10.1016/j.atmosenv.2018.11.035, 2019.
Zhou, S., Wu, L., Guo, J., Chen, W., Wang, X., Zhao, J., Cheng, Y., Huang, Z., Zhang, J., Sun, Y., Fu, P., Jia, S., Tao, J., Chen, Y., and Kuang, J.: Measurement report: Vertical distribution of atmospheric particulate matter within the urban boundary layer in southern China – size-segregated chemical composition and secondary formation through cloud processing and heterogeneous reactions, Atmos. Chem. Phys., 20, 6435–6453, https://doi.org/10.5194/acp-20-6435-2020, 2020.