the Creative Commons Attribution 4.0 License.
the Creative Commons Attribution 4.0 License.
 | 28 Jan 2021
Improvement of the satellite-derived NOx emissions on air quality modeling and its effect on ozone and secondary inorganic aerosol formation in the Yangtze River Delta, China
Yang Yang
Yu Zhao
Lei Zhang
Jie Zhang
Xin Huang
Xuefen Zhao
Yan Zhang
Mengxiao Xi
Yi Lu
We developed a top-down methodology combining the inversed chemistry transport modeling and satellite-derived tropospheric vertical column of NO2 and estimated the NOx emissions of the Yangtze River Delta (YRD) region at a horizontal resolution of 9 km for January, April, July, and October 2016. The effect of the top-down emission estimation on air quality modeling and the response of ambient ozone (O3) and inorganic aerosols (SO, NO, and NH, SNA) to the changed precursor emissions were evaluated with the Community Multi-scale Air Quality (CMAQ) system. The top-down estimates of NOx emissions were smaller than those (i.e., the bottom-up estimates) in a national emission inventory, Multi-resolution Emission Inventory for China (MEIC), for all the 4 months, and the monthly mean was calculated to be 260.0 Gg/month, 24 % less than the bottom-up one. The NO2 concentrations simulated with the bottom-up estimate of NOx emissions were clearly higher than the ground observations, indicating the possible overestimation in the current emission inventory, attributed to its insufficient consideration of recent emission control in the region. The model performance based on top-down estimate was much better, and the biggest change was found for July, with the normalized mean bias (NMB) and normalized mean error (NME) reduced from 111 % to −0.4 % and from 111 % to 33 %, respectively. The results demonstrate the improvement of NOx emission estimation with the nonlinear inversed modeling and satellite observation constraint. With the smaller NOx emissions in the top-down estimate than the bottom-up one, the elevated concentrations of ambient O3 were simulated for most of the YRD, and they were closer to observations except for July, implying the VOC (volatile organic compound)-limited regime of O3 formation. With available ground observations of SNA in the YRD, moreover, better model performance of NO and NH was achieved for most seasons, implying the effectiveness of precursor emission estimation on the simulation of secondary inorganic aerosols. Through the sensitivity analysis of O3 formation for April 2016, the decreased O3 concentrations were found for most of the YRD region when only VOC emissions were reduced or the reduced rate of VOC emissions was 2 times of that of NOx, implying the crucial role of VOC control in O3 pollution abatement. The SNA level for January 2016 was simulated to decline 12 % when 30 % of NH3 emissions were reduced, while the change was much smaller with the same reduced rate for SO2 or NOx. The result suggests that reducing NH3 emissions was the most effective way to alleviate SNA pollution of the YRD in winter.
- Article
(19934 KB) - Full-text XML
-
Supplement
(756 KB) - BibTeX
- EndNote


Nitrogen oxides (NOx = NO2 + NO) play an important role in the formation of ambient ozone (O3) and inorganic aerosols (SO, NO, and NH, SNA). The NOx emission inventory is a necessary input of the air quality model (AQM) and has a great influence on NO2, O3, and SNA simulation (Zhou et al., 2017; Chen et al., 2019a). Moreover, it is crucial for exploring the sources of atmospheric pollution of O3 and fine particles (particles with aerodynamic diameter smaller than 2.5 µm, PM2.5) with the AQM. The inventories were usually developed with a bottom-up method, in which the emissions were calculated based on the activity data (e.g., fuel consumption and industrial production) and emission factors (the emissions per unit of activity data) by source category and region. Bias existed commonly in the bottom-up inventories, due mainly to the uncertainty of economic and energy statistics and to the fast changes in the emission control measures, especially in developing countries like China (Granier et al., 2011; Saikawa et al., 2017; Zhang et al., 2019).
To improve the emission estimation, an inversed top-down method has been developed based on satellite observations and the AQM (Martin et al., 2003; Zhao and Wang, 2009; Zyrichidou et al., 2015; Yang et al., 2019a). The emissions were corrected based on the difference between the modeled and observed tropospheric vertical column densities (TVCDs) of NO2 and the response coefficient of NO2 TVCDs to emissions (Martin et al., 2003; Cooper et al., 2017). With higher temporal and spatial resolution than other instruments, the NO2 TVCDs from the Ozone Monitoring Instrument (OMI) were frequently used (Kurokawa et al., 2009; Gu et al., 2014; de Foy et al., 2015; Kong et al., 2019; Yang et al., 2019a).
Currently, top-down methods are mainly developed at the global or national scale with relatively coarse horizontal resolution (Martin et al., 2003; Miyazaki et al., 2012; Jena et al., 2014; Gu et al., 2014). At the global scale, for example, Martin et al. (2003) and Miyazaki et al. (2012) estimated the NOx emissions at the horizontal resolution of 2∘ × 2.5∘ and 2.8∘ × 2.8∘, respectively. Martin et al. (2003) found that the satellite-derived NOx emissions for 1996–1997 were 50 %–100 % larger than the bottom-up estimates in the Po Valley, Tehran, and Riyadh urban areas. Miyazaki et al. (2012) suggested that the bottom-up method underestimated the NOx emissions over eastern China, the eastern United States, southern Africa, and central–western Europe. At the national scale with the horizontal resolution of 0.5∘ × 0.5∘, the annual NOx emissions in India 2015 derived with the top-down method were 7 %–60 % smaller than various bottom-up estimates (Jena et al., 2014). With the TVCDs from OMI and another instrument (Global Ozone Monitoring Experiment, GOME), the difference in national NOx emissions for China was quantified to be 0.4 Tg N/yr (5.8 % relative to OMI) at the resolution of 70 km × 70 km (Gu et al., 2014). Compared to national and regional ones, limited estimates were available at the regional scale with finer resolution. In China, great differences exist in the levels and patterns of air pollution across the regions, attributed partly to a big variety of air pollutant sources across the country. To achieve the target of air quality improvement required by the central government, varied air pollution control plans were usually developed and implemented at the city/provincial level. Therefore, the top-down estimates in NOx emissions at finer horizontal resolution are greatly needed for understanding the primary sources of NO2 pollution and demonstrating the effect of emission control at the regional scale.
At present, the reliability and rationality of the top-down emission estimates are commonly evaluated with the AQM and satellite observations. For example, the bias between the NO2 TVCDs from OMI observations and the AQM based on the top-down NOx emission estimation was −30.8 ± 69.6 × 10¹³ molec. cm−2 in winter in India (Jena et al., 2014). The linear correlation coefficient (R2) between OMI and the AQM with the top-down emission estimates could reach 0.84 in Europe (Visser et al., 2019). Compared to the satellite observations with relatively large uncertainty (Yang et al., 2019b; Liu et al., 2019), surface concentrations that better represent the effect of air pollution on human health and the ecosystems were less applied in the evaluation of the top-down estimates of NOx emissions. Limited assessments were conducted at the national scale. For example, Liu et al. (2018) found that the normalized mean error (NME) between the observed and simulated NO2 concentrations based on the top-down estimate of NOx emissions could reach 32 % in China at the resolution of 0.25∘ × 0.25∘. Besides NO2, the estimation of NOx emissions also plays an important and complicated role in secondary air pollutant simulation including O3 and SNA, and the response of secondary pollution to the primary emissions was commonly nonlinear. The simulated O3 concentrations in Shanghai (the most developed city in eastern China) could increase over 20 %, with a 60 % reduction in NOx emissions in summer 2016, implying a clear VOC (volatile organic compound)-limited pattern for the O3 formation in the megacity (Wang et al., 2019). For the response of SNA to NOx emissions, the NH and SO concentrations at an urban site in another megacity Nanjing in eastern China were simulated to increase 1.9 % and 2.8 %, with a 40 % abatement of NOx emissions in autumn 2014, respectively, due to the weakened competition of SNA formation against SO2 (Zhao et al., 2020). To the best of our knowledge, however, the relatively new information from the inversed modeling of NOx emissions has not been sufficiently incorporated into the SNA and O3 analyses with the AQM in China.
Located in eastern China, the Yangtze River Delta (YRD) region, including the city of Shanghai and the provinces of Anhui, Jiangsu, and Zhejiang, is one of the most developed and heavy-polluted regions in the country. The air quality for most cities in the YRD failed to meet the National Ambient Air Quality Standard (NAAQS) Class II in 2016 (MEPPRC, 2017). NOx emissions made great contributions to the severe air pollution in the region. Based on an offline sampling and measurement study, for example, the annual average of the NO mass fraction to total PM2.5 reached 19 % in Shanghai in 2014, and it was significantly elevated in the pollution event periods (Ming et al., 2017). In this study, we chose the YRD to estimate the NOx emissions with the inversed method and to explore their influence on the air quality modeling. The top-down estimates of NOx emissions were firstly obtained with the nonlinear inversed method and OMI-derived NO2 TVCDs for 2016. The advantage of the top-down estimation against the bottom-up one was then evaluated with the AQM and abundant ground-based NO2 concentrations. The influences of the top-down estimation in NOx emissions were further detected on O3 and SNA modeling. Sensitivity analyses were conducted by changing the emissions of precursors to investigate the sources and potential control approaches of O3 and SNA pollution for the region.
2.1 The top-down estimation of NOx emissions
The top-down estimation of NOx emissions was conducted for January, April, July, and October of 2016, representing the situations of the four seasons in the YRD region, and the horizontal resolution was 9 km ×9 km. The inversed method assumed a nonlinear and variable correlation between NOx emissions and NO2 TVCDs (Cooper et al., 2017), and the a posterior daily emissions (top-down estimates) were calculated with the following equation:
where Et and Ea represent the a posterior and the a prior daily NOx emissions, respectively; Ωo and Ωa represent the observed and simulated NO2 TVCDs, respectively; β represents the response coefficient of the simulated NO2 TVCDs to a specific change in emissions and was calculated based on the simulated changes in TVCDs (ΔΩ) from a 10 % change in emissions (ΔE).
The inversed method assumed that the daily emissions were similar. For a given month, the a posterior daily emissions were used as the a priori emissions of the next day, and the monthly top-down estimate of the NOx emissions was scaled from the average of the a posterior daily emissions of the last 3 d in the month, as the top-down estimate of daily NOx emissions usually converged within a 1-month simulation period (Zhao and Wang, 2009; Yang et al., 2019b). In our previous work (Yang et al., 2019b), we demonstrated the robustness of the method, by applying the “synthetic” TVCDs from air quality simulation based on a hypothetical “true” emission inventory, instead of those from satellite observations. We found that sufficient iteration times could result in a relatively constant emission estimate (the top-down estimate) close to the “true” emission input. From a bottom-up perspective, the difference in NOx emissions between weekdays and the weekend was within 5 % in the YRD region (Zhou et al., 2017), indicating an insignificant bias from the ignorance of the daily variation of emissions.
The NO2 TVCDs were from OMI on board the Aura satellite. It crosses the Equator at 13:30 local time. The horizontal resolution of OMI was 24 km × 13 km at nadir (Levelt et al., 2006), one of the finest resolutions available for NO2 TVCD observations before October 2017. We applied the Peking University Ozone Monitoring Instrument NO2 product (POMINO v1; Lin et al., 2014, 2015) to constrain the NOx emissions. POMINO v1 modified the retrieval methodology of the Dutch Ozone Monitoring Instrument NO2 product (DOMINO v2) in China and provided better linear correlation of NO2 TVCDs between the satellite and available ground-based observations using multi-axis differential optical absorption spectroscopy (MAX-DOAS) (Lin et al., 2015). The original NO2 TVCDs from POMINO v1 (level 2) were resampled into an 18 km × 18 km grid system based on the area weight method and then downscaled to 9 km × 9 km with Kriging interpolation. As an example, the NO2 TVCDs for July 2016 in the YRD are shown in Fig. S1 in the Supplement, and larger TVCDs were found in the east–central YRD.
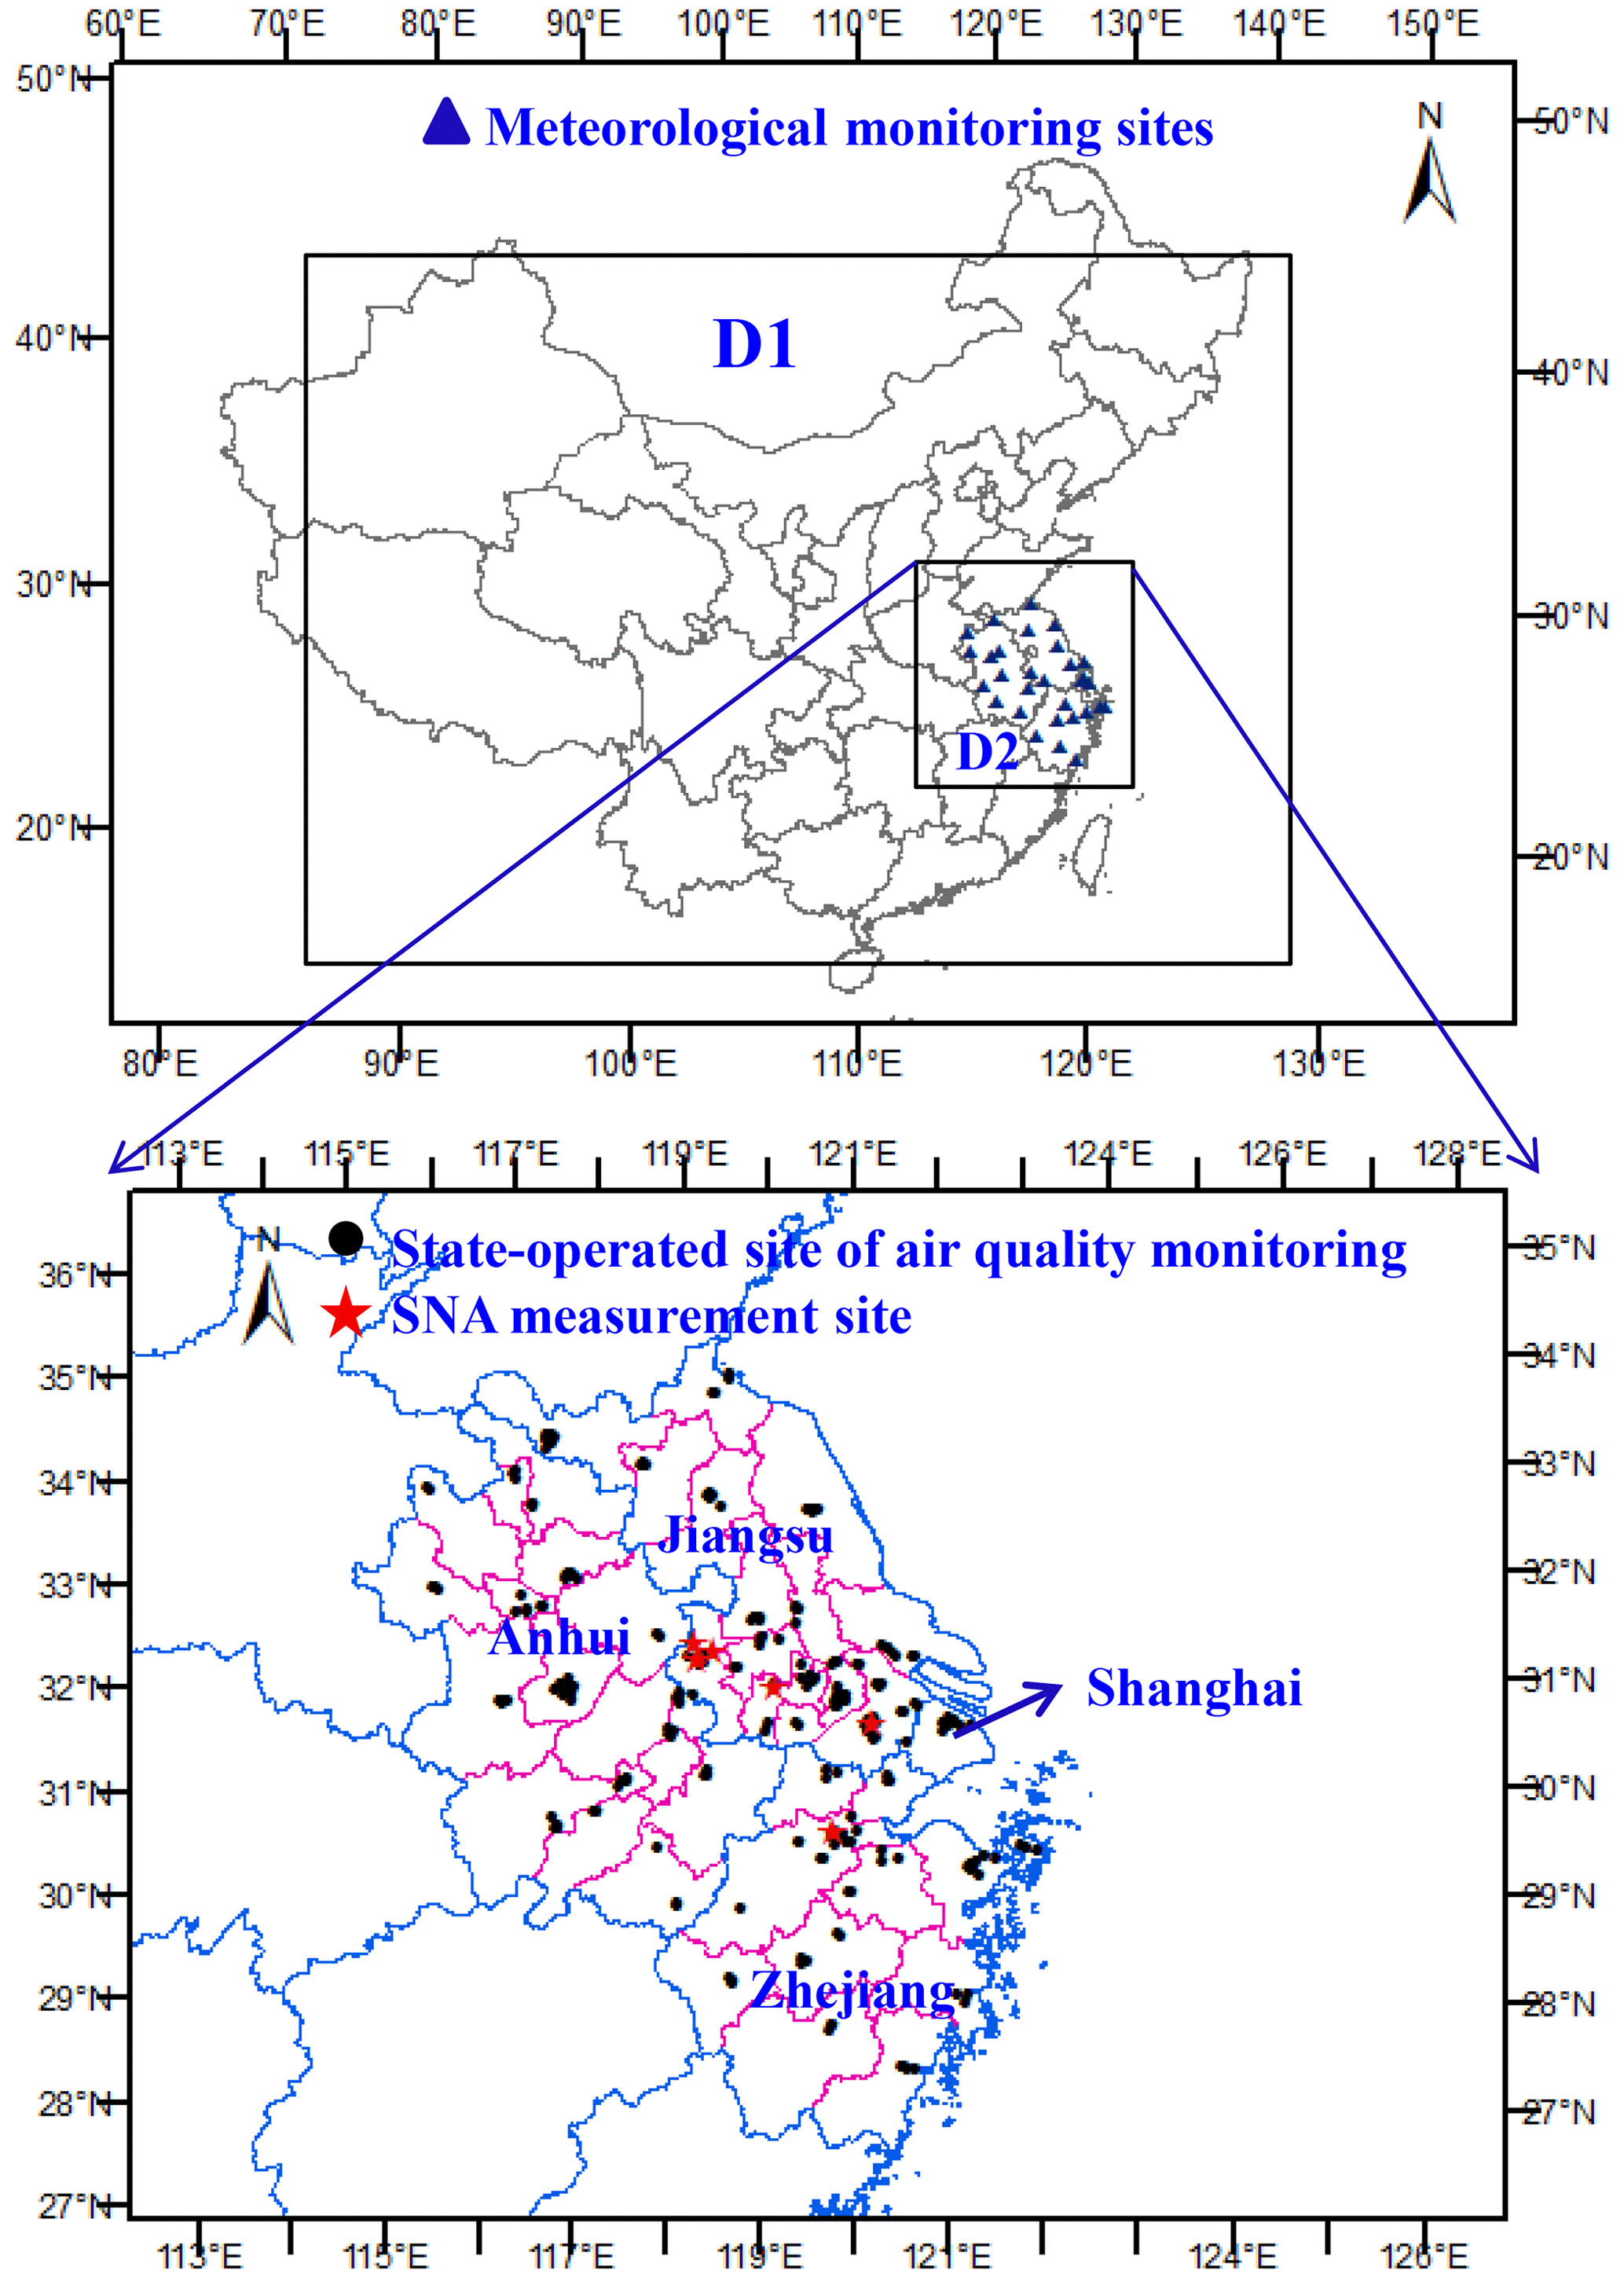
Figure 1The modeling domain and locations of meteorological and air quality monitoring sites. The map data provided by the Resource and Environment Data Cloud Platform are freely available for academic use (http://www.resdc.cn/data.aspx?DATAID=201, last access: 20 January 2020). © Institute of Geographic Sciences & Natural Resources Research, Chinese Academy of Sciences.
2.2 Model configuration
The Models-3 Community Multi-scale Air Quality (CMAQ) version 5.1 was used to conduct the inversed modeling of NOx emission estimation and to simulate the ground-level concentrations of NO2, O3, and SNA. As a three-dimensional Eulerian model, CMAQ includes complex interactions of atmospheric chemistry and physics and is one of the most widely applied AQMs to evaluate the sources and processes of air pollution in China (UNC, 2012; Xing et al., 2015; Zheng et al., 2017). As shown in Fig. 1, the two nested modeling domains were applied with their horizontal resolutions set to 27 km and 9 km, respectively. The mother domain (D1, 177 cells × 127 cells) included most parts of China, and the second (D2, 118 × 121 cells) covered the YRD region. The model included 28 vertical layers, and the height of the first layer (ground layer) was approximately 60 m. The carbon bond gas-phase mechanism (CB05) and AERO6 aerosol module were used in the CMAQ. The initial concentrations and boundary conditions for the D1 were derived from the default clean profile, while those of D2 were extracted from the CMAQ Chemistry Transport Model (CCTM) outputs of its mother domain. The first 5 d of each simulated month were chosen as the spin-up period. Details on model configuration were described in Zhou et al. (2017) and Yang and Zhao (2019).
The Multi-resolution Emission Inventory for China (MEIC; http://www.meicmodel.org/, last access: 20 January 2020) for 2015 was applied as the initial input of anthropogenic emissions in D1 and D2, with an original horizontal resolution of 0.1∘ × 0.1∘. In this study, the MEIC emissions from residential sources were downscaled to the horizontal resolution of 9 km × 9 km, based on the spatial density of population, and those from power, industry, and transportation based on the spatial distribution of gross domestic product (GDP). The NOx emissions from soil were originally obtained from Yienger and Levy (1995) and were doubled as advised by Zhao and Wang (2009). The emissions of Cl, HCl, and lightning NOx were collected from the Global Emissions Initiative (GEIA; Price et al., 1997). Biogenic emissions were derived from the Model Emissions of Gases and Aerosols from Nature developed under the Monitoring Atmospheric Composition and Climate project (MEGAN MACC; Sindelarova et al., 2014).
Meteorological fields were provided by the Weather Research and Forecasting (WRF) model version 3.4, a state-of-the-art atmospheric modeling system designed for both numerical weather prediction and meteorological research (Skamarock et al., 2008). The simulated parameters from WRF for D2 in January, April, July, and October 2016 were compared with the observation dataset of the US National Climate Data Center (NCDC), as summarized in Table S1 in the Supplement. The index of agreement (IOA) of wind speed for the 4 months between the two datasets was larger than 0.8. The root mean square error (RMSE) of wind directions for the 4 months was smaller than 40∘, and the index of agreement (IOA) of temperature and relative humidity between the two datasets was larger than 0.8 and 0.7, respectively. The simulated meteorological parameters in D2 could reach the benchmarks derived from Emery et al. (2001) and Jiménez et al. (2006).
The hourly NO2 and O3 concentrations were observed at 230 state-operated stations of air quality monitoring in 41 cities within the YRD region, and they were applied to evaluate the model performance. Locations of the stations are indicated in Fig. 1, and the observation data were derived from the China National Environmental Monitoring Center (CNEMC; http://www.cnemc.cn/, last access: 20 January 2020). The observations of SO, NO, and NH (SNA) concentrations in PM2.5 for the YRD region during 2015–2017 were collected and applied to evaluate the influence of the top-down estimation of NOx emissions on SNA simulation. In particular, the hourly SNA concentrations of PM2.5 at the Jiangsu Provincial Academy of Environmental Science, an urban site in the capital city of Jiangsu Province, Nanjing (JSPAES; Chen et al., 2019b), were observed with the Monitor for Aerosols and Gases in ambient Air (MARGA; Metrohm, Switzerland) for January, April, July, and October 2016. Meanwhile, the daily average concentrations of SNA were also available from MARGA measurement for the 4 months at the Station for Observing Regional Processes and the Earth System, a suburban site in eastern Nanjing (SORPES; Ding et al., 2019). In addition, the seasonal average concentrations of SNA were available at another four sites in the YRD, including the Nanjing University of Information Science & Technology site in Nanjing (NUIST; Zhang, 2017), and three sites respectively in the cities of Hangzhou (HZS; Li, 2018), Changzhou (CZS; Liu et al., 2018), and Suzhou (SZS; Wang et al., 2016). Details of the collected SNA measurement studies are summarized in Table S2 in the Supplement, and the locations of those sites are illustrated in Fig. 1.
2.3 Scenario setting of sensitivity analysis
In general, there are two categories of chemical regimes (VOC-limited and NOx-limited) in O3 formation (Wang et al., 2010; Jin et al., 2017). In the VOC-limited regime, growth in O3 concentrations occurs with increased VOC emissions and declined NOx emissions, while the increased NOx emissions result in enhancement of O3 concentrations in the NOx-limited regime. To explore the sources and potential control approaches of O3 pollution, the sensitivity of O3 formation to its precursor emissions for April was analyzed with CMAQ modeling in the YRD region. In the YRD, the peaking time of O3 concentration has gradually moved from summer to late spring, and the mean observed O3 concentration in April was 72.5 µg/m3, slightly higher than that in July (71.9 µg/m3). In addition, the model performance of O3 was better for April than that for July in this work (see details in Sect. 3.2). Therefore, we selected April to explore the sensitivity analysis of O3 formation in the region. As summarized in Table S3 in the Supplement, eight cases were set besides the base scenario with the top-down NOx estimates for April 2016. Cases 1 and 6 reduced only the NOx emissions by 30 % and 60 %, and Cases 2 and 7 reduced only the VOC emissions by 30 % and 60 %, respectively. To explore the co-effect of VOCs and NOx emission controls on O3 concentrations, cases with different reduction rates of VOCs and NOx emissions were designed. The emissions of NOx and VOCs in Case 4 were decreased by 30 % and 60 % and in Case 5 by 60 % and 30 %, respectively. Both NOx and VOC emissions were reduced 30 % and 60 % in Cases 3 and 8, respectively.
The response of SNA concentrations to the changes in precursor emissions was influenced by various factors including the abundance of NH3, atmospheric oxidation, and the chemical regime of O3 formation (Wang et al., 2013; Cheng et al., 2016; Zhao et al., 2020). To explore the sensitivity of SNA formation to its precursor emissions, four cases were set besides the base scenario for January 2016, the month with the largest observed SNA concentrations. As shown in Table S4 in the Supplement, the emissions of NOx, SO2, and NH3 were reduced by 30 % in Cases 9–11, respectively, and the emissions of NOx, SO2, and NH3 were simultaneously decreased by 30 % in Case 12.
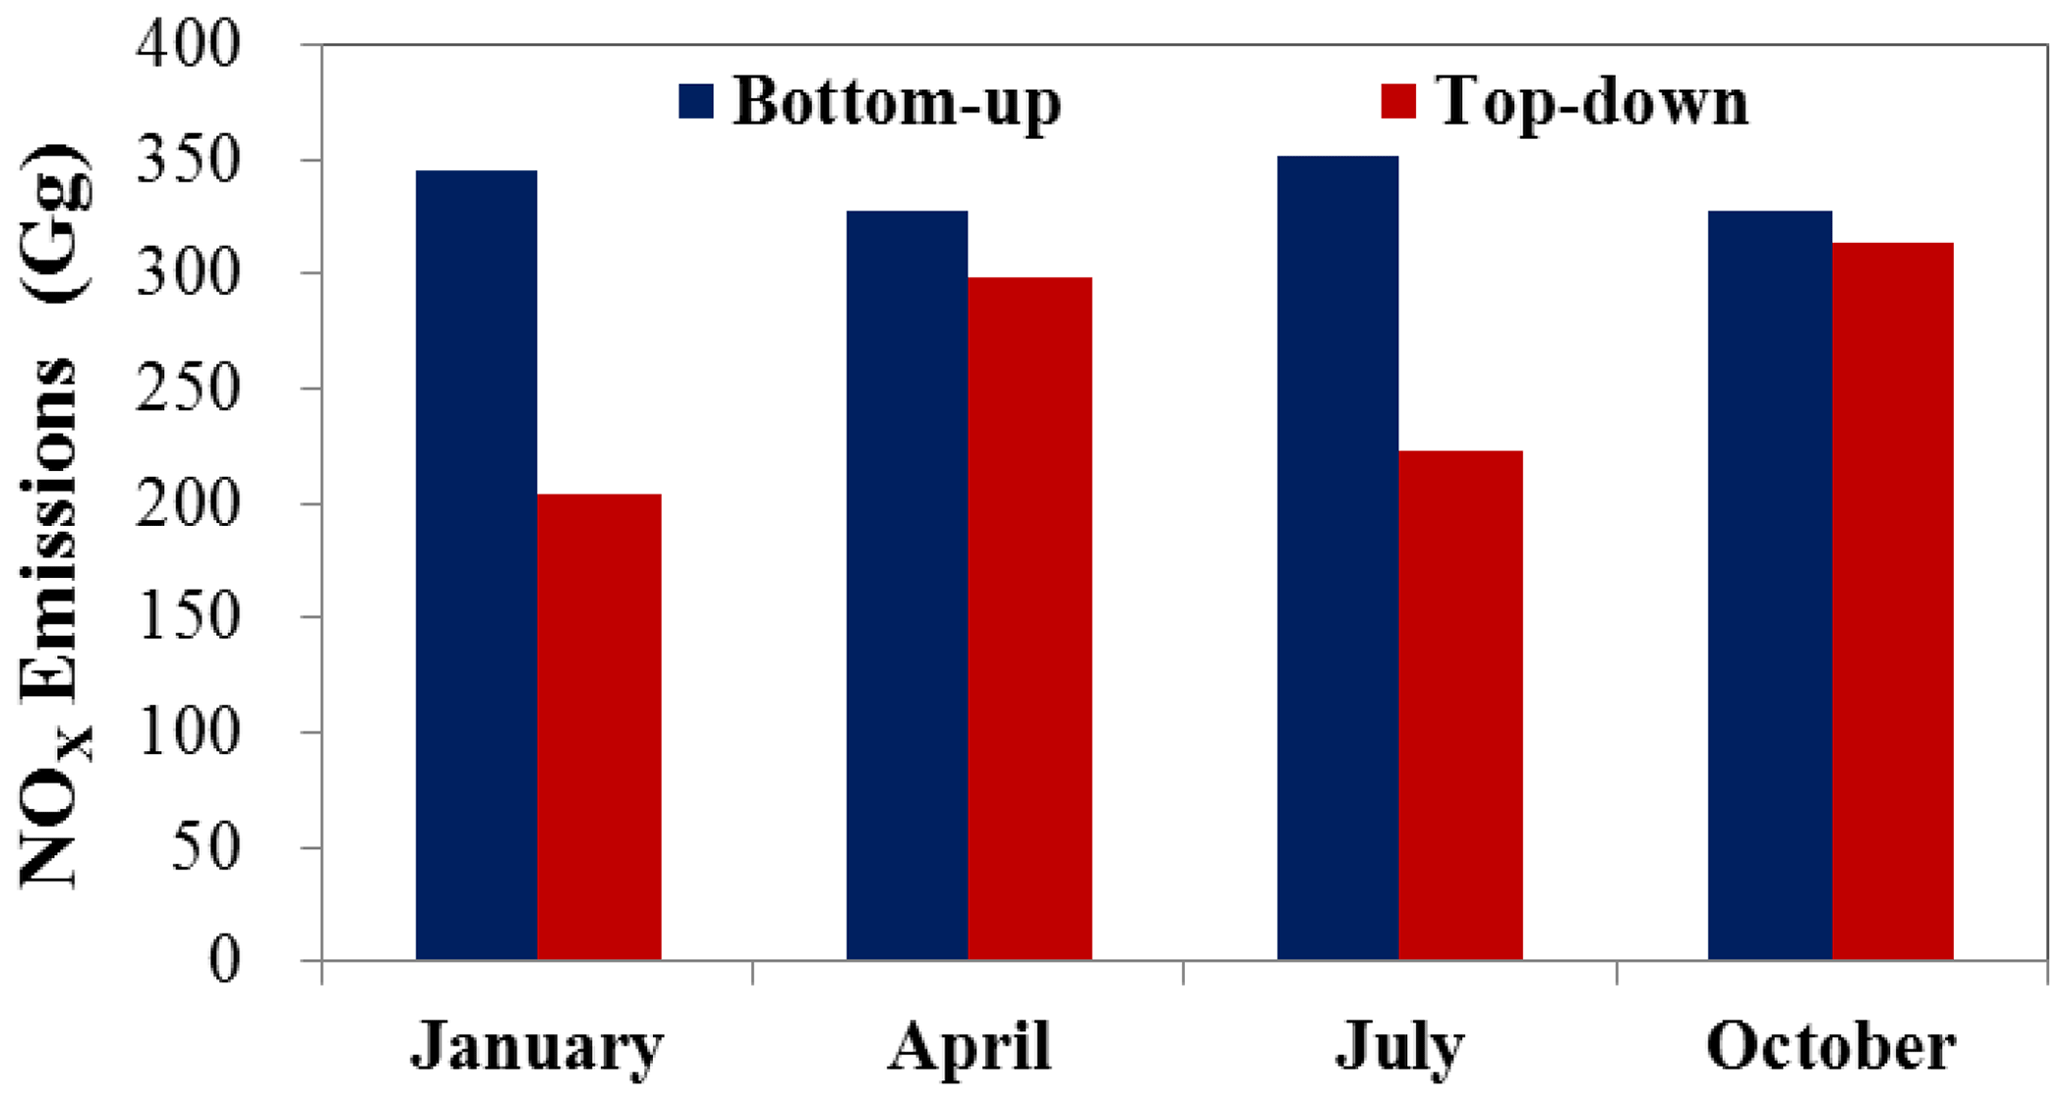
Figure 2The bottom-up and top-down estimates of NOx emissions by month for the YRD region in 2016.
3.1 Evaluation of the bottom-up and top-down estimates of NOx emissions
Figure 2 compares the magnitude of the NOx emissions estimated based on the bottom-up (MEIC) and top-down methods by month in the YRD region. The top-down estimates were smaller than the bottom-up ones for all the 4 months concerned, and the average of the monthly NOx emissions was calculated to be 260.0 Gg/month for 2016 with the top-down method, 24 % smaller than the bottom-up estimation. The comparison indicates a probable overestimation in NOx emissions with the current bottom-up methodology, attributed partly to the insufficient consideration of the effect of recent control on emission abatement. Stringent measures have gradually been conducted to improve the local air quality in the YRD region. For example, the “ultra-low” emission policy for the power sector started in 2015, requiring the NOx concentration in the flue gas of coal-fired units to be the same as that of gas-fired units. Technology retrofitting on power units has been widely conducted, significantly improving the NOx removal efficiencies of selective catalytic reduction (SCR) systems. These detailed changes in emission control, however, could not be fully incorporated in a timely manner into the national emission inventory that relies more on the routinely reported information and policy of environmental management over the country. With the online data from continuous emission monitoring systems (CEMS) incorporated, NOx emissions from the power sector were estimated to be 53 % smaller than MEIC for China in 2015 in our previous work (Zhang et al., 2019). The bias between the top-down and bottom-up estimates could be larger in earlier years and reduced more recently. According to Yang et al. (2019b) and Qu et al. (2017), for example, the top-down NOx emissions were 44 % and 31 % smaller than bottom-up ones for the YRD region and the whole of China in 2012. Benefiting from the better data availability, the bottom-up inventory has been improved with the inclusion of more information on individual power and industrial plants for recent years (Zheng et al., 2018).
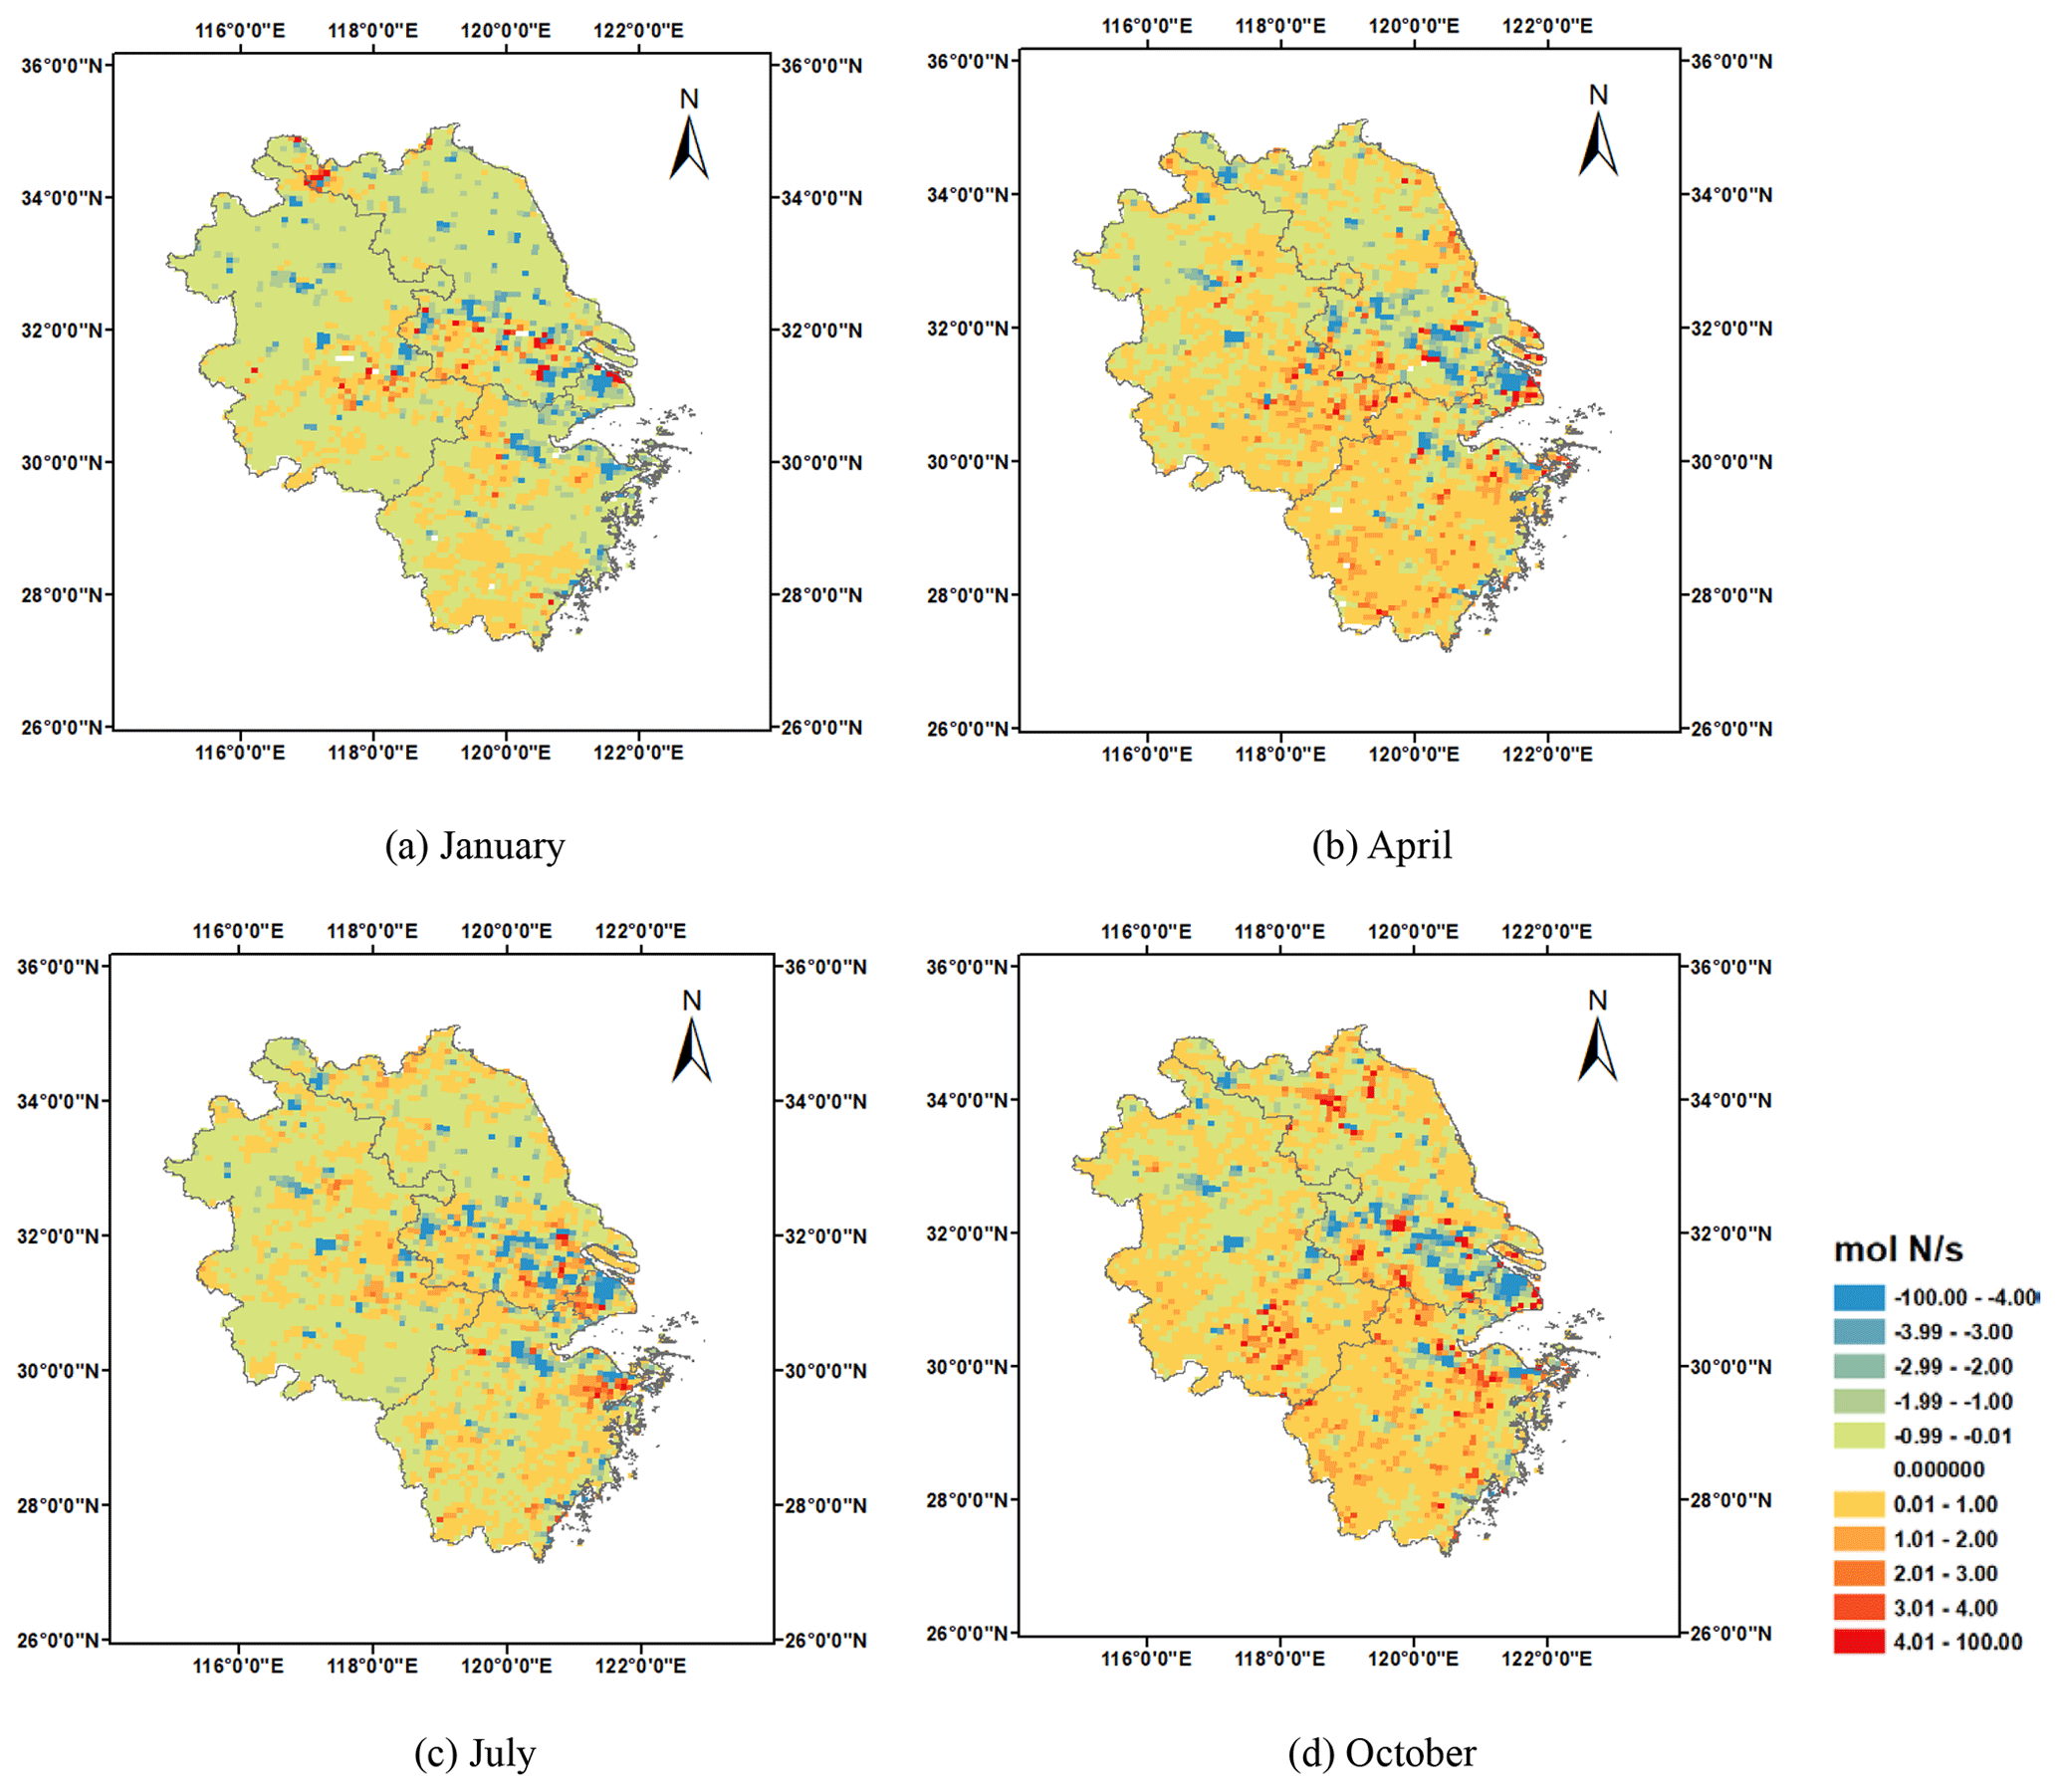
Figure 3The spatial differences between the bottom-up and top-down estimates of NOx emissions for January, April, July, and October 2016 (top-down minus bottom-up, in units of mol N/s).
The differences in the spatial distribution of NOx emissions between the bottom-up and top-down estimates are illustrated by month for the YRD in Fig. 3. The top-down estimates were commonly smaller than the bottom-up ones in the east–central YRD, with intensive manufacturing industry and high population, and larger than those in most of Zhejiang Province, with more hilly and suburban regions. The bias might result from the following issues. From a bottom-up perspective, on the one hand, more stringent control measures were preferentially conducted for power and industrial plants in regions with heavier air pollution like the east–central YRD. As mentioned above, the effects of such actions were difficult to fully track in the bottom-up inventory, leading to the overestimation of emissions for those regions. Due to the lack of precise locations of individual industrial plants (except for large point sources), moreover, the spatial allocation of the emissions relied commonly on the densities of population and economy, assuming a strong correlation with emissions for them. Such an assumption, however, would not still hold in recent years, as a number of factories in the relatively developed region have been moved to less developed suburban regions (e.g., southern Zhejiang) for both environmental and economic purposes. The insufficient consideration of the moving of emission sources is thus expected to result in the overestimation of emissions for developed regions and underestimation for the less developed. On the other hand, the satellite-derived TVCDs were relatively small in southern Zhejiang (Fig. S1), and a larger error in the satellite retrieval, and thereby emissions constrained with the inversed modeling, was expected.
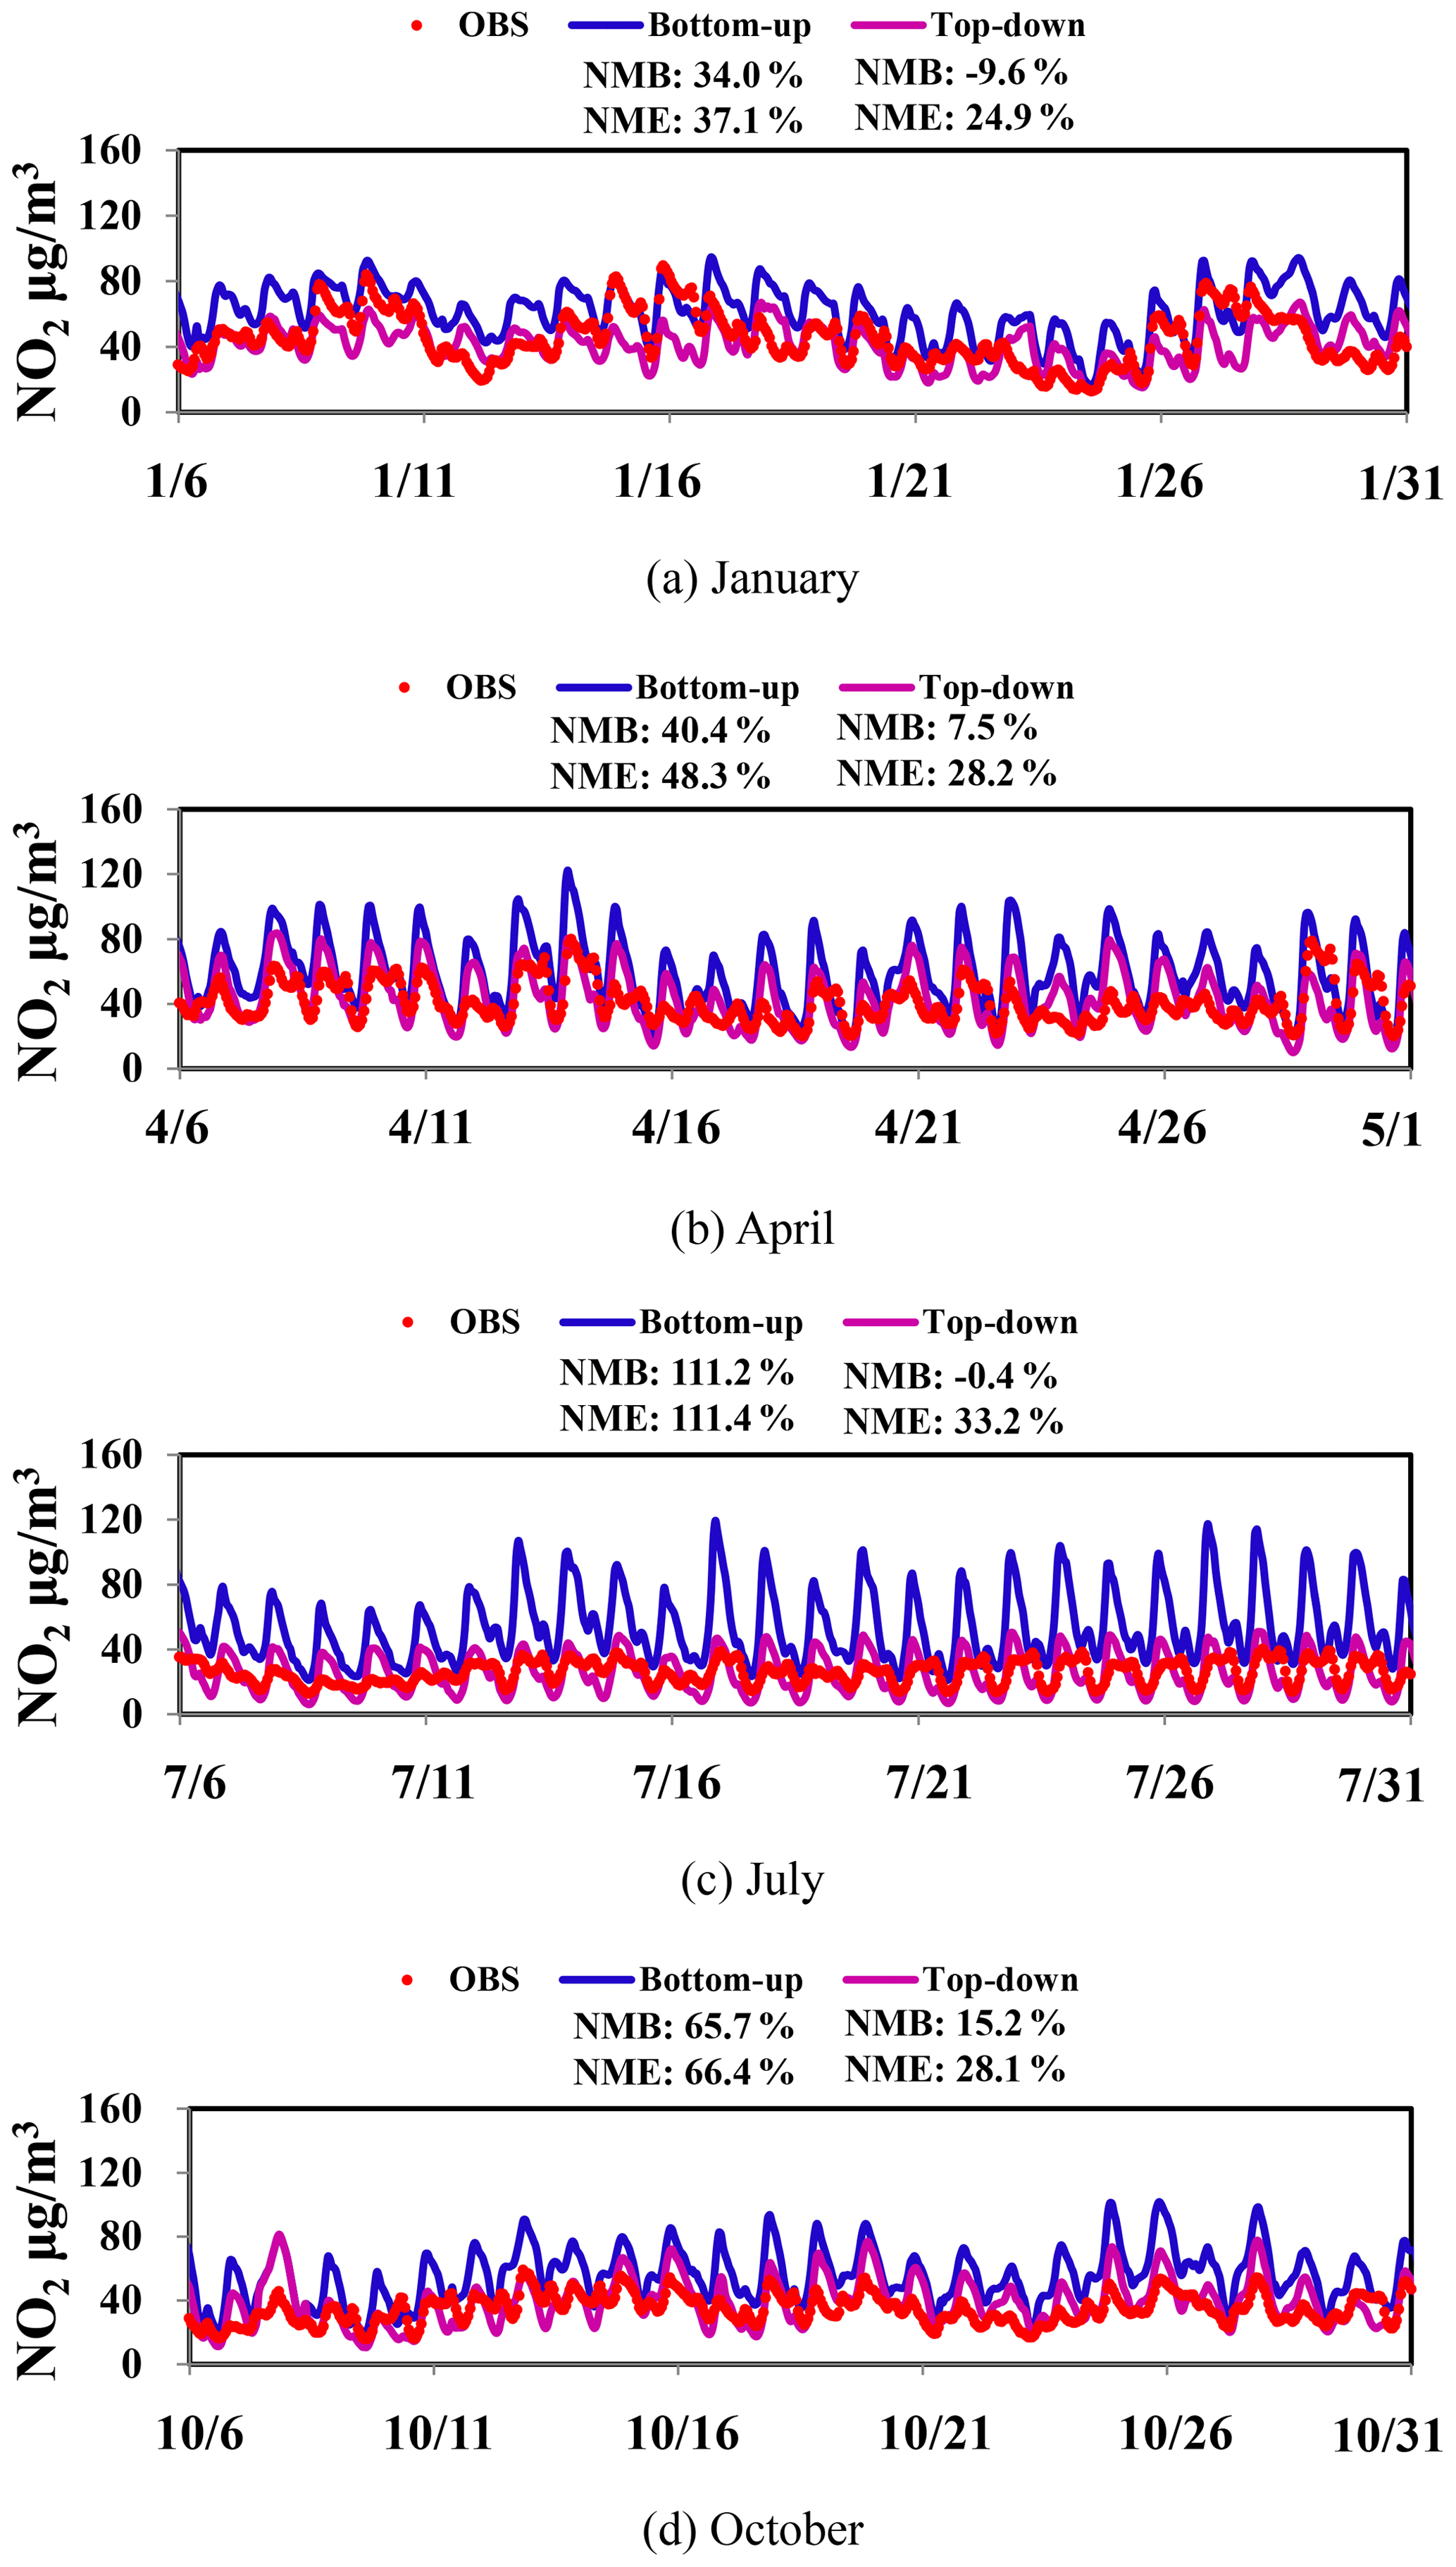
Figure 4The observed and simulated hourly NO2 concentrations based on the bottom-up and top-down NOx emissions for January, April, July, and October 2016.
Figure 4 illustrates the observed and simulated hourly NO2 concentrations using the bottom-up and top-down estimates of NOx emissions in the CMAQ by month. The NO2 concentrations simulated with the bottom-up estimates were clearly larger than the observations in all the 4 months concerned, with the largest and smallest normalized mean bias (NMB) reaching 111 % and 34 % for July and January, respectively. The result suggests again the overestimation in NOx emissions in the current bottom-up inventory for the YRD. The model performance based on the top-down estimates was much better than that based on the bottom-up ones, indicating that the inversed modeling with the satellite observation constraint effectively improved the estimation of NOx emissions. The biggest improvement was found for July, with the NMB reduced from 111 % to −0.4 % and the NME reduced from 111 % to 33 %. As shown in Fig. 2, a relatively big reduction from the bottom-up to top-down estimation in NOx emissions was found for July compared to most of the other months.
Scatter plots of the annual means of the observed and simulated surface NO2 concentrations are shown in Fig. S2 in the Supplement. The slope between the observations and simulation with the top-down estimate (0.99) was much closer to 1 than that with the bottom-up one (1.57), indicating clearly the advantage of the top-down method for constraining the magnitude of the total emissions in the YRD region. The difference in the two slopes implies that the surface NO2 concentrations simulated with the bottom-up estimation were over 50 % larger than those based on top-down ones. As a comparison, the total emissions in the bottom-up inventory were only 30 % larger than the top-down estimation for the whole YRD region. The larger overestimation in the concentrations than the emissions from the bottom-up inventory could result partly from the bias of the locations of state-operated ground observation sites. Most of these sites were located in the urban areas where excess emissions were allocated according to the high density of economy and population, and elevated concentrations were thus simulated compared to rural areas. The similar correlation coefficients (R) suggested that the spatial distribution of NOx emissions was not greatly improved in the top-down estimation on an annual basis of urban observations. Uncertainty existed in the satellite observations: the NMB between NO2 TVCDs in POMINO and available ground-based MAX-DOAS observations was 21 % on cloud-free days (Liu et al., 2019). Due mainly to the NOx transport, moreover, a bias of 13 %–33 % on the spatial distribution of emissions was estimated for the inversed method at the horizontal resolution of 9 km or finer (Yang et al., 2019b). Inclusion of more available observations in rural areas helps improve the comprehensive evaluation of emission estimation.
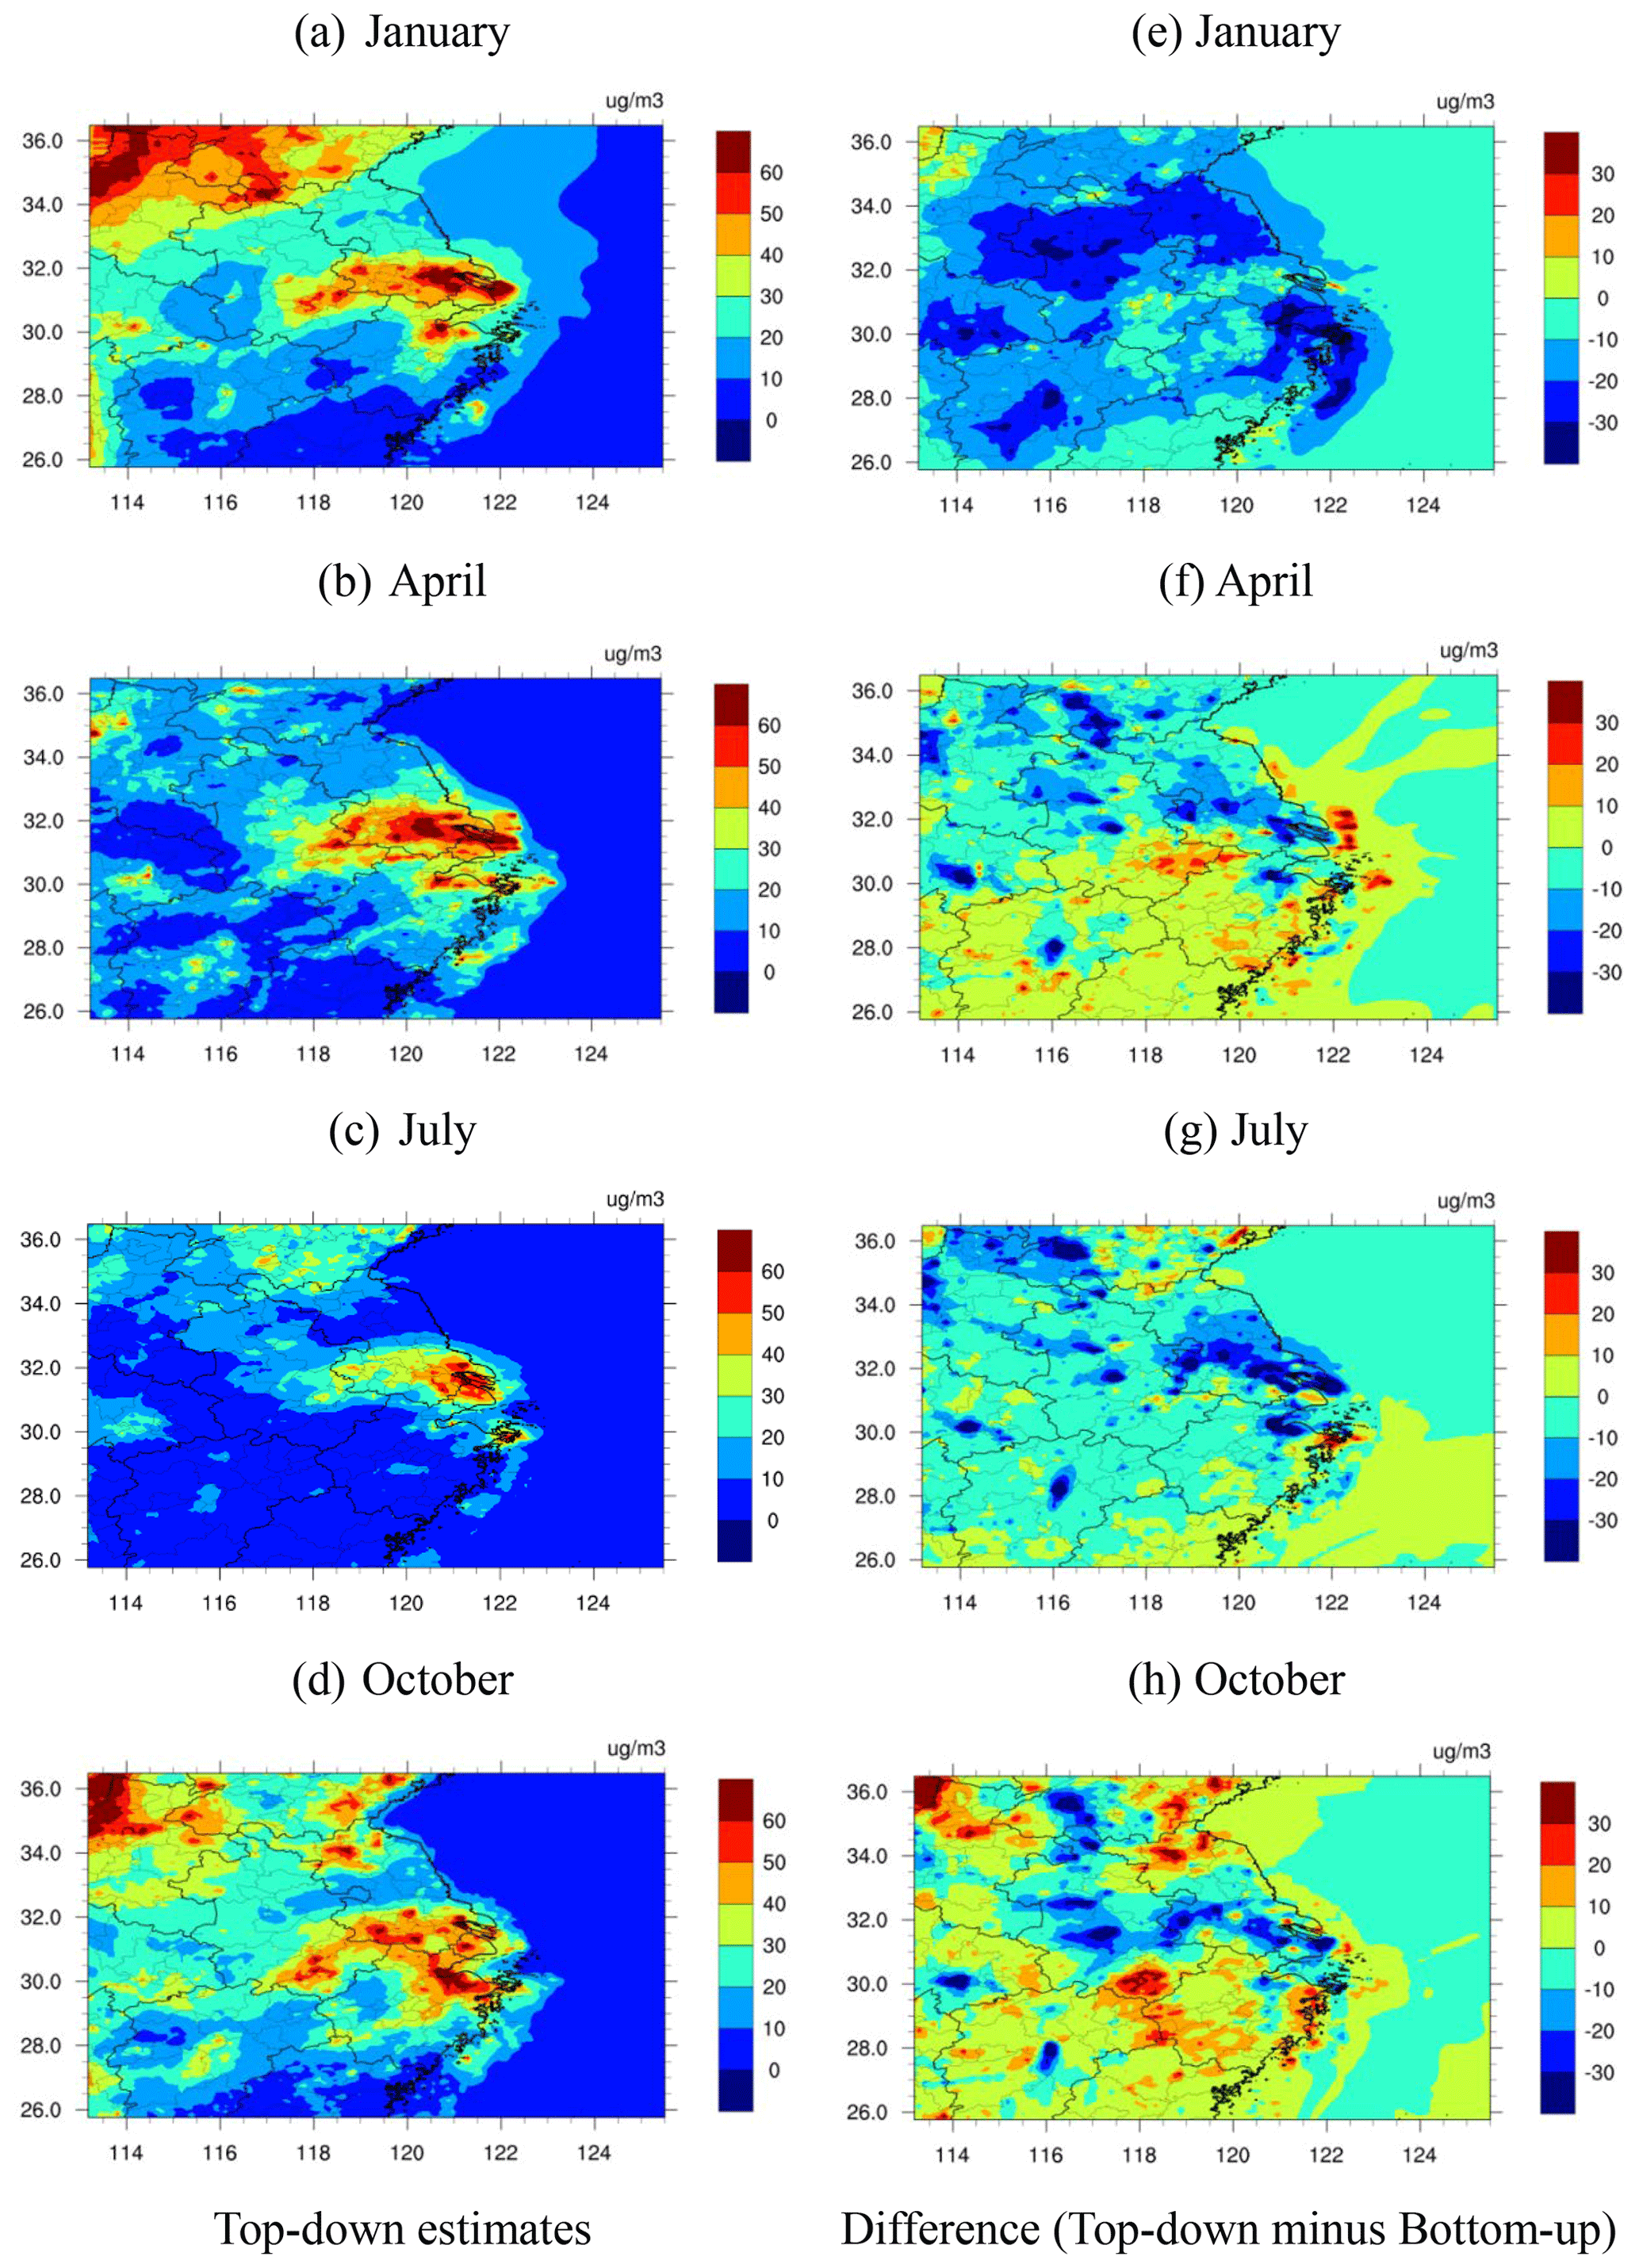
Figure 5The spatial distribution of the simulated monthly mean NO2 concentration with the top-down estimates and differences between the simulations with the top-down and bottom-up NOx emissions in January, April, July, and October 2016 (top-down minus bottom-up).
Figure 5 illustrates the spatial distribution of monthly mean NO2 concentrations simulated based on the top-down estimates and the differences between the simulations with the top-down and bottom-up ones. The larger NO2 concentrations existed in the east–central YRD for all the months (left column in Fig. 5), and the difference in the spatial distribution of NO2 concentrations (right column in Fig. 5) was similar to that in NOx emissions (Fig. 3). Larger reduction in NO2 concentrations based on the top-down estimates was commonly found in the east–central YRD, while the increased concentrations were found in most of Zhejiang.
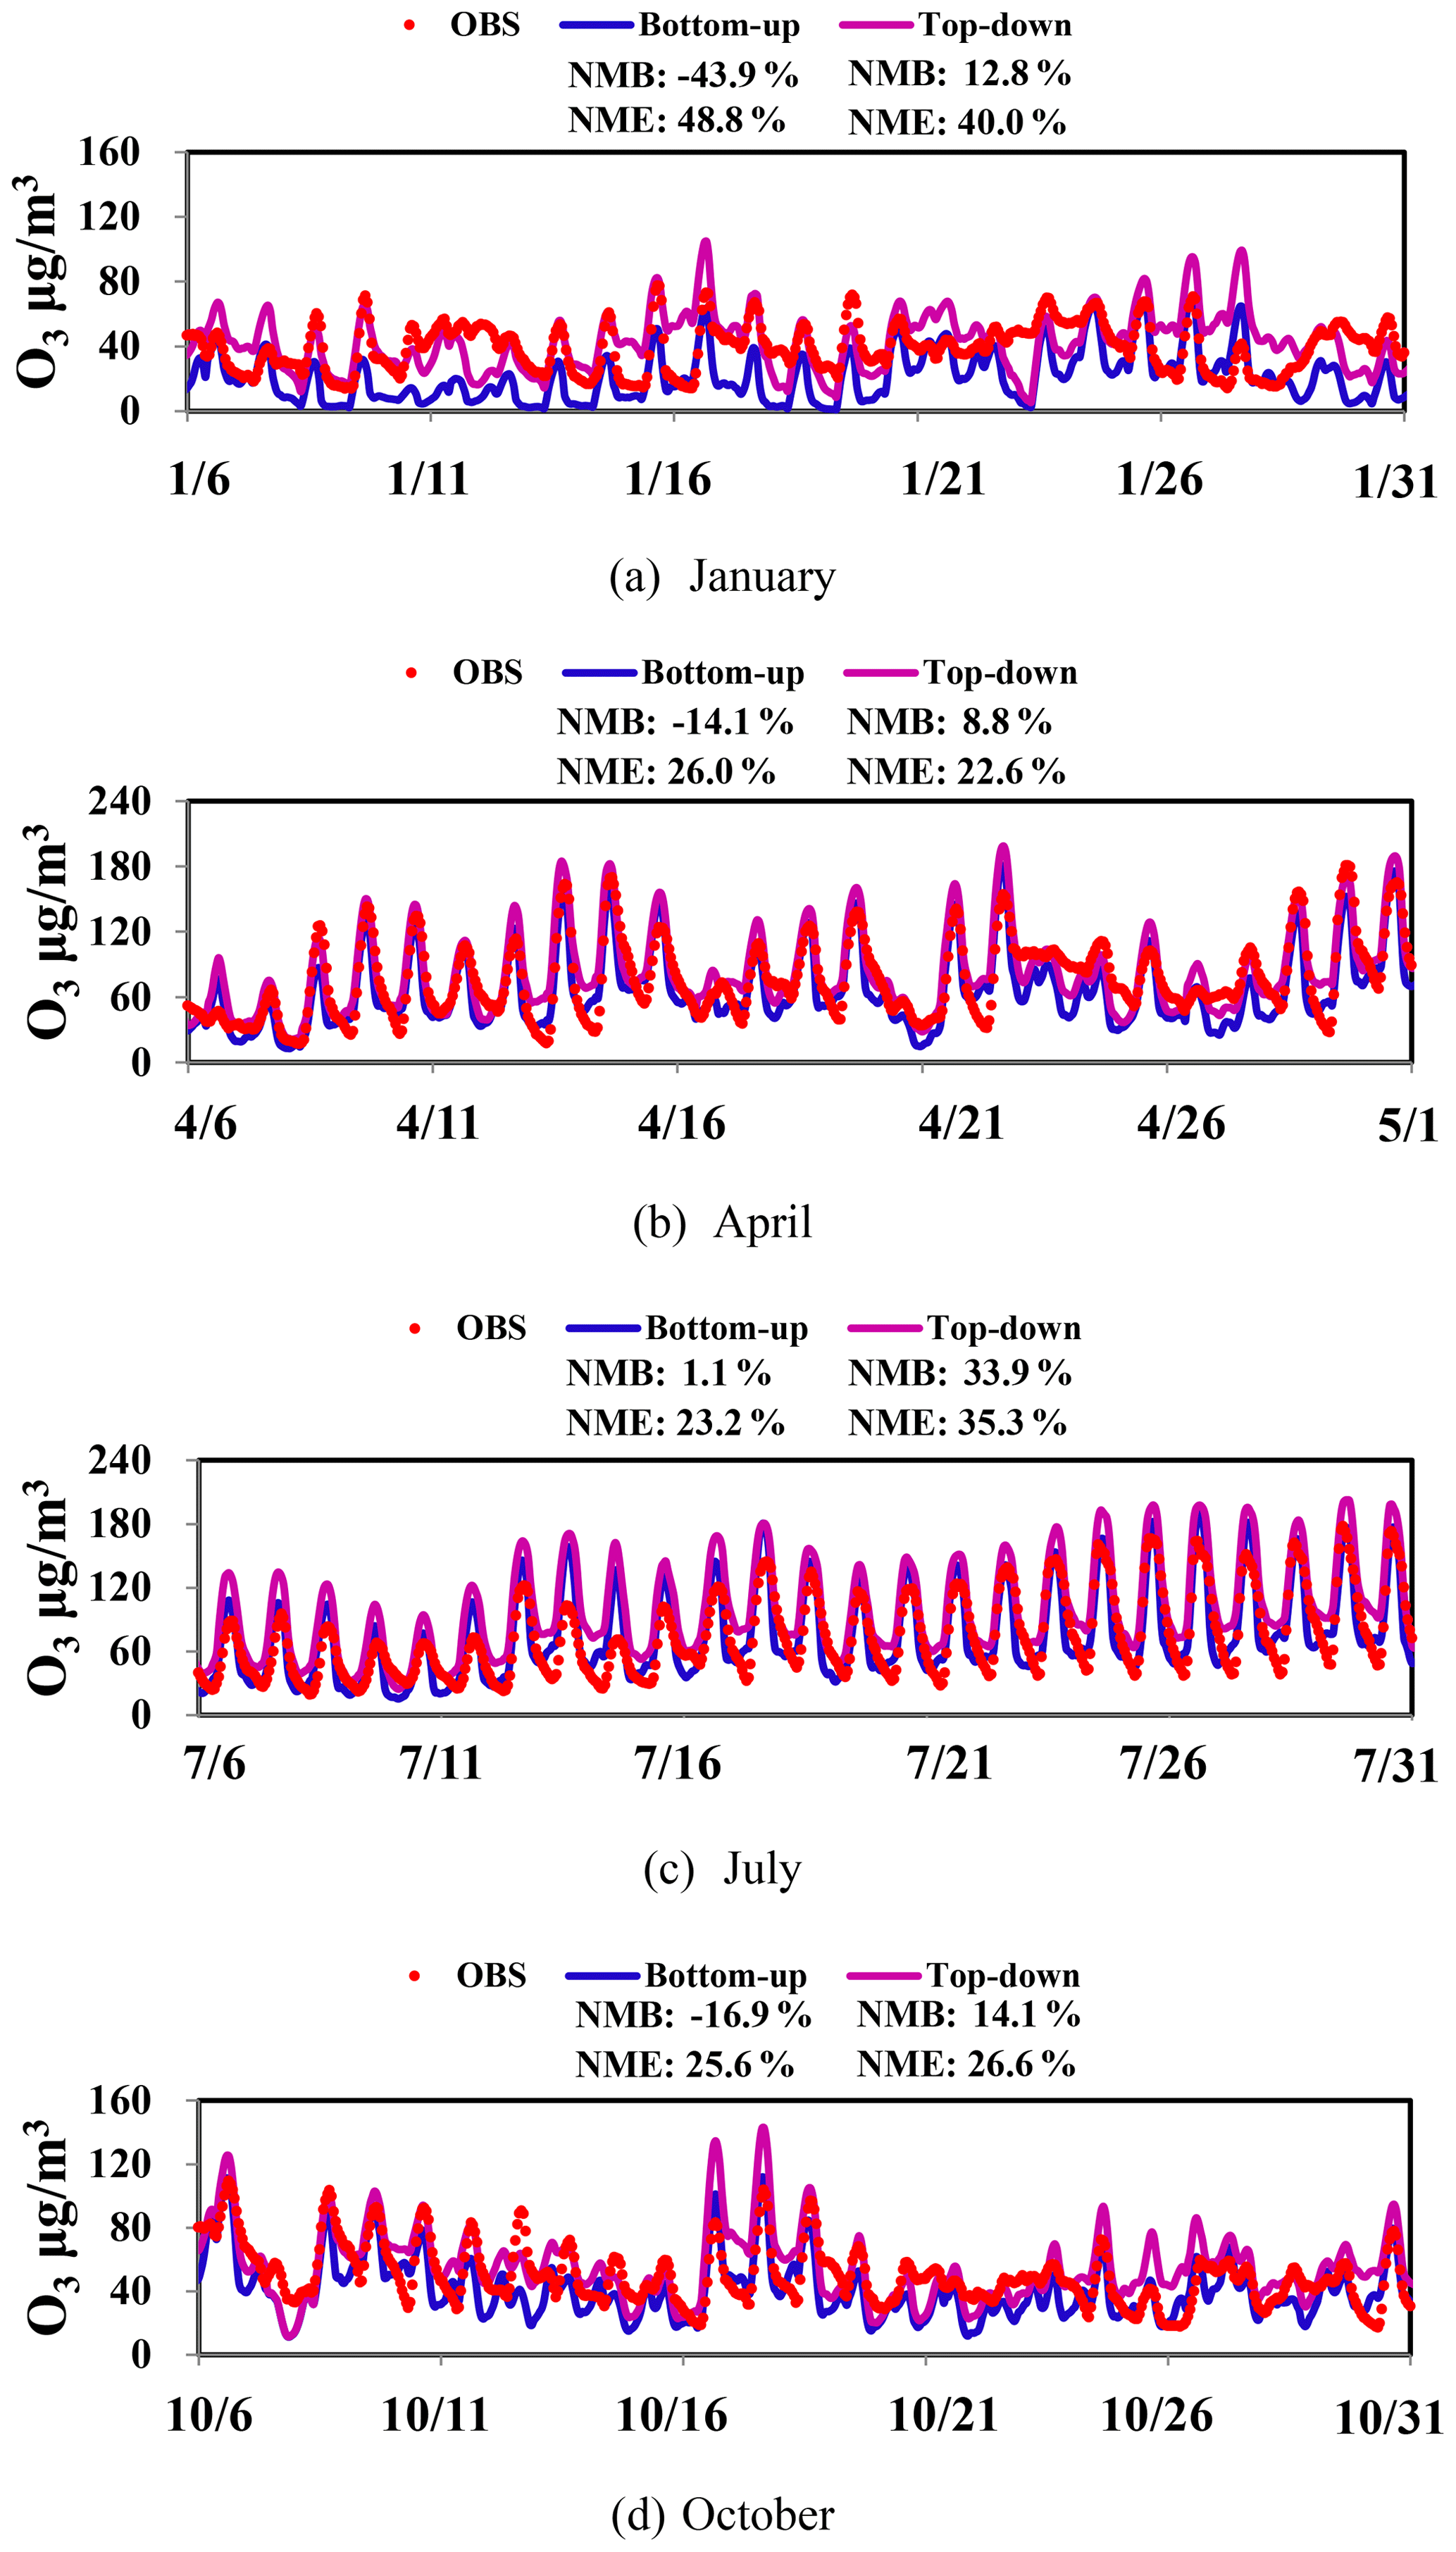
Figure 6The observed and simulated hourly O3 concentrations with the bottom-up and top-down NOx emission estimates for January, April, July, and October 2016.
3.2 Evaluation of the O3 simulation based on the top-down NOx estimates
Figure 6 shows the observed and simulated hourly O3 concentrations based on the bottom-up and top-down estimates of NOx emissions by month. Indicated by the smaller NMBs and NMEs, the model performance of O3 based on the top-down estimates was better than that based on the bottom-up ones for most months. It suggests that the constrained NOx emissions with satellite observations could play an important role in the improvement of O3 simulation. The largest improvement was found in January, for which the NMB and NME were changed from −44 % and 49 % to 13 % and 40 %, respectively, attributed to the biggest change in NOx emissions between the top-down and bottom-up estimates for the month. The worse O3 modeling performance was found for July when the top-down estimate instead of the bottom-up one was applied in the simulation, indicated by the increased NMB and NME. Since the top-down estimation of NOx emissions was justified by the improved NO2 simulation in July (Fig. 4c), the worse O3 simulation might result from the uncertainty in emissions of the volatile organic compounds (VOCs) and the chemical mechanism of the AQM in summer. As suggested by Li (2019), the biogenic VOC (BVOC) emissions of the YRD region could be overestimated by 121 % in summer attributed to ignoring the effect of droughts, and such overestimation might elevate the O3 concentrations in the AQM. In order to explore the influence of the uncertainty of BVOC emissions on O3 model performance, we conducted an extra case in which the BVOC emissions were cut by 50 % in CMAQ. As shown in Fig. S3 in the Supplement, the NMB between the observed and simulated O3 based on the top-down estimate of NOx emissions and the reduced BVOC emissions declined 27 % in July. However, it was still larger than the NMB at 1.1 % when the bottom-up estimate of NOx emissions was applied (Fig. 4c). This comparison thus suggested that the complicated mechanism for summer O3 formation was insufficiently considered in the current model. A recent study conducted an intercomparison of surface-level O3 simulation from 14 state-of-the-art chemical transport models and implied that the larger overestimation of summer O3 than winter for eastern China resulted possibly from the uncertainty in the photochemical treatment in models (Li et al., 2019).
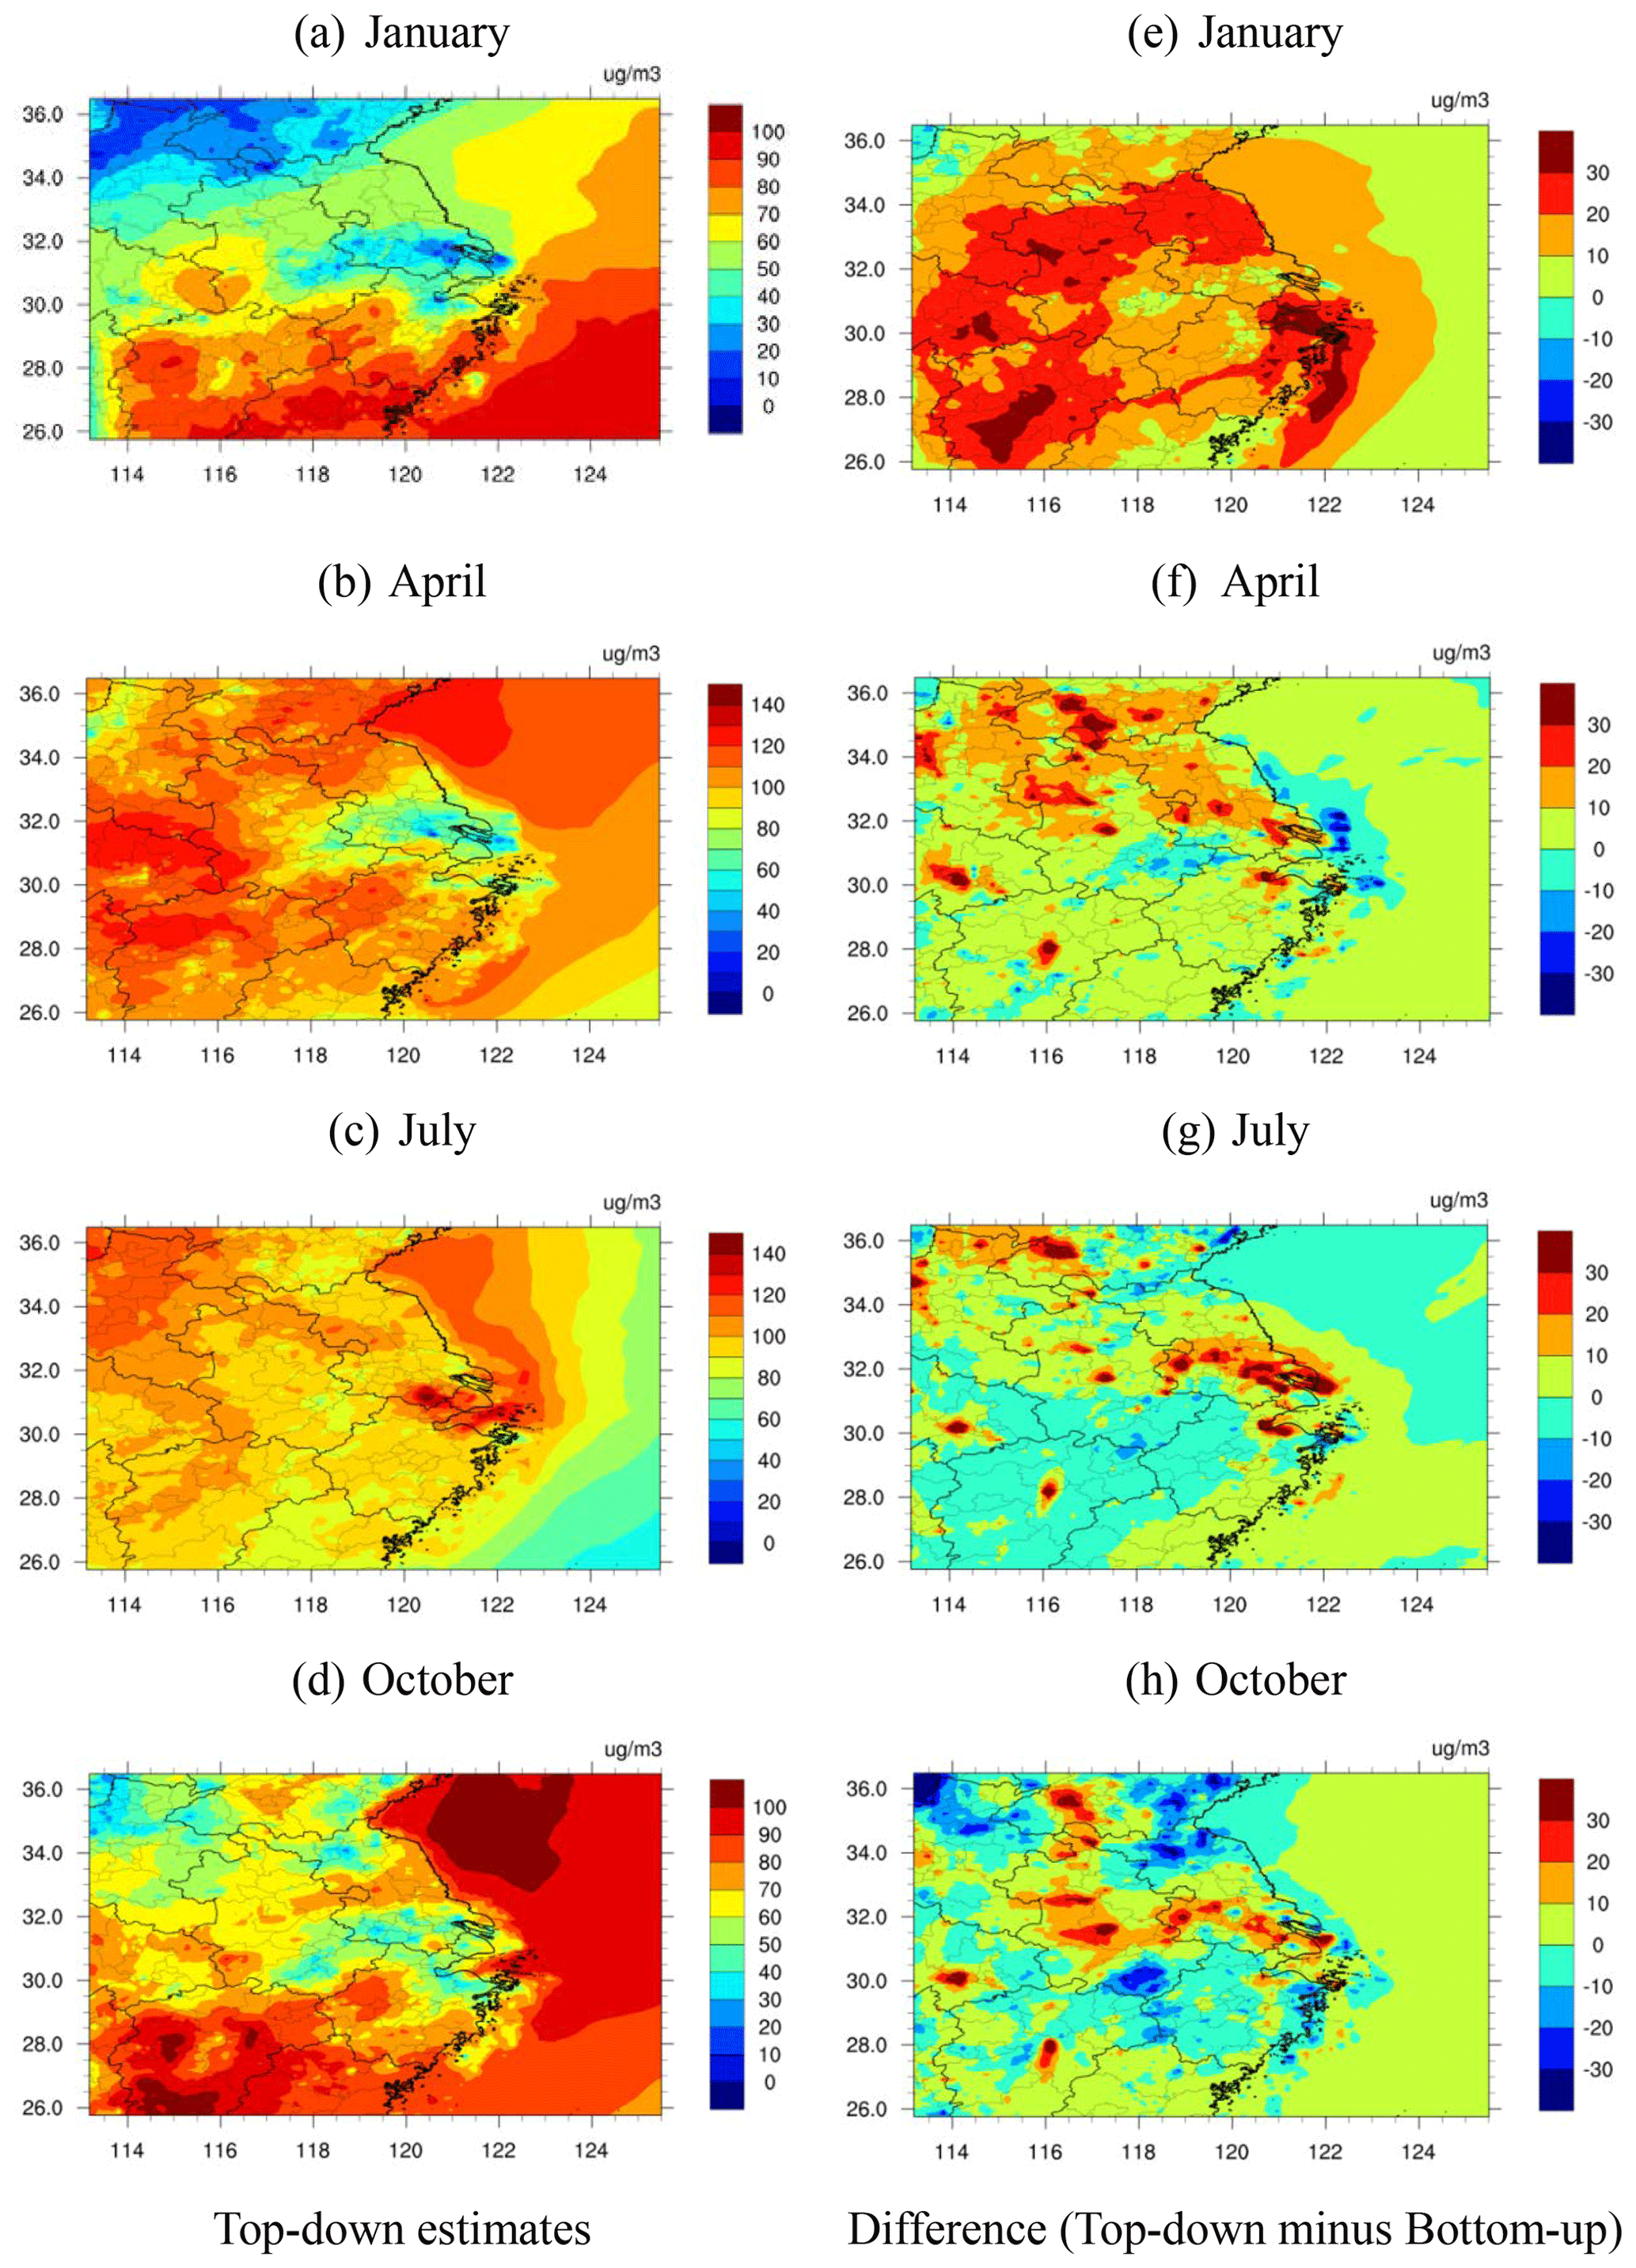
Figure 7The spatial distribution of the simulated monthly mean O3 concentration with the top-down NOx estimates and the spatial differences between the simulations with the top-down and bottom-up NOx emissions in January, April, July, and October 2016 (top-down minus bottom-up).
Table 1The model performance statistics of daily maximum 8 h averaged (MDA8) O3 concentrations in January, April, July, and October 2016 with the bottom-up and top-down NOx emissions.

Table 1 summarizes the observed and simulated daily maximum 8 h averaged (MDA8) O3 concentrations based on the bottom-up and top-down estimates of NOx emissions and summarized by month for the YRD region. The MDA8 O3 concentrations simulated with the top-down estimates were larger than those with the bottom-up ones and were closer to the observations for most months. As most of the YRD was identified as a VOC-limited region (Li et al., 2012; Zhou et al., 2017), the reduced NOx emissions with the top-down method enhanced the O3 levels in the AQM. Similar to the hourly concentrations, the most significant improvement for MDA8 was found in January, with the NMB and NME reduced from −35 % and 39 % to 11 % and 28 %, respectively. Moreover, the improvement of April and October for MDA8 was larger than that for the hourly concentrations, indicating that the improved NOx emissions were more beneficial for the simulation of daytime peak O3 concentrations in spring and winter. Figure 7 illustrates the spatial distribution of the monthly mean O3 concentrations simulated based on the top-down NOx estimates and the differences between the simulations with the top-down and bottom-up estimates by month. In contrast to NO2, the smaller O3 concentrations existed in the east–central YRD for most months, as it was identified as a VOC-limited region with a relatively high NO2 level (Wang et al., 2019). Larger O3 concentrations were found for the surrounding regions in the YRD, e.g., southern Zhejiang, attributed partly to the relatively abundant BVOC emissions (Li, 2019). An exception existed for July, with clearly larger O3 concentrations in the east–central YRD. With the largest population density and the most developed economy in the YRD, the area contains a large number of chemical industrial plants and solvent storage, transportation, and usage (Zhao et al., 2017). High temperature in summer promoted the volatilization of chemical products and solvent and thereby enhanced the seasonal VOC emissions more significantly compared to other less developed YRD regions. Moreover, the lowest NO2 concentration found in summer helped increase the O3 concentration for the region (Gu et al., 2020). Regarding the simulation difference with two emission estimates, application of the top-down estimates instead of the bottom-up ones elevated the O3 concentrations in most of the YRD region. In particular, the big reduction in NOx emissions for the east–central YRD (Fig. 3) was expected to be responsible for the evident growth in O3 concentrations. As the east–central YRD was identified as a VOC-limited region in terms of O3 formation, the O3 concentration in the region would be elevated along with the reduced NOx emissions, reflecting the negative effect of NOx control on O3 pollution alleviation (Wang et al., 2019).
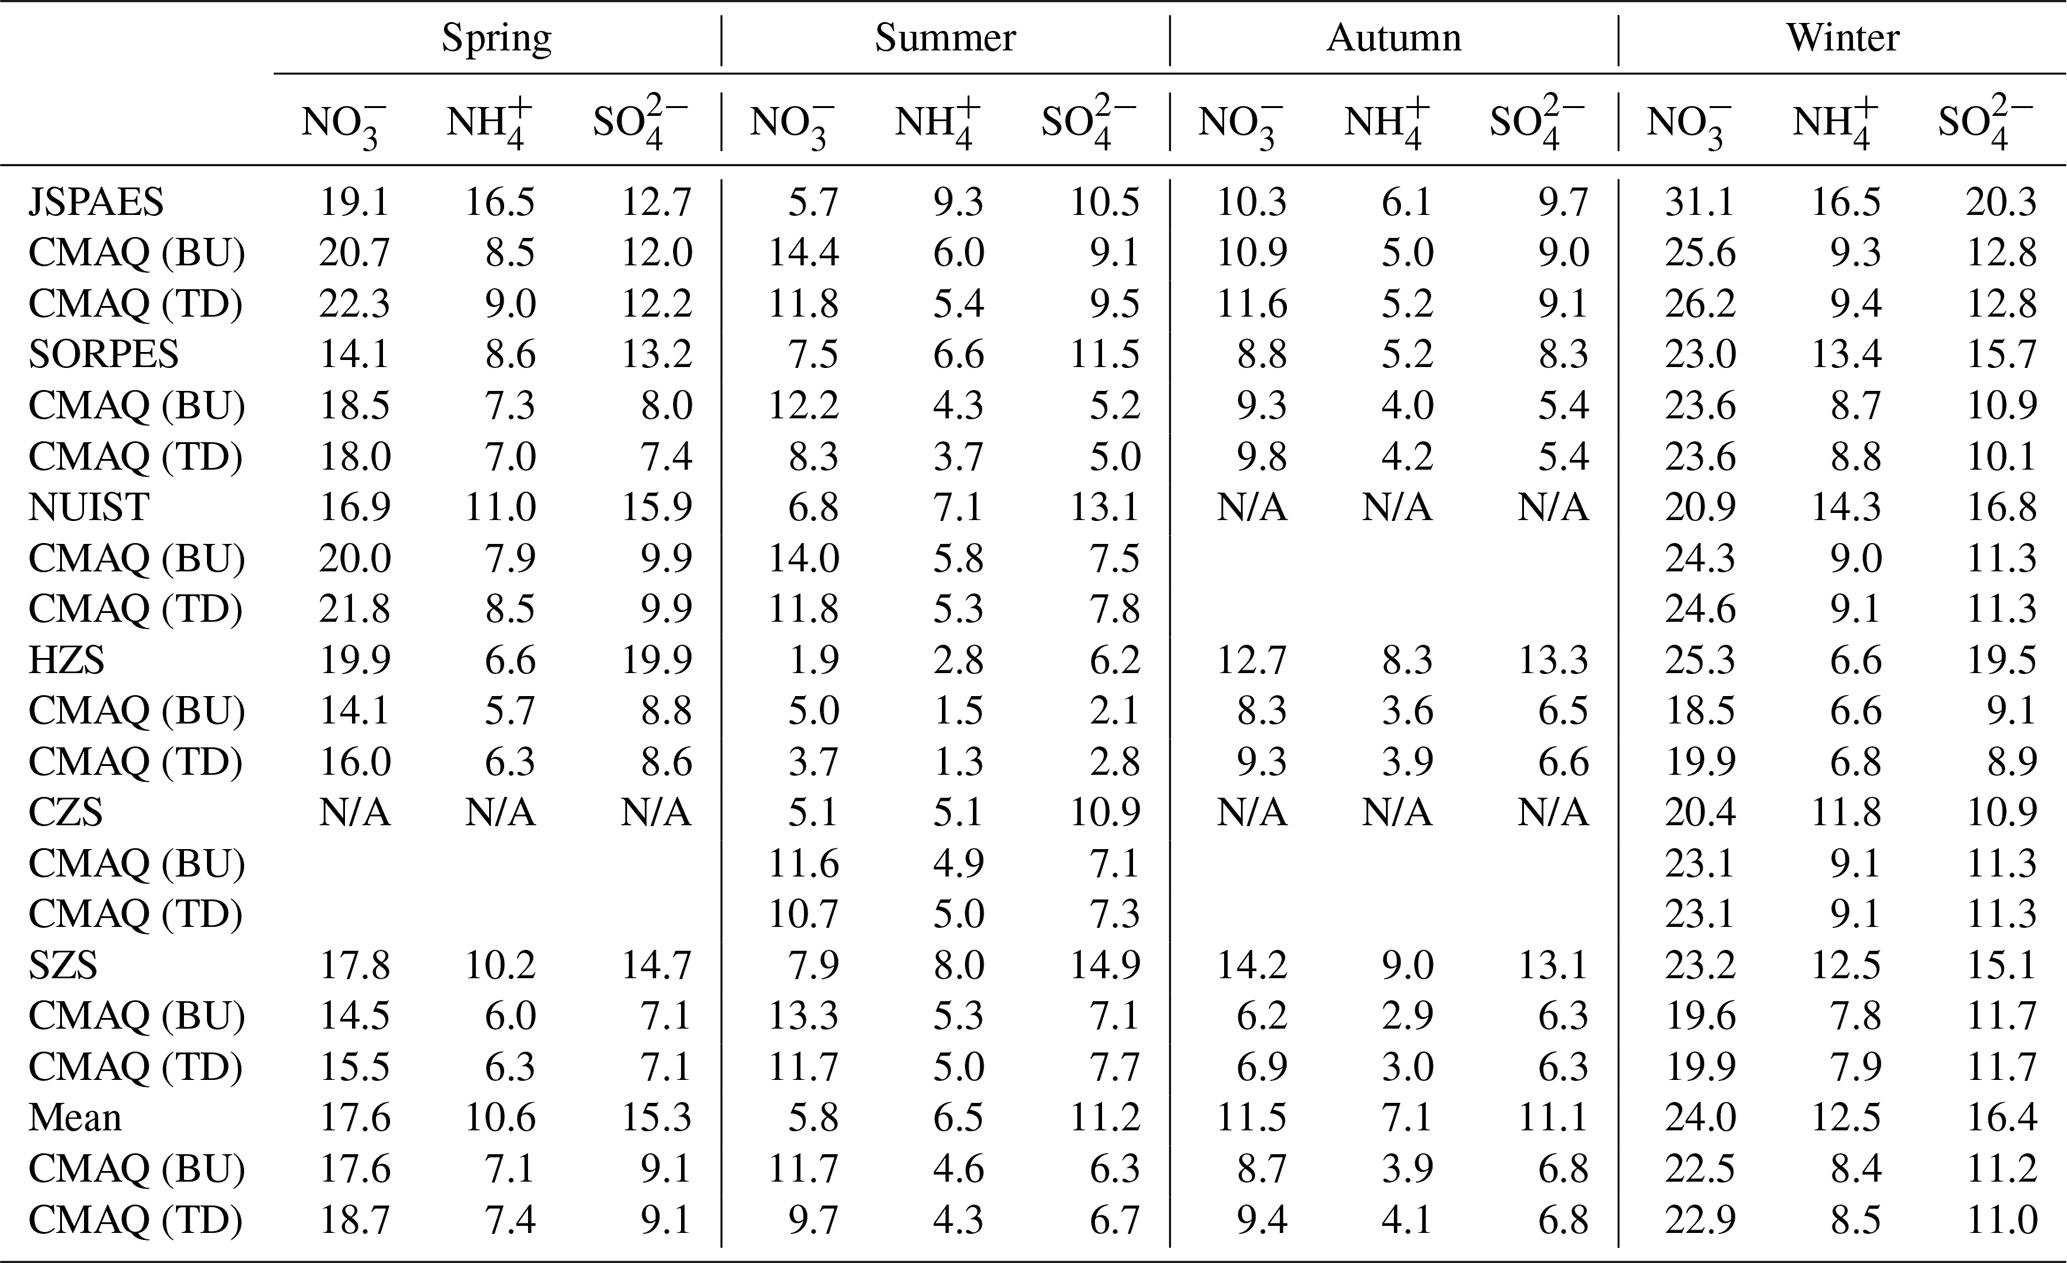
Table 2Comparison of observed and simulated NO, NH, and SO concentrations by site and season in 2016 (unit: µg/m3). The information on SNA observation sites is provided in Table S2 in the Supplement. BU and TD indicate the CMAQ modeling with the bottom-up and top-down estimate of NOx emissions, respectively.
3.3 Evaluation of SNA simulation based on the top-down NOx estimates
Shown in Table 2 is the comparison between the observed and simulated SNA (SO, NO, and NH) concentrations by season. Larger observed and simulated SNA concentrations were found in winter and spring, and smaller concentrations were found in summer and autumn. For most seasons, the simulations of NO concentrations were moderately improved with the top-down estimates of NOx emissions for all the YRD cities concerned, with an exception of Nanjing in autumn. The largest improvement was found in summer, with the mean bias between the simulation and observations reduced 35 % for all the cities involved. Compared to the bottom-up inventory, the commonly smaller NOx emissions in the top-down estimates limited the NO2 concentration and suppressed the formation of NO, while the enhanced O3 from the reduced NOx emissions promoted it (Cai et al., 2017; Huang et al., 2020). In summer, the former dominated the process, with the most evident improvement in NO2 simulation (Fig. 4); thus the reduced NO concentrations that were closer to observations were simulated for all the cities.
The simulations with both top-down and bottom-up estimates of NOx emissions underestimated the NH concentrations for most cases, and such underestimation was slightly corrected with the application of the top-down estimates except for summer. The average change in NH concentrations was 2.3 %, much smaller than that of NO at 14 %. The moderate improvement in NH simulation with the reduced NOx emissions in the top-down estimates resulted partly from the enhancement of the simulated O3 concentrations and thereby the promoted NH formation. In summer, however, the significant drop in the simulated NO2 concentration was assumed to reduce the NO and NH formation and to weaken the consistency between the simulated and observed NH. The difference between the simulated SO with the bottom-up and top-down NOx emission estimates was small for most seasons, implying a limited benefit of improved NOx emissions on SO modeling. Besides emission data, the chemical mechanisms included in the model should be important for the model performance. For example, adding SO2 heterogeneous oxidation in the model could largely improve the sulfate simulation in Nanjing (Sha et al., 2019).
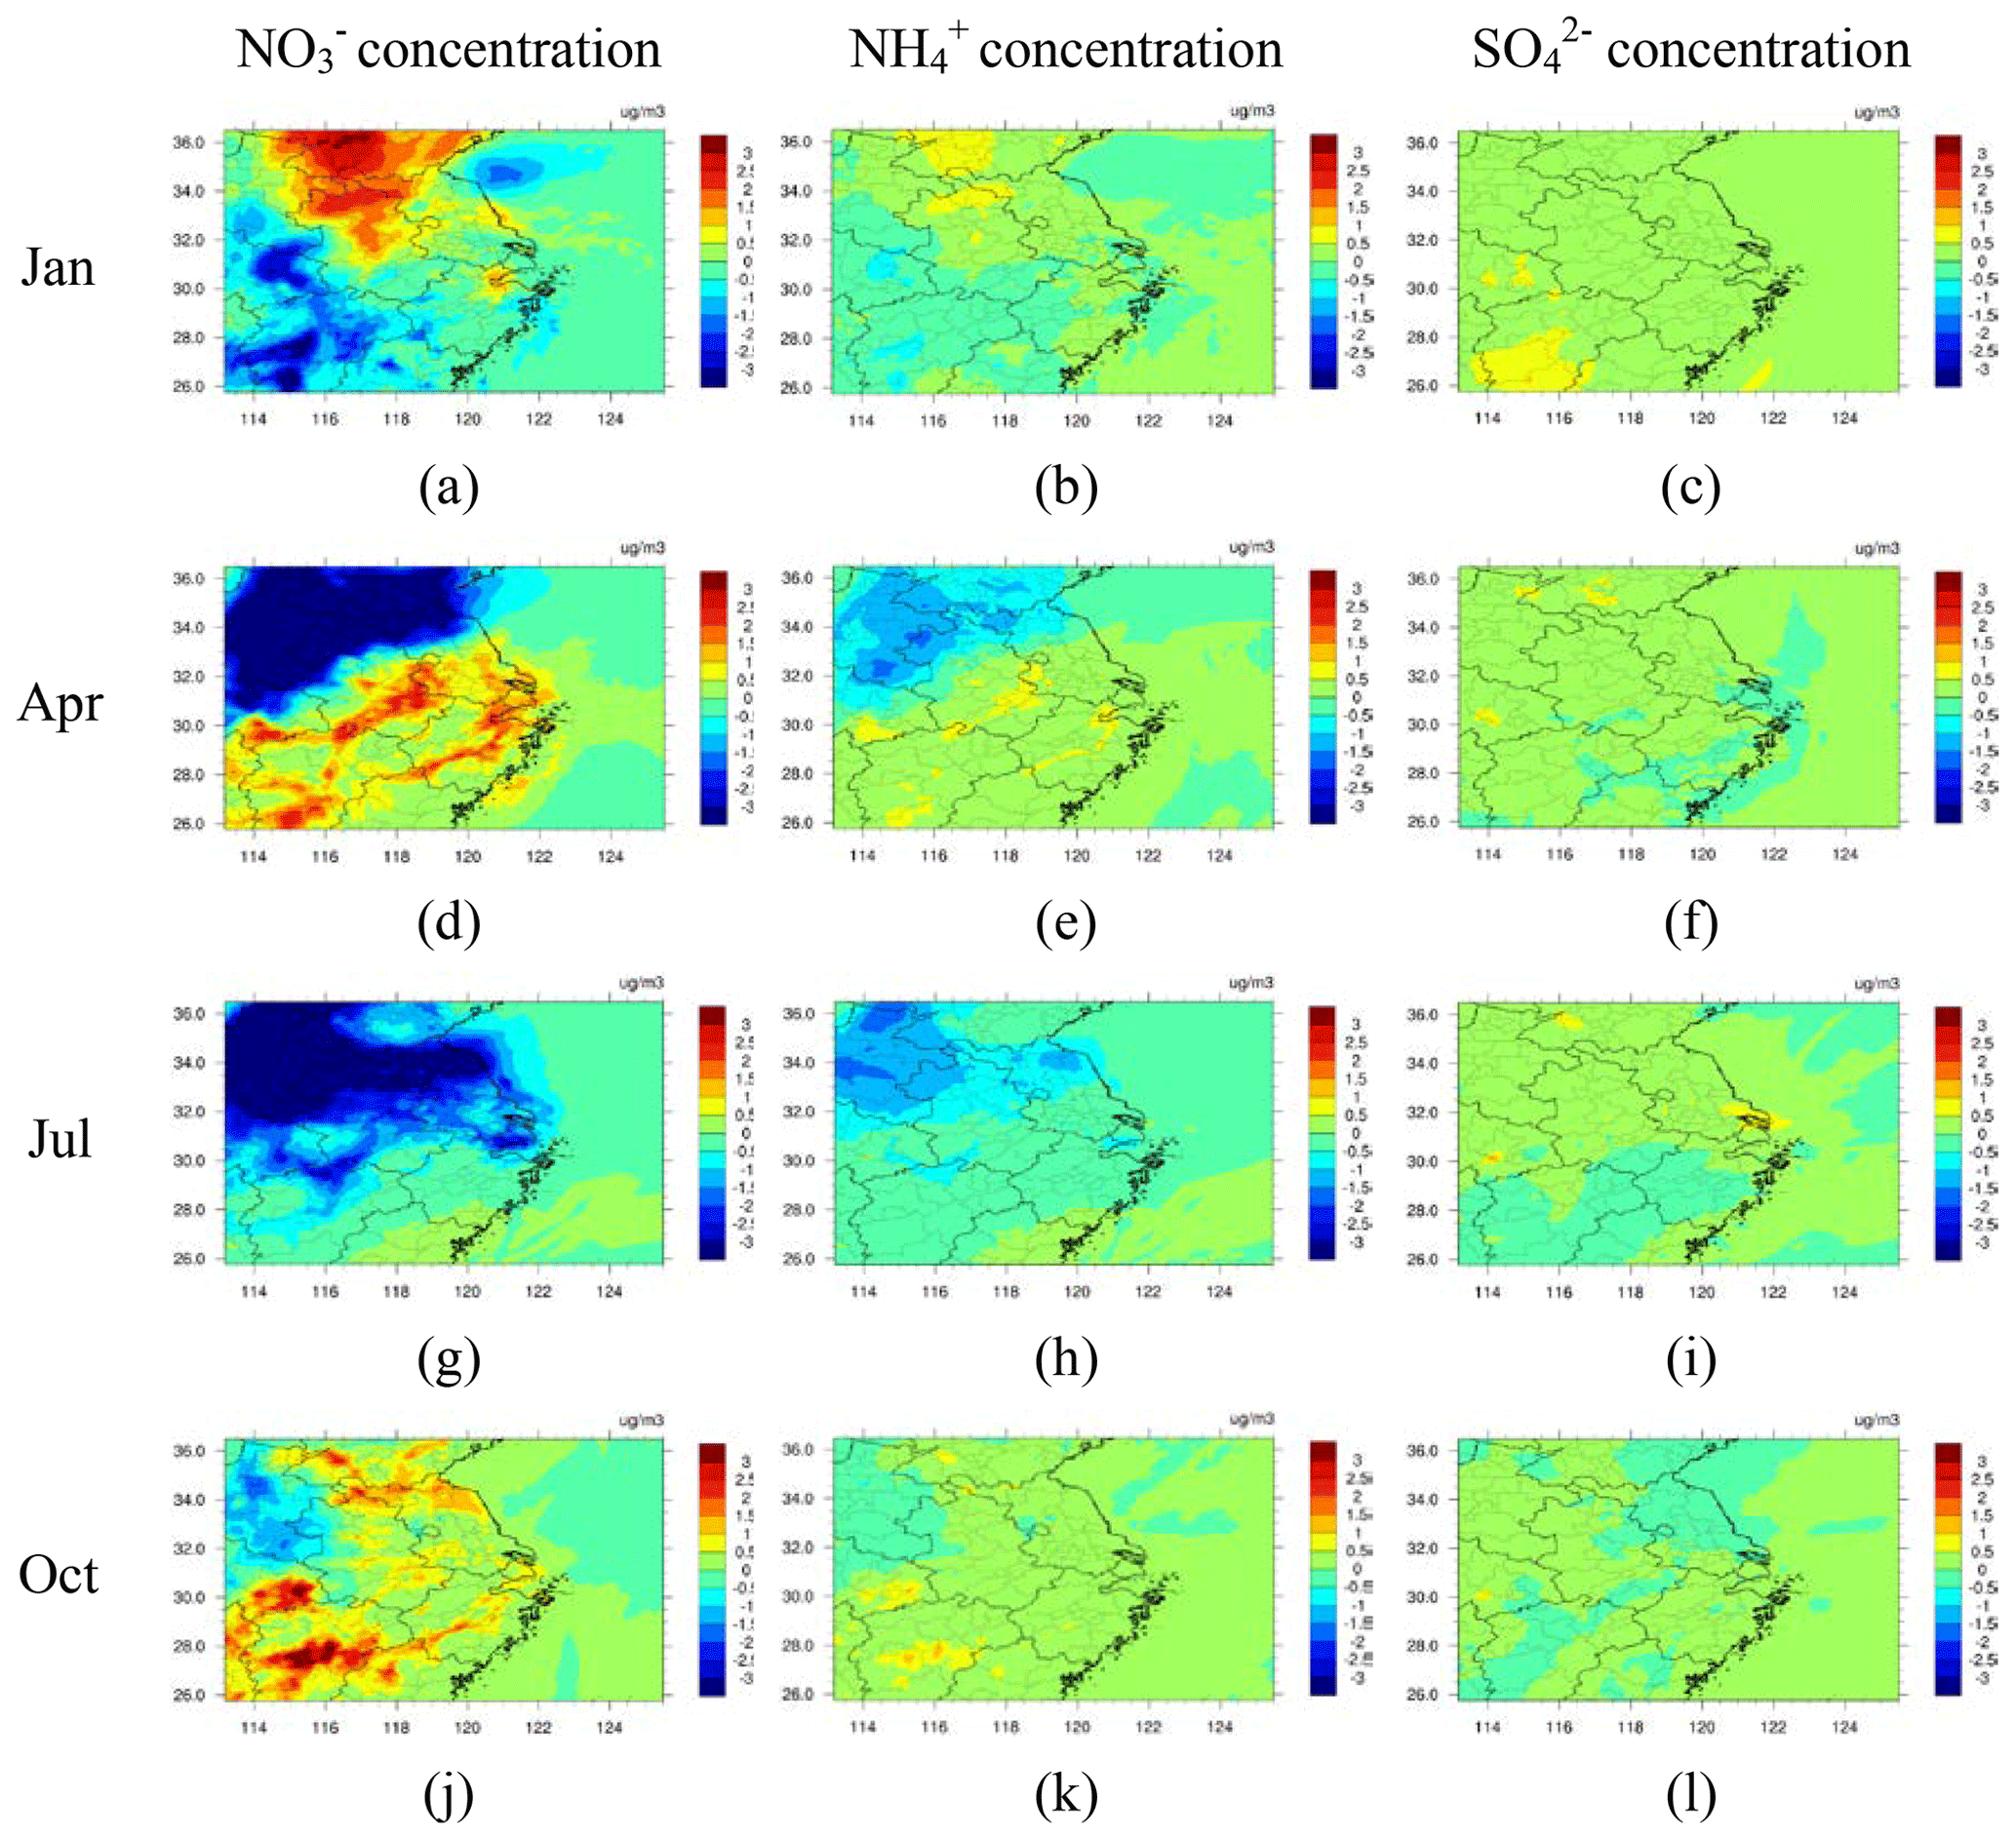
Figure 8The spatial differences between the simulated SNA concentrations with the bottom-up and top-down NOx emission estimates for January, April, July, and October 2016 (top-down minus bottom-up).
Figure 8 shows the differences in the spatial distribution of SNA concentrations simulated with the bottom-up and top-down estimates of NOx emissions by month. In most of the region, the differences of NO concentrations were larger than those of NH and SO for all seasons, and they were mainly controlled by the changed ambient NO2 or O3 level. The difference in spatial pattern of NO was similar to that of O3 for January, and the larger growth attributed to the application of the top-down estimates was found in northern Anhui and eastern Zhejiang (Fig. 8a). The result implies that the change in NO concentration in winter could result partly from the improved O3 simulation; i.e., the elevated O3 was an important reason for the enhanced formation of SNA in winter (Huang et al., 2020). Similarly, the increased NO was found for more than half of the YRD region in April, along with the growth of O3 concentrations (Fig. 8d). For July, however, the difference in spatial pattern of NO (Fig. 8g) was similar to NO2 (Fig. 5g), and the larger reduction attributed to the application of the top-down estimates was found in the northern YRD. The result suggests that the declining NOx emissions and thereby NO2 concentration dominated the reduced NO formation in summer. This was mainly because the reduction of the top-down NOx emission estimate from the bottom-up emission inventory was much larger for July compared to spring or autumn (Fig. 2). In addition, the VOC-limited mechanism in O3 formation was found to be weaker in summer than winter (see Fig. 7e and g), resulting in less O3 formation and thereby nitrate aerosol through oxidation. In October, the growth in NO concentrations was found again in most of the YRD when the top-down estimates were applied (Fig. 8j). The growth in the north resulted mainly from the increased O3 level, while that in the south was associated with the increased NO2. The differences in spatial patterns of simulated NH concentrations were similar to those of NO for the 4 months, suggesting that the change in NH was associated with formation and decomposition of NH4NO3. However, the changes of spatial distribution of SO were similar to those of O3 concentration. Since NH was preferred to react with SO rather than NO (Wang et al., 2013), the formation of SO was mainly influenced by the atmospheric oxidizing capacity when only NOx emissions were changed.
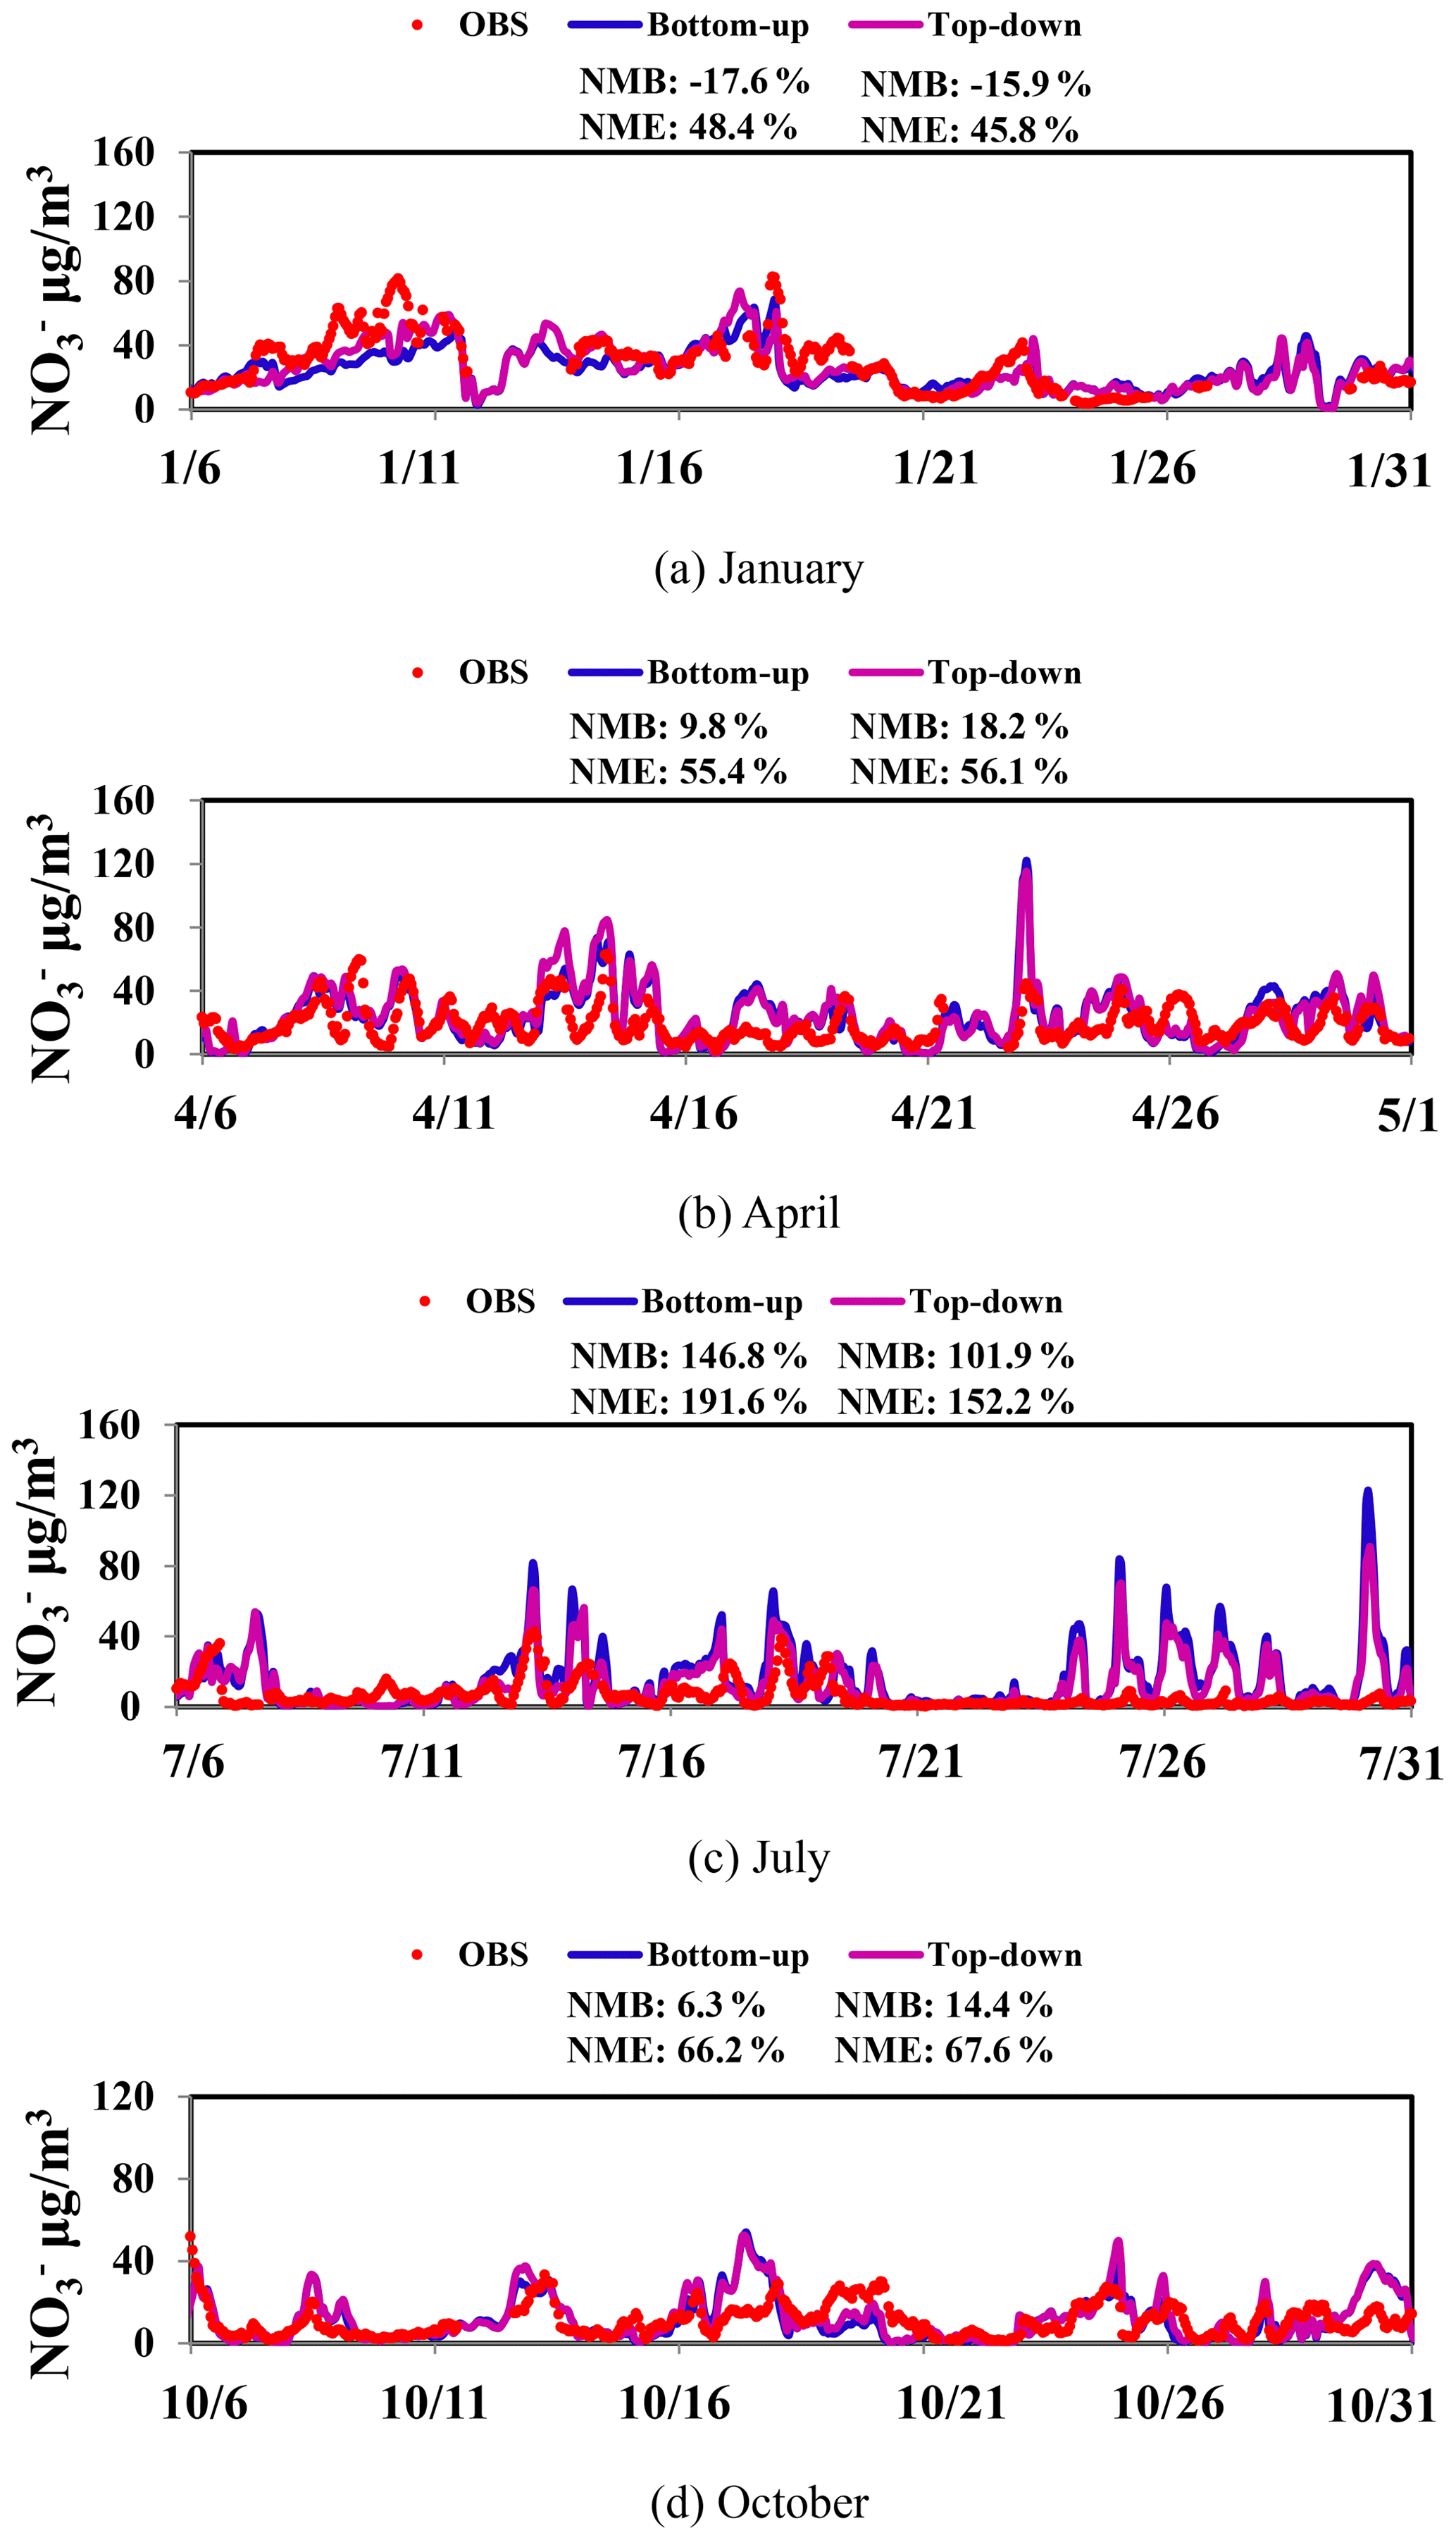
Figure 9The observed and simulated hourly NO concentrations with the bottom-up and top-down NOx emission estimates for January, April, July, and October 2016 at JSPAES.
Figure 9 illustrates the observed and simulated hourly NO concentrations based on the bottom-up and top-down estimate of NOx emissions by month at JSPAES. The NMBs and NMEs for simulation with the top-down emissions were smaller than those with bottom-up ones in January and July, implying the benefit of the improved NOx emissions on hourly NO concentration simulation in winter and summer. The best model performance with the top-down estimates was found in January, with the hourly variation commonly caught with the AQM. However, the NO concentration was seriously overestimated, and the model failed to catch the hourly variations in summer indicated by the large NMB and NME. As shown in Fig. S4 in the Supplement, both the NO2 and O3 concentrations at JSPAES were significantly overestimated for July except O3 with the bottom-up NOx emission estimate, and this partly explained the elevated NO level from the CMAQ simulation.
Figures S5 and S6 in the Supplement compare the observed and simulated hourly concentrations at JSPAES by month for NH and SO, respectively. The NMBs and NMEs for NH simulation with the top-down estimates were smaller than those with the bottom-up ones for most months, while the changes in SO concentration were small. The NH and SO concentrations were largely underestimated with the top-down estimates in January, indicated by the NMB at −44 % and −38 %, respectively. Meanwhile, as shown in Fig. S7 in the Supplement, the SO2 concentrations were overestimated by 61 % at the site. The results thus imply a great uncertainty in the gas–particle partitioning of (NH4)2SO4 formation in the model in winter, attributed probably to the missed oxidation mechanisms of SO2 (Chen et al., 2019c).
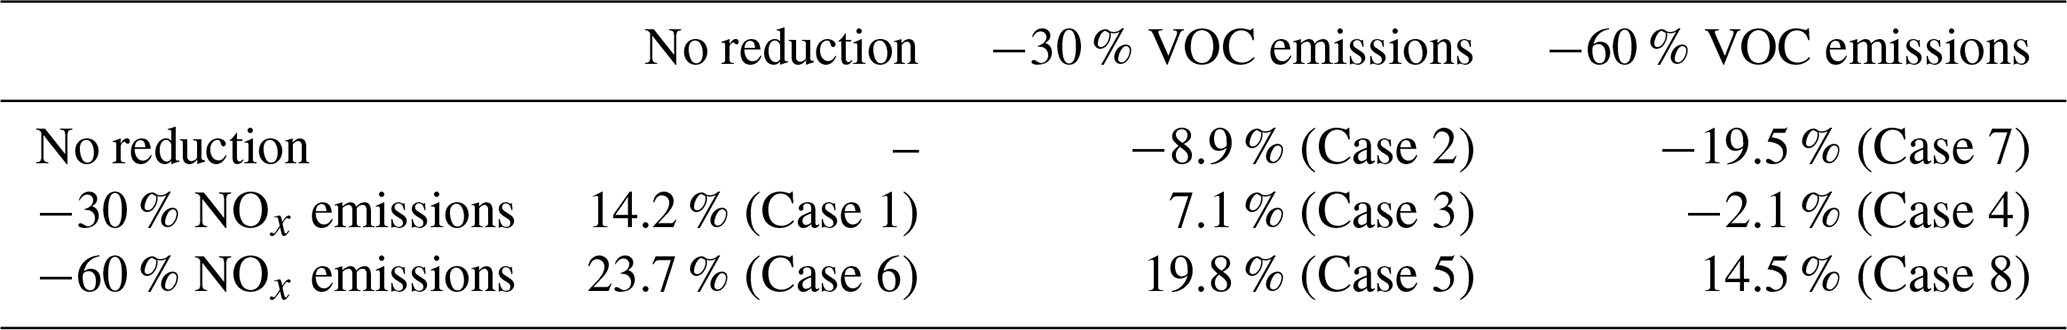
Table 3The changed percentages of ozone concentration based on the sensitivity analysis for April 2016.
3.4 Sensitivity analysis of O3 and SNA formation in the YRD region
Table 3 summarizes the relative changes in the simulated O3 concentrations for April 2016 in different cases. The mean O3 concentration would decline by 8.9 % and 19.5 % with 30 % and 60 % VOC emissions off (Cases 2 and 7), while it would increase by 14.2 % and 23.7 % with 30 % and 60 % NOx emissions off (Cases 1 and 6), respectively. The result confirmed the VOC-limited regime of O3 formation in the YRD region: controlling VOC emissions was an effective way to alleviate O3 pollution, while reducing NOx emissions alone would aggravate O3 pollution.
Table 4The changed percentages of NO, NH, and SO concentrations based on the sensitivity analysis for January 2016.

The growth of O3 concentrations was also found when the reduction rate of NOx emissions was equal to or larger than that of VOCs. The O3 concentration would increase by 7.1 % and 14.5 % respectively when both NOx and VOC emissions were reduced by 30 % and 60 % (Cases 3 and 8), and it would increase by 19.8 % when NOx and VOC emissions were respectively declined by 60 % and 30 % (Case 5). In contrast, small abatement of O3 concentrations (2.1 %) was achieved from the 30 % and 60 % reduction of emissions respectively for NOx and VOCs (Case 4), implying that the O3 level could be restrained when the reduction rate of VOCs was 2 times that of NOx or more. To control the O3 pollution effectively and efficiently, therefore, the magnitude of VOC and NOx emission reduction should be carefully planned and implemented. In actual fact, controlling VOCs is more difficult than NOx. Compared to NOx that come mainly from fossil fuel combustion (Zheng et al., 2018), it is more complicated to identify the sources of specific VOC species that are most active in O3 formation (Wei et al., 2014; Zhao et al., 2017). Moreover, substantial VOC emissions are from fugitive sources, for which emission control technology can hardly be effectively applied. Therefore, it is a big challenge to control O3 pollution by reducing more VOCs than NOx.
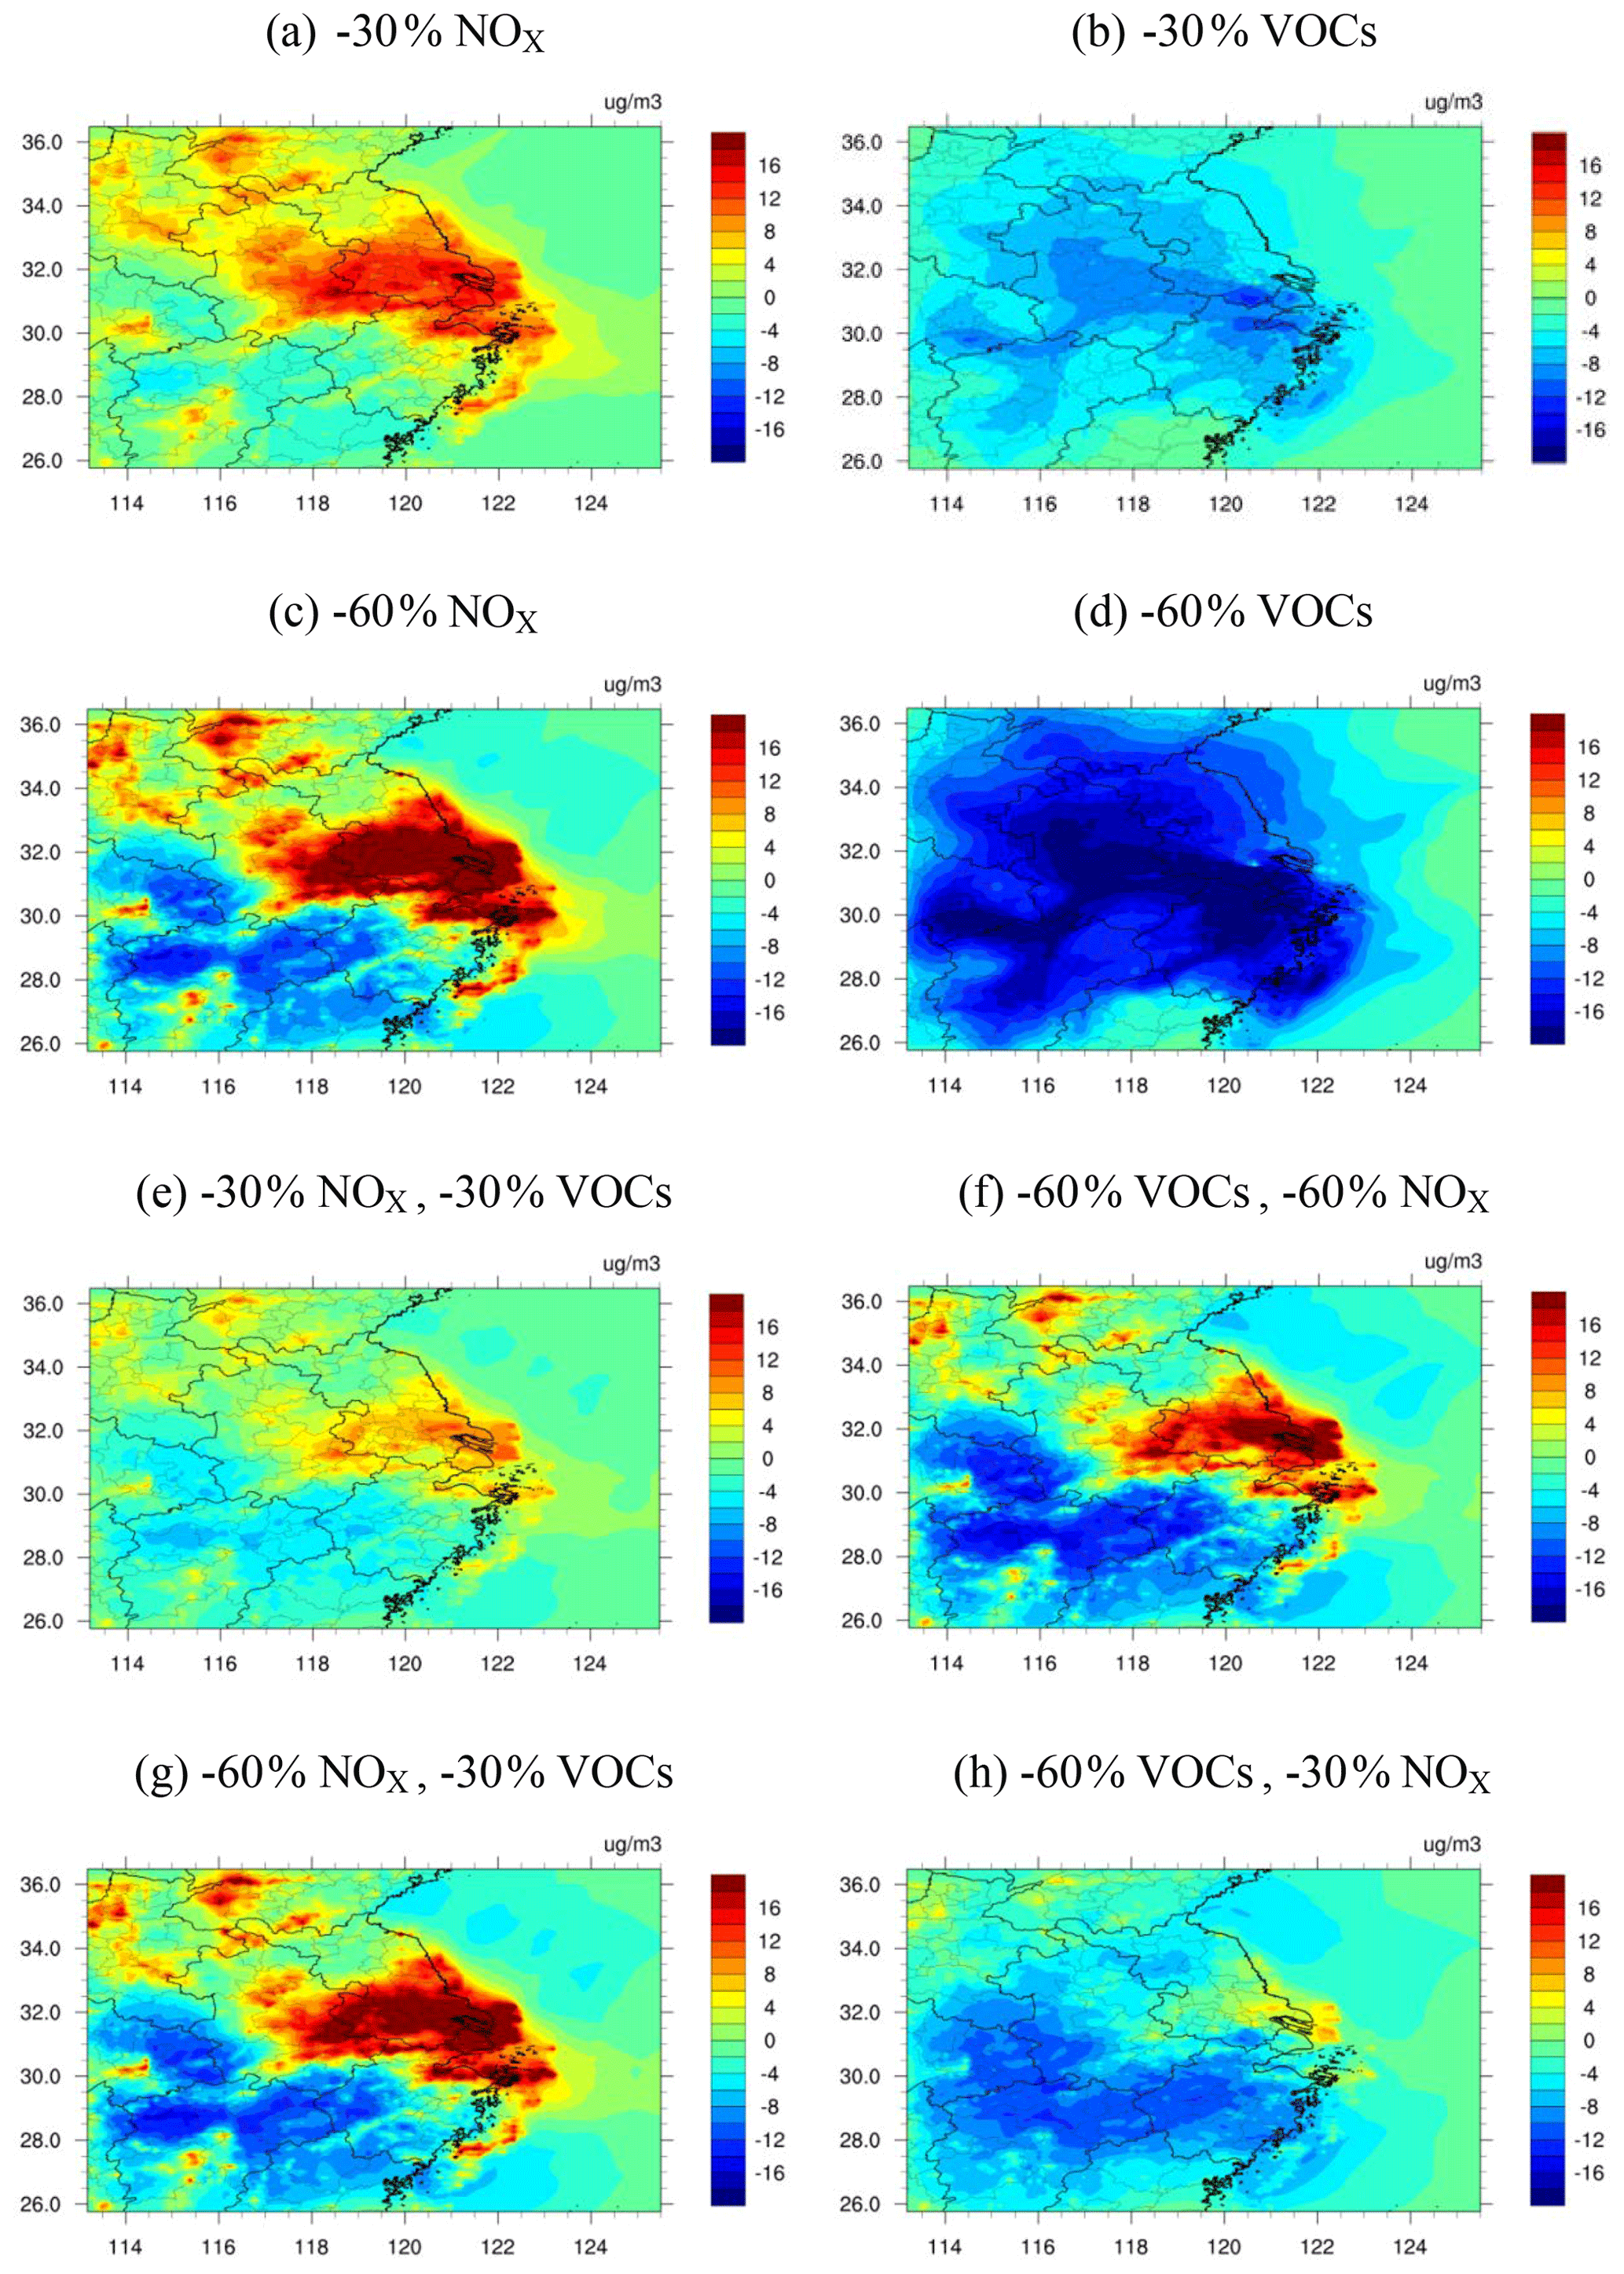
Figure 10The spatial differences of monthly mean O3 concentrations between the simulations based on the base case (top-down estimates) and sensitivity cases in April 2016 (sensitivity case minus base case).
Figure 10 illustrates the differences in spatial patterns of the simulated monthly mean O3 concentrations between the base and sensitivity cases in April. The O3 concentrations were expected to decline for the whole YRD region in the cases of 30 % and 60 % VOC emissions off (Fig. 10b and d), indicating the VOC-limited regime of O3 formation for the entire YRD. For other cases, the O3 concentrations were clearly elevated in the central–eastern YRD with relatively large population and developed industry, particularly for the cases with NOx control only (Fig. 10a and c) or relatively large NOx abatement together with VOC control (Fig. 10f and g). Even for the case with 60 % of VOC reduction and 30 % of NOx (Fig. 10h), there was still a small increase in O3 concentration in the central–eastern YRD, in contrast to the slight O3 reduction found for most areas of the YRD. These results reveal the extreme difficulty in O3 pollution control for the region. In southwestern Zhejiang, the O3 concentrations were found to decline in the cases with large abatement of NOx emissions (Fig. 10c, f and g), suggesting a shift from a VOC-limited to a NOx-limited region for the O3 formation.
Table 4 summarizes the change in the simulated monthly means of SNA (NO, NH, and SO) concentrations between the base case and sensitivity cases in January. The SNA concentrations were decreased in most cases, implying that the reduction in precursor emissions was useful for mitigating the SNA pollution. Compared to that of precursor emissions, however, the reduction rate of SNA was much smaller, attributed to the strong nonlinearity of SNA formation. The largest reductions were found at 11.7 % and 12.4 % when emissions of NH3 and all the three precursors were decreased by 30 % (Cases 11 and 12), respectively. In contrast, the SNA concentrations declined slightly by 1 % and increased by 0.5 % when NOx and SO2 emissions were reduced by 30 % (Cases 9 and 10), respectively. The results suggest that most of the YRD was in an NH3-neutral or even NH3-poor condition in winter, consistent with the judgment through the AQM based on an updated NH3 emission inventory (Zhao et al., 2020), as the NH3 volatilization in winter was much smaller than other seasons. Reducing NH3 emissions was the most efficient way to control SNA pollution for the region in winter. In Case 11 with NH3 control only, the reduction in NO and NH concentrations was much larger than that of SO. As NH3 reacted with SO2 prior to NOx, NH4NO3 was assumed easier to decompose than (NH4)2SOwhen NH3 emissions were reduced. The growth of NO concentrations was found for Case 10 (SO2 control only), since the free NH3 from the reduced SO2 emissions could react with NOx in the NH3-poor condition. Similarly, the SO concentrations increased for Case 9 (NOx control only), as the elevated O3 attributed to the reduction of NOx emissions promoted the SO formation.
From a top-down perspective, we have estimated the monthly NOx emissions for the YRD region in 2016, based on nonlinear inversed modeling and NO2 TVCDs from POMINO, and the bottom-up and top-down estimates of NOx emissions were evaluated with the AQM and ground NO2 observations. Due to insufficient consideration of improved controls on power and industrial sources, the NOx emissions were probably overestimated in the current bottom-up inventory (MEIC), resulting in significantly higher simulated NO2 concentrations than the observations. The simulated NO2 concentrations with the top-down estimates were closer to the observations for all four seasons, suggesting the improved emission estimation with satellite constraint. Improved O3 and SNA simulations with the top-down NOx estimates for most months indicate the importance role of precursor emission estimation in secondary pollution modeling for the region. Through the sensitivity analysis of O3 formation, the mean O3 concentrations were found to decrease for most of the YRD when only VOC emissions were reduced or the reduced rate of VOCs was 2 times that of NOx, and the result indicates the effectiveness of controlling VOC emissions in O3 pollution abatement for the region. For part of southern Zhejiang, however, the O3 concentrations were simulated to decline with the reduced NOx emissions, implying the shift from a VOC-limited to a NOx-limited region. Compared to reducing NOx or SO2 only, larger reduction in SNA concentrations was found when 30 % of emissions were cut for NH3 or all the three precursors (NO2, NH3, and SO2). The result suggests that reducing NH3 emissions was crucial to alleviate SNA pollution of the YRD in winter.
Limitations remain in this study. Due to the limited horizontal resolution of OMI, a relatively big bias existed in the spatial distribution of the constrained NOx emissions at the regional scale compared to national or continental ones, and the uncertainty could exceed 30 % for the YRD region (Yang et al., 2019b). Therefore the improvement in the top-down estimates of NOx emissions can be expected when more advanced and reliable products of satellite observations become available at a finer horizontal resolution (e.g., TROPOspheric Monitoring Instrument, TROPOMI). In addition, more SNA observations from online measurement are recommended for a better space coverage and temporal resolution to explore more carefully the response of SNA to the changes in emissions of NOx and other precursors.
All data in this study are available from the authors upon request.
The supplement related to this article is available online at: https://doi.org/10.5194/acp-21-1191-2021-supplement.
YY developed the strategy and methodology of the work and wrote the draft. YZ improved the methodology and revised the manuscript. LZ provided useful comments on the methodology. JZ and XH provided observation data of secondary inorganic aerosols. XZ, YZ, MX, and YL provided comments on air quality modeling.
The authors declare that they have no conflict of interest.
This article is part of the special issue “Regional assessment of air pollution and climate change over East and Southeast Asia: results from MICS-Asia Phase III”. It is not associated with a conference.
This work was sponsored by the National Natural Science Foundation of China (91644220 and 41575142), the National Key Research and Development Program of China (2017YFC0210106), and the Key Program for Coordinated Control of PM2.5 and Ozone for Jiangsu Province (2019023). We would also like to thank Tsinghua University for the free use of national emissions data (MEIC) and Peking University for the support of satellite data (POMINO v1).
This research has been supported by the National Natural Science Foundation of China (grant nos. 91644220 and 41575142), the National Key Research and Development Program of China (grant no. 2017YFC0210106), and the Key Program for Coordinated Control of PM2.5 and Ozone for Jiangsu Province (2019023).
This paper was edited by Hang Su and reviewed by two anonymous referees.
Cai, S., Wang, Y., Zhao, B., Chang, X., and Hao, J. M.: The impact of the “Air Pollution Prevention and Control Action Plan” on PM2.5 concentrations in Jing-Jin-Ji region during 2012-2020, Sci. Total Environ., 580, 197–209, 2017.
Chen, D., Tian, X., Lang J., Zhou, Y., Li, Y., Guo, X., Wang, W., and Liu, B.: The impact of ship emissions on PM2.5 and the deposition of nitrogen and sulfur in Yangtze River Delta, China, Sci. Total Environ., 649, 1609–1619, 2019a.
Chen, D., Zhao, Y., Lyu, R., Wu, R., Dai, L., Zhao, Y., Chen, F., Zhang, J., Yu, H., and Guan, M.: Seasonal and spatial variations of optical properties of light absorbing carbon and its influencing factors in a typical polluted city in Yangtze River Delta, China. Atmos. Environ., 199, 45–54, 2019b.
Chen, L., Gao, Y., Zhang, M., Fu, J. S., Zhu, J., Liao, H., Li, J., Huang, K., Ge, B., Wang, X., Lam, Y. F., Lin, C.-Y., Itahashi, S., Nagashima, T., Kajino, M., Yamaji, K., Wang, Z., and Kurokawa, J.: MICS-Asia III: multi-model comparison and evaluation of aerosol over East Asia, Atmos. Chem. Phys., 19, 11911–11937, https://doi.org/10.5194/acp-19-11911-2019, 2019c.
Cheng, Y. F., Zheng, G. J., Wei, C., Mu, Q., Zheng, B., Wang, Z. B., Gao, M., Zhang, Q., He, K. B., Carmichael, G., Pöschl, U., and Su, H.: Reactive nitrogen chemistry in aerosol water as a source of sulfate during haze events in China, Sci. Adv., 2, 1–11, 2016.
Cooper, M., Martin, R. V., Padmanabhan, A., and Henze, D. K.: Comparing mass balance and adjoint methods for inverse modeling of nitrogen dioxide columns for global nitrogen oxide emissions, J. Geophys. Res.-Atmos., 122, 4718–4734, 2017.
de Foy, B., Lu, Z., Streets, D. G., Lamsal, L. N., and Duncan, B. N.: Estimates of power plant NOx emissions and lifetimes from OMI NO2 satellite retrievals, Atmos. Environ., 116, 1–11, 2015.
Ding, A., Huang, X., Nie, W., Chi, X., Xu, Z., Zheng, L., Xu, Z., Xie, Y., Qi, X., Shen, Y., Sun, P., Wang, J., Wang, L., Sun, J., Yang, X.-Q., Qin, W., Zhang, X., Cheng, W., Liu, W., Pan, L., and Fu, C.: Significant reduction of PM2.5 in eastern China due to regional-scale emission control: evidence from SORPES in 2011–2018, Atmos. Chem. Phys., 19, 11791–11801, https://doi.org/10.5194/acp-19-11791-2019, 2019.
Emery, C., Tai, E., and Yarwood, G.: Enhanced meteorological modeling and performance evaluation for two Texas episodes, Report to the Texas Natural Resources Conservation Commission, prepared by ENVIRON, International Corp, Novato, CA, 235 pp., 2001.
Granier, C., Bessagnet, B., Bond, T., Angiola, A. D., van der Gon, H. D., Frost G. J. , Heil, A., Kaiser, J. W., Kinne, S., Klimont, Z., Kloster, S., Lamarque, J. F., Liousse, C., Masui, T., Meleux, F., Mieville, A., Ohara, T., Raut, J. C., Riahi, K., Schultz, M. G., Smith, S. J., Thompson, A., van Aardenne, J., van der Werf, G. R., and van Vuuren, D. P.: Evolution of anthropogenic and biomass burning emissions of air pollutants at global and regional scales during the 1980–2010 period, Clim. Change, 109, 163–190, 2011.
Gu, D. S., Wang, Y. X., Smeltzer, C., and Boersma, K. F.: Anthropogenic emissions of NOx over China: Reconciling the difference of inverse modeling results using GOME-2 and OMI measurements, J. Geophys. Res.-Atmos., 119, 7732–7740, 2014.
Gu, Y. X., Li, K., Xu, J. M., Liao, H., and Zhou, G. Q.: Observed dependence of surface ozone on increasing temperature in Shanghai, China, Atmos. Environ., 221, 1–10, 2020.
Huang, X., Ding, A. J., Gao, J., Zheng, B., Zhou, D. R., Qi, X. M., Tang, R., Ren, C. H., Nie, W., Chi, X. G., Wang, J. P., Xu, Z., Chen, L. D., Li, Y. Y., Che, F., Pang, N. N., Wang, H. K., Tong, D., Qin, W., Cheng, W., Liu, W. J., Fu, Q. Y., Chai, F. H., Davis, S. J., Zhang, Q., and He, K. B.: Enhanced secondary pollution offset reduction of primary emissions during COVID-19 lockdown in China, Natl. Sci. Rev., 137, nwaa137, https://doi.org/10.1093/nsr/nwaa137, 2020.
Jena, C., Ghude, S. D., Beig, G., Chate, D. M., Kumar, R., Pfister, G. G., Lal, D. M., Surendran, D. E., Fadnavis, S., van der A, R. J.: Inter-comparison of different NOx emission inventories and associated variation in simulated surface ozone in Indian region, Atmos. Environ., 17, 61–73, 2014.
Jiménez, P., Jorba, O., Parra, R., and Baldasano, J. M.: Evaluation of MM5-EMICAT2000-CMAQ performance and sensitivity in complex terrain: High-resolution application to the northeastern Iberian Peninsula, Atmos. Environ., 40, 5056–5072, 2006.
Jin, X. M., Fiore, A. M., Murray, L. T., Valin, L. C., Lamsal, L. N., Duncan, B., Boersma, K. F., De Smedt, I., Abad, G. G., Chance, K., and Tonnesen, G. S.: Evaluating a space-based Indicator of surface ozone-NOx-VOC sensitivity over midlatitude source regions and application to decadal trends, J. Geophys. Res.-Atmos., 122, 10231–10253, 2017.
Kong, H., Lin, J., Zhang, R., Liu, M., Weng, H., Ni, R., Chen, L., Wang, J., Yan, Y., and Zhang, Q.: High-resolution (0.05∘ × 0.05∘) NOx emissions in the Yangtze River Delta inferred from OMI, Atmos. Chem. Phys., 19, 12835–12856, https://doi.org/10.5194/acp-19-12835-2019, 2019.
Kurokawa, J. I., Yumimoto, K., Uno, I., and Ohara, T.: Adjoint inverse modeling of NOx emissions over eastern China using satellite observations of NO2 vertical column densities, Atmos. Environ., 43, 1878–1887, 2009.
Levelt, P. F., Hilsenrath, E., Leppelmeier, G. W., van den Oord, G. H. J., Bhartia, P. K., Tamminen, J., de Haan, J. F., and Veefkind, J. P.: Science objectives of the Ozone Monitoring Instrument, IEEE T. Geosci. Remote, 44, 1199–1208, 2006.
Li, L.: The numerical simulation of comprehensive air pollution characteristics in a typical city-cluster, Doctoral dissertation, Shanghai University, Shanghai, China, 131 pp., 2012.
Li, L.: Application of new generation natural source emission model in Yangtze River Delta and its influence on SOA and O3, The 4th application technology seminar on air pollution source emission inventory in China, Nanjing, China, 18–19 September, 2019 (in Chinese).
Li, J., Nagashima, T., Kong, L., Ge, B., Yamaji, K., Fu, J. S., Wang, X., Fan, Q., Itahashi, S., Lee, H.-J., Kim, C.-H., Lin, C.-Y., Zhang, M., Tao, Z., Kajino, M., Liao, H., Li, M., Woo, J.-H., Kurokawa, J., Wang, Z., Wu, Q., Akimoto, H., Carmichael, G. R., and Wang, Z.: Model evaluation and intercomparison of surface-level ozone and relevant species in East Asia in the context of MICS-Asia Phase III – Part 1: Overview, Atmos. Chem. Phys., 19, 12993–13015, https://doi.org/10.5194/acp-19-12993-2019, 2019.
Li, Z.: Seasonal pollution characteristics and cytotoxicity of PM2.5 in district of Hangzhou City, Master thesis, Zhejiang University, Hangzhou, China, 2018 (in Chinese).
Lin, J.-T., Martin, R. V., Boersma, K. F., Sneep, M., Stammes, P., Spurr, R., Wang, P., Van Roozendael, M., Clémer, K., and Irie, H.: Retrieving tropospheric nitrogen dioxide from the Ozone Monitoring Instrument: effects of aerosols, surface reflectance anisotropy, and vertical profile of nitrogen dioxide, Atmos. Chem. Phys., 14, 1441–1461, https://doi.org/10.5194/acp-14-1441-2014, 2014.
Lin, J.-T., Liu, M.-Y., Xin, J.-Y., Boersma, K. F., Spurr, R., Martin, R., and Zhang, Q.: Influence of aerosols and surface reflectance on satellite NO2 retrieval: seasonal and spatial characteristics and implications for NOx emission constraints, Atmos. Chem. Phys., 15, 11217–11241, https://doi.org/10.5194/acp-15-11217-2015, 2015.
Liu, F., van der A, R. J., Eskes, H., Ding, J., and Mijling, B.: Evaluation of modeling NO2 concentrations driven by satellite-derived and bottom-up emission inventories using in situ measurements over China, Atmos. Chem. Phys., 18, 4171–4186, https://doi.org/10.5194/acp-18-4171-2018, 2018.
Liu, J. S., Gu, Y., Ma, S. S., Su, Y. L., and Ye, Z. L.: Day-night differences and source apportionment of inorganic components of PM2.5 during summer-winter in Changzhou city, Environ. Sci., 39, 980–989, 2018 (in Chinese).
Liu, M., Lin, J., Boersma, K. F., Pinardi, G., Wang, Y., Chimot, J., Wagner, T., Xie, P., Eskes, H., Van Roozendael, M., Hendrick, F., Wang, P., Wang, T., Yan, Y., Chen, L., and Ni, R.: Improved aerosol correction for OMI tropospheric NO2 retrieval over East Asia: constraint from CALIOP aerosol vertical profile, Atmos. Meas. Tech., 12, 1–21, https://doi.org/10.5194/amt-12-1-2019, 2019.
Martin, R. V., Jacob, D. J., Chance, K., Kurosu, T. P., Palmer, P. I., and Evans, M. J.: Global inventory of nitrogen oxide emissions constrained by space-based observations of NO2 columns, J. Geophys. Res., 108, 1–12, 2003.
Ming, L. L., Jin, L., Li J., Yang, W. Y., Liu, D., Zhang, G., Wang, Z. F., and Lia, X. D.: PM2.5 in the Yangtze River Delta, China: Chemical compositions, seasonal variations, and regional pollution events, Environ. Pollut., 223, 200–212, 2017.
Ministry of Environmental protection of the People's Republic of China (MEPPRC): Chinese Environmental Situation Communique in 2016, Beijing, 55 pp., 2017.
Miyazaki, K., Eskes, H. J., and Sudo, K.: Global NOx emission estimates derived from an assimilation of OMI tropospheric NO2 columns, Atmos. Chem. Phys., 12, 2263–2288, https://doi.org/10.5194/acp-12-2263-2012, 2012.
Price, C., Penner, J., and Prather, M.: NOx from lightning, Part I: Global distribution based on lightning physics, J. Geophys. Res.-Atmos., 102, 1–5, 1997.
Qu, Z., Henze, D. K., Capps, S. L., Wang, Y., Xu, X., Wang, J., and Keller, M., Monthly top-down NOx emissions for China (2005–2012): A hybrid inversion method and trend analysis, J. Geophys. Res.-Atmos., 122, 4600–4625, 2017.
Saikawa, E., Kim, H., Zhong, M., Avramov, A., Zhao, Y., Janssens-Maenhout, G., Kurokawa, J.-I., Klimont, Z., Wagner, F., Naik, V., Horowitz, L. W., and Zhang, Q.: Comparison of emissions inventories of anthropogenic air pollutants and greenhouse gases in China, Atmos. Chem. Phys., 17, 6393–6421, https://doi.org/10.5194/acp-17-6393-2017, 2017.
Sha, T., Ma, X., Jia, H., Tian, R., Chang, Y., Cao, F., and Zhang, Y.: Aerosol chemical component: Simulations with WRF-Chem and comparison with observations in Nanjing, Atmos. Environ., 218, 1–14, 2019.
Sindelarova, K., Granier, C., Bouarar, I., Guenther, A., Tilmes, S., Stavrakou, T., Müller, J.-F., Kuhn, U., Stefani, P., and Knorr, W.: Global data set of biogenic VOC emissions calculated by the MEGAN model over the last 30 years, Atmos. Chem. Phys., 14, 9317–9341, https://doi.org/10.5194/acp-14-9317-2014, 2014.
Skamarock, W. C., Klemp, J. B., Dudhia, J., Gill, D. O., Barker, D. M., Duda, M. G., Huang, X.-Y., Wang, W., and Powers, J. G.: A Description of the Advanced Research WRF Version 3, NCAR Tech. Note NCAR/TN-475+STR, 113 pp., https://doi.org/10.5065/D68S4MVH, 2008.
University of North Carolina at Chapel Hill (UNC): Operational Guidance for the Community Multiscale Air Quality (CMAQ) Modeling System Version 5.0 (February 2012 Release), available at: http://www.cmaq-model.org (last access: 10 June 2020), 2012.
Visser, A. J., Boersma, K. F., Ganzeveld, L. N., and Krol, M. C.: European NOx emissions in WRF-Chem derived from OMI: impacts on summertime surface ozone, Atmos. Chem. Phys., 19, 11821–11841, https://doi.org/10.5194/acp-19-11821-2019, 2019.
Wang, N. F., Chen, Y., Hao, Q. J., Wang, H. B., Yang, F. M., Zhao, Q., Bo, Y., He, K. B., and Yao, Y. G.: Seasonal variation and source analysis on water-soluble ion of PM2.5 in Suzhou, Environ. Sci., 37, 4482–4489, 2016 (in Chinese).
Wang, N., Lyu, X., Deng, X., Huang, X., Jiang, F., and Ding, A.: Aggravating O3 pollution due to NOx emission control in eastern China, Sci. Total Environ., 677, 732–744, 2019.
Wang, X., Zhang, Y., Hu, Y., Zhou, W., Lu, K., Zhong, L., Zeng, L., Shao, M., Hu, M., and Russell, A. G.: Process analysis and sensitivity study of regional ozone formation over the Pearl River Delta, China, during the PRIDE-PRD2004 campaign using the Community Multiscale Air Quality modeling system, Atmos. Chem. Phys., 10, 4423–4437, https://doi.org/10.5194/acp-10-4423-2010, 2010.
Wang, Y., Zhang, Q. Q., He, K., Zhang, Q., and Chai, L.: Sulfate-nitrate-ammonium aerosols over China: response to 2000–2015 emission changes of sulfur dioxide, nitrogen oxides, and ammonia, Atmos. Chem. Phys., 13, 2635–2652, https://doi.org/10.5194/acp-13-2635-2013, 2013.
Wei, W., Wang, S. X., Hao, J. M., and Cheng, S. Y.: Trends of Chemical Speciation Profiles of Anthropogenic Volatile Organic Compounds Emissions in China, 2005-2020, Front. Env. Sci. Eng. in China, 8, 27–41, 2014.
Xing, J., Mathur, R., Pleim, J., Hogrefe, C., Gan, C.-M., Wong, D. C., Wei, C., Gilliam, R., and Pouliot, G.: Observations and modeling of air quality trends over 1990–2010 across the Northern Hemisphere: China, the United States and Europe, Atmos. Chem. Phys., 15, 2723–2747, https://doi.org/10.5194/acp-15-2723-2015, 2015.
Yang, Y. and Zhao, Y.: Quantification and evaluation of atmospheric pollutant emissions from open biomass burning with multiple methods: a case study for the Yangtze River Delta region, China, Atmos. Chem. Phys., 19, 327–348, https://doi.org/10.5194/acp-19-327-2019, 2019.
Yang, Y., Zhao, Y., and Zhang, L.: Evaluating the influence of satellite observation on inversing NOx emission at regional scale. Int. Arch. Photogramm. Remote Sens. Spatial Inf. Sci., XLII-3/W9, 211–217, 2019a.
Yang, Y., Zhao Y., Zhang L., Lu Y.: Evaluating the methods and influencing factors of satellite-derived estimates of NOx emissions at regional scale: A case study for Yangtze River Delta, China, Atmos. Environ., 219, 1–12, 2019b.
Yienger, J. J. and Levy II, H.: Empirical model of global soil biogenic NOx emissions, J. Geophys. Res., 100, 11447-11464, 1995.
Zhang, Y., Bo, X., Zhao, Y., and Nielsen, C. P.: Benefits of current and future policies on emission reduction from China's coal-fired power sector indicated by continuous emission monitoring, Environ. Pollut., 251, 415–424, 2019.
Zhang, Y. Y.: Characteristic of water-soluble ions in PM2.5 in the northern suburb of Nanjing based on on-line monitoring, Master thesis, Nanjing University of Information Science & Technology, Nanjing, China, 72 pp., 2017 (in Chinese).
Zhao, C. and Wang, Y. X.: Assimilated inversion of NOx emissions over East Asia using OMI NO2 column measurements, Geophys. Res. Lett., 36, L06805, 1–5, 2009.
Zhao, Y., Mao, P., Zhou, Y., Yang, Y., Zhang, J., Wang, S., Dong, Y., Xie, F., Yu, Y., and Li, W.: Improved provincial emission inventory and speciation profiles of anthropogenic non-methane volatile organic compounds: a case study for Jiangsu, China, Atmos. Chem. Phys., 17, 7733–7756, https://doi.org/10.5194/acp-17-7733-2017, 2017.
Zhao, Y., Yuan, M., Huang, X., Chen, F., and Zhang, J.: Quantification and evaluation of atmospheric ammonia emissions with different methods: a case study for the Yangtze River Delta region, China, Atmos. Chem. Phys., 20, 4275–4294, https://doi.org/10.5194/acp-20-4275-2020, 2020.
Zheng, B., Tong, D., Li, M., Liu, F., Hong, C., Geng, G., Li, H., Li, X., Peng, L., Qi, J., Yan, L., Zhang, Y., Zhao, H., Zheng, Y., He, K., and Zhang, Q.: Trends in China's anthropogenic emissions since 2010 as the consequence of clean air actions, Atmos. Chem. Phys., 18, 14095–14111, https://doi.org/10.5194/acp-18-14095-2018, 2018.
Zhou, Y., Zhao, Y., Mao, P., Zhang, Q., Zhang, J., Qiu, L., and Yang, Y.: Development of a high-resolution emission inventory and its evaluation and application through air quality modeling for Jiangsu Province, China, Atmos. Chem. Phys., 17, 211–233, https://doi.org/10.5194/acp-17-211-2017, 2017.
Zyrichidou, I., Koukouli, M. E., Balis, D., Markakis, K., Poupkou, A., Katragkou, E., Kioutsioukis, I., Melas, D., Boersma, K. F., van Roozendael, M.: Identification of surface NOx emission sources on a regional scale using OMI NO2, Atmos. Environ., 101, 82–93, 2015.