the Creative Commons Attribution 4.0 License.
the Creative Commons Attribution 4.0 License.
 | 09 Aug 2021
Diel cycle impacts on the chemical and light absorption properties of organic carbon aerosol from wildfires in the western United States
Edward Fortner
Andrew Lambe
Nishit J. Shetty
Conner Daube
Pai Liu
Francesca Majluf
Scott Herndon
Rajan K. Chakrabarty
Organic aerosol (OA) emissions from biomass burning have been the subject of intense research in recent years, involving a combination of field campaigns and laboratory studies. These efforts have aimed at improving our limited understanding of the diverse processes and pathways involved in the atmospheric processing and evolution of OA properties, culminating in their accurate parameterizations in climate and chemical transport models. To bring closure between laboratory and field studies, wildfire plumes in the western United States were sampled and characterized for their chemical and optical properties during the ground-based segment of the 2019 Fire Influence on Regional to Global Environments and Air Quality (FIREX-AQ) field campaign. Using a custom-developed multiwavelength integrated photoacoustic-nephelometer spectrometer in conjunction with a suite of instruments, including an oxidation flow reactor equipped to generate hydroxyl (OH•) or nitrate (NO3•) radicals to mimic daytime or nighttime oxidative aging processes, we investigated the effects of multiple equivalent hours of OH• or NO3• exposure on the chemical composition and mass absorption cross-sections (MAC(λ)) at 488 and 561 nm of OA emitted from wildfires in Arizona and Oregon. We found that OH• exposure induced a slight initial increase in absorption corresponding to short timescales; however, at longer timescales, the wavelength-dependent MAC(λ) decreased by a factor of 0.72 ± 0.08, consistent with previous laboratory studies and reports of photobleaching. On the other hand, NO3• exposure increased MAC(λ) by a factor of up to 1.69 ± 0.38. We also noted some sensitivity of aerosol aging to different fire conditions between Arizona and Oregon. The MAC(λ) enhancement following NO3• exposure was found to correlate with an enhancement in CHO1N and CHOgt1N ion families measured by an Aerodyne aerosol mass spectrometer.
- Article
(5198 KB) - Full-text XML
-
Supplement
(1312 KB) - BibTeX
- EndNote


Wildfires constitute one of the main contributions to the global atmospheric organic aerosol (OA) burden (Murphy et al., 2006; Zhang et al., 2007). The diverse physical, chemical, and optical properties of OA as well as the varied pathways involved in their formation in fires and subsequent atmospheric processing introduce uncertainty into the analysis of their climate impacts, preventing extensive and accurate representation within regional- and global-scale models. Laboratory studies have, in the recent several years, demonstrated the effects of atmospheric processing on the optical, chemical, and physical properties of biomass burning OA (BBOA) or secondary organic aerosol (SOA) from biomass sources (Jimenez et al., 2009; Kroll et al., 2011; Lambe et al., 2013; Sumlin et al., 2017a). BBOA is typically also associated with brown carbon (BrC), a class of OA known to strongly absorb sunlight in the UV and short visible wavelengths (Pósfai et al., 2004; Chakrabarty et al., 2010). Following diurnal cycles, the impacts of atmospheric oxidation can be broadly divided into daytime- and nighttime-driven processes. During daylight hours, the dominant oxidant that may influence OA properties is OH•. At night, when OH• production is significantly lower, O3 and NO3• are the most likely oxidants to influence BBOA properties. Initial laboratory studies suggest that OH•- and NO3•-induced oxidative aging affects the light absorption properties of BBOA surrogates in markedly different ways. OH• exposure has been shown to diminish light absorption by fragmenting large chromophoric molecules (Lambe et al., 2013; Sumlin et al., 2017a), while NO3• oxidation has been shown to enhance light absorption by adding nitrogen-containing chromophoric functional groups (Li et al., 2019; Cheng et al., 2020; Li et al., 2020; He et al., 2021).
The need to study the consequences of such atmospheric processing on BBOA has motivated the development and use of environmental chambers capable of containing and controlling a sample of aerosol as it ages naturally (such as a Teflon bag sitting in open sunlight) or by accelerating the aging process by exposing aerosols to increased concentrations of atmospheric oxidants, UV light, or both (Carter et al., 1995; Cocker et al., 2001; Grieshop et al., 2009; Cubison et al., 2011; Ortega et al., 2013). Such chambers are often large, on the order of several cubic meters (Cocker et al., 2001), and the relatively slow pace of a given experiment may suffer from unrealistic loss mechanisms including wall losses (including electrostatic, diffusional, and gravitational) (McMurry and Grosjean, 1985; Zhang et al., 2014; Wang et al., 2018) and aerosol agglomeration and coagulation (Pierce et al., 2008). Recently, oxidation flow reactors (OFRs) have been used as a field-deployable alternative to traditional environmental chambers. OFRs are comparatively small, on the order of 0.01 m3, with residence times on the order of minutes and oxidant concentrations that are 100–1000 times higher than typical ambient levels, resulting in equivalent atmospheric aging timescales from hours to weeks (Lambe et al., 2011).
While most work with OFRs has focused on OH• -initiated oxidative aging processes, new methods are available to employ NO3• in field-based OFR studies (Lambe et al., 2020; Li et al., 2020) that expand on previous work (Palm et al., 2017). The consequences of such atmospheric processing over multiple diurnal cycles and broad geographical areas introduce significant errors into the aerosol components of radiative transfer models and make it difficult to constrain the impacts that wildfires and other large-scale aerosol events will have on the climate, especially in areas where air quality is expected to suffer under the effects of anthropogenic climate change (McClure and Jaffe, 2018). Following previous laboratory studies that investigated the various properties of BrC generated from smoldering biomass (Sumlin et al., 2017b, 2018a, b), including their optical characteristics following OH• exposure in an OFR, this work investigates the effects of daytime and nighttime aging on the short-visible-wavelength-dependent light-absorbing properties of smoke OA sampled during the Fire Influence on Regional to Global Environments and Air Quality (FIREX-AQ) campaign, an interagency mission led by NASA and the NOAA, conducted during the wildfire season of 2019 (Warneke, 2021). This work focuses on four OFR-based OA oxidative aging experiments performed in August 2019 at ground level near the North Rim of the Grand Canyon in Arizona during the Castle and Ikes fires and in eastern Oregon, during the 204 Cow Fire. Results are used to quantify the effects of diurnal-cycle-driven oxidation processes on the OA mass absorption cross-section.
2.1 Wildfire emissions sampled during OFR experiments
2.1.1 Castle and Ikes fires, northern Arizona
At the time of the FIREX-AQ campaign, two large fires were burning in close proximity to each other near the North Rim of the Grand Canyon, near Page, AZ. These fires, the Castle and Ikes fires (36.51∘ N, 112.28∘ W, and 36.35∘ N, 112.29∘ W, respectively), were ignited by lightning on 12 and 25 July 2019, respectively. Since these fires threatened no structures or other property and were burning through a forest densely packed with litter, underbrush, and dead fallen trees, the fires were allowed to burn within prescribed limits to serve their role as the forest's natural mechanism of clean-out and renewal, while fire crews in the area used Castle and Ikes as training opportunities.
The Castle and Ikes fires burned near the Oquer Canyon in the Kaibab National Forest, a densely forested area consisting predominantly of ponderosa pine (Pinus ponderosa), Douglas fir (Pseudotsuga menziesii), Engelmann spruce (Picea engelmannii), and quaking aspen (Populus tremuloides). Minor species include Gambel oak (Quercus gambelii) and various shrub and grass species of sagebrush (Artemesia) and bitterbrush (Purshia). A complete description of the fuel bed in this region is given in Appendix A of Riccardi et al. (2007). By 20 August 2019, the fire management areas had grown to approximately 24 000 acres (∼97 km2) combined. The Aerodyne Mobile Laboratory (AML; described below) approached from Page via Highway 89A and State Route 67. An OH• OFR experiment (OHArizona) was conducted on 20 August at approximately 17:45 UTC (10:45 MST) at 36.61∘ N, 112.19∘ W (Fig. 1), and a NO3• OFR experiment (NO3,Arizona) was conducted on 22 August at approximately 10:30 UTC (03:30 MST) at 36.54∘ N, 112.17∘ W (Fig. 2).
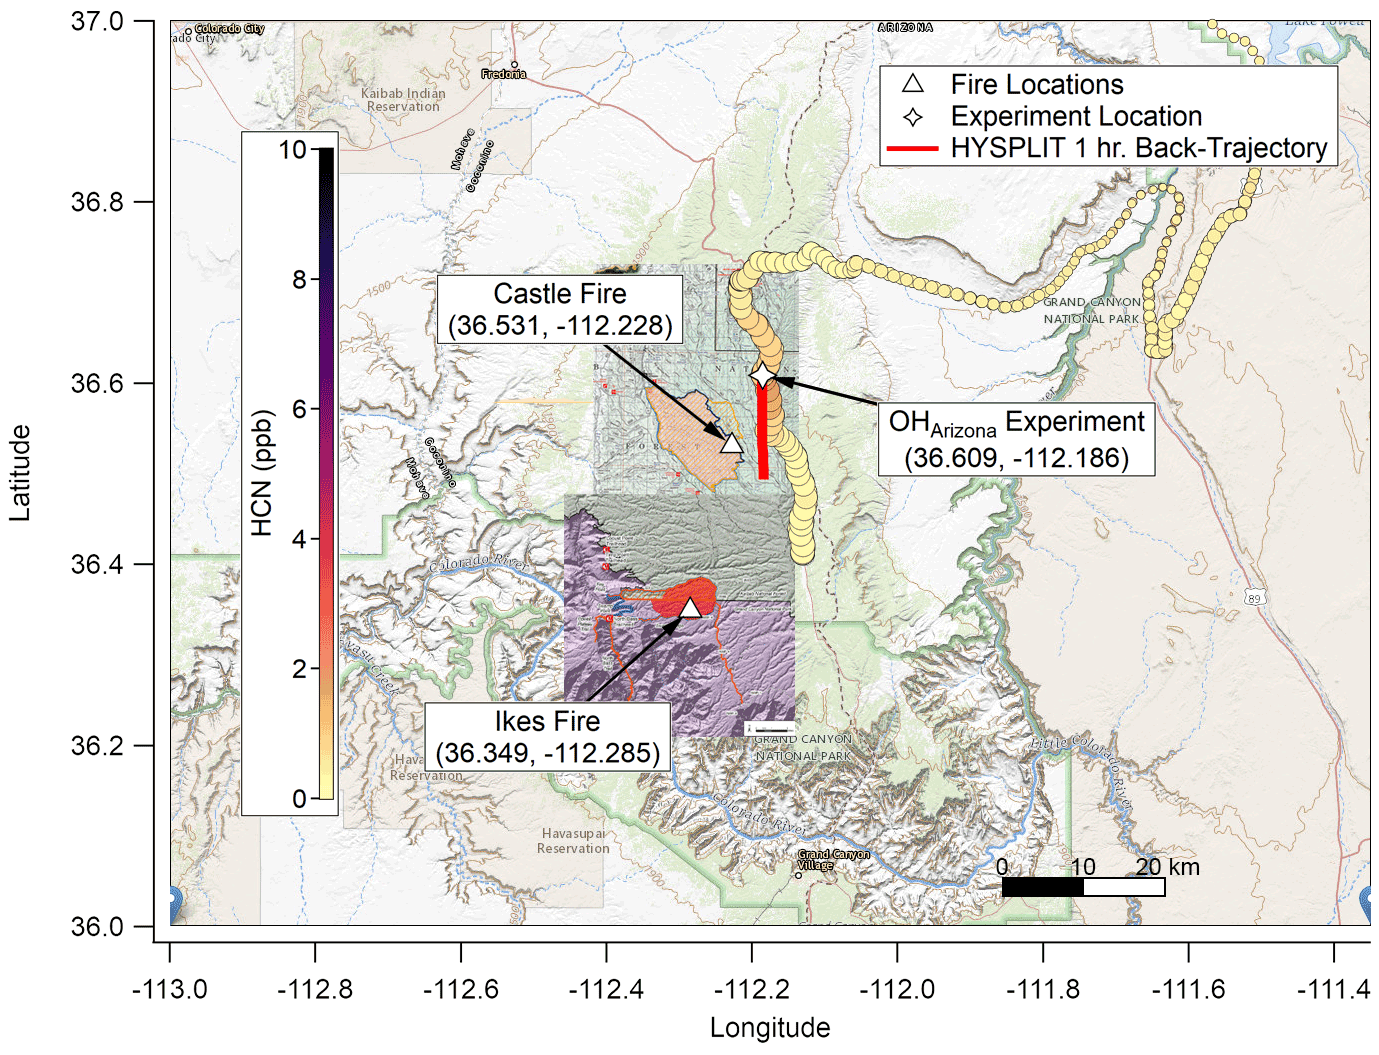
Figure 1Map of the Grand Canyon region overlaid with hydrogen cyanide (HCN) concentration (ppb; color scale), elevation (HCN marker size; larger is higher above mean sea level (a.m.s.l.)), fire origin locations from the Incident Information System (white triangles), OHArizona experiment location (white star), and fire boundary maps for 20 August 2019. Based on Hybrid Single-Particle Lagrangian Integrated Trajectory (HYSPLIT) back trajectories, the plume for this experiment was less than 1 h old, though surface concentrations of smoke were comparatively lower since the nocturnal boundary layer had lifted. The background map is from USGS EarthExplorer, and fire map overlays are from the National Wildfire Coordinating Group's Incident Information System (InciWeb).
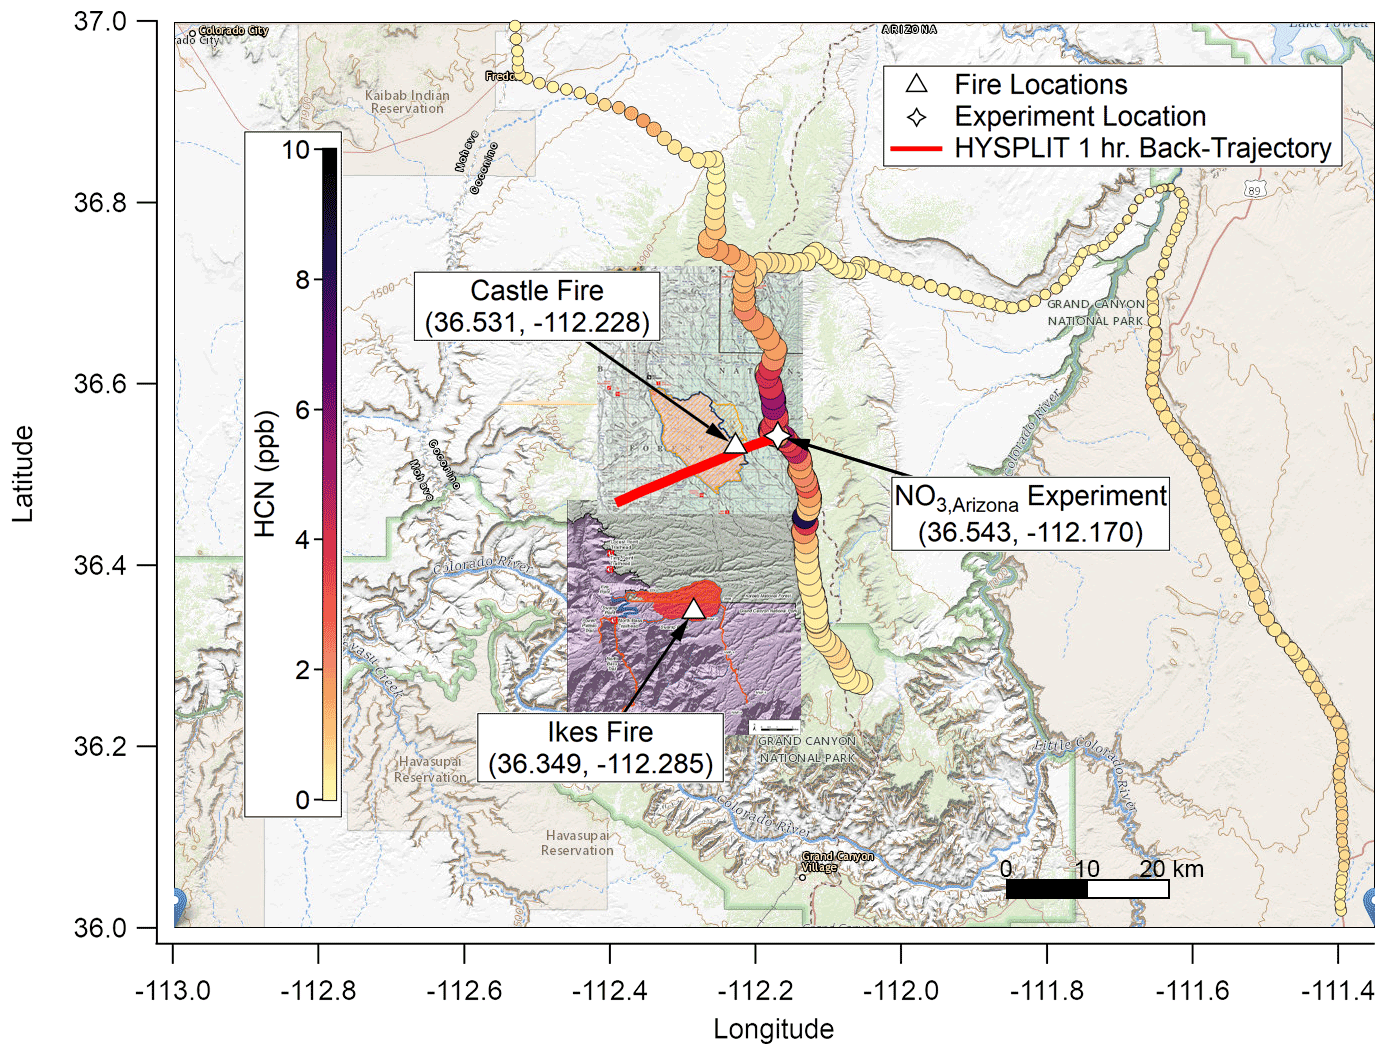
Figure 2As with Fig. 1 but for NO3,Arizona on 22 August 2019. Based on HYSPLIT back trajectories, the plume for this experiment was again less than 1 h old, though smoke that had settled in the valley under the nocturnal boundary layer may have been older. The background map is from USGS EarthExplorer, and fire map overlays are from the National Wildfire Coordinating Group's Incident Information System (InciWeb).
2.1.2 204 Cow Fire, eastern Oregon
After returning from Arizona, the nearest fire of interest was the 204 Cow Fire (44.28∘ N, 118.47∘ W) in the Malheur National Forest region of the Blue Mountains in eastern Oregon, approximately 200 km west-southwest of McCall. The 204 Cow Fire was ignited on 9 August by lightning and grew to burn 9668 acres (approximately 29 km2) until its containment on 15 October. The region is predominantly forested by various species of pine, fir, and juniper trees (Pinus, Abies, and Juniperus, respectively) along with shrub species of sagebrush (Artemesia) (Riccardi et al., 2007). The fire had burned approximately 5500 acres (22.3 km2) by 26 August, when both OH• OFR (“OHOregon”; 09:30 UTC, 03:30 MDT; 44.23∘ N, 118.40∘ W) and NO3• OFR (“NO3,Oregon”; 12:30 UTC, 06:30 MDT; 44.25∘ N, 118.40∘ W) experiments took place (Fig. 3). The AML approached from State Route 26 and then traversed a series of National Forest Development roads to conduct sampling less than 3 km from the fire management area.

Figure 3As with Figs. 1 and 2, showing fire ignition point (white triangle), OHOregon and NO3,Oregon experiment locations (white stars), and fire boundary maps for 26 August 2019. HYSPLIT back trajectories again show that the plumes for these experiments were much less than 1 h old. The background map is from USGS EarthExplorer, and fire map overlays are from the National Wildfire Coordinating Group's Incident Information System (InciWeb).
2.2 Instrumentation
2.2.1 Multiwavelength integrated photoacoustic nephelometer (MIPN)
A description of the design and development of this instrument, including calibration procedures, has been given previously (Arnott et al., 1999, 2000; Moosmüller and Arnott, 2003; Varma et al., 2003; Lewis et al., 2008). Briefly, the aerosol light absorption coefficient (βabs; Mm−1) was measured with the prototype version of a new multiwavelength integrated photoacoustic nephelometer (MIPN) at two wavelengths (λ=488 and 561 nm). The MIPN is based upon single-wavelength instruments constructed at Washington University in St. Louis and was described previously (Sumlin et al., 2017a, 2018a, b). Novel to the MIPN is a dual-cell arrangement wherein the sample stream is split, and one branch is filtered to remove particulate matter, thereby simultaneously sampling a particle-free gaseous background to account for noise from various sources such as ambient acoustic, electrical, and flow noise. Data were acquired from each wavelength in series at 0.5 Hz for 1 min per wavelength and averaged across each wavelength's 1 min cycle. Due to a field malfunction, scattering measurements were not obtained.
OA mass absorption cross-sections (MAC(λ); m2 g−1) at the two operating wavelengths were calculated from the ratio of βabs measured with the MIPN and OA mass concentrations measured with the soot particle aerosol mass spectrometer (SP-AMS) after correcting for dilution and wall losses in the OFR. We additionally calculated the MAC(λ) enhancement, EMAC(λ), from the ratio of OFR-processed and ambient MAC(λ) values. Thus, EMAC(λ)>1 indicates an oxidative-aging-induced absorption enhancement, while EMAC(λ)<1 indicates diminished absorption. To obtain reasonable estimates for EMAC(λ) values that are representative of a given set of oxidation conditions yet still capture the nature of the dynamic plume, EMAC(λ) was calculated using the average of aerosol MAC(λ) during a given oxidation step divided by the average of the ambient steps immediately prior and after.
2.2.2 Aerosol mass spectrometer
The SP-AMS is a standard Aerodyne high-resolution time-of-flight aerosol mass spectrometer (HR-ToF-AMS) with an intracavity continuous wave laser vaporizer (Onasch et al., 2012). The AMS was operated to provide online chemically speciated mass and sizing measurements of both non-refractory and refractory particles between approximately 70–2500 nm in aerodynamic diameter. A PM2.5 inlet lens was installed on the AMS for this study, extending the range of 100 % transmission efficiency of particles up to 2.5 µm in diameter through the lens. The SP-AMS laser was operated with an approximately 50 % duty cycle. When the laser was off, the system was operated as a conventional AMS. During OHArizona, OHOregon, and NO3,Oregon, the SP-AMS was used. During NO3,Arizona, the conventional AMS was used. The instrument was run with 20 s time resolution, and data points included both chemical speciation and mass loading by mass spectral analysis and particle sizing by species for each data point. In the SP-AMS, particles containing refractory materials (i.e. refractory black carbon (rBC) and many metals) are vaporized with a 1064 nm laser. The resulting vapor is ionized via electron impact and detected with the HR-ToF-AMS. In addition to the SP-AMS vaporization, the conventional AMS heater (a heated tungsten surface at 600 ∘C,; Jayne et al., 2000; Canagaratna et al., 2007) was also used to measure the composition of any non-refractory particles. When the instrument was run as a conventional AMS, this was the only heater used.
2.2.3 Potential aerosol mass oxidation flow reactor (OFR)
The potential aerosol mass OFR (Aerodyne Research, Inc.; Lambe et al., 2011) is a horizontal 13 L aluminum cylindrical chamber (46 cm long × 22 cm interior diameter, ID) operated in continuous-flow mode. Irradiance, relative humidity, and temperature in the OFR were measured at the exit flange with UV (TOCON GaP6, sglux) and RH/T (SHT21, Sensiron) sensors, and ozone concentrations were measured with an ozone analyzer (model 106-M, 2B Technologies).
2.2.4 Aerodyne Mobile Laboratory
The AML, a mobile sampling platform equipped with a suite of research-grade instrumentation, was used to facilitate the in situ OFR-based experiments described here. The AML traveled throughout Idaho, Oregon, Utah, and Arizona during FIREX-AQ, sampling continuously when not conducting OFR experiments. The general sampling strategy was to search for smoke-filled valleys and transect plumes with the AML, using the tuneable infrared laser direct absorption spectrometer (TILDAS; Aerodyne Research, Inc.) (McManus et al., 2011a, b) measurements of hydrogen cyanide (HCN) as a tracer for biomass smoke plumes (Li et al., 2000). Upon identification of a suitable location, the AML parked with the sample inlet on the front of the truck facing into the wind to avoid self-sampling of its own exhaust. A PM2.5 cyclone with a small mesh screen to filter out extremely large ash particles was attached to the inlet. A schematic of the OFR experimental setup is given in Fig. 4.
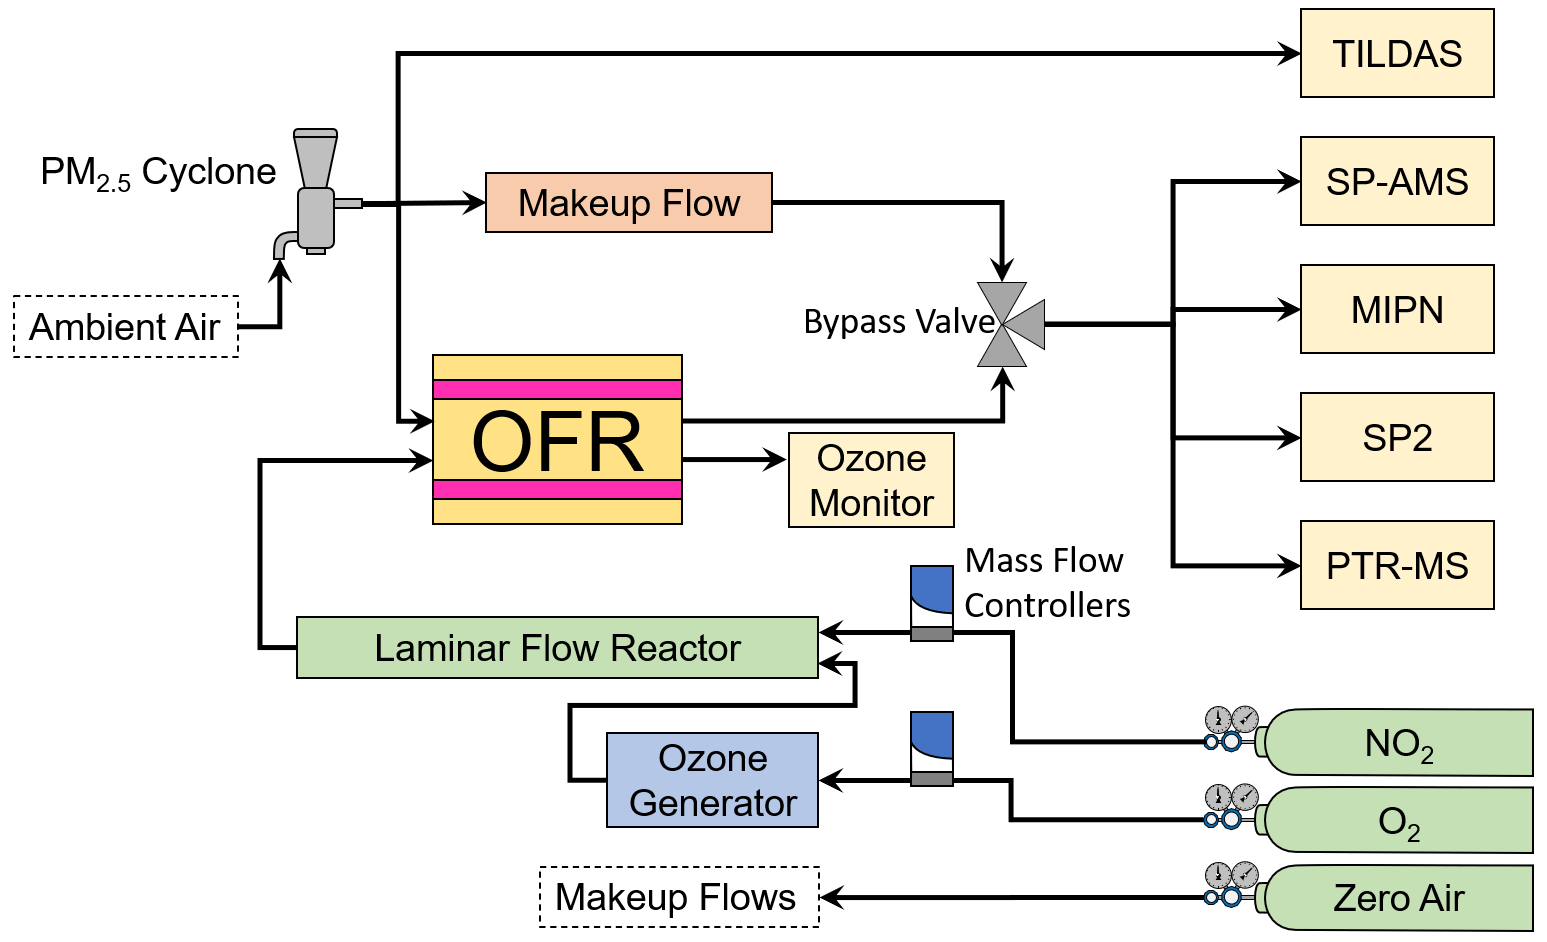
Figure 4A schematic of the general experimental setup aboard the AML showing instruments, reactors, reagents, and other hardware.
AML positioning, including latitude, longitude, and altitude, was measured by a Vector V103 GPS compass (Hemisphere GNSS, Inc., Scottsdale, AZ). Wind velocity was measured by an ultrasonic anemometer (model 86000, R. M. Young Company, Traverse City, MI). Additional meteorology products were obtained from the NOAA Air Resources Laboratory North American Mesoscale 12 km Archive, and plume ages were approximated using the Hybrid Single-Particle Lagrangian Integrated Trajectory (HYSPLIT) model (Stein et al., 2016). Aerosol composition and mixing state properties were measured with a soot particle aerosol mass spectrometer (SP-AMS; Aerodyne Research, Inc., Onasch et al., 2012) and single-particle soot photometer (SP2; Droplet Measurement Technologies; Stephens et al., 2003). A Vocus proton transfer reaction mass spectrometer (PTR-MS; Aerodyne Research, Inc. and Tofwerk AG, Switzerland) (Krechmer et al., 2018) sampled volatile organic compounds (VOCs).
2.3 Experiment design
The total instrument plus makeup flow rate through the OFR was 6.4 L min−1, corresponding to a calculated mean plug flow residence time of 123 s. The degree to which plug flow is a valid model for an OFR is the subject of ongoing research; however, this assumption is adequate for the flow rates and experimental setups used here (Mitroo et al., 2018). OFR experiments lasted 1 to 2 h, during which the reagent inputs were controlled in steps to simulate varying degrees of atmospheric aging. An experiment step consists of two phases: an ambient phase and a reaction phase. During the ambient phase, instruments first sampled ambient air for 5–10 min (depending on the experiment timeline), while laminar flow reactor (LFR) and OFR conditions equilibrated for the reaction phase. During the ambient phase, 5 L min−1 of makeup flow was pulled through the OFR to reduce stagnation time. Once the ambient phase ended, an electronically actuated three-way valve was switched to connect the instruments to the OFR, and OFR-processed air was sampled for 5 to 10 min. After each step, the OH• or NO3• exposure was changed, and the above measurements were repeated. After each experiment, the OFR was cleaned out by setting both sets of lamps to maximum output and overblowing the inlet with humidified zero air until AMS measurements of background organic mass were below 0.3 µg m−3. To account for dilution and particle wall losses in the OFR, refractory black carbon (rBC) monitored with the SP2 was used as a chemically conserved tracer. During all experiments, rBC accounted for ∼2 % to 5 % of total aerosol mass (Figs. S1 and S2).
In the following sections, ambient phases are denoted “ambient_X”, and oxidation phases are denoted “OFR_OH_X” for OH• experiments, and for NO3• experiments, the ozone-only step is denoted “OFR_O3”, and NO3• oxidation steps are denoted “OFR_NO3_X”. “X” indicates the step number. Finally, each experiment includes a “background” measurement, where ambient air was sampled through the dark OFR without oxidant generation.
2.3.1 NO3 experiment design and analysis
To generate NO3•, N2O5 was first generated in the gas phase from the reaction NO2 + O3 → NO3• + O2 followed by the reaction NO3• + NO2 → N2O5 in a 152.4 cm long × 2.22 cm ID perfluoroalkoxy laminar flow reactor (LFR) coupled to the OFR (Lambe et al., 2020). Separate flows containing NO2 (1 % in N2; Praxair) and O3 were added to the LFR. In these experiments, the NO2 + N2 flow rate was set between 0 and 40 cm3 min−1, and O3 was generated by passing 1.8 L min−1 of O2 through an ozone chamber housing a mercury fluorescent lamp (GPH212T5VH, Light Sources, Inc.). The O3 mixing ratio that was input to the LFR was approximately 250 ppmv during NO3• OFR experiments. The NO2 + N2 and O2 flow rates were set using mass flow controllers. The N2O5 generated in the LFR thermally decomposed at room temperature inside the OFR to generate NO3•. The first oxidation step of NO3• OFR experiments was with ozone only (“OFR_O3”) to assess the effect of O3 exposure on OA composition and optical properties relative to ambient OA. During NO3,Arizona, NO2 was stepped down from 40 to 20, 5, and 3 cm3 min−1 to generate the various oxidation timescales (Fig. S3). During NO3,Oregon, inputs of 15 and 5 cm3 min−1 were used. The integrated NO3 exposure, defined as the product of the average NO3• concentration and the mean OFR residence time (τOFR), was calculated using an estimation equation developed by Lambe et al. (2020):
where a through m are empirical fit coefficients derived by Lambe et al. (2020) and summarized in Table S1; TOFR is the measured temperature in the OFR; [NO2]0,LFR and [O3]0,LFR are the NO2 and O3 mixing ratios input to the LFR (ppmv); k = 0.01 s−1 is the assumed N2O5 wall loss rate coefficient in the OFR; and (NO3R)ext is the external NO3• reactivity (s−1), which was calculated from the summed products of ambient VOC concentrations (measured with Vocus) and their NO3• rate coefficients (found in the data repository; see Data availability section). Corresponding calculated NO3• exposures ranged from 1.4 × 10¹⁴ to 3.4 × 10¹⁴ molec. cm−3 s, or approximately 72 to 192 equivalent hours (3 to 8 equivalent days) of atmospheric oxidation at a 24 h average NO3• concentration of 5 × 10⁸ molec. cm−3 (Atkinson, 1991).
2.3.2 OH• experiment design
OH• was generated via photolysis of ambient O2 and H2O at λ=185 nm plus photolysis of O3 (generated at λ=254 nm using low-pressure mercury (Hg) lamps):
A fluorescent dimming ballast was used to regulate current applied to the lamps (GPH436T5VH/4, Light Sources, Inc.). The dimming voltage applied to the ballast ranged from 1.6 to 10 V direct current (DC). To extend the range of OH• concentrations below what is achievable with one set of lamps at 1.6 V DC, a second set of GPH436T5VH/4 lamps with added segments of opaque heat shrink tubing applied to ∼86 % of the arc length (Rowe et al., 2020) was used. The OHArizona OFR experiment began with the non-attenuated lamps set to maximum output. We then switched to the attenuated lamps and stepped the dimming voltage from 10.0 to 5.0, 3.0, 2.0, and 1.6 V (Fig. S4). The OHOregon experiment started with the non-attenuated lamps at 10 V. We then stepped the dimming voltage from 10.0 to 5.0 and 1.6 V. The OH exposure was calculated using Eq. (2) from Rowe et al. (2020):
where a through f are fit coefficients tabulated in Table S2; O3 is the ozone mixing ratio measured at the exit of the OFR (molec. cm−3); OHRext is the external OH• reactivity (s−1), which was calculated from the summed products of ambient VOC concentrations (measured with Vocus) and their OH• rate coefficients (see Data availability section); H2O is the ambient water vapor mixing ratio (%); and τ is the residence time in the OFR. Corresponding calculated OH• exposures ranged from 3.91 × 10¹¹ to 2.53 × 10¹² molec. cm−3 s, or approximately 72 to 480 equivalent hours (3 to 20 equivalent days) of atmospheric oxidation at a 24 h average OH• concentration of 1.5 × 10⁶ molec. cm−3 (Mao et al., 2009).
3.1 Ambient organic aerosol MAC(λ)
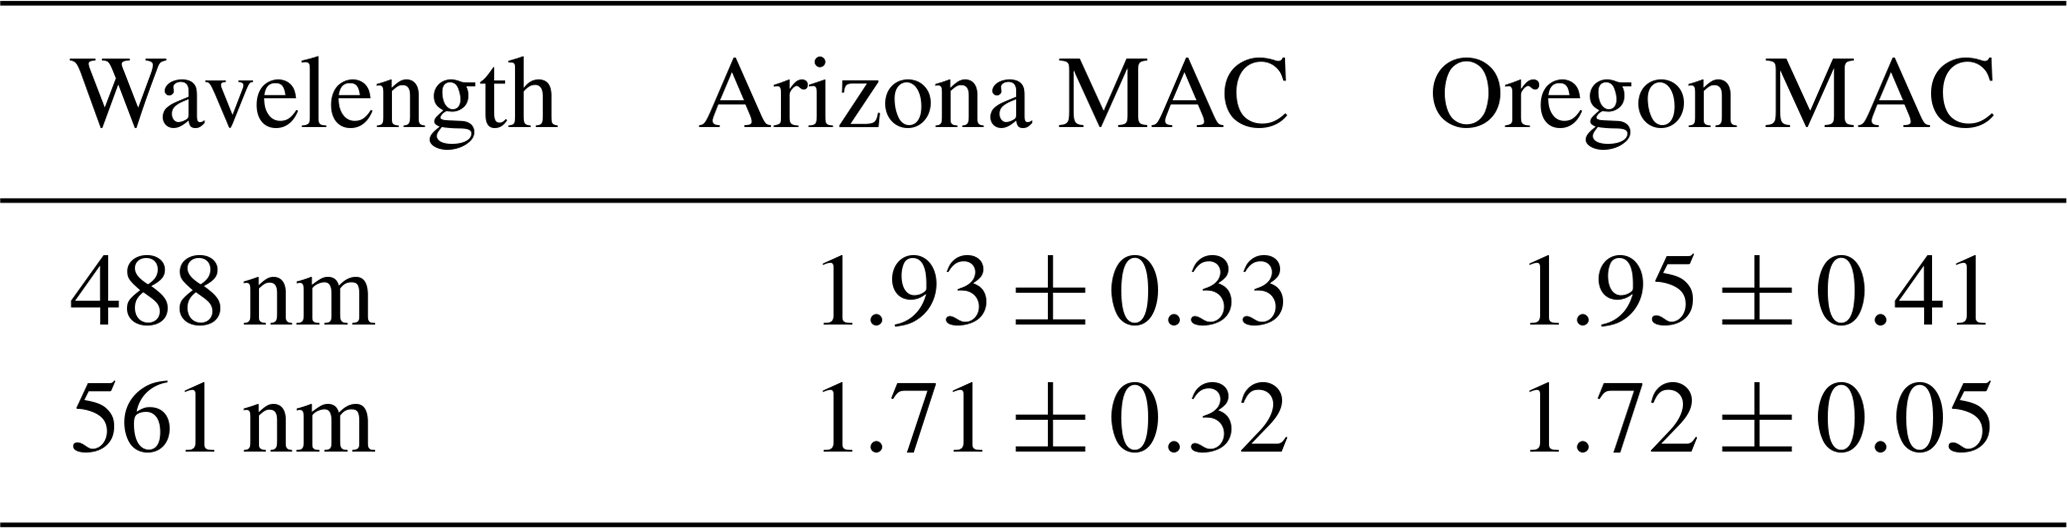
Table 1 summarizes the average MAC(λ) values (m2 g−1) of OA sampled from smoke plumes originating from the Arizona and Oregon wildfires. The absorption Ångström exponent (AAE), which parameterizes the wavelength dependence of absorption and is calculated from the two-parameter formula
was 0.83 ± 0.25 in Arizona and 0.91 ± 0.21 in Oregon. As shown in Figs. S1 and S2, the rBC mass fraction in the sampled plumes was negligible (<5 %) and within the margin of error due to charring of OA in the SP2 (Sedlacek et al., 2018). Therefore, we are confident that the calculated AAE values corresponded to light-absorbing OA constituents in the intercepted plumes.
Table 1Study-average values of MAC from Arizona and Oregon. Errors are 1 standard deviation.
3.2 NO3• oxidative aging of organic aerosol
Equivalent nighttime oxidation of between 78.72 ± 0.00 and 184.08 ± 4.03 h (between 3.28 ± 0.00 and 7.67 ± 0.17 d) was performed across the NO3,Arizona and NO3,Oregon OFR experiments. Average surface wind speeds during these experiments were 0.39 m s−1 in Arizona and 1.40 m s−1 in Oregon. EMAC(λ) is shown in Fig. 5 and summarized in Table 2 as the Oregon data points are obscured by their similarity. EMAC(λ) from NO3,Arizona increases by a factor of up to 1.69 ± 0.38 as a function of NO3• exposure, as does EMAC(λ) from NO3,Oregon, although to a lesser extent because EMAC(λ) was higher at lower equivalent timescales. There was a marked difference in the external reactivity (NO3,EXT). NO3,EXT (and similarly, OHEXT in Sect. 3.3) is the total summed reactivity of ambient gas-phase biomass burning VOCs (BBVOCs) to NO3 (or OH). Concentrations are measured by the PTR-MS during the ambient phases and calculated by NO3,EXT or OH × [NO3 or OH] × [BBVOC], where k denotes the relevant rate constant. In Arizona, calculated NO3,EXT values ranged from 11.6 to 17.6 s−1, while in Oregon, NO3,ext ranged from 161.0 to 187.1 s−1; the NO3• reactivity of catechol alone (measured by the PTR-MS) was 48 to 56 s−1. This indicates the presence of high concentrations of BBVOCs that were highly reactive to NO3• (Finewax et al., 2018).
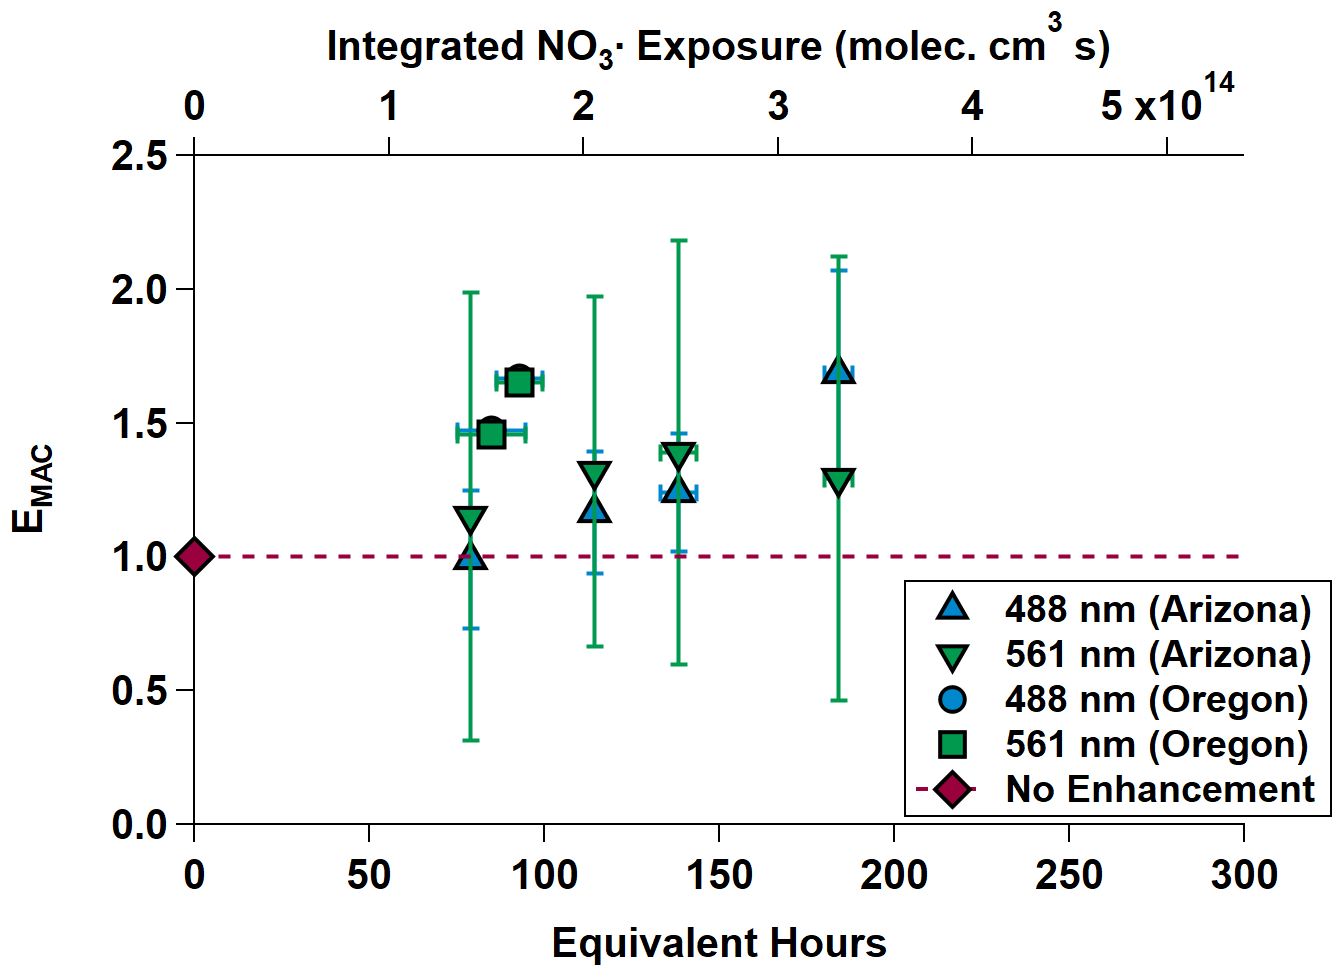
Figure 5MAC(λ) enhancements at 488 and 561 nm during NO3,Arizona (triangles) and NO3,Oregon (square and circle; the circle is partially obscured by the square). The dashed gray line is the “no enhancement” line. The Arizona experiment data show an increasing trend in MAC(λ) with increasing equivalent age. The Oregon data on their own do as well, but in the context of the Arizona data, the chemical species present in the smoke plume in Oregon appear to have been much more reactive towards NO3•. Equivalent photochemical age is calculated from the NO3• exposure in the OFR and assuming an average ambient NO3• concentration of 5 × 10⁸ molec. cm−3 (Atkinson et al., 1991).
Table 2EMAC (488 nm) and EMAC (561 nm) for NO3• oxidation experiments.
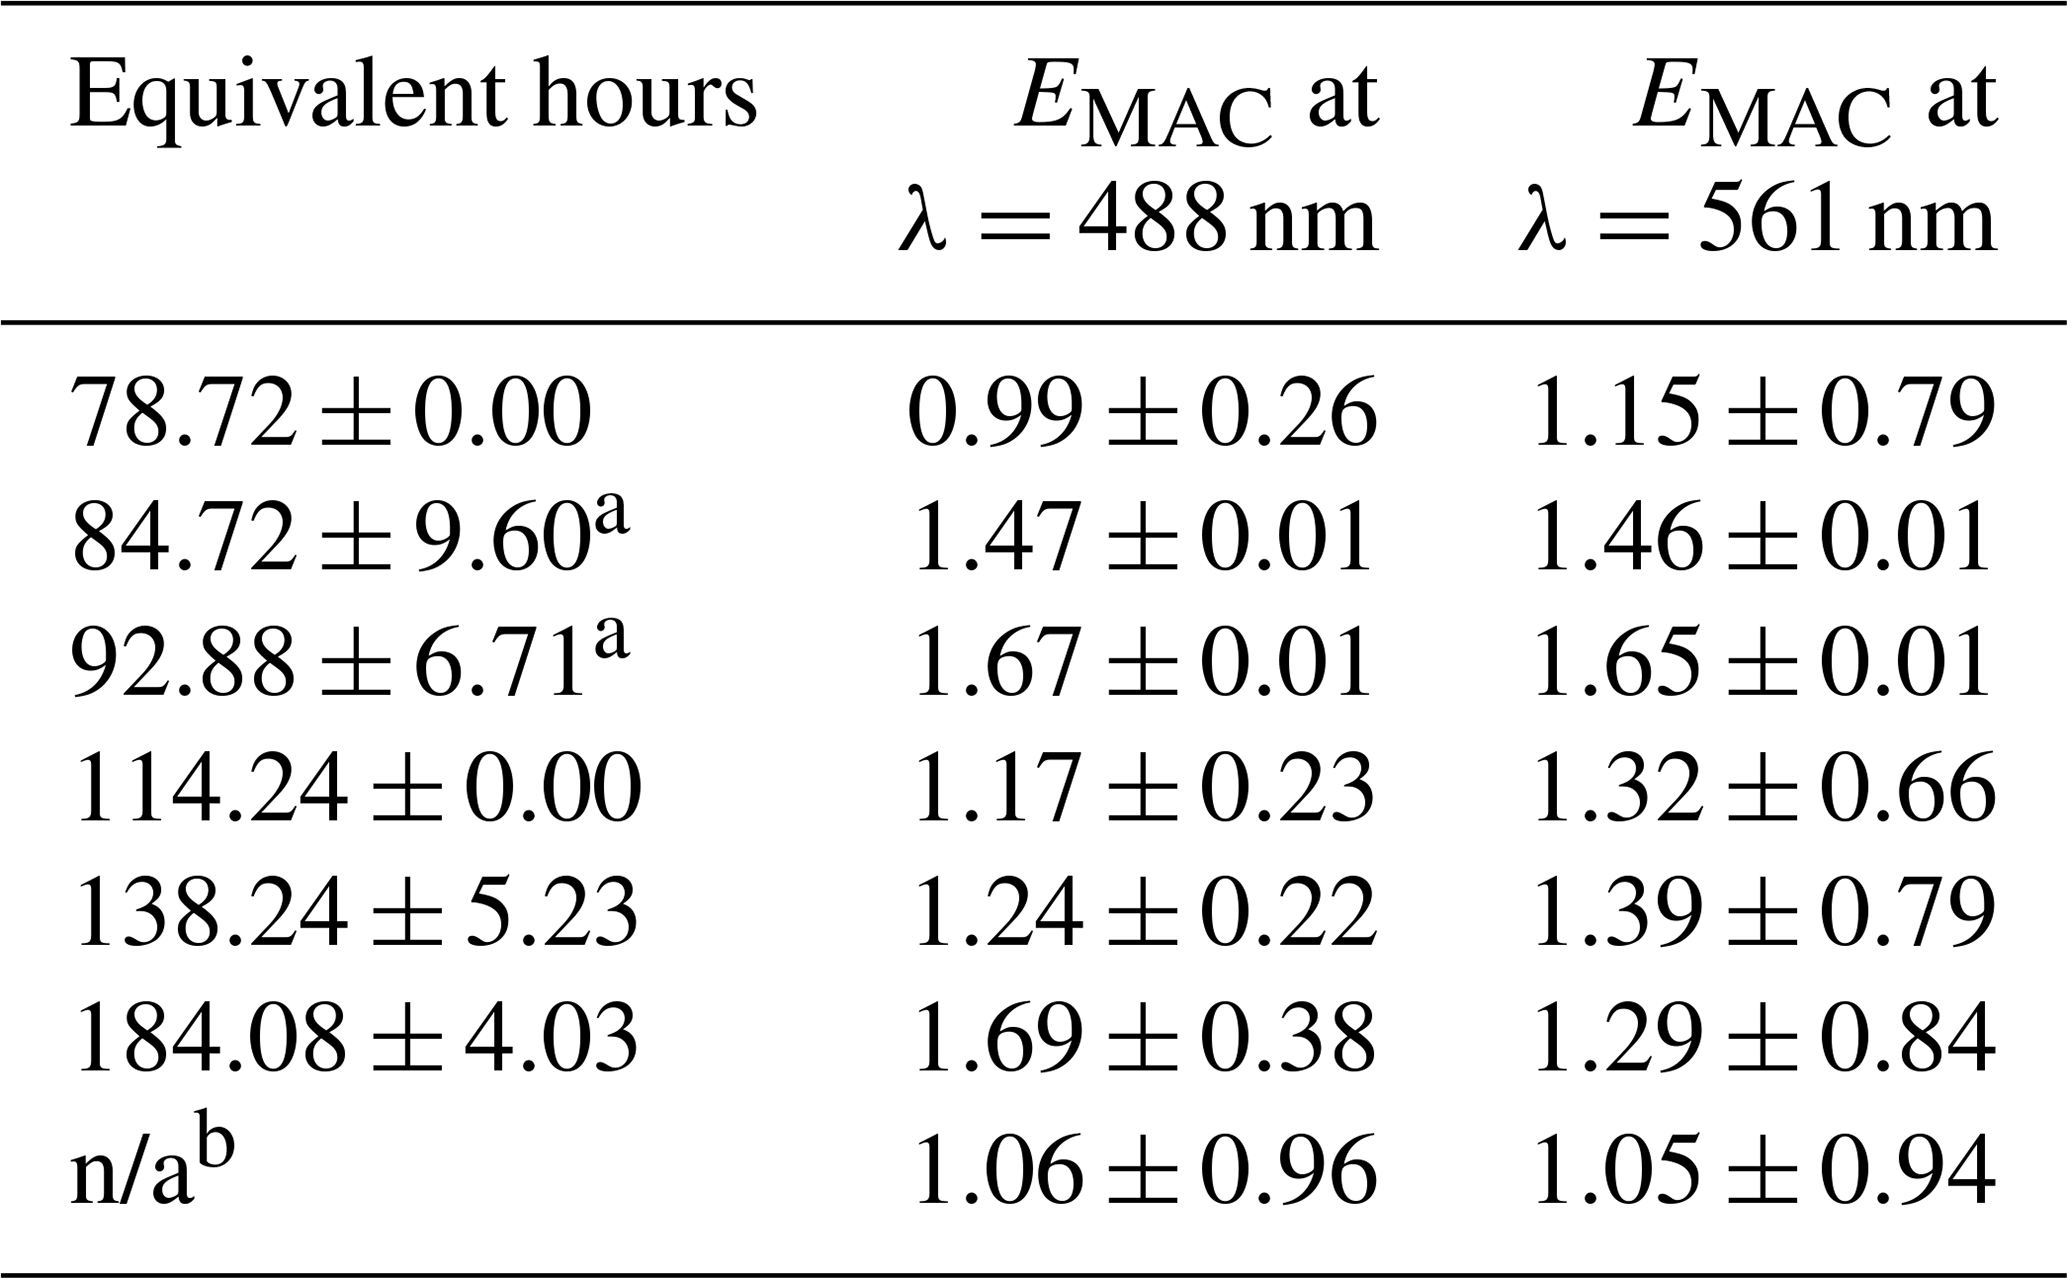
a NO3,Oregon. b O3-only oxidation. All other data points taken during NO3,Arizona; n/a stands for not applicable.
The differences in BBVOC external reactivities manifested in different EMAC(λ) behavior at the two sites. On the shortest oxidation timescale in Arizona (78.72 ± 0.00 equivalent hours), EMAC (488 nm) was 0.99 ± 0.26, and EMAC (561 nm) was 1.15 ± 0.79. This is in contrast to Oregon, where at 84.72 ± 9.60 equivalent hours, EMAC (488 nm) was 1.47 ± 0.01, and EMAC (561 nm) was 1.46 ± 0.01, which we attribute to the variations in BBVOC concentrations between sites. At longer timescales in Arizona, EMAC continued to increase up to EMAC (488 nm) of 1.69 ± 0.38 and EMAC (561 nm) of 1.29 ± 0.84. These values were commensurate with results from Oregon at only 92.88 ± 6.71 equivalent hours. Regardless of choice of site, EMAC(λ) consistently increased with increasing NO3• oxidation timescales. Li et al. (2020) previously observed this absorption enhancement effect in the laboratory by subjecting biomass burning BrC proxy aerosol derived from wood tar to an experimental setup similar to what was used here. They observed EMAC(λ) in the near-UV (330–400 nm) of approximately 2.4 and approximately 6.0 in the visible (400–550 nm), though this high value comes from the ratio of two relatively low MAC(λ) values of 0.6 and 0.1 m2 g−1, much lower than the MAC (561 nm) reported here, which, for ambient aerosol was 1.71 ± 0.32 m2 g−1 in Arizona and 1.72 ± 0.05 m2 g−1 in Oregon.
A breakdown of the chemical speciation from NO3,Arizona was obtained from the AMS data from before and after the OFR_NO3_1 step (refer to Fig. S3), the first oxidation step after ozonolysis. During this step, 217 ppm NO2 was flowing into the LFR. NO3,EXT before and after this step was 17.56 and 13.90 s−1, respectively, for an estimated equivalent age of 138.24 ± 5.23 h. The individual ions measured by the AMS can be visualized for oxidative enhancement or depletion on a log–log scatterplot, shown with markers in Fig. S5 and with individual in Fig. S6. Ions above the solid black line are enhanced following NO3• exposure, whereas ions below are depleted. The 2:1 and 1:2 lines are also included. Colors are per ion family.
While knowledge of the individual enhancement and depletion may inform future investigations, it is perhaps more illustrative to consider ion families. Figure 6 shows the enhancement and depletion of the ion families in Figs. S5 and S6 on the basis of total ion mass in that family. Enhancement is calculated by summing the relative abundances of all ions within a family and taking the ratio of oxidized to ambient, similar to how EMAC(λ) is calculated.
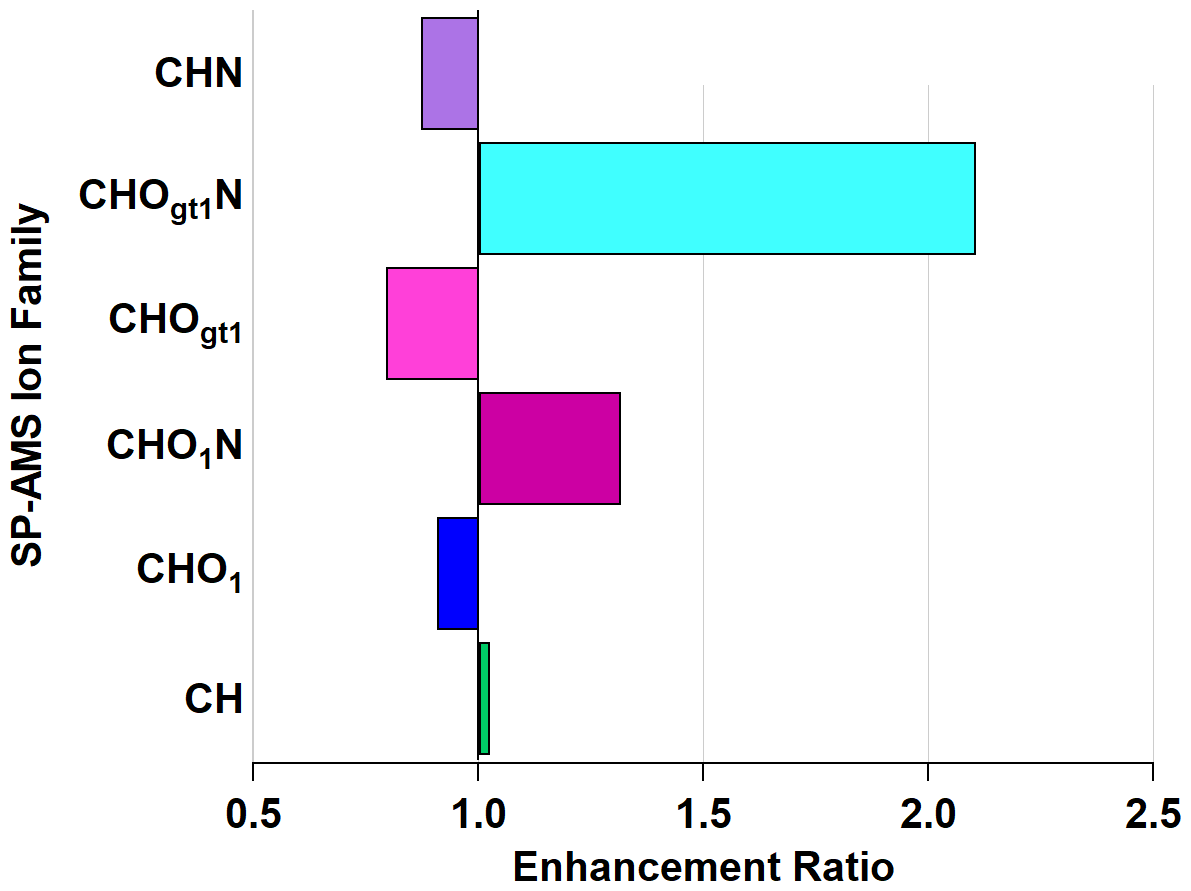
Figure 6Enhancement and depletion of ion families measured by the AMS during NO3• oxidation. CHO1N and CHOgt1N, while present in lower relative abundances, showed the largest enhancement through NO3• oxidation.
The CHOgt1N (“Ogt1” indicates more than one oxygen atom in a molecule containing one or more atoms of C, H, and N) family is enhanced by 211 % and CHO1N (“O1” indicates a single oxygen atom in a molecule containing one or more atoms of C, H, and N) by 132 % through the OFR, with a corresponding diminishment in CHOgt1 and CHO1 (where, again, “Ogt1” and “O1” indicate the quantity of oxygen atoms in molecules of one or more atoms of C and H) to 79 % and 91 %, respectively. This does not imply that all CHO1N species come from CHO1 (or CHOgt1N from CHOgt1, similarly). The addition of nitrogen-containing functional groups is likely the cause of the observed light absorption enhancement since nitrogenated aromatic hydrocarbons form during reactions with NO3• (Li et al., 2019) and can act as chromophores, increasing light absorption (Jacobson, 1999; Laskin et al., 2015; Xie et al., 2019).
3.2.1 O3 oxidation effects
The first step in the NO3• experiments was an O3-only oxidation experiment in case the effects of ozonolysis on biomass burning smoke were significant. Since the NO3• oxidation steps carry a significant amount of residual O3, the contribution of O3 to changes in absorption behavior should be quantified and treated separately from NO3•. Li et al. (2020) performed a similar experiment in their laboratory oxidation studies and found that NO3• oxidation was the dominant chemical transformation mechanism when compared to O3. They further reported a slight decrease in MAC (405 nm) quantified by a reduction in the imaginary refractive index from 0.017 ± 0.005 to 0.011 ± 0.003. However, differences in how Li et al. (2020) performed their experiments (by exposing aerosol to 35 ppbv O3 for 10.6 h) preclude any direct comparison to the short O3 exposure timescales performed during FIREX-AQ.
EMAC(λ) due to O3 during NO3,Arizona was 1.06 ± 0.96 and 1.05 ± 0.94 for 488 and 561 nm, respectively, indicating that O3 effects during the OFR experiments were negligible, or at least dominated by NO3•.
3.3 Daytime oxidation
Compared to the NO3• experiments, a much broader range of equivalent atmospheric aging was mimicked in the OH• experiments. NO3• is a comparatively selective oxidant, while OH• tends to oxidize nearly all organic aerosol it comes into contact with. Between approximately 72 and 480 equivalent hours (3 and 20 equivalent days) of oxidation were performed. Average surface wind speeds were 2.98 m s−1 in Arizona and 0.43 m s−1 in Oregon. As expected, EMAC(λ) for these experiments nominally showed light absorption diminishment for most experiments; however, EMAC(λ) exceeded unity between 91.06 ± 1.30 and 417.86 ± 96.95 h. This effect of initial darkening and subsequent lightening has been reported previously (Sumlin et al., 2017a; Hems et al., 2020). The nature of this absorption enhancement mechanism was outside the scope of Sumlin et al. (2017a), who rather focused on the likely mechanisms of BrC light diminishment; however Hems et al. (2020) posit that the increase in absorbance is linked to the formation of aromatic dimers and functionalization reactions. Hems et al. report that the absorption enhancement was observable up to 11 equivalent hours of OH• exposure and diminished with a net exposure of up to 42 h. It should be noted that the samples analyzed by Hems et al. were only the water-soluble portion, obtained by gathering BrC on a filter and extracting with purified water. Furthermore, the OH• oxidation was carried out by adding hydrogen peroxide to the extract solution and exposing it to UV lamps. The OH• oxidation performed by the OFR during FIREX-AQ is far less controlled given the dynamic nature of the plumes we sampled.
Figure 7 shows EMAC(λ) at 488 and 561 nm for all OH• experiments. The data are summarized in Table 3.
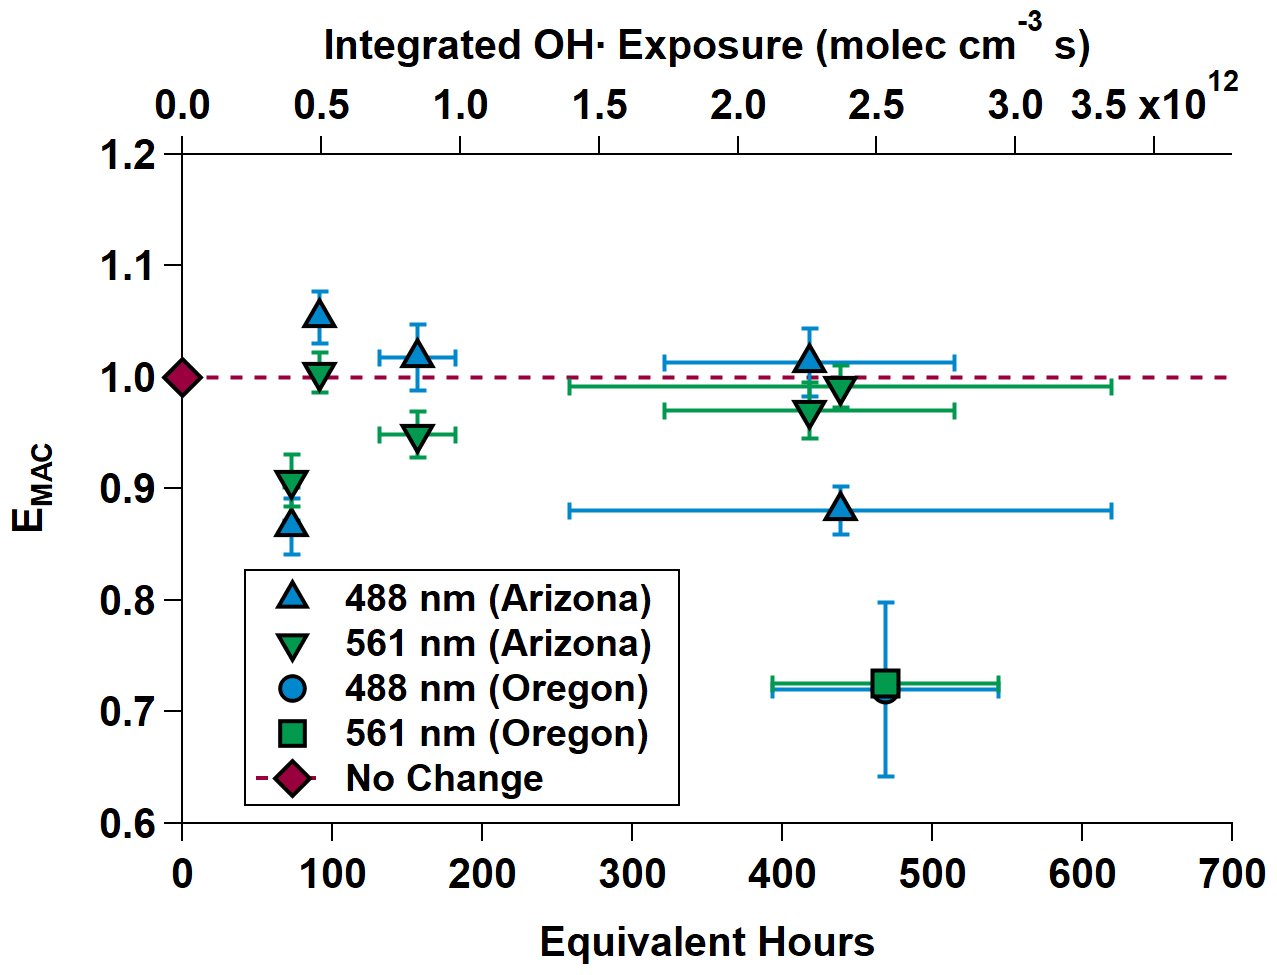
Figure 7MAC(λ) enhancements at 488 and 561 nm during OHArizona (triangles) and OHOregon (square and circle, which is partially obscured). The dashed gray line is the “no enhancement” line. The data show an initial diminishment, then subsequent increasing-to-decreasing trend in MAC(λ) with increasing equivalent age. Equivalent photochemical age (hours) is calculated from the OH• exposure in the OFR and assuming an average ambient OH• concentration of 1.5 × 10⁶ molec. cm−3 (Mao et al., 2009).
Table 3EMAC (488 nm) and EMAC (561 nm) for OH• oxidation experiments.
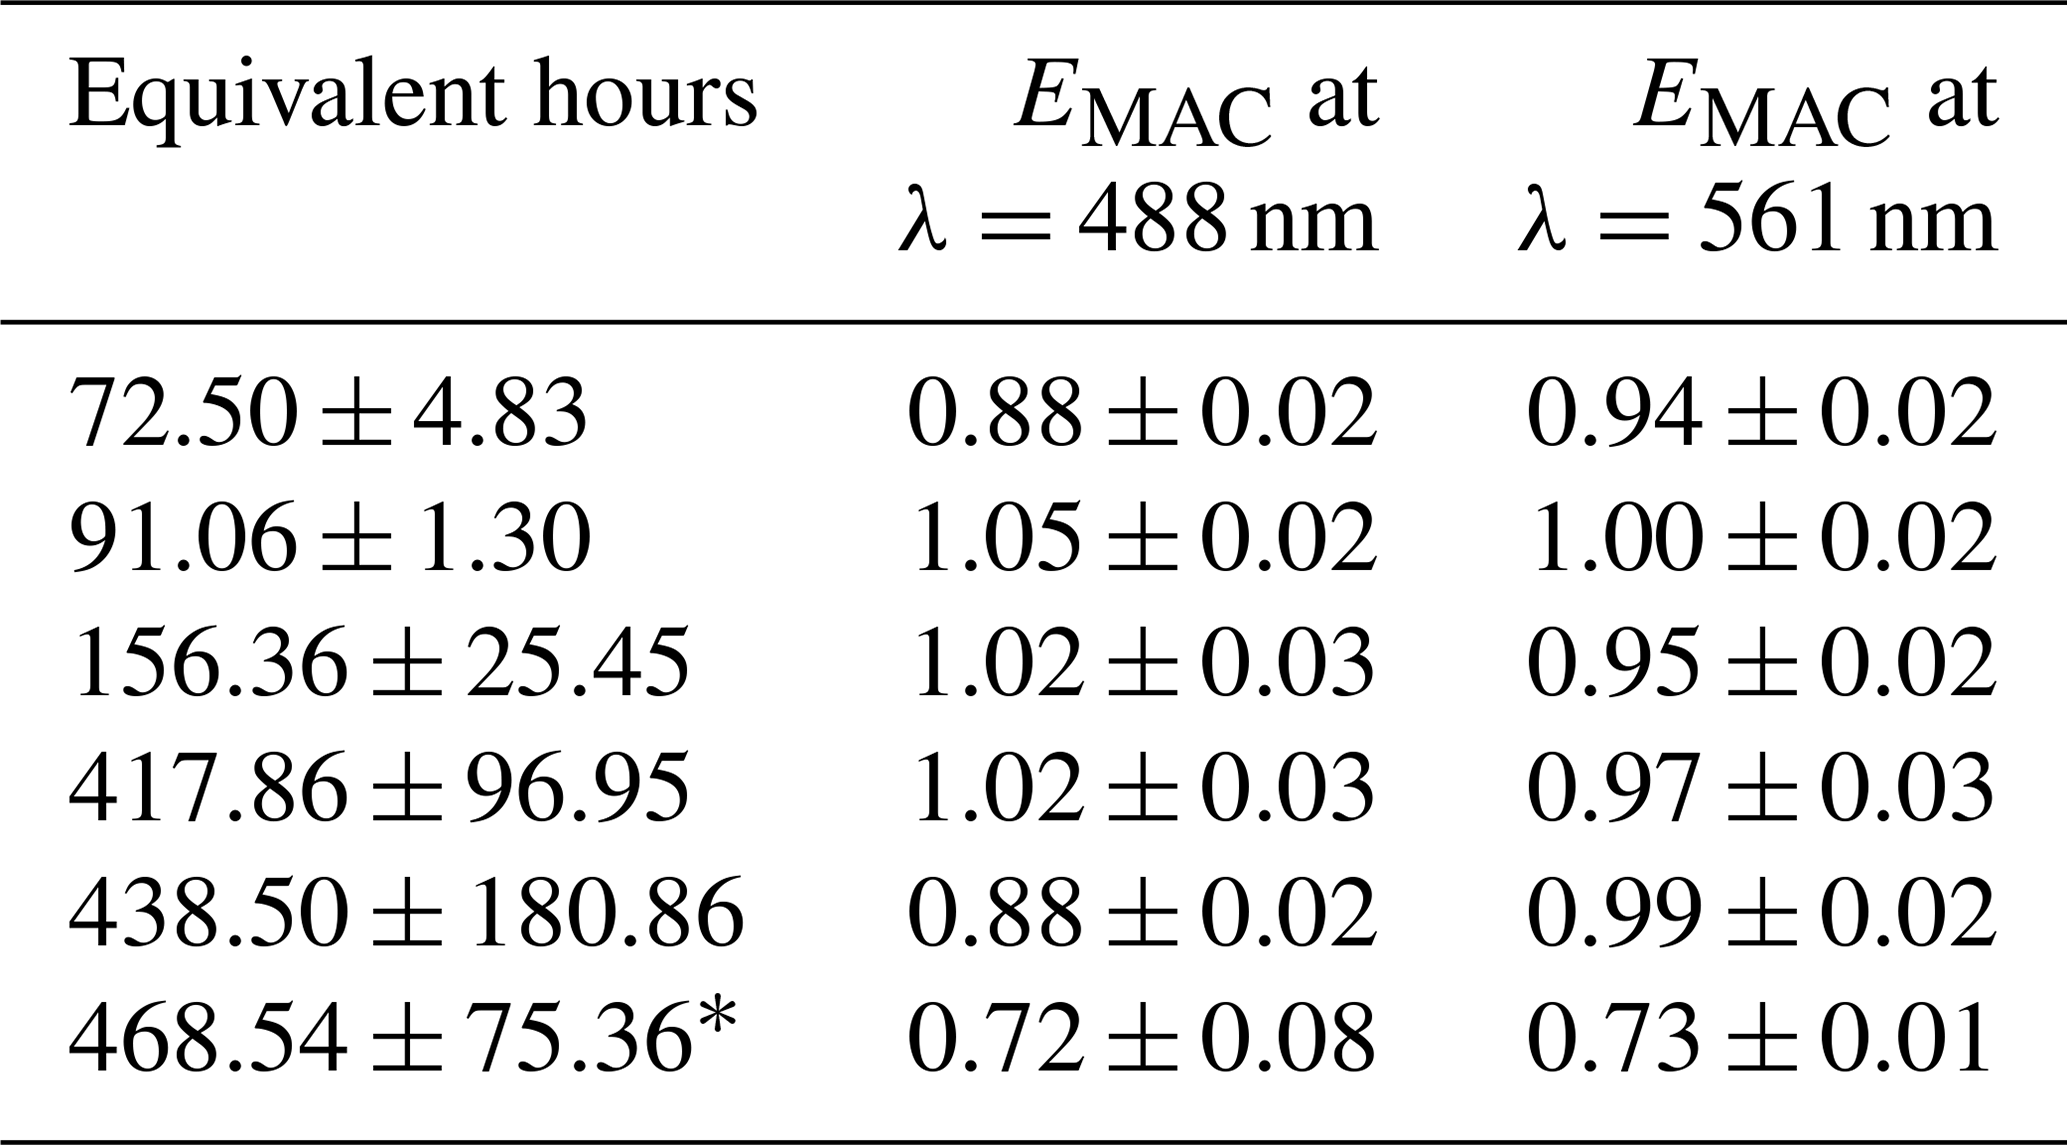
* OHOregon. All others taken during OHArizona.
While OHEXT values were large, it is noteworthy that they were typically exceeded by NO3,EXT values, which, as noted in the previous section, indicates the presence of BBVOCs that are more reactive toward NO3• than toward OH•. The exact nature of these sensitivities requires further research.
The same scatterplot analysis was applied to the OFR_1 step (refer to Fig. S4) of the OHArizona experiment; however, it is less illustrative than with NO3• because the primary driver of MAC(λ) diminishment is fragmentation reactions. Before this step, OHEXT was 74.95 s−1, and after, it was 59.37 s−1, giving an approximate equivalent age of 438.50 ± 180.86 h. The enhancement ratios of the individual ion families show a decrease in CHO1N and an increase in CHOgt1N, though to a lesser degree than under NO3• aging. The ambient CHOgt1N mass fraction was approximately 25 % higher in the NO3,Arizona as well. The comparatively lower relative abundances of nitroaromatics during OHArizona (both pre- and post-OFR_1) may obfuscate any meaning in the enhancement ratios.
Figure S7 shows the OHArizona scatterplot with markers, and Fig. S8 shows the individual measured by the SP-AMS. Qualitatively, it can be observed that there is less spread in the scatterplot and the points are grouped closer to the 1:1 line, further suggesting that the dominant mechanism is fragmentation.
Figure 8 shows the ion family enhancement ratios through the same OFR_1 step, corroborating the conclusions drawn from the scatterplots.
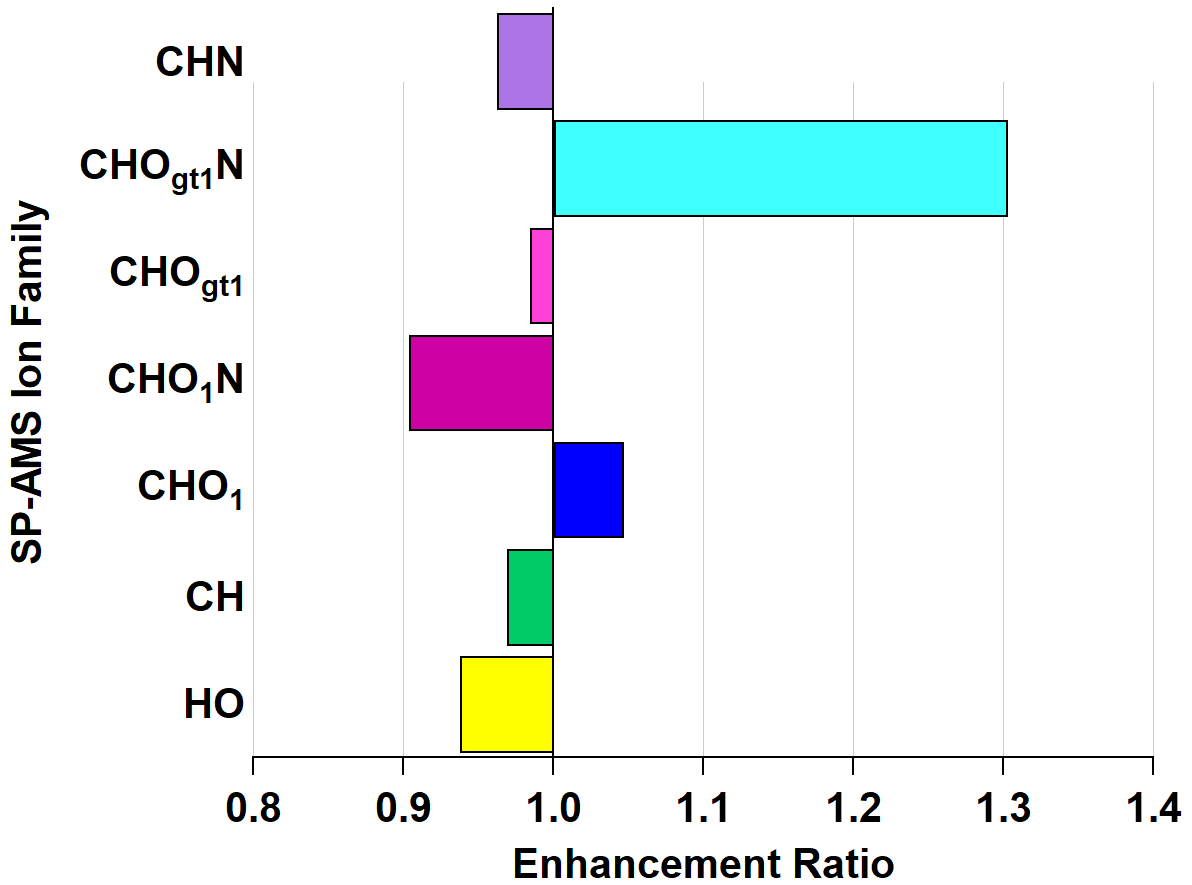
Figure 8Enhancement and depletion of ion families measured by the AMS during OH• oxidation. CHO1N is depleted, while CHOgt1N is enhanced; however, both these families are present in low relative abundances, which may exaggerate the enhancement ratio.
The observations of EMAC(λ) and the associated chemistry of smoke OA sampled as part of the FIREX-AQ ground campaign represent the first attempt to use an OFR in a mobile setting to sample biomass burning at its source as well as the first application of the novel MIPN v1 to a field study. Observations track closely with previous laboratory studies.
These results show the difficulty in naïvely applying a particular aging model to atmospheric aerosol to constrain their long-term behavior in climate models. Aerosol does not age along any single pathway for more than half of a diurnal cycle: at night, oxidative aging of OA by NO3• increases MAC(λ), whereas daytime oxidative aging by OH• initially increases MAC(λ), which is followed by a strong reduction in MAC(λ) due to photobleaching. Overall, our results suggest that explicit characterization of the effect of diel aging on atmospheric aerosol optical, chemical, and physical properties represents the best possible input to climate models.
All experimental data, including MIPN, SP-AMS, SP2, and Vocus PTR-MS measurements, rate constants, and data tables used to calculate external reactivities, are available for download at https://doi.org/10.17632/5mr43vbks3.1 (Sumlin, 2021).
The Supplement includes eight figures detailing rBC fraction observed during experiments (Figs. S1 and S2), sample timelines for oxidation experiments (Figs. S3 and S4), and AMS signal enhancements for various ion families upon oxidation (Figs. S5 through S8). It also includes two tables (Tables S1 and S2) with fit coefficients for Eqs. (1) and (2). The supplement related to this article is available online at: https://doi.org/10.5194/acp-21-11843-2021-supplement.
RKC and BS conceived of the study and its design. RKC and AL provided guidance and supervision for carrying out the research tasks and interpretation of results and contributed to the preparation of the manuscript. BS, EF, NJS, FM, CD, and SH performed the experiments. BS performed the data analysis, developed the figures, and led the preparation of the manuscript. All authors were involved in the editing and proofreading of the manuscript.
The authors declare that they have no conflict of interest.
Publisher’s note: Copernicus Publications remains neutral with regard to jurisdictional claims in published maps and institutional affiliations.
The authors would like to acknowledge Tara Yacovitch, Rob Roscioli, Jordan Krechmer, and Tim Onasch of Aerodyne Research, Inc. and Art Sedlacek III of Brookhaven National Laboratory for their effort in processing and contributing AML data to the public FIREX-AQ repository.
This research has been supported by the National Aeronautics and Space Administration (grant nos. 80NSSC18K1414 and NNH20ZDA001N-ACCDAM), the National Science Foundation (grant nos. AGS-1455215 and AGS-1926817), and the US Department of Energy (grant no. DE-SC0021011).
This paper was edited by Roya Bahreini and reviewed by two anonymous referees.
Arnott, W. P., Moosmüller, H., Rogers, F. C., Jin, T., and Bruch, R.: Photoacoustic spectrometer for measuring light absorption by aerosol: instrument description, Atmos. Environ., 33, 2845–2852, https://doi.org/10.1016/s1352-2310(98)00361-6, 1999.
Arnott, W. P., Moosmüller, H., and Walker, J. W.: Nitrogen dioxide and kerosene-flame soot calibration of photoacoustic instruments for measurement of light absorption by aerosols, Rev. Sci. Instrum., 71, 4545, https://doi.org/10.1063/1.1322585, 2000.
Atkinson, R.: Kinetics and Mechanisms of the Gas-Phase Reactions of the NO3 Radical with Organic Compounds, J. Phys. Chem. Ref. Data, 20, 459–506, https://doi.org/10.1063/1.555887, 1991.
Canagaratna, M. R., Jayne, J. T., Jimenez, J. L., Allan, J. D., Alfarra, M. R., Zhang, Q., Onasch, T. B., Drewnick, F., Coe, H., Middlebrook, A., Delia, A., Williams, L. R., Trimborn, A. M., Northway, M. J., DeCarlo, P. F., Kolb, C. E., Davidovits, P., and Worsnop, D. R.: Chemical and microphysical characterization of ambient aerosols with the aerodyne aerosol mass spectrometer, Mass Spectrom. Rev., 26, 185–222, https://doi.org/10.1002/mas.20115, 2007.
Carter, W., Luo, D., Malkina, I., and Pierce, J.: Environmental Chamber Studies of Atmospheric Reactivities of Volatile Organic Compounds: Effects of Varying Chamber and Light Source, U.S. Department of Energy, https://doi.org/10.2172/57153, 1995.
Chakrabarty, R. K., Moosmüller, H., Chen, L.-W. A., Lewis, K., Arnott, W. P., Mazzoleni, C., Dubey, M. K., Wold, C. E., Hao, W. M., and Kreidenweis, S. M.: Brown carbon in tar balls from smoldering biomass combustion, Atmos. Chem. Phys., 10, 6363–6370, https://doi.org/10.5194/acp-10-6363-2010, 2010.
Cheng, Z., Atwi, K. M., Yu, Z., Avery, A., Fortner, E. C., Williams, L., Majluf, F., Krechmer, J. E., Lambe, A. T., and Saleh, R.: Evolution of the light-absorption properties of combustion brown carbon aerosols following reaction with nitrate radicals, Aerosol Sci. Tech., 54, 849–863, https://doi.org/10.1080/02786826.2020.1726867, 2020.
Cocker, D. R., Flagan, R. C., and Seinfeld, J. H.: State-of-the-Art Chamber Facility for Studying Atmospheric Aerosol Chemistry, Environ. Sci. Technol., 35, 2594–2601, https://doi.org/10.1021/es0019169, 2001.
Cubison, M. J., Ortega, A. M., Hayes, P. L., Farmer, D. K., Day, D., Lechner, M. J., Brune, W. H., Apel, E., Diskin, G. S., Fisher, J. A., Fuelberg, H. E., Hecobian, A., Knapp, D. J., Mikoviny, T., Riemer, D., Sachse, G. W., Sessions, W., Weber, R. J., Weinheimer, A. J., Wisthaler, A., and Jimenez, J. L.: Effects of aging on organic aerosol from open biomass burning smoke in aircraft and laboratory studies, Atmos. Chem. Phys., 11, 12049–12064, https://doi.org/10.5194/acp-11-12049-2011, 2011.
Finewax, Z., de Gouw, J. A., and Ziemann, P. J.: Identification and Quantification of 4-Nitrocatechol Formed from OH and NO3 Radical-Initiated Reactions of Catechol in Air in the Presence of NOX: Implications for Secondary Organic Aerosol Formation from biomass Burning, Environ. Sci. Technol., 52, 1981–1989, https://doi.org/10.1021/acs.est.7b05864, 2018.
Grieshop, A. P., Logue, J. M., Donahue, N. M., and Robinson, A. L.: Laboratory investigation of photochemical oxidation of organic aerosol from wood fires 1: measurement and simulation of organic aerosol evolution, Atmos. Chem. Phys., 9, 1263–1277, https://doi.org/10.5194/acp-9-1263-2009, 2009.
He, Q., Tomaz, S., Li, C., Zhu, M., Meidan, D., Riva, M., Laskin, A., Brown, S. S., George, C., Wang, X., and Rudich, Y.: Optical Properties of Secondary Organic Aerosol Produced by Nitrate Radical Oxidation of Biogenic Volatile Organic Compounds, Environ. Sci. Technol., 55, 2878–2889, https://doi.org/10.1021/acs.est.0c06838, 2021.
Hems, R. F., Schnitzler, E. G., Bastawrous, M., Soong, R., Simpson, A. J., and Abbatt, J. P. D.: Aqueous Photoreactions of Wood Smoke Brown Carbon, ACS Earth and Space Chemistry, 4, 1149–1160, https://doi.org/10.1021/acsearthspacechem.0c00117, 2020.
Jacobson, M. Z.: Isolating nitrated and aromatic aerosols and nitrated aromatic gases as sources of ultraviolet light absorption, J. Geophys. Res.-Atmos., 104, 3527–3542, https://doi.org/10.1029/1998jd100054, 1999.
Jayne, J. T., Leard, D. C., Zhang, X., Davidovits, P., Smith, K. A., Kolb, C. E., and Worsnop, D. R.: Development of an Aerosol Mass Spectrometer for Size and Composition Analysis of Submicron Particles, Aerosol Sci. Tech., 33, 49–70, https://doi.org/10.1080/027868200410840, 2000.
Jimenez, J. L., Canagaratna, M., Donahue, N., Prevot, A., Zhang, Q., Kroll, J. H., DeCarlo, P. F., Allan, J. D., Coe, H., and Ng, N.: Evolution of organic aerosols in the atmosphere, Science, 326, 1525–1529, 2009.
Krechmer, J., Lopez-Hilfiker, F., Koss, A., Hutterli, M., Stoermer, C., Deming, B., Kimmel, J., Warneke, C., Holzinger, R., Jayne, J., Worsnop, D., Fuhrer, K., Gonin, M., and de Gouw, J.: Evaluation of a New Reagent-Ion Source and Focusing Ion–Molecule Reactor for Use in Proton-Transfer-Reaction Mass Spectrometry, Anal. Chem., 90, 12011–12018, https://doi.org/10.1021/acs.analchem.8b02641, 2018.
Kroll, J. H., Donahue, N. M., Jimenez, J. L., Kessler, S. H., Canagaratna, M. R., Wilson, K. R., Altieri, K. E., Mazzoleni, L. R., Wozniak, A. S., and Bluhm, H.: Carbon oxidation state as a metric for describing the chemistry of atmospheric organic aerosol, Nat. Chem., 3, 133–139, https://doi.org/10.1038/nchem.948, 2011.
Lambe, A. T., Ahern, A. T., Williams, L. R., Slowik, J. G., Wong, J. P. S., Abbatt, J. P. D., Brune, W. H., Ng, N. L., Wright, J. P., Croasdale, D. R., Worsnop, D. R., Davidovits, P., and Onasch, T. B.: Characterization of aerosol photooxidation flow reactors: heterogeneous oxidation, secondary organic aerosol formation and cloud condensation nuclei activity measurements, Atmos. Meas. Tech., 4, 445–461, https://doi.org/10.5194/amt-4-445-2011, 2011.
Lambe, A. T., Cappa, C. D., Massoli, P., Onasch, T. B., Forestieri, S. D., Martin, A. T., Cummings, M. J., Croasdale, D. R., Brune, W. H., and Worsnop, D. R.: Relationship between oxidation level and optical properties of secondary organic aerosol, Environ. Sci. Technol., 47, 6349–6357, 2013.
Lambe, A. T., Wood, E. C., Krechmer, J. E., Majluf, F., Williams, L. R., Croteau, P. L., Cirtog, M., Féron, A., Petit, J.-E., Albinet, A., Jimenez, J. L., and Peng, Z.: Nitrate radical generation via continuous generation of dinitrogen pentoxide in a laminar flow reactor coupled to an oxidation flow reactor, Atmos. Meas. Tech., 13, 2397–2411, https://doi.org/10.5194/amt-13-2397-2020, 2020.
Laskin, A., Laskin, J., and Nizkorodov, S. A.: Chemistry of atmospheric brown carbon, Chem. Rev., 115, 4335–4382, 2015.
Lewis, K., Arnott, W. P., Moosmüller, H., and Wold, C. E.: Strong spectral variation of biomass smoke light absorption and single scattering albedo observed with a novel dual-wavelength photoacoustic instrument, J. Geophys. Res.-Atmos., 113, D16203, https://doi.org/10.1029/2007JD009699, 2008.
Li, C., He, Q., Hettiyadura, A. P. S., Käfer, U., Shmul, G., Meidan, D., Zimmermann, R., Brown, S. S., George, C., Laskin, A., and Rudich, Y.: Formation of Secondary Brown Carbon in Biomass Burning Aerosol Proxies through NO3 Radical Reactions, Environ. Sci. Technol., 54, 1395–1405, https://doi.org/10.1021/acs.est.9b05641, 2019.
Li, C., He, Q., Fang, Z., Brown, S. S., Laskin, A., Cohen, S. R., and Rudich, Y.: Laboratory Insights into the Diel Cycle of Optical and Chemical Transformations of Biomass Burning Brown Carbon Aerosols, Environ. Sci. Technol., 54, 11827–11837, https://doi.org/10.1021/acs.est.0c04310, 2020.
Li, Q., Jacob, D. J., Bey, I., Yantosca, R. M., Zhao, Y., Kondo, Y., and Notholt, J.: Atmospheric hydrogen cyanide (HCN): Biomass burning source, ocean sink?, Geophys. Res. Lett., 27, 357–360, https://doi.org/10.1029/1999gl010935, 2000.
Mao, J., Ren, X., Brune, W. H., Olson, J. R., Crawford, J. H., Fried, A., Huey, L. G., Cohen, R. C., Heikes, B., Singh, H. B., Blake, D. R., Sachse, G. W., Diskin, G. S., Hall, S. R., and Shetter, R. E.: Airborne measurement of OH reactivity during INTEX-B, Atmos. Chem. Phys., 9, 163–173, https://doi.org/10.5194/acp-9-163-2009, 2009.
McClure, C. D. and Jaffe, D. A.: US particulate matter air quality improves except in wildfire-prone areas, Proc. Natl. Acad. Sci. U. S. A., 115, 7901–7906, https://doi.org/10.1073/pnas.1804353115, 2018.
McManus, J. B., Zahniser, M. S., and Nelson, D. D.: Dual quantum cascade laser trace gas instrument with astigmatic Herriott cell at high pass number, Appl. Opt., 50, A74–A85, https://doi.org/10.1364/AO.50.000A74, 2011a.
McManus, J. B., Zahniser, M. S., Nelson, D. D., McGovern, R. M., Agnese, M., and Brown, W. F., Compact Quantum Cascade Laser Instrument for High Precision Trace Gas Measurements, in: Renewable Energy and the Environment, OSA Technical Digest (CD), Optical Society of America, paper EThC2, 2011b.
McMurry, P. H. and Grosjean, D.: Gas and aerosol wall losses in Teflon film smog chambers, Environ. Sci. Technol., 19, 1176–1182, https://doi.org/10.1021/es00142a006, 1985.
Mitroo, D., Sun, Y., Combest, D. P., Kumar, P., and Williams, B. J.: Assessing the degree of plug flow in oxidation flow reactors (OFRs): a study on a potential aerosol mass (PAM) reactor, Atmos. Meas. Tech., 11, 1741–1756, https://doi.org/10.5194/amt-11-1741-2018, 2018.
Moosmüller, H. and Arnott, W. P.: Angular truncation errors in integrating nephelometry, Rev. Sci. Instrum., 74, 3492–3501, https://doi.org/10.1063/1.1581355, 2003.
Murphy, D. M., Cziczo, D. J., Froyd, K. D., Hudson, P. K., Matthew, B. M., Middlebrook, A. M., Peltier, R. E., Sullivan, A., Thomson, D. S., and Weber, R. J.: Single-particle mass spectrometry of tropospheric aerosol particles, J. Geophys. Res.-Atmos., 111, D23S32, https://doi.org/10.1029/2006jd007340, 2006.
Onasch, T. B., Trimborn, A., Fortner, E. C., Jayne, J. T., Kok, G. L., Williams, L. R., Davidovits, P., and Worsnop, D. R.: Soot Particle Aerosol Mass Spectrometer: Development, Validation, and Initial Application, Aerosol Sci. Tech., 46, 804–817, https://doi.org/10.1080/02786826.2012.663948, 2012.
Ortega, A. M., Day, D. A., Cubison, M. J., Brune, W. H., Bon, D., de Gouw, J. A., and Jimenez, J. L.: Secondary organic aerosol formation and primary organic aerosol oxidation from biomass-burning smoke in a flow reactor during FLAME-3, Atmos. Chem. Phys., 13, 11551–11571, https://doi.org/10.5194/acp-13-11551-2013, 2013.
Palm, B. B., Campuzano-Jost, P., Day, D. A., Ortega, A. M., Fry, J. L., Brown, S. S., Zarzana, K. J., Dube, W., Wagner, N. L., Draper, D. C., Kaser, L., Jud, W., Karl, T., Hansel, A., Gutiérrez-Montes, C., and Jimenez, J. L.: Secondary organic aerosol formation from in situ OH, O3, and NO3 oxidation of ambient forest air in an oxidation flow reactor, Atmos. Chem. Phys., 17, 5331–5354, https://doi.org/10.5194/acp-17-5331-2017, 2017.
Pierce, J. R., Engelhart, G. J., Hildebrandt, L., Weitkamp, E. A., Pathak, R. K., Donahue, N. M., Robinson, A. L., Adams, P. J., and Pandis, S. N.: Constraining Particle Evolution from Wall Losses, Coagulation, and Condensation-Evaporation in Smog-Chamber Experiments: Optimal Estimation Based on Size Distribution Measurements, Aerosol Sci. Tech., 42, 1001–1015, https://doi.org/10.1080/02786820802389251, 2008.
Pósfai, M., Gelencsér, A., Simonics, R., Arató, K., Li, J., Hobbs, P. V., and Buseck, P. R.: Atmospheric tar balls: Particles from biomass and biofuel burning, J. Geophys. Res.-Atmos., 109, D06213, https://doi.org/10.1029/2003JD004169, 2004.
Riccardi, C. L., Ottmar, R. D., Sandberg, D. V., Andreu, A., Elman, E., Kopper, K, and Long, J.: The fuelbed: a key element of the Fuel Characteristic Classification System, Can. J. Forest Res., 37, 2394–2412, https://doi.org/10.1139/X07-143, 2007.
Rowe, J. P., Lambe, A. T., and Brune, W. H.: Technical Note: Effect of varying the λ = 185 and 254 nm photon flux ratio on radical generation in oxidation flow reactors, Atmos. Chem. Phys., 20, 13417–13424, https://doi.org/10.5194/acp-20-13417-2020, 2020.
Sedlacek, A. J., Onasch, T. B., Nichman, L., Lewis, E. R., Davidovits, P, Freedman, A., and Williams, L.: Formation of refractory black carbon by SP2-induced charring of organic aerosol, Aerosol Sci. Tech, 52, 1345–1350, https://doi.org/10.1080/02786826.2018.1531107, 2018.
Stein, A. F., Draxler, R. R., Rolph, G. D., Stunder, B. J. B., Cohen, M. D., and Ngan, F.: NOAA's HYSPLIT Atmospheric Transport and Dispersion Modeling System, B. Am. Meteorol. Soc., 96, 2059–2077, https://doi.org/10.1175/bams-d-14-00110.1, 2016.
Stephens, M., Turner, N., and Sandberg, J.: Particle identification by laser-induced incandescence in a solid-state laser cavity, Appl. Opt., 42, 3726–3736, https://doi.org/10.1364/AO.42.003726, 2003.
Sumlin, B.: OH and NO3 Oxidation Data from FIREX-AQ Ground Experiments, V1, Mendeley Data [data set], https://doi.org/10.17632/5mr43vbks3.1, 2021.
Sumlin, B. J., Pandey, A., Walker, M. J., Pattison, R. S., Williams, B. J., and Chakrabarty, R. K.: Atmospheric photooxidation diminishes light absorption by primary brown carbon aerosol from biomass burning, Environ. Sci. Tech. Let., 4, 540–545, 2017a.
Sumlin, B. J., Pandey, A., Walker, M. J., Pattison, R. S., Williams, B. J., and Chakrabarty, R. K.: Atmospheric Photooxidation Diminishes Light Absorption by Primary Brown Carbon Aerosol from Biomass Burning, Environ. Sci. Technol. Lett., 4, 540–545, https://doi.org/10.1021/acs.estlett.7b00393, 2017b.
Sumlin, B. J., Heinson, Y. W., Shetty, N., Pandey, A., Pattison, R. S., Baker, S., Hao, W. M., and Chakrabarty, R. K.: UV–Vis–IR spectral complex refractive indices and optical properties of brown carbon aerosol from biomass burning, Journal of Quantitative Spectroscopy and Radiative Transfer, 206, 392–398, 2018a.
Sumlin, B. J., Oxford, C. R., Seo, B., Pattison, R. R., Williams, B. J., and Chakrabarty, R. K.: Density and Homogeneous Internal Composition of Primary Brown Carbon Aerosol, Environ. Sci. Technol., 52, 3982–3989, https://doi.org/10.1021/acs.est.8b00093, 2018b.
Varma, R., Moosmüller, H., and Arnott, W. P.: Toward an ideal integrating nephelometer, Opt. Lett., 28, 1007, https://doi.org/10.1364/ol.28.001007, 2003.
Wang, N., Jorga, S. D., Pierce, J. R., Donahue, N. M., and Pandis, S. N.: Particle wall-loss correction methods in smog chamber experiments, Atmos. Meas. Tech., 11, 6577–6588, https://doi.org/10.5194/amt-11-6577-2018, 2018.
Warneke, C. S. J., Ryerson, T., Crawford, J., Dibb, J., Lefer, B., Roberts, J., Trainer, M., Murphy, D., Brown, S., Brewer, A., Gao, R.-S., and Fahey, D.: Fire Influence on Regional to Global Environments and Air Quality (FIREX-AQ), in preparation, 2021.
Xie, M., Chen, X., Hays, M. D., and Holder, A. L.: Composition and light absorption of N-containing aromatic compounds in organic aerosols from laboratory biomass burning, Atmos. Chem. Phys., 19, 2899–2915, https://doi.org/10.5194/acp-19-2899-2019, 2019.
Zhang, Q., Jimenez, J. L., Canagaratna, M., Allan, J., Coe, H., Ulbrich, I., Alfarra, M., Takami, A., Middlebrook, A., and Sun, Y.: Ubiquity and dominance of oxygenated species in organic aerosols in anthropogenically-influenced Northern Hemisphere midlatitudes, Geophys. Res. Lett., 34, L13801, https://doi.org/10.1029/2007GL029979, 2007.
Zhang, X., Cappa, C. D., Jathar, S. H., McVay, R. C., Ensberg, J. J., Kleeman, M. J., and Seinfeld, J. H.: Influence of vapor wall loss in laboratory chambers on yields of secondary organic aerosol, Proc. Natl. Acad. Sci. U. S. A., 111, 5802–5807, https://doi.org/10.1073/pnas.1404727111, 2014.