the Creative Commons Attribution 4.0 License.
the Creative Commons Attribution 4.0 License.
 | 09 Aug 2021
Measurement report: Source characteristics of water-soluble organic carbon in PM2.5 at two sites in Japan, as assessed by long-term observation and stable carbon isotope ratio
Hiroto Kawashima
The sources and seasonal trends of water-soluble organic carbon (WSOC) in carbonaceous aerosols are of significant interest. From July 2017 to July 2019, we collected samples of PM2.5 (particulate matter, aerodynamic diameter<2.5 µm) from one suburban and one rural site in Japan. The average δ13CWSOC was ‰ and ‰ at the suburban site and rural site, respectively. At the suburban site, the δ13CWSOC was consistent with the δ13C of burned C3 plants, and a high correlation was found between WSOC concentrations and non-sea-salt potassium concentrations; these results suggest that the main source of WSOC at this site was biomass burning of rice straw. At the rural site, the average δ13CWSOC was significantly heavier from autumn to spring ( ‰) than in summer ( ‰) (p<0.01). The δ13CWSOC from autumn to spring was consistent with that of biomass burning of rice straw, whereas that in summer was considered to reflect mainly the formation of secondary organic aerosols from biogenic volatile organic compounds (VOCs). The heaviest δ13CWSOC ( ‰) was observed from February to April 2019, which may be explained by long-range transport of C4 plant burning such as corn from overseas. Thus, the present study indicates that δ13CWSOC is potentially useful for elucidating the sources and atmospheric processes that contribute to seasonal variations of WSOC concentration.
- Article
(1131 KB) - Full-text XML
-
Supplement
(3199 KB) - BibTeX
- EndNote


Particulate matter (PM) has deleterious effects on human health and contributes to climate change (Pope et al., 1995; Lohmann and Feichter, 2005). A major component of PM2.5 (particulate matter, aerodynamic diameter<2.5 µm) is carbonaceous aerosol, which comprises organic carbon (OC) and elemental carbon (EC) (Chow et al., 1993; Malm et al., 2004; Pöschl, 2005). The OC in carbonaceous aerosol can be further classified as water-insoluble organic carbon (WIOC) and water-soluble organic carbon (WSOC) (Sullivan and Weber, 2006). WIOC is produced mainly by the combustion of fossil fuels and contains compounds such as alkanes (Pöschl, 2005). WSOC is emitted primarily from combustion processes, industrial process, and natural sources; it can also be formed through secondary processes such as homogeneous gas-phase or heterogeneous aerosol-phase oxidation (Claeys et al., 2004; Koch et al., 2007; Schichtel et al., 2008). WSOC accounts for 20 %–80 % of the total OC in carbonaceous aerosol depending on the location and season (Decesari et al., 2001; Sullivan et al., 2004; Du et al., 2014; Duarte et al., 2015; Zhang et al., 2019). In addition, an average of 74 % of all WSOC is contained in fine particles (Yu et al., 2004). WSOC is hygroscopic; therefore, it enhances the capability of aerosols to act as cloud condensation nuclei, which affects climate change (Padró et al., 2010; Asa-Awuku et al., 2011). Therefore, source contributions of WSOC have been of significant interest for decades. A common approach for estimating the source contributions of WSOC is the use of a positive matrix factorization model. Using this approach, the annual contributions of biomass burning and secondary processes to WSOC in Beijing, China, were estimated to be 40 % and 54 %, respectively (Du et al., 2014). Similarly, in Helsinki, Finland, the contribution of secondary organic aerosols (SOAs) to WSOC is reported to be high in summer (78 %) but low in winter (28 %) (Saarikoski et al., 2008). WSOC is known to contain various oxygenated compounds, including dicarboxylic acids, ketocarboxylic acids, aliphatic aldehydes, alcohols, saccharides, saccharide anhydrides, aromatic acids, phenols, amines, amino acids, organic nitrates, and organic sulfates (Duarte et al., 2007, 2015; Pietrogrande et al., 2013; Timonen et al., 2013; Chalbot et al., 2014). However, the precise molecular composition of WSOC is poorly understood because of the large number of compounds involved and the difficulties involved in identifying the individual components.
The stable carbon isotope ratio (δ13C) of carbonaceous aerosols can provide useful information about a sample of PM (e.g., Widory et al., 2004; Fisseha et al., 2009; Cao et al., 2011; Gensch et al., 2014). For example, because EC is unreactive, it is possible to identify its source directly from the δ13C of its aerosols (e.g., Kawashima and Haneishi, 2012; Zhao et al., 2018). In contrast, because OC reacts in the atmosphere, its δ13C provides information not only about the source of the PM but also about any atmospheric processing it has undergone (e.g., Cao et al., 2011; Ni et al., 2018). In recent years, some groups have examined the δ13C of WSOC (δ13CWSOC) in PM (Kirillova et al., 2010, 2013; Suto and Kawashima, 2018; Zhang et al., 2019). In addition, various approaches have been used; for example, the δ13CWSOC of ambient aerosols has been examined by means of wet oxidation with GasBench and isotope-ratio mass spectrometry (IRMS) (Fisseha et al., 2006) and by means of combustion with an elemental analyzer and IRMS (EA–IRMS) (Kirillova et al., 2010). Recent advances have afforded highly sensitive analytical methods for determining δ13CWSOC values that use wet oxidation with liquid chromatography and IRMS (LC–IRMS) (Suto and Kawashima, 2018), GasBench and IRMS (Zhang et al., 2019), or total organic carbon analyzer and IRMS (Han et al., 2020); however, combustion-based approaches remain the most widely used.
The δ13CWSOC of particles of various sizes collected at various times of the year in East Asia (Miyazaki et al., 2012; Kirillova et al., 2014a; Pavuluri and Kawamura, 2017; Yan et al., 2017; Suto and Kawashima, 2018; Zhang et al., 2019; Han et al., 2020), South Asia (Kirillova et al., 2013, 2014b; Bosch et al., 2014, Dasari et al., 2019), Europe (Fisseha et al., 2006, 2009; Kirillova et al., 2010), and the United States (Wozniak et al., 2012a, b) have been reported (Table S1 in the Supplement). For example, the δ13C of total carbon (δ13CTC) and δ13CWSOC of total suspended particles (TSPs) was observed from September 2009 to October 2010 in Hokkaido, Japan (Pavuluri and Kawamura, 2017). Both δ13CTC and δ13CWSOC were heavier in winter than in summer, demonstrating seasonal variation. The authors concluded that the reason why δ13CWSOC was heavy in winter was because of the greater release of 13C by fossil fuel combustion and biomass burning. Similarly, Kirillova et al. (2013) collected TSP samples from January 2008 to April 2009 in Sinhagad, India, and Hanimaadhoo Island, Maldives. The average δ13CWSOC was ‰ in Sinhagad and ‰ in Hanimaadhoo Island, which are heavier than values reported in other studies. In addition, aerosols reaching Hanimaadhoo Island after long-range over-ocean transport were enriched by 3 ‰–4 ‰ in δ13CWSOC relative to the aerosols collected in Sinhagad. Based on these findings, Kirillova et al. (2013) reported for the first time that this enrichment of δ13C was an effect related to the aging of OC during long-range transport of aerosol. A recent study reported that the enrichment of δ13CWSOC between source site (Delhi, India) and receptor site (Hanimaadhoo Island, Maldives) is caused by an aging effect during long-range transport (Dasari et al., 2019).
The combustion method, which is widely used at present, requires more pretreatment time, because samples of PM are extracted, dehydrated with a freeze drier, dried, and then measured by EA–IRMS. The wet-oxidation–IRMS method described above does not require a drying stage during sample preparation; therefore, the total analysis time is markedly reduced compared with the combustion method. In addition, this newer approach is highly sensitive, so only small amounts of sample are needed compared to the combustion method. However, despite these improved approaches and the significant interest in the seasonal trends and source apportionment of WSOC, no studies have examined the change of δ13CWSOC in PM2.5 over a long period of time to understand seasonal variability. As mentioned above, the small particle size PM2.5 contains large amount of WSOC, so further investigations are needed. Here, we investigated the seasonal trends of WSOC at one suburban site and one rural site in Japan. Samples of PM2.5 were collected from July 2017 to July 2019 at both sites, and δ13CTC and δ13CWSOC values, as well as carbon component and water-soluble ion concentrations, were determined. We then characterized the source of WSOC and any atmospheric processes it had undergone using isotope-based approaches. We believe that this is the first report of the use of the wet-oxidation–IRMS method (Suto and Kawashima, 2018) for long-term observation of δ13CWSOC.
2.1 Sampling sites and sample collection
Samples of PM2.5 were collected at one suburban site and one rural site in Japan (Fig. S1 in the Supplement). The suburban site (Tsukuba; N, E) was on the rooftop of a 25 m high building at the Japan Automobile Research Institute in Tsukuba City, Ibaraki Prefecture, Japan. Tsukuba is a suburban city located in the inland Kanto plain approximately 60 km northeast of the Tokyo metropolitan area. This site is surrounded by residential areas and forests, and there is a road in front of the building. PM2.5 samples were collected approximately every 10 d from 19 July 2017 to 12 July 2019. The rural site (Yurihonjo; N, E) was on the campus of Akita Prefectural University in Yurihonjo City, Akita Prefecture, Japan. Yurihonjo is located 370 km northwest of Tsukuba and about 5 km away from the coast. The sampling site had no local pollutant sources such as large factories. Every year from December to February, the site is covered with several centimeters of snow (Japan Meteorological Agency, 2020). PM2.5 samples were collected approximately every 14 d from 11 August 2017 to 5 July 2019.
At both sites, the PM2.5 samples were collected by using high-volume samplers (HV-1000F, Sibata Scientific Technology, Saitama, Japan) equipped with a PM2.5 impactor (HV-1000-PM2.5, Sibata Scientific Technology) at a flow rate of approximately 1000 L min−1. The samples were collected on quartz fiber filters (20.3 cm×25.4 cm, 2500QAT-UP, Pallflex, Putnam, USA) that had been prebaked at 550 ∘C for 4 h before use. After sampling, the filters were kept in a freezer at −30 ∘C. A total of 107 PM2.5 samples (62 samples from Tsukuba and 45 samples from Yurihonjo) were collected. PM2.5 mass concentration was analyzed gravimetrically by using an electronic balance before and after sampling.
2.2 Stable carbon isotope ratio analysis
Determination of δ13CTC was performed at the Japan Automobile Research Institute using EA–IRMS (EA IsoLink, Thermo Fisher Scientific, Bremen, Germany; Delta V Advantage, Thermo Fisher Scientific, respectively). Portions of quartz filter (5–10 mg) were packed into a tin cup. The samples were combusted instantaneously with oxygen in the EA, and the carbon was converted to CO2 via an oxidation/reduction tube of the EA. The oxidation/reduction tube and the packed column were maintained at 1020 and 60 ∘C, respectively. The flow rate of ultra-high-purity helium during the analysis was 180 mL min−1. The CO2 from the EA was ionized, and the δ13C value was determined by means of IRMS; data acquisition was performed with Isodat software (ver. 3.0, Thermo Fisher Scientific).
Determination of δ13CWSOC was performed at Akita Prefectural University using the wet-oxidation–IRMS method (Kawashima et al., 2018; Suto and Kawashima, 2018). A portion of each quartz fiber filter (14.13 cm2) was extracted in 5 mL of Milli-Q water under ultrasonic agitation for 30 min. The extract was filtered through a syringe filter (Chromatodisc type A 0.45 µm, GL Sciences, Japan) to remove insoluble material. The PM2.5 samples were not decarbonated before δ13CWSOC analysis, because the difference between the δ13CWSOC with and without hydrochloric acid pretreatment was within 0.2 ‰. A high-performance liquid chromatography (HPLC) system (Shimadzu Co.) was coupled to the IRMS instrument (Isoprime, Elementar UK, Manchester, UK) via a LiquiFace interface (Elementar UK). The HPLC system consisted of a column pump (LC-10ADvp), oxidation pump (LC-10ADvp), post-column pump (LC-10ADvp), autosampler (SIL-10ADvp), degasser (DGU-14A), and UV detector (SPD-10ADvp). The injection volume was 100 µL. The HPLC flow rate (without column), the sodium peroxodisulfate flow rate, and the post-column flow rate were 0.5, 0.4, and 0.3 mL min−1, respectively. Sodium peroxodisulfate (0.5 M) and phosphoric acid (0.2 M) were mixed and then degassed in an ultrasonic bath for 1 h. One run took about 6 min. The trap current was set at 300 µA. The limits of detection (precision, ‰; accuracy, ‰) for levoglucosan and oxalic acid were 1111 and 1133 ng C, respectively.
The IRMS instrument and the data acquisition system were controlled by IonVantage NT software (ver. 1.5.4.0., Isoprime). The HPLC system was controlled by LCsolution software (ver. 1.25, Shimadzu Co.).
Stable carbon isotope ratios are expressed in δ notation in per mil (‰):
where and (=0.0111802) are the ratios for the sample and the standard (Vienna Pee Dee Belemnite), respectively. For all samples, the EA–IRMS and wet-oxidation–IRMS data were measured in triplicate.
A two-point linear calibration was carried out for δ13C (Coplen et al., 2006). For EA–IRMS, δ13CTC values and three internal laboratory standards were calculated by using the following international isotopic standards: IAEA-CH-3 (cellulose, ‰), IAEA-600 (caffeine, ‰), and USGS24 (graphite, ‰). These standards were obtained from the International Atomic Energy Agency (Vienna, Austria). As a check of instrumental stability, an isotope working standard (l-alanine, SI Science Co., Tokyo, Japan; ‰) was analyzed after every nine samples. For wet-oxidation–IRMS, δ13C values were calculated by means of a two-point linear calibration method from international isotope standards of sucrose (IAEA-CH-6, ‰) and three internal laboratory standards for D-(+)-arabitol ( ‰), levoglucosan ( ‰), and oxalic acid ( ‰) obtained from EA–IRMS. Ultrapure water was prepared with a Milli-Q system (18.2 MΩ cm; Millipore, Bedford, MA, USA). To check instrumental stability, the laboratory standard of levoglucosan was analyzed after every nine samples. The average 1SD for δ13CTC and δ13CWSOC was 0.12 ‰ (<0.46 ‰) and 0.09 ‰ (<0.50 ‰), respectively, for all samples examined in the present study.
2.3 Chemical analysis
For determination of OC and EC concentrations, a portion of each quartz fiber filter (0.53 cm2) was examined using a thermal-optical carbon analyzer (model 2001, Desert Research Institute), and the samples were processed according to the IMPROVE (Interagency Monitoring of Protected Visual Environments) thermal desorption and optical reflectance method with a 550 ∘C temperature, split for OC and EC (Chow et al., 2001). The limits of detection for OC and EC were determined as 3 times the standard deviation of a blank filter, and they were 0.02 and 0.02 µg m−3, respectively. These limits of detection were sufficiently low (Yamagami et al., 2019). For determination of WSOC concentrations, a portion of each quartz fiber filter (1.58 cm2) was extracted with 8 mL of ultrapure water for 30 min at room temperature. The water extracts were passed through a polyvinylidene difluoride filter (pore size 0.20 µm, GE Healthcare, USA) to remove insoluble materials, and then the filtrate was analyzed using a total organic carbon analyzer (TOC-L, Shimadzu, Kyoto, Japan). The limit of detection was determined as 3 times the standard deviation of a blank filter, and it was 0.03 µg m−3, which was sufficiently low (Du et al., 2014). Quantification of the major water-soluble anions (Cl−, , , ) and cations (Na+, , K+, Mg2+, Ca2+) was achieved by ion chromatography (Integrion RFIC; Thermo Fisher Scientific Inc., Sunnyvale, CA, USA). Details of the water-soluble ion analysis method are described in Supplement Sect. S1.
3.1 Mass concentrations of PM2.5 at the study sites
The average mass concentrations of PM2.5 during the observation period were 19.7±8.2 µg m−3 (range, 7.1–46.6 µg m−3) in Tsukuba and 11.2±4.7 µg m−3 (5.7–23.4 µg m−3) in Yurihonjo (Table 1). The average mass concentration of PM2.5 in Tsukuba was higher than the air quality standard for the annual average of Japan (15 µg m−3) by the Ministry of the Environment and those at other residential sites across Japan (annual average in 2018: 11.2 µg m−3) (Ministry of the Environment, 2019). In Yurihonjo, the average mass concentration of PM2.5 was lower than the air quality standard for the annual average of Japan, and it was comparable with those at other residential sites across Japan.
Table 1Seasonal average concentrations of PM2.5, EC, OC, and WSOC; and ratios; and δ13CTC and δ13CWSOC values for PM2.5, in Tsukuba and Yurihonjo, Japan.
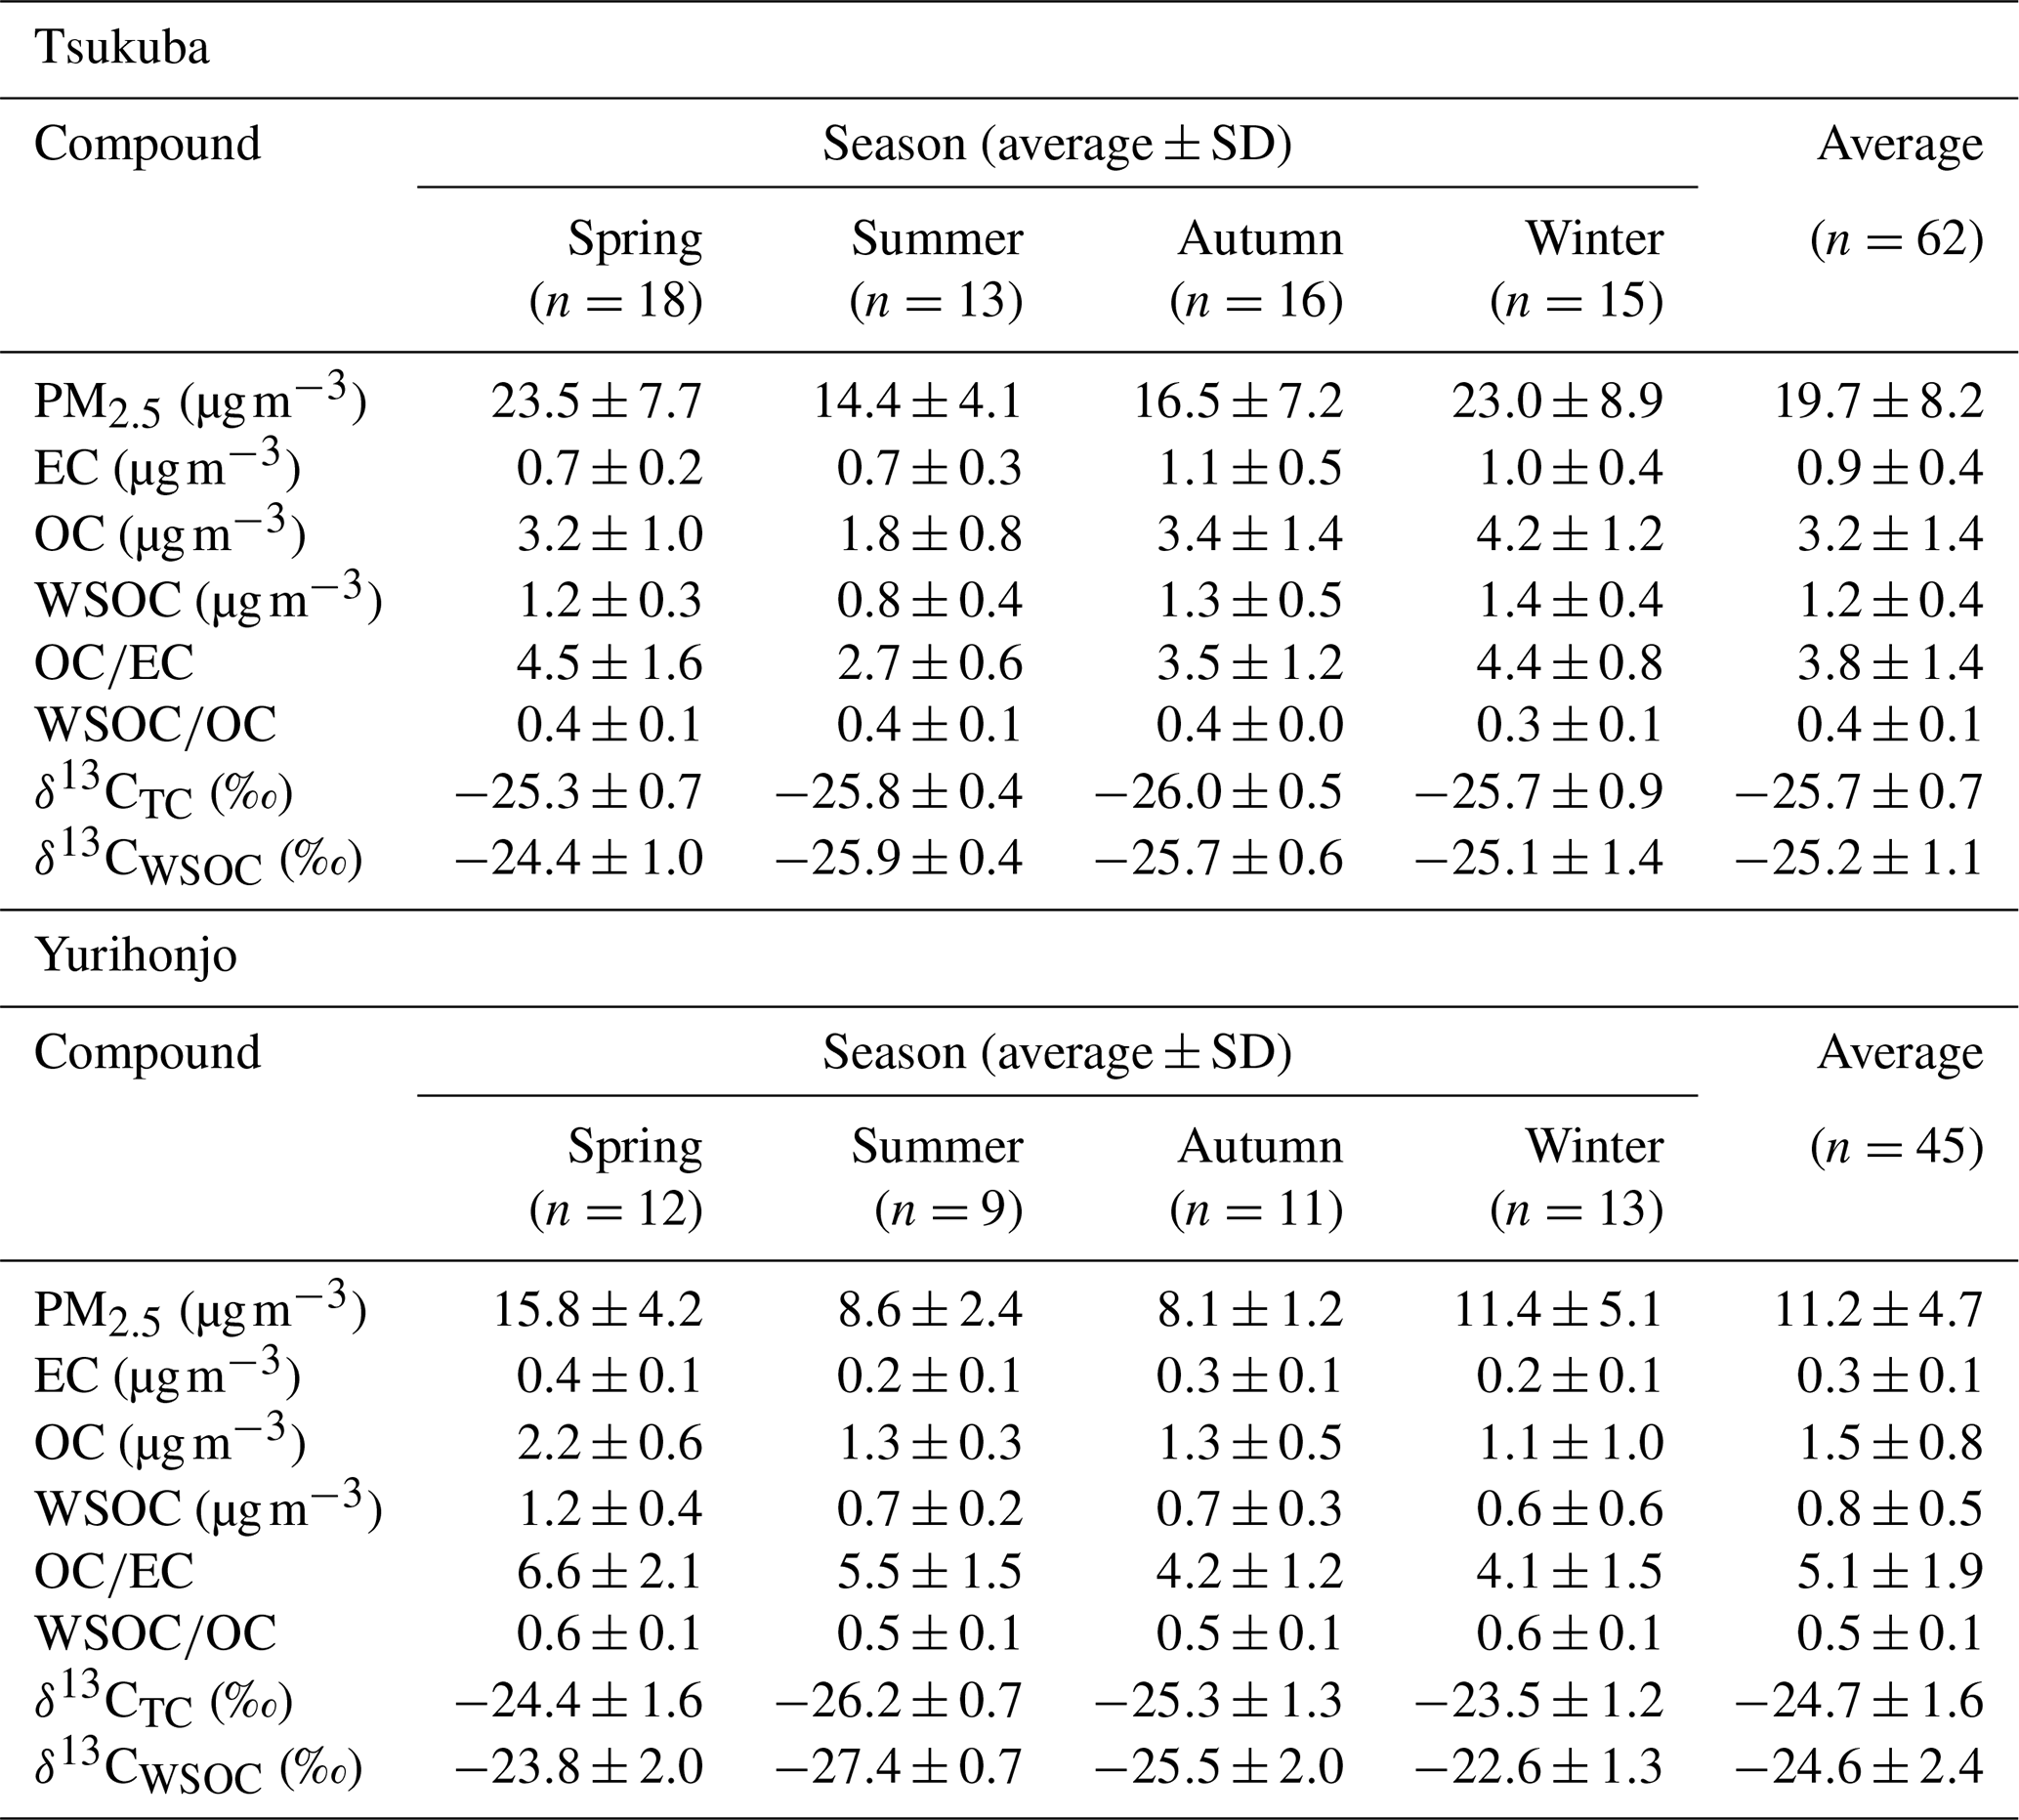
A previous study reviewed the annual PM2.5 concentrations in 45 global megacities in 2013 (Cheng et al., 2016). The five most-polluted megacities were Delhi, India; Cairo, Egypt; and Xi'an, Tianjin, and Chengdu, China (PM2.5 annual average concentration, 89–143 µg m−3). The five least-polluted megacities were Toronto, Canada; Miami, Philadelphia, and New York, United States; and Madrid, Spain (PM2.5 annual average concentration, 7–10 µg m−3). The mass concentration of PM2.5 at both sites in the present study was much closer to that determined for the least-polluted megacities than that determined for the most-polluted megacities. The mass concentrations of PM2.5 in Tsukuba and Yurihonjo were significantly higher in winter and spring than in summer and autumn (p<0.01). The mass concentrations of PM2.5 were consistent with the seasonal variation for nearby sites of the Atmospheric Environmental Regional Observation System (AEROS) provided by the Ministry of the Environment (Ministry of the Environment, 2021).
3.2 Concentrations of EC, OC, and WSOC, as well as OC EC and WSOC OC ratios
The concentrations of EC, OC, and WSOC, as well as the and ratios, at the study sites are summarized in Table 1. The concentrations of the carbon components (EC, WIOC, and WSOC) by season are shown in Fig. 1. The sum of EC and organic matter (1.6×OC concentration) (Turpin and Lim, 2001) accounted for an average of 32 % of the PM2.5 mass concentration in Tsukuba and 25 % in Yurihonjo. Thus, the contribution was slightly higher at Tsukuba than at Yurihonjo. The average EC concentration during the observation period was 0.9±0.40 µg m−3 (0.4–2.40 µg m−3) in Tsukuba and 0.3±0.10 µg m−3 (0.2–0.60 µg m−3) in Yurihonjo. These values are comparable to those reported for Nagoya (1.10 µg m−3) (Yamagami et al., 2019) and Niigata (0.50 µg m−3) (Li et al., 2018), Japan, and lower than that reported for Xi'an, China (7.60 µg m−3) (Zhao et al., 2018). The EC concentration contributed an average of 5 % to the PM2.5 mass concentration in Tsukuba and 3 % in Yurihonjo. Currently, EC concentrations in Japan are decreasing as a result of Japanese government regulations on emissions from diesel vehicles (Yamagami et al., 2019). The average OC concentration during the observation period was 3.2±1.4 µg m−3 (1.0–6.60 µg m−3) in Tsukuba and 1.5±0.80 µg m−3 (0.6–4.20 µg m−3) in Yurihonjo. The OC concentration contributed an average of 28 % to the PM2.5 mass concentration in Tsukuba and 22 % in Yurihonjo. The higher percentage contribution to the PM2.5 mass concentration from OC than EC was in agreement when compared to other studies (contribution of OC and EC concentration in PM2.5 concentration: 20 % and 6 % in Korea) (Park and Cho, 2011).
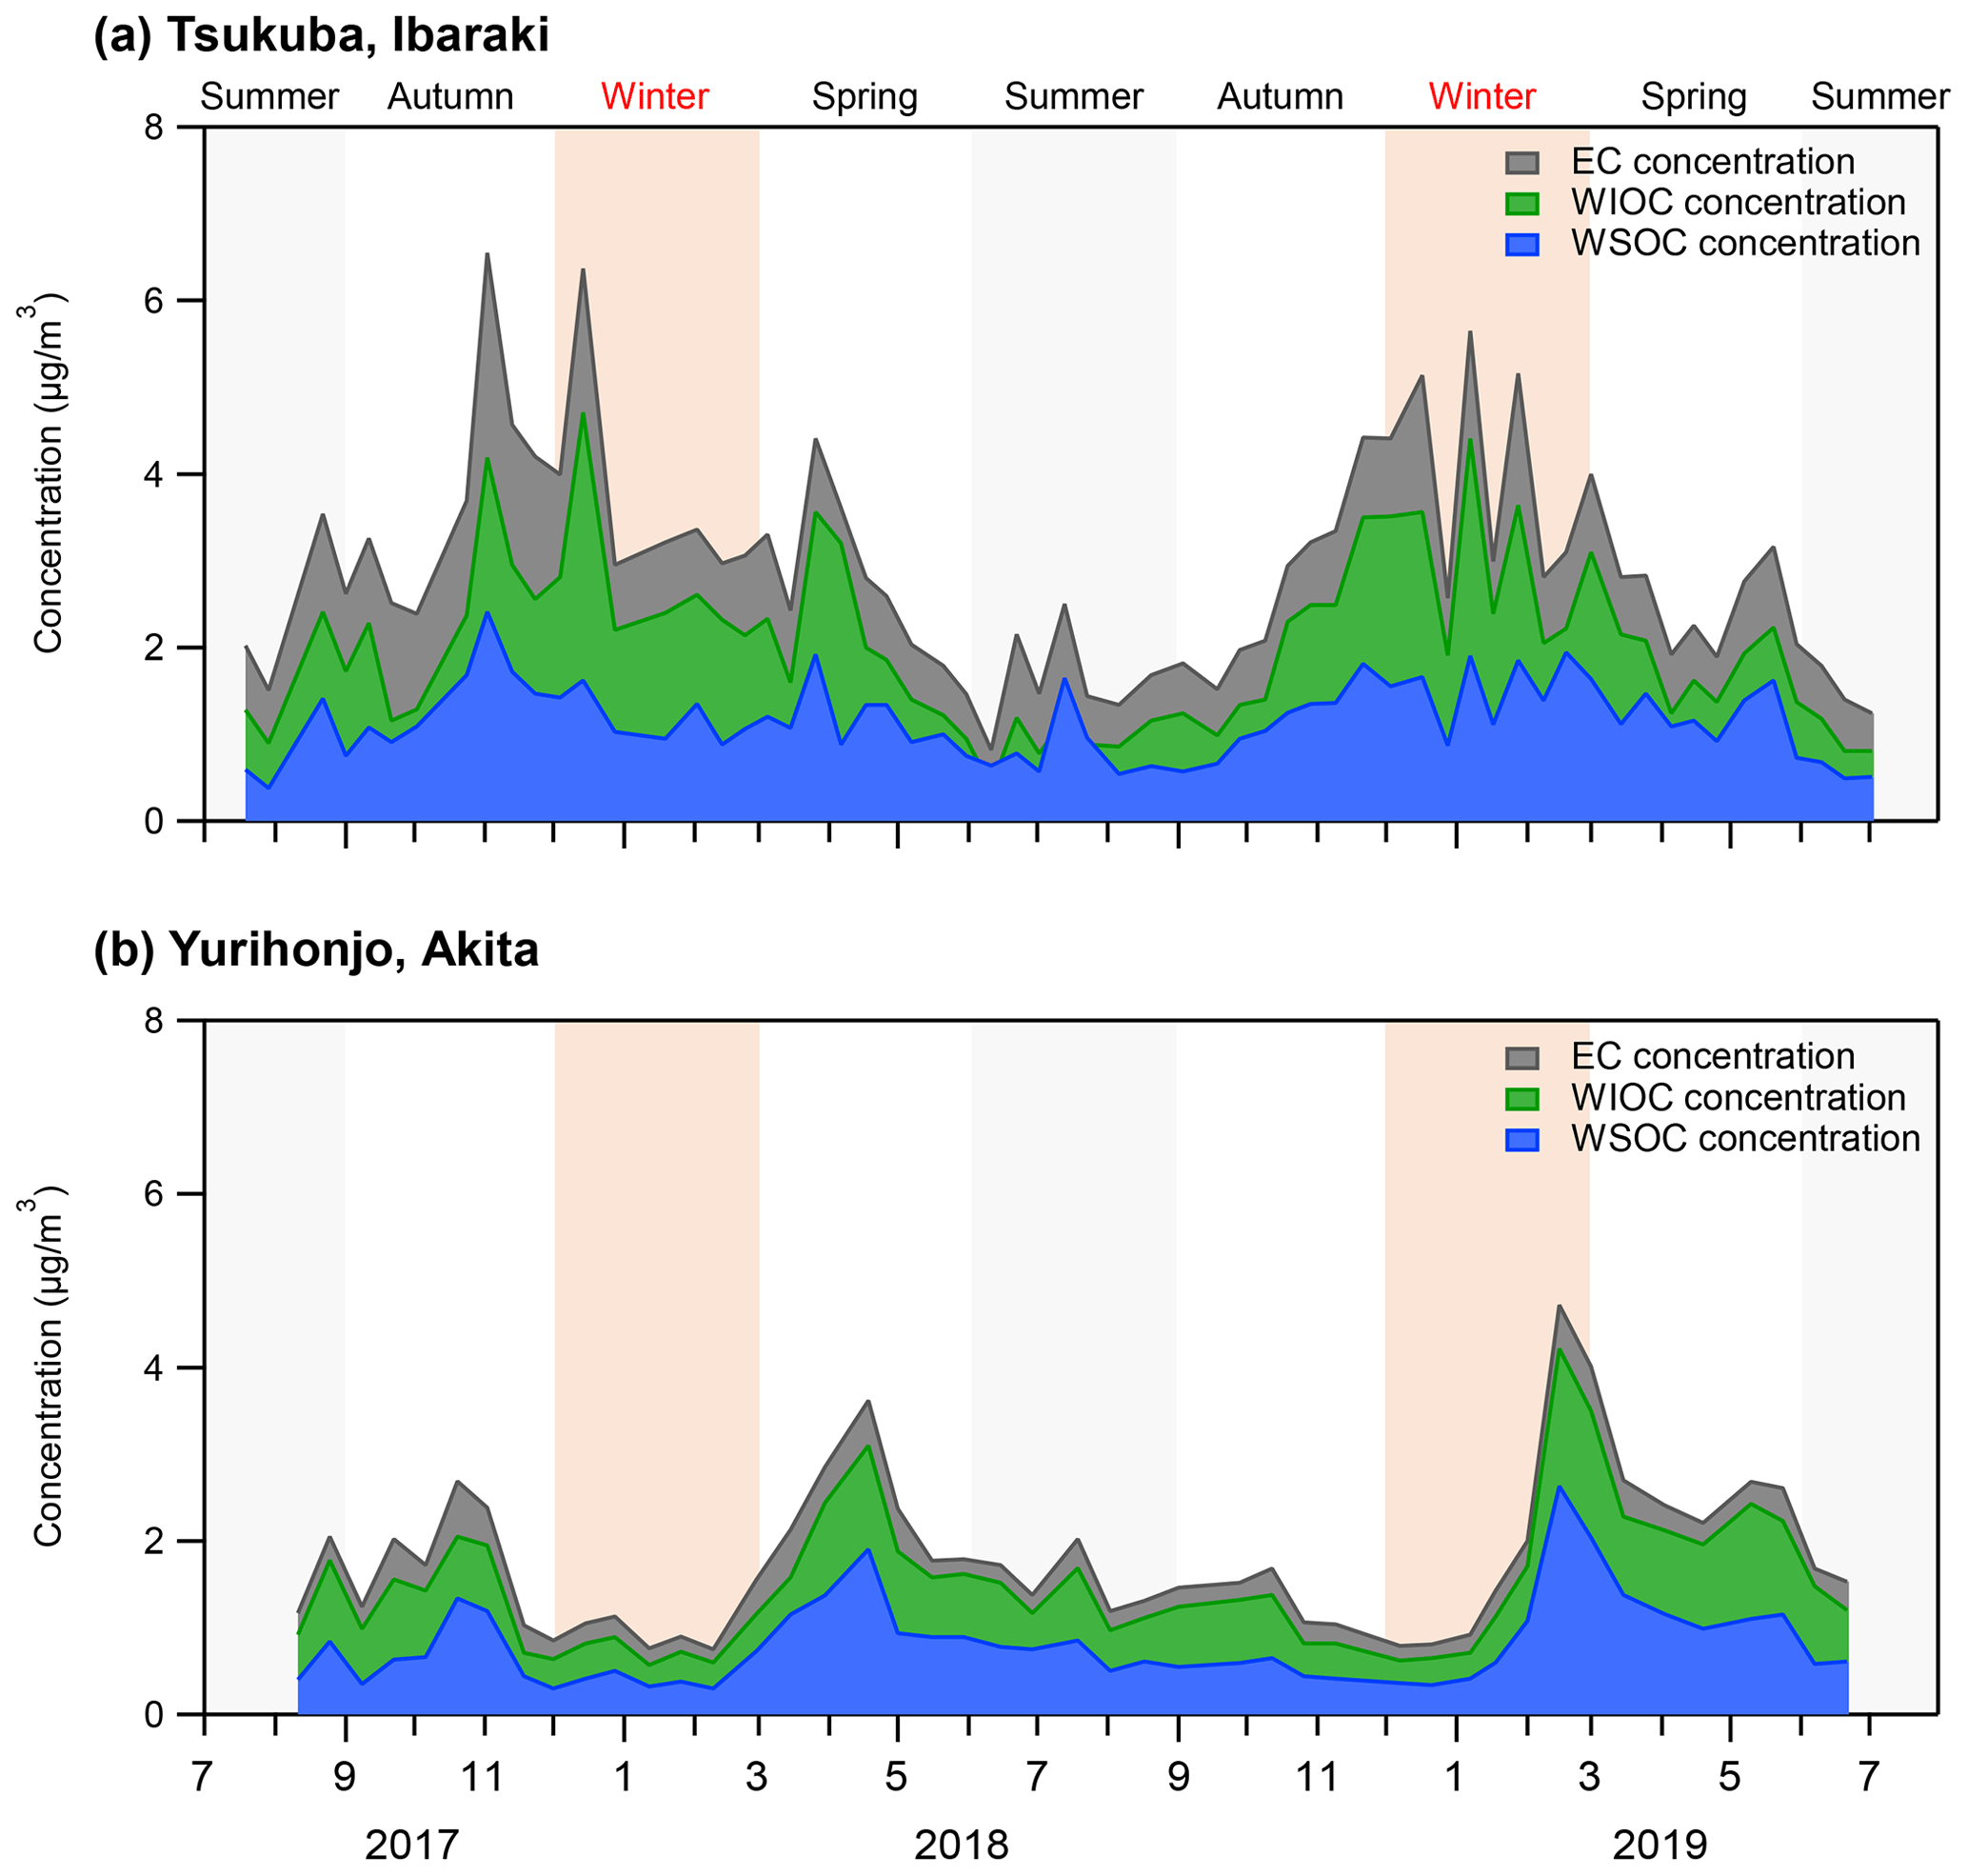
Figure 1Concentrations of EC, WIOC, and WSOC of PM2.5 from July 2017 to July 2019 in (a) Tsukuba, Ibaraki, and (b) Yurihonjo, Akita, Japan.
The ratio is an indicator of the source of carbonaceous particles (Chow et al., 1996). The average ratio was 3.8±1.4 in Tsukuba and 5.1±1.9 in Yurihonjo. The higher ratio at the rural site (Yurihonjo) than at the suburban site (Tsukuba) was comparable with the results of other studies (Ho et al., 2006; Zhang et al., 2008). This was likely because primary emissions, such as EC, are low at rural sites, meaning that the OC is larger in comparison. The high ratio is due to the formation of secondary organic aerosols and biomass burning (Chow et al., 1996).
The average WSOC concentration during the observation period was 1.2±0.40 µg m−3 (0.4–2.40 µg m−3) in Tsukuba and 0.8±0.50 µg m−3 (0.3–2.60 µg m−3) in Yurihonjo. These values were similar to those reported for Sapporo (1.00 µg m−3) (Pavuluri and Kawamura, 2017) and Maebashi (2.30 µg m−3) (Kumagai et al., 2009), Japan, but lower than those reported for Beijing, China (7.20 µg m−3) (Du et al., 2014), and Gwangju, South Korea (3.70 µg m−3) (Park and Cho, 2011). The WSOC concentration at Tsukuba was significantly higher in autumn and winter than in spring and summer (p<0.01), whereas that in Yurihonjo was significantly higher in spring than in the other seasons (p<0.05). The average ratio was 0.4±0.1 in Tsukuba and 0.5±0.1 in Yurihonjo. This is consistent with previous studies that showed that the average ratio was higher at rural sites than at urban sites (Kumagai et al., 2009; Ram and Sarin, 2010). This is also the same as the trend we found for ratio in the present study.
3.3 δ13CTC and δ13CWSOC
To our knowledge, this is the first report of a 2-year-long observation of δ13CTC and δ13CWSOC in PM2.5 at two sites simultaneously. The δ13CWSOC values reported from previous studies conducted at various sampling sites and examining various particle sizes are summarized in Table S1. In the present study, the average δ13CTC was ‰ (−26.9 ‰ to −24.0 ‰) in Tsukuba and ‰ (−27.3 ‰ to −20.4 ‰) in Yurihonjo (Table 1 and Fig. 2). Previous studies have reported the average δ13CTC of TSP in Sapporo, Japan () (Pavuluri and Kawamura, 2017), and of PM2.5 in Sanjiang Plain, China (−24.2 ‰) (Cao et al., 2016), and these values are comparable to our present values.
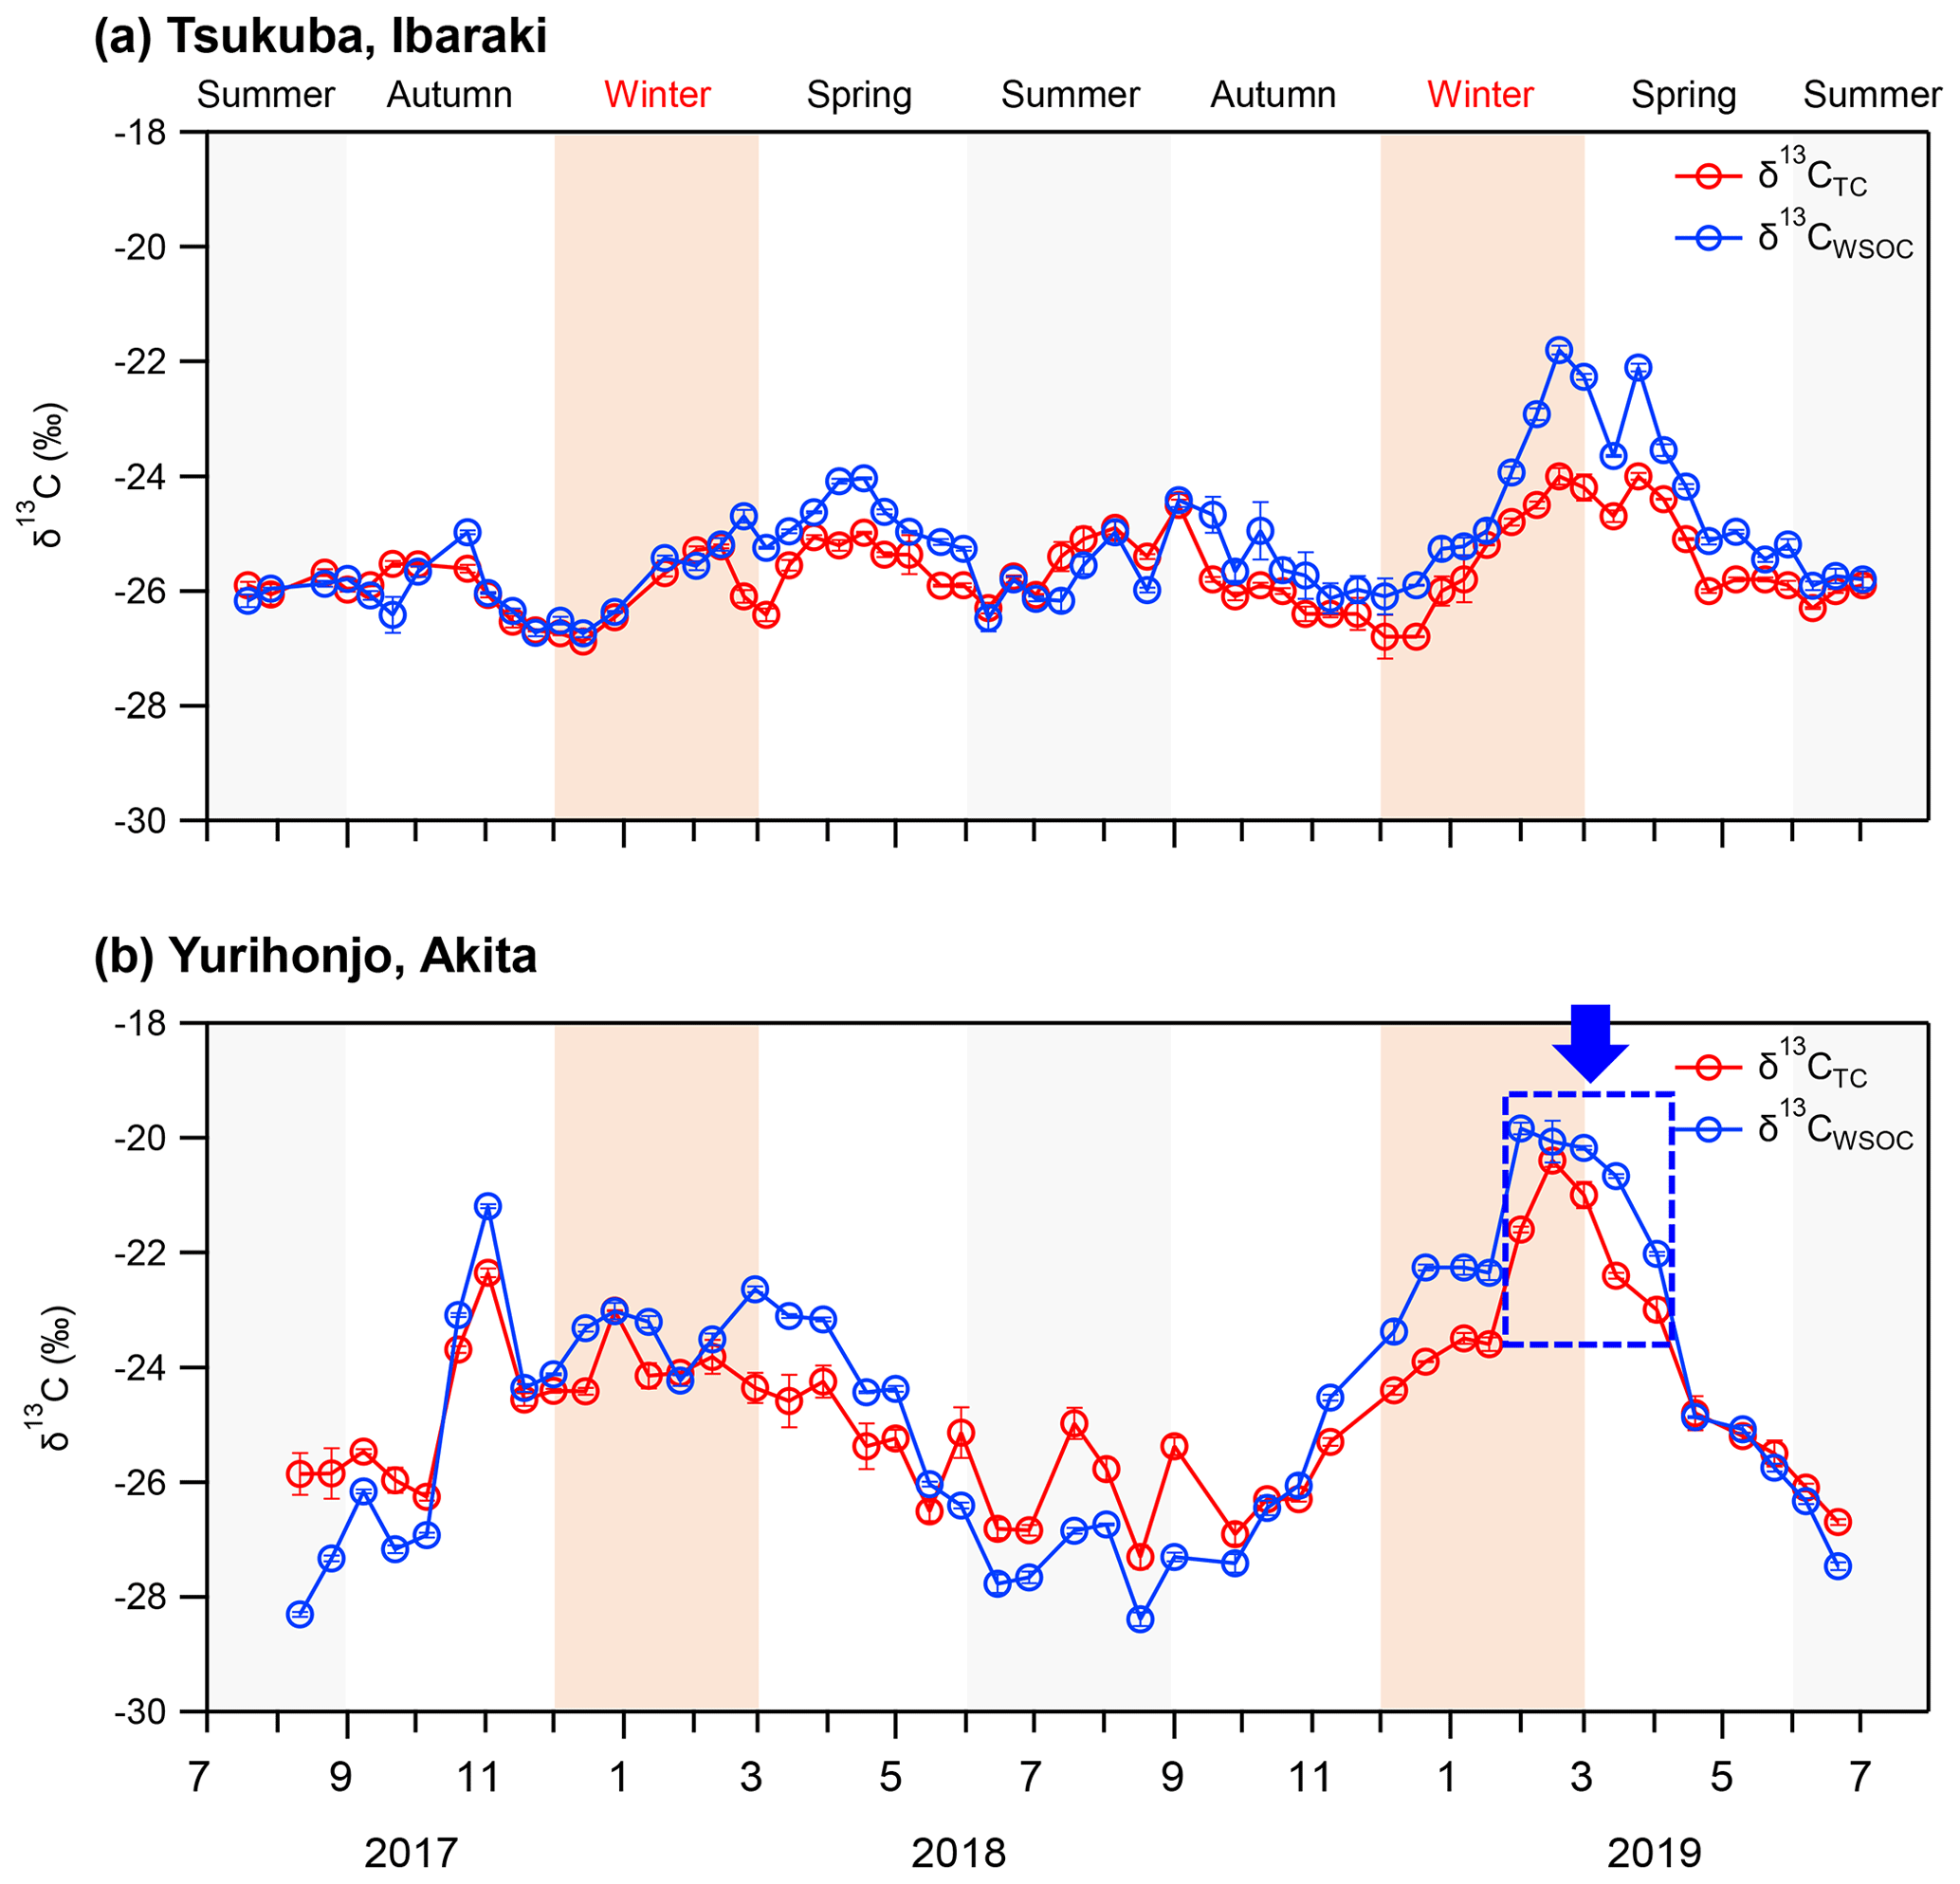
Figure 2δ13CTC and δ13CWSOC of PM2.5 from July 2017 to July 2019 in (a) Tsukuba, Ibaraki, and (b) Yurihonjo, Akita, Japan.
In the present study, the average δ13CWSOC was ‰ (−26.7 ‰ to −21.8 ‰) in Tsukuba and ‰ (−28.4 ‰ to −19.8 ‰) in Yurihonjo (Table 1 and Fig. 2). The δ13CWSOC of PM2.5, which was the particle size examined in the present study, was in Delhi, India (Dasari et al., 2019), and in Bhola, Bangladesh (Dasari et al., 2019), which are very close to our δ13CWSOC values. The δ13CWSOC of TSP was in Sapporo, Japan (Pavuluri and Kawamura, 2017), in Seoul, South Korea (Han et al., 2020), in Millbrook, USA (Wozniak et al., 2012a), and similar values were obtained for particles of different sizes. In these previous studies, most of the average δ13CWSOC values were in the range of −25 ‰ to −24 ‰ regardless of particle size, although there were some heavy values such as those for Hanimaadhoo Island, Maldives (), and Sinhagad, India () (Kirillova et al., 2013).
3.4 Seasonal variations in δ13CTC and δ13CWSOC in PM2.5
δ13CTC and δ13CWSOC at Tsukuba showed no other clear seasonal variation, but they became slightly heavy from February to April 2019 (Fig. 2a). In contrast, the δ13CTC and δ13CWSOC at Yurihonjo were heaver from autumn to spring than in summer (Fig. 2b), and they showed a significant seasonal variation (δ13CTC; p<0.01, δ13CWSOC; p<0.01) compared to those in Tsukuba. In addition, δ13CWSOC became heavier from February to April 2019 as in Tsukuba. At both study sites, δ13CWSOC was usually heavier than δ13CTC, but in summer δ13CWSOC was comparable to or lighter than δ13CTC (Tsukuba; p<0.01, Yurihonjo; p<0.01).
The seasonal trends of δ13CTC and δ13CWSOC observed in the present study were compared with those reported from previous long-term observations. No seasonal variation for δ13CWSOC in the suburban site, Tsukuba, is comparable with that in TSP in Seoul, South Korea, from March 2015 to January 2016 (Han et al., 2020). Similarly, a clear trend for heavier ratios in winter than in summer for δ13CTC and δ13CWSOC in the rural site, Yurihonjo, is comparable with that in TSP reported for Sapporo, Japan, from September 2009 to October 2010 (Pavuluri and Kawamura, 2017). In both Yurihonjo and Sapporo, it was observed that δ13CWSOC is usually heavier than δ13CTC and that this tendency is reversed in summer. Together, these findings imply that δ13CWSOC shows a weak seasonal trend in suburban or urban sites such as Tsukuba and Seoul but a clear seasonal trend in rural sites such as Yurihonjo and Sapporo.
The variations (difference between maximum and minimum value) of δ13CTC and δ13CWSOC were 2.9 ‰ and 4.9 ‰ in Tsukuba and 7.0 ‰ and 8.6 ‰ in Yurihonjo, respectively. The variation of δ13CWSOC was larger than that of δ13CTC at both sites, with both variations larger in Yurihonjo. In previous studies, the variation of δ13CTC was reported as 2.5 ‰ in Sapporo (Pavuluri and Kawamura, 2017), and that of δ13CWSOC was reported as 5.5 ‰ in Sapporo (Pavuluri and Kawamura, 2017) and 6.5 ‰ in Seoul (Han et al., 2020). The variation of δ13CEC of PM2.5 was only 1.6 ‰ in Japan (Kawashima and Haneishi, 2012) and 3.7 ‰ in China (Ni et al., 2018; Zhao et al., 2018). In the present study and these previous studies, the variation of δ13CWSOC was larger than that of δ13CEC, regardless of sampling site. The reason for this is likely that δ13CWSOC is affected not only by the source characteristics but also by atmospheric processing. The reasons underlying the seasonal trend observed for δ13CWSOC are further discussed in Sect. 3.5.1 and 3.5.2.
3.5 Determination of seasonal trends and sources of WSOC using δ13CWSOC
3.5.1 Seasonal trends and sources of WSOC in Tsukuba
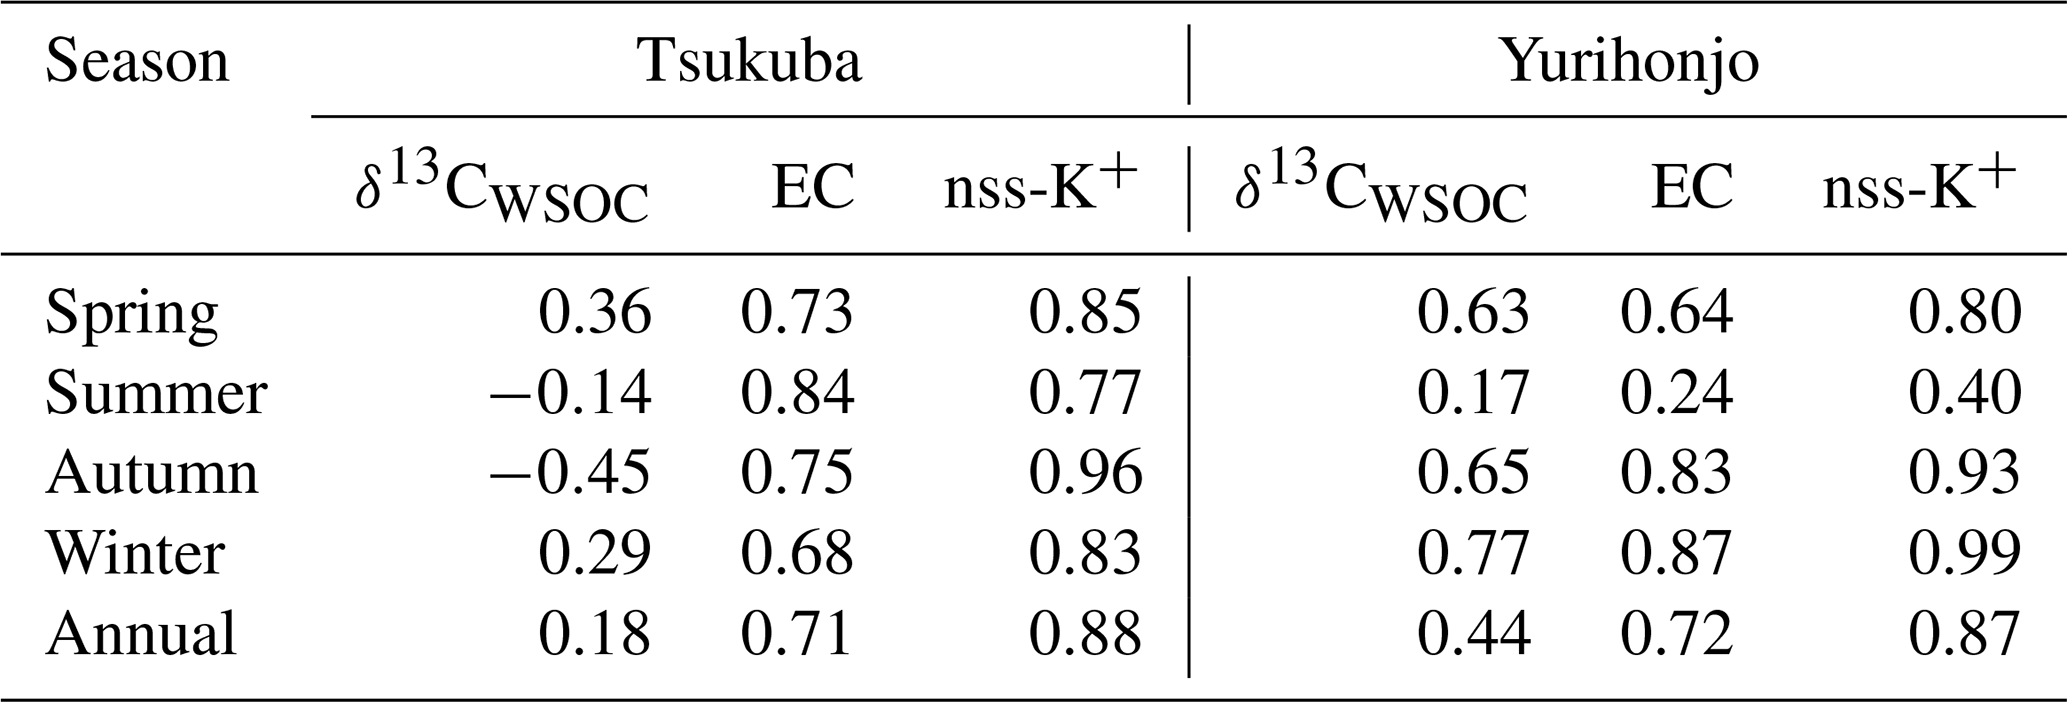
The average WSOC concentration in Tsukuba was significantly higher in autumn and winter than in spring and summer (p<0.01), and EC concentrations showed a similar significant seasonal trend (p<0.01) (Table 1). Table 2 shows the correlation coefficients between WSOC concentrations and three other parameters – δ13CWSOC, EC concentration, and non-sea-salt potassium concentration (nss-K+) – for each season and for the whole year. The EC concentration is a tracer of combustion (Bond et al., 2007). The nss-K+ parameter is a tracer of biomass burning that excludes K+ from seawater (nss-) (Lai et al., 2007). A weak correlation (r=0.18) was found between the annual-average WSOC concentration and annual-average δ13CWSOC. The strong correlation that was found between the annual-average WSOC concentration and annual-average EC concentration (r=0.71) suggests that the WSOC at this suburban site is from combustion sources (e.g., fossil fuel and/or biomass burning). The strong correlations that were observed between WSOC concentrations and nss-K+ for every season (autumn, r=0.96; winter, r=0.83; spring, r=0.85; summer r=0.77; all p<0.01) further suggests that the WSOC at this site is a result of biomass burning. The dominant annual source for WSOC was consistent with that reported in Seoul by Han et al. (2020).
Table 2Correlation (r) between WSOC concentration and the stated parameters.
The average δ13CWSOC was ‰ in Tsukuba (Table 1). Because C3 and C4 plants have different metabolic pathways, their δ13C values range from −34 ‰ to −24 ‰ for C3 plants and from −19 ‰ to −6 ‰ for C4 plants (Smith and Epstein, 1971). When C3 plants are burned in the laboratory, there is no difference between the δ13C of the produced particles and that of the original C3 plants (Turekian et al., 1998; Das et al., 2010). However, the particles produced by burning C4 plants are 3.5 ‰ lighter than the original C4 plants (Turekian et al., 1998). Therefore, the δ13C of C4 plants was estimated to be −22.5 ‰ to −9.5 ‰. The δ13C of C3 and C4 plant burning has been estimated to be −34.7 ‰ to −25.1 ‰ and −19.3 ‰ to −16.1 ‰, respectively (Kawashima and Haneishi, 2012; Garbaras et al., 2015; Guo et al., 2016). Thus, the average δ13CWSOC at Tsukuba indicates that the burning of C3 plant biomass is the dominant source of WSOC at this site. Indeed, rice, a C3 plant, is Japan's largest crop followed by barley and wheat (Ministry of Agriculture Forestry and Fisheries, 2020). In Ibaraki Prefecture, where Tsukuba City is located, the crop acreage and harvest of rice were 68 400 ha and 358 400 t, respectively, in 2018 and were the largest in the Kanto region (Ministry of Agriculture Forestry and Fisheries, 2020). In addition, according to a field investigation, biomass burning in Tsukuba is predominantly the burning of rice straw and rice hulls from September to October Tomiyama et al. (2017). Using radiocarbon analysis, which can distinguish between biogenic and anthropogenic sources, a higher proportion of OC in PM2.5 collected in Tokyo, Japan, in 2014 was reported to be biogenic from autumn to winter than in summer (Hoshi and Saito, 2020).
The main chemical component generated by the breakdown of cellulose by biomass burning is levoglucosan, which can be used as a tracer of biomass burning (Simoneit et al., 1999). The δ13C of levoglucosan emitted from the burning of C3 plants such as peanut, mulberry, China fir, Chinese red pine, Chinese guger tree, and chestnut are reported to range from −26.05 ‰ to −22.60 ‰, with that from rice straw reported to be ‰ (Sang et al., 2012). The average δ13CWSOC in Tsukuba was very close to this previously reported δ13C of levoglucosan from the burning of rice straw. However, levoglucosan accounts for only about 3.8 % of the WSOC in urban areas of Japan (Kumagai et al., 2010). Therefore, it is difficult to accurately identify the sources of WSOC using only the δ13C values of levoglucosan. Further research is needed to determine the δ13C of the components of WSOC other than levoglucosan.
3.5.2 Seasonal trends and sources of WSOC in Yurihonjo
In Yurihonjo, the correlation between WSOC concentrations and EC concentrations was highest in winter (r=0.87, p<0.01), followed by autumn (r=0.83, p<0.01) and spring (r=0.64, p<0.05), and lowest in summer (r=0.24) (Table 2). This suggests that WSOC at this rural site was mainly from combustion sources in autumn and spring. In addition, the correlation between WSOC concentrations and nss-K+ concentrations was very high in autumn (r=0.93), winter (r=0.99), and spring (r=0.80; all p<0.01) but not in summer (r=0.40). These strong correlations from autumn to spring suggest that during that time the WSOC came mainly from combustion sources such as biomass burning. The average δ13CWSOC at Yurihonjo for autumn and spring, ‰, suggests that biomass burning of C3 biomass such as rice straw and rice hulls may be the dominant source of WSOC, as was found in Tsukuba.
In Akita Prefecture, where Yurihonjo is located, the crop acreage of rice was 87 700 ha in 2018, and the rice harvest was 491 100 t (Ministry of Agriculture Forestry and Fisheries, 2020). From February to April 2019, the δ13CWSOC was the heaviest ( ‰ ), and WSOC concentrations were markedly increased compared with the previous months (average, 1.5±0.7 µg m−3) (Figs. 1b and 2b). A moderate correlation between WSOC concentrations and δ13CWSOC values was observed for this time period (r=0.54, p=0.27). This δ13CWSOC value indicates a heavy δ13C source such as C4 plants (e.g., corn and grass), but no evidence of burning of C4 plants during this period was observed around the sampling site at Yurihonjo. Northeast China is the largest producer of corn in China (MWCACP, 2021), and biomass burning is used for heating in winter (Chen et al., 2017). Satellite imagery revealed a number of fire spots in that part of China from February to April 2019 (NASA, 2021) (Fig. S2 in the Supplement). Backward air-mass trajectories showed that air masses at Yurihonjo during this period originated mainly from areas in northeast China (Fig. S3 in the Supplement). Consistent with this finding, Uranishi et al. (2020) reported from an analysis using the Community Multiscale Air Quality model that particles from biomass burning in northeast China were transported to Akita Prefecture in February and March 2019. The correlation between Na+ and Cl− concentrations was highest from winter to spring 2019 in Yurihonjo (r=0.98, p<0.01), suggesting the influence of sea salt. Recently, aerosol photochemical aging during long-range transport has been shown to selectively enrich the 13C content in organic aerosols, leading to heavier δ13C values (Kirillova et al., 2013; Bosch et al., 2014; Dasari et al., 2019; Zhang et al., 2019). In a field study, the isotope fractionation values for δ13CWSOC were estimated to be enriched by 3 ‰–4 ‰ because of aging during transport (Kirillova et al., 2013). The combination of isotopic ratio and concentration measurements (Figs. 1 and 2) together with the evidence of prevailing biomass burning activities (Fig. S2) and the results of the backward trajectory analysis (Fig. S3) suggest that the heavier δ13CWSOC from February to April 2019 at Yurihonjo was the result of C4 plant combustion rather than aging during long-range transport.
The δ13CWSOC in summer was very light (−27.4 ‰) compared with the average value for the observation period. A weak correlation between WSOC concentrations and EC concentrations in summer (r=0.24; Table 2) suggests that the WSOC is derived from a non-combustion source. In general, the formation of WSOC involves atmospheric reactions such as the formation of SOAs, which are formed by oxidation of anthropogenic and biogenic volatile organic compounds (VOCs; Heo et al., 2013). Aliphatic hydrocarbons (e.g., alkanes and alkenes) and aromatics (e.g., benzene, toluene, ethylbenzene, and xylene) emitted from solvent evaporation and vehicle emissions are important anthropogenic VOCs and precursors of SOAs (Chen et al., 2010). The δ13C values for alkanes in tunnel, gas station, underground garage, and refinery air samples are reported to range from ‰ to ‰ (Rudolph et al., 2002). Toluene and xylene are the aliphatic hydrocarbons with the highest annual emissions in Japan (Japan Ministry of Economy Trade and Industry, 2020). The δ13C of toluene and xylene for gas station and vehicle emissions are reported to range from −27.7 ‰ to −23.8 ‰ (Rudolph et al., 2002; Kawashima and Murakami, 2014). Because VOCs in the atmosphere are oxidized by photochemical oxidants, the δ13C values of the residual VOCs become heavier via isotopic fractionation (Rudolph et al., 2000; Anderson et al., 2004); in other words, secondary production tends to result in a lighter δ13C for SOA in the atmosphere. In a laboratory-based experiment, the δ13C of SOA particles formed by photooxidation of toluene was 3 ‰ to 6 ‰ lighter than that of the precursor toluene, depending on the degree of oxidation (Irei et al., 2006, 2011). Assuming that this isotopic fractionation of toluene applies also to all other potential components, the δ13C of the emission source of VOCs at Yurihonjo would be approximately −24.4 ‰ to −21.4 ‰, as calculated by subtracting 3 ‰ to 6 ‰ from the average δ13CWSOC in Yurihonjo during summer (−27.4 ‰). This estimated δ13C value of VOCs is heavier than those previously reported for anthropogenic VOCs. Therefore, anthropogenic VOCs were not considered to be the dominant source of WSOC at Yurihonjo.
At the global scale, biogenic VOC emissions are more than an order of magnitude greater than those of anthropogenic VOCs (Farina et al., 2010). Biogenic VOCs include isoprene, monoterpenes, and sesquiterpenes released from vegetation, with isoprene producing the most SOA (Atkinson and Arey, 1998). The oxidation product of isoprene is 2-methyltetrol, which is widely used as an organic tracer to evaluate the production of SOA from isoprene (Claeys et al., 2004). The average δ13C of 2-methyltetrol in aerosols in four forests in Sichuan Province, China, was −27.36 ‰ (−28.23 ‰ to −26.46 ‰) (Li et al., 2019). This average δ13C of 2-methyltetrol is close to the δ13CWSOC detected in summer in Yurihonjo, suggesting the components produced by secondary reaction of biogenic VOCs make a large contribution to the WSOC in Yurihonjo during the summer. From a field study conducted in a forest in northern Japan, Miyazaki et al. (2012) reported that the lightest δ13CWSOC values (average ‰) were observed from June to September; the authors concluded from positive matrix factorization modeling data that biogenic SOAs (isoprene SOA and α- and/or β-pinene) were the dominant source of WSOC in the summer, which is consistent with the findings of the present study.
The WSOC concentration, δ13CTC, and δ13CWSOC of PM2.5 were observed at one suburban and one rural site in Japan over a 2-year period. The average WSOC concentration during the observation period was 1.2±0.4 µg m−3 (0.4–2.4 µg m−3) at the suburban site and 0.8±0.5 µg m−3 (0.3–2.6 µg m−3) at the rural site. The δ13CWSOC was ‰ (−26.7 ‰ to −21.8 ‰) at the suburban site and ‰ (−28.4 ‰ to −19.8 ‰) at the rural site. The δ13CTC and δ13CWSOC at the suburban site showed no clear seasonal variations, but they were slightly heavier from February to April 2019. In contrast, the δ13CTC and δ13CWSOC at the rural site were heaver from autumn to spring than in summer, and they showed a significant seasonal variation (δ13CTC, p<0.01; δ13CWSOC, p<0.01). Using δ13CWSOC, carbon components, and water-soluble ions, the main source of WSOC at the suburban site was concluded to be local biomass burning of rice straw. At the rural site, the δ13CWSOC from autumn to spring was concluded to reflect mainly the biomass burning of rice straw, whereas that in summer was considered to reflect mainly the formation of secondary organic aerosols from biogenic VOCs. The heaviest δ13CWSOC ( ‰) was from February to April 2019 and may reflect long-range transport of particles resulting from the overseas burning of C4 plants such as corn. Thus, we were able to use a δ13CWSOC-based approach to understand the sources and atmospheric processes that contribute to the WSOC concentrations at the two study sites.
Data are available from the corresponding author on request (nsuto@jari.or.jp).
The supplement related to this article is available online at: https://doi.org/10.5194/acp-21-11815-2021-supplement.
NS and HK were involved in research planning and experimental design. NS performed the sampling and measurements of δ13CTC, carbon components, and water-soluble ions. HK performed the sampling and measurements of δ13CWSOC. All authors clarified the experimental data and contributed to the writing of the paper.
The authors declare that they have no conflict of interest.
Publisher's note: Copernicus Publications remains neutral with regard to jurisdictional claims in published maps and institutional affiliations.
This work was partially supported by the Japan Society for the Promotion of Science KAKENHI (grant nos. 19K20463, 18H03393, 17K12829, and 16KK0015). We acknowledge the use of data and imagery from NASA's Fire Information for Resource Management System (FIRMS) (https://earthdata.nasa.gov/firms, last access: 26 June 2021), part of NASA's Earth Observing System Data and Information System (EOSDIS). We thank emeritus professor Shigeki Masunaga of Yokohama National University for providing the high-volume samplers used in this research; we also thank Sae Ono, Momoka Suto, and Otoha Yoshida for collecting the aerosol samples and for helping with wet-oxidation–IRMS analysis at Akita Prefectural University. Furthermore, we thank Akiyoshi Ito, Hiroyuki Hagino, Kazue Kagami, and Akemi Nakayama at the Japan Automobile Research Institute for their advice and help with chemical analysis. And, Yumi Sone from Thermo Fisher Scientific Inc., Japan, was very helpful with our EA–IRMS analysis. Finally, we thank ELSS, Inc. for editing the English of this article.
This research has been supported by the Japan Society for the Promotion of Science KAKENHI (grant nos. 19K20463, 18H03393, 17K12829, and 16KK0015).
This paper was edited by Rupert Holzinger and reviewed by Andrius Garbaras and one anonymous referee.
Anderson, R. S., Iannone, R., Thompson, A. E., Rudolph, J., and Huang, L.: Carbon kinetic isotope effects in the gas-phase reactions of aromatic hydrocarbons with the OH radical at 296±4 K, Geophys. Res. Lett., 31, L15108, https://doi.org/10.1029/2004GL020089, 2004.
Asa-Awuku, A., Moore, R. H., Nenes, A., Bahreini, R., Holloway, J. S., Brock, C. A., Middlebrook, A. M., Ryerson, T. B., Jimenez, J. L., DeCarlo, P. F., Hecobian, A., Weber, R. J., Stickel, R., Tanner, D. J., and Huey, L. G.: Airborne cloud condensation nuclei measurements during the 2006 Texas Air Quality Study, J. Geophys. Res., 116, D11201, https://doi.org/10.1029/2010jd014874, 2011.
Atkinson, R. and Arey, J.: Atmospheric Chemistry of Biogenic Organic Compounds, Accounts Chem. Res., 31, 574–583, https://doi.org/10.1021/ar970143z, 1998.
Bond, T. C., Bhardwaj, E., Dong, R., Jogani, R., Jung, S., Roden, C., Streets, D. G., and Trautmann, N. M.: Historical emissions of black and organic carbon aerosol from energy-related combustion, 1850–2000, Global Biogeochem. Cy., 21, GB2018, https://doi.org/10.1029/2006gb002840, 2007.
Bosch, C., Andersson, A., Kirillova, E. N., Budhavant, K., Tiwari, S., Praveen, P. S., Russell, L. M., Beres, N. D., Ramanathan, V., and Gustafsson, Ö.: Source-diagnostic dual-isotope composition and optical properties of water-soluble organic carbon and elemental carbon in the South Asian outflow intercepted over the Indian Ocean, J. Geophys. Res., 119, 11743–11759, https://doi.org/10.1002/2014JD022127, 2014.
Cao, F., Zhang, S. C., Kawamura, K., and Zhang, Y. L.: Inorganic markers, carbonaceous components and stable carbon isotope from biomass burning aerosols in Northeast China, Sci. Total Environ., 572, 1244–1251, https://doi.org/10.1016/j.scitotenv.2015.09.099, 2016.
Cao, J. J., Chow, J. C., Tao, J., Lee, S. C., Watson, J. G., Ho, K. F., Wang, G. H., Zhu, C. S., and Han, Y. M.: Stable carbon isotopes in aerosols from Chinese cities: Influence of fossil fuels, Atmos. Environ., 45, 1359–1363, https://doi.org/10.1016/j.atmosenv.2010.10.056, 2011.
Chalbot, M.-C. G., Brown, J., Chitranshi, P., Gamboa da Costa, G., Pollock, E. D., and Kavouras, I. G.: Functional characterization of the water-soluble organic carbon of size-fractionated aerosol in the southern Mississippi Valley, Atmos. Chem. Phys., 14, 6075–6088, https://doi.org/10.5194/acp-14-6075-2014, 2014.
Chen, J., Ying, Q., and Kleeman, M. J.: Source apportionment of wintertime secondary organic aerosol during the California regional PM10/PM2.5 air quality study, Atmos. Environ., 44, 1331–1340, https://doi.org/10.1016/j.atmosenv.2009.07.010, 2010.
Chen, J., Li, C., Ristovski, Z., Milic, A., Gu, Y., Islam, M. S., Wang, S., Hao, J., Zhang, H., He, C., Guo, H., Fu, H., Miljevic, B., Morawska, L., Thai, P., Lam, Y. F., Pereira, G., Ding, A., Huang, X., and Dumka, U. C.: A review of biomass burning: Emissions and impacts on air quality, health and climate in China, Sci. Total Environ., 579, 1000–1034, https://doi.org/10.1016/j.scitotenv.2016.11.025, 2017.
Cheng, Z., Luo, L., Wang, S., Wang, Y., Sharma, S., Shimadera, H., Wang, X., Bressi, M., de Miranda, R. M., Jiang, J., Zhou, W., Fajardo, O., Yan, N., and Hao, J.: Status and characteristics of ambient PM2.5 pollution in global megacities, Environ. Int., 89–90, 212–221, https://doi.org/10.1016/j.envint.2016.02.003, 2016.
Chow, J. C., Watson, J. G., Lowenthal, D. H., Solomon, P. A., Magliano, K. L., Ziman, S. D., and Richards, L. W.: PM10 and PM2.5 Compositions in California's San Joaquin Valley, Aerosol Sci. Technol., 18, 105–128, https://doi.org/10.1080/02786829308959588, 1993.
Chow, J. C., Watson, J. G., Lu, Z., Lowenthal, D. H., Frazier, C. A., Solomon, P. A., Thuillier, R. H., and Magliano, K.: Descriptive analysis of PM2.5 and PM10 at regionally representative locations during SJVAQS/AUSPEX, Atmos. Environ., 30, 2079–2112, https://doi.org/10.1016/1352-2310(95)00402-5, 1996.
Chow, J. C., Watson, J. G., Crow, D., Lowenthal, D. H., and Merrifield, T.: Comparison of IMPROVE and NIOSH Carbon Measurements, Aerosol Sci. Technol., 34, 23–34, https://doi.org/10.1080/02786820119073, 2001.
Claeys, M., Graham, B., Vas, G., Wang, W., Vermeylen, R., Pashynska, V., Cafmeyer, J., Guyon, P., Andreae, M. O., Artaxo, P., and Maenhaut, W.: Formation of secondary organic aerosols through photooxidation of isoprene, Science, 303, 1173–1176, https://doi.org/10.1126/science.1092805, 2004.
Coplen, T. B., Brand, W. A., Gehre, M., Gröning, M., Meijer, H. A. J., Toman, B., and Verkouteren, R. M.: New Guidelines for δ13C Measurements, Anal. Chem., 78, 2439–2441, https://doi.org/10.1021/ac052027c, 2006.
Das, O., Wang, Y., and Hsieh, Y.-P.: Chemical and carbon isotopic characteristics of ash and smoke derived from burning of C3 and C4 grasses, Org. Geochem., 41, 263–269, https://doi.org/10.1016/j.orggeochem.2009.11.001, 2010.
Dasari, S., Andersson, A., Bikkina, S., Holmstrand, H., Budhavant, K., Satheesh, S., Asmi, E., Kesti, J., Backman, J., Salam, A., Bisht, D. S., Tiwari, S., Hameed, Z., and Gustafsson, Ö.: Photochemical degradation affects the light absorption of water-soluble brown carbon in the South Asian outflow, Sci. Adv., 5, eaau8066, https://doi.org/10.1126/sciadv.aau8066, 2019.
Decesari, S., Facchini, M. C., Matta, E., Lettini, F., Mircea, M., Fuzzi, S., Tagliavini, E., and Putaud, J. P.: Chemical features and seasonal variation of fine aerosol water-soluble organic compounds in the Po Valley, Italy, Atmos. Environ., 35, 3691–3699, https://doi.org/10.1016/S1352-2310(00)00509-4, 2001.
Du, Z., He, K., Cheng, Y., Duan, F., Ma, Y., Liu, J., Zhang, X., Zheng, M., and Weber, R.: A yearlong study of water-soluble organic carbon in Beijing I: Sources and its primary vs. secondary nature, Atmos. Environ., 92, 514–521, https://doi.org/10.1016/j.atmosenv.2014.04.060, 2014.
Duarte, R. M. B. O., Santos, E. B. H., Pio, C. A., and Duarte, A. C.: Comparison of structural features of water-soluble organic matter from atmospheric aerosols with those of aquatic humic substances, Atmos. Environ., 41, 8100–8113, https://doi.org/10.1016/j.atmosenv.2007.06.034, 2007.
Duarte, R. M. B. O., Freire, S. M. S. C., and Duarte, A. C.: Investigating the water-soluble organic functionality of urban aerosols using two-dimensional correlation of solid-state 13C NMR and FTIR spectral data, Atmos. Environ., 116, 245–252, https://doi.org/10.1016/j.atmosenv.2015.06.043, 2015.
Farina, S. C., Adams, P. J., and Pandis, S. N.: Modeling global secondary organic aerosol formation and processing with the volatility basis set: Implications for anthropogenic secondary organic aerosol, J. Geophys. Res., 115, D09202, https://doi.org/10.1029/2009jd013046, 2010.
Fisseha, R., Saurer, M., Jaggi, M., Szidat, S., Siegwolf, R. T., and Baltensperger, U.: Determination of stable carbon isotopes of organic acids and carbonaceous aerosols in the atmosphere, Rapid Commun. Mass Sp., 20, 2343–2347, https://doi.org/10.1002/rcm.2586, 2006.
Fisseha, R., Saurer, M., Jäggi, M., Siegwolf, R. T. W., Dommen, J., Szidat, S., Samburova, V., and Baltensperger, U.: Determination of primary and secondary sources of organic acids and carbonaceous aerosols using stable carbon isotopes, Atmos. Environ., 43, 431–437, https://doi.org/10.1016/j.atmosenv.2008.08.041, 2009.
Garbaras, A., Masalaite, A., Garbariene, I., Ceburnis, D., Krugly, E., Remeikis, V., Puida, E., Kvietkus, K., and Martuzevicius, D.: Stable carbon fractionation in size-segregated aerosol particles produced by controlled biomass burning, J. Aerosol Sci., 79, 86–96, https://doi.org/10.1016/j.jaerosci.2014.10.005, 2015.
Gensch, I., Kiendler-Scharr, A., and Rudolph, J.: Isotope ratio studies of atmospheric organic compounds: Principles, methods, applications and potential, Int. J. Mass Spectrom., 365–366, 206–221, https://doi.org/10.1016/j.ijms.2014.02.004, 2014.
Guo, Z., Jiang, W., Chen, S., Sun, D., Shi, L., Zeng, G., and Rui, M.: Stable isotopic compositions of elemental carbon in PM1.1 in north suburb of Nanjing Region, China, Atmos. Res., 168, 105–111, https://doi.org/10.1016/j.atmosres.2015.09.006, 2016.
Han, H., Kim, G., Seo, H., Shin, K.-H., and Lee, D.-H.: Significant seasonal changes in optical properties of brown carbon in the midlatitude atmosphere, Atmos. Chem. Phys., 20, 2709–2718, https://doi.org/10.5194/acp-20-2709-2020, 2020.
Heo, J., Dulger, M., Olson, M. R., McGinnis, J. E., Shelton, B. R., Matsunaga, A., Sioutas, C., and Schauer, J. J.: Source apportionments of PM2.5 organic carbon using molecular marker Positive Matrix Factorization and comparison of results from different receptor models, Atmos. Environ., 73, 51–61, https://doi.org/10.1016/j.atmosenv.2013.03.004, 2013.
Ho, K. F., Lee, S. C., Cao, J. J., Li, Y. S., Chow, J. C., Watson, J. G., and Fung, K.: Variability of organic and elemental carbon, water soluble organic carbon, and isotopes in Hong Kong, Atmos. Chem. Phys., 6, 4569–4576, https://doi.org/10.5194/acp-6-4569-2006, 2006.
Hoshi, J. and Saito, S.: Estimating the contribution of biomass burning to atmospheric organic particles at the central tokyo metropolitan area using levoglucosan and radiocarbon, Journal of Japan Society for Atmospheric Environment, 55, 204–220, https://doi.org/10.11298/taiki.55.204, 2020.
Irei, S., Huang, L., Collin, F., Zhang, W., Hastie, D., and Rudolph, J.: Flow reactor studies of the stable carbon isotope composition of secondary particulate organic matter generated by OH-radical-induced reactions of toluene, Atmos. Environ., 40, 5858–5867, https://doi.org/10.1016/j.atmosenv.2006.05.001, 2006.
Irei, S., Rudolph, J., Huang, L., Auld, J., and Hastie, D.: Stable carbon isotope ratio of secondary particulate organic matter formed by photooxidation of toluene in indoor smog chamber, Atmos. Environ., 45, 856–862, https://doi.org/10.1016/j.atmosenv.2010.11.021, 2011.
Japan Meteorological Agency: Search for Past Climate Data 2017–2019, http://www.jma.go.jp/jma/indexe.html, last access: 24 August 2020.
Japan Ministry of Economy Trade and Industry: Pollutant Release and Transfer Register (PRTR), http://www.env.go.jp/en/chemi/prtr/prtr.html, last access: 24 August 2020.
Kawashima, H. and Haneishi, Y.: Effects of combustion emissions from the Eurasian continent in winter on seasonal δ13C of elemental carbon in aerosols in Japan, Atmos. Environ., 46, 568–579, https://doi.org/10.1016/j.atmosenv.2011.05.015, 2012.
Kawashima, H. and Murakami, M.: Measurement of the stable carbon isotope ratio of atmospheric volatile organic compounds using chromatography, combustion, and isotope ratio mass spectrometry coupled with thermal desorption, Atmos. Environ., 89, 140–147, https://doi.org/10.1016/j.atmosenv.2014.02.033, 2014.
Kawashima, H., Suto, M., and Suto, N.: Determination of carbon isotope ratios for honey samples by means of a liquid chromatography/isotope ratio mass spectrometry system coupled with a post-column pump, Rapid Commun. Mass Sp., 32, 1271–1279, https://doi.org/10.1002/rcm.8170, 2018.
Kirillova, E. N., Sheesley, R. J., Andersson, A., and Gustafsson, Ö.: Natural Abundance 13C and 14C Analysis of Water-Soluble Organic Carbon in Atmospheric Aerosols, Anal. Chem., 82, 7973–7978, https://doi.org/10.1021/ac1014436, 2010.
Kirillova, E. N., Andersson, A., Sheesley, R. J., Kruså, M., Praveen, P. S., Budhavant, K., Safai, P. D., Rao, P. S. P., and Gustafsson, Ö.: 13C- and 14C-based study of sources and atmospheric processing of water-soluble organic carbon (WSOC) in South Asian aerosols, J. Geophys. Res., 118, 614–626, https://doi.org/10.1002/jgrd.50130, 2013.
Kirillova, E. N., Andersson, A., Han, J., Lee, M., and Gustafsson, Ö.: Sources and light absorption of water-soluble organic carbon aerosols in the outflow from northern China, Atmos. Chem. Phys., 14, 1413–1422, https://doi.org/10.5194/acp-14-1413-2014, 2014a.
Kirillova, E. N., Andersson, A., Tiwari, S., Srivastava, A. K., Bisht, D. S., and Gustafsson, Ö.: Water-soluble organic carbon aerosols during a full New Delhi winter: Isotope-based source apportionment and optical properties, J. Geophys. Res.-Atmos., 119, 3476–3485, https://doi.org/10.1002/2013jd020041, 2014b.
Koch, D., Bond, T. C., Streets, D., Unger, N., and van der Werf, G. R.: Global impacts of aerosols from particular source regions and sectors, J. Geophys. Res., 112, D02205, https://doi.org/10.1029/2005jd007024, 2007.
Kumagai, K., Iijima, A., Tago, H., Tomioka, A., Kozawa, K., and Sakamoto, K.: Seasonal characteristics of water-soluble organic carbon in atmospheric particles in the inland Kanto plain, Japan, Atmos. Environ., 43, 3345–3351, https://doi.org/10.1016/j.atmosenv.2009.04.008, 2009.
Kumagai, K., Iijima, A., Shimoda, M., Saitoh, Y., Kozawa, K., Hagino, H., and Sakamoto, K.: Determination of Dicarboxylic Acids and Levoglucosan in Fine Particles in the Kanto Plain, Japan, for Source Apportionment of Organic Aerosols, Aerosol Air Qual. Res., 10, 282–291, https://doi.org/10.4209/aaqr.2009.11.0075, 2010.
Lai, S., Zou, S., Cao, J., Lee, S., and Ho, K.: Characterizing ionic species in PM2.5 and PM10 in four Pearl River Delta cities, South China, J. Environ. Sci., 19, 939–947, https://doi.org/10.1016/s1001-0742(07)60155-7, 2007.
Li, L., Zhou, Y., Bi, X., Deng, S., Wang, S., and Lu, M.: Determination of the stable carbon isotopic compositions of 2-methyltetrols for four forest areas in Southwest China: The implications for the δ13C values of atmospheric isoprene and C3/C4 vegetation distribution, Sci. Total Environ., 678, 780–792, https://doi.org/10.1016/j.scitotenv.2019.04.432, 2019.
Li, P., Sato, K., Hasegawa, H., Huo, M., Minoura, H., Inomata, Y., Take, N., Yuba, A., Futami, M., Takahashi, T., and Kotake, Y.: Chemical Characteristics and Source Apportionment of PM2.5 and Long-Range Transport from Northeast Asia Continent to Niigata in Eastern Japan, Aerosol Air Qual. Res., 18, 938–956, https://doi.org/10.4209/aaqr.2017.05.0181, 2018.
Lohmann, U. and Feichter, J.: Global indirect aerosol effects: a review, Atmos. Chem. Phys., 5, 715–737, https://doi.org/10.5194/acp-5-715-2005, 2005.
Malm, W. C., Schichtel, B. A., Pitchford, M. L., Ashbaugh, L. L., and Eldred, R. A.: Spatial and monthly trends in speciated fine particle concentration in the United States, J. Geophys. Res., 109, D03306, https://doi.org/10.1029/2003jd003739, 2004.
Ministry of Agriculture Forestry and Fisheries: Statistical Survey on Crops, https://www.maff.go.jp/e/index.html, last access: 24 August 2020.
Ministry of the Environment: air quality standard for the annual average of Japan, http://www.env.go.jp/kijun/taiki.html, last access: 24 Ausugt 2020.
Ministry of the Environment: Atmospheric Environmental Regional Observation System (AEROS), http://www.env.go.jp/kijun/taiki.html, last access: 22 Februrary 2021.
Miyazaki, Y., Fu, P. Q., Kawamura, K., Mizoguchi, Y., and Yamanoi, K.: Seasonal variations of stable carbon isotopic composition and biogenic tracer compounds of water-soluble organic aerosols in a deciduous forest, Atmos. Chem. Phys., 12, 1367–1376, https://doi.org/10.5194/acp-12-1367-2012, 2012.
MWCACP: USDA Major World Crop Areas and Climate Profiles, https://ipad.fas.usda.gov/rssiws/al/global_cropprod.aspx, last access: 26 May 2021.
NASA: Fire Information for Resource Management System (FIRMS), https://earthdata.nasa.gov/firms, last access: 26 May 2021.
Ni, H., Huang, R.-J., Cao, J., Liu, W., Zhang, T., Wang, M., Meijer, H. A. J., and Dusek, U.: Source apportionment of carbonaceous aerosols in Xi'an, China: insights from a full year of measurements of radiocarbon and the stable isotope 13C, Atmos. Chem. Phys., 18, 16363–16383, https://doi.org/10.5194/acp-18-16363-2018, 2018.
Padró, L. T., Tkacik, D., Lathem, T., Hennigan, C. J., Sullivan, A. P., Weber, R. J., Huey, L. G., and Nenes, A.: Investigation of cloud condensation nuclei properties and droplet growth kinetics of the water-soluble aerosol fraction in Mexico City, J. Geophys. Res., 115, D09204, https://doi.org/10.1029/2009jd013195, 2010.
Park, S. S. and Cho, S. Y.: Tracking sources and behaviors of water-soluble organic carbon in fine particulate matter measured at an urban site in Korea, Atmos. Environ., 45, 60–72, https://doi.org/10.1016/j.atmosenv.2010.09.045, 2011.
Pavuluri, C. M. and Kawamura, K.: Seasonal changes in TC and WSOC and their 13C isotope ratios in Northeast Asian aerosols: land surface–biosphere–atmosphere interactions, Acta Geochimica, 36, 355–358, https://doi.org/10.1007/s11631-017-0157-3, 2017.
Pietrogrande, M. C., Bacco, D., and Chiereghin, S.: GC/MS analysis of water-soluble organics in atmospheric aerosol: optimization of a solvent extraction procedure for simultaneous analysis of carboxylic acids and sugars, Anal. Bioanal. Chem., 405, 1095–1104, https://doi.org/10.1007/s00216-012-6592-4, 2013.
Pope, C. A., Thun, M. J., Namboodiri, M. M., Dockery, D. W., Evans, J. S., Speizer, F. E., and Heath Jr., C. W.: Particulate air pollution as a predictor of mortality in a prospective study of US Adults, Am. J. Resp. Crit. Care, 151, 669–674, https://doi.org/10.1164/ajrccm/151.3_Pt_1.669, 1995.
Pöschl, U.: Atmospheric Aerosols: Composition, Transformation, Climate and Health Effects, Angew. Chem. International Edition, 44, 7520–7540, https://doi.org/10.1002/anie.200501122, 2005.
Ram, K. and Sarin, M. M.: Spatio-temporal variability in atmospheric abundances of EC, OC and WSOC over Northern India, J. Aerosol Sci., 41, 88–98, https://doi.org/10.1016/j.jaerosci.2009.11.004, 2010.
Rudolph, J., Czuba, E., and Huang, L.: The stable carbon isotope fractionation for reactions of selected hydrocarbons with OH-radicals and its relevance for atmospheric chemistry, J. Geophys. Res., 105, 29329–29346, https://doi.org/10.1029/2000JD900447, 2000.
Rudolph, J., Czuba, E., Norman, A. L., Huang, L., and Ernst, D.: Stable carbon isotope composition of nonmethane hydrocarbons in emissions from transportation related sources and atmospheric observations in an urban atmosphere, Atmos. Environ., 36, 1173–1181, https://doi.org/10.1016/S1352-2310(01)00537-4, 2002.
Saarikoski, S., Timonen, H., Saarnio, K., Aurela, M., Järvi, L., Keronen, P., Kerminen, V.-M., and Hillamo, R.: Sources of organic carbon in fine particulate matter in northern European urban air, Atmos. Chem. Phys., 8, 6281–6295, https://doi.org/10.5194/acp-8-6281-2008, 2008.
Sang, X. F., Gensch, I., Laumer, W., Kammer, B., Chan, C. Y., Engling, G., Wahner, A., Wissel, H., and Kiendler-Scharr, A.: Stable carbon isotope ratio analysis of anhydrosugars in biomass burning aerosol particles from source samples, Environ. Sci. Technol., 46, 3312–3318, https://doi.org/10.1021/es204094v, 2012.
Schichtel, B. A., Malm, W. C., Bench, G., Fallon, S., McDade, C. E., Chow, J. C., and Watson, J. G.: Fossil and contemporary fine particulate carbon fractions at 12 rural and urban sites in the United States, J. Geophys. Res., 113, D02311, https://doi.org/10.1029/2007jd008605, 2008.
Simoneit, B. R. T., Schauer, J. J., Nolte, C. G., Oros, D. R., Elias, V. O., Fraser, M. P., Rogge, W. F., and Cass, G. R.: Levoglucosan, a tracer for cellulose in biomass burning and atmospheric particles, Atmos. Environ., 33, 173–182, https://doi.org/10.1016/S1352-2310(98)00145-9, 1999.
Smith, B. N. and Epstein, S.: Two Categories of Ratios for Higher Plants, Plant Physiol., 47, 380–384, https://doi.org/10.1104/pp.47.3.380, 1971.
Sullivan, A. P. and Weber, R. J.: Chemical characterization of the ambient organic aerosol soluble in water: 2. Isolation of acid, neutral, and basic fractions by modified size-exclusion chromatography, J. Geophys. Res., 111, D05315, https://doi.org/10.1029/2005jd006486, 2006.
Sullivan, A. P., Weber, R. J., Clements, A. L., Turner, J. R., Bae, M. S., and Schauer, J. J.: A method for on-line measurement of water-soluble organic carbon in ambient aerosol particles: Results from an urban site, Geophys. Res. Lett., 31, L13105, https://doi.org/10.1029/2004gl019681, 2004.
Suto, N. and Kawashima, H.: Online wet oxidation/isotope ratio mass spectrometry method for determination of stable carbon isotope ratios of water-soluble organic carbon in particulate matter, Rapid Commun. Mass Sp., 32, 1668–1674, https://doi.org/10.1002/rcm.8240, 2018.
Timonen, H., Carbone, S., Aurela, M., Saarnio, K., Saarikoski, S., Ng, N. L., Canagaratna, M. R., Kulmala, M., Kerminen, V.-M., Worsnop, D. R., and Hillamo, R.: Characteristics, sources and water-solubility of ambient submicron organic aerosol in springtime in Helsinki, Finland, J. Aerosol Sci., 56, 61–77, https://doi.org/10.1016/j.jaerosci.2012.06.005, 2013.
Tomiyama, H., Tanabe, K., Chatani, S., Kobayashi, S., Fujitani, Y., Furuyama, A., Sato, K., Fushimi, A., Kondo, Y., Sugata, S., Morino, Y., Hayasaki, M., Oguma, H., Ide, R., Kusaka, H., and Takami, A.: Observation for Temporal Open Burning Frequency and Estimation for Daily Emissions caused by Open Burning of Rice Residue, Journal of Japan Society for Atmospheric Environment, 52, 105–117, https://doi.org/10.11298/taiki.52.105, 2017.
Turekian, V. C., Macko, S., Ballentine, D., Swap, R. J., and Garstang, M.: Causes of bulk carbon and nitrogen isotopic fractionations in the products of vegetation burns: laboratory studies, Chem. Geol., 152, 181–192, https://doi.org/10.1016/S0009-2541(98)00105-3, 1998.
Turpin, B. J. and Lim, H.-J.: Species Contributions to PM2.5 Mass Concentrations: Revisiting Common Assumptions for Estimating Organic Mass, Aerosol Sci. Technol., 35, 602–610, https://doi.org/10.1080/02786820119445, 2001.
Uranishi, K., Ikemori, F., Shimadera, H., Kondo, A., and Sugata, S.: Air Quality Simulation of PM2.5 Transboundary Pollution over Northeast Asia Caused by Biomass Burning in Northeast China: A Case Study in Hokkaido, Japan, in Early Spring of 2019, Journal of Japan Society for Atmospheric Environment, 55, 34–49, https://doi.org/10.11298/taiki.55.34, 2020.
Widory, D., Roy, S., Le Moullec, Y., Goupil, G., Cocherie, A., and Guerrot, C.: The origin of atmospheric particles in Paris: a view through carbon and lead isotopes, Atmos. Environ., 38, 953–961, https://doi.org/10.1016/j.atmosenv.2003.11.001, 2004.
Wozniak, A. S., Bauer, J. E., and Dickhut, R. M.: Characteristics of water-soluble organic carbon associated with aerosol particles in the eastern United States, Atmos. Environ., 46, 181–188, https://doi.org/10.1016/j.atmosenv.2011.10.001, 2012a.
Wozniak, A. S., Bauer, J. E., Dickhut, R. M., Xu, L., and McNichol, A. P.: Isotopic characterization of aerosol organic carbon components over the eastern United States, J. Geophys. Res., 117, D13303, https://doi.org/10.1029/2011JD017153, 2012b.
Yamagami, M., Ikemori, F., Nakashima, H., Hisatsune, K., and Osada, K.: Decreasing trend of elemental carbon concentration with changes in major sources at Mega city Nagoya, Central Japan, Atmos. Environ., 199, 155–163, https://doi.org/10.1016/j.atmosenv.2018.11.014, 2019.
Yan, C., Zheng, M., Bosch, C., Andersson, A., Desyaterik, Y., Sullivan, A. P., Collett, J. L., Zhao, B., Wang, S., He, K., and Gustafsson, O.: Important fossil source contribution to brown carbon in Beijing during winter, Sci. Rep., 7, 43182, https://doi.org/10.1038/srep43182, 2017.
Yu, J. Z., Yang, H., Zhang, H., and Lau, A. K. H.: Size distributions of water-soluble organic carbon in ambient aerosols and its size-resolved thermal characteristics, Atmos. Environ., 38, 1061–1071, https://doi.org/10.1016/j.atmosenv.2003.10.049, 2004.
Zhang, W., Zhang, Y.-L., Cao, F., Xiang, Y., Zhang, Y., Bao, M., Liu, X., and Lin, Y.-C.: High time-resolved measurement of stable carbon isotope composition in water-soluble organic aerosols: method optimization and a case study during winter haze in eastern China, Atmos. Chem. Phys., 19, 11071–11087, https://doi.org/10.5194/acp-19-11071-2019, 2019.
Zhang, X. Y., Wang, Y. Q., Zhang, X. C., Guo, W., and Gong, S. L.: Carbonaceous aerosol composition over various regions of China during 2006, J. Geophys. Res., 113, D14111, https://doi.org/10.1029/2007jd009525, 2008.
Zhao, Z., Cao, J., Zhang, T., Shen, Z., Ni, H., Tian, J., Wang, Q., Liu, S., Zhou, J., Gu, J., and Shen, G.: Stable carbon isotopes and levoglucosan for PM2.5 elemental carbon source apportionments in the largest city of Northwest China, Atmos. Environ., 185, 253–261, https://doi.org/10.1016/j.atmosenv.2018.05.008, 2018.