the Creative Commons Attribution 4.0 License.
the Creative Commons Attribution 4.0 License.
 | 05 Aug 2021
PM1 composition and source apportionment at two sites in Delhi, India, across multiple seasons
Ernesto Reyes-Villegas
Upasana Panda
Eoghan Darbyshire
James M. Cash
Rutambhara Joshi
Ben Langford
Chiara F. Di Marco
Neil J. Mullinger
Mohammed S. Alam
Leigh R. Crilley
Daniel J. Rooney
W. Joe F. Acton
Will Drysdale
Eiko Nemitz
Michael Flynn
Aristeidis Voliotis
Gordon McFiggans
James Lee
C. Nicholas Hewitt
Mathew R. Heal
Sachin S. Gunthe
Tuhin K. Mandal
Bhola R. Gurjar
Shivani
Ranu Gadi
Siddhartha Singh
Vijay Soni
James D. Allan
Air pollution in urban environments has been shown to have a negative impact on air quality and human health, particularly in megacities. Over recent decades, Delhi, India, has suffered high atmospheric pollution, with significant particulate matter (PM) concentrations as a result of anthropogenic activities. Organic aerosols (OAs) are composed of thousands of different chemical species and are one of the main constituents of submicron particles. However, quantitative knowledge of OA composition, their sources and their processes in urban environments is still limited. This is important particularly in India, as Delhi is a massive, inhomogeneous conurbation, where we would expect the apportionment and concentrations to vary depending on where in Delhi the measurements/source apportionment is performed, indicating the need for multisite measurements. This study presents the first multisite analysis carried out in India over different seasons, with a focus on identifying OA sources. The measurements were taken during 2018 at two sites in Delhi, India. One site was located at the India Meteorological Department, New Delhi (ND). The other site was located at the Indira Gandhi Delhi Technical University for Women, Old Delhi (OD). Non-refractory submicron aerosol (NR-PM1) concentrations (ammonium, nitrate, sulfate, chloride and organic aerosols) of four aerosol mass spectrometers were analysed. Collocated measurements of volatile organic compounds, black carbon, NOx and CO were performed. Positive matrix factorisation (PMF) analysis was performed to separate the organic fraction, identifying a number of conventional factors: hydrocarbon-like OAs (HOAs) related to traffic emissions, biomass burning OAs (BBOAs), cooking OAs (COAs) and secondary OAs (SOAs).
A composition-based estimate of PM1 is defined by combining black carbon (BC) and NR-PM1 (C-PM1= BC + NR-PM1). No significant difference was observed in C-PM1 concentrations between sites, OD (142 ± 117 µg m−3) compared to ND (123 ± 71 µg m3), from post-monsoon measurements. A wider variability was observed between seasons, where pre-monsoon and monsoon showed C-PM1 concentrations lower than 60 µg m−3. A seasonal variation in C-PM1 composition was observed; SO showed a high contribution over pre-monsoon and monsoon seasons, while NO and Cl− had a higher contribution in winter and post-monsoon. The main primary aerosol source was from traffic, which is consistent with the PMF analysis and Aethalometer model analysis. Thus, in order to reduce PM1 concentrations in Delhi through local emission controls, traffic emission control offers the greatest opportunity. PMF–aerosol mass spectrometer (AMS) mass spectra will help to improve future aerosol source apportionment studies. The information generated in this study increases our understanding of PM1 composition and OA sources in Delhi, India. Furthermore, the scientific findings provide significant information to strengthen legislation that aims to improve air quality in India.
- Article
(2692 KB) - Full-text XML
-
Supplement
(2758 KB) - BibTeX
- EndNote


Air pollution in urban environments has been shown to have a negative impact on human health, particularly in megacities. The World Health Organization (WHO) stated that in 2016 about 90 % of the global population living in urban environments was exposed to particulate matter concentrations exceeding the WHO air quality guidelines (https://www.who.int/gho/phe/air_pollution_pm25_concentrations/en/, last access: 20 June 2019). According to the WHO global air quality database in 2018, Delhi was ranked in 11th position of the cities with high particulate mass, measured as the mass of particles whose size is equal to or lower than 2.5 µm (PM2.5), having an annual average concentration of 143 µg m−3. Other Indian cities are in the top 20 with Varanasi being in first place with a PM2.5 concentration of 217 µg m−3 (https://www.who.int/airpollution/data/cities/en/, last access: 17 June 2019). Previous studies have identified ambient fine particle concentrations, particularly the submicron fraction lower than or equal to 1 µm, to have detrimental effects on health (PM1) (Pope et al., 2002; Ramgolam et al., 2009).
Organic aerosols (OAs) constitute a large proportion of PM1 mass, with fractions between 40 %–60 % in urban environments (Zhang et al., 2007). OAs are composed of thousands of different chemical species and are difficult to study due to a variety of sources and processes. Black carbon (BC), another important component of PM1, is a product of incomplete combustion and is recognised as one of the main climate-forcing components (Bond and Bergstrom, 2006; Lack et al., 2014). Moreover, the WHO, in a health effects of BC report, states that while there is no clear evidence of BC directly affecting human health, it may work as a medium to transport a wide variety of chemical species of varying toxicities (Janssen et al., 2012). BC sources and concentrations have been studied in India (Thamban et al., 2017; Jain et al., 2018a). In 2014, Gupta et al. (2017) studied the seasonal variation in BC in Agra, identifying biomass burning to be the major BC source, especially during winter. The BC mixing state was measured in a clean site (Nainital) and a polluted site (Gurgaon), with average BC concentrations of 1.0 and 11.0 µg m−3, respectively (Raatikainen et al., 2017). In 2016, a BC network in India was initiated with 16 Aethalometers (Laskar et al., 2016); the availability of these instruments allowed the study of BC sources in different environments (Rajesh and Ramachandran, 2017; Kolhe et al., 2018; Nazeer Hussain et al., 2018).
Aerosol mass spectrometer (AMS) instruments (Aerodyne Research, Billerica, MA) have been widely used in different locations around the world to quantify online real-time non-refractory PM1 (NR-PM1) components: OAs, nitrate (NO), sulfate (SO), ammonium (NH) and chloride (Cl−). In India, the first NR-PM1 measurements were taken on campus at the Indian Institute of Technology (IIT) in Kanpur in winter 2011, where OAs were found to contribute 70 % to NR-PM1 concentrations (Chakraborty et al., 2015). Subsequently, a number of studies have been conducted at the same site showing dominance of the OA fraction with substantial contributions from secondary sources (Kumar et al., 2016) and looking at organo-nitrates and OA sources (Chakraborty et al., 2016, 2018) from December 2015 to January 2016, where NR-PM1 measurements helped to analyse the temporal characteristics of brown carbon (Satish et al., 2017). Aircraft measurements during the pre-monsoon and monsoon periods in 2016, covering the NE Bay of Bengal and Indo-Gangetic Plain (IGP) regions, allowed the vertical and horizontal aerosol chemical composition to be studied (Brooks et al., 2019). Recent long-term measurements in Mahabaleshwar (Mukherjee et al., 2018), Bhubaneswar (Kompalli et al., 2020) and New Delhi (Gani et al., 2019) have allowed the study of NR-PM1 seasonal variability.
Receptor modelling tools, such as chemical mass balance, principal component analysis and positive matrix factorisation (PMF), have been used in aerosol source apportionment studies in India (Tiwari et al., 2013; Bhuyan et al., 2018; Jain et al., 2018b; Gadi et al., 2019; Shivani et al., 2019; Jain et al., 2020). PMF has been shown to be a useful tool to determine OA sources from aerosol mass spectrometer measurements across the Northern Hemisphere (Ng et al., 2010). In India, source apportionment studies using PMF have identified different OA sources; for instance, seasonal analysis in 2016–2017 in Mahabaleshwar, a high-altitude site, identified hydrocarbon-like OAs (HOAs), biomass burning OAs (BBOAs) and two different types of oxygenated OA (OOA) as the OA sources (Mukherjee et al., 2018; Singla et al., 2019). Similar OA factors were identified in a recent study performed in New Delhi, with the main OA sources being HOAs, BBOAs, and OOAs from a 1-year analysis (Bhandari et al., 2020).
This work is part of the Atmospheric Pollution and Human Health in an Indian Megacity (APHH-India) programme (https://www.urbanair-india.org/, last access: 5 March 2020). The main objective of the programme is to support research on the sources and emissions of urban air pollution in New Delhi, India; the processes underlying and impacting on these; and how air pollution then impacts on health. In agreement with two of the working packages of the programme (DelhiFlux and PROMOTE), the objectives in this work are
-
to study the aerosol concentrations in a high time resolution in Old Delhi and New Delhi through the year in two different locations
-
to identify the main OA sources and to determine the contribution of primary and secondary OAs
-
to study the interaction of aerosol concentrations with local meteorology
-
to provide information to be used by the modelling community for improvements in the emission inventories, air pollution forecast and source apportionment.
2.1 Site description and meteorology
The measurements were taken during 2018 at two sites in Delhi, India. One site was located at the Indian Meteorological Department (IMD), Mausam Bhawan, Lodhi Road, New Delhi, lat 28.588, long 77.217, hereafter ND. The other site was located at the Indira Gandhi Delhi Technical University for Women (IGDTUW) at New Church Rd, Kashmere Gate, Old Delhi, lat 28.664, long 77.232, hereafter OD. Section S1 in the Supplement shows the site locations.
The meteorology in India is highly influenced by the monsoon season, which takes places between June and September and is characterised by an increase in precipitation (Turner et al., 2019). Recent long-term measurements in Mahabaleshwar (Mukherjee et al., 2018) and New Delhi (Gani et al., 2019) have identified a clear pattern over the pre-monsoon, monsoon and post-monsoon seasons. Airborne measurements have been used to study the monsoon progression across the Indo-Gangetic Plain region and its impacts on aerosol characteristics (Brooks et al., 2019). In the present study, temperature showed a wide range of variability; winter was cool with an average temperature of 20 ∘C, whereas pre-monsoon, monsoon and post-monsoon seasons were characterised by average temperatures of 36, 31 and 25 ∘C, respectively (Fig. 1). As expected, relative humidity (RH) showed the highest average over the monsoon season (76 %) compared to the other seasons which had RH lower than 60 %. Similar temperatures have been previously observed by Brooks et al. (2019) with 31 ∘C pre-monsoon and 22 ∘C in the monsoon season as well as by Gani et al. (2019) with temperatures between 10–20 ∘C in winter, 25–40 ∘C pre-monsoon and 25–35 ∘C in the monsoon season. Figure S3 in the Supplement shows box plots of temperature, wind speed and RH for the different seasons.
2.2 Instrumentation
Four Aerodyne aerosol mass spectrometers were deployed across the different seasons in 2018 (Table 1): one aerosol chemical speciation monitor (ACSM) (Ng et al., 2011), one compact time-of-flight aerosol mass spectrometer (cToF-AMS) (Drewnick et al., 2005) and two high-resolution time-of-flight AMSs (HR-ToF-AMSs) (DeCarlo et al., 2006). The principle of operation of aerosol mass spectrometer instruments has been widely explained in previous publications; in general, these instruments quantify real-time concentrations of NR-PM1 (OAs, NO, SO, NH and Cl−) by vaporising the aerosols at 600 ∘C with electron impact ionisation at 70 eV and final detection in the mass spectrometer. The main difference between the instruments used in this study is the mass spectrometer, with differences in the sensitivity and the mass-to-charge () resolution. However, all are reliable instruments and successful intercomparisons with parallel measurements have been performed in previous studies (Ng et al., 2011; Crenn et al., 2015). In this study, the cToF-AMS and the HR-AMS agree to within 21 % from parallel ambient measurements in OD during the pre-monsoon season (Fig. S7). Previous comparisons of AMS instruments have shown agreement between instruments of between 19 % and 50 %, and 35 % is widely recommended as the absolute accuracy of AMS instruments (DeCarlo et al., 2008; Dunlea et al., 2009; Bahreini et al., 2009; Crenn et al., 2015; Shinozuka et al., 2020). Section S2 shows the calibrations and quality assurance analysis performed for the AMS measurements. The measurements in PostM_OD_T and PostM_ND_T (see Table 1 for definitions) were taken from a height of 32 m from a tower (T). The tower was used to perform eddy-covariance flux measurements, which will be reported elsewhere. The rest were ground-based measurements (∼ 3 m high). All set-ups included a PM2.5 cyclone to cut particle size and a drier to reduce humidity. The AMS measurements during the Diwali festival (7 November) for the period PostM_ND_T_C were lost due to a power cut; thus this special episode was removed from the NR-PM1 analysis.
Table 1Measurement dates and instrumentation. Winter (Win), pre-monsoon (PreM), monsoon (Mon) and post-monsoon (PostM). New Delhi (ND) and Old Delhi (OD) sites. ACSM (A), two HR-ToF-AMS instruments (H1 and H2), cToF-AMS (C). Eddy-covariance flux measurements tower (T).
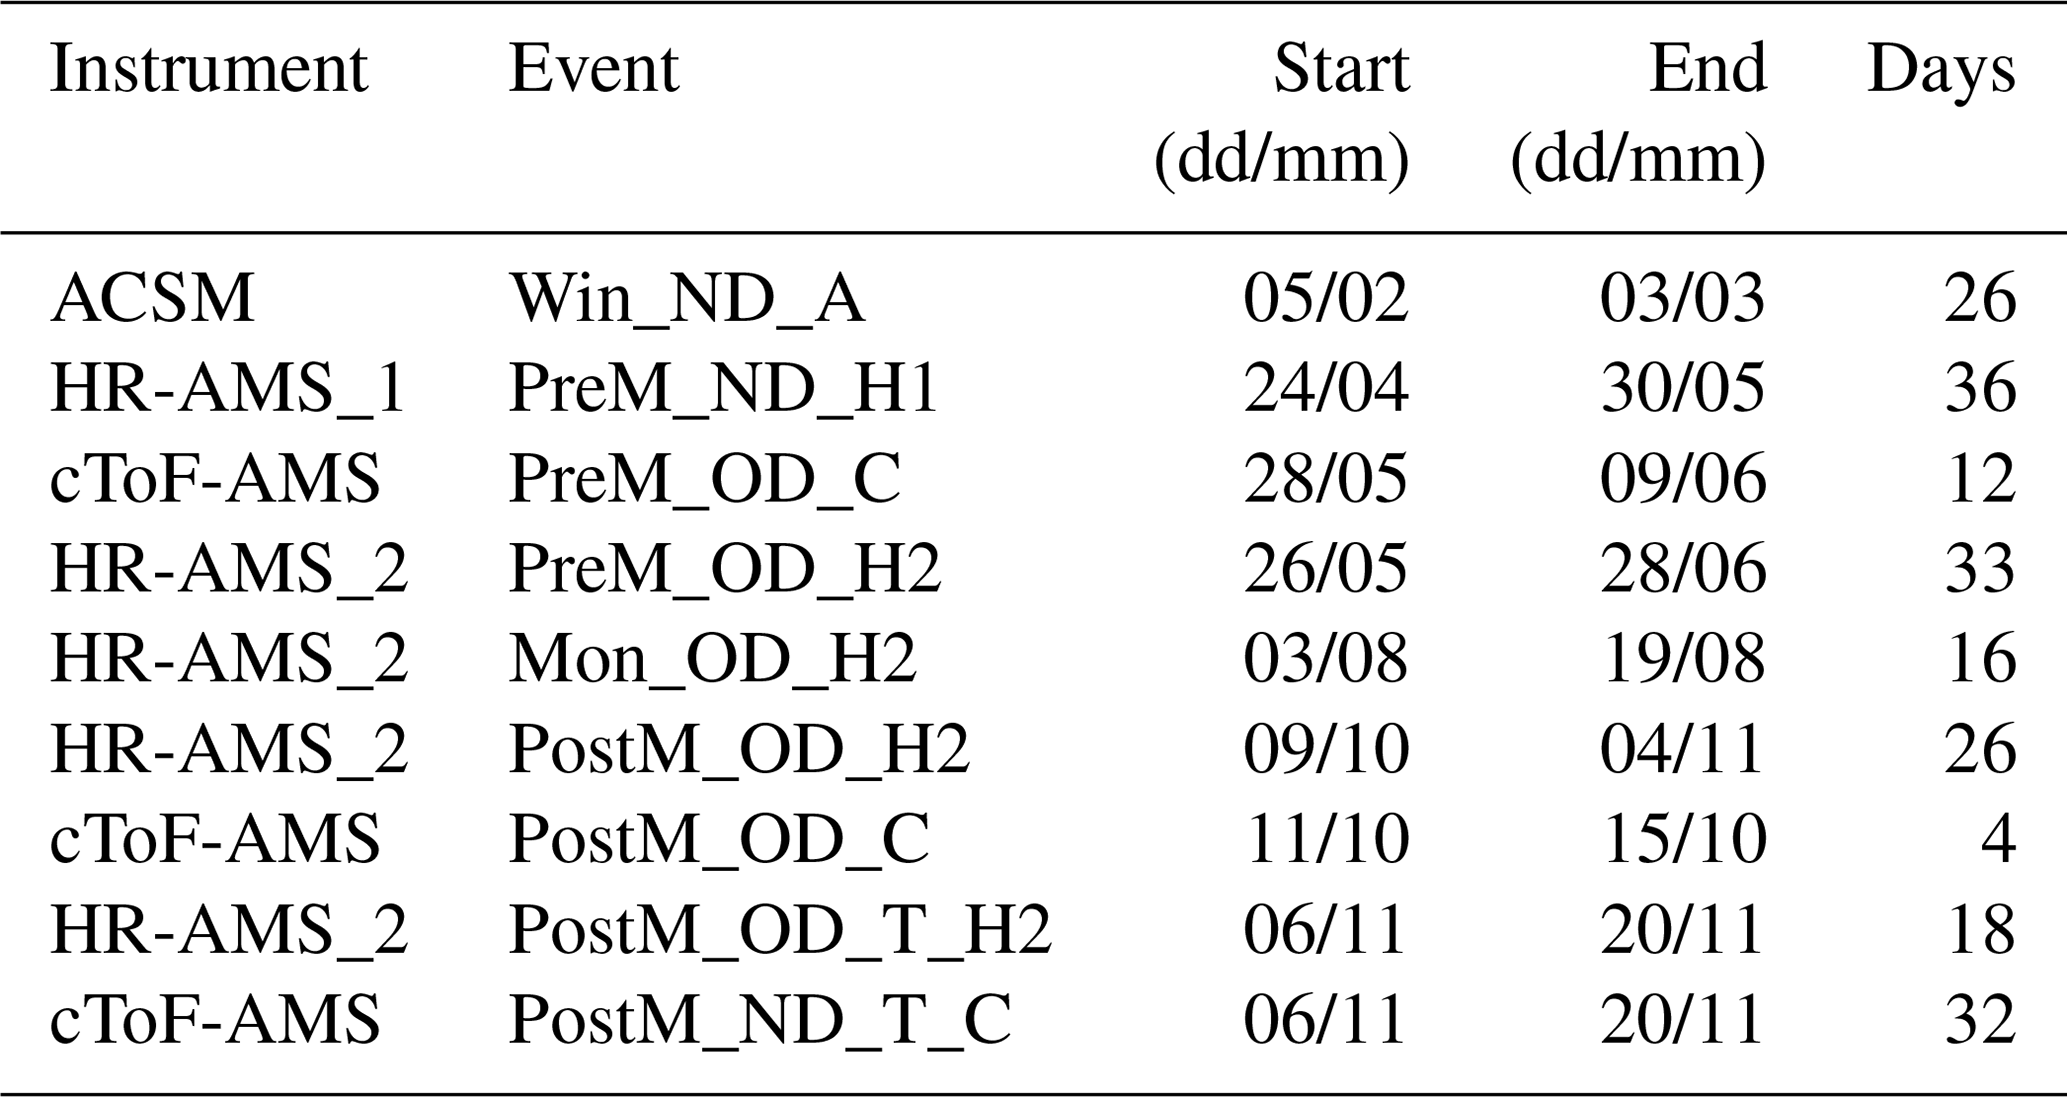

Figure 1Box plots with (a) planetary boundary layer height (PBLH), (b) temperature, (c) relative humidity and (d) wind speed for the different seasons. The marker represents the mean.
Other instruments used along with the mass spectrometers include two Aethalometers (Magee Scientific, one model AE31 and one model AE33) and one multi-angle absorption photometer (MAAP; Thermo Fisher Scientific) (Petzold et al., 2002). Table 1 shows details about the instrument locations and sampling periods, and Table S1 presents the instruments collocated with the mass spectrometers. Meteorology data, apart from planetary boundary layer height (PBLH), were downloaded from https://ncdc.noaa.gov/ (last access: 5 January 2019) at 1-hourly resolution. PBLH data were sourced from ECMWF ERA5 0.25∘ results at a 1 h resolution.
PMF (Paatero et al., 2002) was used to identify potential sources of OAs, based on the source finder tool, SoFi 4.8 (Canonaco et al., 2013). Section S3 in the Supplement provides detailed information about the criteria to select the OA factors. The PMF analysis of the OD_H2 measurements presented in this work was performed by Cash et al. (2021) for the complete dataset (26 May–20 November) using high-resolution organic mass spectra. The PMF analysis of the PreM_ND_H1 dataset was performed with unit mass resolution data. BC concentrations measured with the Aethalometer AE-31 were corrected following the Weingartner method (Weingartner et al., 2003) and using the SP2 (single particle soot photometer) as a reference BC measurement. The Aethalometer model was applied, following the Sandradewi method (Sandradewi et al., 2008), to Aethalometer measurements, both AE-31 and AE-33, to identify the contribution of biomass burning and fossil fuel to BC concentrations. Section S4 in the Supplement shows the BC data processing.
3.1 Aerosol concentrations and composition
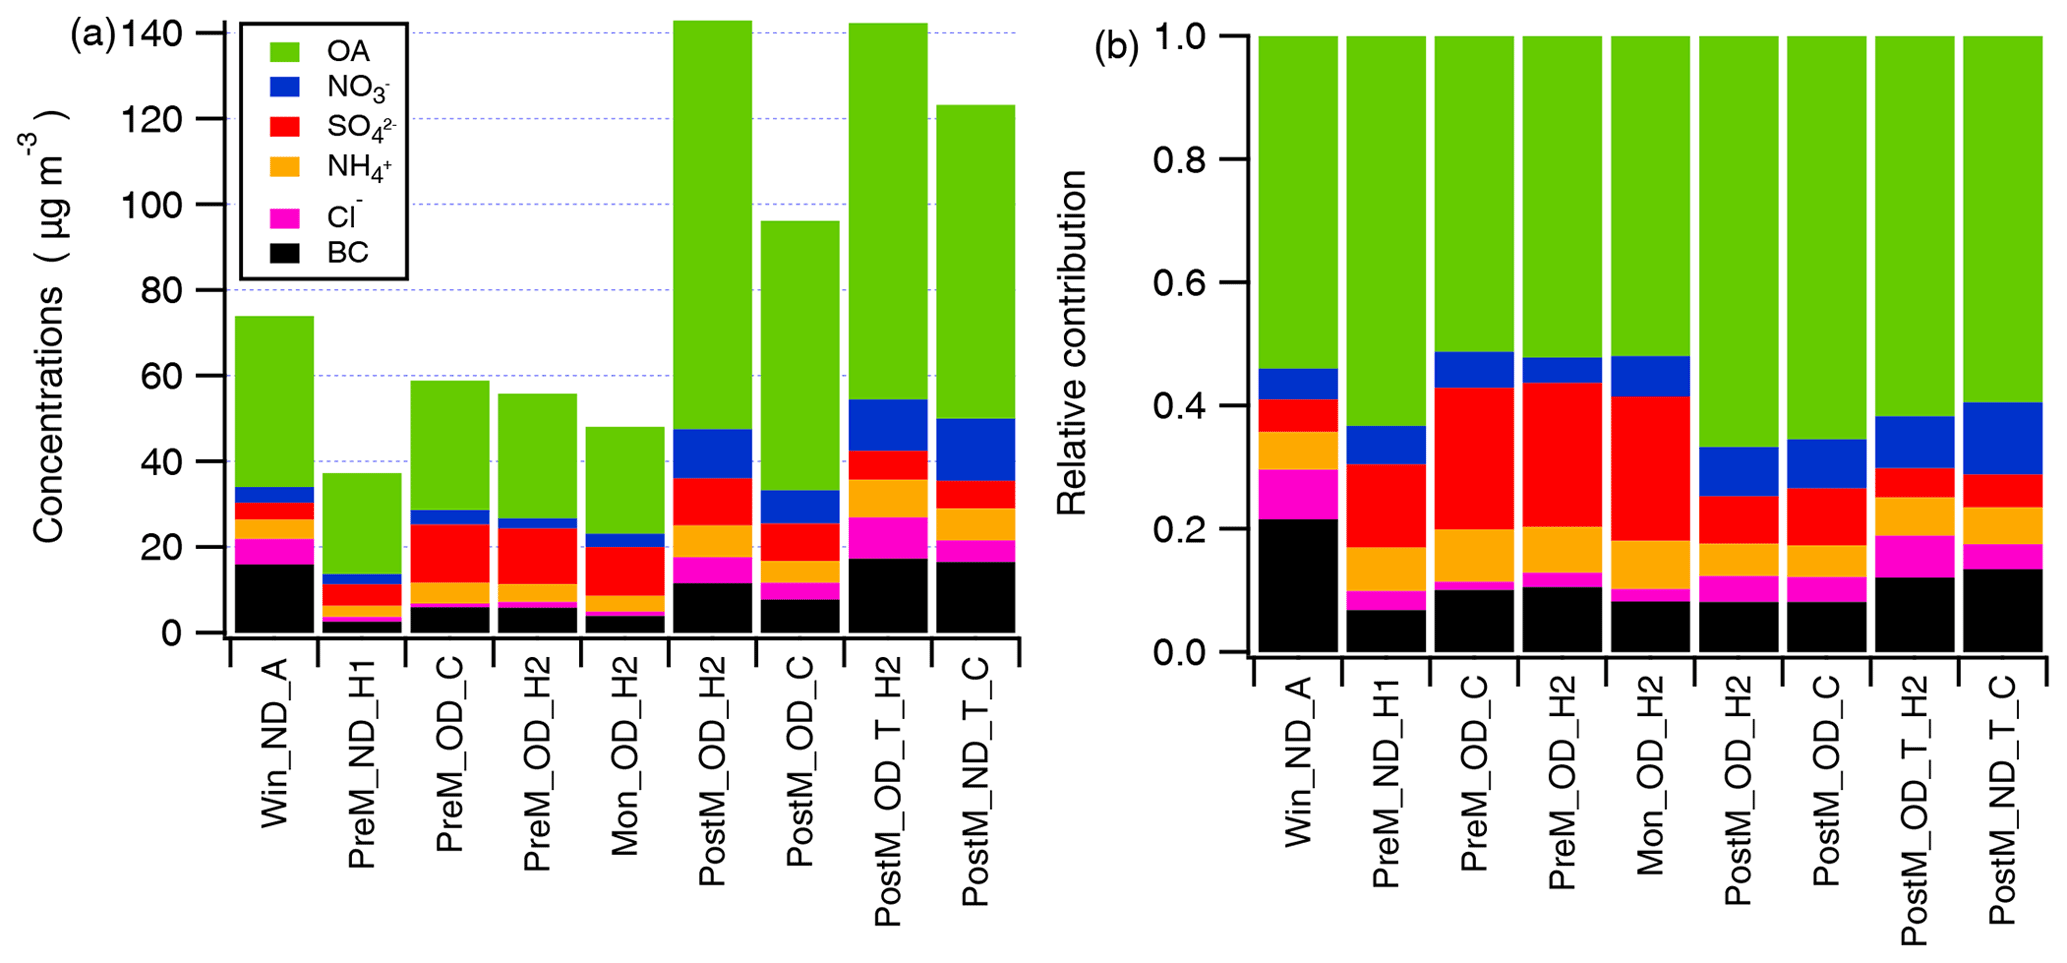
Aerosol measurements were taken in OD and ND over different seasons in 2018. The highest concentrations were observed in the post-monsoon season, where OA concentrations of 400 µg m−3 were found (Fig. S8). Lower aerosol concentrations were observed in the monsoon season, where OAs reached between 80–200 µg m−3. Similarly to Gani et al. (2019), we combine BC and NR-PM1 concentrations to develop a composition-based estimate of PM1 (C-PM1= BC + NR-PM1). The season with the highest averaged C-PM1 concentrations was observed in PostM-OD, with average concentrations (± SD) of 142 ± 117 µg m−3 in PostM_OD_T_H2 (Fig. 2a). Lower aerosol concentrations were observed in pre-monsoon and seasons with C-PM1 average concentrations lower than 40 µg m−3 in PreM_ND_H1 and Mon_OD_H2, with OAs being the component with the leading contributor to PM1.
Measurements during the post-monsoon season were taken in OD (PostM_OD_T_H2) and ND (PostM_ND_T_C) at the same time (6–20 November). This comparison shows average C-PM1 concentrations in OD were slightly higher (142 ± 117 µg m−3) compared to ND (123 ± 71 µg m−3). It is worth mentioning that, while removing the Diwali festival as a special event, the measurements shown in this work still include high concentrations from festivities that took place before and after the Diwali festival on 7 November. The ND site is located in an affluent residential green area, where the transit of heavy good vehicles is controlled; thus, it could be expected that the use of fireworks is also restricted here, whereas in OD, there is less control of the firework activities. While no significant differences were observed when comparing between sites, a clear difference between seasons was observed; the pre-monsoon and monsoon seasons had similar C-PM1 concentrations lower than 60 µg m−3, while post-monsoon C-PM1 concentrations were higher than 120 µg m−3. Detailed statistical analysis for NR-PM1 and BC is presented in Table S3.
OAs make the main relative contribution to PM1 with values of 0.45–0.62 followed by BC with values of 0.13–0.24 (Fig. 2b). This high relative contribution of OAs has been observed in previous studies in India (Bhandari et al., 2020; Singla et al., 2019). The high BC contributions of around 18 % suggest an important contribution from primary sources. Sulfate made a higher contribution in pre-monsoon and monsoon seasons, while NO and Cl− had a higher contribution in winter and post-monsoon, similarly to a previous study performed in Delhi (Gani et al., 2019).
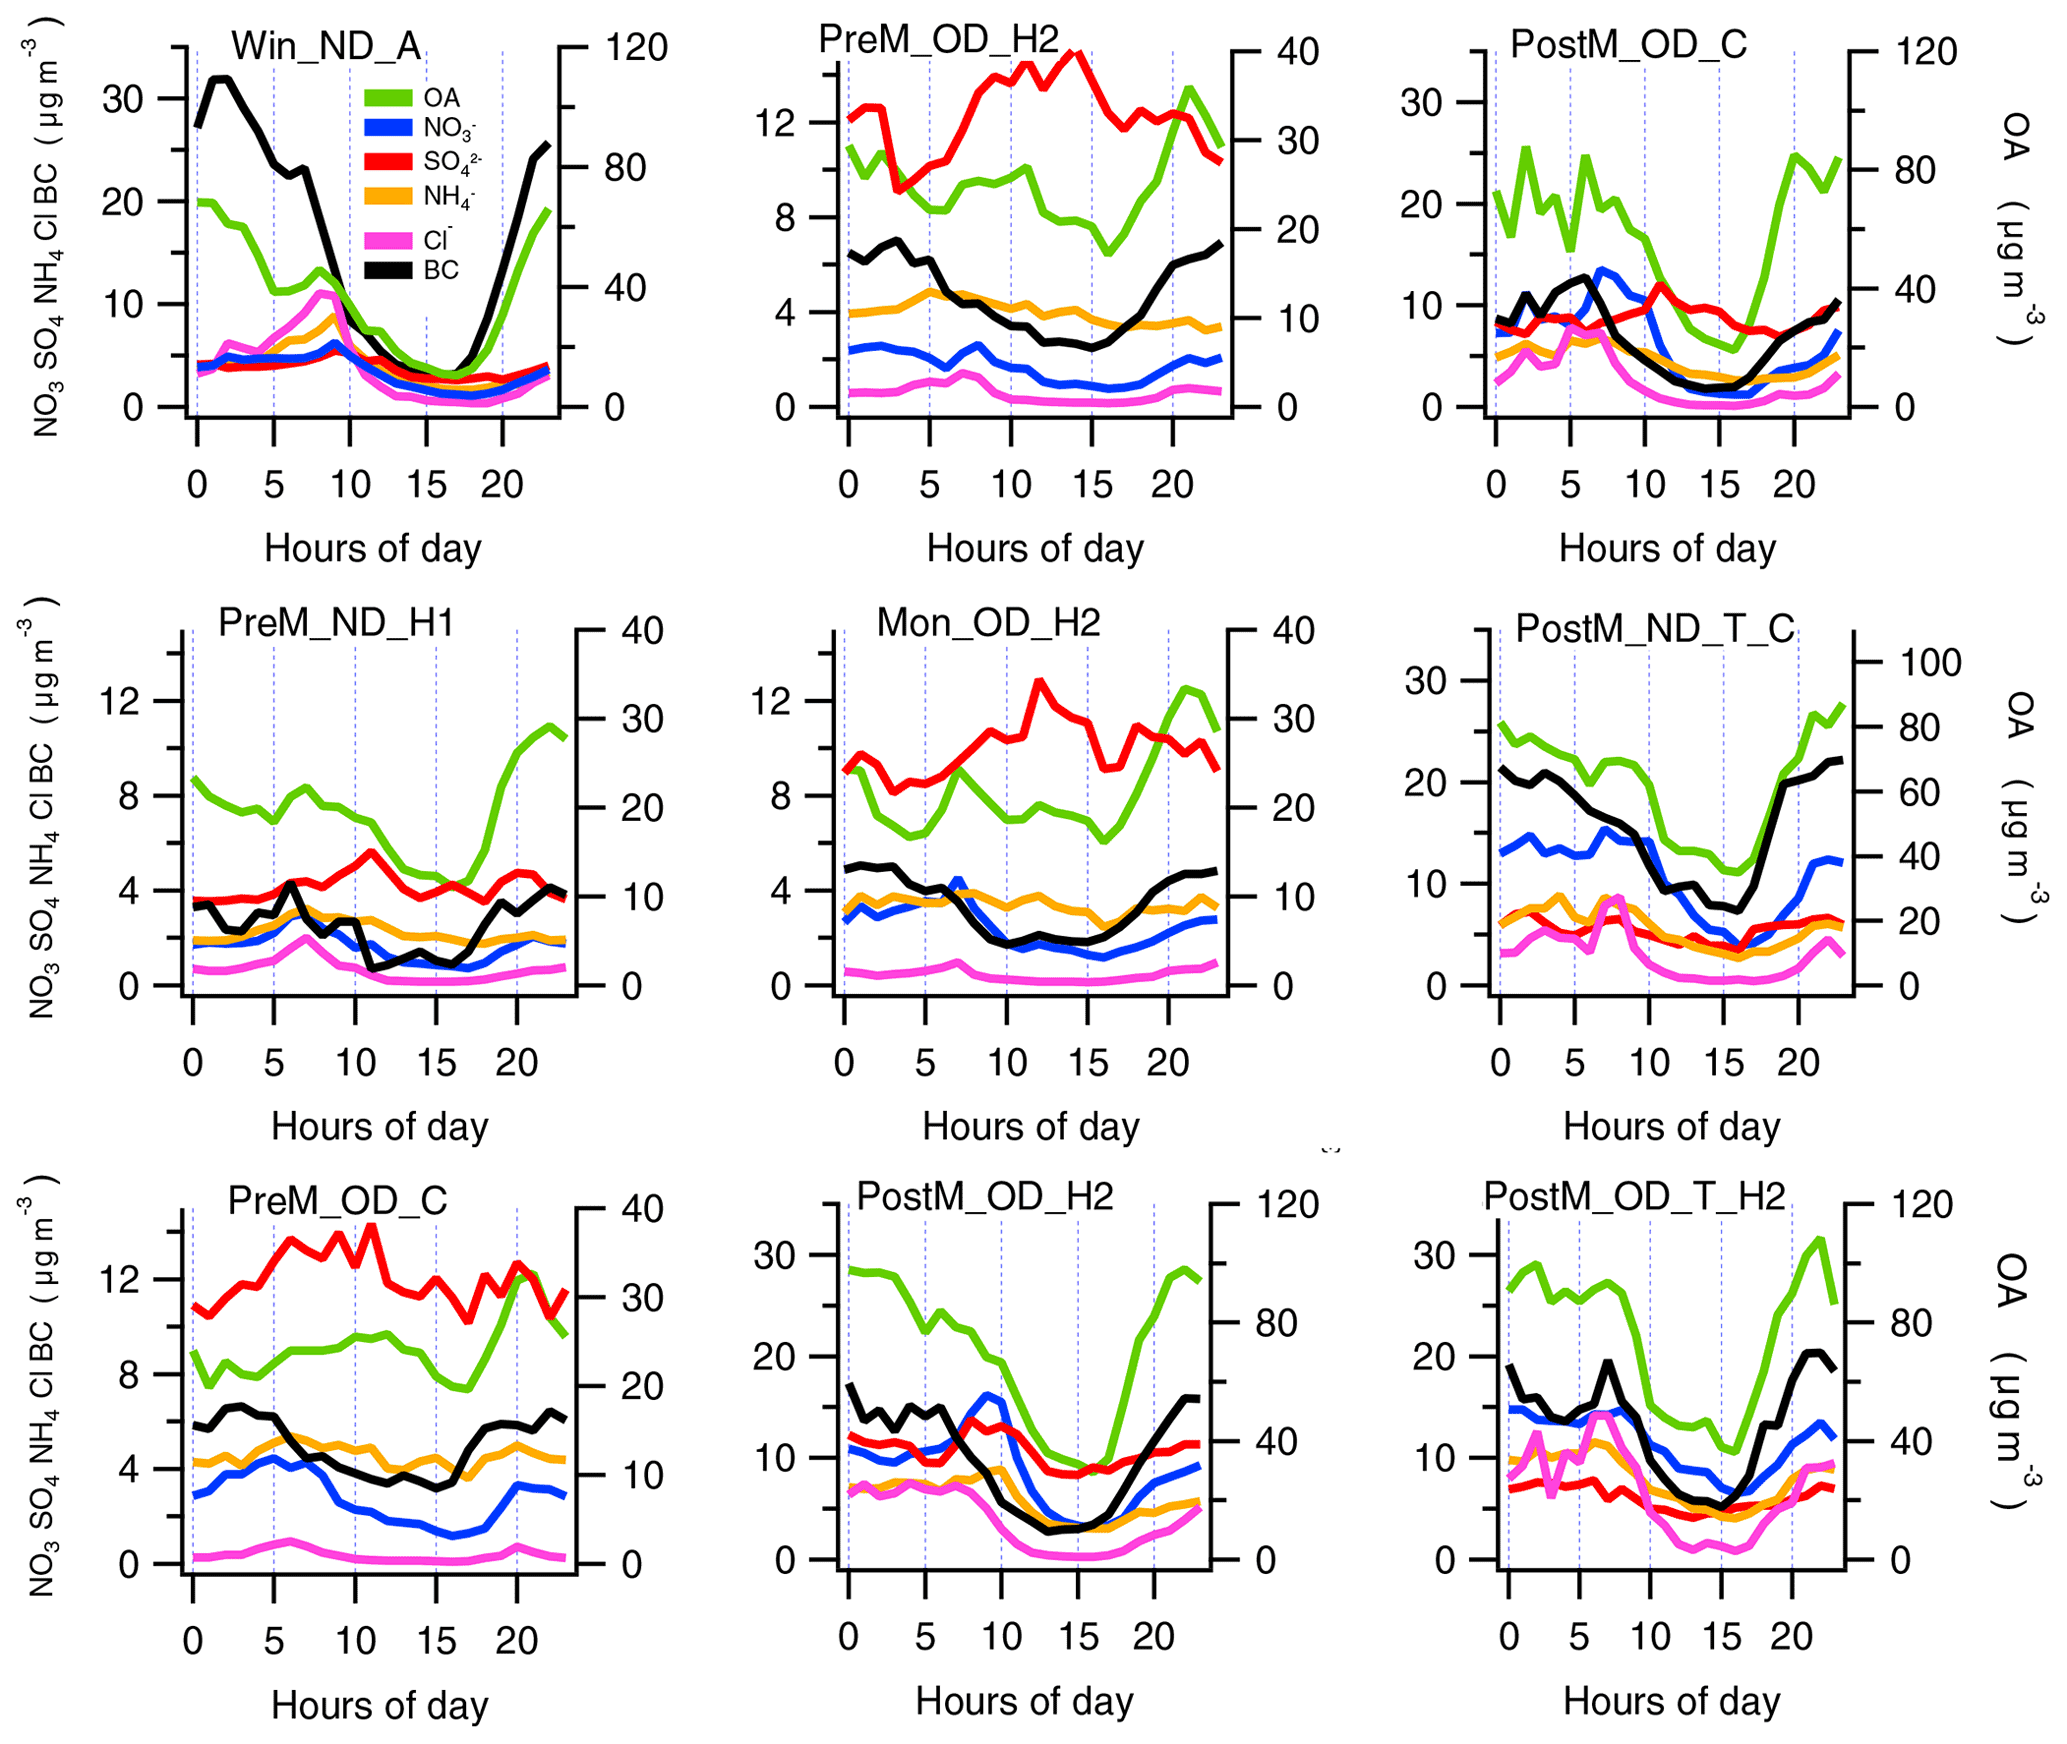
This wide range of concentrations is related to the meteorological conditions (Fig. 1), mainly with boundary layer height as a result of changes in temperature; winter and PostM-T had a temperature of 20–25 ∘C, resulting in wind speeds of 2.5–3.0 m s−1, which may have resulted in a more stable mixing layer, accumulating aerosol concentrations. In the early pre-monsoon season, an average temperature of 35 ∘C with wind speeds of 3.5 m s−1 facilitated greater aerosol dispersion. From the diurnal cycles (Fig. 3), it can be seen that NO and Cl− showed high concentrations during the morning while BC and OAs showed high concentrations at night. SO showed less diurnal variability, suggesting a regional origin with large sources at midday when the photochemistry takes place compensating for the boundary layer effect. BC is an aerosol constituent related to primary emissions, fossil fuel (mainly traffic) and biomass burning (Sandradewi et al., 2008); hence the fact that OA had a diurnal pattern similar to BC during the post-monsoon season suggests OAs were potentially dominated by primary sources, while in the pre-monsoon season, OAs showed an increase in concentrations during the day, suggesting a larger contribution from secondary OAs (Shrivastava et al., 2017). This primary–secondary origin of OAs will be analysed in the next section.
3.2 Source apportionment of the organic aerosols
Organic aerosols are composed of thousands of chemical species, making source attribution challenging. Methods using receptor modelling tools such as PMF are often employed to deconvolve OAs into various OA factors that, depending on their composition and temporal variations, can be attributed to potential OA sources. In this work a number of factors were identified with PMF analysis (Fig. 4); three common factors were found in all the seasons, hydrocarbon-like OAs (HOAs), biomass burning OAs (BBOAs) and more oxidised oxygenated OAs (MO-OOAs). Other identified sources were cooking OAs (COAs), less oxidised oxygenated OAs (LO-OOAs) and oxygenated primary OAs (oPOAs). HOAs are related to fossil fuel emissions, mainly attributed to traffic, whose mass spectrum is characterised by peaks at a mass-to-charge ratio () of 55 and 57 and which are dominated by the CxH family (Zhang et al., 2005). BBOAs are characterised by 60 (C2H4O+) which is related to anhydrosugar fragments, such as levoglucosan (Alfarra et al., 2007). The mass spectrum of COAs presents peaks at 55 and 57, similarly to the HOA spectrum but with a lower peak at 57 (Allan et al., 2010; Mohr et al., 2012). The two oxygenated OA (OOA) factors identified MO-OOAs and LO-OOAs. MO-OOAs have a dominant peak at 44 (CO), and LO-OOAs typically have a peak at 44 and a larger peak at 43 (mostly C2H) compared to MO-OOA (Zhang et al., 2011).
The HOA mass spectrum was consistent across the collection periods and between the different instruments deployed, with peaks at ratios of 41, 43, 55 and 57, and its diurnal cycle showed high concentrations in the morning and at night resulting from the traffic rush hour. Moreover, HOAs showed their highest concentrations during periods of low wind speeds (Fig. S19) and shallow boundary layers, highlighting the importance of HOA as a primary local source: even a small local source emitting into a shallow nocturnal boundary-layer can result in significant accumulation of concentrations. The MO-OOA mass spectrum is also consistent over all the seasons with peaks at 18 and 44; its diurnal cycle shows the highest concentrations to have been at around 10:00 to 15:00 (all times are in Indian standard time), suggesting a relation to the stronger radiation occurring at that time, resulting in secondary aerosol production from photochemistry. We can observe larger variability in the BBOA mass spectra, with changes to the peak at 60, which has a higher relative intensity over the post-monsoon and winter seasons. oPOAs, which show peaks at at 43 and 44, have a characteristic diurnal pattern with high concentrations around 09:00. While the mass spectrum resembles that of OOAs, the diurnal cycle behaved differently to those of LO-OOAs and MO-OOAs. A more detailed analysis about the possible origin of oPOAs will be provided in the next section. COAs were identified over the pre-monsoon and post-monsoon seasons but not in PostM_ND_T or during winter. Moreover, previous studies in urban environments have identified a lunch peak in the diurnal plots (Allan et al., 2010; Young et al., 2015). However, this peak was not clearly observed in any of the seasons where COAs were identified. Perhaps, the high OA concentrations resulting from the other anthropogenic emissions, i.e. traffic and biomass burning along with the boundary layer effect, would favour the mixing of OA sources and PMF would struggle to completely separate the OA sources (Lanz et al., 2008).

Figure 4Mass spectra and diurnal plots of OA factors from PMF analysis in the different periods. Here the period all_OD_H2 is displayed to compare with the other periods. The period all_OD_H2, which shows the high-resolution PMF analysis performed with the complete dataset of the AMS instruments (H2) 26 May–23 November 2018, is analysed in detail by Cash et al. (2021). Detailed analysis of the all_OD_H2 dataset is presented in Table S4, where the PMF analysis identified seven factors, adding HOA = HOA + nHOA and BBOA = SFOA + SVBBOA to compare with our five-factor solutions.
4.1 The role of meteorology in aerosol concentrations
The meteorology in India has been summarised in Sect. 2.1, stating the impact of the monsoon season and the difference between pre-monsoon and post-monsoon. This work allowed the study of NR-PM1 seasonal variability, which showed strong variations through the seasons (Fig. 2), where a seasonal cycle was observed with high aerosol concentrations post-monsoon and in winter with low temperatures. From the previous diurnal plots in winter_ND (Fig. 3), high Cl− concentrations were observed in the morning. PMF analysis performed on this dataset also identified a factor referred to as oPOAs with a morning peak (Fig. 4a). Figure 5 shows the diurnal trends of Cl− and oPOAs along with meteorology parameters. Both Cl− and oPOAs peak at around 09:00, at the time when RH shows its highest value, and their concentrations start decreasing when the PBLH starts increasing at around 10:00. This decrease in Cl− and oPOA concentrations is perhaps due to mixing with fresh air masses from the break-up of the boundary layer; moreover, it is likely that the Cl− reduction is due to some repartitioning into the gas phase as temperature increases. NH4Cl has a higher vapour pressure than NH4NO3 and will dissociate first. This is also consistent with the decrease on Cl− concentrations before NO3− concentrations increase in the morning. The same high Cl− concentrations were observed by Chakraborty et al. (2018) in NR-PM1 measurements taken during September–October 2014 in Kanpur, India, where similar meteorological conditions were present. This indicates the impact RH, PBLH and temperature have on Cl− and oPOA concentrations. Figure S20 shows Cl− and oPOA have different sources; it can be observed that Cl− follows the trend of NH, which is expected as the AMS is sensitive mainly to NH4Cl but not to other Cl− compounds, and oPOAs follow the same pattern as SO. It is possible that the properties of the condensed material in oPOAs may be similar to the assumed NH4Cl, even though the sources are different; i.e. both have a similar volatility. A more detailed analysis on the Cl− processes is performed by Gunthe et al. (2021), where the ACSM_Winter data are part of the analysed datasets.
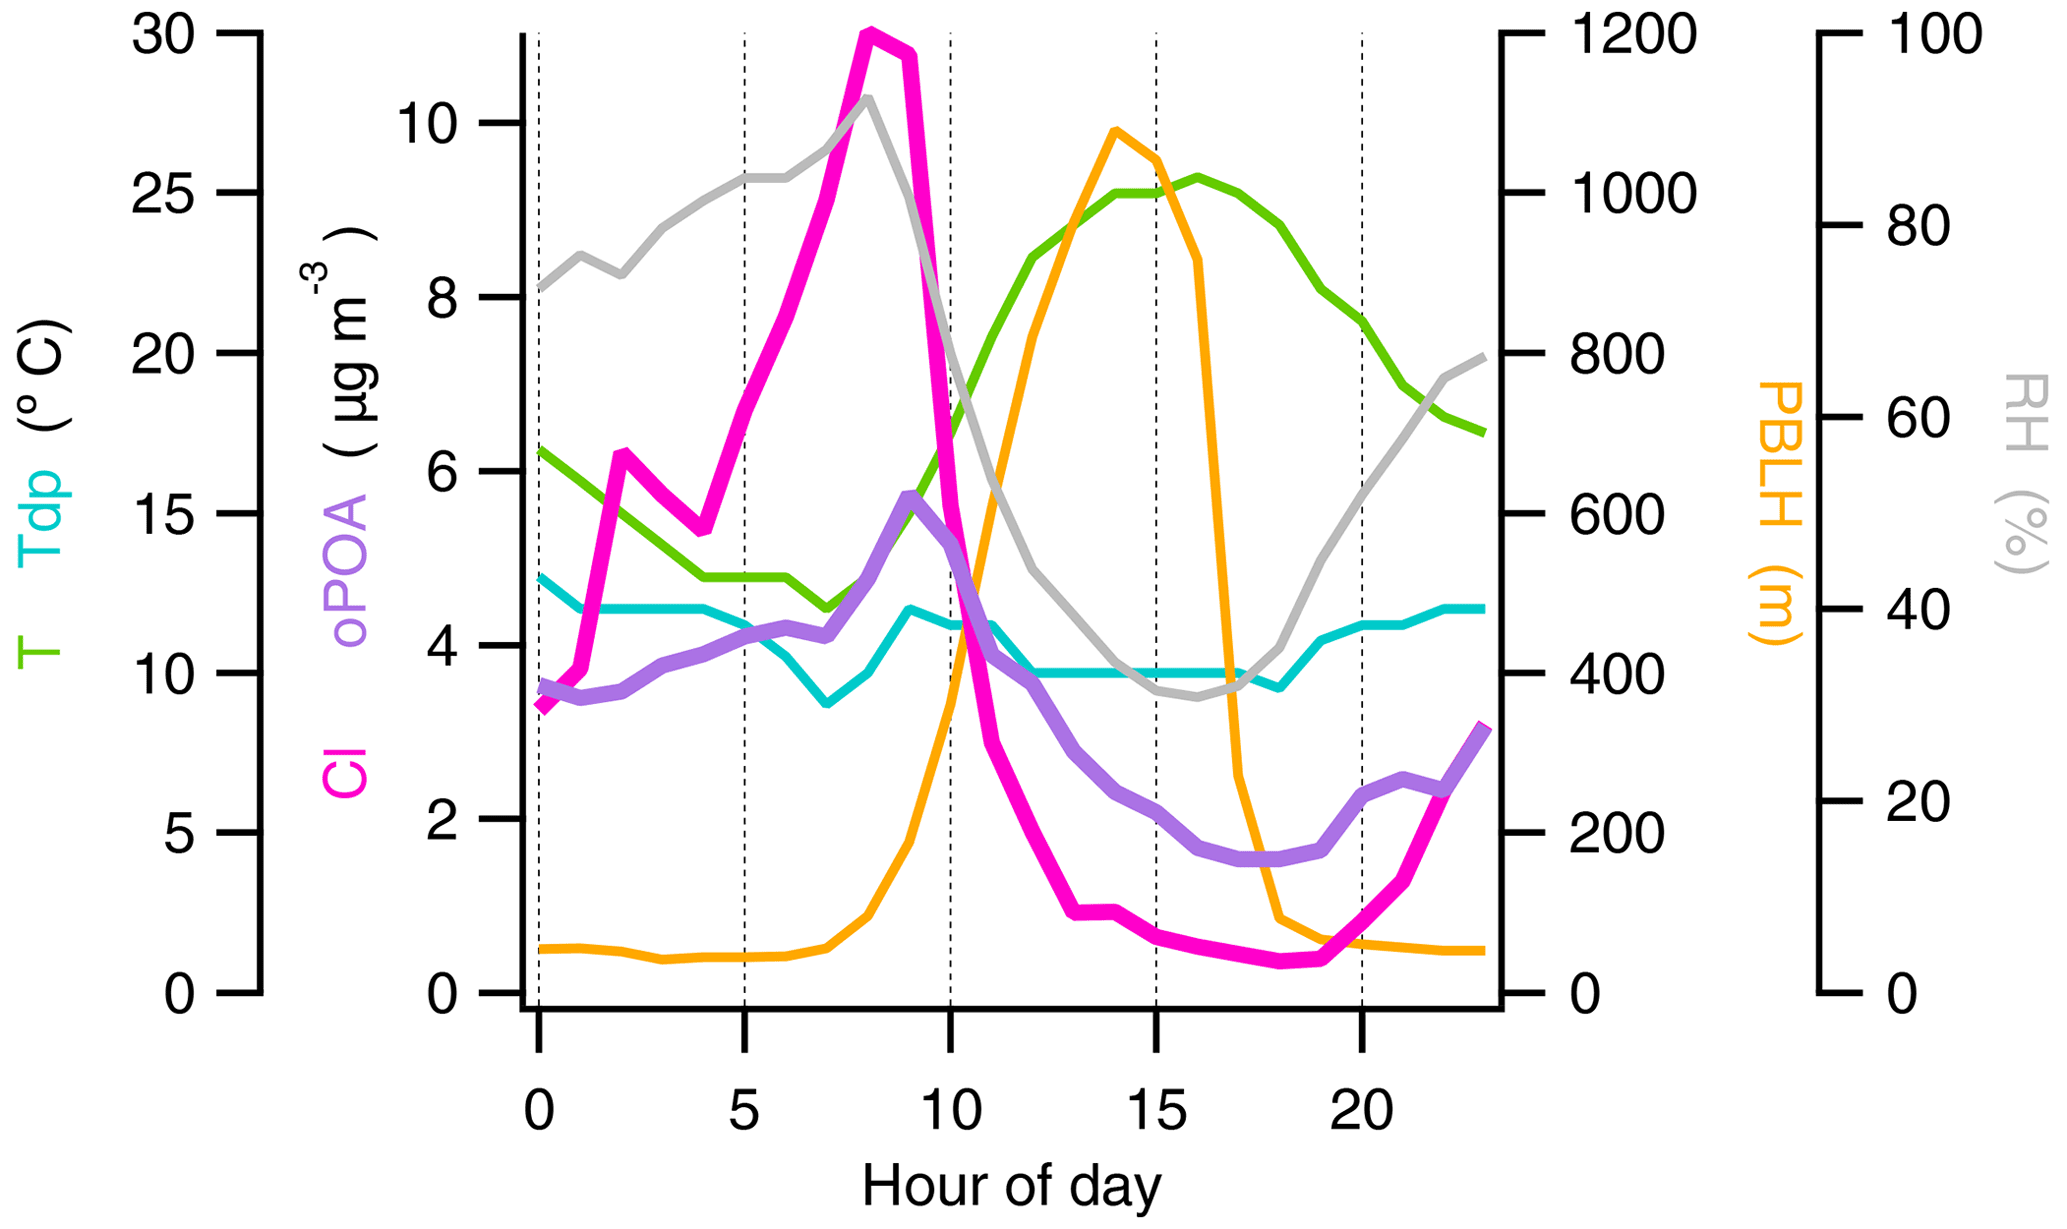
Figure 5Diurnal median values of meteorological parameters, Cl− and oPOA concentrations in Winter_ND.
4.2 Organic aerosol sources and their contribution to NR-PM1
Seasonal dependencies of the PMF factors can be investigated by looking at their average contributions (Fig. 6). HOAs comprise the factor with the highest concentration with 6.0–55.0 µg m−3 for pre-monsoon and post-monsoon, respectively, in the PostM_OD_H2 dataset (Table S4), HOA concentrations of 30 µg m−3 were identified. These HOA concentrations represent a relative contribution to OA sources of 20 % to 50 %. Traditionally, HOAs have been related mainly to traffic emissions of vehicles using petrol or diesel (Zhang et al., 2005; Platt et al., 2017). However, in Delhi, compressed natural gas vehicles and generators might also contribute to HOA concentrations (Prakash et al., 2020). It is interesting to see that BBOAs have low concentrations (2.0–8.0 µg m−3) in the ND and pre-monsoon seasons with a low contribution to OA sources (0.10–0.15). However, Cash et al. (2021), in the PostM_OD_T_H2 analysis, identified a BBOA average concentration of 48.22 µg m−3, representing a relative contribution of 25 %. COAs are an important primary source in OD, with average concentrations of 2.0–12.0 µg m−3. It is worth mentioning that COA concentrations might be overestimated due to a potentially higher relative ionisation efficiency, which has been observed previously in a laboratory experiment (Reyes-Villegas et al., 2018). Considering HOAs, BBOAs and COAs as primary OAs (POAs) and the rest of the sources as OOAs and looking at the POA relative contribution to OA concentrations (Fig. 6d), there is a more constant concentration in ND with values between 54 %–56 %, while POA relative contributions in OD range between 46 %–66 %. These POA relative contributions close to 50 % over different times of the year have been previously observed in a study performed in 2017 at IIT Delhi, New Delhi (Bhandari et al., 2020), with similar average concentrations for POAs and OOAs (52 and 56 µg m−3, respectively, for winter as well as 30 and 31 mug m−3, respectively, for pre-monsoon). Cash et al. (2021) identified POA relative contributions of 45 % and 52 % for pre-monsoon and monsoon and 64 % for post-monsoon, showing the importance of POA concentrations in OD during this latter season. OOA concentrations are produced by both POAs and precursor gas. In other urban environments, it is possible to see a more variable POA OOA ratio contribution to OA concentrations (Jimenez et al., 2009). For instance, in London, UK, in 2012 POA contributions ranged from 80 % in winter to 45 % in summer (Young et al., 2015), perhaps as a result of the lower temperatures during winter compared to summer along with less photochemistry in winter at higher altitudes. These findings demonstrate the impact primary PM1 emissions in Delhi have on OA concentrations over the year.
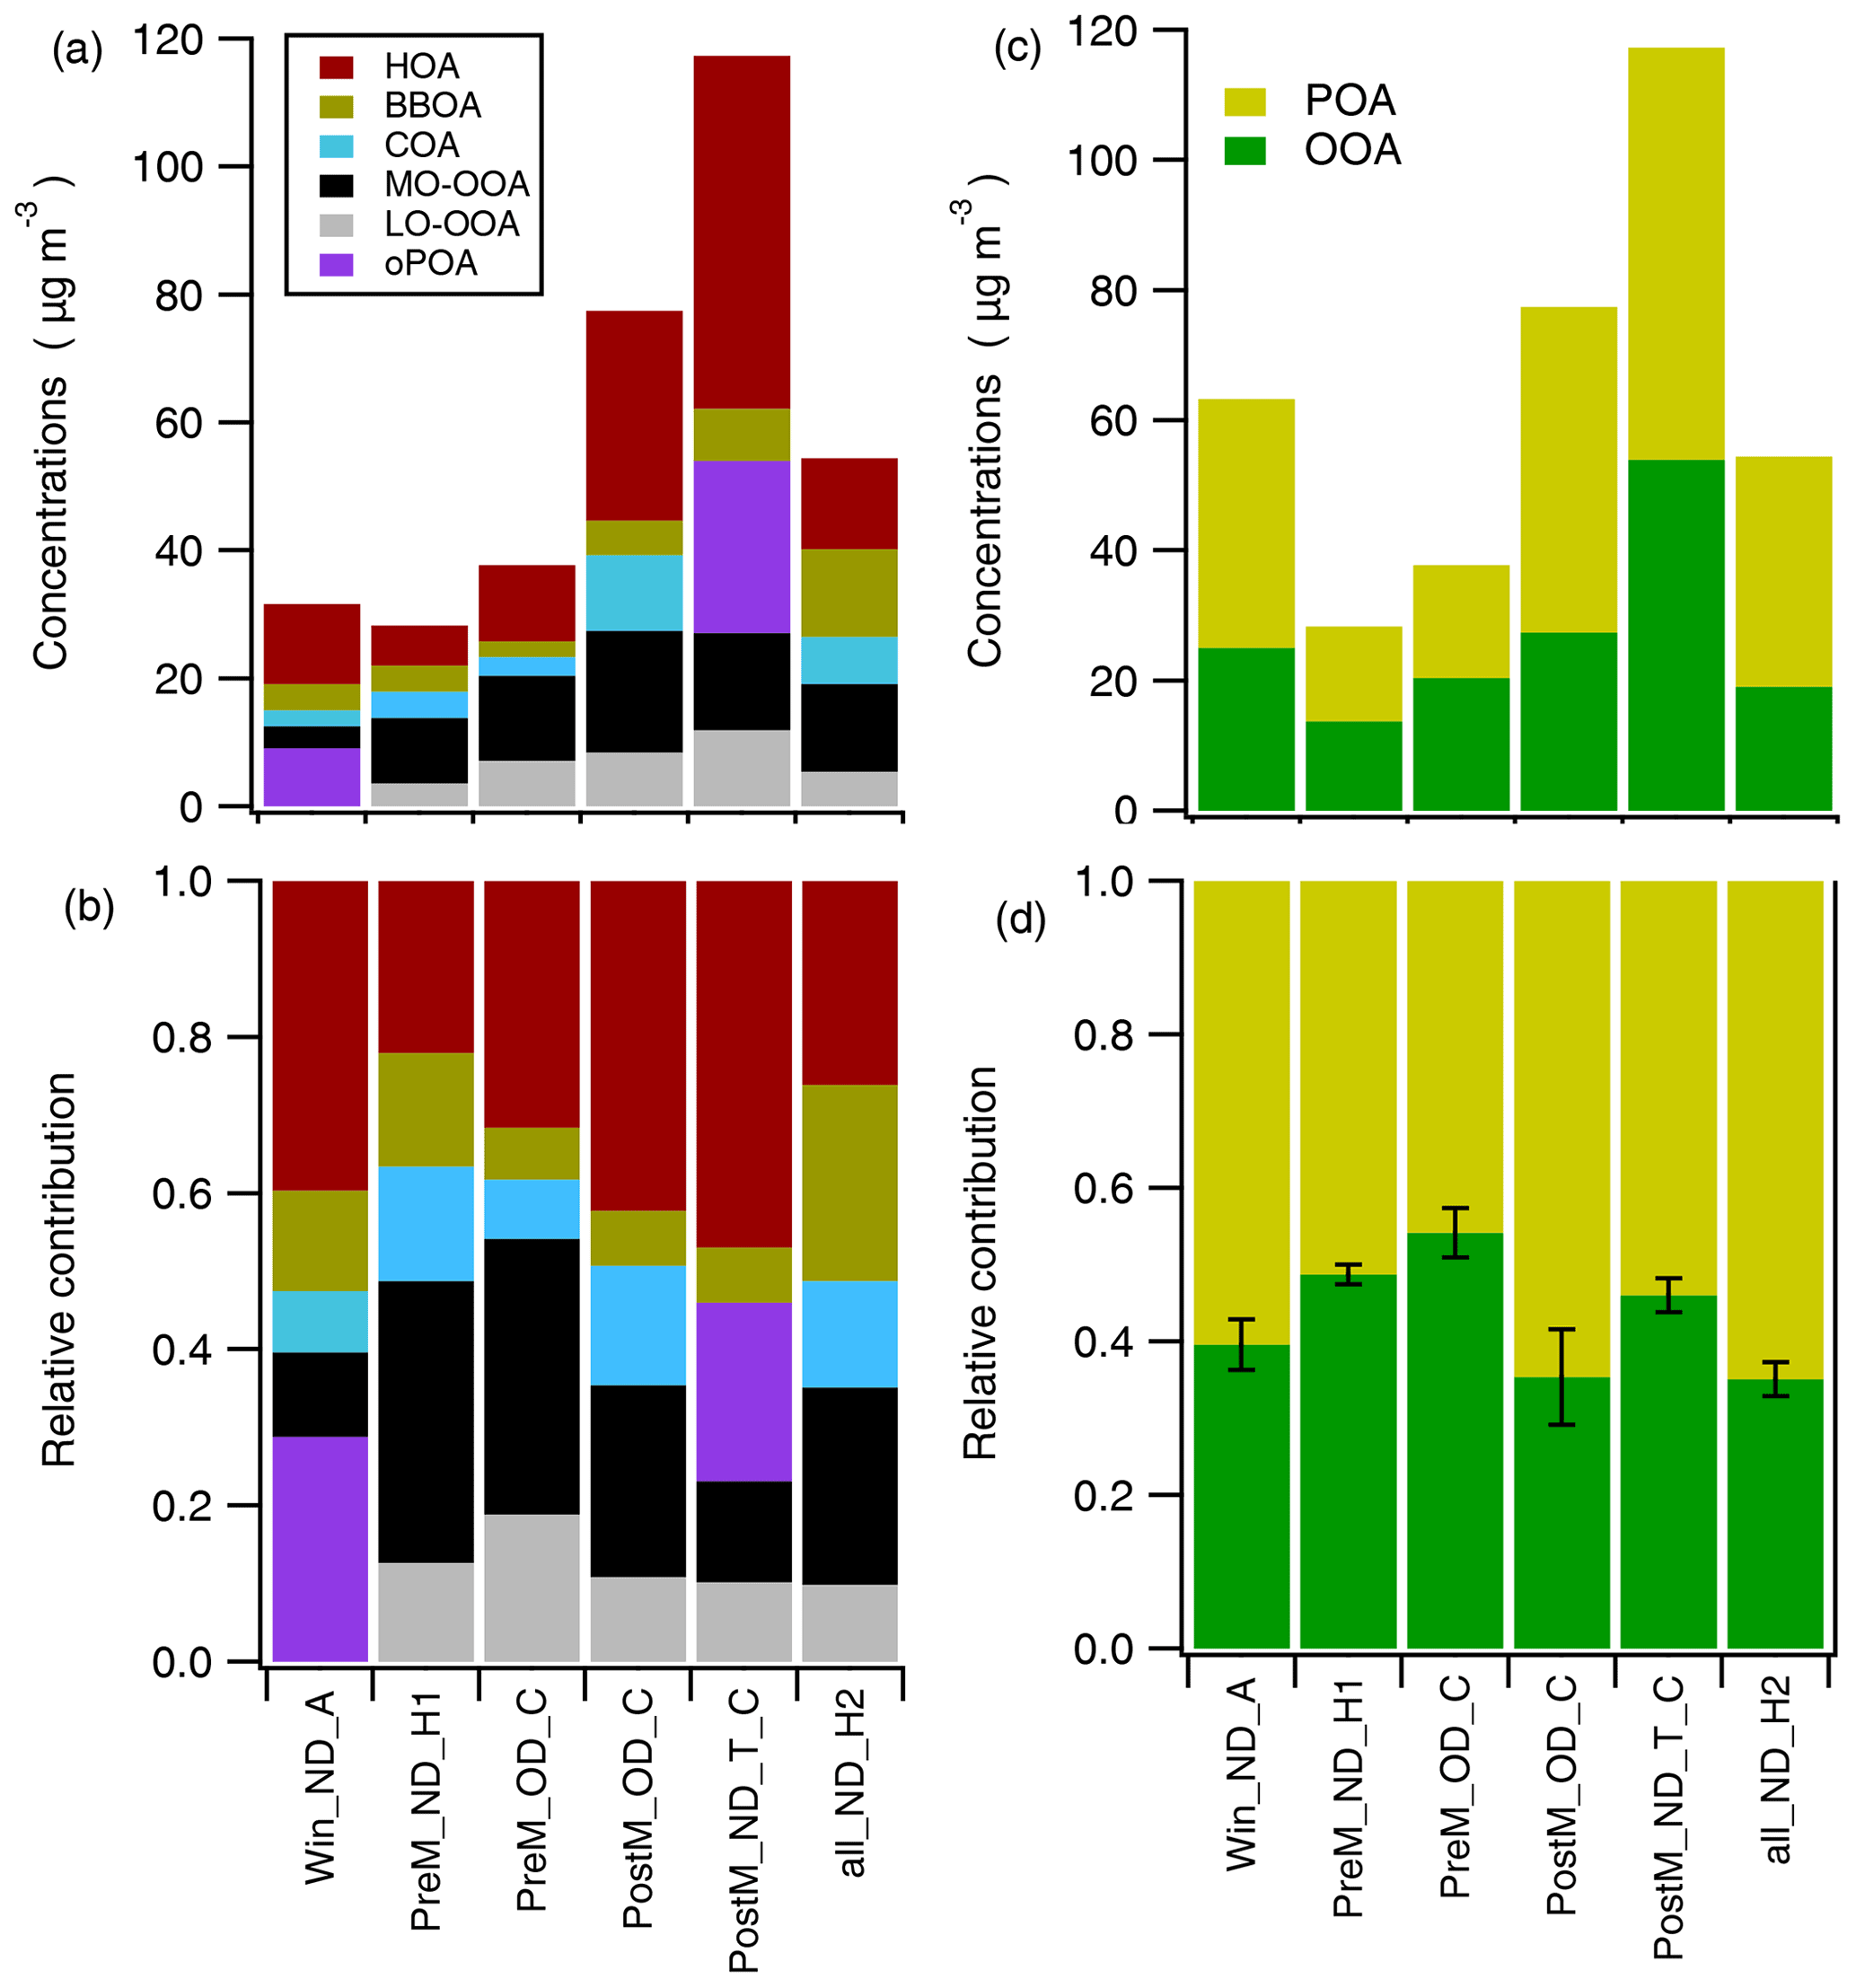
Figure 6OA average concentrations (a) and relative contribution (b). The whiskers represent the standard deviation of the POA OOA contribution after running PMF with different F peak values between −1 to 1 with steps of 0.2 to prove the stability of the separation.
4.3 Fossil fuel and biomass burning sources of BC
The high contribution of POA has been explained in Sect. 4.2, and more specifically, traffic was identified as an important OA source. This finding is supported by the Aethalometer model analysis. This model based on the Sandradewi method (Sandradewi et al., 2008) uses the absorption coefficient (babs) and the absorption Ångström exponent to apportion the contribution of fossil fuel (babs_950ff) and biomass burning (babs_470bb) to Aethalometer measurements (refer to Sect. S4 in the Supplement for details). Figure 7 shows the mean absorption coefficients for fossil fuel and biomass burning, where high babs_950ff values compared to babs_470bb are observed. Pre-monsoon and monsoon are the seasons with low biomass burning influence, with average values between 8–20 Mm−1; during these seasons, fossil fuel showed babs values between 35 and 50 Mm−1. Post-monsoon the influence of biomass burning starts to increase with average values around 50 Mm−1. However, at this time, traffic showed higher average values between 100 and 150 Mm−1. In winter, biomass burning has an important influence, with an average of 80 Mm−1, while fossil fuel still has a major influence with a value of 95 Mm−1. It is only during the Diwali festival, from OD-PostMon (Fig. S16) where biomass burning makes a significant contribution to BC (700 Mm−1). However, during this period, there is an important contribution of BC from fossil fuel (500 Mm−1), showing the importance of fossil fuel as a BC source.
Aerosol composition was studied to compare Old Delhi (OD) and New Delhi (ND) over different seasons in 2018 with a focus on source apportionment. No significant difference was observed in C-PM1 concentrations (defined as total AMS mass plus black carbon, BC) from post-monsoon measurements between sites: OD (142 ± 117 µg m−3) compared to ND (123 ± 71 µg m−3). A wider variability was observed between seasons, where the pre-monsoon and monsoon seasons showed average C-PM1 concentrations lower than 60 µg m−3. The fact that there is no remarkable difference in C-PM1 concentrations in the two sites suggests that, when aiming to control C-PM1 high concentrations, the actions should be region orientated, for example considering the Delhi region, rather than considering controlling air pollution in OD or ND only. OD presented high SO concentrations (7.0 µg m−3 in OD and 3.4 µg m−3 in ND). In the post-monsoon and winter seasons, the C-PM1 mass was dominated by organic matter (OAs) rather than inorganic, and the largest single contributor was hydrocarbon-like organic aerosols (HOAs). NH, NO and Cl− peaked in the morning, while OAs peaked at night. A seasonal variation in PM1 composition was observed; SO showed a high contribution over pre-monsoon and monsoon seasons, while (more volatile) NO and Cl− made a larger contribution in the cooler seasons, winter and post-monsoon. The fact that no remarkable difference between sites was found suggests the air pollution in Delhi is a regional problem that is influenced by meteorological conditions over the year, with the post-monsoon and winter seasons being the seasons with the highest pollutant concentrations.
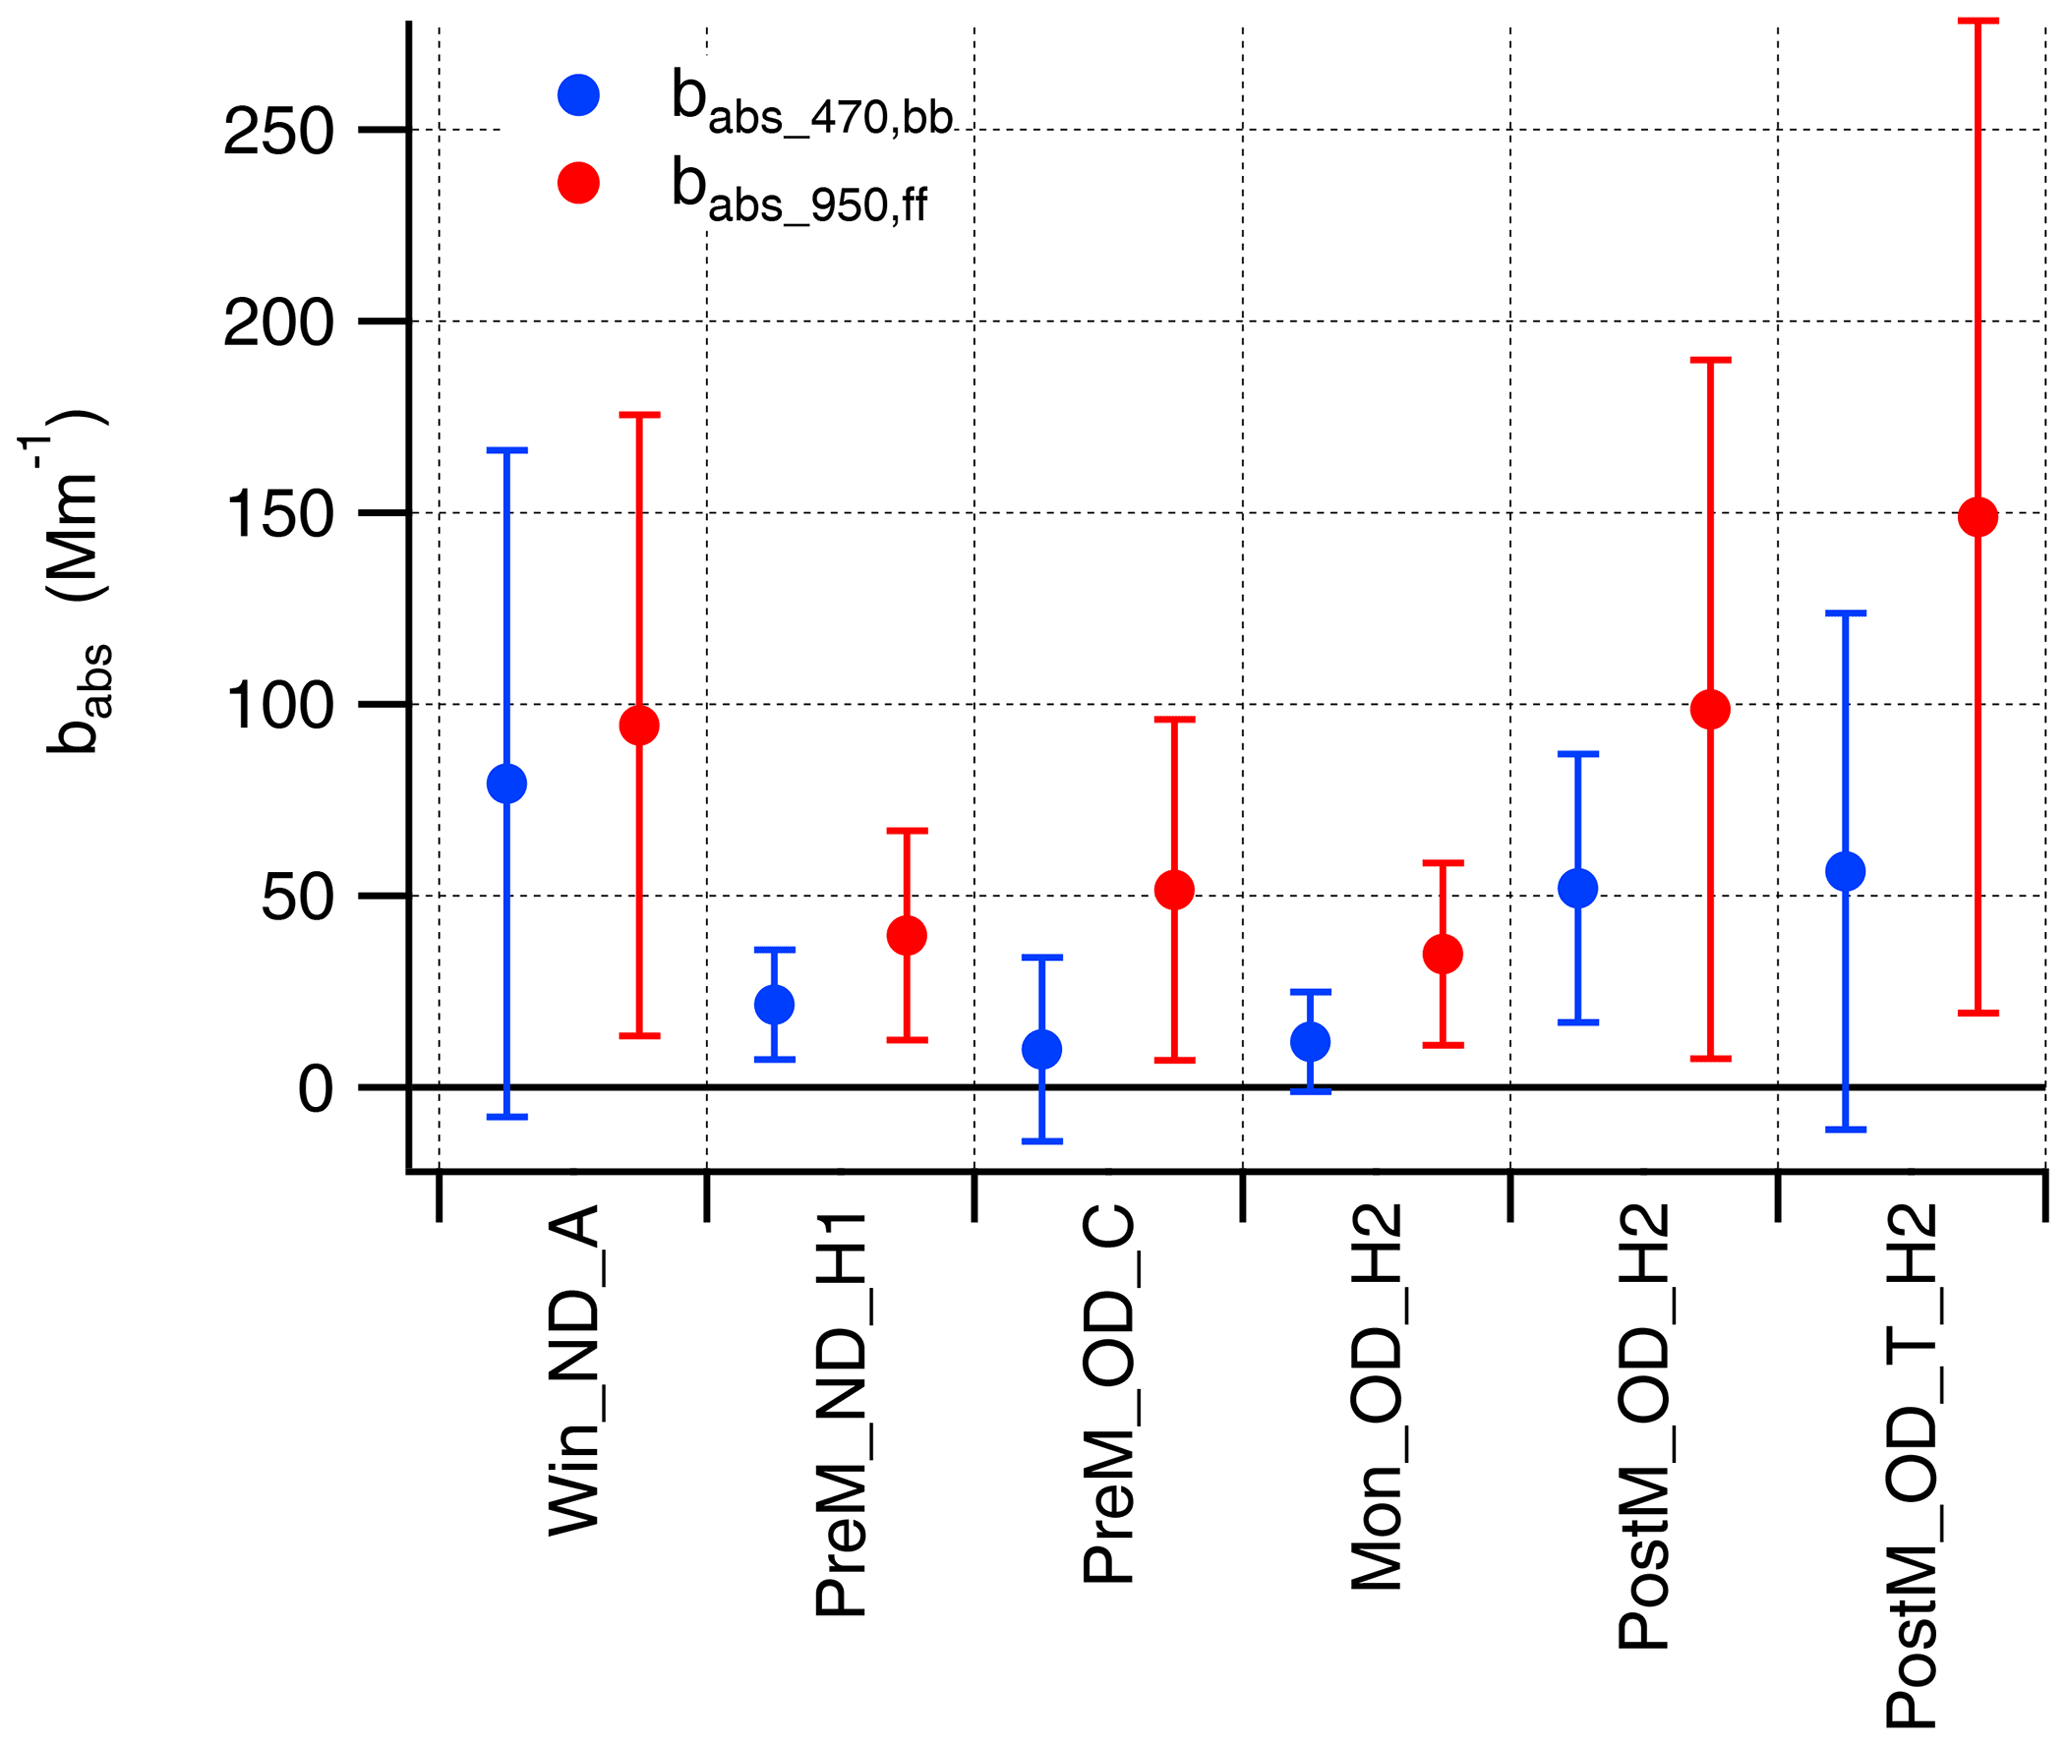
Figure 7Average absorption coefficients for fossil fuel (babs_950ff) and biomass burning (babs_470bb). The whiskers represent ± 1 standard deviation.
Analysis of the organic mass spectra by positive matrix factorisation (PMF) identified a number of conventional factors: HOAs, biomass burning OAs (BBOAs), cooking-like OAs (COAs), less oxidised oxygenated OAs (LO-OOAs) and more oxidised oxygenated OAs (MO-OOAs). One additional factor (oPOAs) had a particular diurnal trend, similar to that of Cl−, and a mass spectral signature similar to that of OOAs. However, from examination of the polar plots (Fig. S20), oPOAs appear to have similar source sectors to those of SO. This suggests oPOA may be semi-volatile and driven by changes in T and RH, like Cl−, whilst having different sources, undetermined at this time. Traffic has been shown to be the main primary aerosol source for both OAs and BC, as seen with the PMF analysis (HOA) and Aethalometer model analysis (babs_950ff). The measurements indicate that in Delhi further control of primary traffic exhaust emissions would make a significant contribution to reducing PM1 concentrations. Moreover, by controlling gas precursor emissions, OOA concentrations may also be reduced.
Primary organic aerosols (POAs) made a relatively constant contribution at the different sites and seasons with a relative contribution of around 50 % to OAs. This shows both the importance of primary sources and the fact that daily average temperatures remain above 20 ∘C throughout the year; 20 ∘C in winter and 43 ∘C pre-monsoon, compared, for example, with European urban environments where average temperatures can drop to 5 ∘C or lower in winter and summer temperatures are around 25–30 ∘C. This temperature might increase the regional pollutant transport allowing an even POA–SOA distribution over the Delhi region. When comparing these results with Cash et al. (2021), it shows the importance POA has in OD during the post-monsoon season, where a POA relative contribution of 63 % is observed. Meteorology played an important role in aerosol concentrations. High concentrations of Cl− and oPOA were observed in winter_ND which was characterised by high RH, with a sudden drop in concentrations when the boundary layer broke up in the morning and temperatures rose. This Cl− peak has been observed in a previous post-monsoon study in Kanpur, India (Chakraborty et al., 2018; Gadi et al., 2019). More detailed research should be carried out in order to identify the potential sources/processes that caused the peak in OA concentrations around 09:00–10:00 in urban Indian environments, which has been observed taking place during the post-monsoon and winter seasons.
The information generated in this study increases our understanding of PM1 composition and OA sources in Delhi, India. The PMF-AMS mass spectra can be used in future source apportionment studies in India and perhaps other urban environments to improve the identification of sources and provides a unique dataset for the assessment of atmospheric chemistry and transport models. Furthermore, the scientific findings provide significant information to target legislation that aim to improve air quality in India.
AMS data used in this paper have been archived at https://catalogue.ceda.ac.uk/uuid/b7c9aeb6aee54698aef82f20365fc441 (Reyes Villegas et al., 2021).
The supplement related to this article is available online at: https://doi.org/10.5194/acp-21-11655-2021-supplement.
ERV, RJ and JDA measured PM1 using a cToF-AMS along with black carbon using the Aethalometer AE31 and the SP2. ED, MF and AV measured PM1 using a HR-ToF-AMS along with black carbon using the Aethalometer AE31. UP, SSG, ED, and JDA measured PM1 using an ACSM along with black carbon using the Aethalometer AE33. JMC, BL, CDM, NJM, S and EN measured PM1 using a HR-ToF-AMS. MSA and LRC collected the 12 h samples in quartz filters for ion chromatography (IC) analysis. DJR performed the IC analysis. TKM, BRG, JL, CNH, EN and JDA conceived the Delhi-Flux project. All authors contributed to the discussion, writing and editing of the article.
The authors declare that they have no conflict of interest.
Publisher’s note: Copernicus Publications remains neutral with regard to jurisdictional claims in published maps and institutional affiliations.
This research has been supported by the UK NERC through the DelhiFlux and PROMOTE projects under the Newton Bhabha Fund programme “Air Pollution and Human Health in a Developing Megacity (APHH-India)”, NERC reference numbers NE/P016502/1, NE/P01643X/1, NE/P016472/1 and NE/P016480/1. The monsoon measurements were supported by the NERC National Capability award SUNRISE (NE/R000131/1). James Cash is recipient of a NERC E3 DTP studentship (NE/L002558/1).
This paper was edited by Nga Lee Ng and reviewed by two anonymous referees.
Alfarra, M. R., Prevot, A. S. H., Szidat, S., Sandradewi, J., Weimer, S., Lanz, V. A., Schreiber, D., Mohr, M., and Baltensperger, U.: Identification of the mass spectral signature of organic aerosols from wood burning emissions, Environ. Sci. Technol., 41, 5770–5777, https://doi.org/10.1021/Es062289b, 2007.
Allan, J. D., Williams, P. I., Morgan, W. T., Martin, C. L., Flynn, M. J., Lee, J., Nemitz, E., Phillips, G. J., Gallagher, M. W., and Coe, H.: Contributions from transport, solid fuel burning and cooking to primary organic aerosols in two UK cities, Atmos. Chem. Phys., 10, 647–668, https://doi.org/10.5194/acp-10-647-2010, 2010.
Bahreini, R., Ervens, B., Middlebrook, A. M., Warneke, C., de Gouw, J. A., DeCarlo, P. F., Jimenez, J. L., Brock, C. A., Neuman, J. A., Ryerson, T. B., Stark, H., Atlas, E., Brioude, J., Fried, A., Holloway, J. S., Peischl, J., Richter, D., Walega, J., Weibring, P., Wollny, A. G., and Fehsenfeld, F. C.: Organic aerosol formation in urban and industrial plumes near Houston and Dallas, Texas, J. Geophys. Res.-Atmos., 114, D00F16, https://doi.org/10.1029/2008JD011493, 2009.
Bhandari, S., Gani, S., Patel, K., Wang, D. S., Soni, P., Arub, Z., Habib, G., Apte, J. S., and Hildebrandt Ruiz, L.: Sources and atmospheric dynamics of organic aerosol in New Delhi, India: insights from receptor modeling, Atmos. Chem. Phys., 20, 735–752, https://doi.org/10.5194/acp-20-735-2020, 2020.
Bhuyan, P., Deka, P., Prakash, A., Balachandran, S., and Hoque, R. R.: Chemical characterization and source apportionment of aerosol over mid Brahmaputra Valley, India, Environ. Pollut., 234, 997–1010, https://doi.org/10.1016/j.envpol.2017.12.009, 2018.
Bond, T. C. and Bergstrom, R. W.: Light absorption by carbonaceous particles: An investigative review, Aerosol Sci. Technol., 40, 27–67, https://doi.org/10.1080/02786820500421521, 2006.
Brooks, J., Allan, J. D., Williams, P. I., Liu, D., Fox, C., Haywood, J., Langridge, J. M., Highwood, E. J., Kompalli, S. K., O'Sullivan, D., Babu, S. S., Satheesh, S. K., Turner, A. G., and Coe, H.: Vertical and horizontal distribution of submicron aerosol chemical composition and physical characteristics across northern India during pre-monsoon and monsoon seasons, Atmos. Chem. Phys., 19, 5615–5634, https://doi.org/10.5194/acp-19-5615-2019, 2019.
Canonaco, F., Crippa, M., Slowik, J. G., Baltensperger, U., and Prevot, A. S. H.: SoFi, an IGOR-based interface for the efficient use of the generalized multilinear engine (ME-2) for the source apportionment: ME-2 application to aerosol mass spectrometer data, Atmos. Meas. Tech., 6, 3649–3661, https://doi.org/10.5194/amt-6-3649-2013, 2013.
Cash, J. M., Langford, B., Di Marco, C., Mullinger, N. J., Allan, J., Reyes-Villegas, E., Joshi, R., Heal, M. R., Acton, W. J. F., Hewitt, C. N., Misztal, P. K., Drysdale, W., Mandal, T. K., Shivani, Gadi, R., Gurjar, B. R., and Nemitz, E.: Seasonal analysis of submicron aerosol in Old Delhi using high-resolution aerosol mass spectrometry: chemical characterisation, source apportionment and new marker identification, Atmos. Chem. Phys., 21, 10133–10158, https://doi.org/10.5194/acp-21-10133-2021, 2021.
Chakraborty, A., Bhattu, D., Gupta, T., Tripathi, S. N., and Canagaratna, M. R.: Real-time measurements of ambient aerosols in a polluted Indian city: Sources, characteristics, and processing of organic aerosols during foggy and nonfoggy periods, J. Geophys. Res.-Atmos., 120, 9006–9019, https://doi.org/10.1002/2015jd023419, 2015.
Chakraborty, A., Gupta, T., and Tripathi, S. N.: Chemical composition and characteristics of ambient aerosols and rainwater residues during Indian summer monsoon: Insight from aerosol mass spectrometry, Atmos. Environ., 136, 144–155, https://doi.org/10.1016/j.atmosenv.2016.04.024, 2016.
Chakraborty, A., Mandariya, A. K., Chakraborti, R., Gupta, T., and Tripathi, S. N.: Realtime chemical characterization of post monsoon organic aerosols in a polluted urban city: Sources, composition, and comparison with other seasons, Environ. Pollut., 232, 310–321, https://doi.org/10.1016/j.envpol.2017.09.079, 2018.
Crenn, V., Sciare, J., Croteau, P. L., Verlhac, S., Fröhlich, R., Belis, C. A., Aas, W., Äijälä, M., Alastuey, A., Artiñano, B., Baisnée, D., Bonnaire, N., Bressi, M., Canagaratna, M., Canonaco, F., Carbone, C., Cavalli, F., Coz, E., Cubison, M. J., Esser-Gietl, J. K., Green, D. C., Gros, V., Heikkinen, L., Herrmann, H., Lunder, C., Minguillón, M. C., Močnik, G., O'Dowd, C. D., Ovadnevaite, J., Petit, J. E., Petralia, E., Poulain, L., Priestman, M., Riffault, V., Ripoll, A., Sarda-Estève, R., Slowik, J. G., Setyan, A., Wiedensohler, A., Baltensperger, U., Prévôt, A. S. H., Jayne, J. T., and Favez, O.: ACTRIS ACSM intercomparison – Part 1: Reproducibility of concentration and fragment results from 13 individual Quadrupole Aerosol Chemical Speciation Monitors (Q-ACSM) and consistency with co-located instruments, Atmos. Meas. Tech., 8, 5063–5087, https://doi.org/10.5194/amt-8-5063-2015, 2015.
DeCarlo, P. F., Kimmel, J. R., Trimborn, A., Northway, M. J., Jayne, J. T., Aiken, A. C., Gonin, M., Fuhrer, K., Horvath, T., Docherty, K. S., Worsnop, D. R., and Jimenez, J. L.: Field-deployable, high-resolution, time-of-flight aerosol mass spectrometer, Anal. Chem., 78, 8281–8289, https://doi.org/10.1021/Ac061249n, 2006.
DeCarlo, P. F., Dunlea, E. J., Kimmel, J. R., Aiken, A. C., Sueper, D., Crounse, J., Wennberg, P. O., Emmons, L., Shinozuka, Y., Clarke, A., Zhou, J., Tomlinson, J., Collins, D. R., Knapp, D., Weinheimer, A. J., Montzka, D. D., Campos, T., and Jimenez, J. L.: Fast airborne aerosol size and chemistry measurements above Mexico City and Central Mexico during the MILAGRO campaign, Atmos. Chem. Phys., 8, 4027–4048, https://doi.org/10.5194/acp-8-4027-2008, 2008.
Drewnick, F., Hings, S. S., DeCarlo, P., Jayne, J. T., Gonin, M., Fuhrer, K., Weimer, S., Jimenez, J. L., Demerjian, K. L., Borrmann, S., and Worsnop, D. R.: A new time-of-flight aerosol mass spectrometer (TOF-AMS) – Instrument description and first field deployment, Aerosol Sci. Technol., 39, 637–658, https://doi.org/10.1080/02786820500182040, 2005.
Dunlea, E. J., DeCarlo, P. F., Aiken, A. C., Kimmel, J. R., Peltier, R. E., Weber, R. J., Tomlinson, J., Collins, D. R., Shinozuka, Y., McNaughton, C. S., Howell, S. G., Clarke, A. D., Emmons, L. K., Apel, E. C., Pfister, G. G., van Donkelaar, A., Martin, R. V., Millet, D. B., Heald, C. L., and Jimenez, J. L.: Evolution of Asian aerosols during transpacific transport in INTEX-B, Atmos. Chem. Phys., 9, 7257–7287, https://doi.org/10.5194/acp-9-7257-2009, 2009.
Gadi, R., Shivani, Sharma, S. K., and Mandal, T. K.: Source apportionment and health risk assessment of organic constituents in fine ambient aerosols (PM2.5): A complete year study over National Capital Region of India, Chemosphere, 221, 583–596, https://doi.org/10.1016/j.chemosphere.2019.01.067, 2019.
Gani, S., Bhandari, S., Seraj, S., Wang, D. S., Patel, K., Soni, P., Arub, Z., Habib, G., Hildebrandt Ruiz, L., and Apte, J. S.: Submicron aerosol composition in the world's most polluted megacity: the Delhi Aerosol Supersite study, Atmos. Chem. Phys., 19, 6843–6859, https://doi.org/10.5194/acp-19-6843-2019, 2019.
Gunthe, S. S., Liu, P., Panda, U., Raj, S. S., Sharma, A., Darbyshire, E., Reyes-Villegas, E., Allan, J., Chen, Y., Wang, X., Song, S., Pöhlker, M. L., Shi, L., Wang, Y., Kommula, S. M., Liu, T., Ravikrishna, R., McFiggans, G., Mickley, L. J., Martin, S. T., Pöschl, U., Andreae, M. O., and Coe, H.: Enhanced aerosol particle growth sustained by high continental chlorine emission in India, Nat. Geosci., 14, 77–84, https://doi.org/10.1038/s41561-020-00677-x, 2021.
Gupta, P., Singh, S. P., Jangid, A., and Kumar, R.: Characterization of black carbon in the ambient air of Agra, India: Seasonal variation and meteorological influence, Adv. Atmos. Sci., 34, 1082–1094, https://doi.org/10.1007/s00376-017-6234-z, 2017.
Jain, C. D., Gadhavi, H. S., Wankhede, T., Kallelapu, K., Sudhesh, S., Das, L. N., Pai, R. U., and Jayaraman, A.: Spectral properties of black carbon produced during biomass burning, Aerosol. Air. Qual. Res., 18, 671–679, https://doi.org/10.4209/aaqr.2017.03.0102, 2018a.
Jain, S., Sharma, S. K., Mandal, T. K., and Saxena, M.: Source apportionment of PM10 in Delhi, India using PCA/APCS, UNMIX and PMF, Particuology, 37, 107–118, https://doi.org/10.1016/j.partic.2017.05.009, 2018b.
Jain, S., Sharma, S. K., Vijayan, N., and Mandal, T. K.: Seasonal characteristics of aerosols (PM2.5 and PM1.0) and their source apportionment using PMF: A four year study over Delhi, India, Environ. Pollut., 262, 114337, https://doi.org/10.1016/j.envpol.2020.114337, 2020.
Janssen, N. A., Gerlofs-Nijland, M. E., Lanki, T., Salonen, R. O., Cassee, F., Hoek, G., Fischer, P., Brunekreef, B., and Krzyzanowski, M.: Health effects of black carbon, WHO Regional Office for Europe Copenhagen, Denmark, 55, 2012.
Jimenez, J., Canagaratna, M., Donahue, N., Prevot, A., Zhang, Q., Kroll, J., DeCarlo, P., Allan, J., Coe, H., and Ng, N.: Evolution of organic aerosols in the atmosphere, Science, 326, 1525–1529, 2009.
Kolhe, A. R., Aher, G. R., Ralegankar, S. D., and Safai, P. D.: Investigation of aerosol black carbon over semi-urban and urban locations in south-western India, Atmos. Pollut. Res., 9, 1111–1130, https://doi.org/10.1016/j.apr.2018.04.010, 2018.
Kompalli, S. K., Suresh Babu, S. N., Satheesh, S. K., Krishna Moorthy, K., Das, T., Boopathy, R., Liu, D., Darbyshire, E., Allan, J. D., Brooks, J., Flynn, M. J., and Coe, H.: Seasonal contrast in size distributions and mixing state of black carbon and its association with PM1.0 chemical composition from the eastern coast of India, Atmos. Chem. Phys., 20, 3965–3985, https://doi.org/10.5194/acp-20-3965-2020, 2020.
Kumar, B., Chakraborty, A., Tripathi, S. N., and Bhattu, D.: Highly time resolved chemical characterization of submicron organic aerosols at a polluted urban location, Environ. Sci. Proc. Imp., 18, 1285–1296, https://doi.org/10.1039/c6em00392c, 2016.
Lack, D. A., Moosmüller, H., McMeeking, G. R., Chakrabarty, R. K., and Baumgardner, D.: Characterizing elemental, equivalent black, and refractory black carbon aerosol particles: a review of techniques, their limitations and uncertainties, Anal. Bioanal. Chem., 406, 99–122, https://doi.org/10.1007/s00216-013-7402-3, 2014.
Lanz, V. A., Alfarra, M. R., Baltensperger, U., Buchmann, B., Hueglin, C., Szidat, S., Wehrli, M. N., Wacker, L., Weimer, S., Caseiro, A., Puxbaum, H., and Prevot, A. S. H.: Source attribution of submicron organic aerosols during wintertime inversions by advanced factor analysis of aerosol mass spectra, Environ. Sci. Technol., 42, 214–220, https://doi.org/10.1021/Es0707207, 2008.
Laskar, S. I., Jaswal, K., Bhatnagar, M. K., and Rathore, L. S.: India Meteorological Department, Proceedings of the Indian National Science Academy, India, 82, 1021–1037, https://doi.org/10.16943/ptinsa/2016/48501, 2016.
Mohr, C., DeCarlo, P. F., Heringa, M. F., Chirico, R., Slowik, J. G., Richter, R., Reche, C., Alastuey, A., Querol, X., Seco, R., Penuelas, J., Jimenez, J. L., Crippa, M., Zimmermann, R., Baltensperger, U., and Prevot, A. S. H.: Identification and quantification of organic aerosol from cooking and other sources in Barcelona using aerosol mass spectrometer data, Atmos. Chem. Phys., 12, 1649–1665, https://doi.org/10.5194/acp-12-1649-2012, 2012.
Mukherjee, S., Singla, V., Pandithurai, G., Safai, P. D., Meena, G. S., Dani, K. K., and Anil Kumar, V.: Seasonal variability in chemical composition and source apportionment of sub-micron aerosol over a high altitude site in Western Ghats, India, Atmos. Environ., 180, 79–92, https://doi.org/10.1016/j.atmosenv.2018.02.048, 2018.
Nazeer Hussain, S., Chakradhar Rao, T., Balakrishnaiah, G., Rama Gopal, K., Raja Obul Reddy, K., Siva Kumar Reddy, N., Lokeswara Reddy, T., Pavan Kumari, S., Ramanjaneya Reddy, P., and Ramakrishna Reddy, R.: Investigation of black carbon aerosols and their characteristics over tropical urban and semi-arid rural environments in peninsular India, J. Atmos. Sol.-Terr. Phys., 167, 48–57, https://doi.org/10.1016/j.jastp.2017.10.010, 2018.
Ng, N. L., Canagaratna, M. R., Zhang, Q., Jimenez, J. L., Tian, J., Ulbrich, I. M., Kroll, J. H., Docherty, K. S., Chhabra, P. S., Bahreini, R., Murphy, S. M., Seinfeld, J. H., Hildebrandt, L., Donahue, N. M., DeCarlo, P. F., Lanz, V. A., Prevot, A. S. H., Dinar, E., Rudich, Y., and Worsnop, D. R.: Organic aerosol components observed in Northern Hemispheric datasets from Aerosol Mass Spectrometry, Atmos. Chem. Phys., 10, 4625–4641, https://doi.org/10.5194/acp-10-4625-2010, 2010.
Ng, N. L., Herndon, S. C., Trimborn, A., Canagaratna, M. R., Croteau, P., Onasch, T. B., Sueper, D., Worsnop, D. R., Zhang, Q., and Sun, Y.: An Aerosol Chemical Speciation Monitor (ACSM) for routine monitoring of the composition and mass concentrations of ambient aerosol, Aerosol Sci. Technol., 45, 780–794, 2011.
Paatero, P., Hopke, P. K., Song, X. H., and Ramadan, Z.: Understanding and controlling rotations in factor analytic models, Chemometr. Intell. Lab., 60, 253–264, https://doi.org/10.1016/S0169-7439(01)00200-3, 2002.
Petzold, A., Kramer, H., and Schonlinner, M.: Continuous measurement of atmospheric black carbon using a multi-angle absorption photometer, Environ. Sci. Pollut. R., 9, 78–82, 2002.
Platt, S. M., El Haddad, I., Pieber, S. M., Zardini, A. A., Suarez-Bertoa, R., Clairotte, M., Daellenbach, K. R., Huang, R. J., Slowik, J. G., Hellebust, S., Temime-Roussel, B., Marchand, N., de Gouw, J., Jimenez, J. L., Hayes, P. L., Robinson, A. L., Baltensperger, U., Astorga, C., and Prévôt, A. S. H.: Gasoline cars produce more carbonaceous particulate matter than modern filter-equipped diesel cars, Sci. Rep.-UK, 7, 4926, https://doi.org/10.1038/s41598-017-03714-9, 2017.
Pope, I. C., Burnett, R. T., Thun, M. J., Calle, E. E., Krewski, D., Ito, K., and Thurston, G. D.: Lung cancer, cardiopulmonary mortality, and long-term exposure to fine particulate air pollution, J. Am. Med. Assoc., 287, 1132–1141, https://doi.org/10.1001/jama.287.9.1132, 2002.
Prakash, J., Vats, P., Sharma, A. K., Ganguly, D., and Habib, G.: New Emission Inventory of Carbonaceous Aerosols from the On-road Transport Sector in India and its Implications for Direct Radiative Forcing over the Region, Aerosol Air Qual. Res., 20, 741–761, https://doi.org/10.4209/aaqr.2019.08.0393, 2020.
Raatikainen, T., Brus, D., Hooda, R. K., Hyvarinen, A. P., Asmi, E., Sharma, V. P., Arola, A., and Lihavainen, H.: Size-selected black carbon mass distributions and mixing state in polluted and clean environments of northern India, Atmos. Chem. Phys., 17, 371–383, https://doi.org/10.5194/acp-17-371-2017, 2017.
Rajesh, T. A. and Ramachandran, S.: Characteristics and source apportionment of black carbon aerosols over an urban site, Environ. Sci. Pollut. R., 24, 8411–8424, https://doi.org/10.1007/s11356-017-8453-3, 2017.
Ramgolam, K., Favez, O., Cachier, H., Gaudichet, A., Marano, F., Martinon, L., and Baeza-Squiban, A.: Size-partitioning of an urban aerosol to identify particle determinants involved in the proinflammatory response induced in airway epithelial cells, Part Fibre Toxicol., 6, 6–9, 2009.
Reyes-Villegas, E., Bannan, T., Le Breton, M., Mehra, A., Priestley, M., Percival, C., Coe, H., and Allan, J. D.: Online Chemical Characterization of Food-Cooking Organic Aerosols: Implications for Source Apportionment, Environ. Sci. Technol., 52, 5308–5318, https://doi.org/10.1021/acs.est.7b06278, 2018.
Reyes Villegas, E., Allan, J., McFiggans, G., and Coe, H.: APHH: Compact Time of Flight Aerosol Mass Spectrometer measurements made at the Indira Gandhi Delhi Technical University for Women (IGDTUW) site and India Meteorological Department (IMD) during the post monsoon periods for the DelhiFlux field campaign 2018, available at: https://catalogue.ceda.ac.uk/uuid/b7c9aeb6aee54698aef82f20365fc441TS8, last access: 15 March 2021.
Sandradewi, J., Prévôt, A. S. H., Szidat, S., Perron, N., Alfarra, M. R., Lanz, V. A., Weingartner, E., and Baltensperger, U. R. S.: Using aerosol light abosrption measurements for the quantitative determination of wood burning and traffic emission contribution to particulate matter, Environ. Sci. Technol., 42, 3316–3323, https://doi.org/10.1021/es702253m, 2008.
Satish, R., Shamjad, P., Thamban, N., Tripathi, S., and Rastogi, N.: Temporal Characteristics of Brown Carbon over the Central Indo-Gangetic Plain, Environ. Sci. Technol., 51, 6765–6772, https://doi.org/10.1021/acs.est.7b00734, 2017.
Shinozuka, Y., Saide, P. E., Ferrada, G. A., Burton, S. P., Ferrare, R., Doherty, S. J., Gordon, H., Longo, K., Mallet, M., Feng, Y., Wang, Q., Cheng, Y., Dobracki, A., Freitag, S., Howell, S. G., LeBlanc, S., Flynn, C., Segal-Rosenhaimer, M., Pistone, K., Podolske, J. R., Stith, E. J., Bennett, J. R., Carmichael, G. R., da Silva, A., Govindaraju, R., Leung, R., Zhang, Y., Pfister, L., Ryoo, J. M., Redemann, J., Wood, R., and Zuidema, P.: Modeling the smoky troposphere of the southeast Atlantic: a comparison to ORACLES airborne observations from September of 2016, Atmos. Chem. Phys., 20, 11491–11526, https://doi.org/10.5194/acp-20-11491-2020, 2020.
Shivani, Gadi, R., Sharma, S. K., and Mandal, T. K.: Seasonal variation, source apportionment and source attributed health risk of fine carbonaceous aerosols over National Capital Region, India, Chemosphere, 237, 124500, https://doi.org/10.1016/j.chemosphere.2019.124500, 2019.
Shrivastava, M., Cappa, C. D., Fan, J., Goldstein, A. H., Guenther, A. B., Jimenez, J. L., Kuang, C., Laskin, A., Martin, S. T., Ng, N. L., Petaja, T., Pierce, J. R., Rasch, P. J., Roldin, P., Seinfeld, J. H., Shilling, J., Smith, J. N., Thornton, J. A., Volkamer, R., Wang, J., Worsnop, D. R., Zaveri, R. A., Zelenyuk, A., and Zhang, Q.: Recent advances in understanding secondary organic aerosol: Implications for global climate forcing, Rev. Geophys., 55, 509–559, https://doi.org/10.1002/2016rg000540, 2017.
Singla, V., Mukherjee, S., Pandithurai, G., Dani, K. K., and Safai, P. D.: Evidence of Organonitrate Formation at a High Altitude Site, Mahabaleshwar, during the Pre-monsoon Season, Aerosol Air Qual. Res., 19, 1241–1251, https://doi.org/10.4209/aaqr.2018.03.0110, 2019.
Thamban, N. M., Tripathi, S. N., Moosakutty, S. P., Kuntamukkala, P., and Kanawade, V. P.: Internally mixed black carbon in the Indo-Gangetic Plain and its effect on absorption enhancement, Atmos. Res., 197, 211–223, https://doi.org/10.1016/j.atmosres.2017.07.007, 2017.
Tiwari, S., Pervez, S., Cinzia, P., Bisht, D. S., Kumar, A., and Chate, D.: Chemical characterization of atmospheric particulate matter in Delhi, India, part II: Source apportionment studies using PMF 3.0, Sustain. Environ. Res., 23, 295–306, 2013.
Turner, A. G., Bhat, G. S., Martin, G. M., Parker, D. J., Taylor, C. M., Mitra, A. K., Tripathi, S. N., Milton, S., Rajagopal, E. N., Evans, J. G., Morrison, R., Pattnaik, S., Sekhar, M., Bhattacharya, B. K., Madan, R., Govindankutty, M., Fletcher, J. K., Willetts, P. D., Menon, A., Marsham, J. H., team, a. t. I., Hunt, K. M. R., Chakraborty, T., George, G., Krishnan, M., Sarangi, C., Belušić, D., Garcia-Carreras, L., Brooks, M., Webster, S., Brooke, J. K., Fox, C., Harlow, R. C., Langridge, J. M., Jayakumar, A., Böing, S. J., Halliday, O., Bowles, J., Kent, J., O'Sullivan, D., Wilson, A., Woods, C., Rogers, S., Smout-Day, R., Tiddeman, D., Desai, D., Nigam, R., Paleri, S., Sattar, A., Smith, M., Anderson, D., Bauguitte, S., Carling, R., Chan, C., Devereau, S., Gratton, G., MacLeod, D., Nott, G., Pickering, M., Price, H., Rastall, S., Reed, C., Trembath, J., Woolley, A., Volonté, A., and New, B.: Interaction of convective organization with monsoon precipitation, atmosphere, surface and sea: The 2016 INCOMPASS field campaign in India, Q. J. Roy. Meteorol. Soc., 146, 2828–2852, https://doi.org/10.1002/qj.3633, 2019.
Weingartner, E., Saathoff, H., Schnaiter, M., Streit, N., Bitnar, B., and Baltensperger, U.: Absorption of light by soot particles: determination of the absorption coefficient by means of aethalometers, J. Aerosol. Sci., 34, 1445–1463, https://doi.org/10.1016/S0021-8502(03)00359-8, 2003.
Young, D. E., Allan, J. D., Williams, P. I., Green, D. C., Flynn, M. J., Harrison, R. M., Yin, J., Gallagher, M. W., and Coe, H.: Investigating the annual behaviour of submicron secondary inorganic and organic aerosols in London, Atmos. Chem. Phys., 15, 6351–6366, https://doi.org/10.5194/acp-15-6351-2015, 2015.
Zhang, Q., Alfarra, M. R., Worsnop, D. R., Allan, J. D., Coe, H., Canagaratna, M. R., and Jimenez, J. L.: Deconvolution and quantification of hydrocarbon-like and oxygenated organic aerosols based on aerosol mass spectrometry, Environ. Sci. Technol., 39, 4938–4952, https://doi.org/10.1021/es048568l, 2005.
Zhang, Q., Jimenez, J. L., Canagaratna, M. R., Allan, J. D., Coe, H., Ulbrich, I., Alfarra, M. R., Takami, A., Middlebrook, A. M., Sun, Y. L., Dzepina, K., Dunlea, E., Docherty, K., DeCarlo, P. F., Salcedo, D., Onasch, T., Jayne, J. T., Miyoshi, T., Shimono, A., Hatakeyama, S., Takegawa, N., Kondo, Y., Schneider, J., Drewnick, F., Borrmann, S., Weimer, S., Demerjian, K., Williams, P., Bower, K., Bahreini, R., Cottrell, L., Griffin, R. J., Rautiainen, J., Sun, J. Y., Zhang, Y. M., and Worsnop, D. R.: Ubiquity and dominance of oxygenated species in organic aerosols in anthropogenically-influenced Northern Hemisphere midlatitudes, Geophys. Res. Lett., 34, L13801, https://doi.org/10.1029/2007gl029979, 2007.
Zhang, Q., Jimenez, J. L., Canagaratna, M. R., Ulbrich, I. M., Ng, N. L., Worsnop, D. R., and Sun, Y.: Understanding atmospheric organic aerosols via factor analysis of aerosol mass spectrometry: a review, Anal. Bioanal. Chem., 401, 3045–3067, 2011.