the Creative Commons Attribution 4.0 License.
the Creative Commons Attribution 4.0 License.
 | 02 Aug 2021
Study of the seasonal variation in Aeolus wind product performance over China using ERA5 and radiosonde data
Siying Chen
Rongzheng Cao
Yixuan Xie
Yinchao Zhang
Wangshu Tan
He Chen
Pan Guo
Peitao Zhao
Aeolus wind products became available to the public on 12 May 2020. In this study, Aeolus wind observations, L-band radiosonde (RS) data, and the European Centre for Medium-Range Weather Forecasts fifth-generation atmospheric reanalysis (ERA5) data were used to analyze the seasonality of Aeolus wind product performance over China. Based on the Rayleigh-clear and Mie-cloudy data, the data quality of the Aeolus effective detection data was verified, and the results showed that the Aeolus data were in good agreement with the L-band RS and ERA5 data. The Aeolus data relative errors in the four regions (Chifeng, Baoshan, Shapingba, and Qingyuan) in China were calculated based on different months (July to December 2019 and May to October 2020). The relative error in the Rayleigh-clear data in summer was significantly higher than that in winter, with the mean relative error parameter in July 174 % higher than that in December. The mean random error increased by 0.97 m s−1 in July compared with December, which also supported this conclusion. In addition, the distribution of the wind direction and high-altitude clouds in different months (July and December) was analyzed. The results showed that the distribution of the angle between the horizontal wind direction of the atmosphere and the horizontal line of sight had a greater proportion in the high error interval (70–110∘) in summer, and this proportion was 8.14 % higher in July than in December. The cloud top height in summer was approximately 3–5 km higher than that in winter, which might decrease the signal-to-noise ratio of Aeolus. Therefore, the wind product performance of Aeolus was affected by seasonal factors, which might be caused by seasonal changes in wind direction and cloud distribution.
- Article
(9824 KB) - Full-text XML
- BibTeX
- EndNote


Global wind field data are indispensable meteorological parameters for weather forecasting (Ishii et al., 2017). The European Space Agency (ESA) proposed the Atmospheric Dynamics Mission Aeolus (ADM-Aeolus) in 1999. The Aeolus is equipped with a 355 nm direct-detection wind lidar, which uses a single-view detection method to obtain the horizontal line-of-sight (HLOS) component of the three-dimensional wind field from space. In addition, it adopts a dual-channel design and uses different frequency discriminators to receive the Mie and Rayleigh channel signals (Stoffelen et al., 2005; Reitebuch, 2012). Aeolus was successfully launched on 22 August 2018, becoming the world's first spaceborne wind lidar in orbit. It then sent back the first batch of wind profile data, proving that the satellite-borne direct-detection wind lidar could provide global wind profiles (Reitebuch et al., 2019). On 12 May 2020, ESA opened Aeolus's wind measurement products to the public (https://earth.esa.int/eogateway/news/aeolus-data-now-publicly-available, last access: 13 March 2021), including Level 1B (L1B) and Level 2B (L2B) products. Among these, L2B products provide fully processed HLOS wind profiles after correction of temperature and pressure effects (European Space Agency et al., 2008), which were used in the present study.
To accurately calibrate the Doppler lidar carried on Aeolus, a dedicated calibration and validation team has carried out a series of verification and comparison studies on Aeolus' wind products. After the launch of Aeolus, a special verification study was immediately performed. The main verification methods have included radiosonde (Baars et al., 2020) and airborne lidar (Lux et al., 2020; Witschas et al., 2020), in which Aeolus's prototype atmospheric laser Doppler instrument airborne demonstrator was used. Over the following 2 years, researchers worldwide completed regional verification of the Aeolus detection data using various detection methods, including satellites (Shin et al., 2020), ground-based lidar (Hauchecorne et al., 2020), ground-based wind profiler radar (Belova et al., 2021; Guo et al., 2021), and radiosonde (Liu et al., 2021). In addition, global Aeolus data verification studies using the numerical weather prediction (NWP) model have been undertaken (Rennie and Isaksen, 2019; Martin et al., 2021). These verifications have deepened our understanding of Aeolus data quality, with some factors discovered that affect Aeolus data quality during the verification process, such as solar background radiation (Zhang et al., 2021), satellite flight direction (Guo et al., 2021), and seasonal changes (Martin et al., 2021). The European Centre for Medium-Range Weather Forecasts (ECMWF) has revised the data processing algorithm over time, including the temperature gradient correction algorithm for M1, which is the main mirror of the Aeolus telescope, to solve the problem of seasonal changes (Rennie and Isaksen, 2019).
To date, very few studies on the seasonal fluctuation in Aeolus wind product performance over China have been undertaken, especially using actual detection data. After the implementation of the new M1 deviation correction scheme, the effect of system thermal performance changes on Aeolus' seasonal fluctuation is significantly reduced, which has led to systematic errors lower than 1 m s−1 (Rennie and Isaksen, 2020). However, the actual atmospheric conditions during different seasons still affect the detection performance of the lidar.
In the present study, the variation in the Aeolus wind product performance during different seasons was analyzed using Aeolus L2B wind products in four regions of China over 12 months (July to December 2019 and May to October 2020) and was compared to the L-band radiosonde (L-band RS) detection and ECMWF Reanalysis v5 (ERA5) data. Two conjectures regarding Aeolus's different wind product capabilities were introduced and verified.
2.1 Aeolus L2B wind products
A sun-synchronous dawn–dusk orbit with a height of approximately 320 km is selected by Aeolus, and the orbit repeats its ground track every 7 d (European Space Agency et al., 2008). The transit time of Aeolus over central and eastern China is at approximately 10:00 and 22:00 UTC. In the present study, the criteria for judging the validity of the Aeolus data were the validity flags (0 is invalid, and 1 is valid) and the estimated errors (threshold requirements), which were obtained from the L2B data. Based on the recommendations of the ECMWF (Rennie and Isaksen, 2020) and the actual data situation used in the present study (Fig. 1), the thresholds of the estimated errors were 8 m s−1 (Rayleigh-clear) and 4 m s−1 (Mie-cloudy). In this study, the Mie-clear and Rayleigh-cloudy data were discarded because the remaining valid data points were too few.

Figure 1Difference between the Aeolus HLOS and L HLOS wind components as a function of estimated errors for (a) Mie-cloudy, (b) Mie-clear, (c) Rayleigh-cloudy, and (d) Rayleigh-clear. Samples mean the number of data points, and the samples below or beyond the threshold are also listed. Reference lines are the screening threshold of estimated errors: 4 m s−1 (Mie) and 8 m s−1 (Rayleigh).
2.2 L-band radiosonde wind data
The L-band RS is widely used to obtain the true situation of the atmospheric environment, and its detection altitude reaches 30 km (Guo et al., 2016). In the present study, the L-band RS wind data were the valid data detected by the four L-band RS stations. Matching the geographical location and time of the L-band lidar required special attention. For the geographical location, most of the valid L-band RS detection data used in the present study had a balloon drift of less than 0.5∘ (longitude or latitude). Only a few data points in winter had a maximum balloon drift of approximately 1.6∘. The detection time of the L-band RS network in China was 00:00 and 12:00 UTC. Generally, the time of launching the ball is approximately 45 min earlier than the detection time, which is 1 to 2 h away from the transit time of Aeolus. To reduce the influence of time and geographical location differences in the present study, ERA5 data were used as the reference data.
2.3 ERA5 data
The reanalysis dataset is often used as a reference for meteorological data analysis (Hersbach et al., 2020). ERA5 data provided by the ECMWF were used in the present study as the reference data. The current observation dataset used for ERA5 assimilation does not contain the observation results of Aeolus (https://confluence.ecmwf.int/pages/viewpage.action?pageId=82870405#ERA5:datadocumentation-Table14, last access: 27 July 2021); therefore, there was no mutual influence between the L2B data of Aeolus and the reanalysis data of ERA5. In addition to the zonal wind vector u and the meridional wind vector v, the cloud coverage provided in ERA5 was used in the present study (Sect. 3.2.2). Because of the high resolution of ERA5 regarding time and geographical location, after matching well with Aeolus data, the difference between ERA5 and L-band RS data was used to represent the wind difference between Aeolus and the L-band RS due to time and geographic differences to a certain extent.
2.4 Data matching
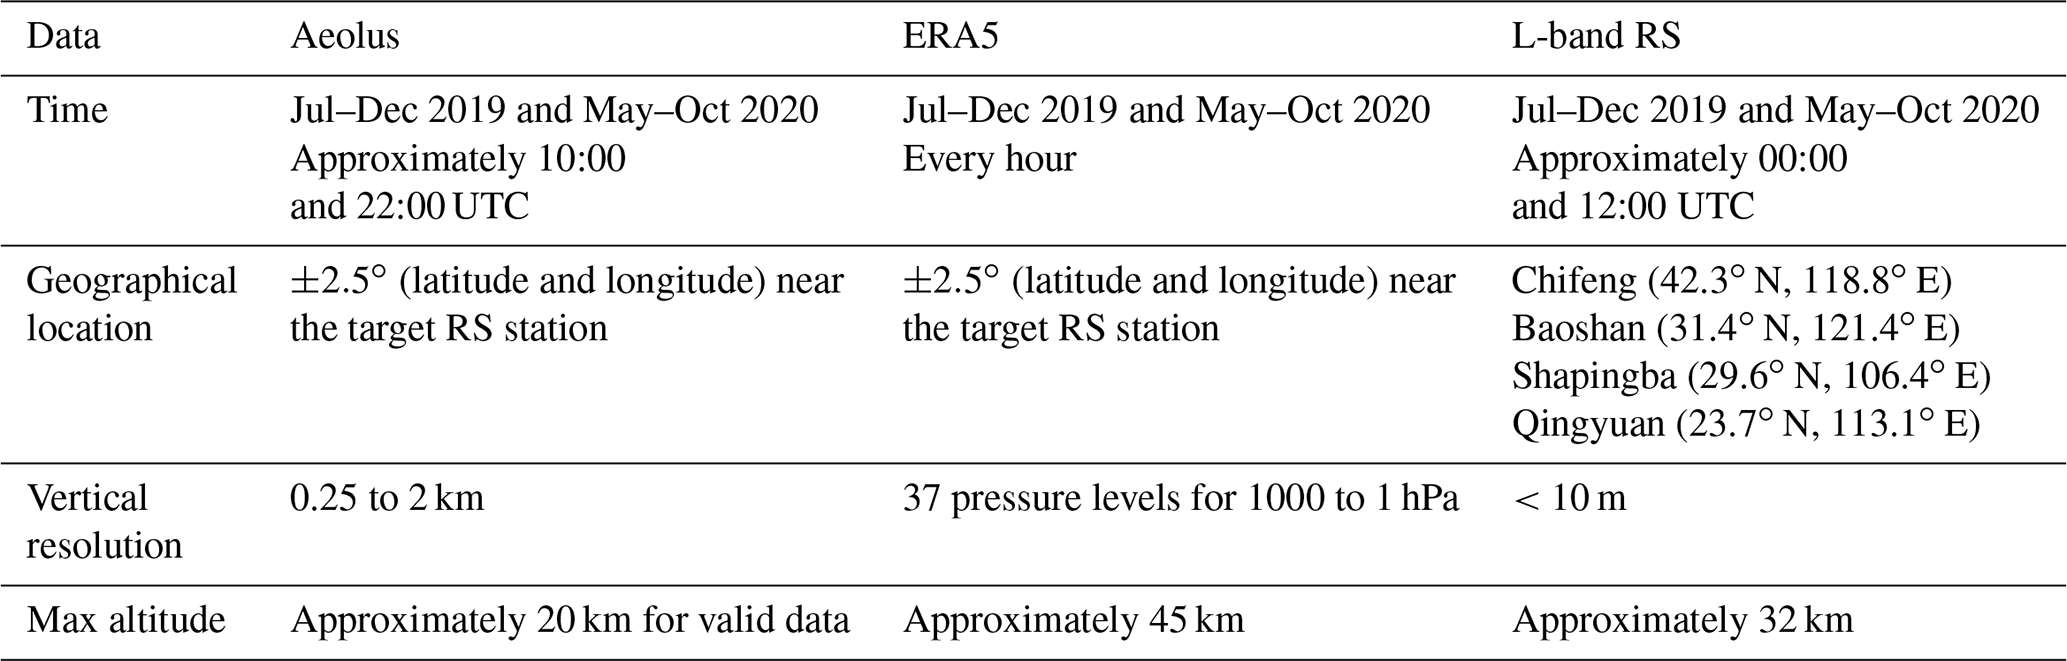
The collocation distance suggested by the CAL/VAL implementation plan (https://earth.esa.int/eogateway/documents/20142/1564626/Aeolus-Scientific-CAL-VAL-Implementation-Plan.pdf, last access: 27 July 2021) is 100 km around the ground site, but for a single site, there are too few data points that meet the suggestion per month. To compromise between the consistency of meteorological conditions and abundance of detection data, the Aeolus L2B data were compared with the ERA5 and L-band RS detection data, within a ±2.5∘ (latitude and longitude) geographical range (Fig. 2) near the target L-band RS station. The four L-band RS stations shown in Fig. 1 were selected because they possessed obvious differences in geographical location and meteorological conditions. The main characteristics of the datasets used in the comparison are listed in Table 1. The main processing procedures are shown in Fig. 3, and more details are discussed in the following.
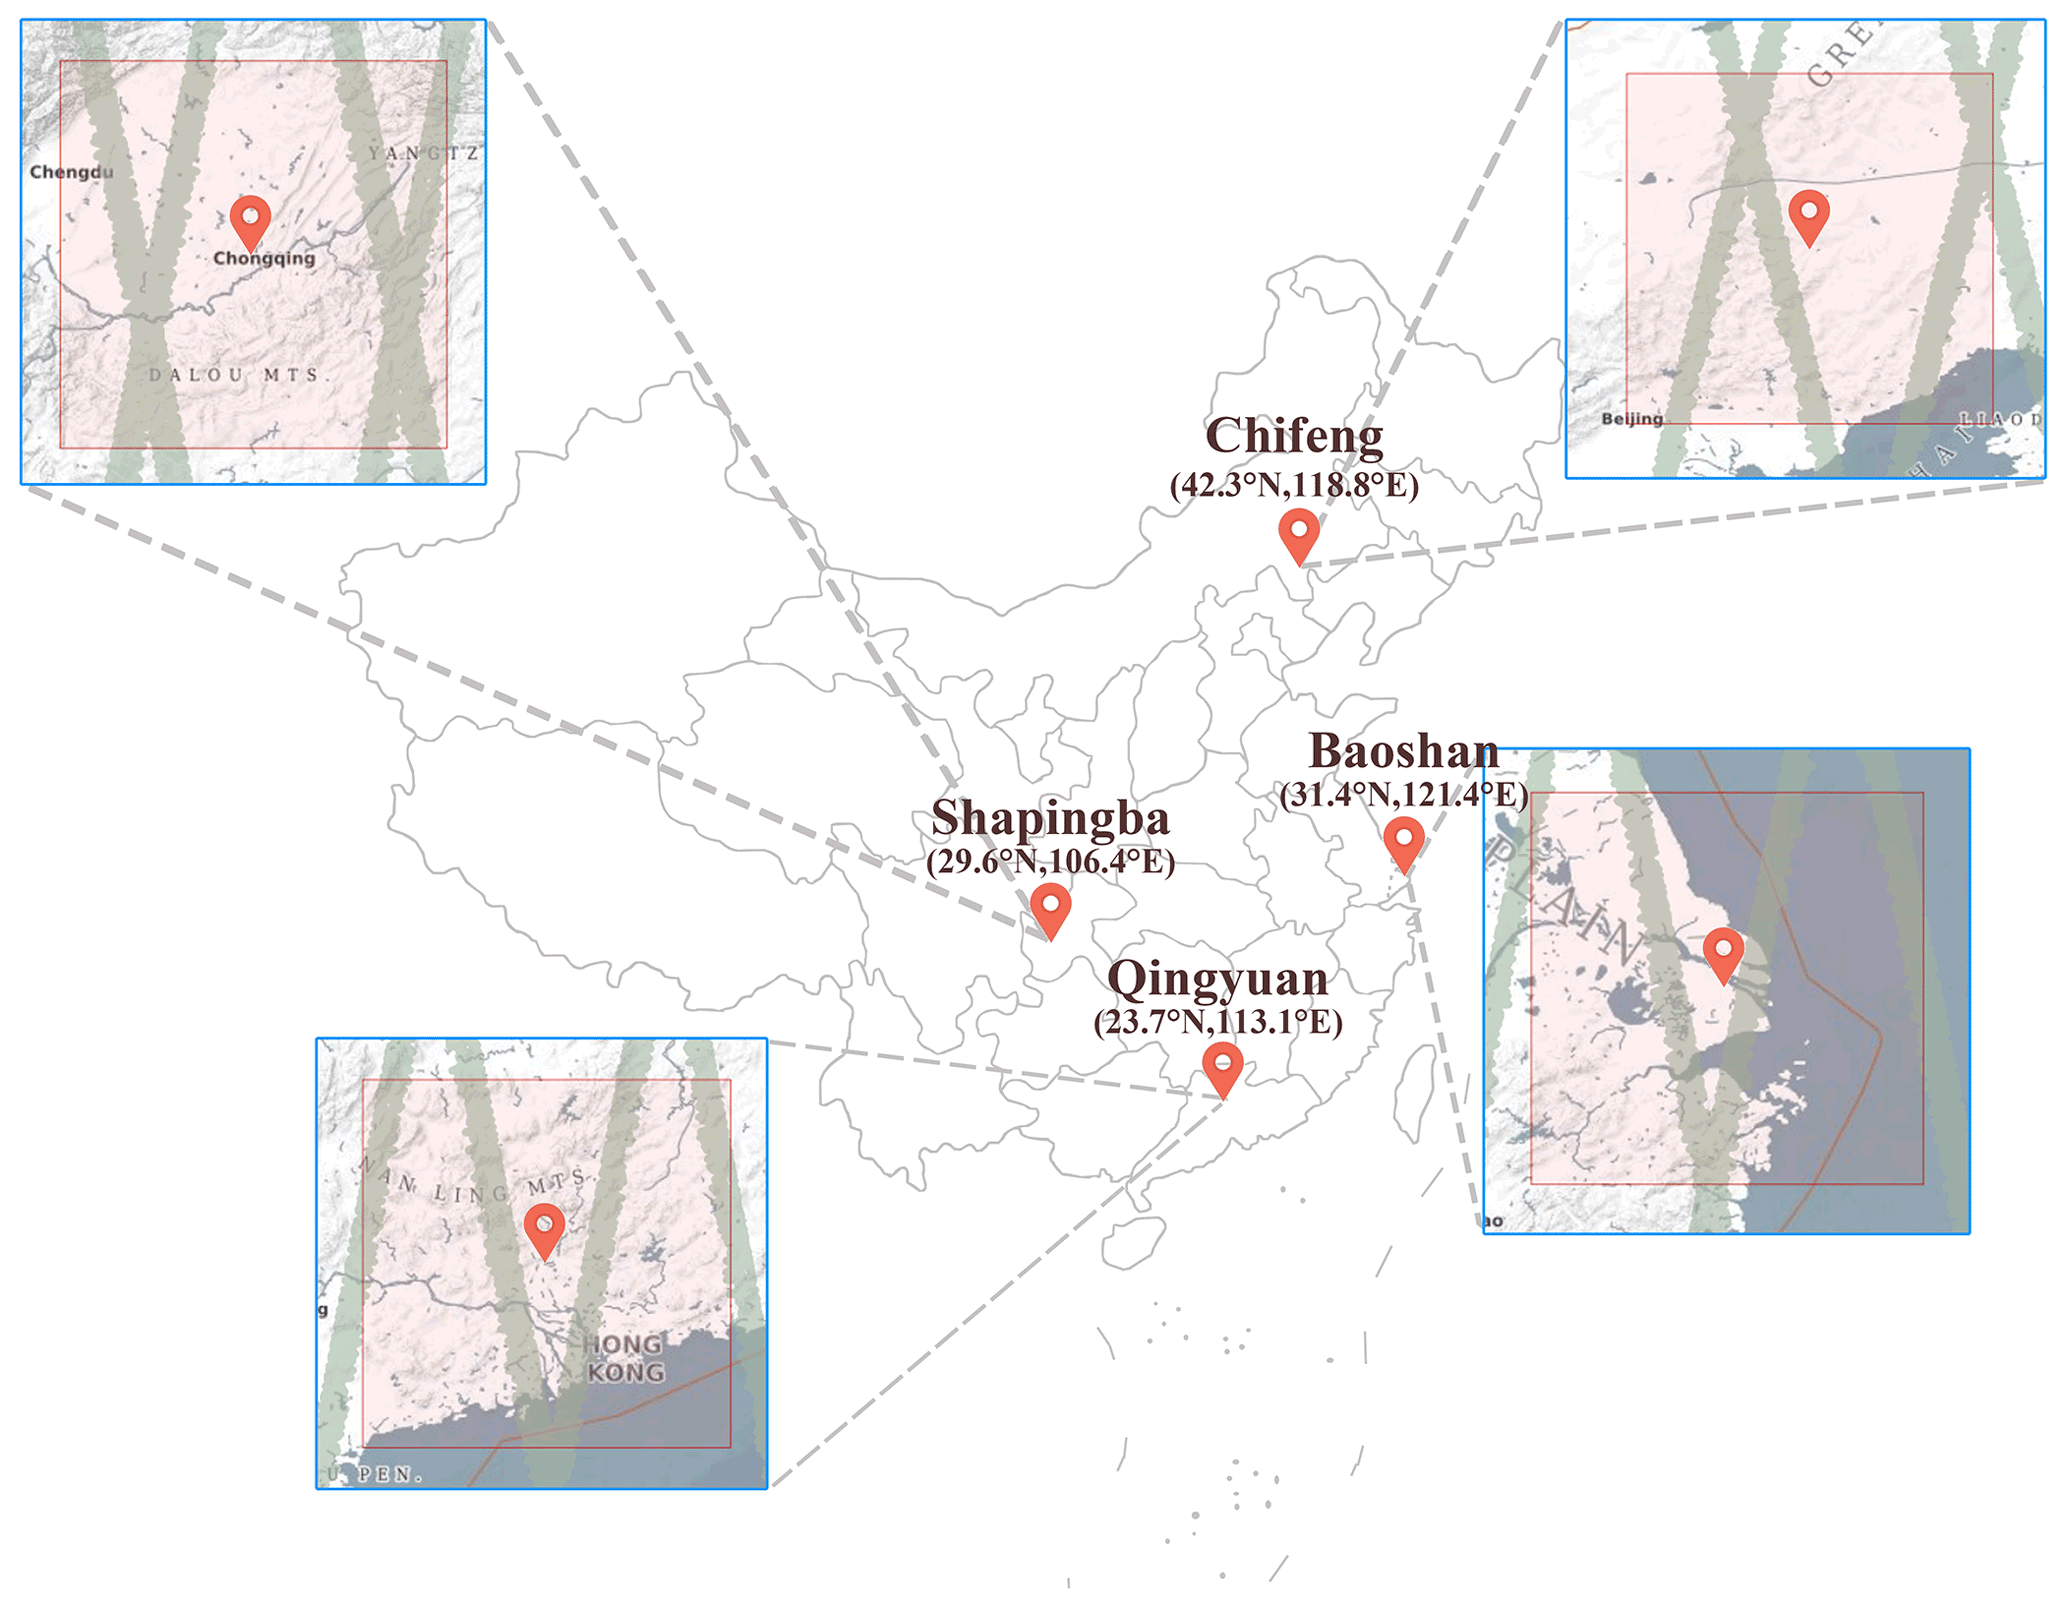
Figure 2Geographical location of the L-band RS site and Aeolus measurement trajectory. In the enlarged view (http://aeolus-ds.eo.esa.int/socat/L1B_L2_Products, last access: 27 July 2021), the red rectangles represent the range of ±2.5∘ around the L-band RS stations, and the gray-green lines represent Aeolus's overlapping trajectories for the 12 months.
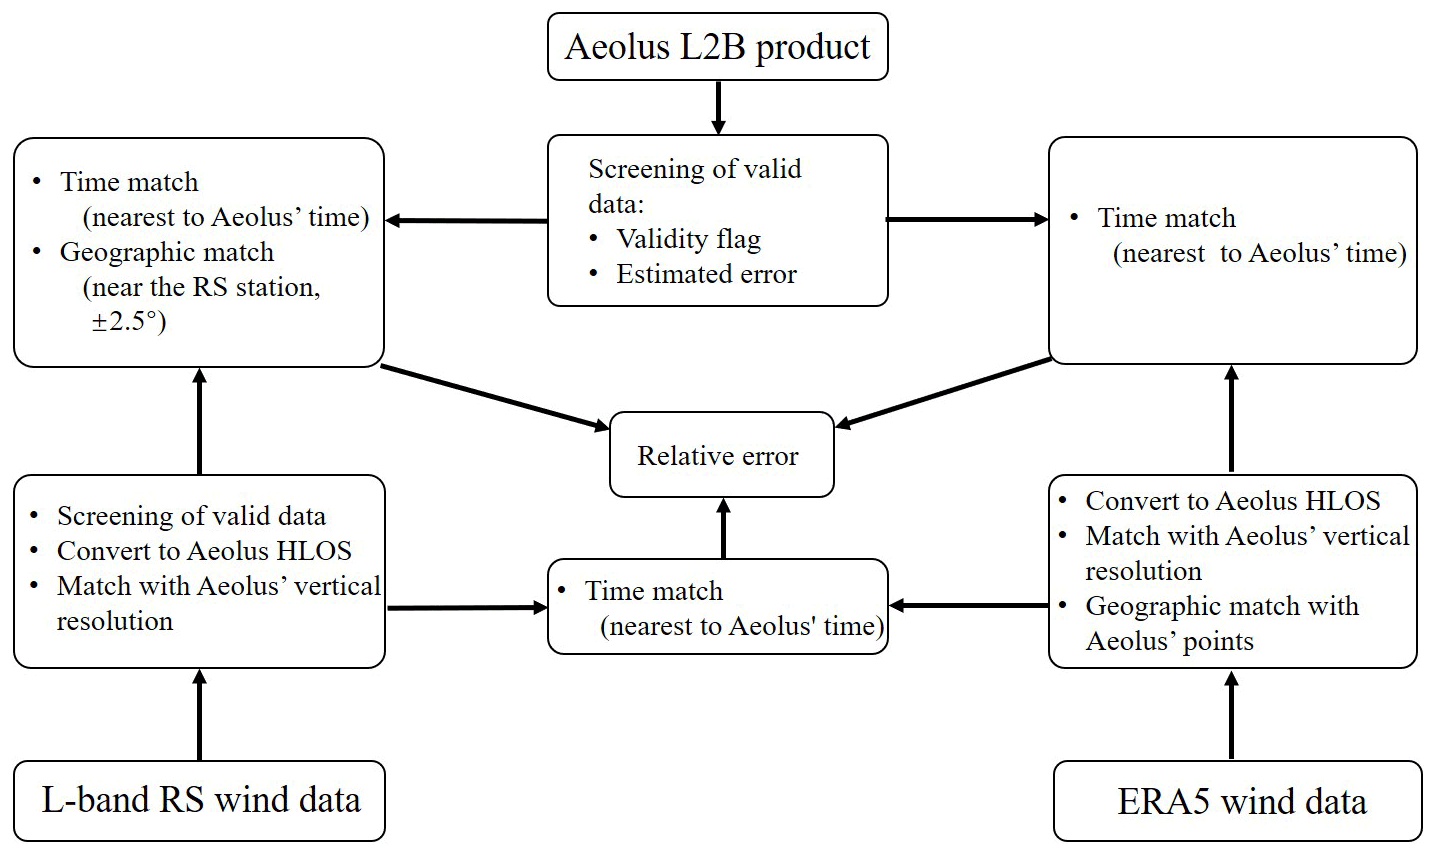
Table 1Main characteristics of the datasets used in the comparison.
The L2B data are the result of the single-component wind measurements of Aeolus; therefore, it was necessary to decompose the L-band RS and ERA5 data in the direction of the Aeolus HLOS. The Aeolus has different azimuths at different locations and distances, which have been given in the L2B data. RS and ERA5 data were decomposed in the HLOS direction:
where, represents the total horizontal wind speed provided by the L-band RS data or ERA5 data. represents the wind direction of the total horizontal wind vector. θHLOS is the azimuth of Aeolus. The ERA5 wind data have full, u, and v wind vector information and can calculated the VHLOS through two components. However, the result is the same as that calculated by Eq. (1) after the total wind vector has been composited.
For time matching, the L-band RS and ERA5 take the latest detection data from the Aeolus transit to the target area (±2.5∘ near the L-band RS station). Geographical location matching was determined by selection of the L-band RS station. The Aeolus data select the detection data within a ±2.5∘ (latitude and longitude) rectangular area centered on the L-band RS station (rectangular red area in Fig. 2). For the ERA5 data, the data point closest to the latitude and longitude of the Aeolus data was selected. In the vertical direction, owing to the difference in the vertical resolution of the three datasets, L-band RS and ERA5 data had to be matched with the Aeolus data via linear interpolation. Linear interpolation is a method of curve fitting using linear polynomials to construct new data points within the range of a discrete set of known data points. The L-band RS (ERA5) data point, which is just a little higher than one Aeolus data point in altitude, was found and marked as V(H+). Then, V(H−) was found, which was just a little lower than the Aeolus data point. The L-band RS (ERA5) wind matched with the Aeolus data point was calculated using Eq. (2):
where VH is the L-band RS (ERA5) wind matched with the Aeolus data at altitude and HAeolus is the altitude of the Aeolus data point.
2.5 Calculation of the relative error
Generally, the calculation formula of the wind speed error for the wind measurement system is
where Va and Vb represent the wind speeds of different datasets. This equation was used to calculate the difference between the different wind field data. Then, for a dataset with a sample size of n, its statistical mean deviation (MD) and standard deviation (SD) were
In addition, the scaled median absolute deviation (scaled MAD) is widely used in other Aeolus validation studies:
However, because the detection error in the Doppler wind lidar increases with an increase in the detected wind speed (Frehlich, 2001), the relative error can better reflect the detection performance of the instrument compared to the error value. The general calculation of the relative error is shown in Eq. (7):
where, Vture represents the data with a smaller error in the two datasets. In the present study, it was assumed that the error in ERA5 data was the smallest, while the error in Aeolus data was the largest.
Similarly, for a dataset with a sample size of n, the statistical average relative error was
In the data comparison logic of the present study, both and were used to approximate the relative error value of the Aeolus data when the space–time matching was good. The Aeolus relative error parameter was set as follows:
The average value of the comparisons between Aeolus and the two datasets was used to reduce the possibility of large deviations in the relative error. DAeolus was used to approximate the relative error value of the Aeolus data in the present study.
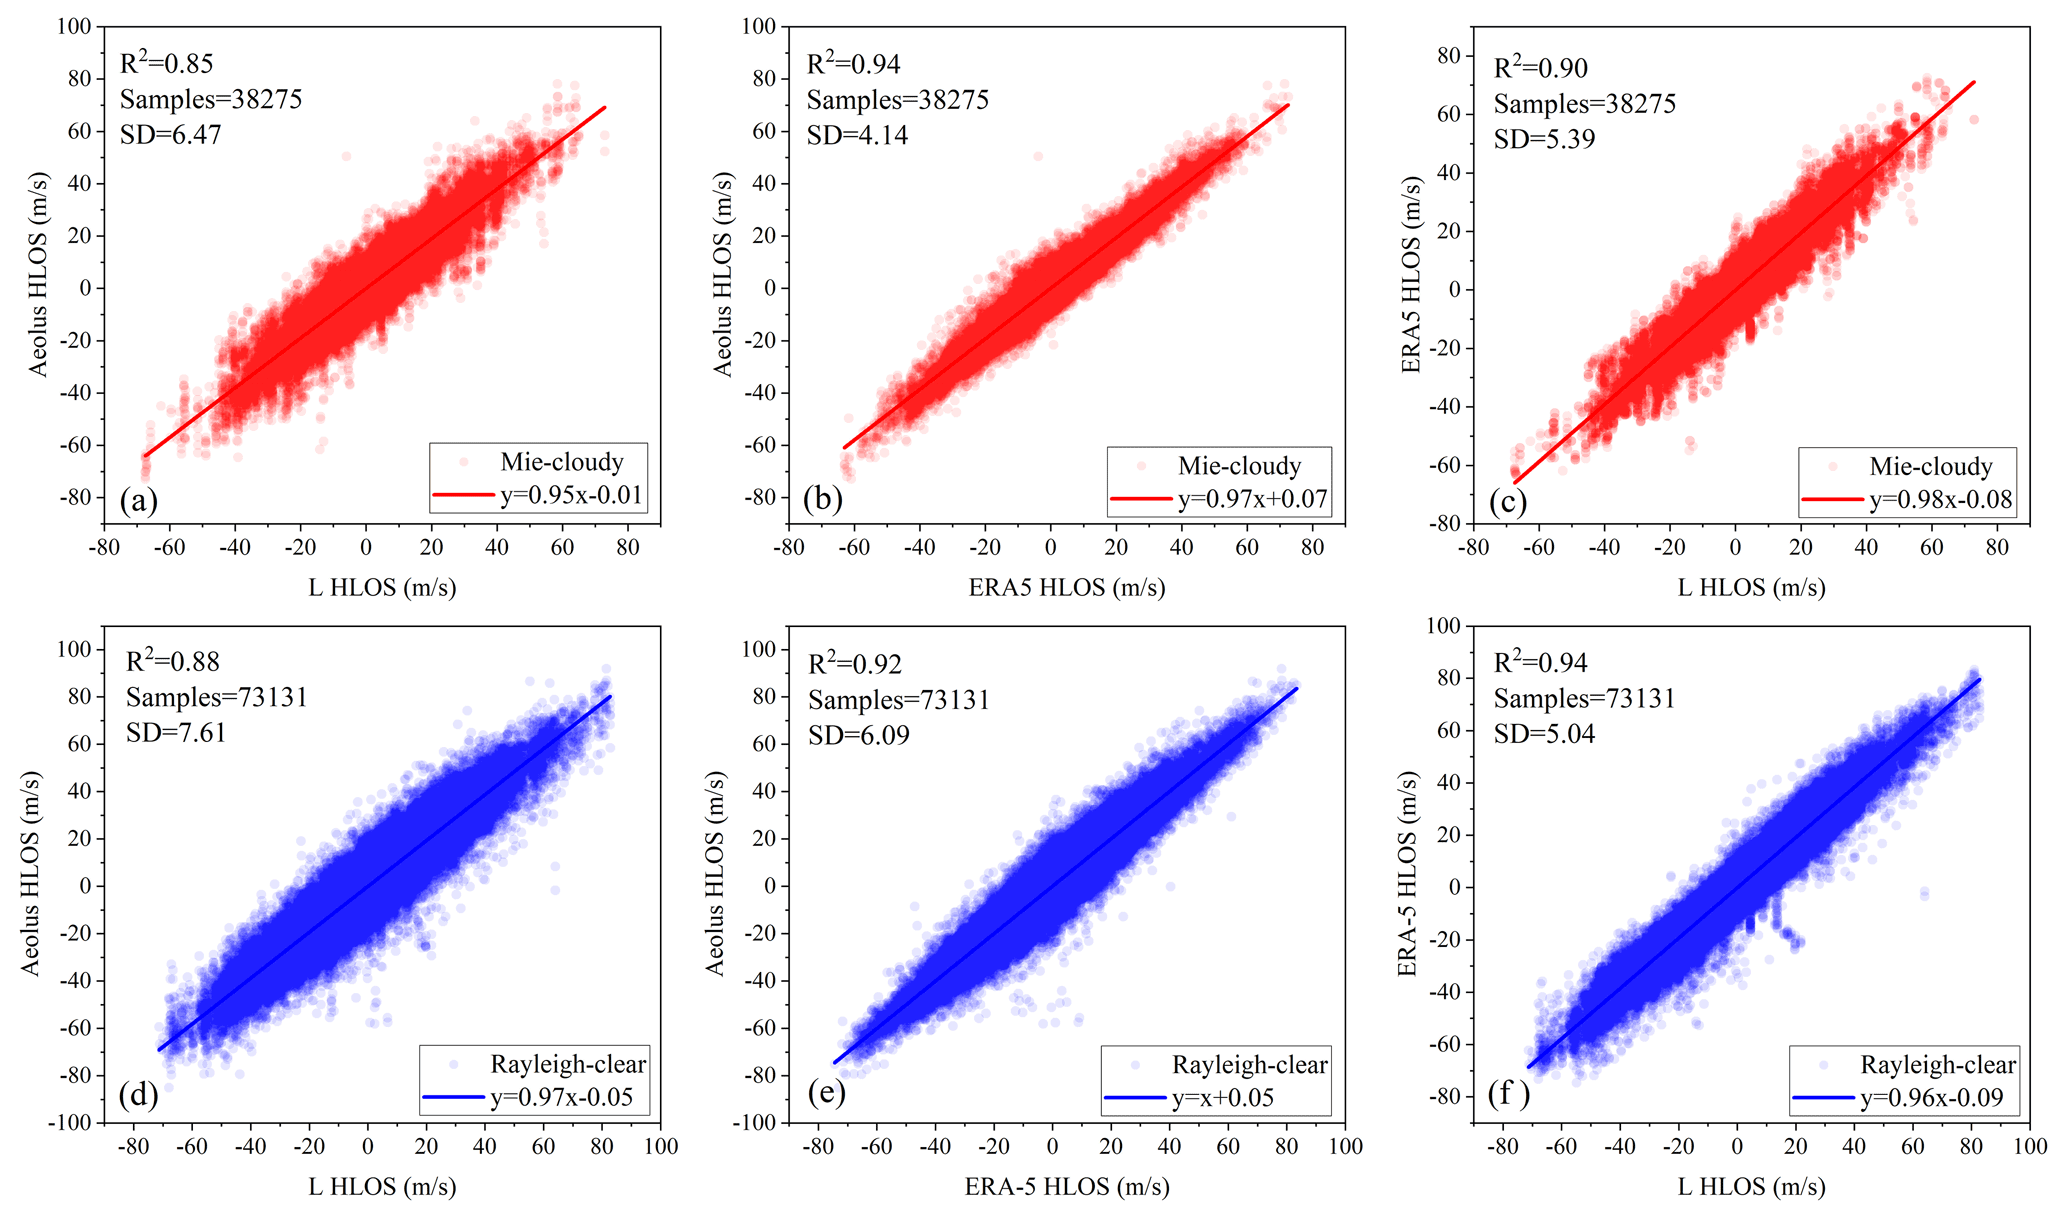
Figure 4Comparison results of Aeolus, L-band RS, and ERA5 data in Mie-cloudy and Rayleigh-clear groups. (a, d) Aeolus vs. L-band RS, (b, e) Aeolus vs. ERA5, and (c, f) ERA5 vs. L band RS.
3.1 Data quality
The comparison results of the three data sources after data matching are shown in Fig. 4. The red and blue points in the figures represent the data points of the Mie-cloudy and Rayleigh-clear groups, respectively. The red and blue lines represent the linear fitting lines of the data points of the two groups, respectively. The Mie-cloudy and Rayleigh-clear groups in the four regions provided 38 275 and 73 131 valid data points over 12 months (July–December 2019 and May–October 2020).
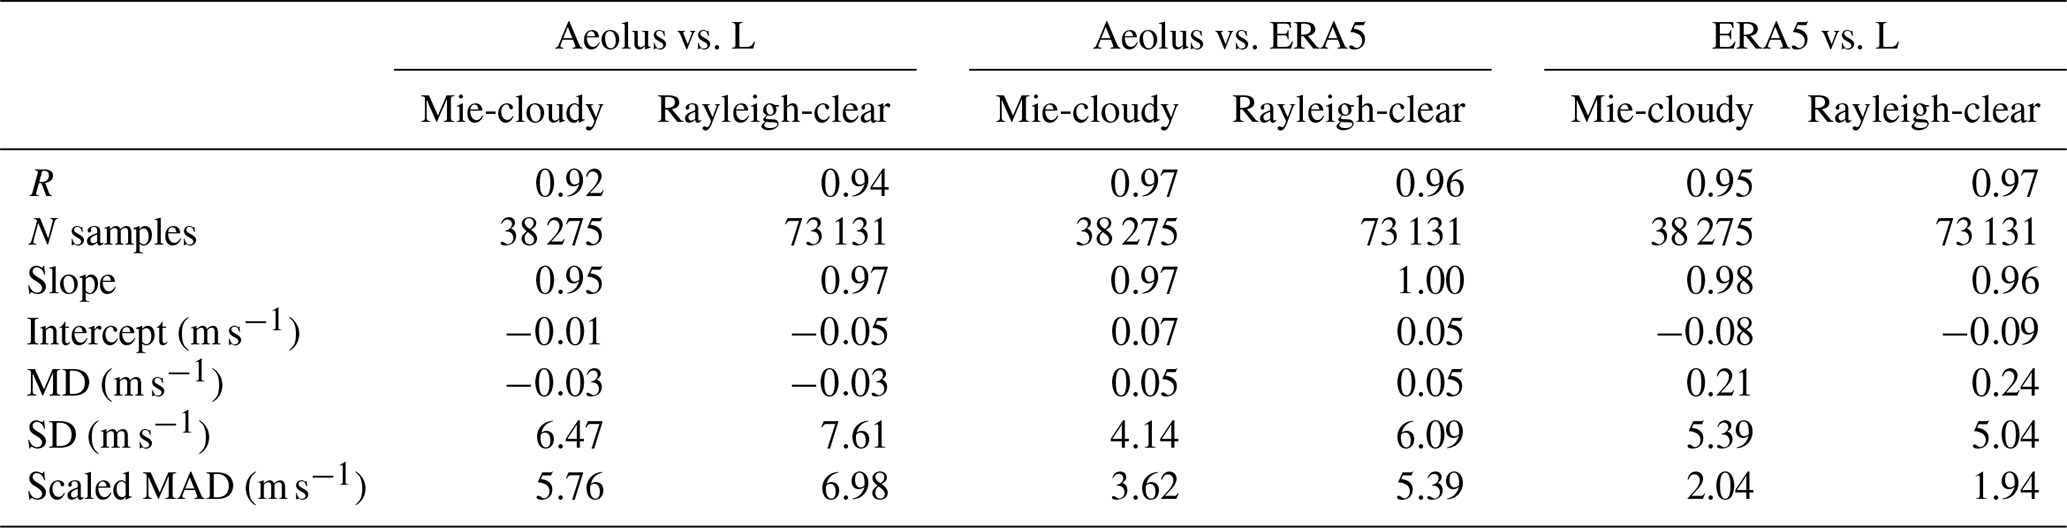
Table 2 shows the comparison results for the three groups of data. The consistency of the L-band RS and Aeolus data was the lowest among the three groups for the Mie-cloudy and Rayleigh-clear groups. The performance of the R and SD values of this group (Aeolus vs. L) was also slightly worse than that of the other two groups, which was expected. In addition, the scaled MAD value of group ERA5 vs. L was significantly lower than that of other groups. This means that there is a great agreement between ERA5 wind and L-band RS wind, despite their temporal and spatial matching problems. Overall, the correlation coefficients in the three sets of comparison results were all higher than 0.92, reflecting the reliability of the data used in the present study. The comparison results of data 1∘ from RS site are also shown in Table 3. The correlation coefficient is increased and the scaled MAD is decreased, when applying a stricter collocation criterion of 100 km. A stricter collocation criterion led to better results.
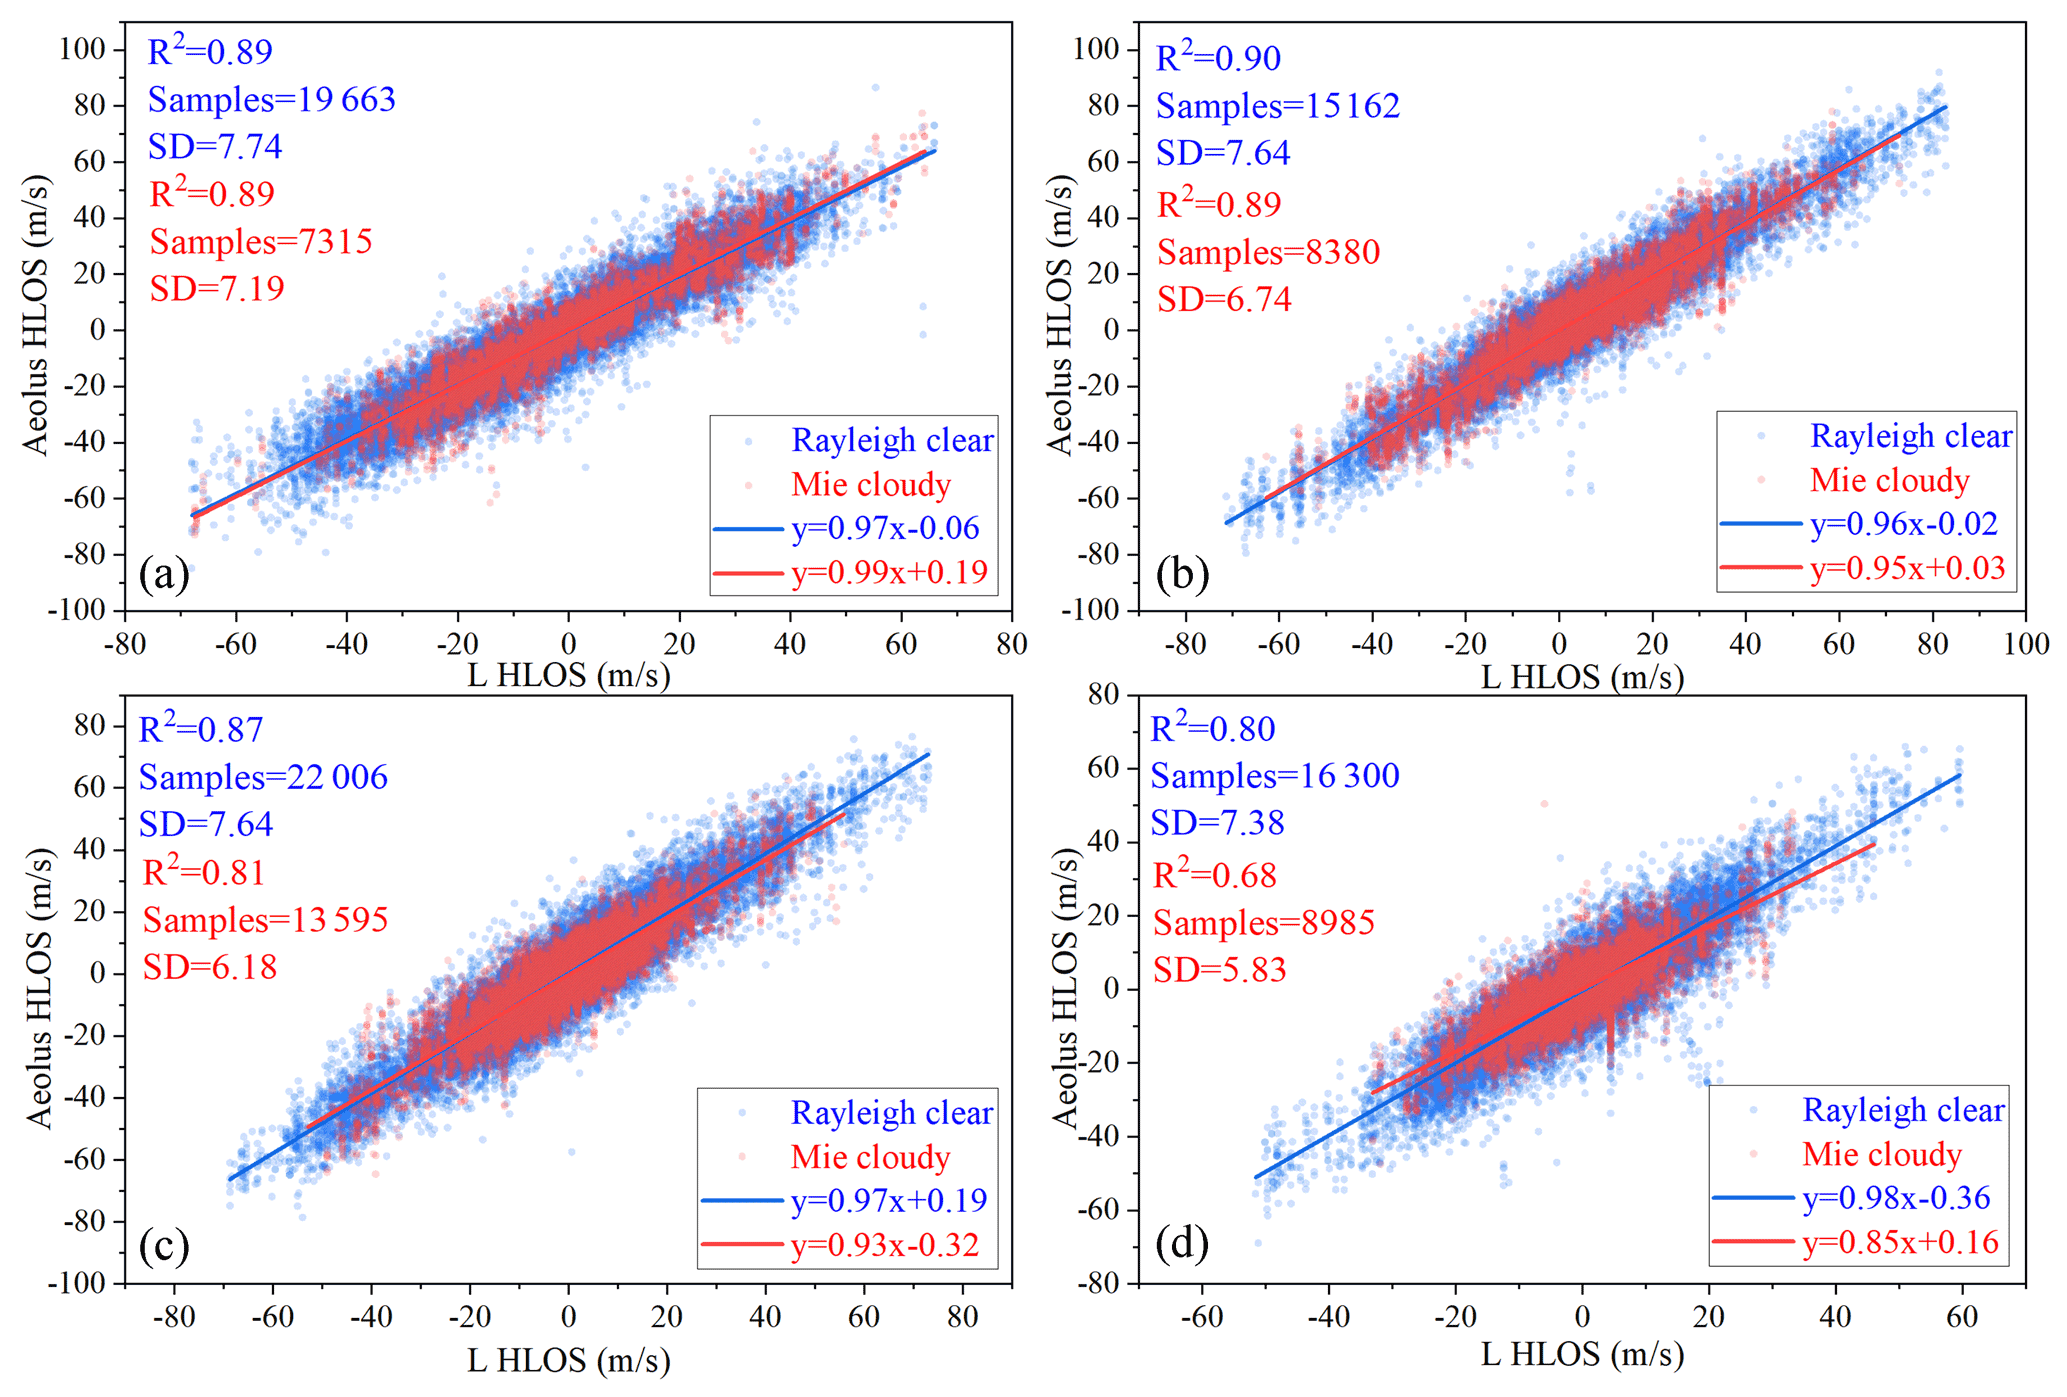
Figure 5Comparison of Aeolus and L-band radar detection data in four regions. The blue data points are the Rayleigh-clear group data, and the red data points are the Mie-cloudy group data. (a) Chifeng, (b) Baoshan, (c) Shapingba, and (d) Qingyuan.
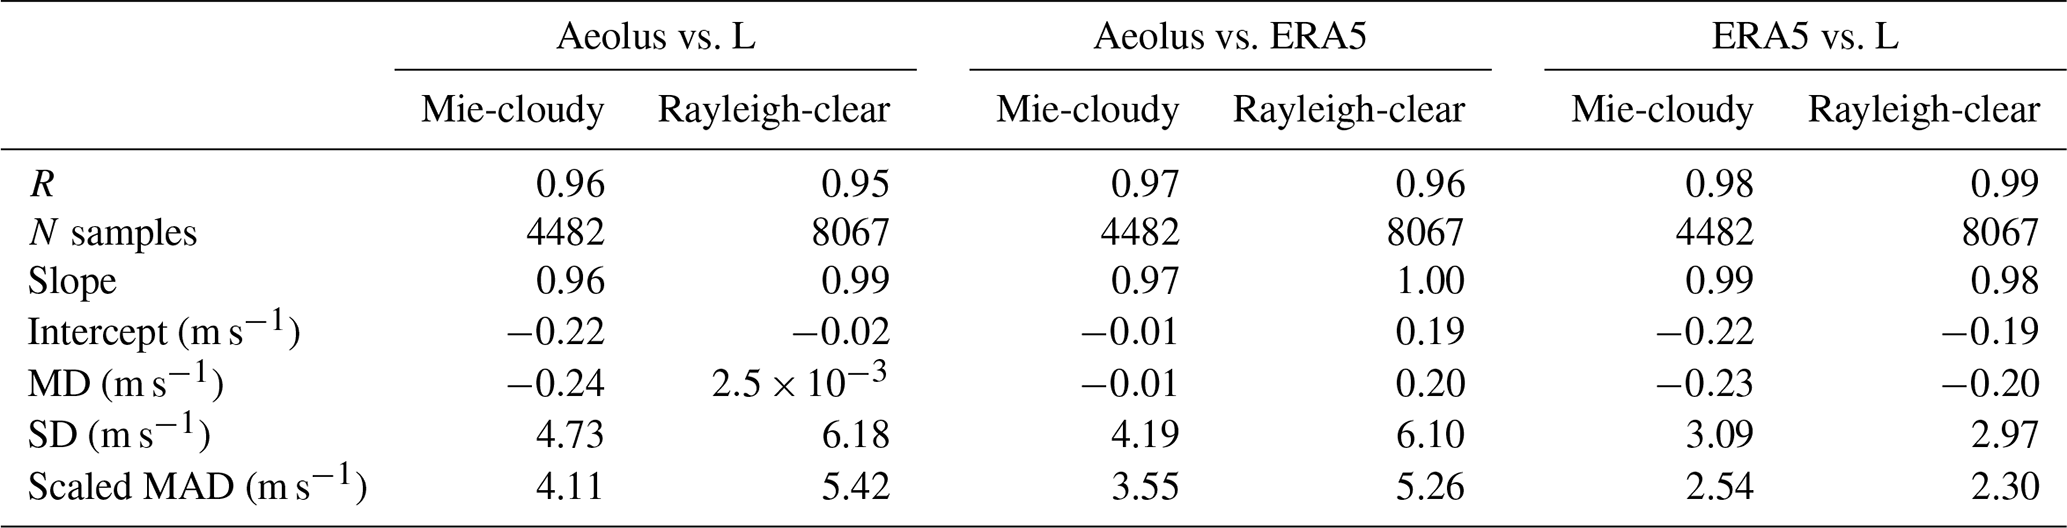
Table 3Same as Table 2 but for rectangle of ±1∘ lat and long. The distance of 1∘ lat and long is approximately 100 km in the regions we studied.
Because the present study also involved wind field data in different regions, the influence of the geographical location and climatic factors on data quality needed to be demonstrated. Figure 5 shows a comparison of the Aeolus and L-band RS data in the four regions used in the present study. The blue data points represent the data of the Rayleigh-clear group, and the red data points represent the data of the Mie-cloudy group. The colors of the linear fitting line and related parameters are consistent with the corresponding data points. Table 4 summarizes the results of this comparison. The consistency of the Aeolus and L-band RS data in the Qingyuan area was worse than that of the other three groups, which might be because Qingyuan is close to the tropics, where the atmospheric convection is active. In addition, from the perspective of the correlation coefficient R, the correlation of the Rayleigh-clear group between the Aeolus and the L-band RS data was higher; however, the SD value was also relatively higher than that of the Mie-cloudy group, which means that the data points were more scattered. As the latitude decreased, the data quality declined; however, the data quality of Baoshan is similar to that of Chifeng, which means that this trend was not obvious.
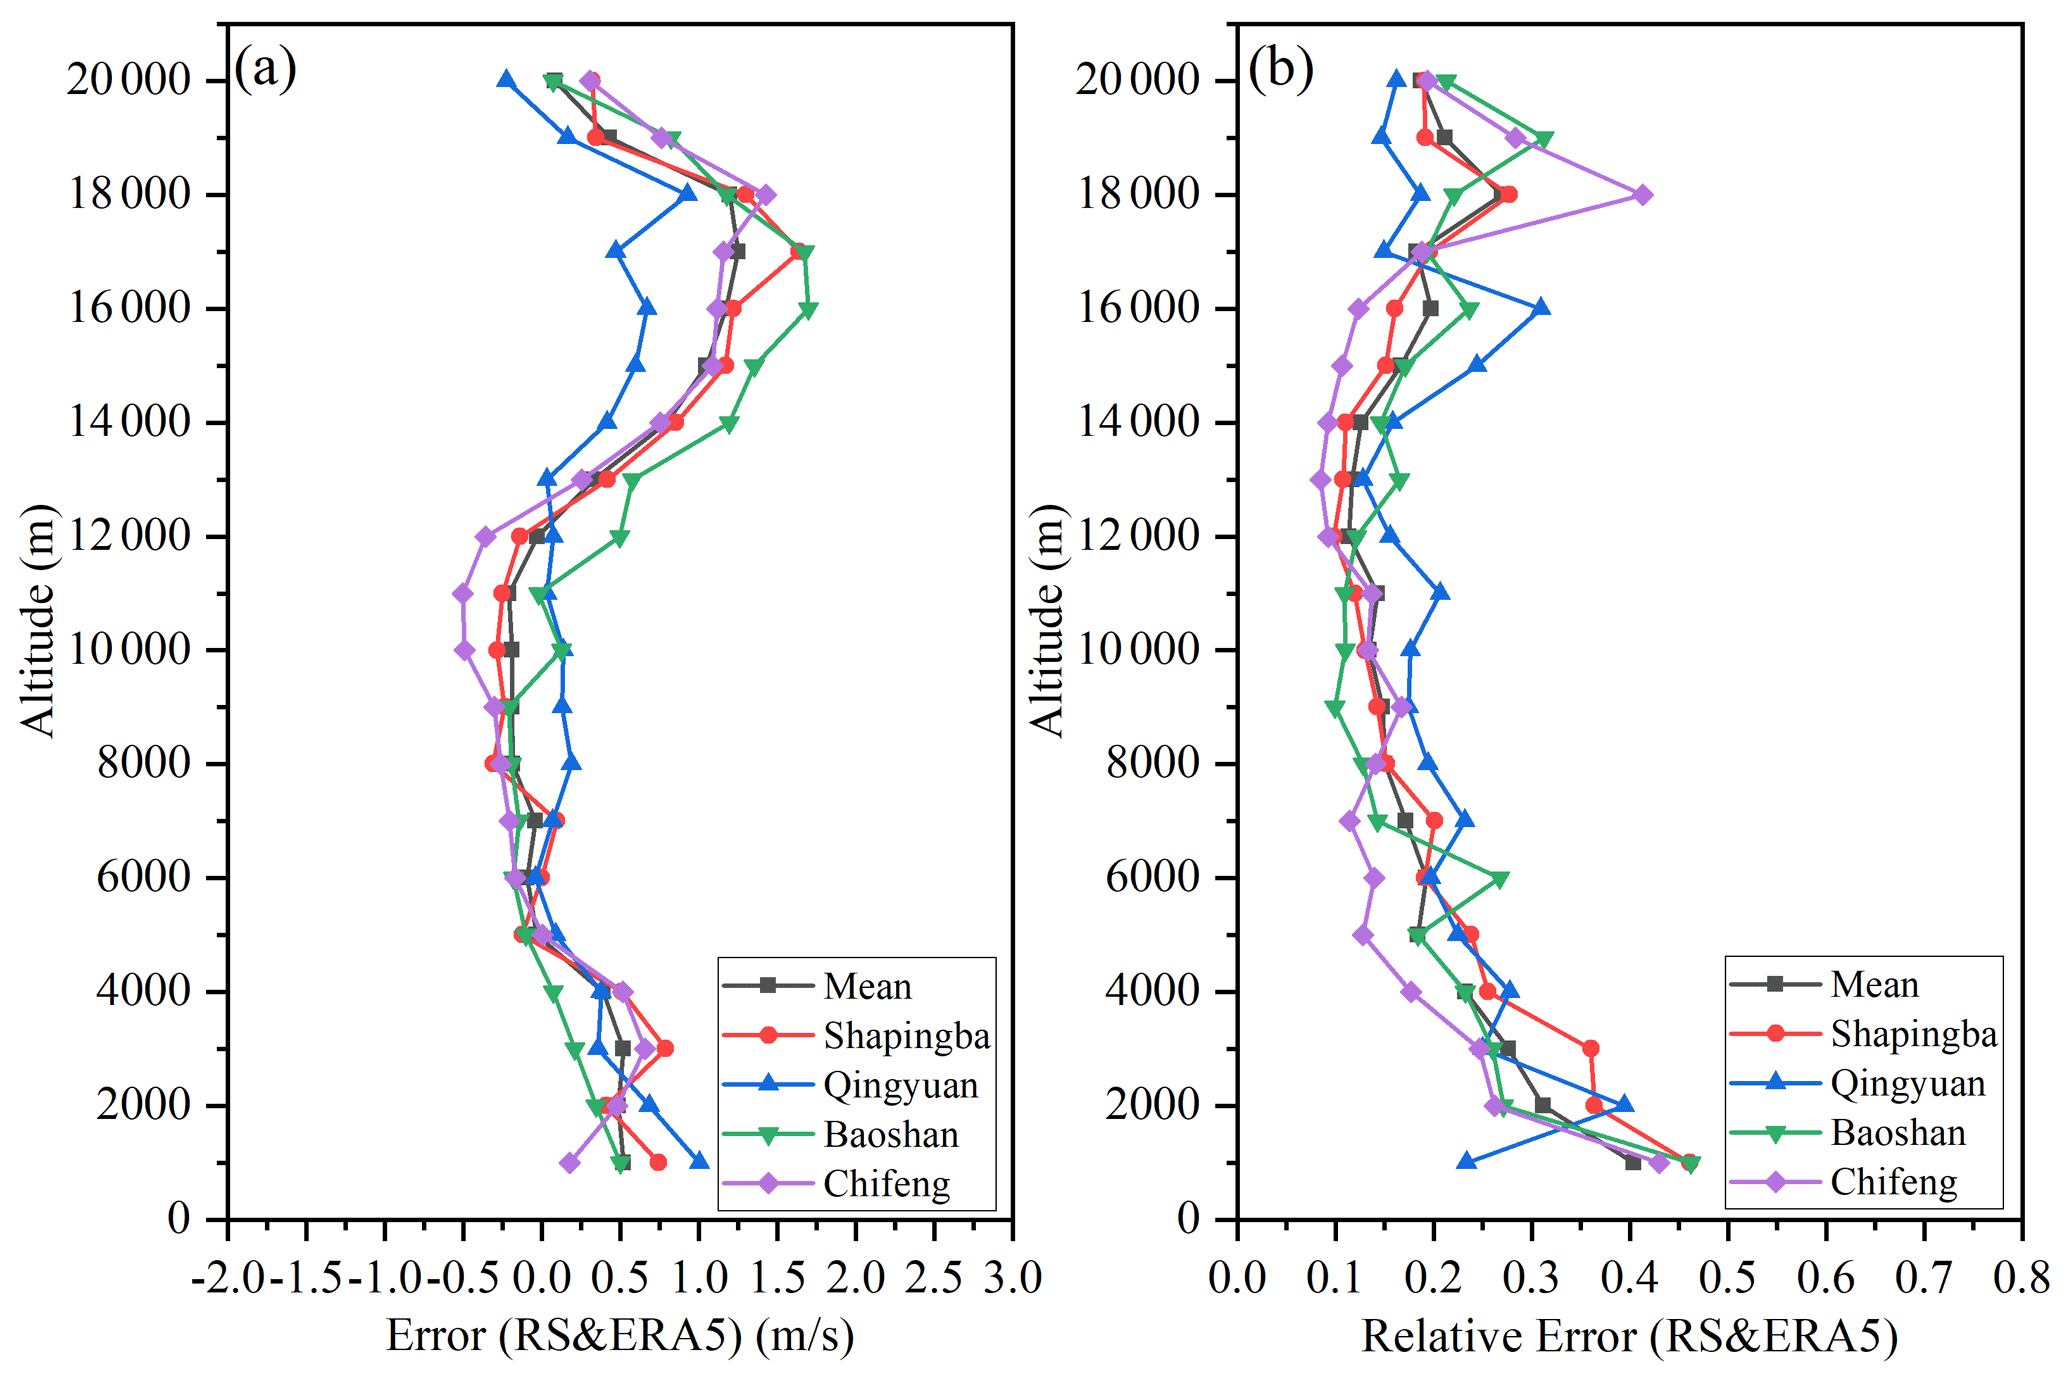
Figure 6Vertical comparison of ERA5 and RS wind data for four regions. (a) Error and (b) relative error.
Table 4Comparison results of Aeolus and L-band RS in different regions.

The data quality of the ERA5 and L-band RS wind data was further verified as the reference data. Previous studies have shown that ERA5 and RS wind data are relatively reliable in various wind field models and detection methods (Ingleby, 2017; Piasecki et al., 2019; Ramon et al., 2019; Molina et al., 2021). The ERA5 data (matching the RS data) used in the present study were compared and verified with the RS data in the vertical direction, and the results are shown in Fig. 6. Except for the vertical height range of 14–19 km, the average error between the RS and ERA5 wind field data was between −0.5 and 0.5 m s−1. However, Fig. 6b shows that the increase in the error between 14 and 19 km was caused by the increase in the wind speed value, and the relative error between the RS and the ERA5 wind data was within 0.3. The good consistency of the two datasets in the vertical direction indirectly verified the quality of the ERA5 and RS wind field data in the present study.
3.2 Seasonal variations in relative errors
After the data quality was confirmed, the three wind field datasets were introduced into Eqs. (3)–(9) to calculate the errors. The representative statistical distribution of errors is shown in Fig. 7a, which conforms to the Gaussian distribution law.
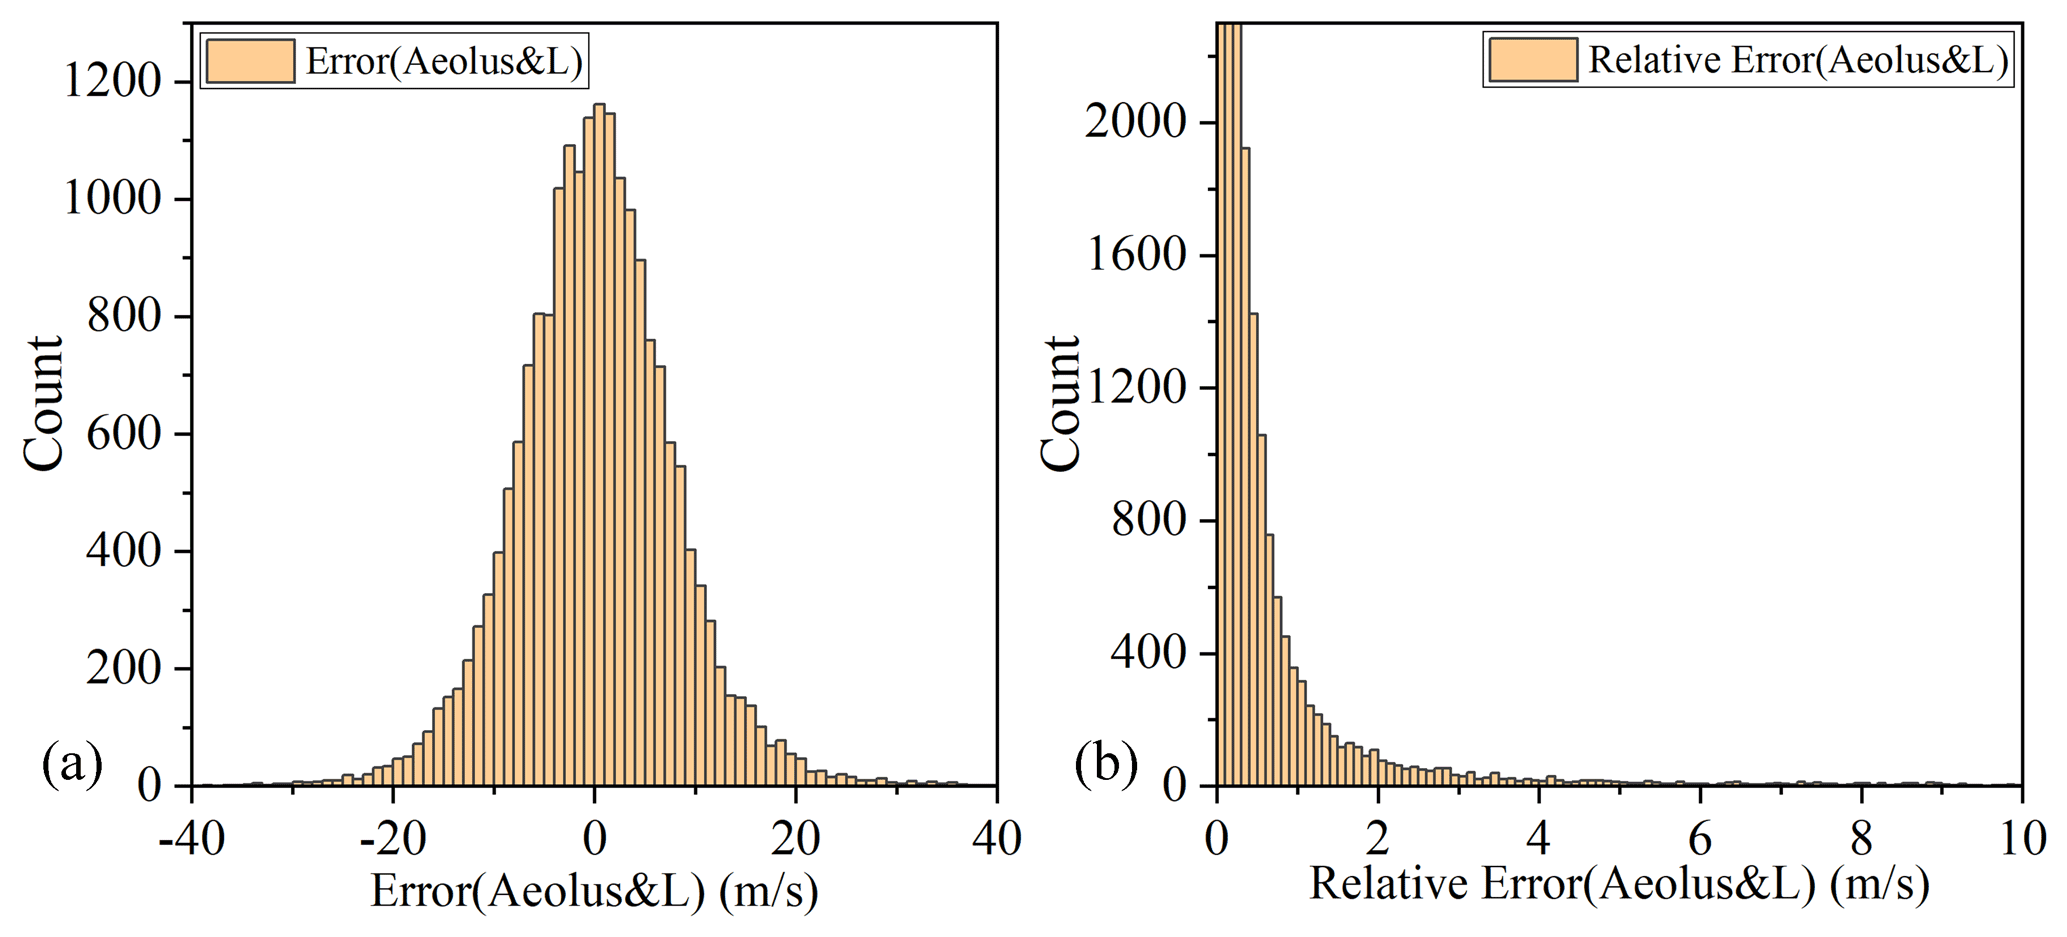
Figure 7Statistical distribution of the error (a) and relative error (b) between Aeolus detection and L-band RS data. The data were from the Rayleigh-clear group for 12 months in Chifeng.
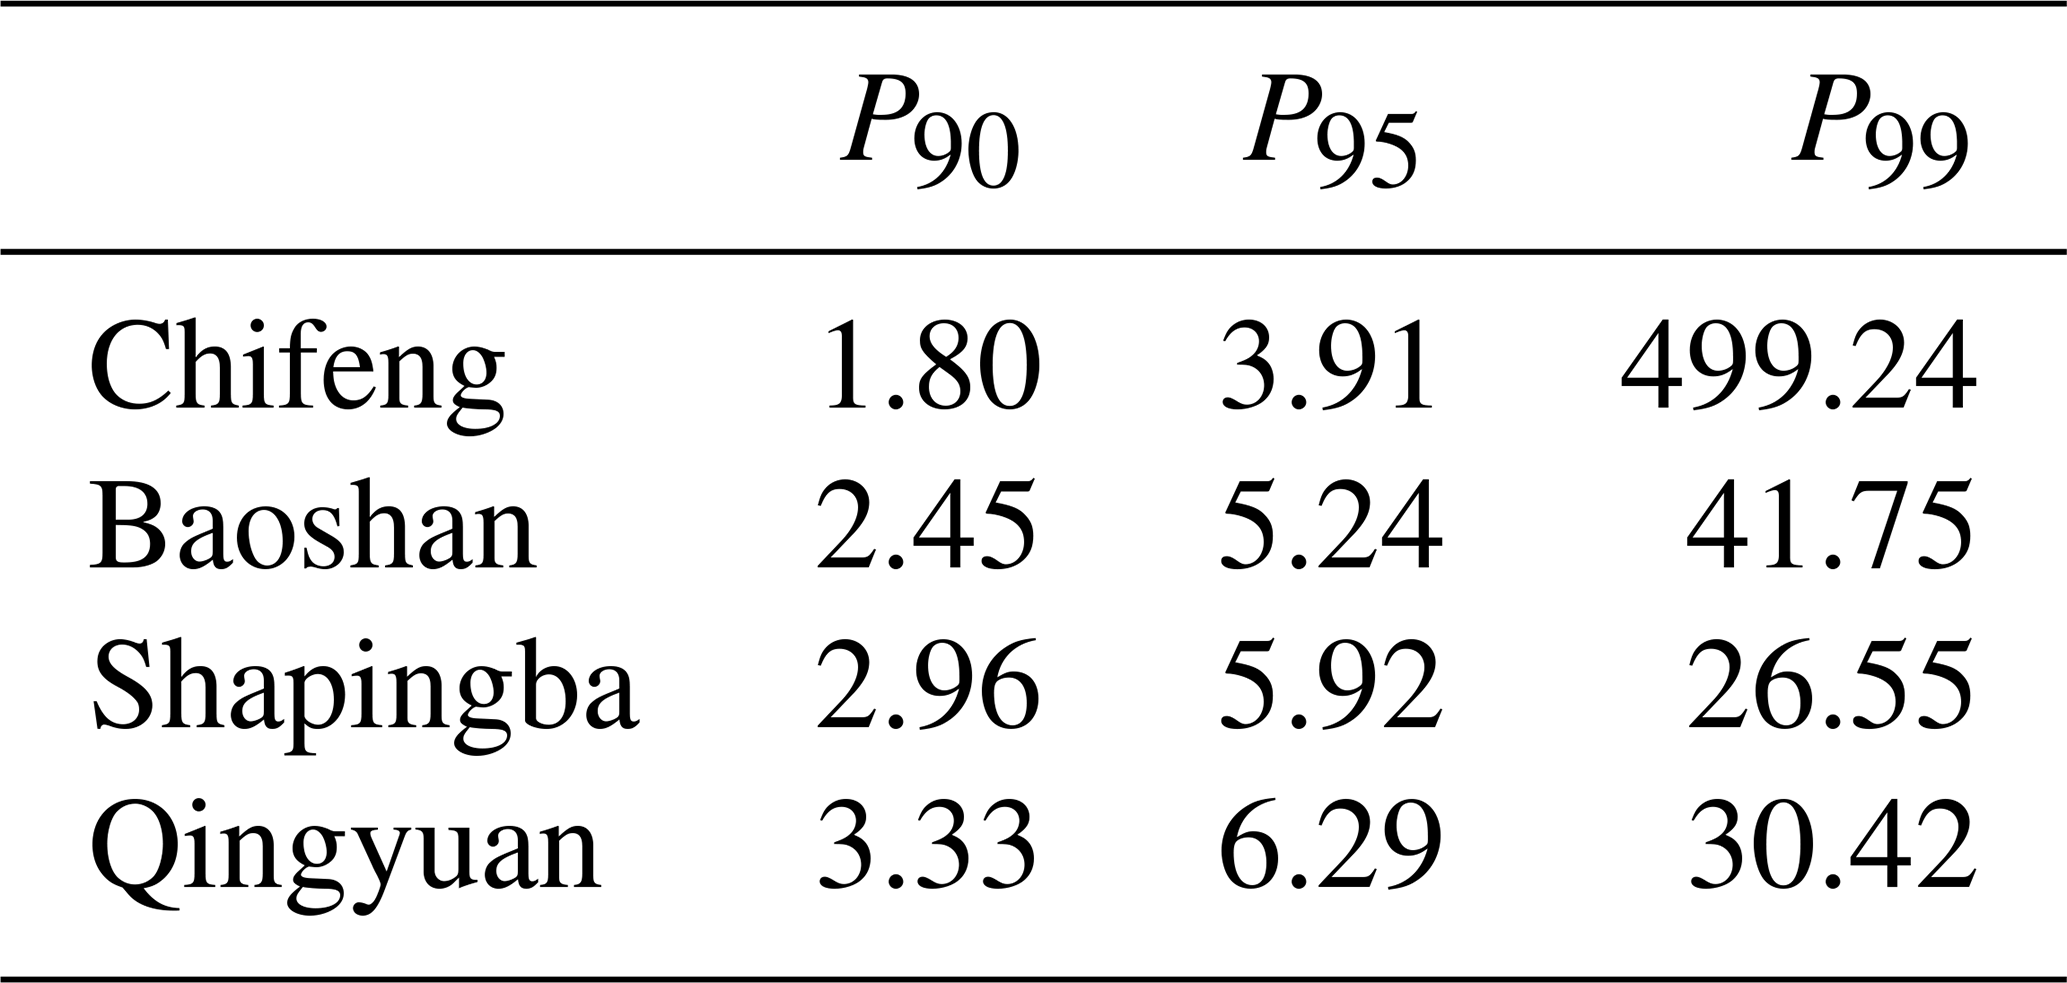
However, the value of the relative error is affected by the denominator in Eq. (7). When the value of the denominator is close to zero, the relative error has a larger outlier. The occurrence of such an outlier was sporadic and random, as shown in Fig. 7b. Although most of the relative errors were distributed in the interval [0, 3], sporadic outliers still existed in the range greater than 3. These outliers affect the subsequent calculations and must be filtered. The threshold screening method was selected for filtering, and the relative error that was greater than 3 (i.e., 300 %) was considered an invalid value. The statistical results of the relative error at the four RS stations are summarized in Table 5. When we choose 3 (300 %) as the relative error threshold, the most meaningful data points in the four regions were within the threshold.

Figure 8Monthly mean values of the three groups of relative errors in different regions and months, (a) Chifeng, (b) Baoshan, (c) Shapingba, and (d) Qingyuan.
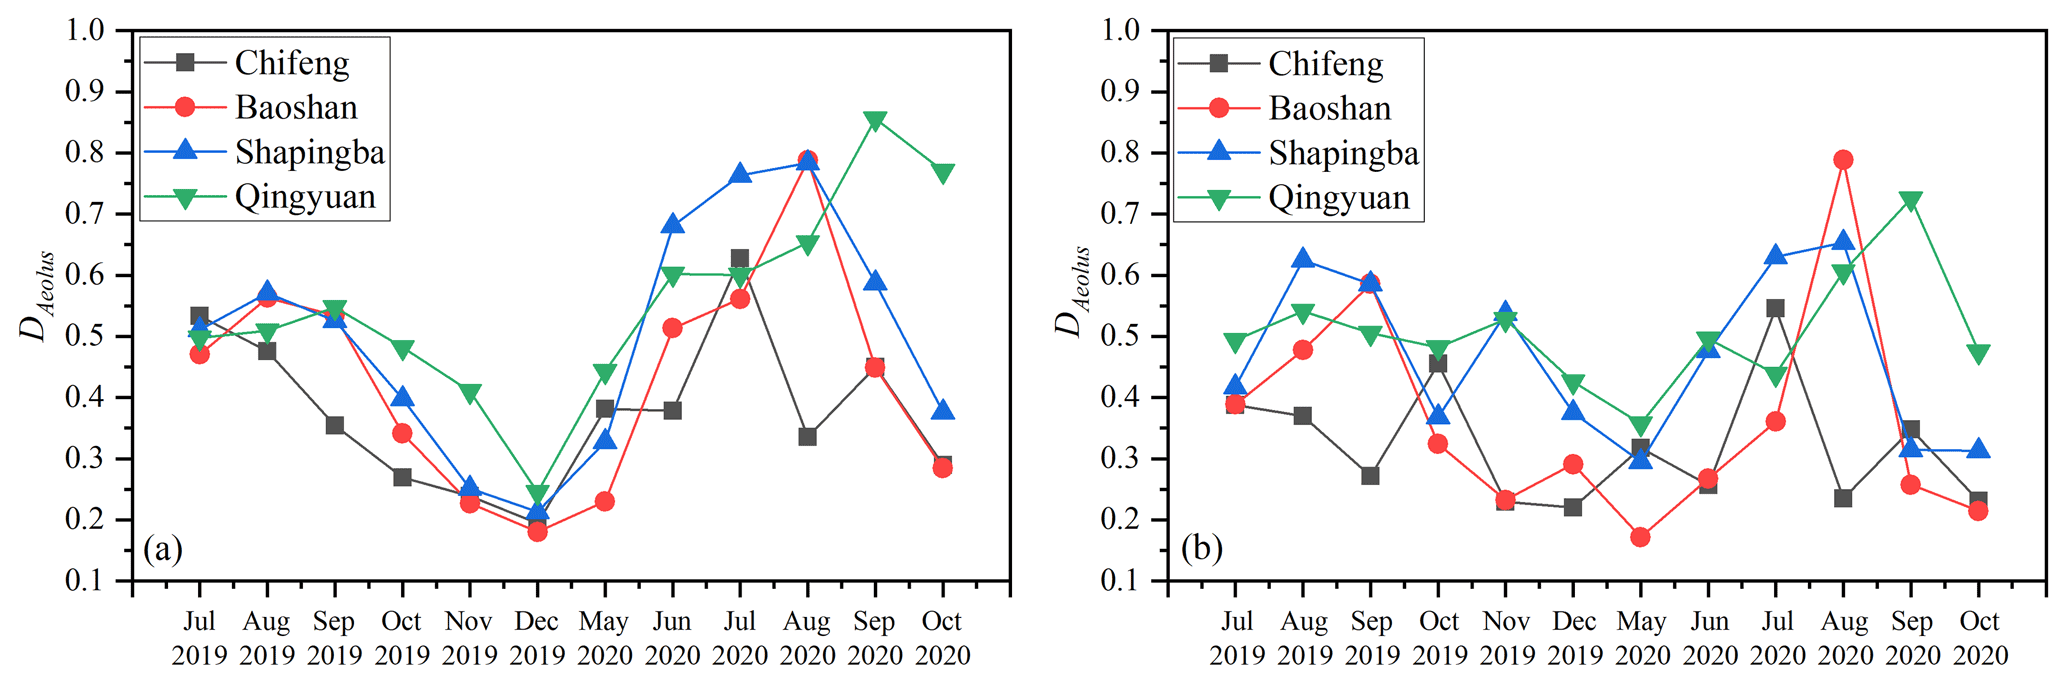
Figure 9Changes in the monthly average of DAeolus in different months, (a) Rayleigh-clear and (b) Mie-cloudy.
Table 5Percentiles of the relative error between Aeolus detection and L-band RS data for four regions. P90 represents the boundary value of the range where 90 % of the relative error falls. The mean of P95 and P99 are similar to P90.
Further, we used Eq. (8) to calculate the monthly average relative error for each month in each region. Then, Eq. (9) was used to calculate the monthly average of the Aeolus relative error parameters. Finally, we obtained the changes in the three sets of relative errors (Aeolus & L, L & ERA5, and Aeolus & ERA5) from July 2019 to October 2020 (data missing from January to April 2020), as shown in Fig. 8. For the Rayleigh-clear data, the relative error in the Aeolus data was significantly larger in summer. Although the (L & ERA5), which represents the error caused by imperfect space–time matching, also increased in summer, the increase in (Aeolus & L) and (Aeolus & ERA5) in the summer months was much larger than that of (L & ERA5). This increase in the relative error was caused by the variation in the Aeolus wind product performance. The same seasonal trend in the Rayleigh-clear data in the four regions (Fig. 9a) also confirmed this, as the mean relative error parameter in July was over 174 % higher than that in December. The mean random error was also calculated and had a 0.97 m s−1 increase in July compared to December. We also found that as the latitude decreased, the month in which the relative error peak appeared was delayed. Over the 2 years (2019–2020), the peaks of the relative errors for Chifeng were in July, whereas for Baoshan and Shapingba they were in August and Qingyuan was delayed to September. The relative errors in the summer of 2020 were higher to varying degrees than those in 2019, which was mainly caused by the decrease in the output laser energy of Aeolus. This effect is less pronounced for Mie-cloudy winds because they are not as strongly dependent on the laser energy.
We also calculated the monthly average value of DAeolus in the Mie-cloudy group, as shown in Fig. 9b. The monthly mean value of DAeolus in the Mie-cloudy group did not show a significant seasonal trend, similarly to the Rayleigh-clear group. The mean relative error parameter in July was only 39 % higher than that in December. Its seasonal fluctuations were relatively random for the different regions; however, the summer relative error was slightly larger overall.
The ECMWF proposed that varying temperature gradients across the instrument's mirror M1 caused seasonal fluctuations in the quality of the Aeolus detection data (Rennie and Isaksen, 2020). After applying corrections for the mirror effects, the seasonal variation caused by the thermal structure of the system itself theoretically became very small. Seasonal variations in relative errors may be partly due to seasonal variations in atmospheric conditions.
Considering the difference in the detection range between the Rayleigh-clear and Mie-cloudy groups (Mie-cloudy mainly detects the aerosol layer), this seasonal difference might be caused by seasonal changes in the real atmospheric environment. Therefore, we proposed and verified two conjectures based on the Aeolus working principle.
3.2.1 Seasonal variations in atmospheric wind direction
Because Aeolus detects only a single line-of-sight wind vector, the detection wind vector is a component of the real wind vector. When the angle between the detection and real wind vectors approaches 90∘, the real wind vector contributes almost nothing to the detection wind vector and the detection error is the largest. The closer the angle between the two is to 0 or 180∘, the smaller the detection error.
The wind direction of the atmospheric wind field exhibited an obvious seasonal trend. In China, the northwest monsoon prevails in the winter and the southeast in the summer (Chang, 2004; Huang et al., 2004; He et al., 2007). To verify whether the seasonal variation in wind direction was the cause of the seasonal variation in the Aeolus wind product performance, we analyzed the statistical distribution of the angle between the real horizontal wind and the Aeolus HLOS direction.
Based on the previous data-matching work, we calculated the angle α between the real horizontal wind direction (provided by the ERA5 data) and the Aeolus HLOS direction (provided by the L2B data) of each Aeolus valid data point. Figure 10 was obtained from the Rayleigh-clear group data. When the angle α was between 70 and 110∘, the relative error in the Aeolus data increased significantly. The proportion of data points with angles between 70 and 110∘ in July was 8.14 % higher than that in December. Most of the data points in December were concentrated in the vicinity of 0 and 180∘. Theoretically, this would significantly increase the average relative error in Aeolus in July, which might be one of the reasons for the increase in the relative error in Aeolus during the summer. For the Mie-cloudy group (Fig. 11), the proportion of data points with angles between 70 and 110∘ in July was 5.86 % higher than that in December; therefore, there was the same order of magnitude for the angle difference distribution of the Rayleigh-clear and Mie-cloudy data. However, the seasonal variation in the relative error in the Mie-cloudy group was much smaller than that in the Rayleigh-clear group; therefore, this conjecture cannot explain the seasonal performance of the Mie-cloudy group.

Figure 10Statistical distribution at different angles (HLOS and wind direction) about the data points and mean relative errors from the Rayleigh-clear group data. The relative error Dr in the figure was calculated from the 12-month data of the region; (a) Chifeng, (b) Baoshan, (c) Shapingba, and (d) Qingyuan.
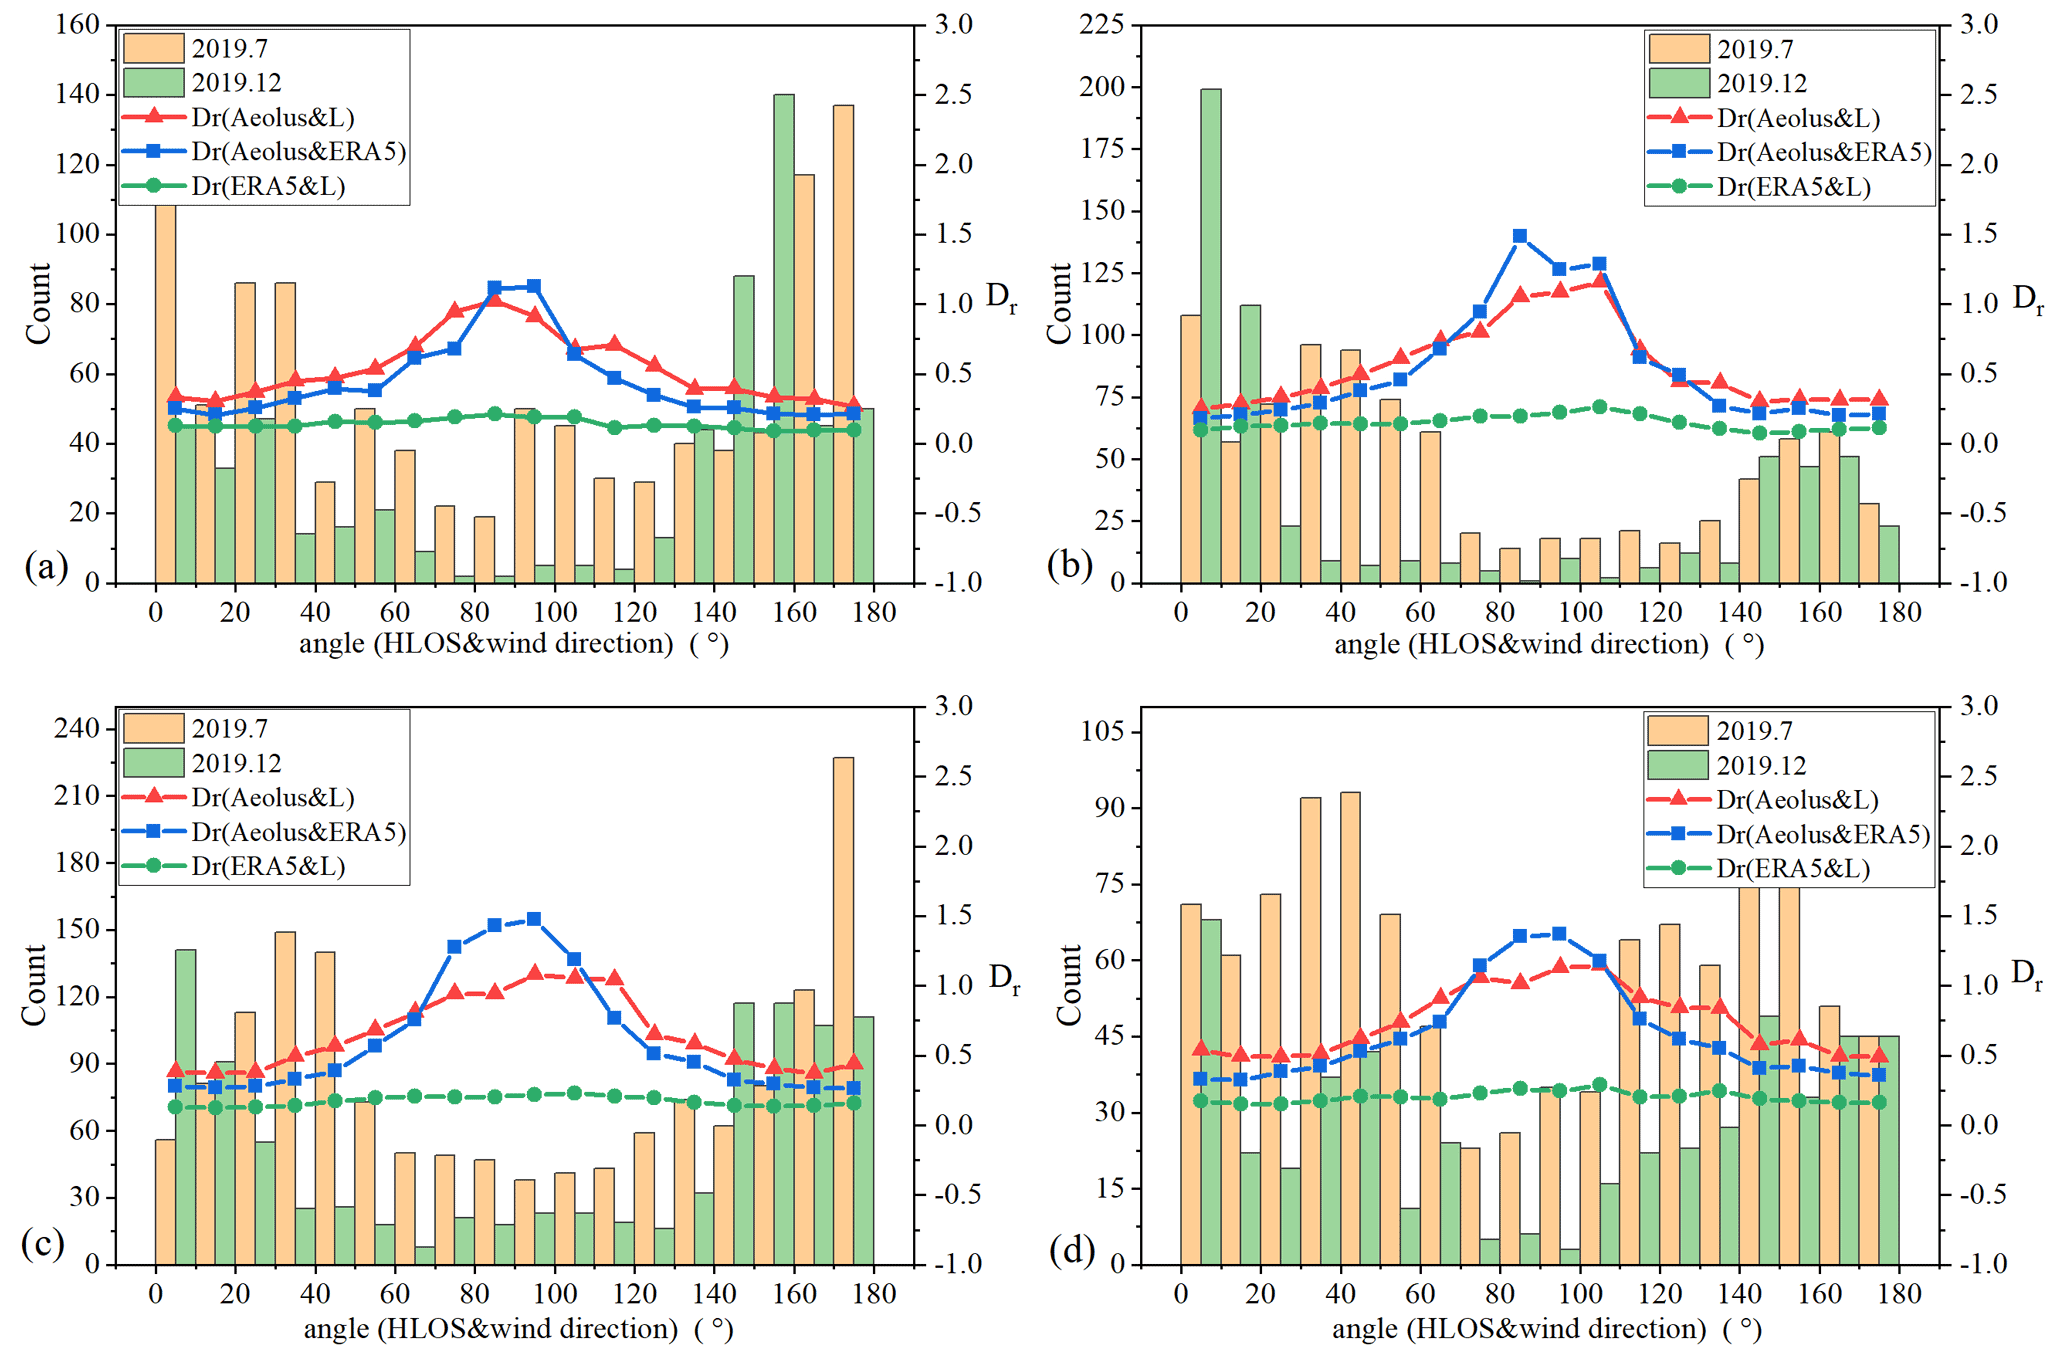
Figure 11Statistical distribution at different angles (HLOS and wind direction) about the data points and mean relative errors from the Mie-cloudy group data. The relative error Dr in the figure was calculated from the 12-month data of the region; (a) Chifeng, (b) Baoshan, (c) Shapingba, and (d) Qingyuan.
3.2.2 Seasonal variations in upper cloud cover
During the actual work process, the spaceborne wind lidar is susceptible to the influence of cloud aerosols. When the laser passes through the cloud aerosol layer, it is subjected to a strong attenuation effect, resulting in a decrease in the energy of the laser beam and signal-to-noise ratio (SNR). Simultaneously, for the Rayleigh channel, the cloud aerosol layer will cause strong Mie scattering, which will pollute the signal of the Rayleigh channel and increase its detection error (Rennie et al., 2020).
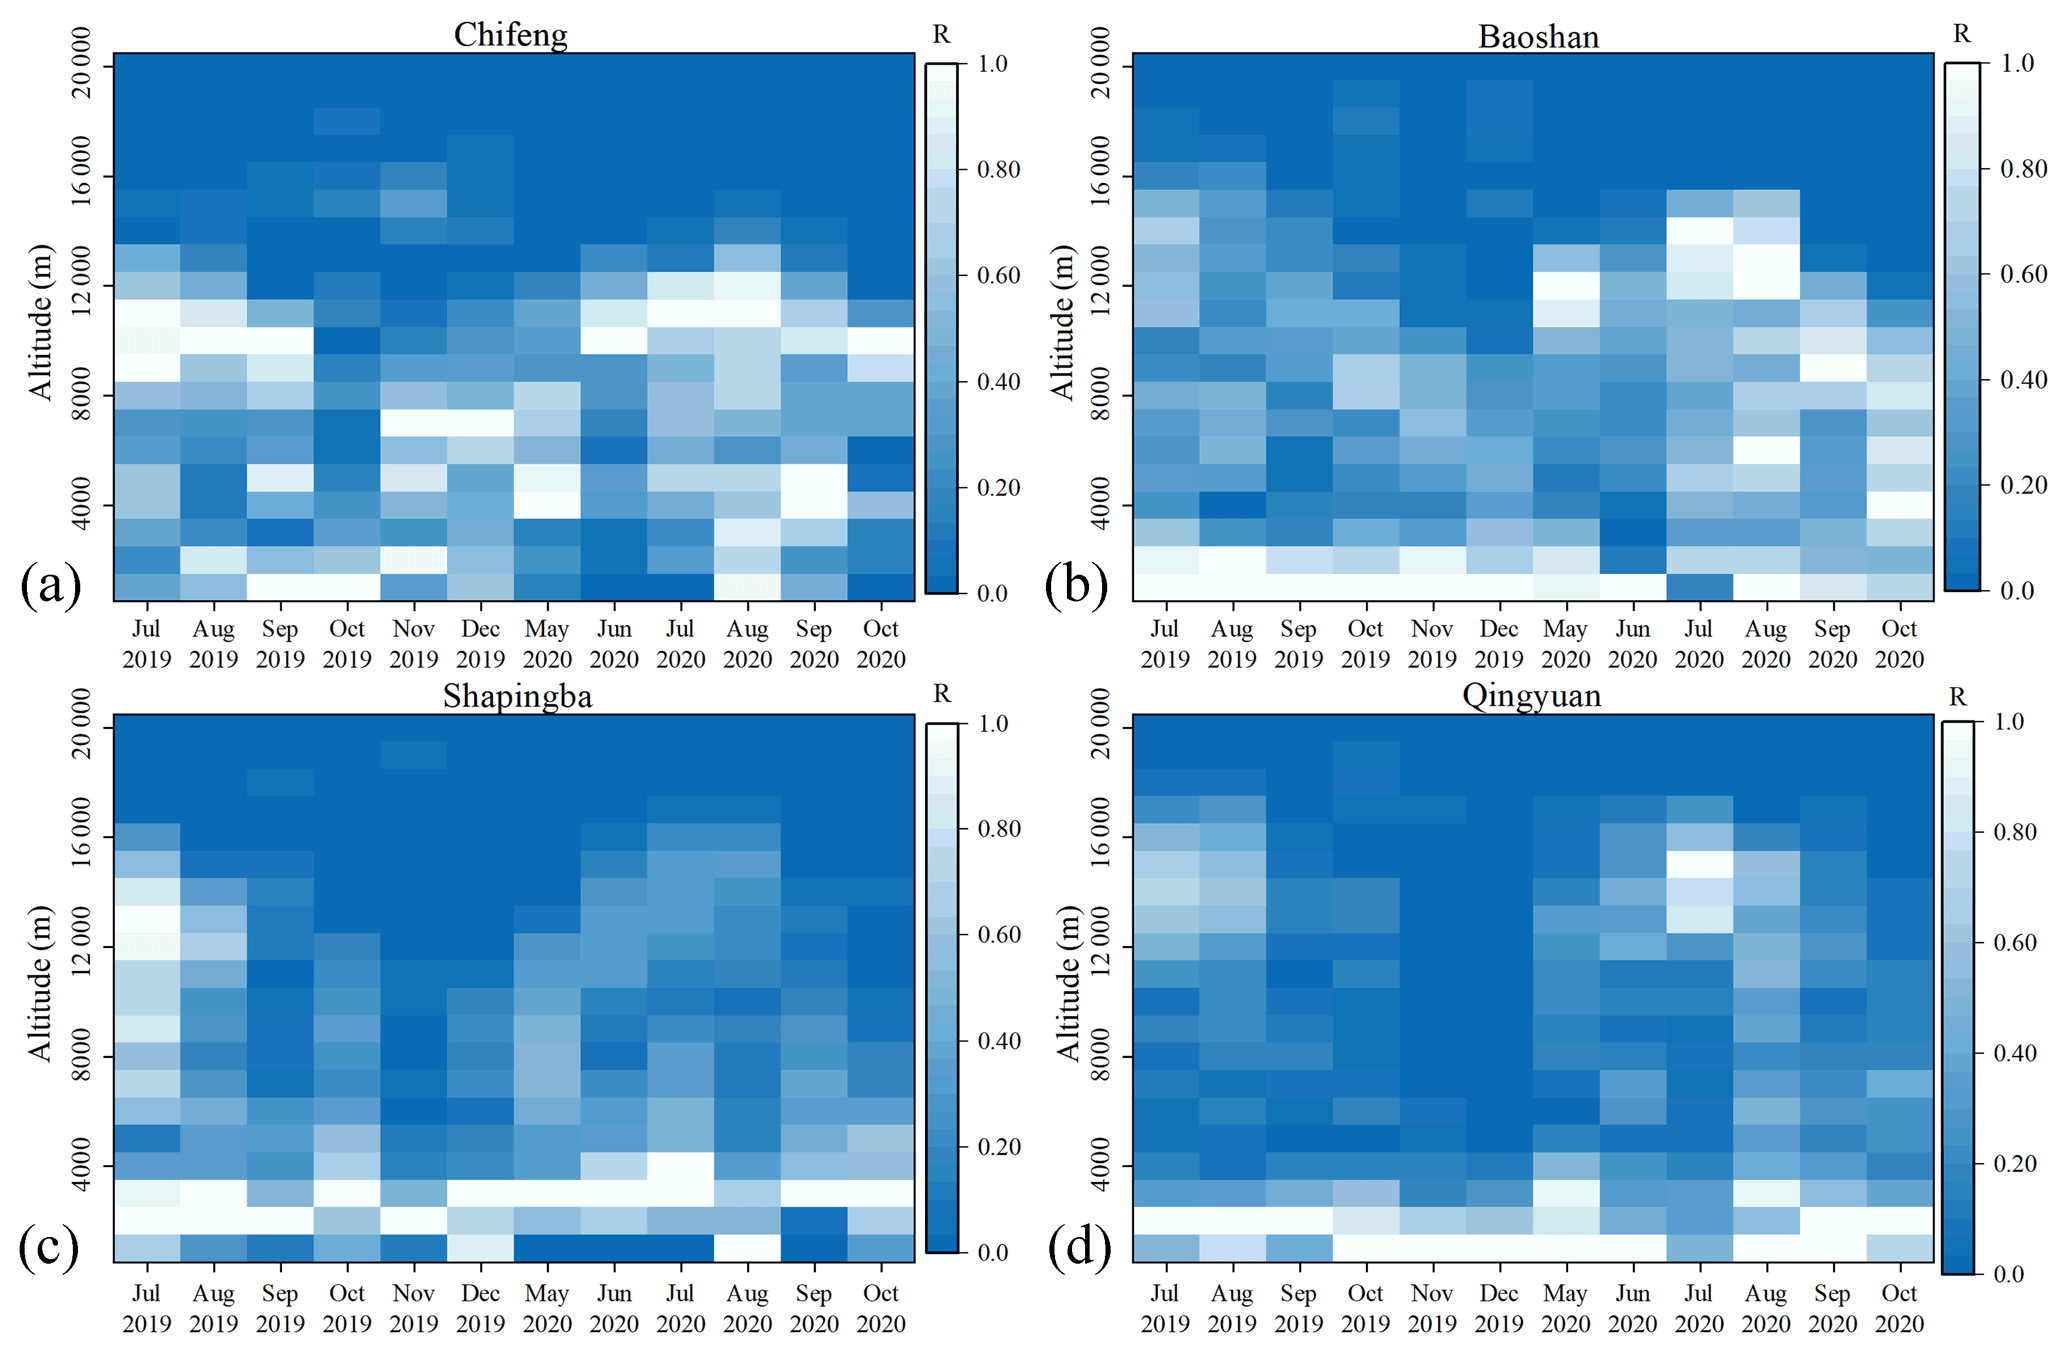
Figure 12Vertical distribution of R values in different regions and months. (a) Chifeng, (b) Baoshan, (c) Shapingba, and (d) Qingyuan.
Because the Rayleigh channel has comprehensive coverage in altitude, we took the effective data of the Rayleigh channel (both Rayleigh-clear and Rayleigh-cloudy) and counted the number of samples (Nclear, Ncloudy) based on the month and altitude and then defined the parameter r that represented the backscatter ratio:
r was normalized to obtain the parameter R. The larger the value of the parameter R, the stronger the scattering of Mie in the altitude layer. We calculated the R value of 12 months in different regions with a height resolution of 1000 m to obtain Fig. 12. Obvious high-altitude Mie scattering layers existed for the four areas during summer, whereas during autumn and winter, this Mie scattering layer moved to areas with lower altitudes, with the Mie scattering intensity weakened. In Qingyuan, the high-altitude Mie scattering layer in November and December 2019 was very weak (Fig. 12d).
The ERA5 cloud coverage information matching with the Aeolus data points is shown in Fig. 13. The r value in Fig. 13 represents the backscattering ratio, defined by Eq. (10). The mean cloud coverage and r values had a similar trend in the vertical direction; however, they were different in the near-ground area because the main reason for the Mie scattering here was aerosols rather than clouds. Taken together, the high-altitude Mie scattering layer in Fig. 12 in summer was caused by the presence of clouds in the area.

Figure 13ERA5 cloud coverage of the valid Rayleigh channel data in the vertical direction. Data in (a) are from Qingyuan in July 2019, and data in (b) are from Qingyuan in December 2019. The green line is the mean value of cloud coverage at different distance gates.
Therefore, the height of the cloud tops in summer increased significantly within the Aeolus detection height range. Combining the results (Figs. 12 and 13), the cloud top height in July was approximately 3–5 km higher than that in December for the four regions, which was consistent with the seasonal variation rule of cloud top height in East Asia (Zhao et al., 2020).
When the satellite-borne wind lidar worked, the high-altitude cloud layer attenuated the laser beam and reduced the energy of the laser beam passing through the cloud layer. Thus, the SNR of the echo signal in the area below the high cloud decreased, and the detection error increased. Simultaneously, the Rayleigh signal from the cloudy area was interfered with by the Mie scattering signal, which affected the calculation of its Doppler shift. Although the Aeolus data processing algorithm uses a strict backscatter ratio threshold to remove the Rayleigh channel data elements that may contain Mie scattering from the Rayleigh-clear group (Rennie et al., 2020), the signal interference still affects the final inversion result.
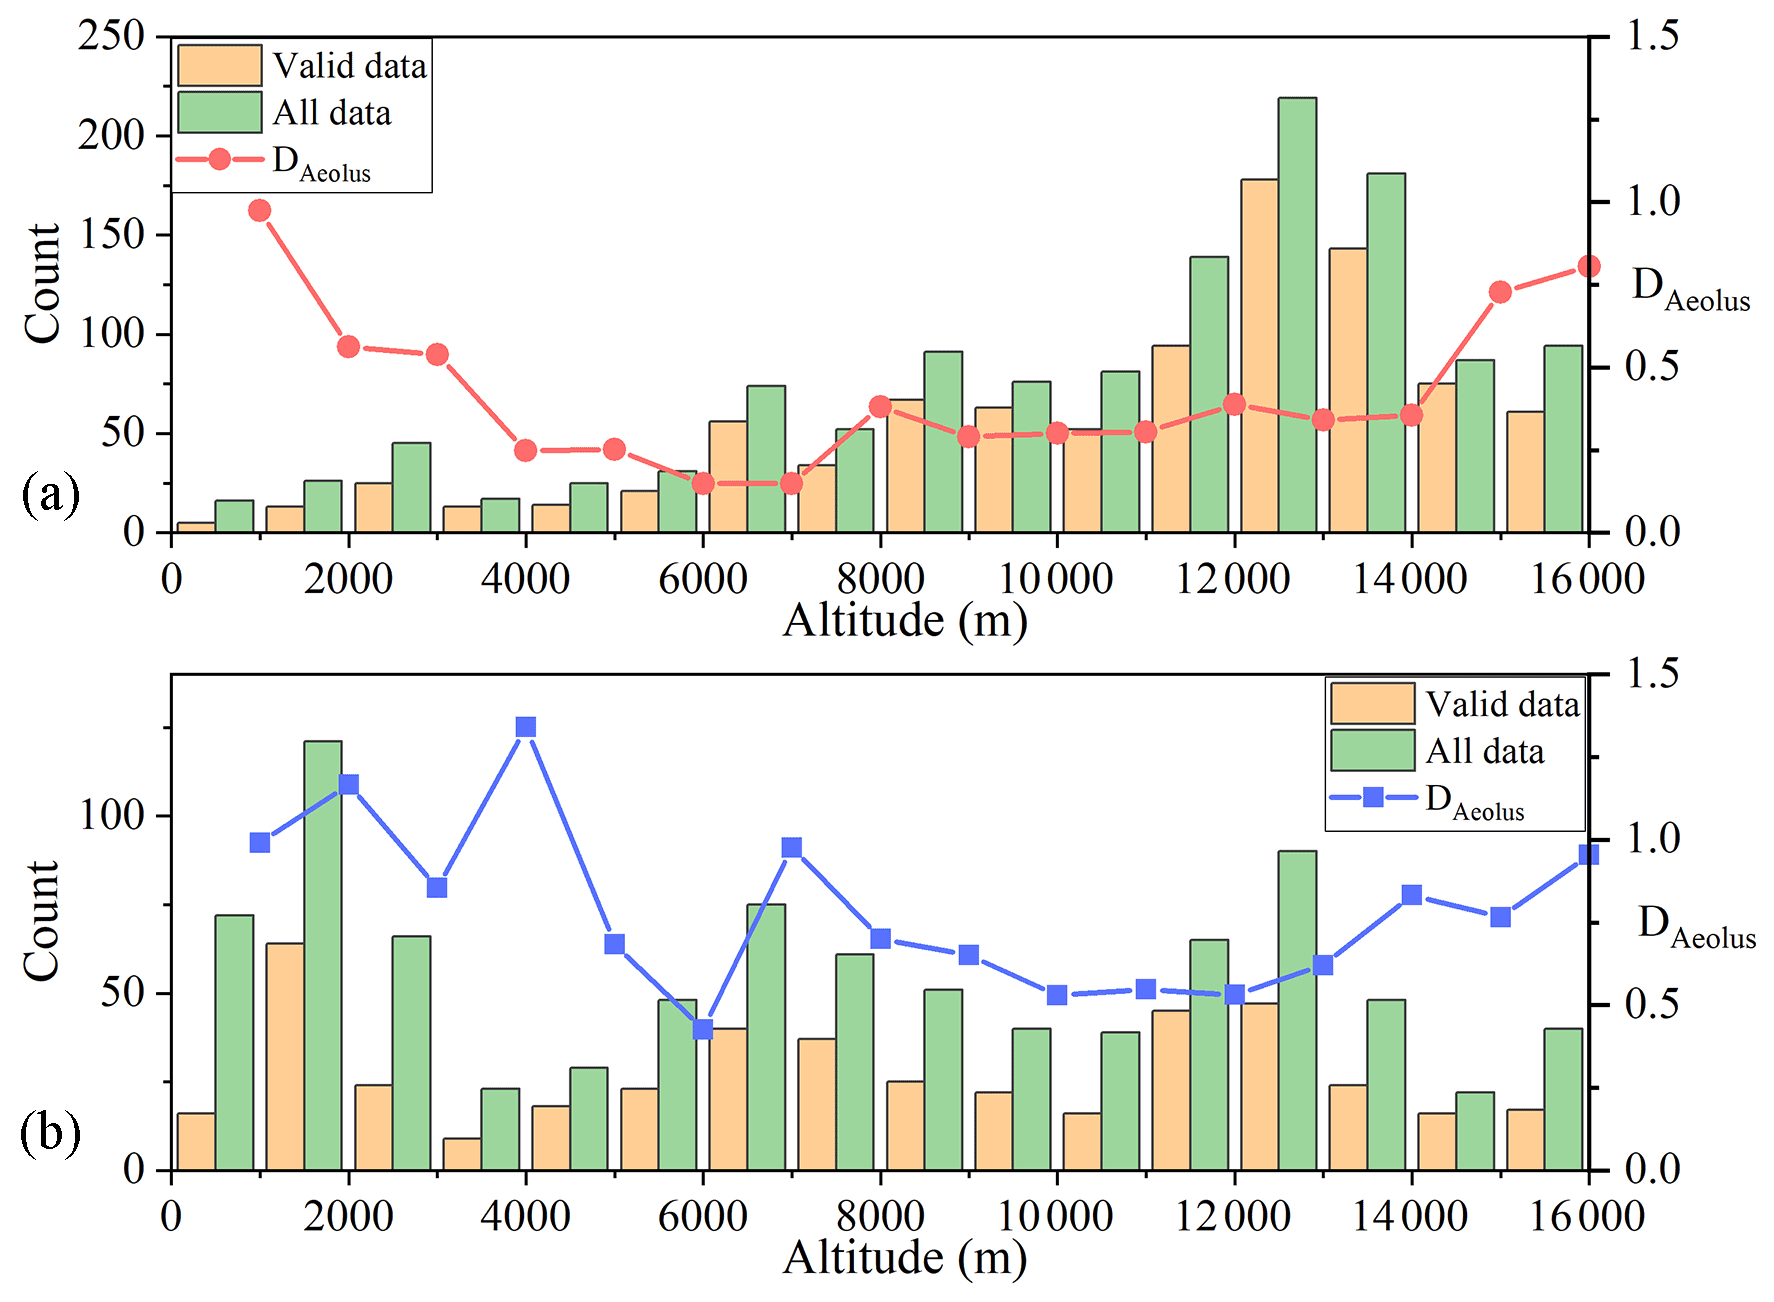
Figure 14Distribution of Mie-cloudy data points and DAeolus in altitude. (a) July 2020 and (b) August 2020. Data are from Baoshan.
Finally, we attempted to use this conjecture to explain why the relative error seasonal variation in the Mie-cloudy group was not obvious (Fig. 9b). There are two special data points in Fig. 9b: July and August 2020 in Baoshan. These were both during the summer; however, the average relative error in August was significantly higher than that in July. The vertical distribution of the valid data points and all data points of the Mie-cloudy group in the 2 months are shown in Fig. 14. The data points in July were mainly distributed in the high-altitude cloud area, which might be due to the dense clouds in the upper air in July making it difficult for the Mie channel to detect the area below the clouds. The Mie scattering signal of the high-altitude cloud layer close to the satellite, i.e., small optical thickness and high SNR, improved the Aeolus data quality. In addition, the Mie channel discriminator was not sensitive to the Rayleigh scattering signal; therefore, it was unnecessary to consider the Rayleigh signal interference (Rennie et al., 2020). In August, the data points were evenly distributed in the vertical direction, and the number of low-altitude data accounted for a considerable proportion. Before the laser beam reached a low altitude, it was attenuated by high-altitude clouds. The low-altitude Mie-scattered echo signal generated by the laser beam propagated through the upper atmosphere and attenuated again. Therefore, it became very weak when it reached the Aeolus receiving telescope, which was not conducive to subsequent signal processing and reduced the quality of the Mie-cloudy data. DAeolus was significantly higher in August than in July when the altitude was lower than 8 km, which supports the above explanation (Fig. 14). Therefore, in summer, a considerable part of the data in the Mie-cloudy group came from a high altitude; however, the low-altitude and the high-altitude Mie scattering signals contributed to the overall relative error in the opposite way, which might be why the seasonal variation in the Aeolus relative error in the Mie-cloudy group was not obvious.
In the present study, the seasonal variation in the Aeolus wind product performance in China was analyzed using Aeolus detection data, L-band RS detection data, and ERA5 data from July to December 2019 and May to October 2020. First, the difference between the Aeolus and L-band RS data was discussed, and the selection threshold of the Aeolus data estimation error was clarified, which was 8 m s−1 for the Rayleigh-clear data and 4 m s−1 for the Mie-cloudy data. After the valid data were filtered, a comparative analysis of the three wind field datasets was undertaken. The R value of Aeolus's Rayleigh-clear (Mie-cloudy) data and ERA5 data was 0.96 (0.97), and the R value of the L-band RS data was 0.92 (0.94). Therefore, the Aeolus detection data were in good agreement with the ERA5 and L-band RS data, and the quality of the data used in the present study was reliable.
These three datasets were then used to calculate the monthly mean value of the relative error. The calculation results showed that the relative error in the summer Rayleigh-clear data in the four regions increased significantly, and the average relative error in July was 174 % higher than that in December. In the Mie-cloudy group, this seasonal trend was not obvious and the performance was more random. Combining the working principle of Aeolus, we proposed two conjectures to explain the seasonal variation in the relative error in the Aeolus data. One was the variation in the angle between the actual horizontal wind direction and Aeolus HLOS direction, which might have affected the extent of the Aeolus single-vector data to reflect the true wind vector. The other was the seasonal variation in the altitude of the high-altitude clouds and cloud tops, which might have affected the SNR of the echo signals in different channels.
For the first conjecture, we calculated the distribution of the angle between the actual horizontal wind direction and the Aeolus HLOS direction of different regions in July and December. There were more data points distributed in the high error interval of 70–110∘ in July than in December; therefore, this conjecture was reasonable. However, the first conjecture encountered problems in explaining the situation of the Mie-cloudy data. For the second conjecture, we set the parameter R to represent the backscattering ratio and calculated the distribution of R at different altitudes in different months. There was a strong high-altitude Mie scattering layer in summer. Combined with the cloud coverage information, the Mie scattering layer was caused by the high-altitude clouds in summer. The high-altitude clouds reduced the SNR of the echo signal received by Aeolus and interfered with the signal analysis and processing of the Rayleigh channel. This conjecture is also reasonable and can explain the seasonal variation in the relative error in the Mie-cloudy channel of Aeolus.
In the present study, the analysis of the Aeolus data quality and its seasonal changes in four regions (Chifeng, Baoshan, Shapingba, and Qingyuan) of China will help in the better understanding and use of the Aeolus detection data over China. Besides, this study is helpful for figuring out the influence of clouds and wind direction on the detection performance of Aeolus, which will provide a reference for the follow-up development of spaceborne wind lidar.
The Aeolus L2B data used in this study can be downloaded from https://aeolus-ds.eo.esa.int/oads/access/collection (last access: 27 July 2021) (ESA, 2021). The L-band RS data can be provided for non-commercial research purposes upon request (Yinchao Zhang – ychang@bit.edu.cn). The ERA5 data can be downloaded from https://cds.climate.copernicus.eu/cdsapp#!/dataset/10.24381/cds.bd0915c6?tab=overview (last access: 27 July 2021) (Hersbach et al., 2018).
SC and RC conceived the idea for verifying the seasonal variation in Aeolus wind product performance over China. RC and YX conducted the data analyses and co-wrote the manuscript. YZ, WT, HC, PG, and PZ discussed the experimental results. All coauthors helped in reviewing the manuscript.
The authors declare that they have no conflict of interest.
Publisher's note: Copernicus Publications remains neutral with regard to jurisdictional claims in published maps and institutional affiliations.
This article is part of the special issue “Aeolus data and their application (AMT/ACP/WCD inter-journal SI)”. It is not associated with a conference.
We are very grateful to the China Meteorological Administration for the L-band RS data in China, the ESA for the Aeolus data, and the ECMWF for ERA5.
This paper was edited by Geraint Vaughan and reviewed by two anonymous referees.
Baars, H., Herzog, A., Heese, B., Ohneiser, K., Hanbuch, K., Hofer, J., Yin, Z., Engelmann, R., and Wandinger, U.: Validation of Aeolus wind products above the Atlantic Ocean, Atmos. Meas. Tech., 13, 6007–6024, https://doi.org/10.5194/amt-13-6007-2020, 2020.
Belova, E., Kirkwood, S., Voelger, P., Chatterjee, S., Satheesan, K., Hagelin, S., Lindskog, M., and Körnich, H.: Validation of Aeolus winds using ground-based radars in Antarctica and in northern Sweden, Atmos. Meas. Tech. Discuss. [preprint], https://doi.org/10.5194/amt-2021-54, in review, 2021.
Chang, C.-P.: East Asian Monsoon, World Scientific, Singapore, 2004.
ESA – European Space Agency: ESA Aeolus Online Dissemination System, available at: https://aeolus-ds.eo.esa.int/oads/access/collection, last access: 27 July 2021.
European Space Agency, Andersson, E., and Clissold, P. (Eds.): ADM-Aeolus: science report, ESA Communication Production Office, Noordwijk, the Netherlands, 121 pp., 2008.
Frehlich, R.: Estimation of velocity error for Doppler lidar measurements, J. Atmos. Ocean. Tech., 18, 1628–1639, 2001.
Guo, J., Miao, Y., Zhang, Y., Liu, H., Li, Z., Zhang, W., He, J., Lou, M., Yan, Y., Bian, L., and Zhai, P.: The climatology of planetary boundary layer height in China derived from radiosonde and reanalysis data, Atmos. Chem. Phys., 16, 13309–13319, https://doi.org/10.5194/acp-16-13309-2016, 2016.
Guo, J., Liu, B., Gong, W., Shi, L., Zhang, Y., Ma, Y., Zhang, J., Chen, T., Bai, K., Stoffelen, A., de Leeuw, G., and Xu, X.: Technical note: First comparison of wind observations from ESA's satellite mission Aeolus and ground-based radar wind profiler network of China, Atmospheric Chem. Phys., 21, 2945–2958, https://doi.org/10.5194/acp-21-2945-2021, 2021.
Hauchecorne, A., Khaykin, S., Wing, R., Mariscal, J.-F., Porteneuve, J., Cammas, J.-P., Marquestaut, N., Payen, G., and Duflot, V.: Validation of ESA Aeolus wind observations using French ground-based Rayleigh Doppler lidars at midlatitude and tropical sites, EGU General Assembly Conference Abstracts, 22, 19786, https://doi.org/10.5194/egusphere-egu2020-19786, 2020.
He, J., Ju, J., Wen, Z., Lü, J., and Jin, Q.: A review of recent advances in research on Asian monsoon in China, Adv. Atmos. Sci., 24, 972–992, 2007.
Hersbach, H., Bell, B., Berrisford, P., Biavati, G., Horányi, A., Muñoz Sabater, J., Nicolas, J., Peubey, C., Radu, R., Rozum, I., Schepers, D., Simmons, A., Soci, C., Dee, D., and Thépaut, J.-N.: ERA5 hourly data on pressure levels from 1979 to present, Copernicus Climate Change Service (C3S) Climate Data Store (CDS) [data], available at: https://cds.climate.copernicus.eu/cdsapp#!/dataset/10.24381/cds.bd0915c6?tab=overview (last access: 27 July 2021), 2018.
Hersbach, H., Bell, B., Berrisford, P., Hirahara, S., Horányi, A., Muñoz-Sabater, J., Nicolas, J., Peubey, C., Radu, R., and Schepers, D.: The ERA5 global reanalysis, Q. J. Roy. Meteorol. Soc., 146, 1999–2049, 2020.
Huang, R., Huang, G., and Wei, Z.: Climate variations of the summer monsoon over China, in: East Asian Monsoon, World Scientific, Singapore, 213–268, 2004.
Ingleby, B.: An assessment of different radiosonde types 2015/2016, European Centre for Medium Range Weather Forecasts, ECMWF Technical Memorandum, ECMWF, 2017.
Ishii, S., Okamoto, K., Baron, P., Ishibashi, T., Tanaka, T., Sekiyama, T., Maki, T., Kubota, T., Satoh, Y., Sakaizawa, D., Yamashita, K., Gamo, K., Ochiai, S., Yasui, M., Oki, R., Satoh, M., and Iwasaki, T.: Study on measurement performance of future space-based Doppler wind lidar in Japan, in: 2017 IEEE International Geoscience and Remote Sensing Symposium (IGARSS), July 2017, Japan, 4238–4245, https://doi.org/10.1109/IGARSS.2017.8127938, 2017.
Liu, B., Guo, J., Gong, W., Zhang, Y., Shi, L., Ma, Y., Li, J., Guo, X., Stoffelen, A., de Leeuw, G., and Xu, X.: Intercomparison of wind observations from ESA's satellite mission Aeolus, ERA5 reanalysis and radiosonde over China, Atmos. Chem. Phys. Discuss. [preprint], https://doi.org/10.5194/acp-2021-41, in review, 2021.
Lux, O., Lemmerz, C., Weiler, F., Marksteiner, U., Witschas, B., Rahm, S., Geiß, A., and Reitebuch, O.: Intercomparison of wind observations from the European Space Agency's Aeolus satellite mission and the ALADIN Airborne Demonstrator, Atmos. Meas. Tech., 13, 2075–2097, https://doi.org/10.5194/amt-13-2075-2020, 2020.
Martin, A., Weissmann, M., Reitebuch, O., Rennie, M., Geiß, A., and Cress, A.: Validation of Aeolus winds using radiosonde observations and numerical weather prediction model equivalents, Atmos. Meas. Tech., 14, 2167–2183, https://doi.org/10.5194/amt-14-2167-2021, 2021.
Molina, M. O., Gutiérrez, C., and Sánchez, E.: Comparison of ERA5 surface wind speed climatologies over Europe with observations from the HadISD dataset, Int. J. Climatol., 1–15, joc.7103, https://doi.org/10.1002/joc.7103, 2021.
Piasecki, A., Jurasz, J., and Kies, A.: Measurements and reanalysis data on wind speed and solar irradiation from energy generation perspectives at several locations in Poland, SN Appl. Sci., 1, 865, https://doi.org/10.1007/s42452-019-0897-2, 2019.
Ramon, J., Lledó, L., Torralba, V., Soret, A., and Doblas-Reyes, F. J.: What global reanalysis best represents near-surface winds?, Q. J. Roy. Meteorol. Soc., 145, 3236–3251, https://doi.org/10.1002/qj.3616, 2019.
Reitebuch, O.: The Spaceborne Wind Lidar Mission ADM-Aeolus, in: Atmospheric Physics: Background – Methods – Trends, edited by: Schumann, U., Springer, Berlin, Heidelberg, 815–827, https://doi.org/10.1007/978-3-642-30183-4_49, 2012.
Reitebuch, O., Lemmerz, C., Lux, O., Marksteiner, U., Rahm, S., Weiler, F., Witschas, B., Meringer, M., Schmidt, K., Huber, D., Nikolaus, I., Geiss, A., Vaughan, M., Dabas, A., Flament, T., Stieglitz, H., Isaksen, L., Rennie, M., de Kloe, J., Marseille, G.-J., Stoffelen, A., Wernham, D., Kanitz, T., Straume, A.-G., Fehr, T., von Bismarck, J., Floberghagen, R., and Parrinello, T.: Initial Assessment of the Performance of the First Wind Lidar in Space on Aeolus, in: EPJ Web of Conferences, ILRC29, Heifei, China, 1–4, 2019.
Rennie, M. and Isaksen, L.: Aeolus L2B status, monitoring and NWP impact assessment at ECWMF, in: Aeolus NWP Impact Assessment Workshop, Darmstadt, Germany, 2019.
Rennie, M. and Isaksen, L.: The NWP impact of Aeolus Level-2B winds at ECMWF, ECMWF Technical Memo 864, ECMWF, Shinfield Park, Reading, UK, 2020.
Rennie, M., Tan, D., Andersson, E., Poli, P., and Dabas, A.: Aeolus Level-2B Algorithm Theoretical Basis Document (Mathematical Description of the Aeolus Level-2B Processor), AE-TN-ECMWF-L2BP.0023, V.3.21, ECMWF, available at: https://earth.esa.int/eogateway/documents/20142/37627/Aeolus-L2B-Algorithm-ATBD.pdf (last access: 27 July 2021), 2020.
Shin, H., Ahn, M.-H., Kim, J., and Chung, C.-Y.: Aeolus/ALADIN data analysis in Korea, EGU General Assembly Conference Abstracts, 22, 19595, https://doi.org/10.5194/egusphere-egu2020-19595, 2020.
Stoffelen, A., Pailleux, J., Källén, E., Vaughan, J. M., Isaksen, L., Flamant, P., Wergen, W., Andersson, E., Schyberg, H., Culoma, A., Meynart, R., Endemann, M., and Ingmann, P.: The Atmospheric Dynamics Mission For Global Wind Field Measurement, B. Am. Meteorol. Soc., 86, 73–88, https://doi.org/10.1175/BAMS-86-1-73, 2005.
Witschas, B., Lemmerz, C., Geiß, A., Lux, O., Marksteiner, U., Rahm, S., Reitebuch, O., and Weiler, F.: First validation of Aeolus wind observations by airborne Doppler wind lidar measurements, Atmos. Meas. Tech., 13, 2381–2396, https://doi.org/10.5194/amt-13-2381-2020, 2020.
Zhang, C., Sun, X., Lu, W., Shi, Y., Dou, N., and Li, S.: Relationship between wind observation accuracy and the ascending node of the sun-synchronous orbit for the Aeolus-type spaceborne Doppler wind lidar, Atmos. Meas. Tech., 14, 4787–4803, https://doi.org/10.5194/amt-14-4787-2021, 2021.
Zhao, M., Zhang, H., Wang, H.-B., Zhou, X.-X., Zhu, L., An, Q., and Chen, Q.: The change of cloud top height over East Asia during 2000–2018, Adv. Clim. Change Res., 11, 110–117, https://doi.org/10.1016/j.accre.2020.05.004, 2020.