the Creative Commons Attribution 4.0 License.
the Creative Commons Attribution 4.0 License.
 | 30 Jul 2021
Using GECKO-A to derive mechanistic understanding of secondary organic aerosol formation from the ubiquitous but understudied camphene
Isaac Kwadjo Afreh
Bernard Aumont
Marie Camredon
Kelley Claire Barsanti
Camphene, a dominant monoterpene emitted from both biogenic and pyrogenic sources, has been significantly understudied, particularly in regard to secondary organic aerosol (SOA) formation. When camphene represents a significant fraction of emissions, the lack of model parameterizations for camphene can result in inadequate representation of gas-phase chemistry and underprediction of SOA formation. In this work, the first mechanistic study of SOA formation from camphene was performed using the Generator for Explicit Chemistry and Kinetics of Organics in the Atmosphere (GECKO-A). GECKO-A was used to generate gas-phase chemical mechanisms for camphene and two well-studied monoterpenes, α-pinene and limonene, as well as to predict SOA mass formation and composition based on gas/particle partitioning theory. The model simulations represented observed trends in published gas-phase reaction pathways and SOA yields well under chamber-relevant photooxidation and dark ozonolysis conditions. For photooxidation conditions, 70 % of the simulated α-pinene oxidation products remained in the gas phase compared to 50 % for limonene, supporting model predictions and observations of limonene having higher SOA yields than α-pinene under equivalent conditions. The top 10 simulated particle-phase products in the α-pinene and limonene simulations represented 37 %–50 % of the SOA mass formed and 6 %–27 % of the hydrocarbon mass reacted. To facilitate comparison of camphene with α-pinene and limonene, model simulations were run under idealized atmospheric conditions, wherein the gas-phase oxidant levels were controlled, and peroxy radicals reacted equally with HO2 and NO. Metrics for comparison included gas-phase reactivity profiles, time-evolution of SOA mass and yields, and physicochemical property distributions of gas- and particle-phase products. The controlled-reactivity simulations demonstrated that (1) in the early stages of oxidation, camphene is predicted to form very low-volatility products, lower than α-pinene and limonene, which condense at low mass loadings; and (2) the final simulated SOA yield for camphene (46 %) was relatively high, in between α-pinene (25 %) and limonene (74 %). A 50 % α-pinene + 50 % limonene mixture was then used as a surrogate to represent SOA formation from camphene; while simulated SOA mass and yield were well represented, the volatility distribution of the particle-phase products was not. To demonstrate the potential importance of including a parameterized representation of SOA formation by camphene in air quality models, SOA mass and yield were predicted for three wildland fire fuels based on measured monoterpene distributions and published SOA parameterizations for α-pinene and limonene. Using the surrogate mixture to represent camphene increased predicted SOA mass by 43 %–50 % for black spruce and by 56 %–108 % for Douglas fir. This first detailed modeling study of the gas-phase oxidation of camphene and subsequent SOA formation highlights opportunities for future measurement–model comparisons and lays a foundation for developing chemical mechanisms and SOA parameterizations for camphene that are suitable for air quality modeling.
- Article
(3522 KB) - Full-text XML
-
Supplement
(5014 KB) - BibTeX
- EndNote


Sources of atmospheric monoterpene (C10H16) emissions are diverse and include biogenic sources (Geron et al., 2000; Guenther et al., 1995; Hayward et al., 2001; Kesselmeier and Staudt, 1999; Kim et al., 2010; Ludley et al., 2009; Maleknia et al., 2007; Rinne et al., 2000; Steinbrecher et al., 1999; Tani et al., 2003; White et al., 2008), as well as pyrogenic sources (Akagi et al., 2011, 2013; Gilman et al., 2015; Hatch et al., 2015; Simpson et al., 2011). Monoterpenes account for an estimated one fifth of total global biogenic volatile organic compound (BVOC) emissions (Guenther et al., 1995; Hallquist et al., 1999). Quantities and identities of monoterpenes emitted from biogenic sources primarily depend on plant species and temperature or light (Geron et al., 2000; Hayward et al., 2001; Yáñez-Serrano et al., 2018). Studies across biogenic source types (e.g., terrestrial vegetation, soil, and marine) typically include up to 14 individual monoterpenes, with α-pinene, β-pinene, camphene, 3-carene, limonene, myrcene, p-ocimene, and sabinene being the most widely reported and having the highest emissions (Ambrose et al., 2010; Bäck et al., 2012; Fehsenfeld et al., 1992; Geron et al., 2000; Hayward et al., 2001; Rinne et al., 2000; White et al., 2008; Yassaa et al., 2008). As with biogenic sources, the identities and quantities of monoterpenes from pyrogenic sources (e.g., biomass burning) vary as a function of plant species and fuel component (Hatch et al., 2019). Approximately 30 monoterpene isomers have been observed from biomass burning sources, with α-pinene, β-pinene, camphene, 3-carene, limonene, and myrcene being commonly detected (Akagi et al., 2013; Gilman et al., 2015; Hatch et al., 2015).
Monoterpenes have a wide range of molecular structures, atmospheric lifetimes, and secondary organic aerosol (SOA) formation potentials. The molecular structures of monoterpenes can be acyclic or cyclic (with variability in the size and number of rings) and can include one to three C=C double bonds (Atkinson and Arey, 2003b; Calogirou et al., 1999; Jacobson et al., 2000; Lee et al., 2006a). The reaction rate constants of monoterpenes with atmospheric oxidants vary by orders of magnitude (Atkinson and Arey, 2003a; Geron et al., 2000), and their atmospheric lifetimes vary from minutes to days (Atkinson and Arey, 2003b). Monoterpenes can react with atmospheric oxidants to form less-volatile oxidation products leading to the formation of SOA. SOA composes a significant fraction of atmospheric fine particulate matter (PM2.5) which adversely affects air quality and has an impact on climate (Almatarneh et al., 2018; Hallquist et al., 1999; Jacobson et al., 2000; Kanakidou et al., 2005). The extent of SOA formation from monoterpenes can vary significantly due to the differences in their structures, reaction rates, and volatility of their oxidation products and propensity to form accretion products (Barsanti et al., 2017; Griffin et al., 1999; Ng et al., 2007; Zhang et al., 2015).
Over the past two decades, laboratory studies have been performed using monoterpene precursors to elucidate their potential to form SOA under conditions approximating atmospheric relevance. For example, Griffin et al. (1999) used a series of outdoor chamber experiments to establish the SOA formation potential of 14 biogenic compounds, including nine monoterpenes. Since then, several chamber studies under varying experimental conditions have been conducted for individual monoterpenes including α-pinene, β-pinene, 3-carene, limonene, and myrcene (e.g., Amin et al., 2013; Boyd et al., 2017; Fry et al., 2014; Hatfield and Huff Hartz, 2011; Lee et al., 2006a; Ng et al., 2007; Presto et al., 2005; Presto and Donahue, 2006; Zhao et al., 2018). Additionally, other studies have been conducted to investigate gas-phase reaction pathways and major products from the reactions of monoterpenes with hydroxyl radical (OH), ozone (O3), and nitrate radical (NO3) (e.g., Draper et al., 2015; Friedman and Farmer, 2018; Kundu et al., 2012; Zhang et al., 2015). While some monoterpenes have been well studied in chambers or other laboratory reactors, other monoterpenes are relatively under-studied, including some that are commonly measured in non-negligible quantities in the atmosphere.
Parameterizations used in air quality models are largely based on laboratory studies; thus widely studied monoterpenes (e.g., α-pinene and limonene) are often used as surrogates to represent the gas-phase chemistry and SOA formation of all terpenes (e.g., Carter, 2010; Saha and Grieshop, 2016; Stockwell et al., 1997). The lack of monoterpene-specific laboratory data can result in inadequate representation of monoterpene chemistry, including SOA formation, particularly where a diversity of unrepresented monoterpenes make a large contribution to total emissions. Camphene is one monoterpene that has been observed in the atmosphere but has little to no published data regarding SOA formation. Previous experimental and theoretical studies of camphene focused on the gas-phase reactions of camphene and product identification (e.g., Atkinson et al., 1990; Gaona-Colmán et al., 2017; Hakola et al., 1994). Recently, a density functional theory (DFT) approach was also used to investigate the oxidation of camphene and the fate of product radicals under atmospherically relevant conditions (Baruah et al., 2018). While this approach identified plausible reaction pathways of camphene photooxidation and associated gas-phase products, formation of SOA was not considered.
In this work, a mechanistic study of SOA formation from camphene was conducted using the Generator for Explicit Chemistry and Kinetics of Organics in the Atmosphere (GECKO-A). GECKO-A has been previously used to study SOA formation from a number of precursors (e.g., Camredon et al., 2007; La et al., 2016; McVay et al., 2016; Valorso et al., 2011). GECKO-A was used here to generate nearly explicit mechanisms for camphene and the well-studied monoterpenes α-pinene and limonene. Model simulations were run under chamber-relevant conditions (“chamber reactivity simulations”) to capture trends in simulated SOA mass and composition and compared with published observations using commonly reported metrics including SOA yields and oxygen carbon () ratios. Model simulations were also run under idealized atmospheric conditions (“controlled reactivity simulations”) to facilitate a direct comparison of camphene with α-pinene and limonene, including comparisons of gas-phase oxidation pathways, gas-phase reactivity profiles, time-evolution of SOA mass and yields, and physicochemical property distributions of gas- and particle-phase products. Based on these analyses, the feasibility of using α-pinene or limonene as a surrogate for camphene was assessed, and implications for air quality model predictions and opportunities for future studies were identified.
2.1 GECKO-A model description
SOA formation from three monoterpene precursors (α-pinene, limonene, and camphene) was modeled using GECKO-A. A description of GECKO-A is given by Aumont et al. (2005). GECKO-A is a modeling tool that generates nearly explicit gas-phase oxidation mechanisms for individual or multiple organic compounds under general atmospheric conditions (Aumont et al., 2005, 2012; Camredon et al., 2007), as well as the properties to represent the gas/particle partitioning of the stable organic compounds present in the mechanisms (Camredon et al., 2007; Valorso et al., 2011). The nearly explicit chemical mechanism is generated using experimental data and a predefined protocol (Aumont et al., 2005, 2012; Camredon et al., 2007). The protocol is described in Aumont et al. (2005) and includes updates described in Aumont et al. (2013), La et al. (2016), McVay et al. (2016), and Valorso et al. (2011). In the absence of experimental data, reaction rate constants and products, as well as their physicochemical properties, are estimated based on structure-activity relationships (SARs) (Aumont et al., 2005). Autoxidation leading to the formation of highly oxygenated molecules (HOM) in the gas phase (e.g., Bianchi et al., 2019; Ehn et al., 2014) is not currently represented in GECKO-A. A SAR to predict the rate coefficients of peroxy radical (RO2) H migration reactions (H-shifts) that lead to the formation of HOM was recently published by Vereecken and Nozière (2020). The straight implementation of this SAR into GECKO-A would lead to a non-manageable number of species and reactions. Therefore, reduction protocols are currently under development to consider the autoxidation reactions in subsequent model versions. For the application presented herein, limitations and implications of the absence of HOM formation via RO2 autoxidation are discussed where relevant.
Some simplifications were applied during the mechanism generation to reduce the size of the gas-phase chemical mechanisms: (1) the maximum generations of oxidation for each mechanism was set at six based on prior GECKO-A modeling results for n-alkanes (Aumont et al., 2012), and sensitivity studies were performed in this work for α-pinene oxidation, in which increasing the number of generations beyond six did not result in significant changes in the evolution of the gas or particle phases; (2) species with vapor pressure below 10−13 atm (equivalent to C* of µg m−3 for species with a mean molecular weight of 250 g mol−1) were considered non-volatile and therefore treated as end products during gas-phase mechanism generation (Valorso et al., 2011); and (3) position isomers were lumped if the production yield of a species was lower than 10−3 (Valorso et al., 2011). The chemical mechanisms generated for this study included 1.4×10⁶ reactions and 2×10⁵ oxidation products for α-pinene; 6.5×10⁵ reactions and 9.3×10⁴ oxidation products for limonene; and 1.3×10⁶ reactions and 1.8×10⁵ oxidation products for camphene. These mechanisms were then implemented in a box model to simulate the evolution of gaseous organic compounds and SOA formation (Aumont et al., 2005, 2012; Camredon et al., 2007). Gas/particle partitioning of stable organic compounds was calculated according to the saturation vapor pressure of each organic compound and assuming thermodynamic equilibrium between the gas and an ideal (activity coefficients =1), homogeneous, and inert condensed phase. The saturation vapor pressures were estimated using the Nannoolal method (Nannoolal et al., 2008), which performs relatively well compared to other estimation methods when used to simulate SOA formation during α-pinene oxidation experiments (Valorso et al., 2011). Condensed-phase reactions are not currently represented in GECKO-A; the limitations and implications of which are discussed where relevant.
2.2 GECKO-A-generated oxidation mechanisms
The monoterpene reaction schemes are generated by GECKO-A using established protocols, as described in Aumont et al. (2005). First, the mechanism generator analyzes the structure of the compound to determine the reactive sites and the plausible reaction pathways. Reaction products and initial branching ratios are based on experimental data when available. Otherwise, the reaction products and rate constants are estimated based on structure-activity relationships (SARs). The initial reaction rate constants of the monoterpenes with OH, O3, and NO3 were based on data from Atkinson and Arey (2003a). For α-pinene + OH, the initial branching ratios are based on data from Peeters et al. (2001). For subsequent reaction steps with α-pinene + OH, and for the limonene and camphene mechanisms, reaction products and branching ratios are based on SARs.
2.2.1 OH reaction scheme
The reaction pathways of OH-initiated oxidation of α-pinene, limonene, and camphene up to the formation of first-generation stable products are shown in Figs. 1–3, respectively. For figure clarity, inorganic species formed (including OH) are not shown. The initial reaction steps proceed mainly by the addition of OH to the C=C double bond or by hydrogen abstraction. This leads to the formation of hydroxyalkyl radicals (HO2) which react rapidly with O2 to form peroxy radicals (RO2). The peroxy radicals can combine with NO, RO2, and/or HO2 to form stable products. The peroxy radicals can also lose an oxygen atom through reaction with NO to form alkoxy radicals, which is consistent with observations reported by Atkinson and Arey (1998) and Calogirou et al. (1999). For α-pinene oxidation, the hydroxyalkyl radicals primarily react with O2 to form peroxy radicals which then react with NO, RO2, and/or HO2 to form stable products, many with a four-membered ring, or lose an oxygen atom to form alkoxy radicals. As observed by Lee et al. (2006b), the alkoxy radicals undergo subsequent reactions leading to the formation of formaldehyde, acetone, and multifunctional products including pinonaldehyde. For limonene oxidation, reaction of the peroxy radicals with NO, NO3, and/or RO2 followed by O2 addition and NO to NO2 conversion leads to the formation of limononaldehyde or limonaketone and formaldehyde, which is consistent with observations reported by Lee et al. (2006b). Alternatively, the peroxy radicals react with NO, NO3, and/or RO2 to form ring-opened peroxy radicals which further react to form multifunctional products. For camphene, the hydroxyalkyl radicals react rapidly with O2 to form hydroxyalkyl peroxy radicals. The hydroxyalkyl peroxy radicals subsequently react with NO, RO2, and HO2 to form stable products or react with NO, NO3, and/or RO2 to form hydroxyalkoxy radicals. The hydroxyalkoxy radicals then either decompose to form camphenilone (a bicyclic product) and formaldehyde or react with O2 to form five-membered ring hydroxyperoxy radicals which further react to form multifunctional products. The reaction pathway of OH addition to the exocyclic double bond of camphene as represented in GECKO-A is in agreement with the observations made by Gaona-Colmán et al. (2017) and Reissell et al. (1999), as well as by Baruah et al. (2018) in their DFT study of OH-initiated oxidation of camphene. While camphene and α-pinene are structurally bicyclic, their first-generation products resulting from the decomposition of the bicyclic hydroxyalkoxy radicals differ; camphene primarily forms five-membered ring first-generation products, while α-pinene primarily forms four-membered ring first-generation products. Limonene, which is monocyclic, primarily forms ring-opened first-generation products when its monocyclic hydroxyalkoxy radicals decompose.
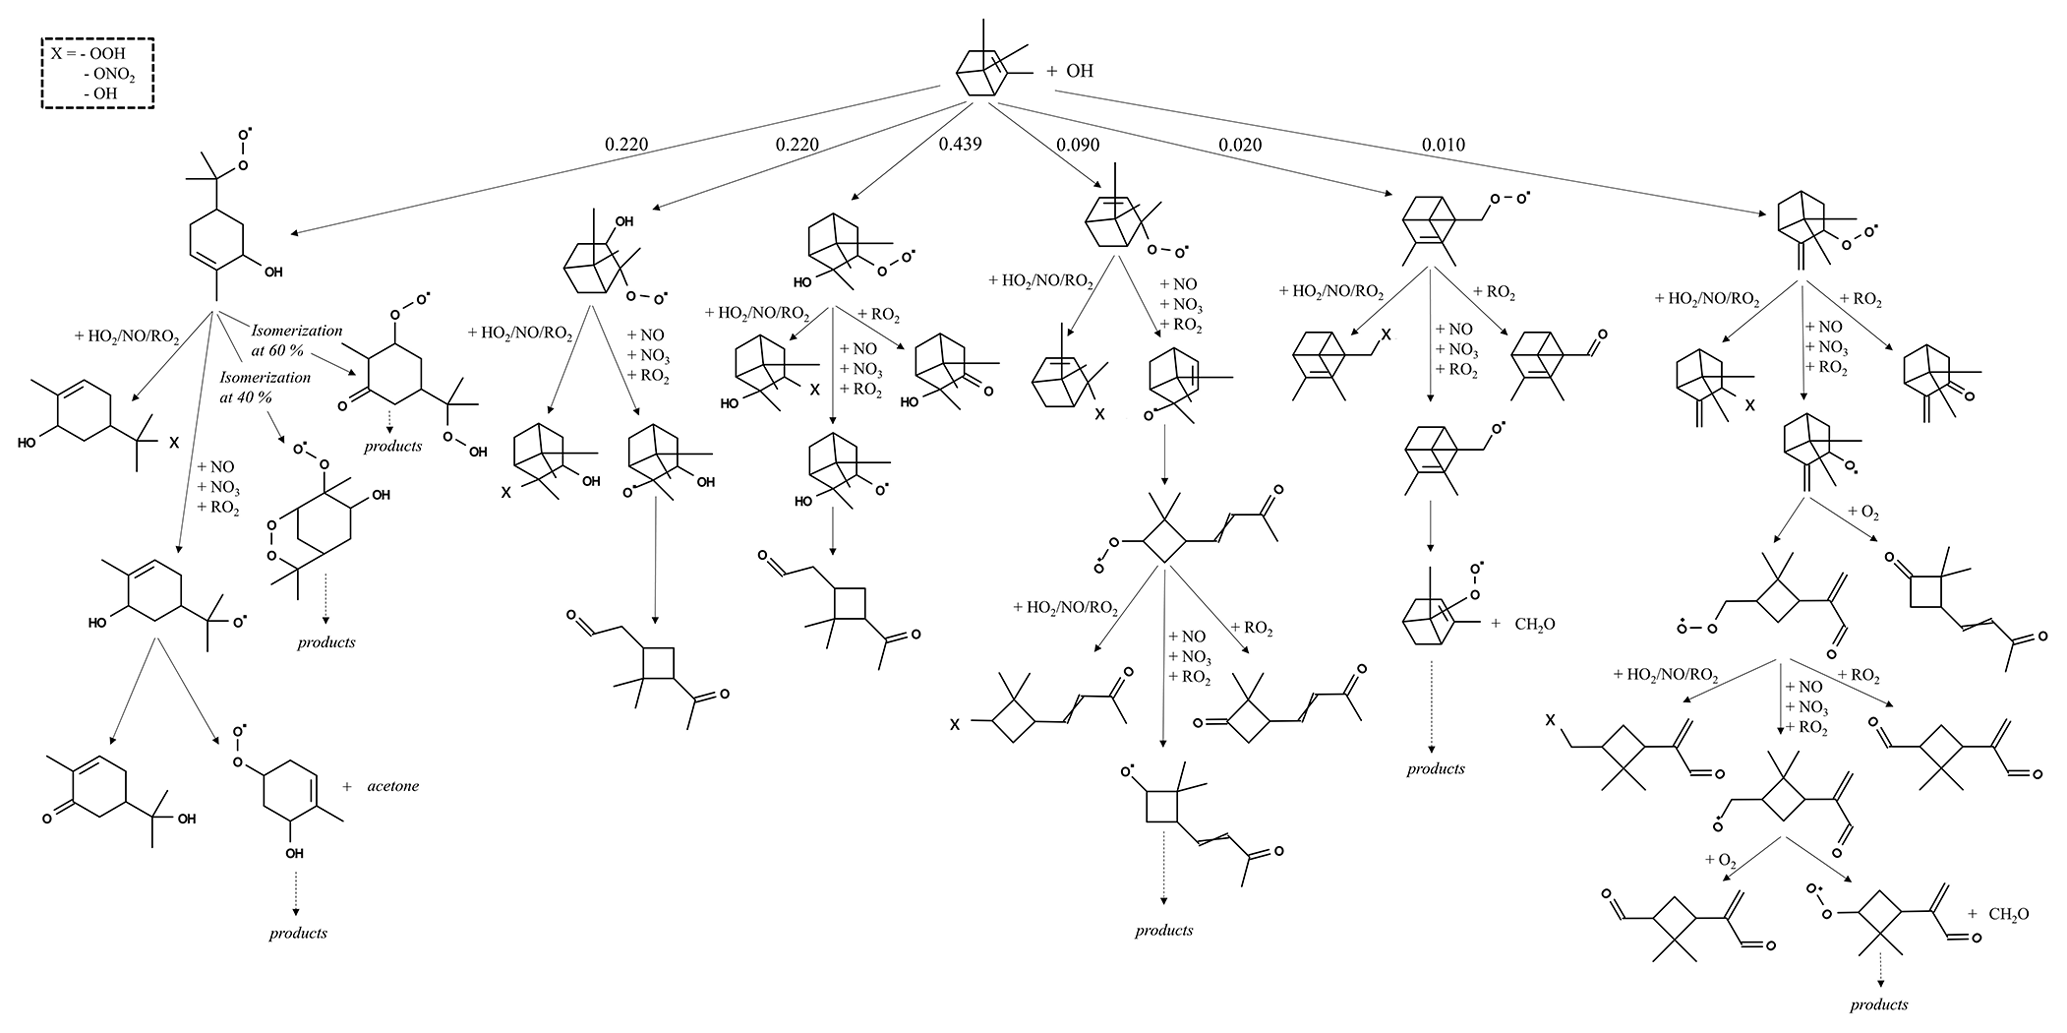
Figure 1Initial oxidation pathways of α-pinene oxidation with OH as represented in GECKO-A (inorganic products are not shown).
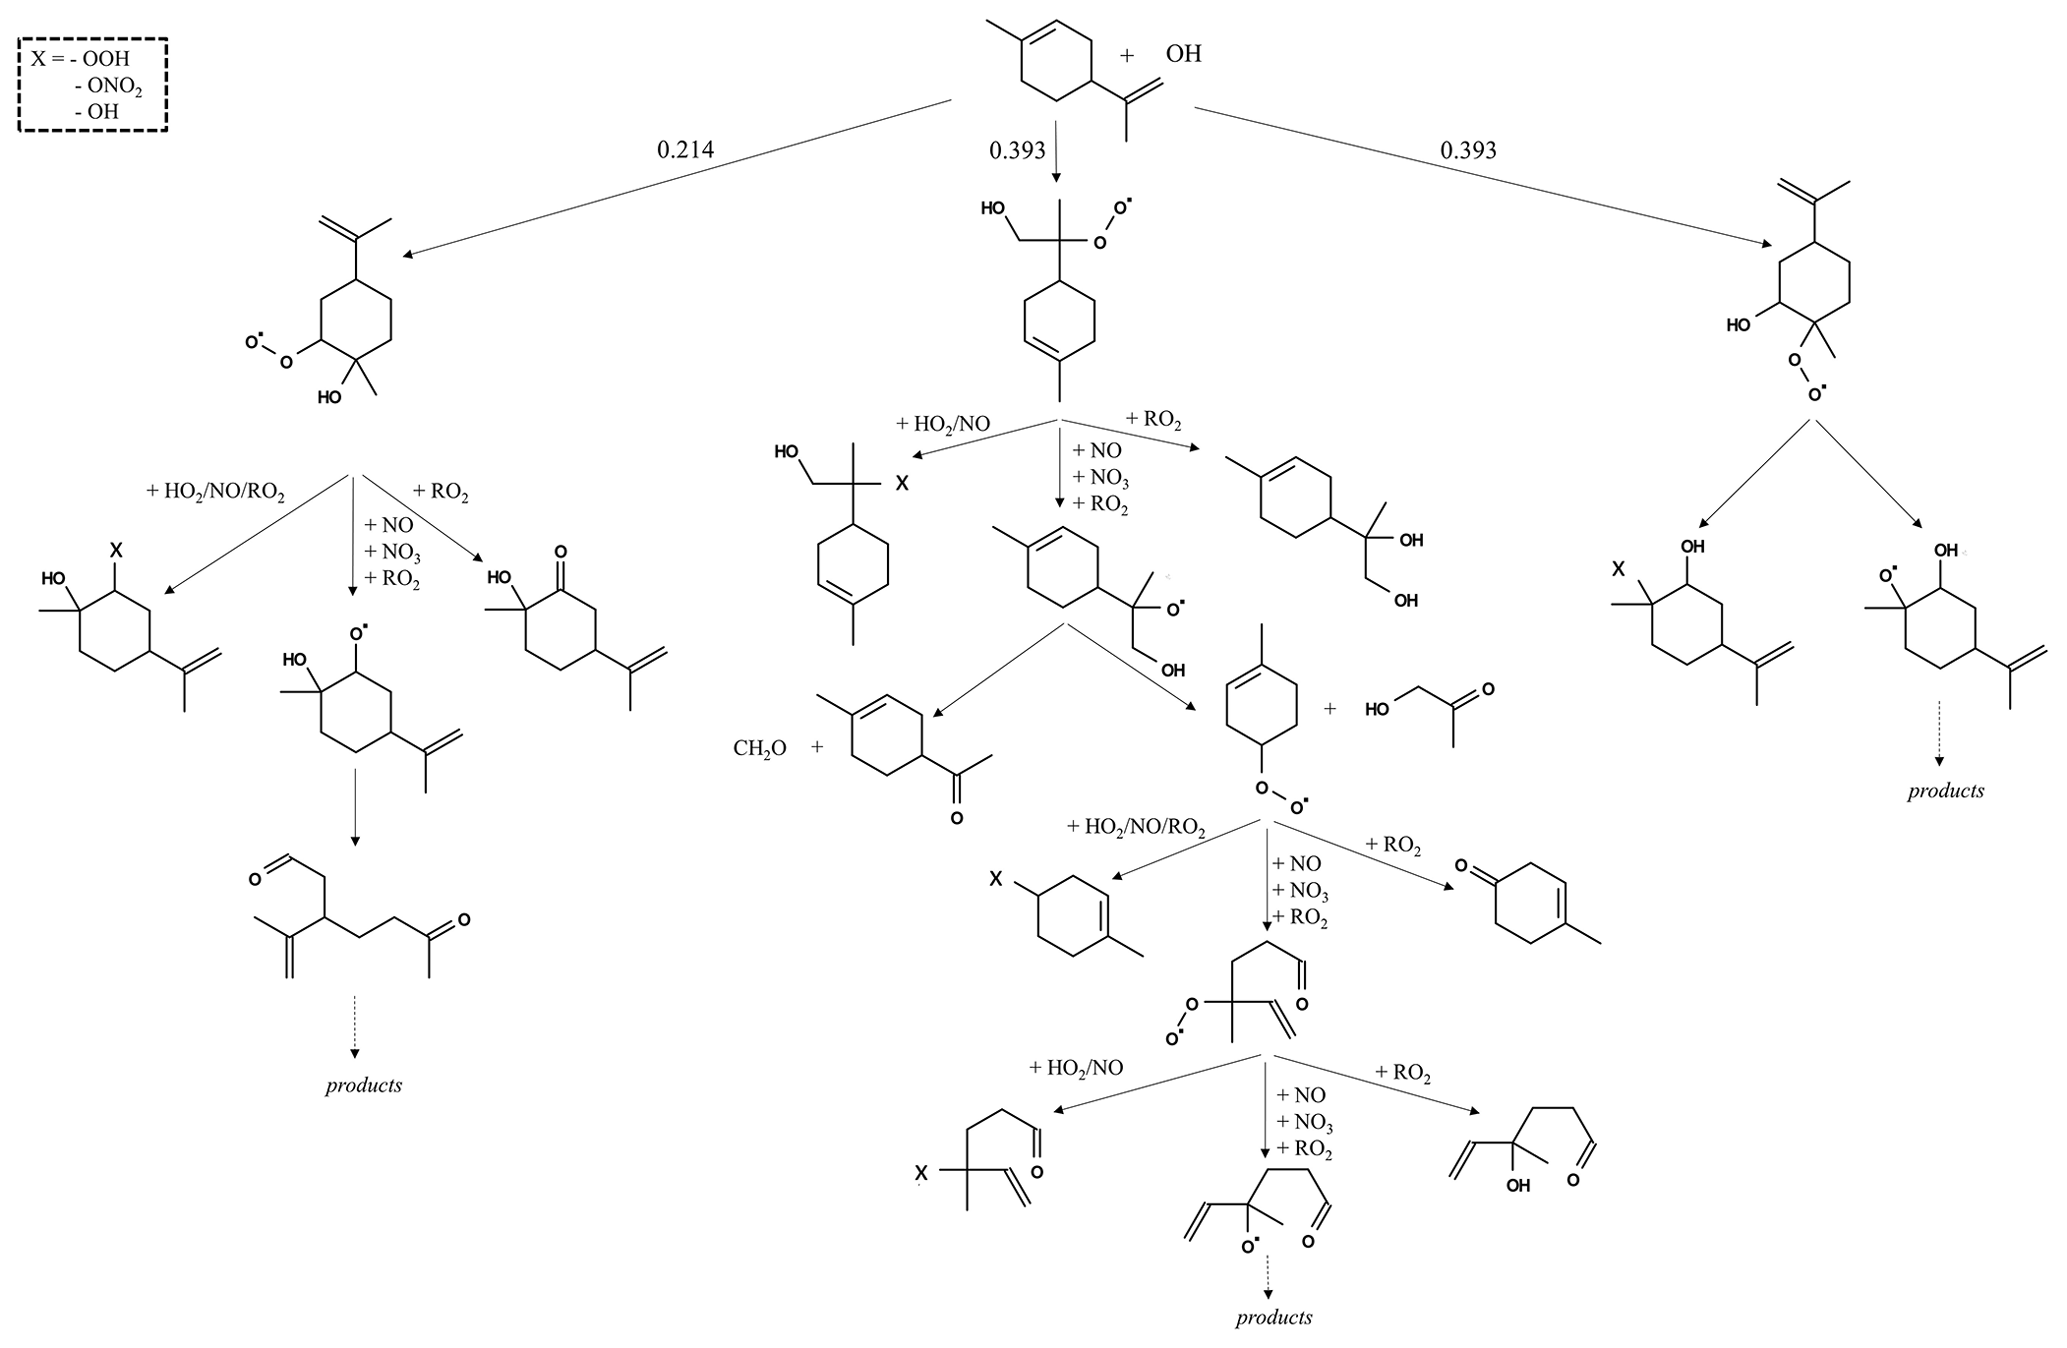
Figure 2Initial oxidation pathways of limonene oxidation with OH as represented in GECKO-A (inorganic products are not shown).

Figure 3Initial oxidation pathways of camphene oxidation with OH as represented in GECKO-A (inorganic products are not shown).
2.2.2 O3 reaction scheme
The initial oxidation pathways of O3-initiated oxidation of α-pinene, limonene, and camphene are shown in Figs. S1–S3 in the Supplement, respectively. The reaction starts with the addition of O3 to the C=C double bond of the parent compound to form an ozonide which rapidly undergoes bond cleavage to form either a biradical Criegee intermediate bearing a carbonyl substituent for terpenes with an endocyclic double bond or a biradical Criegee intermediate and a carbonyl for terpenes with an exocyclic double bond. The Criegee intermediate can stabilize by collisions and/or decompose (after possible rearrangement) to form peroxy radicals. The stabilized Criegee intermediates (SCI) undergo bimolecular reactions with H2O, CO, NO, and/or NO2. The peroxy radicals then react with HO2, NO, and/or RO2 to form stable products or react with NO, NO3, and/or RO2 to form alkoxy radicals. For α-pinene, the alkoxy radicals either react with O2 or decompose to form formaldehyde and peroxy radicals. The peroxy radicals further react to form peroxy acid, carboxylic acid, and CO2. For limonene, the alkoxy radical reactions primarily lead to the formation of organic nitrates, organic hydroperoxides, carboxylic acids, and peroxy acids. For camphene, the ozonide decomposes to form (1) camphenilone, a stable bicyclic product that has been observed experimentally by Calogirou et al. (1999) and Hakola et al. (1994), and (2) a bicyclic peroxy radical and formaldehyde, consistent with the camphene + O3 mechanism reported by Gaona-Colmán et al. (2017). The bicyclic peroxy radical reacts with HO2, NO, and/or RO2 to form stable products or reacts with NO, NO3, and/or RO2 to form alkoxy radical which then further reacts to form five-membered ring products.
2.2.3 NO3 reaction scheme
The initial oxidation pathways of NO3-initiated oxidation of α-pinene, limonene, and camphene are shown in Figs. S4–S6, respectively. The NO3 radical attacks the C=C double bond to form a nitratoalkyl radical which undergoes rapid reaction with O2 to form a nitratoalkylperoxy radical. The nitratoalkylperoxy radicals of all three compounds react similarly in three ways: (1) with NO to form dinitrates; (2) with HO2 or RO2 to form nitratocarbonyls, nitratoalcohols, and nitratoperoxides (Calogirou et al., 1999); and (3) with NO, NO3, and/or RO2 to form nitratoalkoxy radicals, which react further to form multifunctional products.
Table 1Initial conditions for α-pinene and limonene chamber reactivity simulations.

2.3 Simulation conditions
The objective of the chamber reactivity simulations was to compare GECKO-A model output with published SOA chamber data (Table 1). No attempt was made to strictly reproduce the conditions of a given chamber experiment. Since the first objective of this study focuses on the ability of the model to capture the major trends observed in chamber data (e.g., SOA yields and major oxidation products), the simulation conditions were set to mimic (or be representative of) typical chamber conditions. Comparative analyses were performed for the precursors α-pinene and limonene since they are among the well-studied monoterpenes in environmental chambers, and sufficient data exist for measurement–model comparison. These chamber reactivity simulations included photooxidation (P) and dark ozonolysis (DO) conditions which were differentiated by the initial concentrations of NO, HONO, and O3 as shown in Table 1. For both the P and DO conditions, the initial hydrocarbon mixing ratios were set at a relatively low (50 ppb) and a relatively high (150 ppb) level as compared with published chamber studies. This resulted in a total of four chamber reactivity simulations for each monoterpene precursor. It is noted that the simulations are unable to capture HOM formation via RO2 autoxidation and subsequent dimerization (Ehn et al., 2014) that may have occurred in the chamber studies, particularly under DO conditions. In each simulation, 1 µg m−3 of organic seed with a molecular weight of 250 g mol−1 was added to initiate gas/particle partitioning.
Table 2Initial conditions for camphene, α-pinene, and limonene controlled reactivity simulations. The levels of O3 and NOx were fixed during these simulations.

The objective of the controlled reactivity simulations was to examine SOA formation by camphene in the context of well-studied monoterpenes, specifically α-pinene and limonene, under controlled conditions (Table 2). In these simulations, the gas-phase chemistry was not controlled by the individual precursors but by other organic compounds as occurs in the ambient atmosphere, allowing for a straightforward comparison of terpene oxidation mechanisms under the controlled reactivity conditions. A mixture of ethane (10 ppb) and formaldehyde (50 ppb) was used to buffer (i.e., control) the gas-phase reactivity. The NOx and O3 mixing ratios were held constant at values of 1 and 30 ppb, respectively, throughout the simulation. Hence, RO2 reacted equally with HO2 and NO, and the levels of the oxidants did not change when relatively small amounts of precursor were added. The controlled reactivity simulations included 0.1 ppb of initial precursor and 10 µg m−3 of organic seed.
All box-model simulations were performed under fixed conditions: temperature was held at 298 K and relative humidity at 5 % to represent mean chamber conditions, and the solar zenith angle, required to calculate photolysis frequencies, was set at 50∘ to represent mean daytime solar spectra except for dark ozonolysis conditions where no photolysis was considered.
3.1 Chamber reactivity simulations
3.1.1 Measurement–model comparison
In Fig. 4, SOA yields from the chamber reactivity simulations are shown with measured SOA yields from chamber studies. SOA data (see Table S1 in the Supplement) were compiled from 12 published chamber studies (e.g., Chen et al., 2017; Griffin et al., 1999; Kim and Paulson, 2013; Kourtchev et al., 2014; Nah et al., 2016; Ng et al., 2007; Yu et al., 1999) in which α-pinene or limonene was used as a precursor, and final SOA mass, SOA yield, and reacted hydrocarbon concentration (ΔHC) were reported (at least two of the three quantities). For the α-pinene photooxidation data, there is an apparent cluster around an SOA yield of 0.2 for SOA mass <150 µg m−3 with which the model agrees (Fig. 4a). The scatter in the data is due to differences in experimental conditions (e.g., temperature and NOx mixing ratios). As previously observed, SOA yields of α-pinene tend to be higher at lower temperatures and lower NOx conditions (higher initial VOCNOx ratios) (Kim and Paulson, 2013; Pathak et al., 2007b). For example, the two relatively high SOA yields (0.38 at 29.3 µg m−3 and 0.46 at 121.3 µg m−3) had relatively low initial NOx concentrations (Ng et al., 2007), while the two relatively low SOA yields (0.059 at 44 µg m−3 and 0.06 at 4.5 µg m−3) had relatively high initial NOx concentrations (Kim and Paulson, 2013; Ng et al., 2007). For mass loadings >150 µg m−3, α-pinene photooxidation SOA yield data plateau at approximately 0.3, which also is captured by the model. In contrast, for limonene photooxidation, experimental data show a linear trend in the SOA yield as a function of SOA mass (for SOA mass >25 µg m−3), and the SOA yield does not plateau at higher SOA mass loadings. The observed linear trend in SOA yield as a function of SOA mass is reflected in the model simulations (Fig. 4c). For α-pinene ozonolysis (Fig. 4b), there is an apparent cluster around an SOA yield of 0.2 for SOA mass <200 µg m−3. At SOA mass <100 µg m−3, the modeled SOA yield is within range of the observations, towards the lowest values; between SOA mass >100 and <200 µg m−3, the modeled SOA yield is lower than the observations (two data points). The SOA yield plateaus at approximately 0.4 for SOA mass >200 µg m−3; the model simulations do not extend to this high mass range precluding comparison. For limonene ozonolysis, Fig. 4d shows the chamber SOA yield plateauing at approximately 0.8 (for mass loadings >200 µg m−3) which is captured by the model simulations.
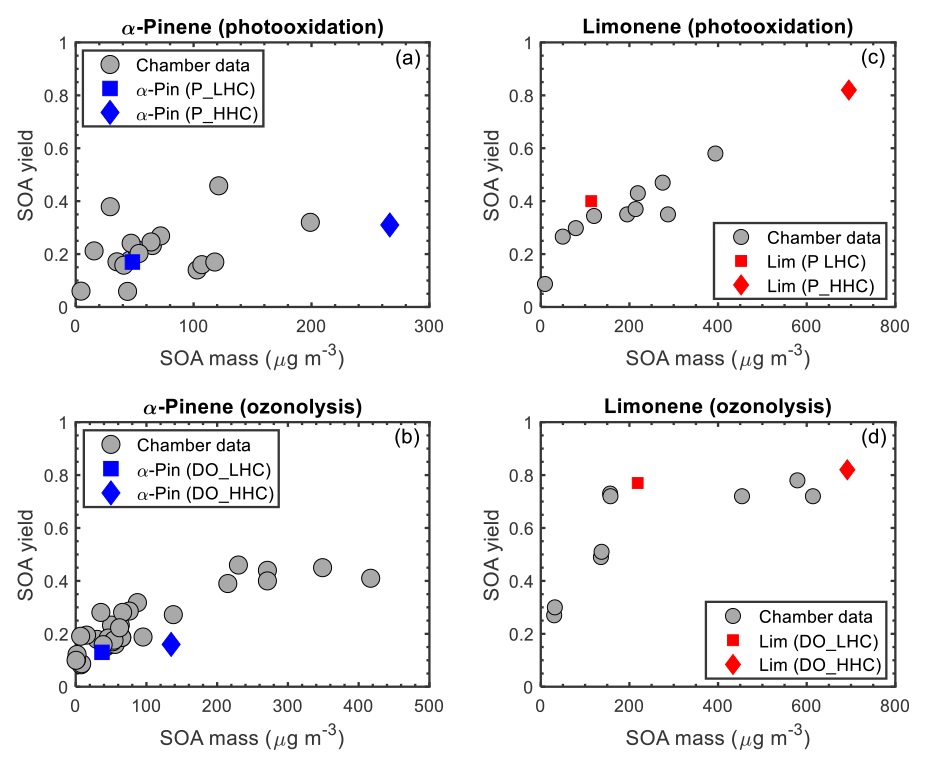
Figure 4GECKO-A SOA yields are represented by blue (α-pinene) and red (limonene) markers; chamber SOA yields are represented by grey markers. The initial hydrocarbon mixing ratios are differentiated by shape: squares represent the simulation using the lower hydrocarbon (LHC) mixing ratio and diamonds the simulation using the higher hydrocarbon (HHC) mixing ratio.
Overall, the model simulations agree well with the observed trends in SOA yield as a function of SOA mass. The largest discrepancies are for α-pinene ozonolysis, in which SOA mass is underpredicted relative to the observations. The contribution of HOM formation from RO2 autoxidation is expected to be more important under such conditions, in which the lifetime of RO2 is sufficiently long for autoxidation to compete with bimolecular reactions, and monoterpene oxidation by O3 is greater than by OH leading to higher HOM yields (Ehn et al., 2014; Jokinen et al., 2015). The inclusion of HOM formation and subsequent dimerization would lead to an increase in predicted SOA mass in both the α-pinene and limonene ozonolysis simulations. An increase in SOA mass due to HOM formation and subsequent dimerization would improve the measurement–model agreement for α-pinene but would also lead to an overprediction of SOA mass for limonene. In addition, a non-negligible contribution of HOM monomers and dimers to the particle phase would increase the calculated average oxygen carbon () ratio and increase the measurement–model discrepancy further, as is discussed below. McVay et al. (2016) reported similar conclusions for α-pinene photolysis experiments; a parameterized representation of RO2 autoxidation in GECKO-A increased predicted SOA mass for low UV conditions, improving measurement–model agreement at the end of the experiment and resulted in no change for high UV conditions.
Table 3Simulation-based OH exposure, simulated average mass-weighted ratio, and chamber average mass-weighted ratio for α-pinene and limonene under photooxidation and ozonolysis conditions.
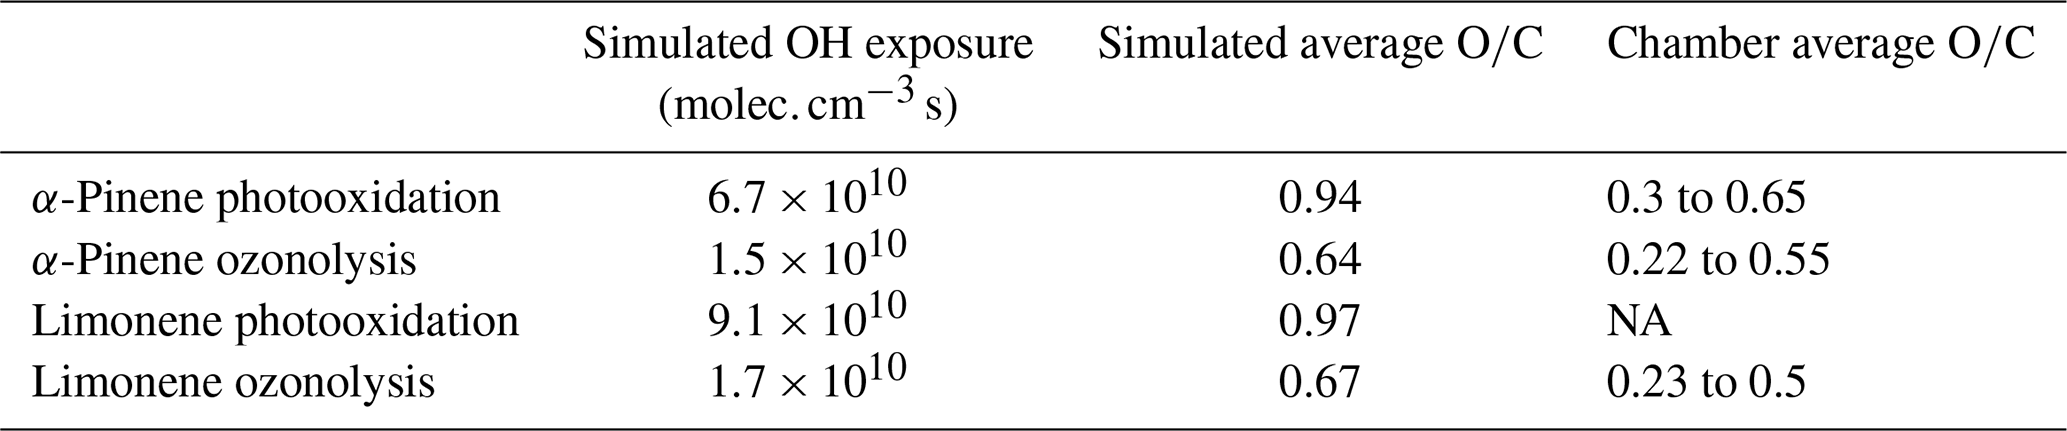
NA: not available.
Table 3 shows the simulated SOA mass-weighted average ratios for α-pinene photooxidation ( = 0.94), α-pinene ozonolysis ( = 0.64), limonene photooxidation ( = 0.97), and limonene ozonolysis ( = 0.67). For α-pinene, the simulated SOA from photooxidation had higher average than from ozonolysis. This is consistent with experiments by Kourtchev et al. (2015) in which the reported for OH-initiated α-pinene SOA was higher than for α-pinene SOA initiated by ozonolysis. The same trend was predicted for limonene. Generally, the simulated values were high relative to values reported from chamber studies. Reported average values from chamber studies range from 0.3 to 0.65 for α-pinene photooxidation (e.g., Lambe et al., 2015; Pfaffenberger et al., 2013), 0.22 to 0.55 for α-pinene ozonolysis (e.g., Chen et al., 2011; Chhabra et al., 2010; Kourtchev et al., 2015), and 0.23 to 0.5 for limonene ozonolysis (e.g., Draper et al., 2015; Heaton et al., 2007; Walser et al., 2008). Factors known to affect ratios include mass loading, OH exposure (defined as the integral of OH concentration and residence time; Lambe et al., 2015), and accretion product formation (Chhabra et al., 2010; Reinhardt et al., 2007). Shilling et al. (2009) showed the dependency of ratios on mass loadings for α-pinene, in which ratio decreased from 0.45 to 0.38 as mass loading increased from 0.5 to 15 µg m−3. Mass loading is not likely driving the differences between simulations and observations here since the simulated mass loadings were similar to the mass loadings of the chamber experiments (e.g., Chhabra et al., 2011; Shilling et al., 2009) with which the ratios were compared. Regarding OH exposure, calculated OH exposures for the photooxidation simulations (Table 3) were within the typically reported OH exposure ranges (5.4×10¹⁰–4.0×10¹¹ ) from the chamber photooxidation experiments (e.g., Lambe et al., 2015; Pfaffenberger et al., 2013). The lower observed values may be partially explained by the loss of H2O in condensed-phase reactions (Claflin et al., 2018; Ziemann and Atkinson, 2012), which were likely occurring in the experiments (e.g., Bakker-Arkema and Ziemann, 2020; Kenseth et al., 2018) but were not represented in the GECKO-A simulations.
3.1.2 Major products simulated for α-pinene and limonene
The results from the simulations using the lower hydrocarbon mixing ratio (LHC) and higher hydrocarbon mixing ratio (HHC) were qualitatively similar. Thus, here and in subsequent sections, only the results for the LHC simulations are shown and discussed; the corresponding figures for the HHC simulations are provided in the Supplement. Figure 5a and b show the chemical structures and molecular formulae of the top 10 products by mass in the gas and particle phases at the end of the α-pinene photooxidation simulation. The top 10 gas-phase products (dominated by carbonyl, carboxyl, and nitrate functional groups) account for 46 % of the reacted α-pinene carbon mass, with acetone being the top contributor. A total of 2 of the top 10 gas-phase products, pinonic acid (i.e., (3-acetyl-2,2-dimethylcyclobutyl)acetic acid) and pinonaldehyde (i.e., (3-acetyl-2,2-dimethylcyclobutyl)acetaldehyde), are among the most commonly reported products in experimental studies (e.g., Lee et al., 2006b). The top 10 particle-phase products (dominated by carbonyl, carboxyl, hydroxyl, hydroperoxide, and nitrate functional groups) account for 42 % of the SOA mass and 7 % of the reacted α-pinene carbon mass. For limonene photooxidation (Figs. S10 and S11), the top 10 gas-phase products account for 34 % of reacted limonene, while the top 10 particle-phase products account for 50 % of the SOA mass and 20 % of the reacted limonene carbon mass. The top 10 particle-phase products are dominated by dinitrate and carbonyl functional groups, indicating the possible influence of multigenerational products from peroxy radicals + NO reactions.
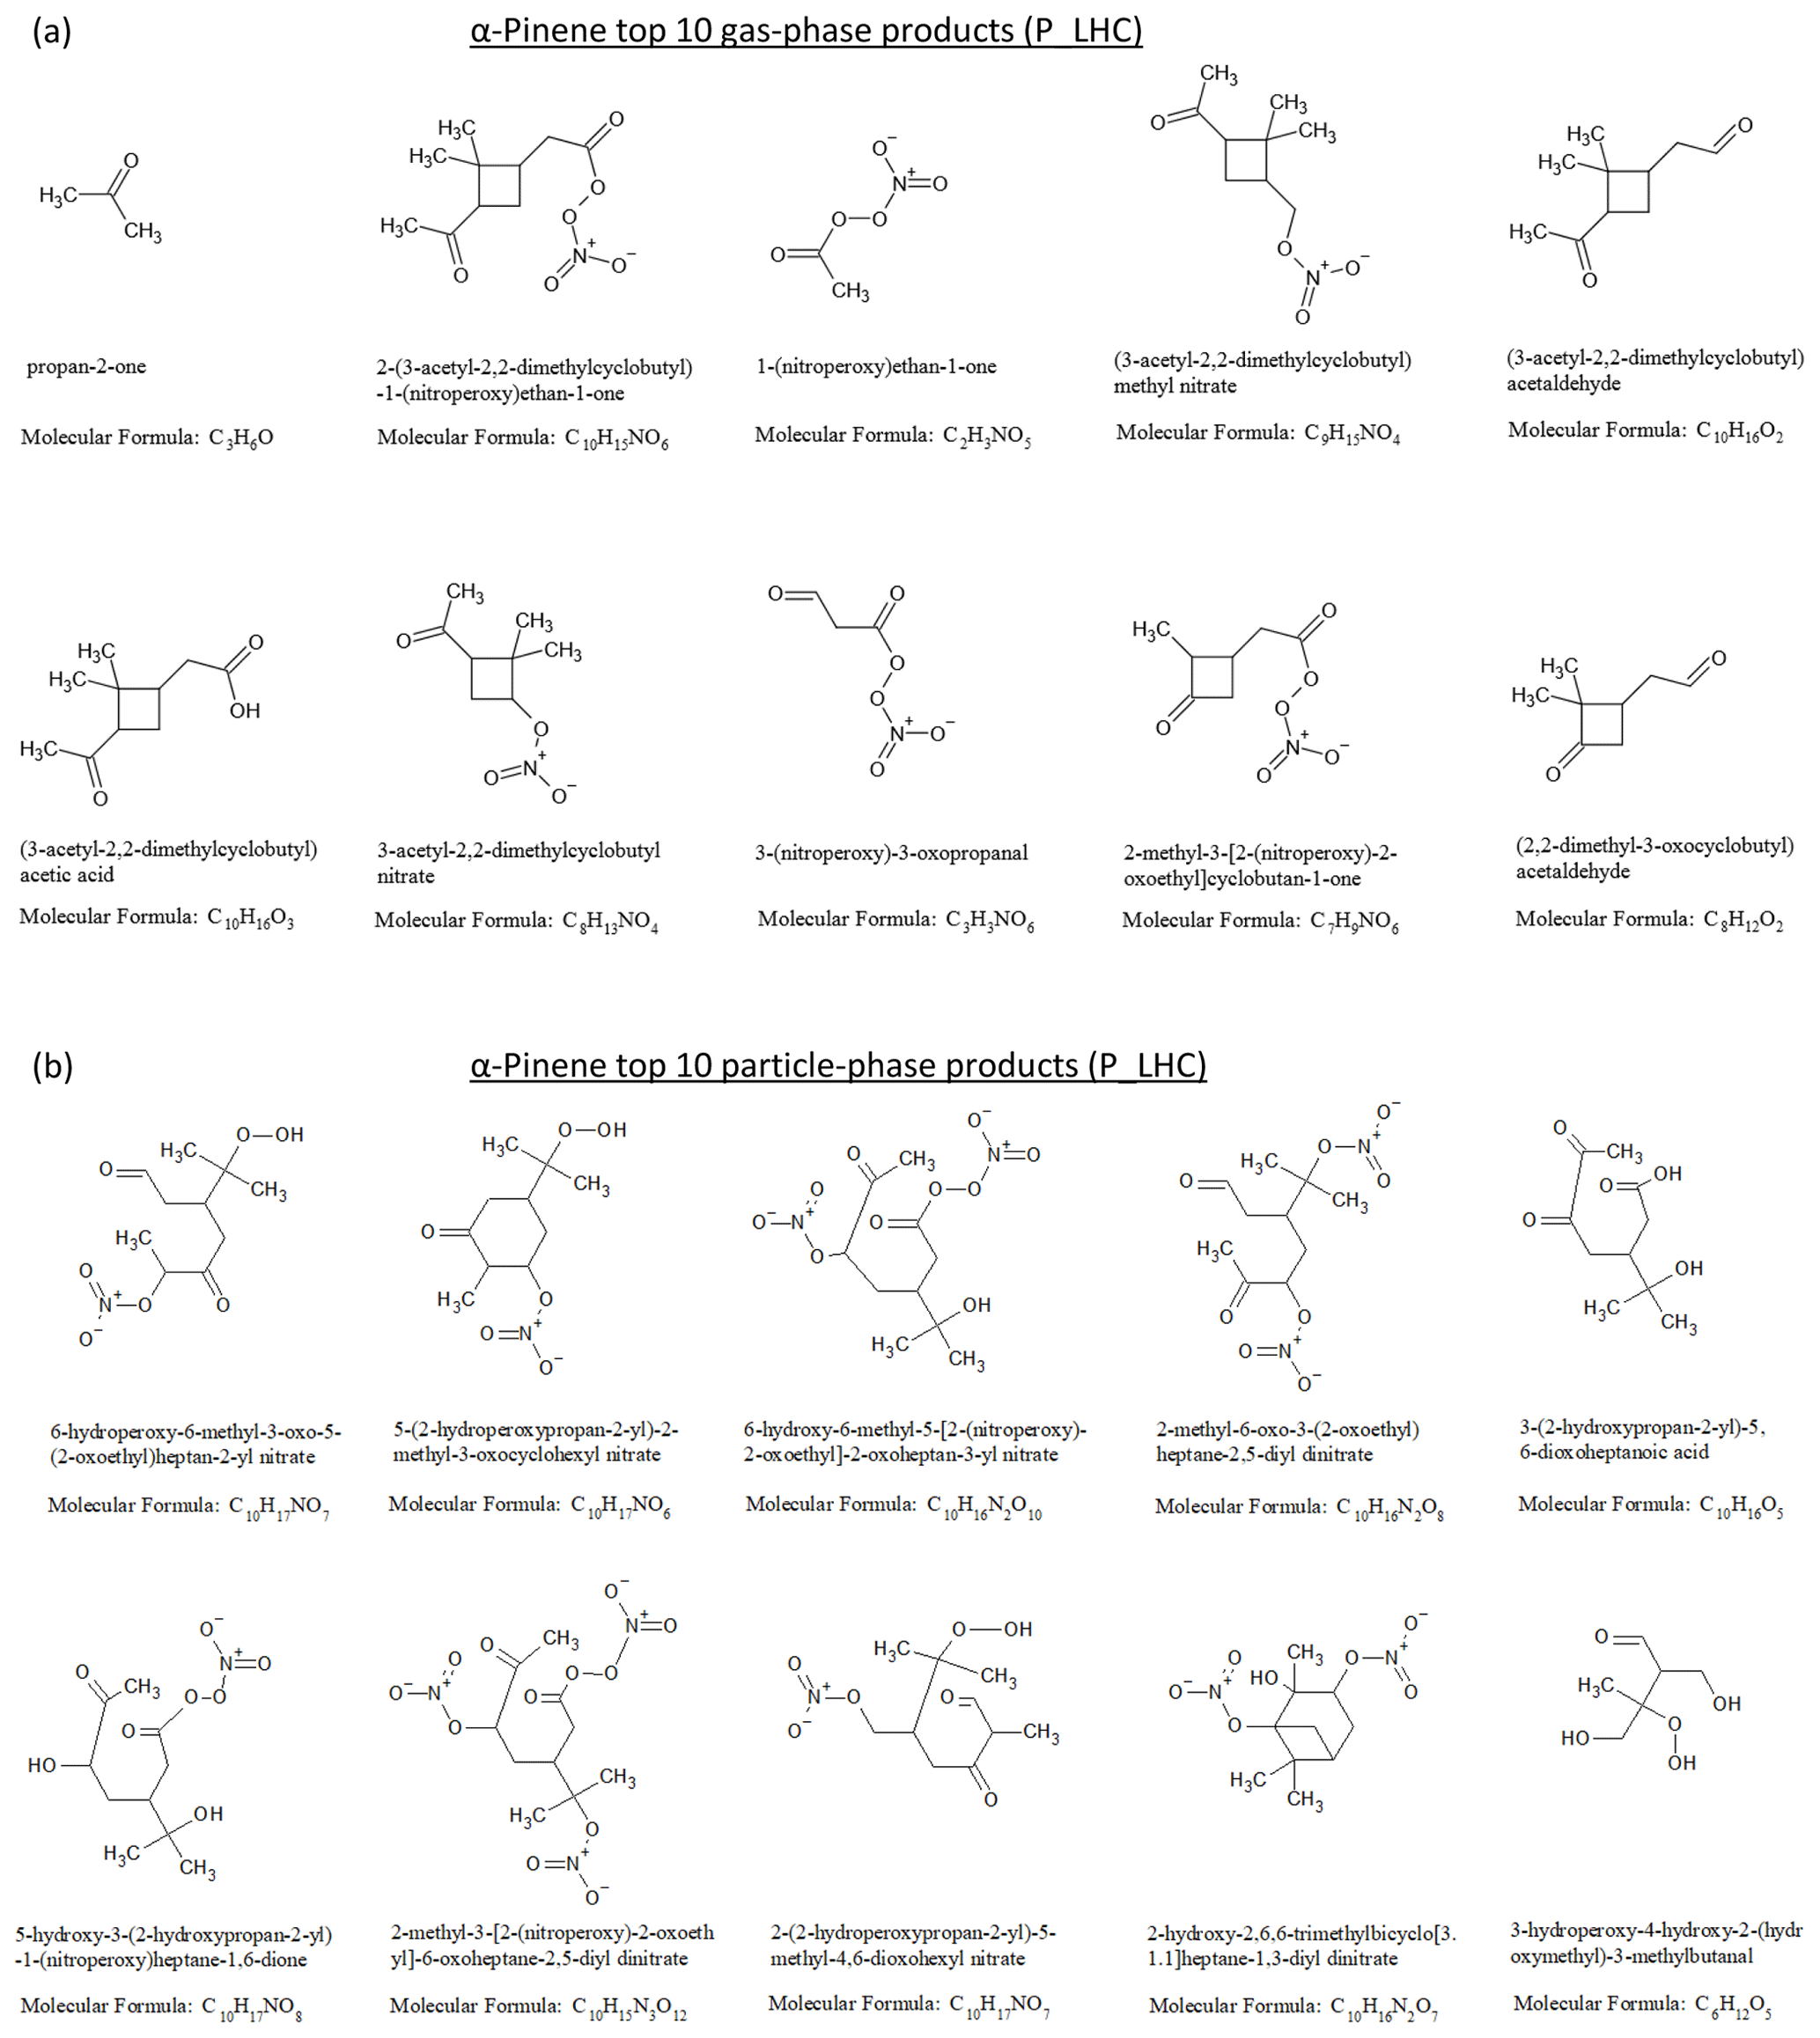
Figure 5(a) Top 10 gas-phase products and (b) top 10 particle-phase products from α-pinene photooxidation at the end of the low hydrocarbon (P_LHC) simulation.
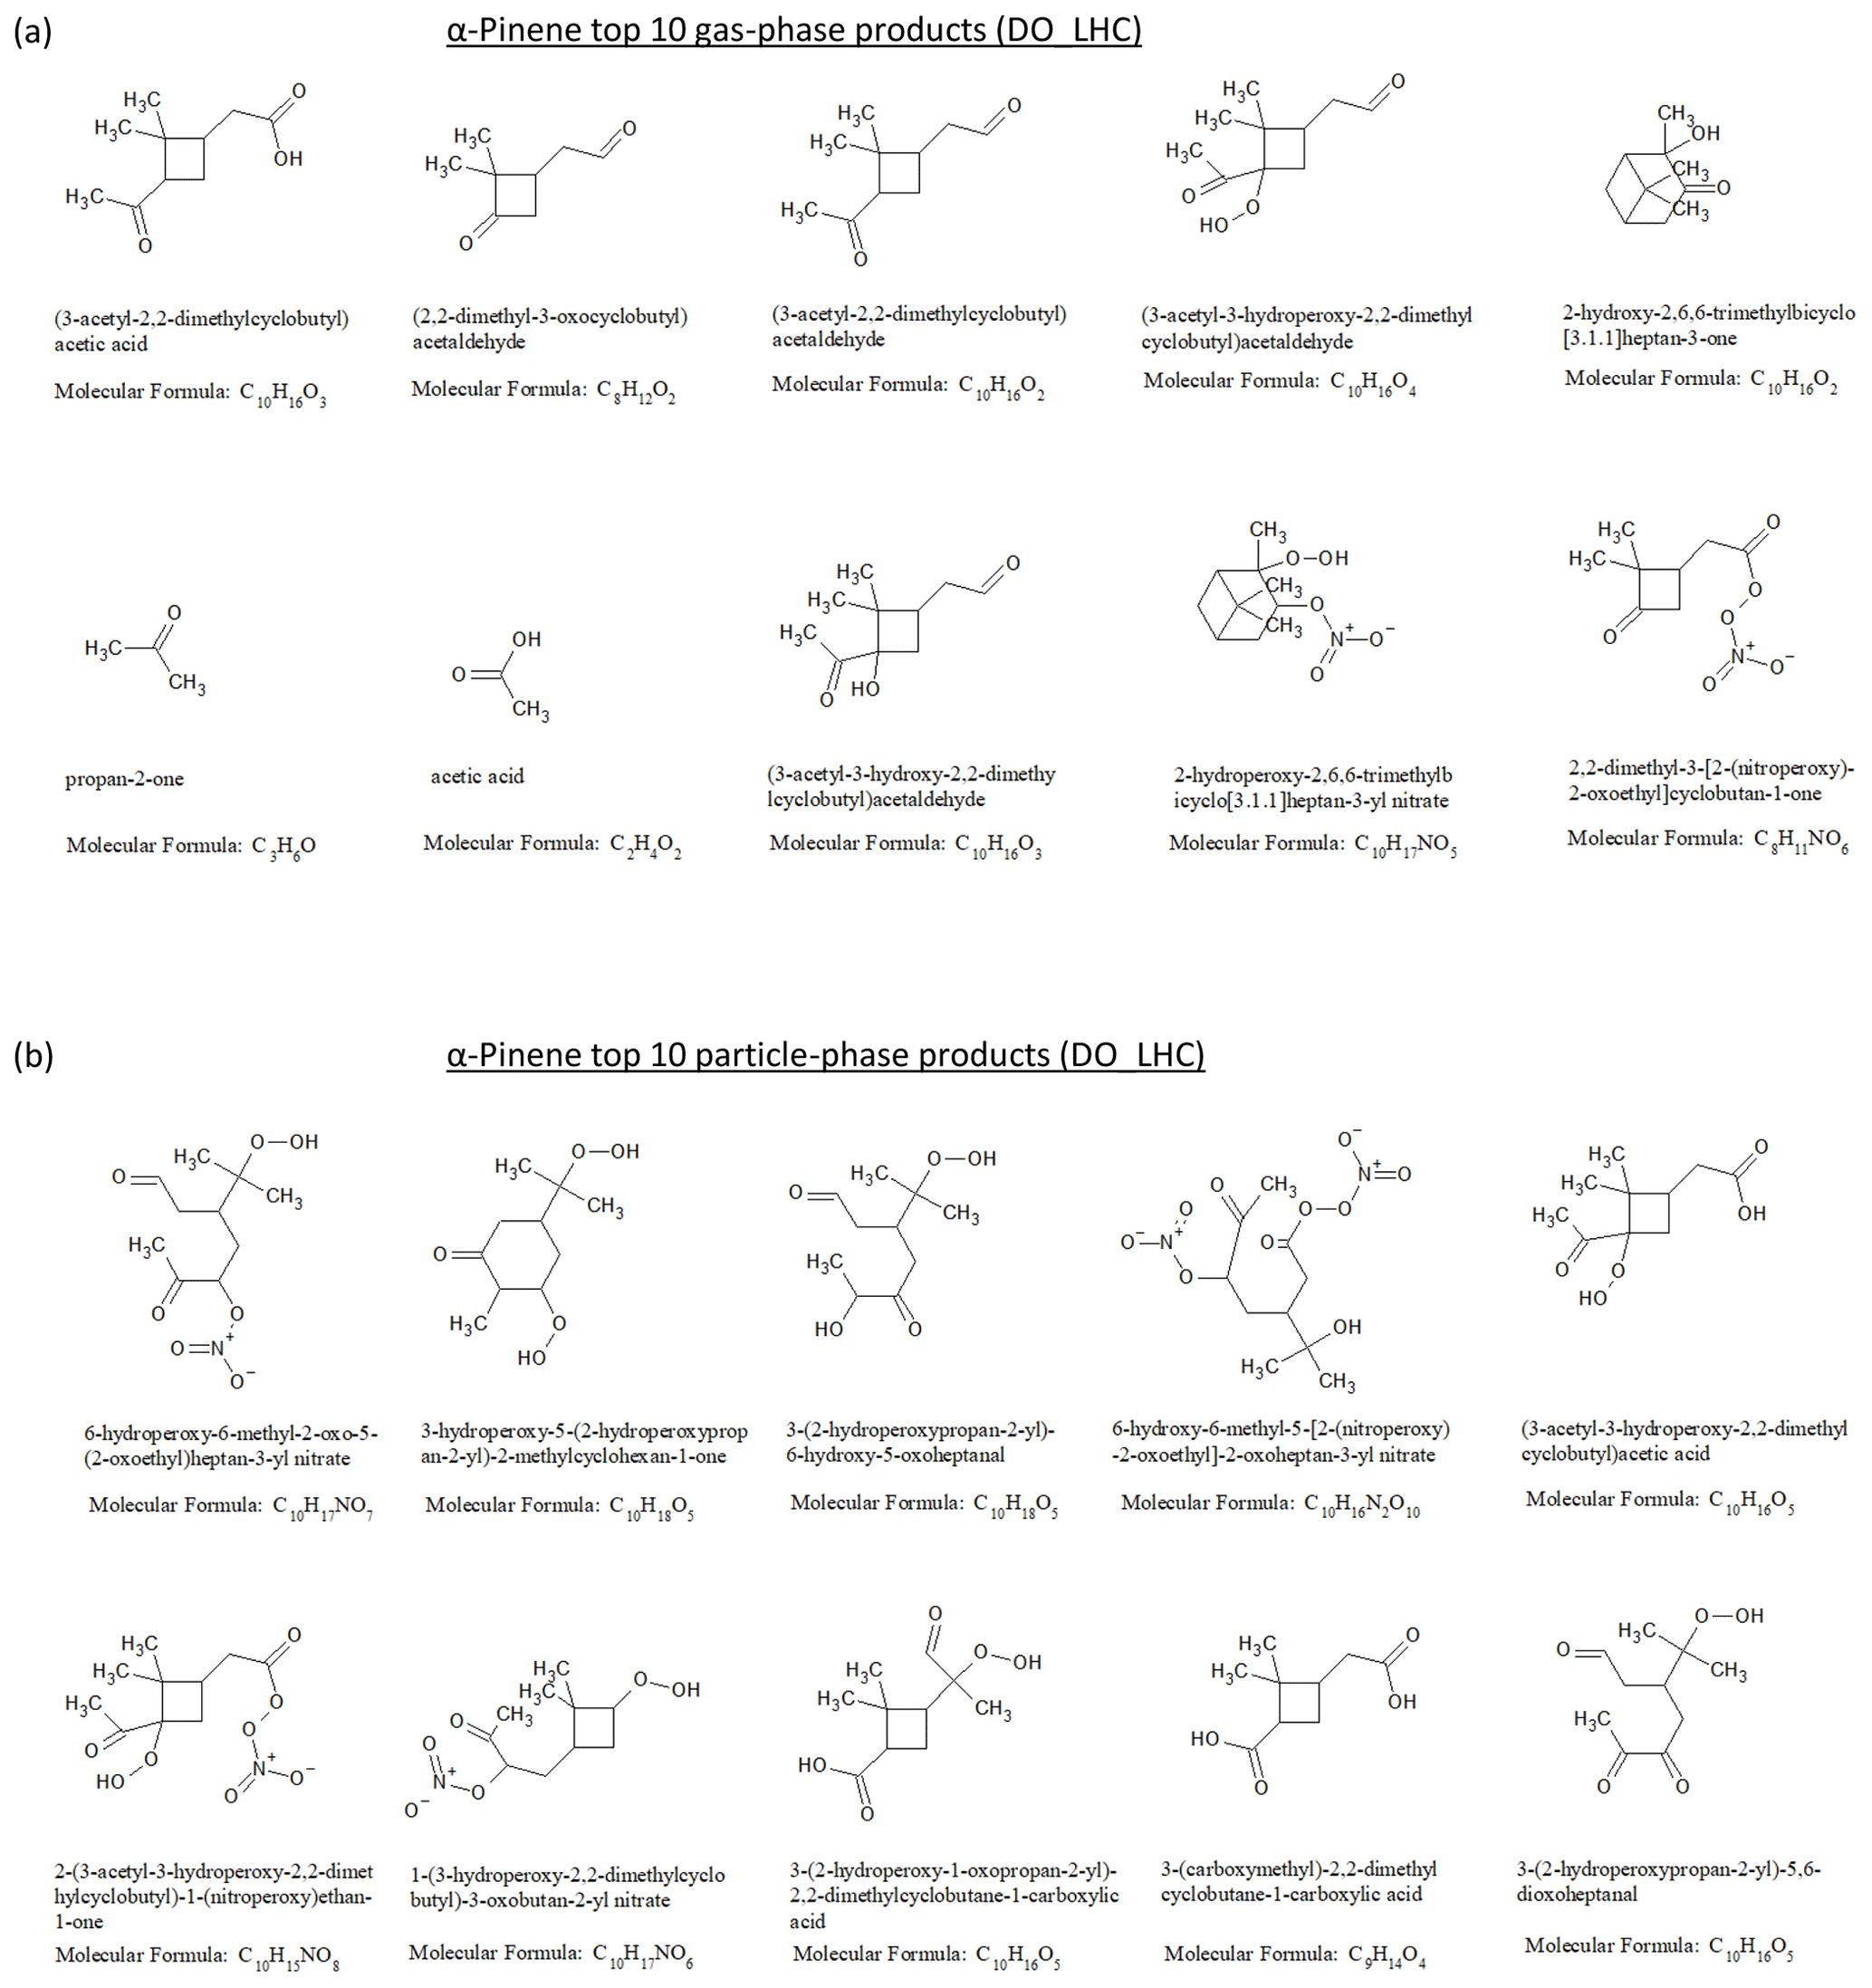
Figure 6(a) Top 10 gas-phase products and (b) top 10 particle-phase products from α-pinene dark ozonolysis at the end of the low hydrocarbon (DO_LHC) simulation.
The top 10 gas- and particle-phase products from the α-pinene ozonolysis simulation are shown in Fig. 6a and b. The top 10 gas-phase products account for 62 % of the reacted α-pinene carbon mass, while the top 10 particle-phase products account for 42 % of the SOA mass and 6 % of the reacted α-pinene carbon mass. A total of 3 of the top 10 products have been previously reported in experimental product studies of α-pinene ozonolysis (e.g., Jang and Kamens, 1999; Larsen et al., 2001; Yu et al., 1999). They include one particle-phase product, pinic acid (3-(carboxymethyl)-2,2-dimethylcyclobutane-1-carboxylic acid), and two gas-phase products, pinonic acid (i.e., (3-acetyl-2,2-dimethylcyclobutyl)acetic acid) and pinonaldehyde (i.e., (3-acetyl-2,2-dimethylcyclobutyl)acetaldehyde). For limonene ozonolysis (Figs. S12 and S13), the top 10 gas-phase products account for 24 % of reacted limonene, while the top 10 particle-phase products account for 37 % of the SOA mass and 27 % of the reacted limonene carbon mass. The top 10 particle-phase products were dominated by carbonyl, carboxyl, hydroxyl, and hydroperoxide, indicating the influence of multi-generational products via peroxy radicals + .
3.1.3 Modeled SOA yield and carbon budget
Given the skill of the model in representing published chamber data at both macroscopic and molecular levels, the model was used to explore the carbon budget during photooxidation and ozonolysis simulations. The time evolution of SOA yields for α-pinene and limonene during photooxidation and ozonolysis, as simulated by GECKO-A, is shown in Fig. 7a and b, respectively. Also shown are the corresponding final SOA mass concentrations. As has been previously reported (Lee et al., 2006b), limonene had a higher SOA yield than α-pinene under both photooxidation and ozonolysis conditions.
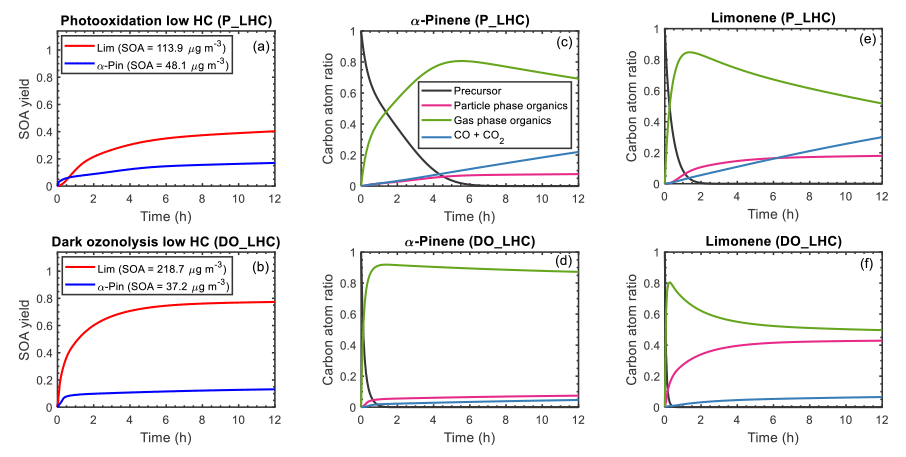
Figure 7Simulated SOA yield (a, b) and carbon budget (c–f) as a function of time for α-pinene and limonene during photooxidation (a, c, e) and dark ozonolysis (b, d, f). The SOA yield curve for α-pinene is represented by a blue line; limonene is represented by a red line. For the carbon budget plots, the mixing ratios of the precursor (black line), particle-phase organics (magenta line), gas-phase organics (green line), and CO+CO2 (blue line) are expressed as carbon atom ratios (ppbC initial precursor in ppbC; ppbC signifies parts per billion carbon). The results shown are for the low hydrocarbon mixing ratio (50 ppb) simulations.
The time evolution of the carbon budget during the photooxidation and ozonolysis simulations is shown in Fig. 7c to f. During photooxidation (Fig. 7c), the precursors were oxidized largely by OH and O3 (see Fig. S7 for the relative fractions of precursor reacting with each oxidant), forming organic oxidation products in the gas phase. These gaseous oxidation products partitioned into the particle phase if their volatility was low enough. Oxidation products that remained in the gas phase reacted with OH, NO3, and/or O3 or were photolyzed if a chromophore was present; these subsequent gas-phase reactions formed additional oxidation products that partitioned to the particle phase or continued to react in the gas phase. At the end of 12 h of photooxidation, the α-pinene system was dominated by organic oxidation products in the gas phase (70 %), with the remaining fractions being organic oxidation products in the particle phase (8 %) and CO+CO2 (22 %). The high yield of gas-phase organics is largely influenced by the high concentrations of acetone and volatile C8 to C10 species (see Fig. 5a for top gas-phase products and Fig. S9a for the gas- and particle-phase product distribution). As shown in the α-pinene + OH reaction scheme (Fig. 1) acetone is formed when the monocyclic alkoxy radical decomposes via O2 addition. For limonene photooxidation (Fig. 7e), the concentration of acetone is lower than for α-pinene and more of the C8 to C10 species are further oxidized and partitioned into the particle phase (Fig. S9c). This resulted in a final distribution of 50 % gas-phase organic products, 20 % particle-phase organic products, and 30 % CO+CO2. The simulated acetone yields are qualitatively consistent with experimental data that have shown yields of acetone from α-pinene photooxidation (Lee et al., 2006b; Wisthaler et al., 2001) can be up to 4 orders of magnitude higher than from limonene photooxidation (Lee et al., 2006b; Reissell et al., 1999).
For the α-pinene ozonolysis system (Fig. 7d), at the end of the simulation 88 % of the carbon is gas-phase organic products, 7 % particle-phase organic products, and 5 % CO+CO2. For limonene ozonolysis (Fig. 7f), 50 % of the carbon fraction is gas-phase organics, 43 % particle-phase organics, and 7 % CO+CO2. The higher particle-phase fraction for limonene ozonolysis is a result of the C8 and C10 organic products of limonene being more highly functionalized and thus partitioned to the particle phase (Figs. S9d and S13), whereas the C8 and C10 organic products of α-pinene are more volatile and partitioned to the gas phase (Figs. 6a and S9b).
3.2 Controlled reactivity simulations
The GECKO-A simulations captured trends (e.g., SOA yields and major products) observed in chamber studies (Sect. 3.1) for α-pinene and limonene, two common terpene model surrogates. The GECKO-A model was then used to perform a detailed study of SOA formation from camphene under idealized (“controlled reactivity”) atmospheric conditions which were compared with analogous simulations for α-pinene and limonene.
3.2.1 Gas-phase chemistry
Time-dependent mixing ratios of HO2, OH, and NO3 are shown in Fig. 8 for the controlled reactivity simulations performed at 0.1 ppb of HCo (camphene, α-pinene, or limonene) and 10 µg m−3 of organic seed. The O3 and total NOx levels were fixed so that the oxidant (OH, O3, and NO3) levels remained stable during the simulations. The reaction rate of camphene with O3 is extremely slow (2 and 3 orders of magnitude lower than the rate constants for α-pinene + O3 and limonene + O3, respectively; Atkinson and Arey, 2003a); thus, camphene predominately reacts with OH in the simulations, while α-pinene and limonene react with O3 and OH (see Fig. S30 for relative fractions). The time profiles of HO2, OH, and NO3 were independent of the precursor, confirming that the gas-phase oxidant levels were controlled by the added ethane and formaldehyde. This allows for a comparative assessment of the monoterpenes. The calculated lifetime of RO2 with was <60 s, and thus it was assumed that these bimolecular RO2 reactions would be dominant, and the absence of HOM formation via RO2 autoxidation in GECKO-A did not significantly have an impact on the results and conclusions derived from these simulations.
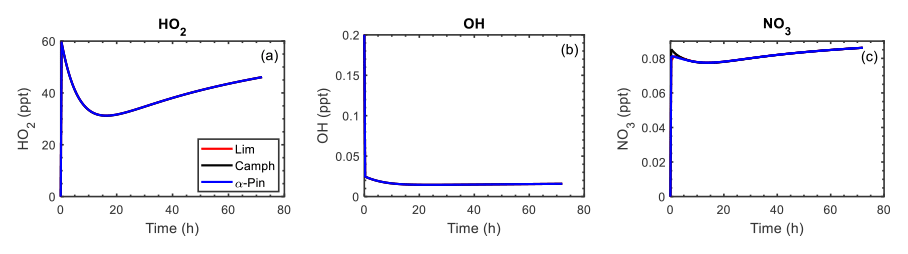
Figure 8Mixing ratios of HO2, OH, and NO3 as a function of time for limonene (red line), camphene (black line), and α-pinene (blue line) during the controlled reactivity simulations with 0.1 ppb of HCo and 10 µg m−3 of organic seed. By design, the profiles of the mixing ratios for each precursor overlap except for at the very beginning of the NO3 profile.
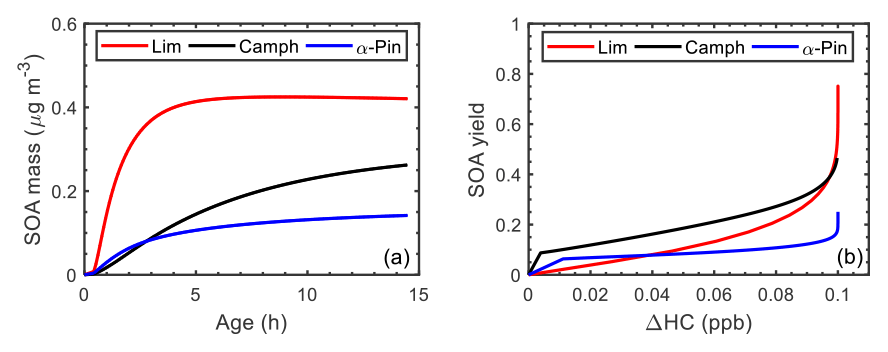
Figure 9(a) Simulated SOA mass as a function of atmospheric aging time (reaction with OH) and (b) simulated SOA yield as a function of reacted hydrocarbon concentration (ΔHC) during the controlled reactivity simulation at 0.1 ppb HCo with 10 µg m−3 seed for limonene (red line), camphene (black line), and α-pinene (blue line).
3.2.2 Simulated SOA formation
Figure 9 illustrates the simulated SOA yields as a function of atmospheric aging time (Fig. 9a) and the SOA yield as function of reacted HC concentration (Fig. 9b) for the controlled reactivity simulations. The atmospheric aging time, τ is defined as
where [OH]atm is the atmospheric OH concentration (2×10⁶ was assumed), and [OH]sim is the simulated OH concentration. Camphene was predicted to form more SOA (0.26 µg m−3) than α-pinene (0.14 µg m−3) but less than limonene (0.42 µg m−3) after 14.5 h of aging time (Fig. 9a). The simulation results in Fig. 9b show that camphene, which reacts predominantly with OH (Fig. S30), forms low-volatility products (more SOA at lower ΔHC) at the start of the reaction than α-pinene and limonene. However, after the precursor is completely consumed, the SOA yield of limonene exceeds that of camphene. The shorter lifetime and chemical structure, including the presence of two double bonds, contribute to the relatively high SOA yield of limonene. As previously reported (Lee et al., 2006b), and as simulated herein, limonene had the highest SOA yield among well-studied monoterpenes. However, the final SOA yield of camphene was relatively high, approximately twice that of α-pinene.
3.2.3 Gas- and particle-phase product distribution
Figure 10 shows the product distribution in the gas and particle phases after 72 h (equivalent to 14.5 h of atmospheric OH aging time) for the controlled reactivity simulations. While thousands of secondary species are formed during the oxidation of a given monoterpene, only species that contribute ≥0.01 % of the total gas- or particle-phase mass were included in Fig. 10. Also, all C1 species, as well as seven of the C2 gas-phase products (whose concentrations were largely a direct result of ethane chemistry) were omitted from Fig. 10. For camphene (Fig. 10a), the particle phase is largely dominated by C10 species with three to five functional groups, followed by highly functionalized C7 species (typically with four to five functional groups). Similarly, for limonene (Fig. 10b), the particle phase is dominated by C10 species with four to five functional groups, followed by C7 to C9 species with four to five functional groups. However, for α-pinene (Fig. 10c), there is a broad distribution of C8 to C10 products (with three to four functional groups) contributing to the particle phase. Generally, the volatility of particle-phase products from camphene and limonene was lower than from α-pinene. As shown in Fig. 10a, a large fraction of gas-phase products from camphene, as compared to limonene, is composed of C9 and C10 products whose volatility was not low enough to partition to the particle phase. This further explains the SOA yields shown in Fig. 9b, in which limonene SOA yield exceeded camphene SOA yield at the end of the simulation.
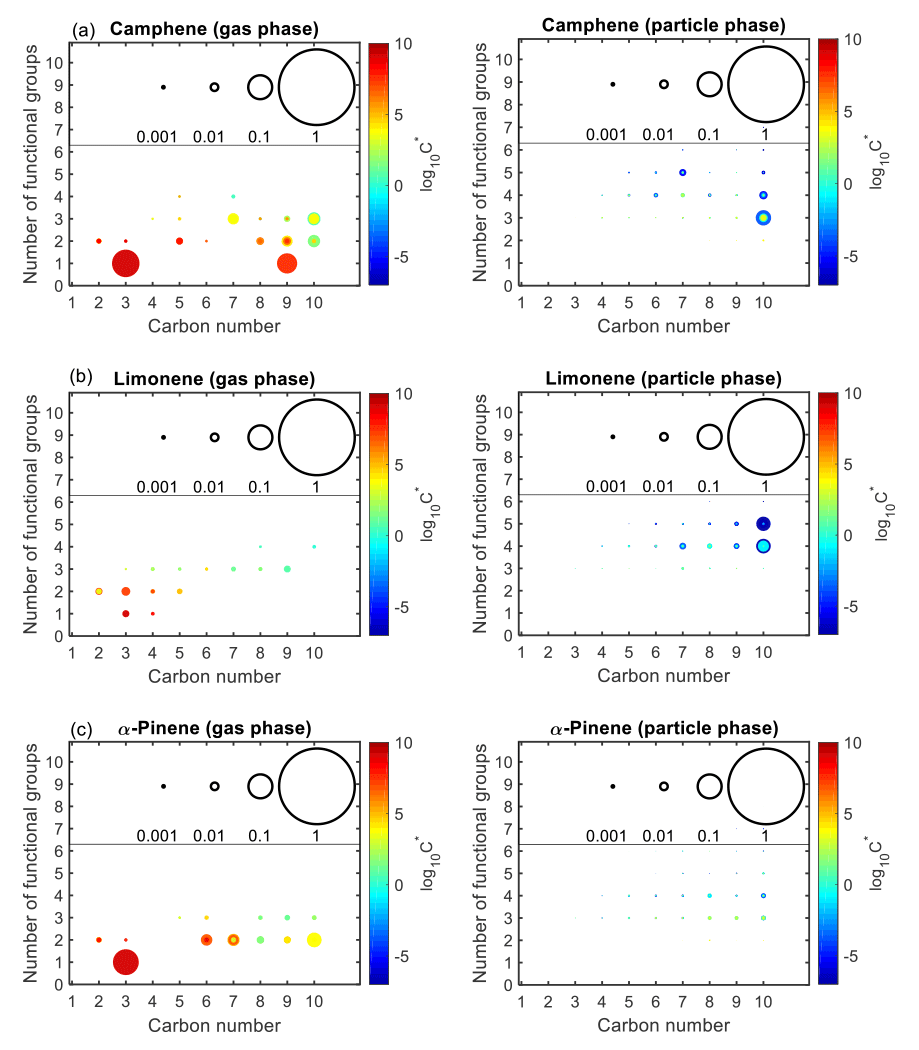
Figure 10Number of functional groups associated with gas- and particle-phase species as a function of carbon number. Results are shown for camphene, α-pinene, and limonene after 72 h of oxidation under controlled reactivity conditions. The markers are sized by the ratio of their mixing ratio (in ppbC) to the initial mixing ratio of the precursor (in ppbC). The colors of the markers are scaled by volatility (represented by saturation concentration, C*).
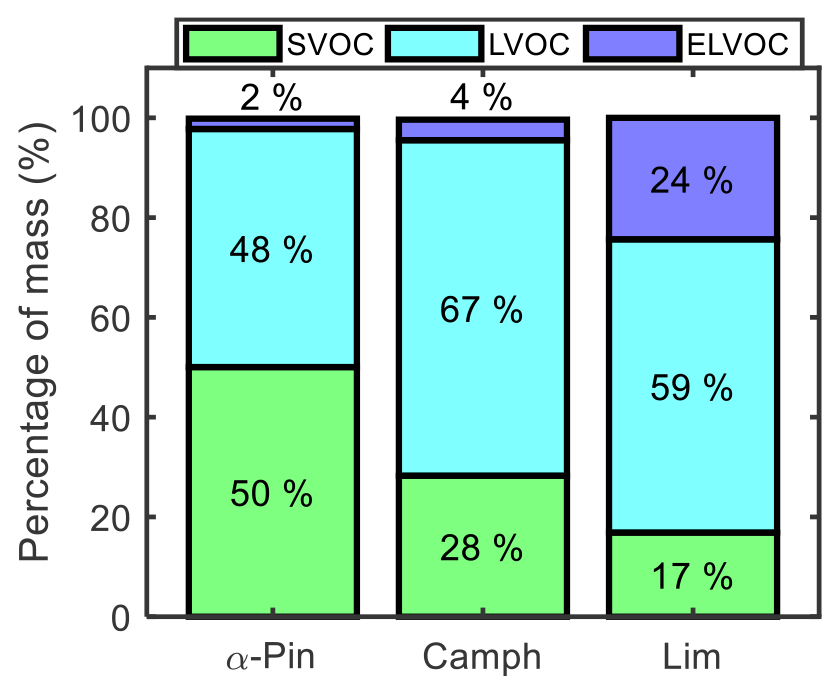
Figure 11Mass percentage of four volatility categories in the particle phase at the end of the controlled reactivity simulations for α-pinene, camphene, and limonene.
Figure 11 shows the final mass percentages of α-pinene, camphene, and limonene particle-phase oxidation products grouped into three volatility categories. The volatility categories were assigned based on the calculated mass saturation concentrations (C*) of the simulated products. C* was calculated based on the equilibrium absorption coefficient equation, as defined by Odum et al. (1996) and Pankow (1994). Log C* values in the range of , −3.5 to −0.5, and −0.5 to 2.5 were assigned respectively as extremely low-volatility, low-volatility, and semi-volatile organic compounds (ELVOCs, LVOCs, and SVOCs) (Chuang and Donahue, 2016; Zhang et al., 2015). Limonene, which had the highest simulated SOA yield among the three studied monoterpenes, was largely LVOCs (59 %), followed by ELVOCs (24 %) and then SVOCs (17 %). Camphene SOA was also largely LVOCs (67 %), followed by SVOCs (28 %) and then a significantly lower fraction of ELVOCs (4 %) than limonene. In contrast, α-pinene SOA was dominated by SVOCs (50 %), followed by LVOCs (48 %) and then ELVOCs (2 %). For experimental studies of α-pinene ozonolysis, Zhang et al. (2015) reported a fractional contribution of ∼68 % SVOCs to final SOA mass, which is similar to the contribution predicted using GECKO-A. For α-pinene and camphene, intermediate-volatility organic compounds (IVOCs) were less than 1 % of the SOA mass. Product volatility distributions can be influenced by gas-phase RO2 autoxidation and condensed-phase reactions, which were not considered here. While HOM formation likely played a minor role in these controlled reactivity simulations, the monomer building blocks of known accretion reactions were predicted for all monoterpenes studied. Thus, it is expected that accretion product formation could occur under these conditions, leading to changes in the simulated volatility distributions.
3.2.4 Using α-pinene limonene as a surrogate for camphene
For the controlled reactivity simulations, the final SOA mass and yield of camphene (0.26 µg m−3, 0.46) were between the final SOA mass and yield of α-pinene (0.14 µg m−3, 0.25) and limonene (0.42 µg m−3, 0.74). This suggests that camphene could potentially be represented in models as a mixture of α-pinene + limonene, for which SOA parameterizations currently are available (Griffin et al., 1999; Pathak et al., 2007a; Zhang et al., 2006). To test this, a controlled reactivity simulation was run with 50 ppt (parts per thousand) α-pinene + 50 ppt limonene; simulation results were then compared with the simulation results for 0.1 ppb of camphene. Figure 12a shows that while the slopes of the SOA yield curves differ over the course of the reaction, the SOA masses (0.26 µg m−3 for 50 % α-pinene + 50 % limonene and 0.26 µg m−3 for camphene) and yields (0.46 for 50 % α-pinene + 50 % limonene and 0.47 for camphene) were approximately equal at the end of the simulation. However, the end of simulation particle-phase volatility distributions (Fig. 12b) are notably different. The 50 % α-pinene + 50 % limonene simulation had a significantly higher fraction (25 %) of ELVOCs, influenced by the low-volatility limonene products, than the camphene simulation (4 %). These results suggest that while the final SOA mass and yield of the α-pinene + limonene mixture were representative of camphene, the properties (e.g., volatility) of the particle-phase products were not. The volatility distributions will influence the formation of SOA at the lowest mass loadings and will also influence changes in SOA mass as a function of dilution, with the surrogate mixture (50 % α-pinene + 50 % limonene) producing less volatile SOA than predicted for camphene. Thus, the extent to which camphene can be represented by α-pinene + limonene will depend on the application. To improve the representation of camphene, a second simulation was run with 50 ppt α-pinene + 50 ppt limonene, in which the rate constants of α-pinene and limonene were replaced with the rate constants of camphene during the chemical mechanism generation. However, the representation of camphene SOA by the α-pinene + limonene mixture did not improve (resulted in higher final SOA yield of 0.51) when the rate constants of α-pinene and limonene were replaced with those of camphene (Fig. 12a). Also, representing camphene by the limonene mechanism with camphene rate constants did not improve the representation of camphene SOA (see Fig. S33). This illustrates the importance of both the reaction rate constants and structure on SOA formation from monoterpenes.
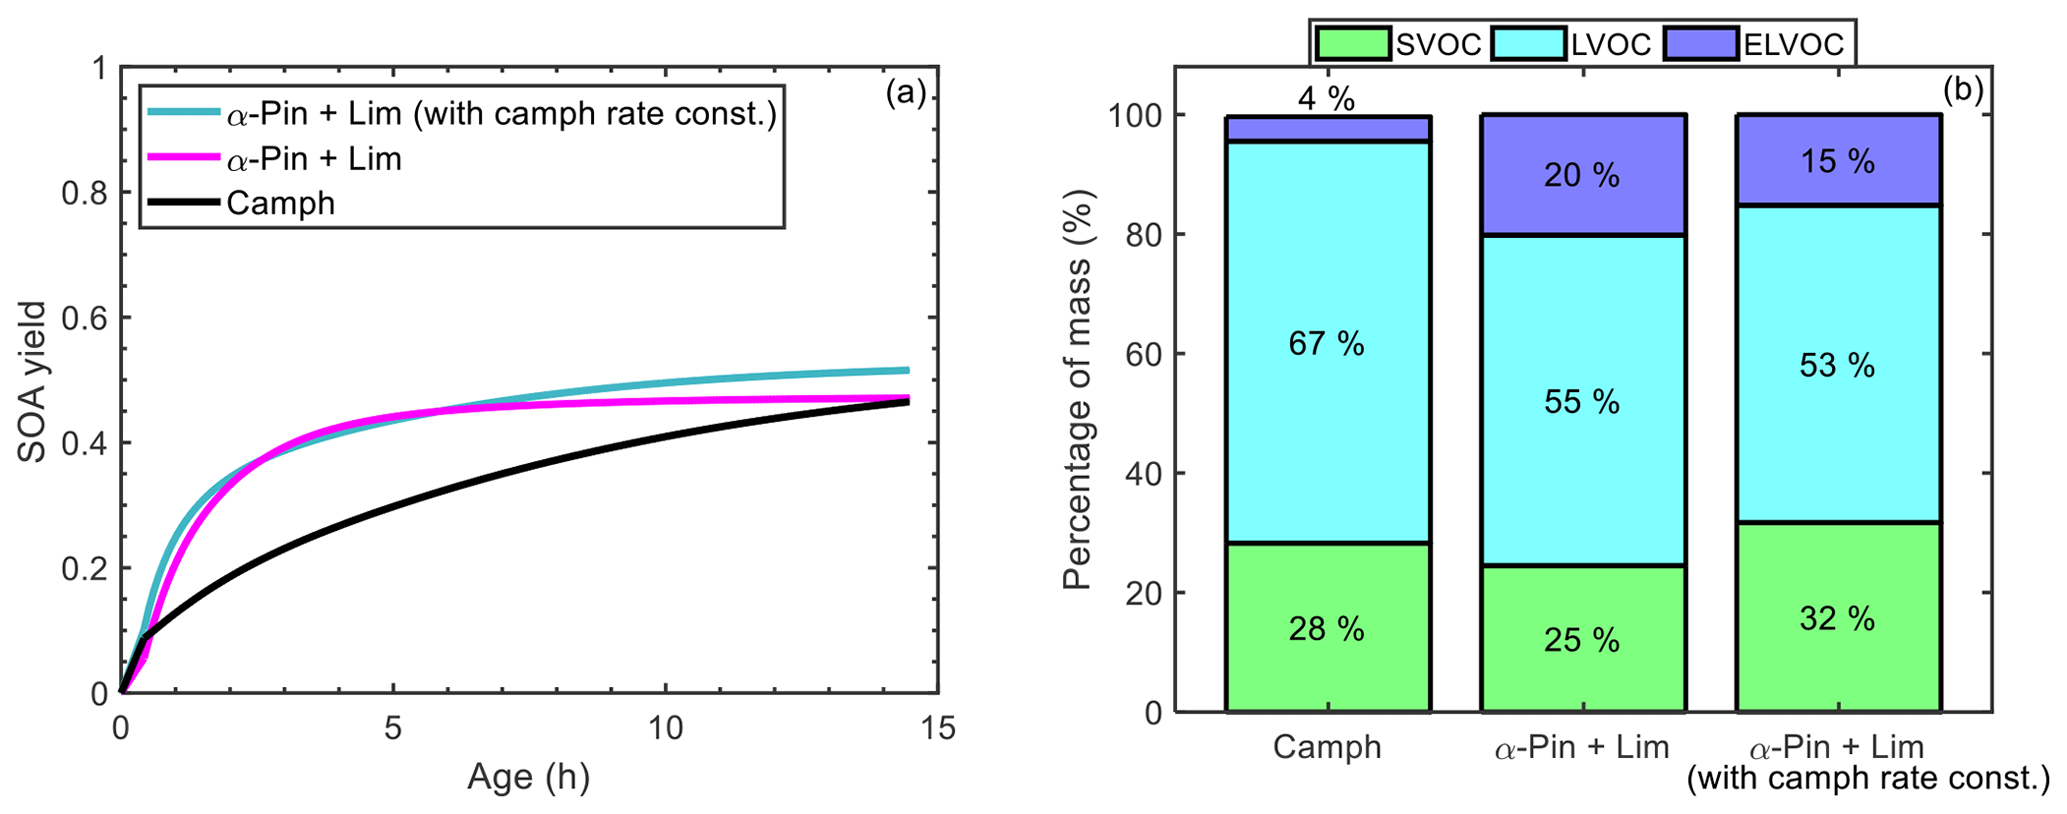
Figure 12(a) Simulated SOA yield as a function of atmospheric aging time for camphene (black line), 50 % α-pinene + 50 % limonene (magenta line), and 50 % α-pinene + 50 % limonene in which the rate constants of α-pinene and limonene were replaced with the rate constants of camphene (green line); and (b) mass percentage of four volatility categories in the particle phase at the end of the controlled reactivity simulations for camphene, 50 % α-pinene + 50 % limonene, and limonene, and 50 % α-pinene + 50 % limonene in which the rate constants of α-pinene and limonene were replaced with the rate constants of camphene.
Table 4SOA yield and mass predicted using two-product and VBS parameters for the top five monoterpenes by emission factor (EF) from black spruce, Douglas fir, and lodgepole pine. For each fire fuel, the monoterpenes were represented using two different surrogate assignments. In Assignment 1, α-pinene is used to represent all monoterpenes except limonene. In Assignment 2, camphene is represented as 50 % α-pinene + 50 % limonene. There is no Assignment 2 for lodgepole pine because camphene is not one of the top five monoterpenes by EF. The percentage (%) increase in SOA was calculated based on the difference between the total SOA of assignments 1 and 2. The EFs of assignments 1 and 2, the two-product SOA parameters, and the VBS parameters are provided in Tables S2–S4, respectively.
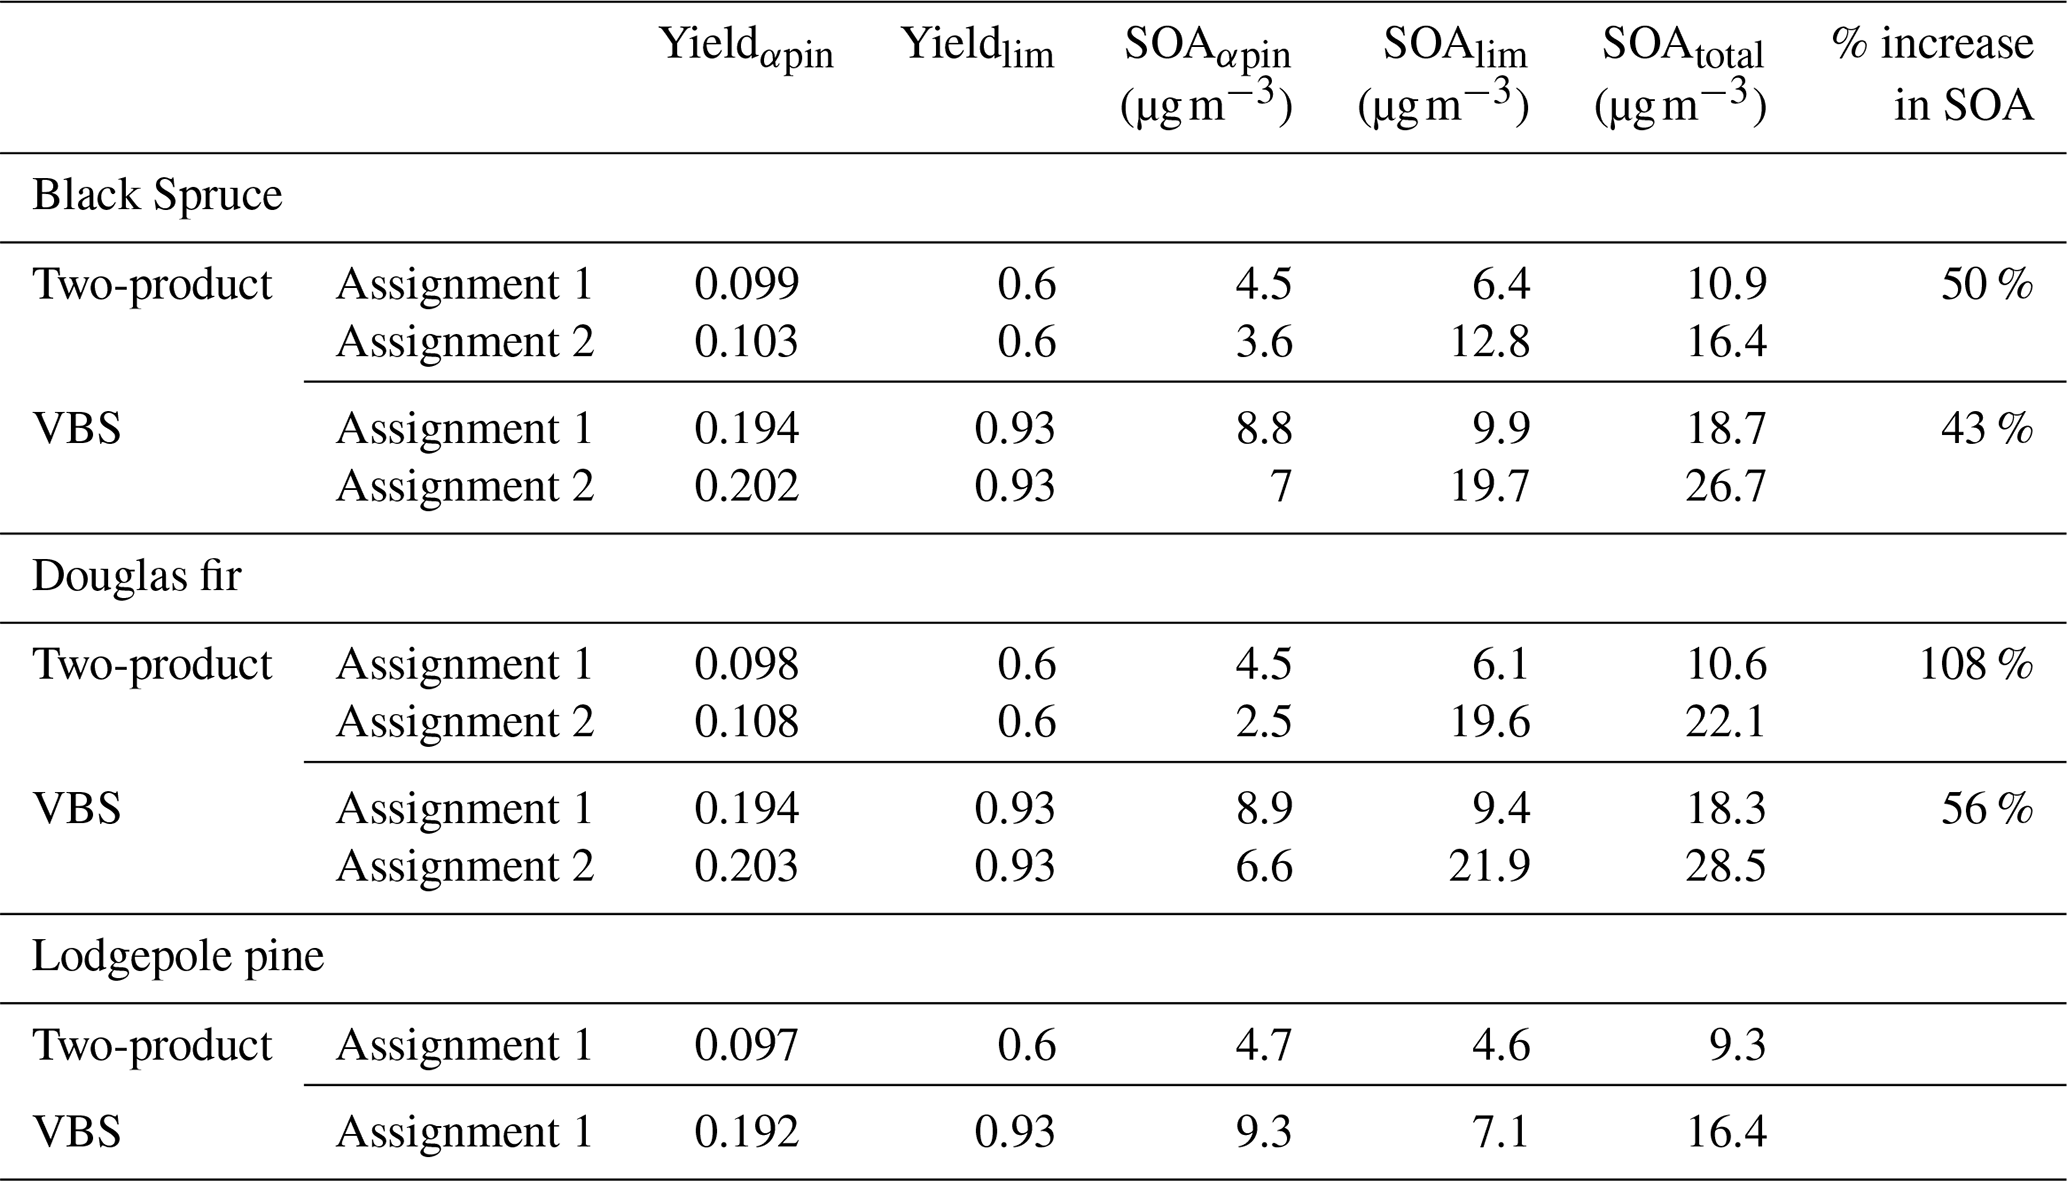
To demonstrate the potential impact of including a parameterized representation of SOA formation by camphene in air quality models, SOA mass and yields were predicted for three wildland fire fuels based on the measured monoterpene distributions in Hatch et al. (2015) for black spruce, and Hatch et al. (2019) for Douglas fir and lodgepole pine. The top five monoterpenes by emissions factor (mass of compound emitted per mass of fuel burned) represent ∼70 %–80 % of the total monoterpene emission factor (EF) for each of these fuels. These top five monoterpenes were used to represent SOA formation from monoterpenes for each fuel by normalizing the monoterpene EF for each fuel, assigning α-pinene as the model surrogate for all measured compounds except limonene, including camphene, and then reassigning camphene as 50 % α-pinene + 50 % limonene. SOA mass concentrations and yields were predicted assuming a background PM level of 50 µg m−3 and ΔHC = 10 ppb and using published two-product SOA parameters based on Griffin et al. (1999) (Table S3) and volatility basis set (VBS) parameters (low NOx, dry) based on Pathak et al. (2007b) (for α-pinene) and Zhang et al. (2006) (for limonene) (Table S4). The two model parameterizations were used to represent a range of potential outcomes. The SOA yields using the two-product parameters were lower than predicted here for α-pinene (∼0.1) but similar for camphene (∼0.6); using the VBS parameters, the yields were similar for α-pinene (∼0.2) but higher than predicted here for camphene (∼0.9). The total OA mass loadings in the parameterized SOA calculations were a factor of 3–6 higher than in the GECKO-A controlled reactivity simulations, which is consistent with the higher SOA yield for camphene predicted using the VBS parameters. The results of the SOA calculations are summarized in Table 4. For lodgepole pine, there is no change in SOA mass because camphene is not one of the top five monoterpenes by EF. However, for fuels in which camphene contributed significantly to the measured monoterpene EF, SOA mass increased by 43 %–50 % for black spruce and by 56 %–108 % for Douglas fir.
While camphene is a ubiquitous monoterpene measured in significant quantities from both biogenic and pyrogenic sources, little is known about SOA formation from camphene, and there are no published parameterizations to represent camphene SOA in air quality models. GECKO-A simulations suggest that the initial organic oxidation products of camphene are of low volatility and can condense at low OA mass loadings – lower than oxidation products predicted for α-pinene and limonene. Predicted final SOA yields for camphene in the controlled reactivity simulations (∼45 %) were in between those predicted for α-pinene (25 %) and limonene (∼75 %), suggesting that SOA formation from camphene can be represented in air quality models assuming a 50 % α-pinene + 50 % limonene surrogate mixture. The predicted SOA yields do not account for condensed-phase accretion reactions, which could occur under the simulation conditions. Calculations based on measured monoterpene distributions for three wildland fire fuels illustrate that accounting for camphene, in this case using the surrogate mixture and published SOA parameterizations for α-pinene and limonene, increased predicted SOA mass from monoterpenes by 43 %–108 %. This demonstrates the potential impact of representing SOA formation from camphene in air quality models and the need for an appropriate parameterization. The surrogate mixture appears to represent the SOA mass and yield of camphene well but not necessarily the volatility distribution of the products. The SOA mass, yields, and product volatility distributions can be influenced by gas-phase HOM formation and subsequent dimerization, as well as condensed-phase accretion reactions, which were not considered here. Further modeling and/or experimental studies are needed to develop and test a suitable parameterization for representing camphene SOA formation in air quality models; this includes robust assessments of changes in SOA composition and yields associated with gas-phase HOM formation via RO2 autoxidation and condensed-phase accretion reactions under a range of atmospherically relevant conditions.
The GECKO-A codes are not publicly accessible since the developers of the GECKO-A model want to completely evaluate the model prior to its release to the public. Please contact authors Bernard Aumont and Marie Camredon for questions regarding the GECKO-A model codes.
The GECKO-A simulation dataset is available on Zenodo: https://doi.org/10.5281/zenodo.5059693 (Afreh et al., 2021). Please contact authors Isaac Kwadjo Afreh and Kelley Claire Barsanti for questions regarding the GECKO-A simulation data.
The supplement related to this article is available online at: https://doi.org/10.5194/acp-21-11467-2021-supplement.
IKA performed the model simulations and led analysis and visualization efforts. KCB conceptualized, administered, and supervised the project. BA and MC developed the software and methodology, including the model, and supported the research design and interpretation of the results. IKA prepared the manuscript with review and editing contributions from KCB, BA, and MC.
The authors declare that they have no conflict of interest.
Publisher’s note: Copernicus Publications remains neutral with regard to jurisdictional claims in published maps and institutional affiliations.
The authors would like to thank Richard Valorso for the training given in the use of GECKO-A modeling tools. Isaac Kwadjo Afreh and Kelley Claire Barsanti acknowledge support from the National Oceanic and Atmospheric Administration (NOAA) and the National Science Foundation (NSF).
This research has been supported by the National Oceanic and Atmospheric Administration (grant no. AC4 NA16OAR4310103) and the National Science Foundation (NSF) (grant no. AGS-1753364).
This paper was edited by Delphine Farmer and reviewed by three anonymous referees.
Afreh, I. K., Barsanti, K. C., Bernard, A., and Camredon, M.: Using GECKO-A to derive mechanistic understanding of SOA formation from the ubiquitous but understudied camphene, Zenodo [data set], https://doi.org/10.5281/zenodo.5059693, 2021.
Akagi, S. K., Yokelson, R. J., Wiedinmyer, C., Alvarado, M. J., Reid, J. S., Karl, T., Crounse, J. D., and Wennberg, P. O.: Emission factors for open and domestic biomass burning for use in atmospheric models, Atmos. Chem. Phys., 11, 4039–4072, https://doi.org/10.5194/acp-11-4039-2011, 2011.
Akagi, S. K., Yokelson, R. J., Burling, I. R., Meinardi, S., Simpson, I., Blake, D. R., McMeeking, G. R., Sullivan, A., Lee, T., Kreidenweis, S., Urbanski, S., Reardon, J., Griffith, D. W. T., Johnson, T. J., and Weise, D. R.: Measurements of reactive trace gases and variable O3 formation rates in some South Carolina biomass burning plumes, Atmos. Chem. Phys., 13, 1141–1165, https://doi.org/10.5194/acp-13-1141-2013, 2013.
Almatarneh, M. H., Elayan, I. A., Poirier, R. A., and Altarawneh, M.: The ozonolysis of cyclic monoterpenes: A computational review, Can. J. Chem., 96, 281–292, https://doi.org/10.1139/cjc-2017-0587, 2018.
Ambrose, J. L., Haase, K., Russo, R. S., Zhou, Y., White, M. L., Frinak, E. K., Jordan, C., Mayne, H. R., Talbot, R., and Sive, B. C.: A comparison of GC-FID and PTR-MS toluene measurements in ambient air under conditions of enhanced monoterpene loading, Atmos. Meas. Tech., 3, 959–980, https://doi.org/10.5194/amt-3-959-2010, 2010.
Amin, H. S., Hatfield, M. L., and Huff Hartz, K. E.: Characterization of secondary organic aerosol generated from ozonolysis of α-pinene mixtures, Atmos. Environ., 67, 323–330, https://doi.org/10.1016/j.atmosenv.2012.10.063, 2013.
Atkinson, R. and Arey, J.: Atmospheric chemistry of biogenic Organic Compounds, Accounts Chem. Res., 31, 574–583, https://doi.org/10.1021/ar970143z, 1998.
Atkinson, R. and Arey, J.: Atmospheric degradation of volatile organic compounds, Chem. Rev., 103, 4605–4638, https://doi.org/10.1021/cr0206420, 2003a.
Atkinson, R. and Arey, J.: Gas-phase tropospheric chemistry of biogenic volatile organic compounds: A review, Atmos. Environ., 37, 197–219, https://doi.org/10.1016/S1352-2310(03)00391-1, 2003b.
Atkinson, R., Aschmann, S. M., and Arey, J.: Rate constants for the gas-phase reactions of OH and NO3 radicals and O3 with sabinene and camphene at 296±2 K, Atmos. Environ. A-Gen., 24, 2647–2654, https://doi.org/10.1016/0960-1686(90)90144-C, 1990.
Aumont, B., Szopa, S., and Madronich, S.: Modelling the evolution of organic carbon during its gas-phase tropospheric oxidation: development of an explicit model based on a self generating approach, Atmos. Chem. Phys., 5, 2497–2517, https://doi.org/10.5194/acp-5-2497-2005, 2005.
Aumont, B., Valorso, R., Mouchel-Vallon, C., Camredon, M., Lee-Taylor, J., and Madronich, S.: Modeling SOA formation from the oxidation of intermediate volatility n-alkanes, Atmos. Chem. Phys., 12, 7577–7589, https://doi.org/10.5194/acp-12-7577-2012, 2012.
Aumont, B., Camredon, M., Mouchel-Vallon, C., La, S., Ouzebidour, F., Valorso, R., Lee-Taylor, J., and Madronich, S.: Modeling the influence of alkane molecular structure on secondary organic aerosol formation, Faraday Discuss., 165, 105–122, https://doi.org/10.1039/c3fd00029j, 2013.
Bäck, J., Aalto, J., Henriksson, M., Hakola, H., He, Q., and Boy, M.: Chemodiversity of a Scots pine stand and implications for terpene air concentrations, Biogeosciences, 9, 689–702, https://doi.org/10.5194/bg-9-689-2012, 2012.
Bakker-Arkema, J. G., and Ziemann, P. J.: Measurements of kinetics and equilibria for the condensed phase reactions of hydroperoxides with carbonyls to form peroxyhemiacetals, ACS Earth Space Chem., 4, 467–475, https://doi.org/10.1021/acsearthspacechem.0c00008, 2020.
Barsanti, K. C., Kroll, J. H., and Thornton, J. A.: Formation of Low-Volatility Organic Compounds in the Atmosphere: Recent Advancements and Insights, J. Phys. Chem. Lett., 8, 1503–1511, https://doi.org/10.1021/acs.jpclett.6b02969, 2017.
Baruah, S. D., Gour, N. K., Sarma, P. J., and Deka, R. C.: OH-initiated mechanistic pathways and kinetics of camphene and fate of product radical: a DFT approach. Environ, Sci. Pollut. R., 25, 2147–2156, https://doi.org/10.1007/s11356-017-0646-2, 2018.
Bianchi, F., Kurtén, T., Riva, M., Mohr, C., Rissanen, M. P., Roldin, P., Berndt, T., Crounse, J. D., Wennberg, P. O., Mentel, T. F., Wildt, J., Junninen, H., Jokinen, T., Kulmala, M., Worsnop, D. R., Thornton, J. A., Donahue, N., Kjaergaard, H. G., and Ehn, M.: Highly Oxygenated Organic Molecules (HOM) from Gas-Phase Autoxidation Involving Peroxy Radicals: A Key Contributor to Atmospheric Aerosol, Chem. Rev., 119, 3472–3509, https://doi.org/10.1021/acs.chemrev.8b00395, 2019.
Boyd, C. M., Nah, T., Xu, L., Berkemeier, T., and Ng, N. L.: Secondary organic aerosol (SOA) from nitrate radical oxidation of monoterpenes: Effects of temperature, dilution, and humidity on aerosol formation, mixing, and evaporation, Environ. Sci. Technol., 51, 7831–7841, https://doi.org/10.1021/acs.est.7b01460, 2017.
Calogirou, A., Larsen, B. R., and Kotzias, D.: Gas-phase terpene oxidation products: A review, Atmos. Environ., 33, 1423–1439, https://doi.org/10.1016/S1352-2310(98)00277-5, 1999.
Camredon, M., Aumont, B., Lee-Taylor, J., and Madronich, S.: The system: an explicit model of secondary organic aerosol formation, Atmos. Chem. Phys., 7, 5599–5610, https://doi.org/10.5194/acp-7-5599-2007, 2007.
Carter, W. P. L.: Development of a condensed SAPRC-07 chemical mechanism, Atmos. Environ., 44, 5336–5345, https://doi.org/10.1016/j.atmosenv.2010.01.024, 2010.
Chen, F., Zhou, H., Gao, J., and Hopke, P. K.: A chamber study of secondary organic aerosol (SOA) formed by ozonolysis of d-limonene in the presence of NO, Aerosol Air Qual. Res., 17, 59–68, https://doi.org/10.4209/aaqr.2016.01.0029, 2017.
Chen, Q., Liu, Y., Donahue, N. M., Shilling, J. E., and Martin, S. T.: Particle-phase chemistry of secondary organic material: Modeled compared to measured O:C and H:C elemental ratios provide constraints, Environ. Sci. Technol., 45, 4763–4770, https://doi.org/10.1021/es104398s, 2011.
Chhabra, P. S., Flagan, R. C., and Seinfeld, J. H.: Elemental analysis of chamber organic aerosol using an aerodyne high-resolution aerosol mass spectrometer, Atmos. Chem. Phys., 10, 4111–4131, https://doi.org/10.5194/acp-10-4111-2010, 2010.
Chhabra, P. S., Ng, N. L., Canagaratna, M. R., Corrigan, A. L., Russell, L. M., Worsnop, D. R., Flagan, R. C., and Seinfeld, J. H.: Elemental composition and oxidation of chamber organic aerosol, Atmos. Chem. Phys., 11, 8827–8845, https://doi.org/10.5194/acp-11-8827-2011, 2011.
Chuang, W. K. and Donahue, N. M.: A two-dimensional volatility basis set – Part 3: Prognostic modeling and NOx dependence, Atmos. Chem. Phys., 16, 123–134, https://doi.org/10.5194/acp-16-123-2016, 2016.
Claflin, M. S., Krechmer, J. E., Hu, W., Jimenez, J. L., and Ziemann, P. J.: Functional group composition of secondary organic aerosol formed from ozonolysis of α-pinene under high VOC and autoxidation conditions, ACS Earth Space Chem., 2, 1196–1210, https://doi.org/10.1021/acsearthspacechem.8b00117, 2018.
Draper, D. C., Farmer, D. K., Desyaterik, Y., and Fry, J. L.: A qualitative comparison of secondary organic aerosol yields and composition from ozonolysis of monoterpenes at varying concentrations of NO2, Atmos. Chem. Phys., 15, 12267–12281, https://doi.org/10.5194/acp-15-12267-2015, 2015.
Ehn, M., Thornton, J. A., Kleist, E., Sipilä, M., Junninen, H., Pullinen, I., Springer, M., Rubach, F., Tillmann, R., Lee, B., Lopez-Hilfiker, F., Andres, S., Acir, I. H., Rissanen, M., Jokinen, T., Schobesberger, S., Kangasluoma, J., Kontkanen, J., Nieminen, T., Kurtén, T., Nielsen, L. B., Jørgensen, S., Kjaergaard, H. G., Canagaratna M., Maso, M. D., Berndt, T., Petäjä, T., Wahner, A., Kerminen, V. M., Kulmala, M., Worsnop, D. R., Wildt, J., Mentel, T. F.: A large source of low-volatility secondary organic aerosol, Nature, 506, 476–479, https://doi.org/10.1038/nature13032, 2014.
Fehsenfeld, F., Calvert, J., Fall, R., Goldan, P., Guenther, A. B., Hewitt, C. N., Lamb, B., Liu, S., Trainer, M., Westberg, H., and Zimmerman, P.: Emissions of volatile organic compounds from vegetation and the implications for atmospheric chemistry, Global Biogeochem. Cy., 6, 389–430, https://doi.org/10.1029/92GB02125, 1992.
Friedman, B. and Farmer, D. K.: SOA and gas phase organic acid yields from the sequential photooxidation of seven monoterpenes, Atmos. Environ., 187, 335–345, https://doi.org/10.1016/j.atmosenv.2018.06.003, 2018.
Fry, J. L., Draper, D. C., Barsanti, K. C., Smith, J. N., Ortega, J., Winkler, P. M., Lawler, M. J., Brown, S. S., Edwards, P. M., Cohen, R. C., and Lee, L.: Secondary organic aerosol formation and organic nitrate yield from NO3 oxidation of biogenic hydrocarbons, Environ. Sci. Technol., 48, 11944–11953, https://doi.org/10.1021/es502204x, 2014.
Gaona-Colmán, E., Blanco, M. B., Barnes, I., Wiesen, P., and Teruel, M. A.: OH- and O3-initiated atmospheric degradation of camphene: Temperature dependent rate coefficients, product yields and mechanisms, RSC Adv., 7, 2733–2744, https://doi.org/10.1039/c6ra26656h, 2017.
Geron, C., Rasmussen, R., Arnts, R. R., and Guenther, A.: A review and synthesis of monoterpene speciation from forests in the United States, Atmos. Environ., 34, 1761–1781, https://doi.org/10.1016/S1352-2310(99)00364-7, 2000.
Gilman, J. B., Lerner, B. M., Kuster, W. C., Goldan, P. D., Warneke, C., Veres, P. R., Roberts, J. M., de Gouw, J. A., Burling, I. R., and Yokelson, R. J.: Biomass burning emissions and potential air quality impacts of volatile organic compounds and other trace gases from fuels common in the US, Atmos. Chem. Phys., 15, 13915–13938, https://doi.org/10.5194/acp-15-13915-2015, 2015.
Griffin, R. J., Cocker, D. R., Flagan, R. C., and Seinfeld, J. H.: Organic aerosol formation from the oxidation of biogenic hydrocarbons, J. Geophys. Res.-Atmos., 104, 3555–3567, https://doi.org/10.1029/1998JD100049, 1999.
Guenther, A., Hewitt, C. N., Erickson, D., Fall, R., Geron, C., Graedel, T., Harley, P., Klinger, L., Lerdau, M., Mckay, W. A., Pierce, T., Scholes, B., Steinbrecher, R., Tallamraju, R., Taylor, J., and Zimmerman, P.: A global model of natural volatile organic compound emission, J. Geophys. Res., 100, 8873–8892, https://doi.org/10.1029/94JD02950, 1995.
Hakola, H., Arey, J., Aschmann, S. M., and Atkinson, R.: Product formation from the gas-phase reactions of OH radicals and O3 with a series of monoterpenes, J. Atmos. Chem., 18, 75–102, https://doi.org/10.1007/BF00694375, 1994.
Hallquist, M., Wängberg, I., Ljungström, E., Barnes, I., and Becker, K. H.: Aerosol and product yields from NO3 radical-initiated oxidation of selected monoterpenes, Environ. Sci. Technol., 33, 553–559, https://doi.org/10.1021/es980292s, 1999.
Hatch, L. E., Luo, W., Pankow, J. F., Yokelson, R. J., Stockwell, C. E., and Barsanti, K. C.: Identification and quantification of gaseous organic compounds emitted from biomass burning using two-dimensional gas chromatography–time-of-flight mass spectrometry, Atmos. Chem. Phys., 15, 1865–1899, https://doi.org/10.5194/acp-15-1865-2015, 2015.
Hatch, L. E., Jen, C. N., Kreisberg, N. M., Selimovic, V., Yokelson, R. J., Stamatis, C., York, R. A., Foster, D., Stephens, S. L., Goldstein, A. H., and Barsanti, K. C.: Highly speciated measurements of terpenoids emitted from laboratory and mixed-conifer forest prescribed fires, Environ. Sci. Technol., 53, 9418–9428, https://doi.org/10.1021/acs.est.9b02612, 2019.
Hatfield, M. L. and Huff Hartz, K. E.: Secondary organic aerosol from biogenic volatile organic compound mixtures, Atmos. Environ., 45, 2211–2219, https://doi.org/10.1016/j.atmosenv.2011.01.065, 2011.
Hayward, S., Muncey, R. J., James, A. E., Halsall, C. J., and Hewitt, C. N.: Monoterpene emissions from soil in a Sitka spruce forest, Atmos. Environ., 35, 4081–4087, https://doi.org/10.1016/S1352-2310(01)00213-8, 2001.
Heaton, K. J., Dreyfus, M. A., Wang, S., and Johnston, M. v.: Oligomers in the early stage of biogenic secondary organic aerosol formation and growth, Environ. Sci. Technol., 41, 6129–6136, https://doi.org/10.1021/es070314n, 2007.
Jacobson, M. C., Hansson, H. C., Noone, K. J., and Charlson, R. J.: Organic atmospheric aerosols: Review and state of the science, Rev. Geophys., 38, 267–294, https://doi.org/10.1029/1998RG000045, 2000.
Jang, M. and Kamens, R. M.: Newly characterized products and composition of secondary aerosols from the reaction of α-pinene with ozone, Atmos. Environ., 33, 459–474, https://doi.org/10.1016/S1352-2310(98)00222-2, 1999.
Jokinen, T., Berndt, T., Makkonen, R., Kerminen, V.-M., Junninen, H., Paasonen, P., Stratmann, F., Herrmann, H., Guenther, A. B., Worsnop, D. R., Kulmala, M., Ehn, M., and Sipilä, M.: Production of extremely low volatile organic compounds from biogenic emissions: Measured yields and atmospheric implications, P. Natl. Acad. Sci. USA, 112, 7123–7128, https://doi.org/10.1073/pnas.1423977112, 2015.
Kanakidou, M., Seinfeld, J. H., Pandis, S. N., Barnes, I., Dentener, F. J., Facchini, M. C., Van Dingenen, R., Ervens, B., Nenes, A., Nielsen, C. J., Swietlicki, E., Putaud, J. P., Balkanski, Y., Fuzzi, S., Horth, J., Moortgat, G. K., Winterhalter, R., Myhre, C. E. L., Tsigaridis, K., Vignati, E., Stephanou, E. G., and Wilson, J.: Organic aerosol and global climate modelling: a review, Atmos. Chem. Phys., 5, 1053–1123, https://doi.org/10.5194/acp-5-1053-2005, 2005.
Kenseth, C. M., Huang, Y., Zhao, R., Dalleska, N. F., Hethcox, J. C., Stoltz, B. M., and Seinfeld, J. H.: Synergistic O3+OH oxidation pathway to extremely low-volatility dimers revealed in β-pinene secondary organic aerosol, P. Natl. Acad. Sci. USA, 115, 8301–8306, https://doi.org/10.1073/pnas.1804671115, 2018.
Kesselmeier, J. and Staudt, M.: Biogenic volatile organic compounds (VOC): An overview on emission, physiology and ecology, J. Atmos. Chem., 33, 23–88, https://doi.org/10.1023/A:1006127516791, 1999.
Kim, H. and Paulson, S. E.: Real refractive indices and volatility of secondary organic aerosol generated from photooxidation and ozonolysis of limonene, α-pinene and toluene, Atmos. Chem. Phys., 13, 7711–7723, https://doi.org/10.5194/acp-13-7711-2013, 2013.
Kim, S., Karl, T., Guenther, A., Tyndall, G., Orlando, J., Harley, P., Rasmussen, R., and Apel, E.: Emissions and ambient distributions of Biogenic Volatile Organic Compounds (BVOC) in a ponderosa pine ecosystem: interpretation of PTR-MS mass spectra, Atmos. Chem. Phys., 10, 1759–1771, https://doi.org/10.5194/acp-10-1759-2010, 2010.
Kourtchev, I., Fuller, S. J., Giorio, C., Healy, R. M., Wilson, E., O'Connor, I., Wenger, J. C., McLeod, M., Aalto, J., Ruuskanen, T. M., Maenhaut, W., Jones, R., Venables, D. S., Sodeau, J. R., Kulmala, M., and Kalberer, M.: Molecular composition of biogenic secondary organic aerosols using ultrahigh-resolution mass spectrometry: comparing laboratory and field studies, Atmos. Chem. Phys., 14, 2155–2167, https://doi.org/10.5194/acp-14-2155-2014, 2014.
Kourtchev, I., Doussin, J.-F., Giorio, C., Mahon, B., Wilson, E. M., Maurin, N., Pangui, E., Venables, D. S., Wenger, J. C., and Kalberer, M.: Molecular composition of fresh and aged secondary organic aerosol from a mixture of biogenic volatile compounds: a high-resolution mass spectrometry study, Atmos. Chem. Phys., 15, 5683–5695, https://doi.org/10.5194/acp-15-5683-2015, 2015.
Kundu, S., Fisseha, R., Putman, A. L., Rahn, T. A., and Mazzoleni, L. R.: High molecular weight SOA formation during limonene ozonolysis: insights from ultrahigh-resolution FT-ICR mass spectrometry characterization, Atmos. Chem. Phys., 12, 5523–5536, https://doi.org/10.5194/acp-12-5523-2012, 2012.
La, Y. S., Camredon, M., Ziemann, P. J., Valorso, R., Matsunaga, A., Lannuque, V., Lee-Taylor, J., Hodzic, A., Madronich, S., and Aumont, B.: Impact of chamber wall loss of gaseous organic compounds on secondary organic aerosol formation: explicit modeling of SOA formation from alkane and alkene oxidation, Atmos. Chem. Phys., 16, 1417–1431, https://doi.org/10.5194/acp-16-1417-2016, 2016.
Lambe, A. T., Chhabra, P. S., Onasch, T. B., Brune, W. H., Hunter, J. F., Kroll, J. H., Cummings, M. J., Brogan, J. F., Parmar, Y., Worsnop, D. R., Kolb, C. E., and Davidovits, P.: Effect of oxidant concentration, exposure time, and seed particles on secondary organic aerosol chemical composition and yield, Atmos. Chem. Phys., 15, 3063–3075, https://doi.org/10.5194/acp-15-3063-2015, 2015.
Larsen, B. R., di Bella, D., Glasius, M., Winterhalter, R., Jensen, N. R., and Hjorth, J.: Gas-phase OH oxidation of monoterpenes: Gaseous and particulate products, J. Atmos. Chem., 38, 231–276, https://doi.org/10.1023/A:1006487530903, 2001.
Lee, A., Goldstein, A. H., Keywood, M. D., Gao, S., Varutbangkul, V., Bahreini, R., Ng, N. L., Flagan, R. C., and Seinfeld, J. H.: Gas-phase products and secondary aerosol yields from the ozonolysis of ten different terpenes, J. Geophys. Res.-Atmos., 111, D07302. https://doi.org/10.1029/2005JD006437, 2006a.
Lee, A., Goldstein, A. H., Kroll, J. H., Ng, N. L., Varutbangkul, V., Flagan, R. C., and Seinfeld, J. H.: Gas-phase products and secondary aerosol yields from the photooxidation of 16 different terpenes, J. Geophys. Res.-Atmos., 111, D17305, https://doi.org/10.1029/2006JD007050, 2006b.
Ludley, Katherine. E., Jickells, S. M., Chamberlain, P. M., Whitaker, J., and Robinson, C. H.: Distribution of monoterpenes between organic resources in upper soil horizons under monocultures of Picea abies, Picea sitchensis and Pinus Sylvestris, Soil Biol. Biochem., 41, 1050–1059, https://doi.org/10.1016/J.SOILBIO.2009.02.002, 2009.
Maleknia, S. D., Bell, T. L., and Adams, M. A.: PTR-MS analysis of reference and plant-emitted volatile organic compounds, Int. J. Mass Spectrom., 262, 203–210, https://doi.org/10.1016/j.ijms.2006.11.010, 2007.
McVay, R. C., Zhang, X., Aumont, B., Valorso, R., Camredon, M., La, Y. S., Wennberg, P. O., and Seinfeld, J. H.: SOA formation from the photooxidation of α-pinene: systematic exploration of the simulation of chamber data, Atmos. Chem. Phys., 16, 2785–2802, https://doi.org/10.5194/acp-16-2785-2016, 2016.
Nah, T., McVay, R. C., Zhang, X., Boyd, C. M., Seinfeld, J. H., and Ng, N. L.: Influence of seed aerosol surface area and oxidation rate on vapor wall deposition and SOA mass yields: a case study with α-pinene ozonolysis, Atmos. Chem. Phys., 16, 9361–9379, https://doi.org/10.5194/acp-16-9361-2016, 2016.
Nannoolal, Y., Rarey, J., and Ramjugernath, D.: Estimation of pure component properties part 3. Estimation of the vapor pressure of non-electrolyte organic compounds via group contribution and group interactions, Fluid Phase Equilibr., 269, 117–133, https://doi.org/10.1016/j.fluid.2008.04.020, 2008.
Ng, N. L., Chhabra, P. S., Chan, A. W. H., Surratt, J. D., Kroll, J. H., Kwan, A. J., McCabe, D. C., Wennberg, P. O., Sorooshian, A., Murphy, S. M., Dalleska, N. F., Flagan, R. C., and Seinfeld, J. H.: Effect of NOx level on secondary organic aerosol (SOA) formation from the photooxidation of terpenes, Atmos. Chem. Phys., 7, 5159–5174, https://doi.org/10.5194/acp-7-5159-2007, 2007.
Odum Jay, R., Hoffmann, T., Bowman, F., Collins, D., Flagan Richard, C., and Seinfeld John, H.: Gas particle partitioning and secondary organic aerosol yields, Environ. Sci. Technol., 30, 2580–2585, https://doi.org/10.1021/es950943+, 1996.
Pankow, J. F.: An absorption model of gas/particle partitioning of organic compounds in the atmosphere, Atmos. Environ., 28, 185–188, https://doi.org/10.1016/1352-2310(94)90093-0, 1994.
Pathak, R. K., Presto, A. A., Lane, T. E., Stanier, C. O., Donahue, N. M., and Pandis, S. N.: Ozonolysis of α-pinene: parameterization of secondary organic aerosol mass fraction, Atmos. Chem. Phys., 7, 3811–3821, https://doi.org/10.5194/acp-7-3811-2007, 2007a.
Pathak, R. K., Stanier, C. O., Donahue, N. M., and Pandis, S. N.: Ozonolysis of α-pinene at atmospherically relevant concentrations: Temperature dependence of aerosol mass fractions (yields), J. Geophys. Res.-Atmos., 112, 1–8, https://doi.org/10.1029/2006JD007436, 2007b.
Peeters, J., Vereecken, L., and Fantechi, G.: The detailed mechanism of the OH-initiated atmospheric oxidation of α-pinene: A theoretical study, Phys. Chem. Chem. Phys., 3, 5489–5504, https://doi.org/10.1039/b106555f, 2001.
Pfaffenberger, L., Barmet, P., Slowik, J. G., Praplan, A. P., Dommen, J., Prévôt, A. S. H., and Baltensperger, U.: The link between organic aerosol mass loading and degree of oxygenation: an α-pinene photooxidation study, Atmos. Chem. Phys., 13, 6493–6506, https://doi.org/10.5194/acp-13-6493-2013, 2013.
Presto, A. A. and Donahue, N. M.: Investigation of α-pinene + ozone secondary organic aerosol formation at low total aerosol mass, Environ. Sci. Technol., 40, 3536–3543, https://doi.org/10.1021/es052203z, 2006.
Presto, A. A., Huff Hartz, K. E., and Donahue, N. M.: Secondary organic aerosol production from terpene ozonolysis. 2. Effect of NOx concentration, Environ. Sci. Technol., 39, 7046–7054, https://doi.org/10.1021/es050400s, 2005.
Reinhardt, A., Emmenegger, C., Gerrits, B., Panse, C., Dommen, J., Baltensperger, U., Zenobi, R., and Kalberer, M.: Ultrahigh mass resolution and accurate mass measurements as a tool to characterize oligomers in secondary organic aerosols, Anal. Chem., 79, 4074–4082, https://doi.org/10.1021/ac062425v, 2007.
Reissell, A., Harry, C., Aschmann, S. M., Atkinson, R., and Arey, J.: Formation of acetone from the OH radical- and O3-initiated reactions of a series of monoterpenes, J. Geophys. Res.-Atmos., 104, 13869–13879, https://doi.org/10.1029/1999JD900198, 1999.
Rinne, J., Tuovinen, J. P., Laurila, T., Hakola, H., Aurela, M., and Hypén, H.: Measurements of hydrocarbon fluxes by a gradient method above a northern boreal forest, Agr. Forest Meteorol., 102, 25–37, https://doi.org/10.1016/S0168-1923(00)00088-5, 2000.
Saha, P. K. and Grieshop, A. P.: Exploring divergent volatility properties from yield and thermodenuder measurements of secondary organic aerosol from α-pinene ozonolysis, Environ. Sci. Technol., 50, 5740–5749, https://doi.org/10.1021/acs.est.6b00303, 2016.
Shilling, J. E., Chen, Q., King, S. M., Rosenoern, T., Kroll, J. H., Worsnop, D. R., DeCarlo, P. F., Aiken, A. C., Sueper, D., Jimenez, J. L., and Martin, S. T.: Loading-dependent elemental composition of α-pinene SOA particles, Atmos. Chem. Phys., 9, 771–782, https://doi.org/10.5194/acp-9-771-2009, 2009.
Simpson, I. J., Akagi, S. K., Barletta, B., Blake, N. J., Choi, Y., Diskin, G. S., Fried, A., Fuelberg, H. E., Meinardi, S., Rowland, F. S., Vay, S. A., Weinheimer, A. J., Wennberg, P. O., Wiebring, P., Wisthaler, A., Yang, M., Yokelson, R. J., and Blake, D. R.: Boreal forest fire emissions in fresh Canadian smoke plumes: C1−C10 volatile organic compounds (VOCs), CO2, CO, NO2, NO, HCN and CH3CN, Atmos. Chem. Phys., 11, 6445–6463, https://doi.org/10.5194/acp-11-6445-2011, 2011.
Steinbrecher, R., Hauff, K., Rössler, J., Dürr, M., and Seufert, G.: Monoterpene emission from soils in orange plantations of the Valencian Citrus belt, Spain, Phys. Chem. Earth Pt. B, 24, 695–698, https://doi.org/10.1016/S1464-1909(99)00067-2, 1999.
Stockwell, W. R., Kirchner, F., Kuhn, M., and Seefeld, S.: A new mechanism for regional atmospheric chemistry modeling, J. Geophys. Res.-Atmos., 102, 25847–25879, https://doi.org/10.1029/97jd00849, 1997.
Tani, A., Hayward, S., and Hewitt, C. N.: Measurement of monoterpenes and related compounds by proton transfer reaction-mass spectrometry (PTR-MS), Int. J. Mass Spectrom., 223–224, 561–578, https://doi.org/10.1016/S1387-3806(02)00880-1, 2003.
Valorso, R., Aumont, B., Camredon, M., Raventos-Duran, T., Mouchel-Vallon, C., Ng, N. L., Seinfeld, J. H., Lee-Taylor, J., and Madronich, S.: Explicit modelling of SOA formation from α-pinene photooxidation: sensitivity to vapour pressure estimation, Atmos. Chem. Phys., 11, 6895–6910, https://doi.org/10.5194/acp-11-6895-2011, 2011.
Vereecken, L. and Nozière, B.: H migration in peroxy radicals under atmospheric conditions, Atmos. Chem. Phys., 20, 7429–7458, https://doi.org/10.5194/acp-20-7429-2020, 2020.
Walser, M. L., Desyaterik, Y., Laskin, J., Laskin, A., and Nizkorodov, S. A.: High-resolution mass spectrometric analysis of secondary organic aerosol produced by ozonation of limonene, Phys. Chem. Chem. Phys., 10, 1009–1022, https://doi.org/10.1039/b712620d, 2008.
White, M. L., Russo, R. S., Zhou, Y., Mao, H., Varner, R. K., Ambrose, J., Veres, P., Wingenter, O. W., Haase, K., Stutz, J., Talbot, R., and Sive, B. C.: Volatile organic compounds in northern New England marine and continental environments during the ICARTT 2004 campaign, J. Geophys. Res.-Atmos., 113, 1–16, https://doi.org/10.1029/2007JD009161, 2008.
Wisthaler, A., Jensen, N. R., Winterhalter, R., Lindinger, W., and Hjorth, J.: Measurements of acetone and other gas phase product yields from the OH-initiated oxidation of terpenes by proton-transfer-reaction mass spectrometry (PTR-MS), Atmos. Environ., 35, 6181–6191, https://doi.org/10.1016/S1352-2310(01)00385-5, 2001.
Yáñez-Serrano, A. M., Nölscher, A. C., Bourtsoukidis, E., Gomes Alves, E., Ganzeveld, L., Bonn, B., Wolff, S., Sa, M., Yamasoe, M., Williams, J., Andreae, M. O., and Kesselmeier, J.: Monoterpene chemical speciation in a tropical rainforest:variation with season, height, and time of dayat the Amazon Tall Tower Observatory (ATTO), Atmos. Chem. Phys., 18, 3403–3418, https://doi.org/10.5194/acp-18-3403-2018, 2018.
Yassaa, N., Peeken, I., Zllner, E., Bluhm, K., Arnold, S., Spracklen, D., and Williams, J.: Evidence for marine production of monoterpenes, Environ. Chem., 5, 391–401, https://doi.org/10.1071/EN08047, 2008.
Yu, J., Cocker III, D. R., Griffin, R. J., Flagan, R. C., and Seinfeld, J. H.: Gas-Phase Ozone Oxidation of Monoterpenes: Gaseous and Particulate Products, J. Atmos. Chem., 34, 207–258, https://doi.org/10.1023/A:1006254930583, 1999.
Zhang, J., Huff Hartz, K. E., Pandis, S. N., and Donahue, N. M.: Secondary organic aerosol formation from limonene Ozonolysis: Homogeneous and heterogeneous influences as a function of NOx, J. Phys. Chem. A., 110, 11053–11063, https://doi.org/10.1021/jp062836f, 2006.
Zhang, X, McVay, R. C., Huang, D. D., Dalleska, N. F., Aumont, B., Flagan, R. C., and Seinfeld, J. H.: Formation and evolution of molecular products in alpha-pinene secondary organic aerosol, P. Natl. Acad. Sci. USA, 112, 14168–14173, https://doi.org/10.1073/pnas.1517742112, 2015.
Zhao, D., Schmitt, S. H., Wang, M., Acir, I.-H., Tillmann, R., Tan, Z., Novelli, A., Fuchs, H., Pullinen, I., Wegener, R., Rohrer, F., Wildt, J., Kiendler-Scharr, A., Wahner, A., and Mentel, T. F.: Effects of NOx and SO2 on the secondary organic aerosol formation from photooxidation of α-pinene and limonene, Atmos. Chem. Phys., 18, 1611–1628, https://doi.org/10.5194/acp-18-1611-2018, 2018.
Ziemann, P. J. and Atkinson, R.: Kinetics, products, and mechanisms of secondary organic aerosol formation, Chem. Soc. Rev., 41, 6582, https://doi.org/10.1039/c2cs35122f, 2012.