the Creative Commons Attribution 4.0 License.
the Creative Commons Attribution 4.0 License.
 | 30 Jul 2021
Better representation of dust can improve climate models with too weak an African monsoon
Yves Balkanski
Rémy Bonnet
Olivier Boucher
Ramiro Checa-Garcia
Jérôme Servonnat
The amount of short wave radiation absorbed by dust has remained uncertain. We have developed a more accurate representation of dust absorption that is based on the observed dust mineralogical composition and accounts for very large particles. We analyze the results from two fully coupled climate simulations of 100 years in terms of their simulated precipitation patterns against observations. A striking benefit of the new dust optical and physical properties is that tropical precipitation over the Sahel, tropical North Atlantic and West Indian Ocean are significantly improved compared to observations, without degrading precipitations elsewhere. This alleviates a common persistent bias in Earth system models that exhibit a summer African monsoon that does not reach far enough north. We show that the improvements documented here for the IPSL-CM61 climate model result from both a thermodynamical and dynamical response to dust absorption, which is unrelated to natural variability. Aerosol absorption induces more water vapor advection from the ocean to the Sahel region, thereby providing an added supply of moisture available for precipitation. This work, thus, provides a path towards improving precipitation patterns in these regions by accounting for both physical and optical properties of the aerosol more realistically.
- Article
(6035 KB) - Full-text XML
-
Supplement
(629 KB) - BibTeX
- EndNote


Mineral dust influences precipitation through aerosol–radiation interactions (Miller et al., 2014), changing the vertical temperature profile, and is an efficient ice nucleus in the presence of feldspar (Atkinson et al., 2013), therefore also producing an indirect, cloud-mediated radiative perturbation. It also influences the water cycle through microphysical interactions with clouds (Nenes et al., 2014). The energy absorbed by mineral dust in the atmospheric column is defined as the difference between top-of-atmosphere and surface radiative effects. In source regions, it represents several tens of watts per square meter (W m−2) and, hence, is stronger than the anthropogenic aerosol–cloud interactions (Miller et al., 2014; Nenes et al., 2014). The Sahel precipitation is influenced by the energy absorbed by aerosols (Miller et al., 2004; Solmon et al., 2008; Yoshioka et al., 2007), and the dust absorption of energy depends on iron oxides (hematite and goethite) that are part of dust mineralogical composition (Sokolik and Toon, 1996; Claquin et al., 1999). Over the last 15 years, simulating tropical precipitation has been notoriously difficult for climate models (Fiedler et al., 2020). Improving the representation of tropical monsoons is a prerequisite for predicting future changes in tropical precipitation and attributing them to observed changes in greenhouse gases and to aerosol changes. We show here how a better representation of dust aerosols leads to an unequivocal improvement in the simulation of precipitation over key climatic tropical regions in the IPSL-CM6 model, namely in the Sahel, tropical North Atlantic and West Indian Ocean, without degrading precipitation elsewhere around the globe, and we subsequently discuss the thermodynamically and dynamically driven mechanisms at play that affect the water cycle.
Miller et al. (2014) showed that the increase in the Sahel precipitation in response to high dust absorption is a fairly robust result across models. The intensity and the seasonal pattern of tropical precipitation are controlled by the northward cross-equatorial transport of energy (e.g., Hwang and Frierson, 2013). Clouds and the Earth's Radiant Energy System (CERES) observations of the Earth's energy budget indicate a net northward cross-equatorial transport of energy. The atmospheric component of this cross-equatorial transport is southward, whereas the oceanic component is northward (see Fig. 4 in Stephens et al., 2016). Haywood et al. (2016) discussed how, in the UK Met Office HadGEM2 model, tropical precipitation biases could be reduced by setting the northern and southern hemispheric albedos to be equal, in agreement with multidecadal satellite observations. Hemispheric albedo changes thus strongly influence tropical precipitations. The link between hemispheric albedo, aerosol loadings and properties in general, and dust atmospheric absorption in particular, remains, however, poorly understood.
The abundance and variation in iron oxides, as well as the presence of large particles, are known to control dust absorption (Balkanski et al., 2007; Miller et al., 2004; Ryder et al., 2018; Yoshioka et al., 2007). Although iron oxides in dust are present in minute quantities from 1 % to 5 % by volume (Di Biagio et al., 2019; Journet et al., 2014; Kandler et al., 2007; Liu et al., 2018; Nickovic et al., 2012; Perlwitz et al., 2015; Reid, 2003), this relatively small volume largely influences mineral dust absorption (Balkanski et al., 2007; Ryder et al., 2018; Di Biagio et al., 2019). Large dust particles, with diameters ranging between 10 and 100 µm, are rarely accounted for in climate models (Checa-Garcia et al., 2021). Recent measurements have shown a much stronger absorption from these large particles than from smaller ones (Ryder et al., 2013, 2018). Due to the abundance of these large particles over source regions, the atmospheric energy balance will be altered. Furthermore, the Sahel is one of the world's regions with the highest iron oxide content in soils (Journet et al., 2014; Nickovic et al., 2012). In this study, we analyze the strong relationship between high iron oxide content and increased precipitation in the Sahel. Here we discuss the role played by dust on tropical precipitation and describe an end-to-end physical mechanism that ties the improvement in tropical precipitation to observational support for a higher level of dust absorption based on measurements of iron oxide in dust particles, measurements of the full dust particle size distribution and detailed climate simulations with interactive dust.
2.1 IPSL-CM6 description
The climate model used here is the low-resolution model from the Institut Pierre-Simon Laplace Climate Modeling Center described by Boucher et al. (2020). The horizontal resolution is 2.5∘ in longitude and 1.28∘ in latitude, with a discretization of the vertical into 79 layers that extends to about 80 km. For the ocean model, Nucleus for European Modeling of the Ocean (NEMO), that includes sea ice and biogeochemistry, the horizontal resolution is 1∘, and the model is discretized using 75 vertical levels. The aerosols are run interactively in the simulations presented here.
2.2 Dust modeling
Dust emission fluxes are calculated in two steps. In a first step, we derive the horizontal flux of dust that is mobilized based upon the following three criteria: a threshold velocity that depends on the nature of the upper soil, the wind speed at 10 m and an erodibility factor that takes into account the effect of soil moisture. These erodibility factors were tuned following the procedure described in Balkanski et al. (2004). Total emissions and loads compare well with the constraints given by Ridley et al. (2016) and Kok et al. (2017). The dust particle size distribution is emitted with a constant shape following the brittle theory described by Kok (2011). The size distribution is represented by one or four modes, where each one is represented with a lognormal distribution consisting of a mass median diameter which varies in response to the sink processes that affect the dust cycle. When using one mode for the simulation, this mode is centered at 2.5 µm, with a width of 2.0, and represents both the accumulation and coarse modes (Schulz et al., 1998; Denjean et al., 2016). The size distribution of the four modes allows one to account for large particles up to 100 µm (Di Biagio et al., 2020). These four modes have mass median diameters of 1.0, 2.5, 7.0 and 22.0 µm, respectively, and are fitted to the size distribution predicted by the brittle theory for particles of diameter below 20 µm and to observations made during the campaigns of Fennec and AER-D (Ryder et al., 2013, 2018) for diameters above 20 µm, as described in Di Biagio et al. (2020).
Dust absorption is influenced mainly by the iron oxide embedded in the dust aggregates (Lafon et al., 2006; Ryder et al., 2018; Di Biagio et al., 2019). Measurements of iron oxides on soils from around the world have been reported for two particle size classes, i.e., the clays with diameters of less than 2 µm and the silts with diameters between 2 and 64 µm. The iron oxide varies drastically, depending on the soil types, and most measurements indicate a weight content of 1 % to 7 % equivalent to 0.5 % to 3.5 % (Lafon et al., 2006; Di Biagio et al., 2019; Moosmüller et al., 2012; Engelbrecht et al., 2016; Journet et al., 2014) by volume. To determine the amount of iron oxide over the Sahel, we used the high-resolution database published by Nickovic et al. (2012) and determined the amount of hematite over the Sahel region (16∘ W–36∘ E; 10–20∘ N), as shown in Fig. 1. With the 30 s arc grid high-resolution of the database (GMINER30; http://www.seevccc.rs/GMINER30/, last access: 28 July 2021), the mineral content of hematite could be retrieved for 6 026 016 points. For the clay fraction (diameter ≤ 2 µm), 50 % of these points had a hematite content of more than 2 % by weight (equivalent to 1 % by volume since the density of hematite is twice that of all other minerals, except goethite), and 30 % (respectively 17 %) of the points had an hematite content of more than 3 % (respectively 4 %) by weight. For the silt fraction (diameter > 2 µm), 49 % of these points had a goethite content of more than 2 % by weight (equivalent to 1 % by volume since density of hematite is twice that of all other minerals, except goethite), and 30 % (respectively 12 %) of the points had an hematite content of more than 4 % (respectively 5 %) by weight. Assuming that hematite and goethite contents are the same for these soils, and accounting for the density of hematite (5300 kg m−3) and goethite (3800 kg m−3), we estimate that iron oxides (hematite + goethite) represent 5.3 % of the weight and 3.0 % of the volume of mineral dust that has a density of 2650 kg m−3. Hence, in the simulation, we took the optical properties of mineral dust with a volume of 3.0 % made of iron oxides.
The absorption of dust size distribution is determined as follows: we consider dust as being the mixture of six minerals, namely kaolinite (kaol), illite (illi), montmorillonite (montmo), quartz (qua), calcite (calci) and hematite (hema). The difference in optical properties between goethite and hematite are not considered in this study, as we focus on the mechanisms by which dust absorption causes an increase in precipitation over the Sahel and not on having a very precise estimate of this absorption. We keep a constant volume content of hematite of 3.0 % as being representative of the Sahel region. The first step in the computation is computing the refractive index of each of the above-cited minerals with hematite; for example, for 3 % hematite, all mixtures are composed of 97 %–3 %. Using the Maxwell–Garnett mixing rule (Chylek et al., 1988), we compute the equivalent refractive index (me) of a particle that consists of the assembly of two minerals, and it is computed in the following way:
where m0 is the refractive index of mineral around the inclusion, mA is the refractive index of the inclusion in the internal mixture, and vA is the volume fraction of inclusion of the particle.
The second step is to compute the refractive index, starting first with the most abundant constituents of these clay mixtures, i.e., illi-hema and kaol-hema. The third step takes the resultant illi-kaol-hema mixture and mixes it with montmo. The resulting illi-kaol-montmo-hema mixture is then mixed with qua. And, finally, the illi-kaol-montmo-qua mixture is mixed with calci, the least abundant of those minerals. We refer the reader to Table 1 of Balkanski et al. (2007), which explains the abundance of the different assemblages and minerals.
Table 1Dust global radiative perturbation in the different model simulations. The atmospheric radiative perturbations (corresponding to atmospheric absorption) are indicated in bold.
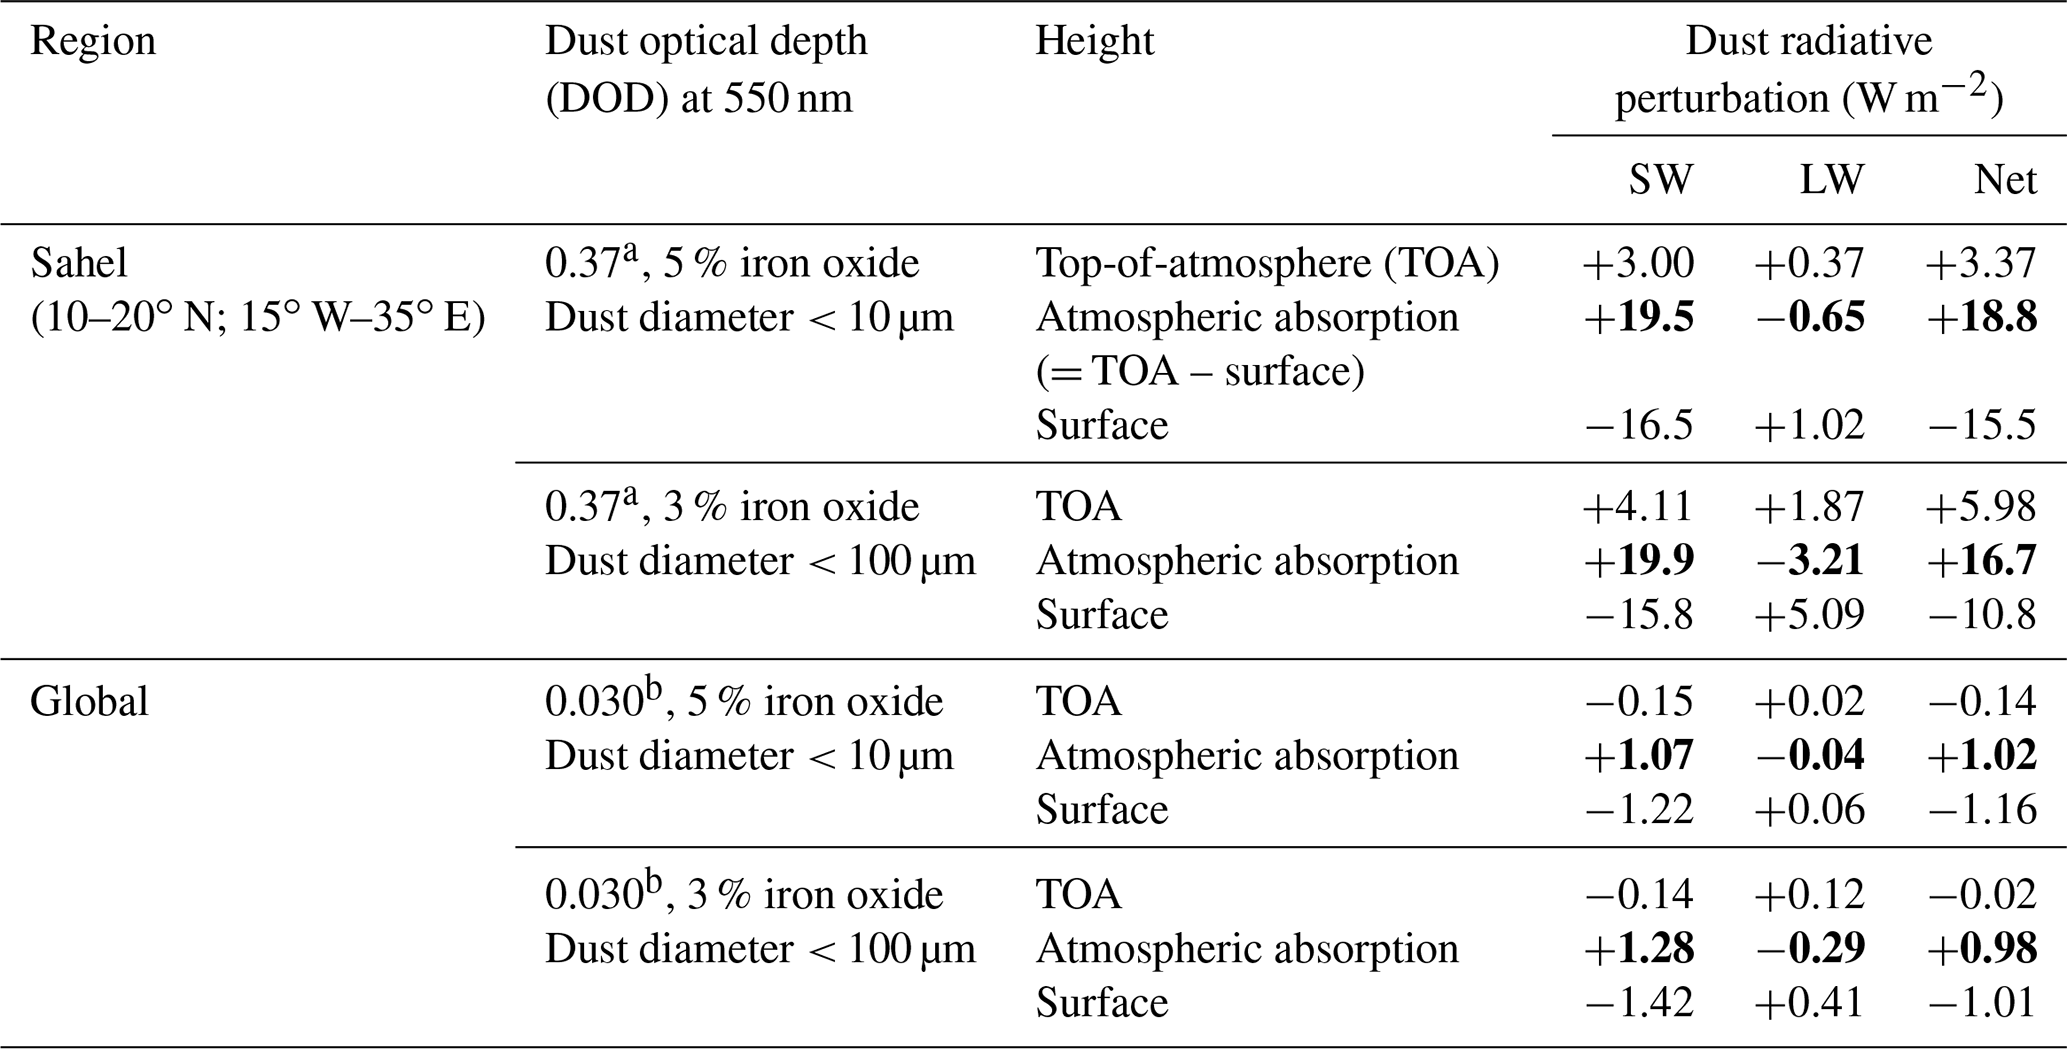
a Sahel dust optical depth at 550 nm was scaled to 0.37 to match the Moderate Resolution Imaging Spectroradiometer (MODIS) June–September (JJAS) mean from 2000 to 2014 (from both on land and Deep Blue products). b Global dust optical depth at 550 nm was scaled to 0.030, according to observational constraints described in Kok et al. (2017).
We ran a 100-year simulation of the fully coupled IPSL-CM6 model with all the interactive components of the aerosol, including dust for the 1915–2014 period, and another 100-year simulation without the dust. We analyzed the last 30 years of the coupled simulations (1985–2014) for the period when precipitation is most abundant over the Sahel from June to September (JJAS in the rest of the text). We checked, for all variables, the consistency of the results compared to the previous 30-year period from 1955 to 1984. We compare the short wave (SW) and long wave (LW) radiative effects of two simulations that have the same absorption, i.e., four modes (including large particles; 10 µm < D < 100 µm) with 3 % iron oxides to the simulation with one mode (without large particles; 10 µm < D < 100 µm). The results are shown in Table 1. We ran, for the full 100-year period, only the simulation with one mode and 5 % iron oxide content equivalent to the full size distribution (four modes and 3 % iron oxide).
In order to compute the direct radiative perturbation (DRP) from dust, we compare the fluxes both at the top-of-atmosphere and at the surface for the simulation with the dust aerosol and the case when dust aerosol concentrations are set to zero in the model. The refractive indices are described for the short wave in the work of Di Biagio et al. (2019) and Balkanski et al. (2007) and for the longwave in Di Biagio et al. (2020). The radiative transfer module includes a six-band (0.185–4.0 µm) scheme in the SW (improved from the parameterization of Fouquart and Bonnel, 1980) and the rapid radiative transfer model with 16 bands between 3.33 and 1,000 µm (Hogan and Bozzo, 2018). The model accounts for the diurnal cycle of solar radiation and allows fractional cloudiness to form in a grid box. The reflectivity and transmissivity of a layer are computed using the δ-Eddington approximation (Joseph et al., 1976), in the case of a maximum random overlap (Morcrette and Fouquart, 1986), by averaging the clear and cloudy sky fluxes weighted linearly by their respective fractions in the layer. The radiative fluxes are computed every 90 min, with and without the presence of clouds and with and without the presence of aerosols; they are sampled at the top-of-atmosphere and at the surface. The clear-sky and all-sky aerosol radiative effects can then be estimated as the differences in radiative fluxes with and without mineral dust.
2.3 Deriving the water budget along the Sahel region (10–20∘ N; 15∘ W–35∘ E)
Following Sheen et al. (2017), we attempt to determine the total flux of moisture depth across each of the airshed boundaries. Hence, we compute the integrated moisture flux through the following integral:
where ρw is the density of water, g is the acceleration due to gravity, ps is the surface pressure, and represents the monthly mean of the product of the water content with the wind speed. The fluxes are expressed in unit of kilograms per meter per second (kg m−1 s−1). The integrated fluxes across each side of the airshed are first averaged, scaled by the length along the flux trajectory (Trenberth, 1999), and then divided by the airshed area to obtain quantities in units of millimeters per day that can be compared to the precipitation and the evaporation fluxes over the airshed.
We first present how dust absorption is calculated and then present the results from a fully coupled climate simulation of 100 years (from which we analyze the last 30 years) and compare the simulated precipitation with observations. Iron oxide content is based on the observations of the dust mineralogical composition over the Sahel region (Lafon et al., 2006; Di Biagio et al., 2019) and is displayed for soils in Fig. 1. We infer the refractive index of the mineral dust using an optical model. Figure 2 illustrates the influence of the iron oxide content and the size of a particle on its radiative absorption. In this figure, the aerosol absorption increases along the x axis, with the aerosol co-single scattering albedo (coSSA) calculated at 550 nm and defined as follows:
The solid blue line illustrates the absorption calculated when dust particles with diameter less than 10 µm are considered. The shift from the solid blue to the solid orange line indicates the increase in dust absorption when particles with a diameter larger than 10 µm are accounted for. This graph also indicates that particles with a diameter of less than 10 µm, with an iron oxide content of 5.0 %, absorb the same amount of radiation than particles with 3.0 % iron oxide, for which we also consider the diameters greater than 10 µm (see Table 1). With this mineralogical composition, we obtain a coSSA of 0.09. For dust particles with an iron oxide volume content of 1.5 %, thought to be the global median value, as discussed in Balkanski et al. (2007), the coSSA is 0.032, and it almost doubles to 0.058 when large particles are also considered. Hence, the substantial increase in aerosol absorption caused by large particles will be particularly marked over dust source regions. This has yet to be taken into account in many models that generally do not include particles sizes above 10 µm.
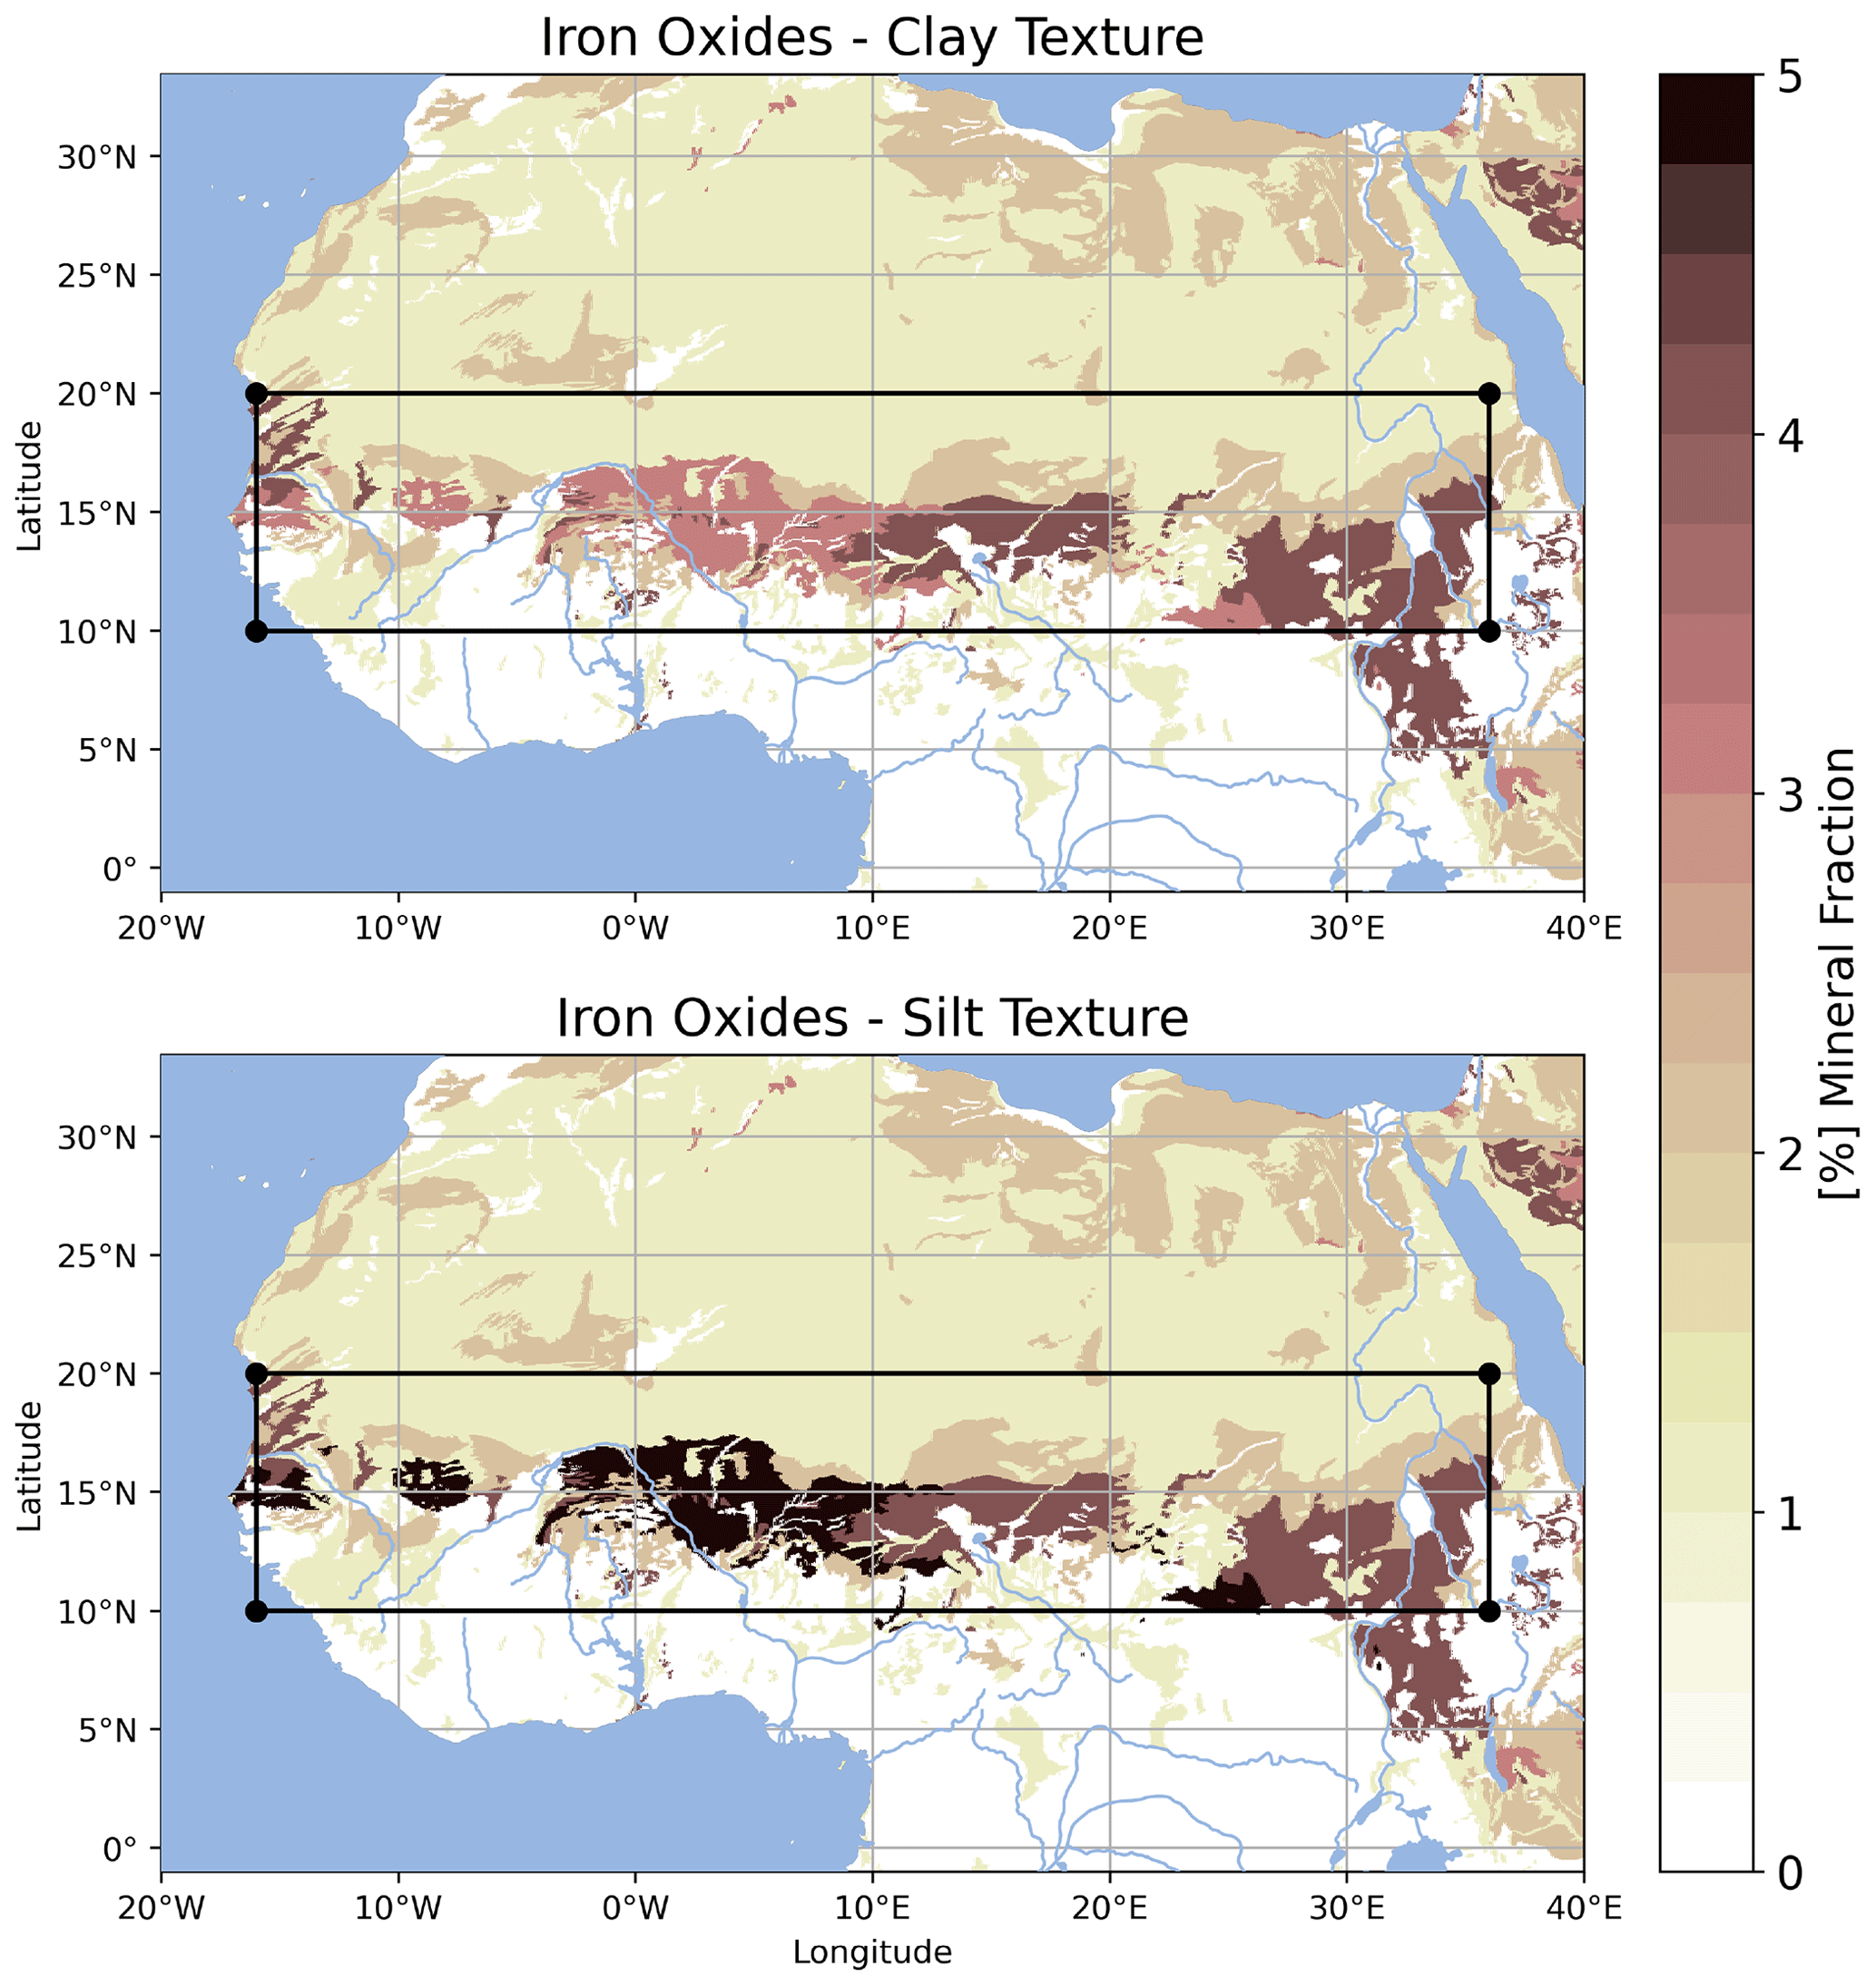
Figure 1Iron oxide content (by mass) in the clay and silt fractions of soils over central and northern Africa (from Nickovic et al., 2012).
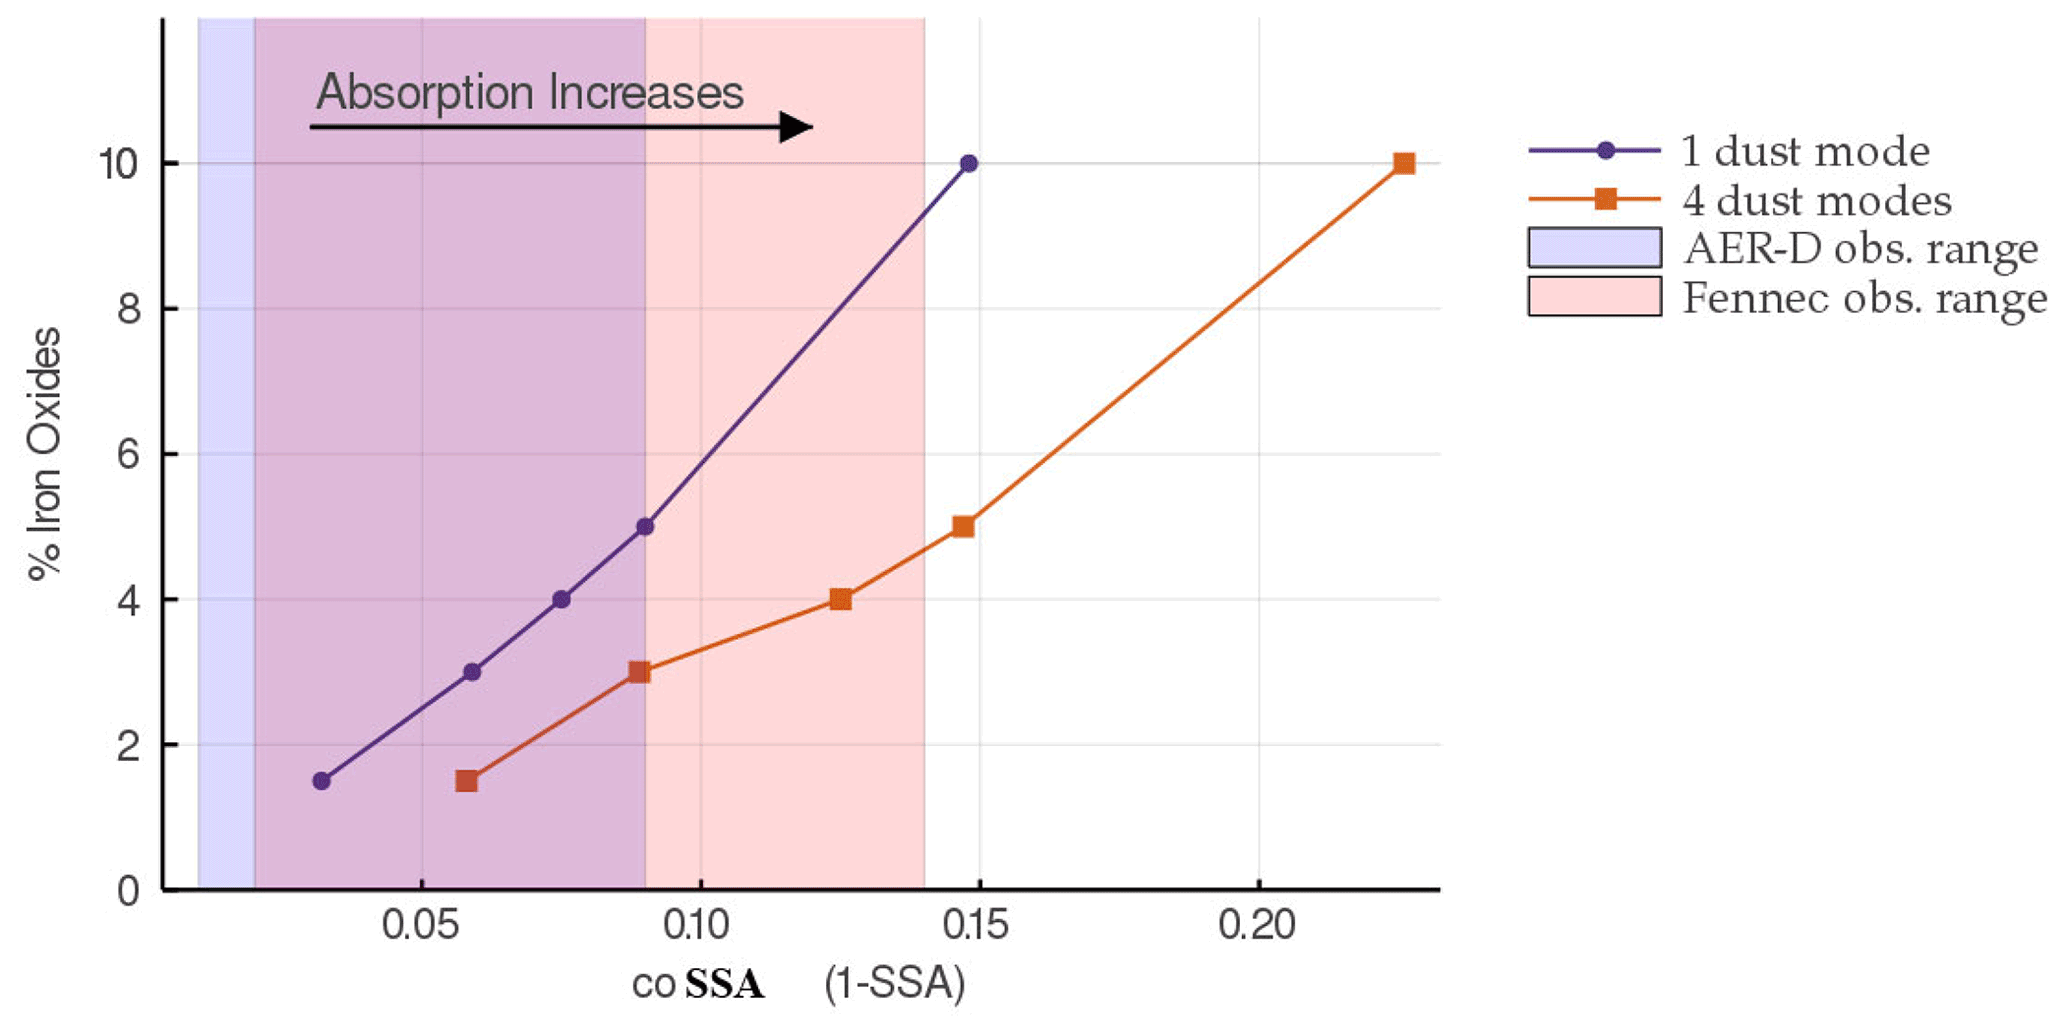
Figure 2Relationship between the aerosol absorption (co-single scattering albedo at 550 nm), presented on the x axis, and the volume fraction of iron oxide present in dust. The solid blue line is for dust particles with diameters of less than 10 µm. The shift from the blue to the orange line shows the increase in dust absorption when the assumed size distribution is taken from observations made during the Fennec campaign by Ryder et al. (2013), as shown in Fig.1 of Di Biagio et al. (2020). The optical model used is described in Sect. 2. The ranges of absorptions measured during the AER-D campaign (Ryder et al., 2018) over the Sahara and the near Atlantic are indicated by the blue shading (coSSA at 550 nm; ranging from 0.01 to 0.09), and the range measured during the Fennec campaign (Ryder et al., 2013) is indicated with the red shading (coSSA at 550 nm; ranging from 0.02 to 0.1.
We now discuss the changes in the aerosol direct radiative effect for dust containing 3.0 % iron oxide, which corresponds to the amount of iron oxide measured over the Sahel (Fig. 1). Figure 3 illustrates the JJAS mean radiative perturbation due to the presence of dust. Over the bright surfaces of the Sahel region, the top-of-atmosphere (TOA) short wave radiative perturbation is positive, i.e., an atmosphere with dust is less reflective than an atmosphere without dust. At the surface, the radiative effect from dust is strongly negative (−16 W m−2 over the Sahel), as the dominant term is the reduction in short wave radiation either due to backscatter or the absorption of radiation by dust. The difference between the TOA and surface determines the JJAS dust mean atmospheric absorption due to dust, which is estimated to be +17 W m−2 over the Sahel). Since dust is highly variable in time, this average value is consistent with values of several hundred watts per square meter simulated or inferred from surface-based measurements during particularly strong dust episodes (Pérez et al., 2006; Milton et al., 2008).
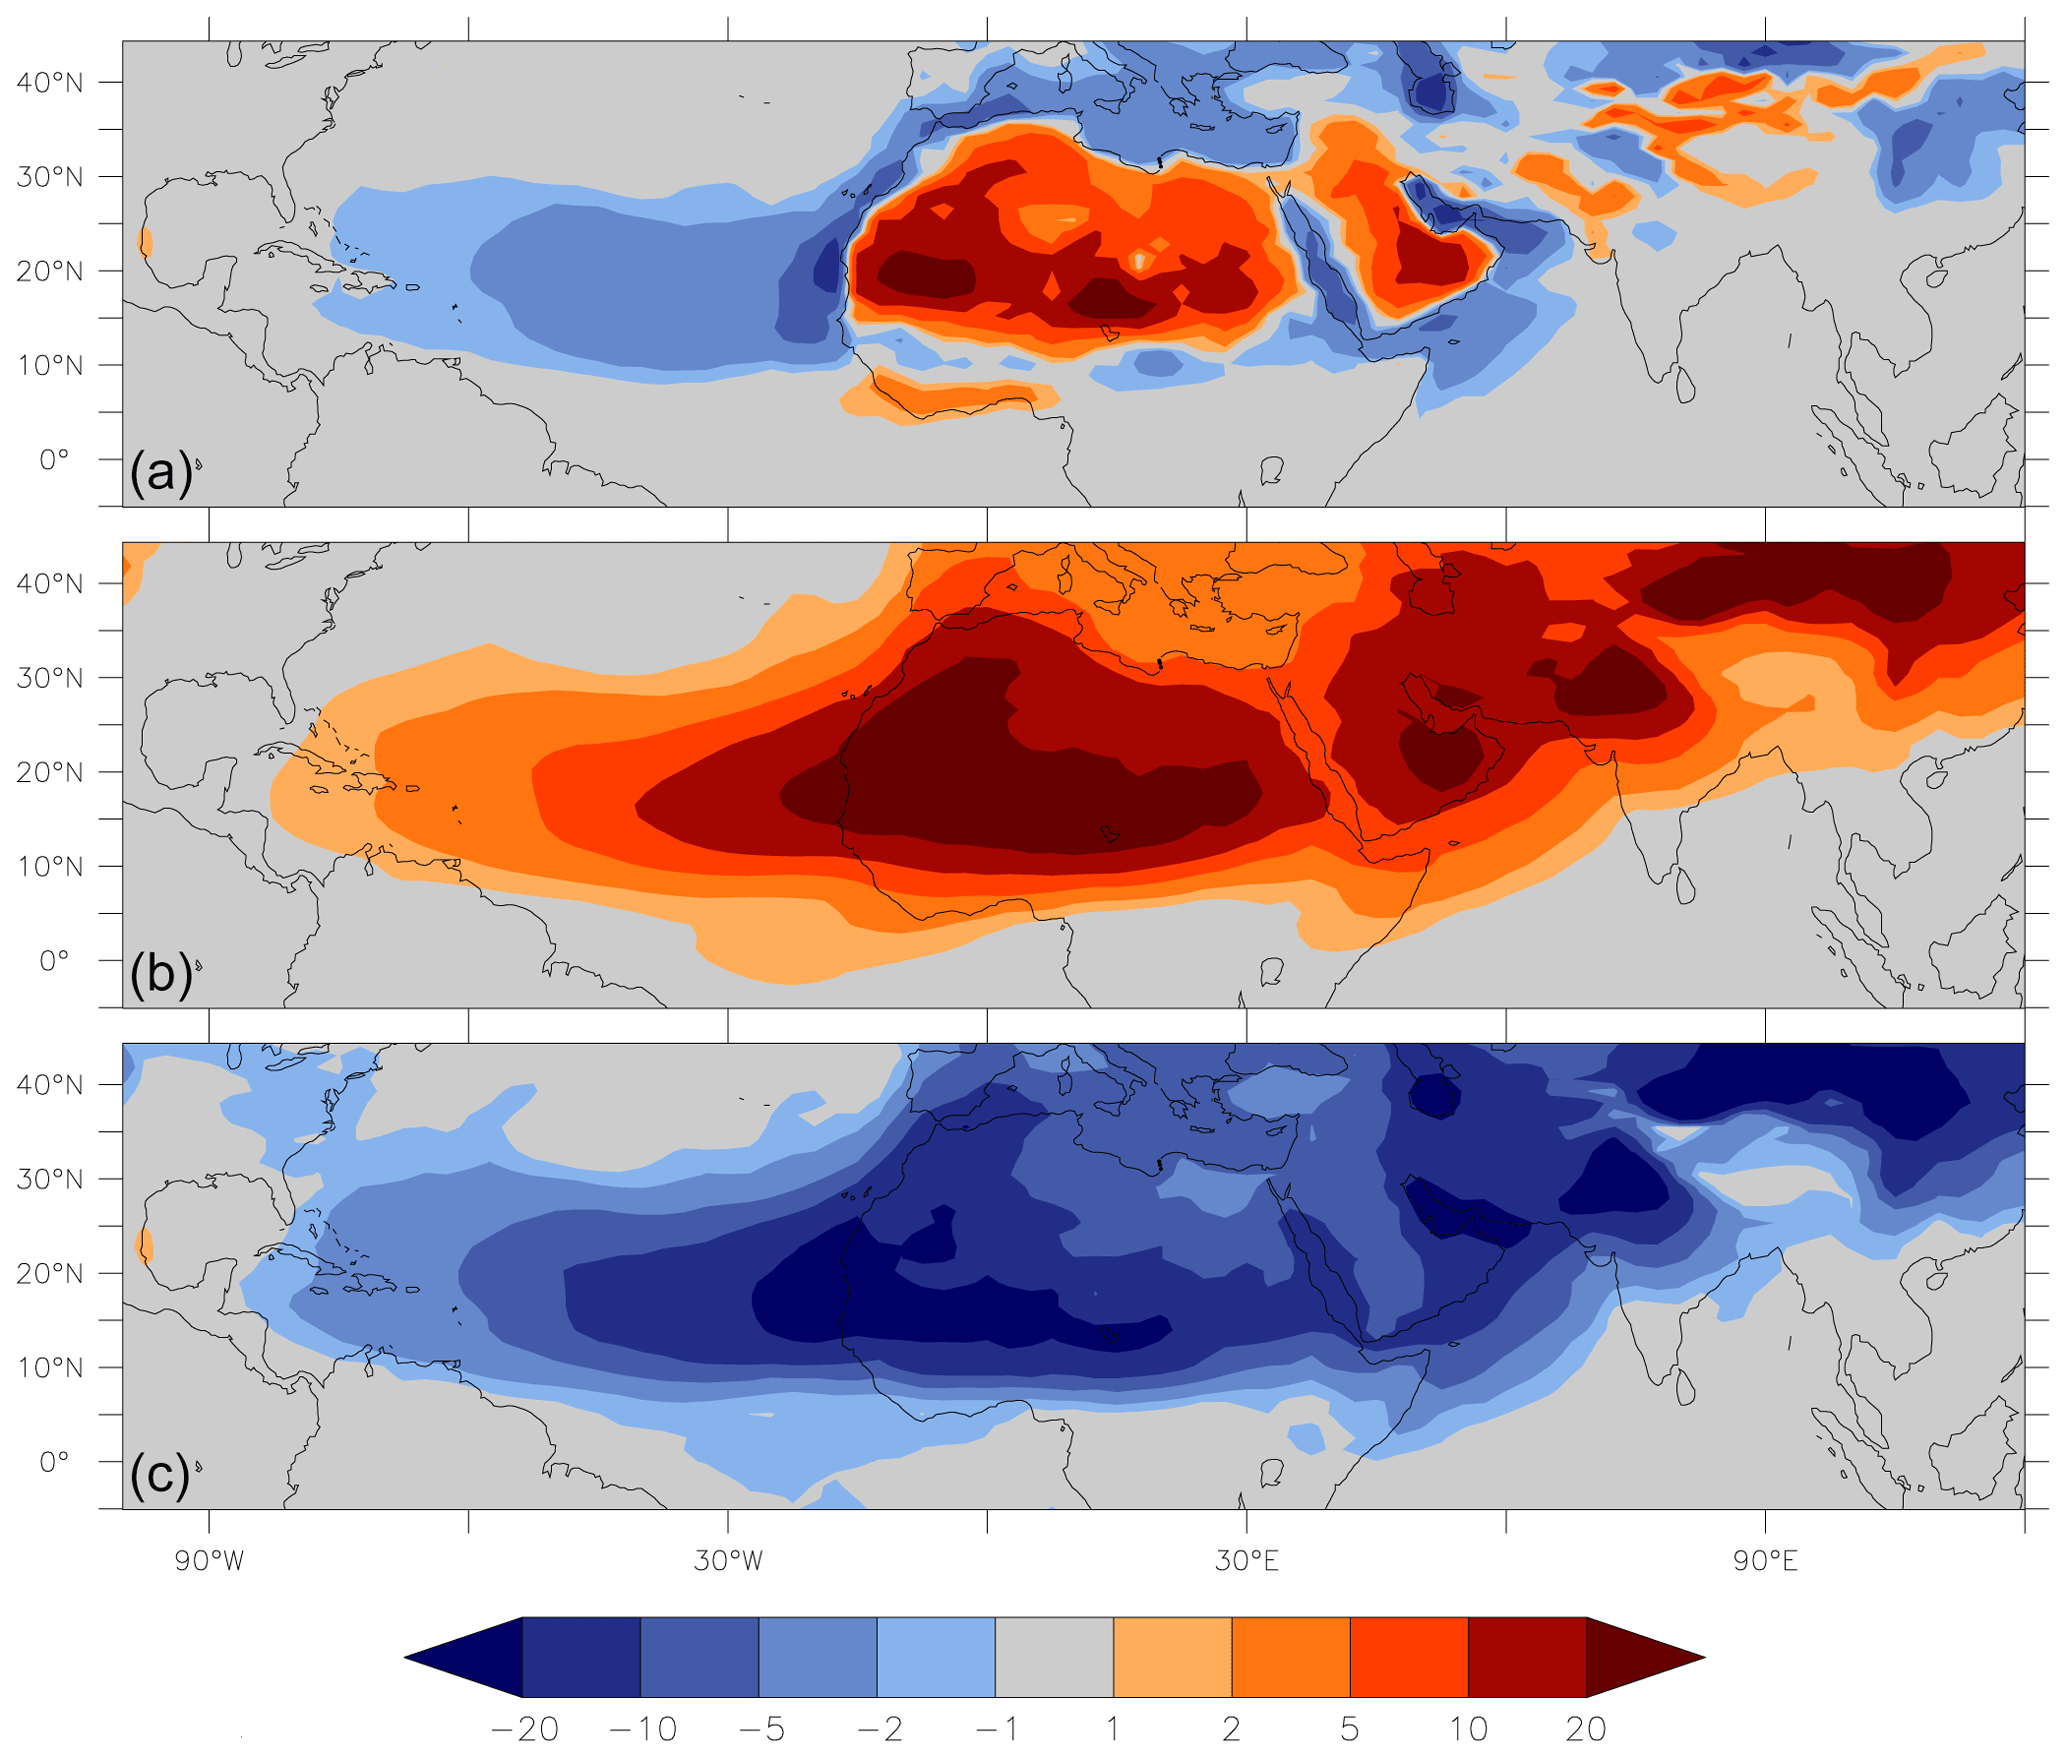
Figure 3(a) Mean JJAS TOA dust direct radiative effect (in watts per square meter; hereafter W m−2). (b) Mean JJAS dust atmospheric absorption (W m−2), which is obtained as being the difference between TOA and surface effects. (c) Mean JJAS surface dust radiative effect (W m−2). Over the Sahel region (10 to 20∘ N; 15∘ W to 35∘ E), the effect amounts to +6.0 W m−2 (SW ; LW ), the atmospheric absorption amounts to +16.7 W m−2 (SW ; LW ), and the surface radiative effect amounts to −10.8 W m−2 (SW , LW ). In addition, Table 1 also indicates the values for the global dust direct radiative effect.
To evaluate the impact of this change in the radiative effect of dust on precipitation, we calculate the difference in 30 years (1985–2014) of precipitation averaged over JJAS between the simulation with dust and the one with no dust (Figs. 4 and 5). These figures show an increase in precipitation between 6 and 20∘ N latitude over Africa. A common feature of most Earth system models (ESMs) is having a summer African monsoon that does not reach far enough north compared to observations such as Tropical Rainfall Measuring Mission (TRMM; Roehrig et al., 2013). Figure 5 shows that precipitation averaged from 10∘ W to 10∘ E increases from 0.5 to 1.5 mm d−1 over the summer months (JJAS). Accounting for dust absorption, hence, shifts the extent of the African summer monsoon northward.
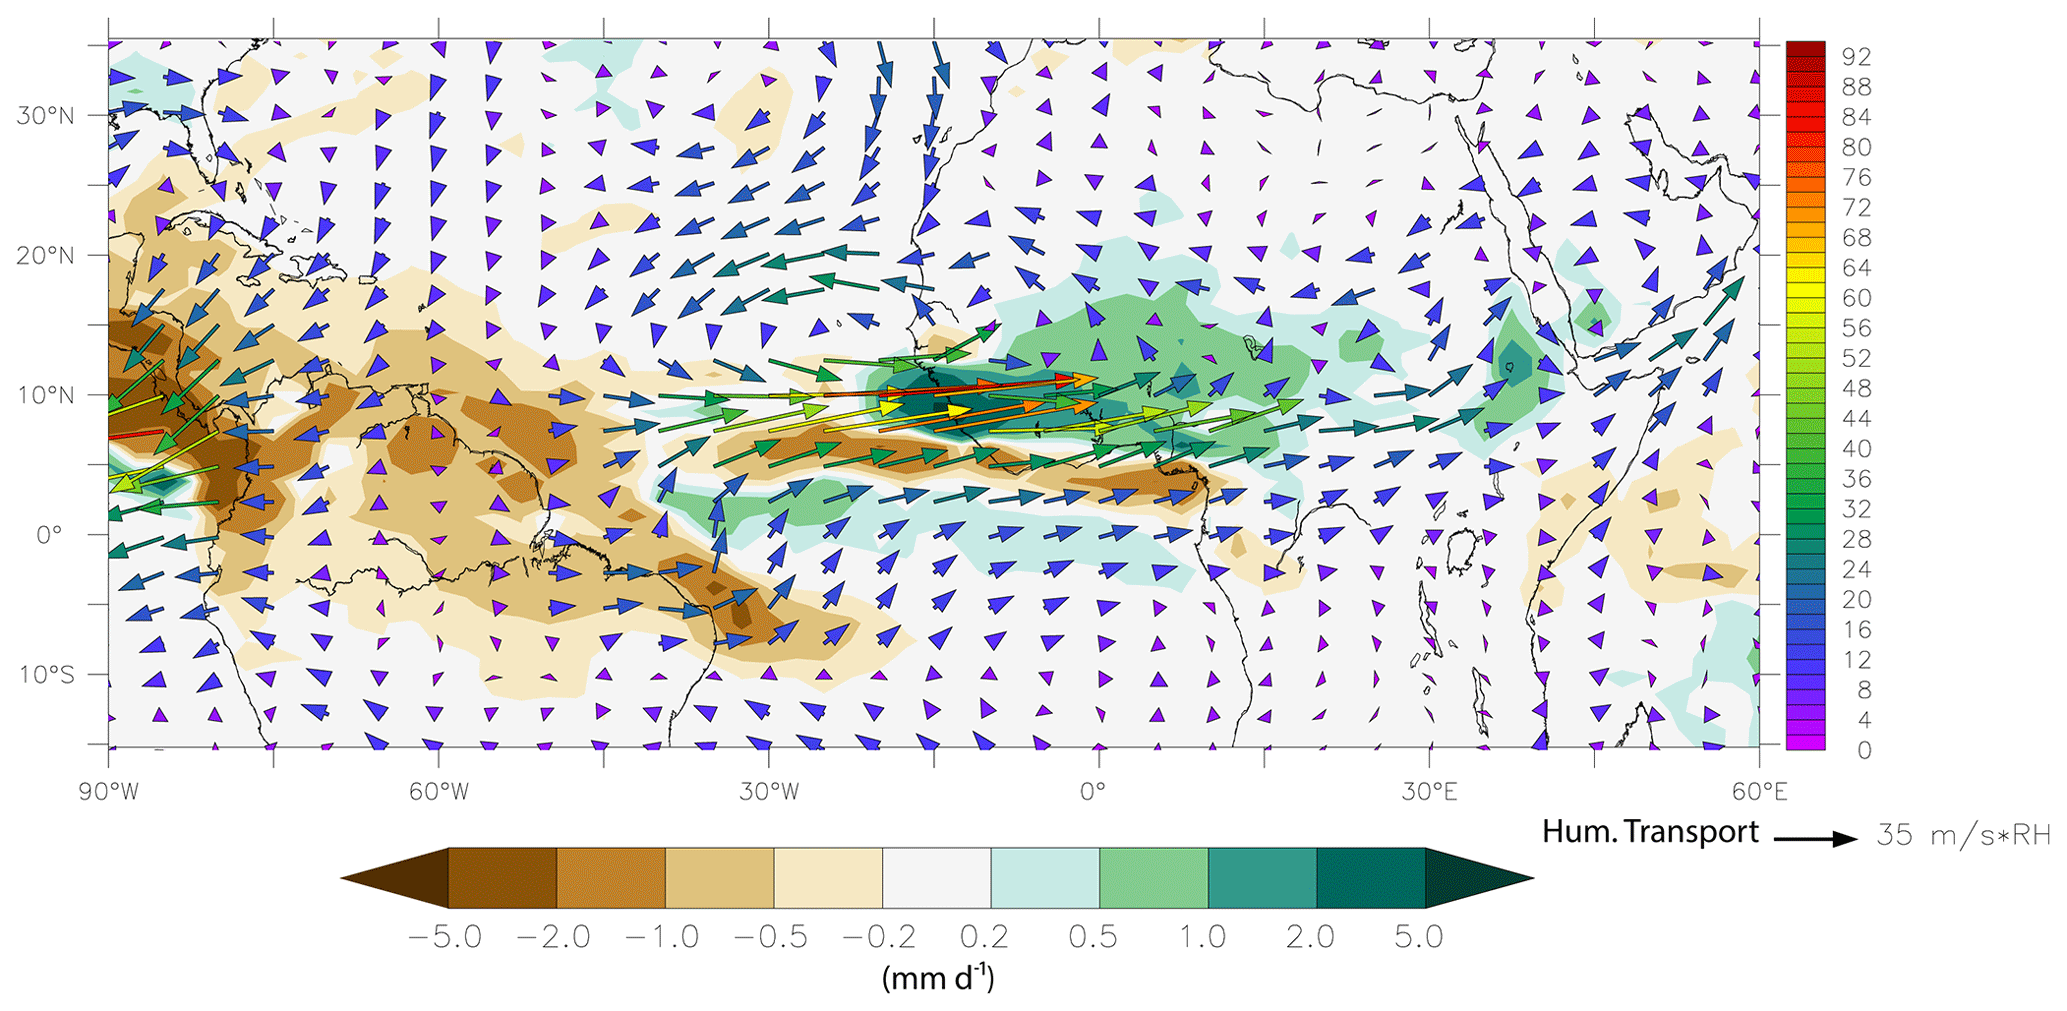
Figure 4The contours represent the mean precipitation difference (millimeters per day) due to the effect of absorbing dust for the months JJAS for 30 years (1985 to 2014). This is obtained by subtracting the precipitation fields from the experiment with interactive dust and the experiment without dust from the IPSL-CM6 climate model. The arrows indicate the changes in mean humidity transport ( RH – relative humidity) for the same period.
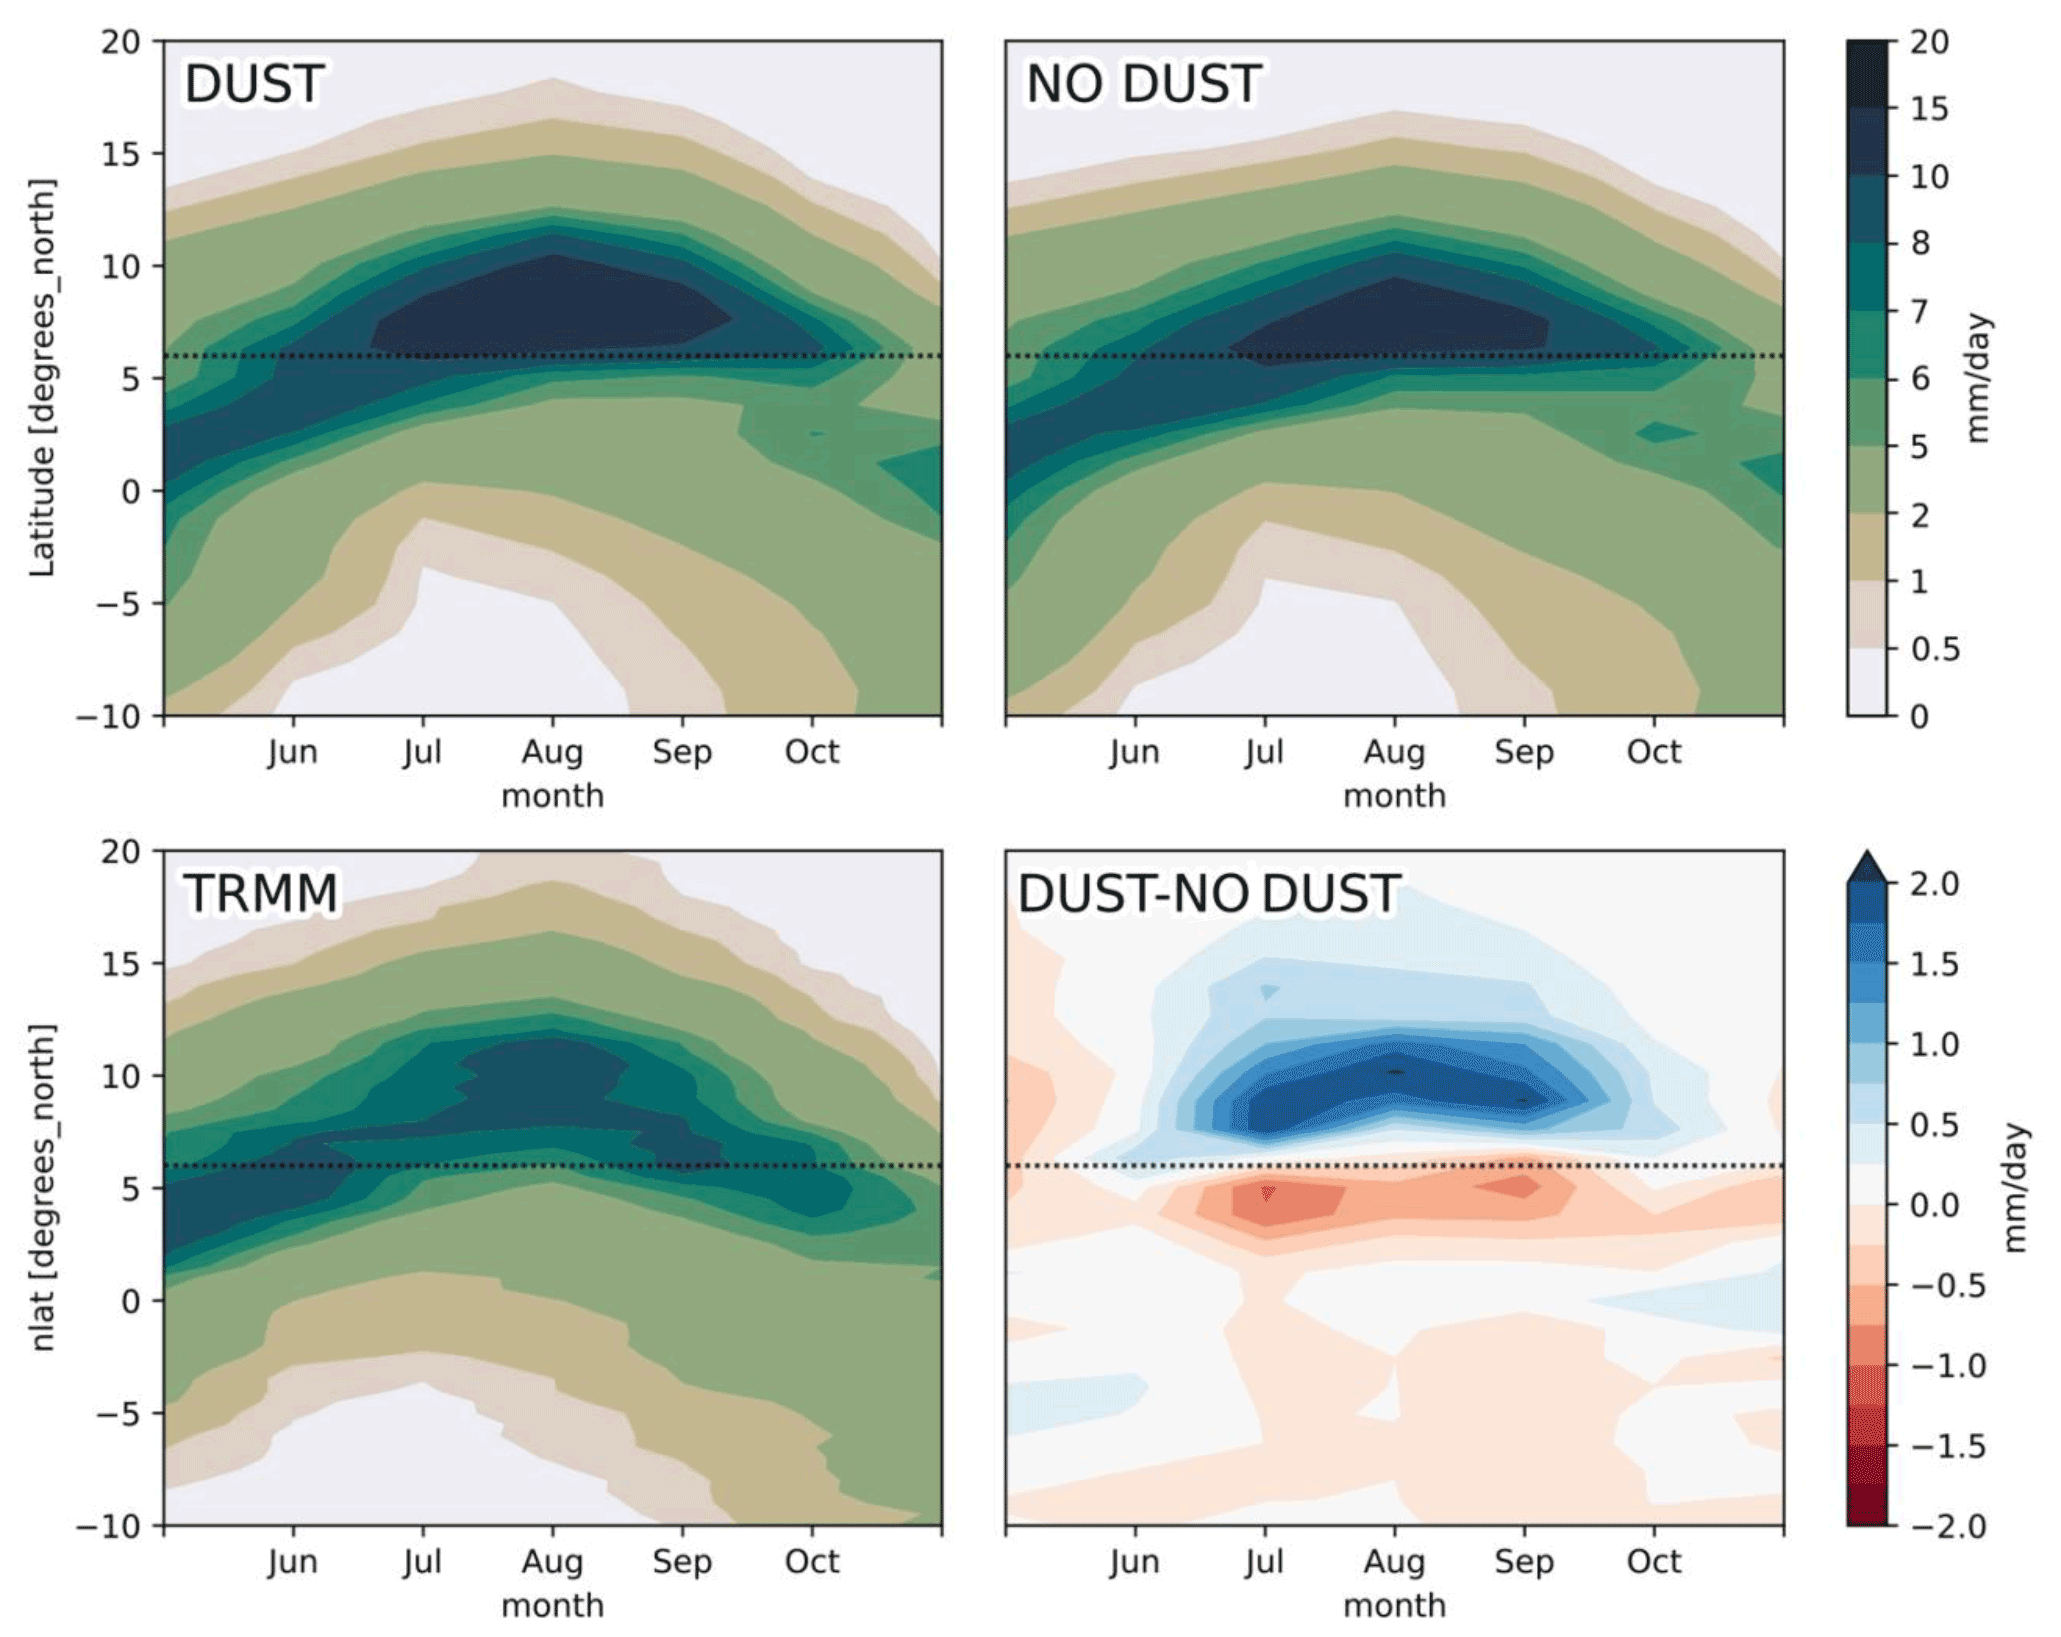
Figure 5A Hovmöller diagram showing the time and latitudinal variations in the zonally averaged precipitation (millimeters per day) from 10∘ W to 10∘ E from 2000 to 2014. The TRMM indicates the observed precipitations from the NASA Tropical Rainfall Measuring Mission.
We now examine whether precipitation is better represented when the effect of absorbing dust on atmospheric heating is accounted for. The accuracy with which the model captures the African monsoon was analyzed by comparing the incursion of the precipitation into the African continent with the TRMM observations for the same time during a 15-year period (2000–2014) over the summer months (JJAS). Figure 6 introduces the change in water budget due to the effect of absorbing dust over an airshed of the size of the Sahel (10–20∘ N; 15∘ W–35∘ E). We derive the amount of water advected into this region with the same units as precipitation or evaporation (millimeters per day; see Sect. 2.). Figure 4 shows that aerosol absorption induces more water vapor advection from the ocean to the Sahel, thereby providing an added supply of moisture that is available for precipitation. When sufficient water vapor is advected towards the African continent, aerosol absorption changes the regional energy balance and enhances convection through the air column (Miller et al., 2014; Solmon et al., 2008). The change in water flux into the Sahel region amounts to an increase of 0.365 mm d−1 for the JJAS period. Precipitation and evaporation over the Sahel region increase by 0.40 and 0.09 mm d−1, respectively, for the same months over the 30-year period (1985–2014). Hence, there is a small residual in the water budget which we attribute to imperfections in the way the advected water fluxes are diagnosed in the model.
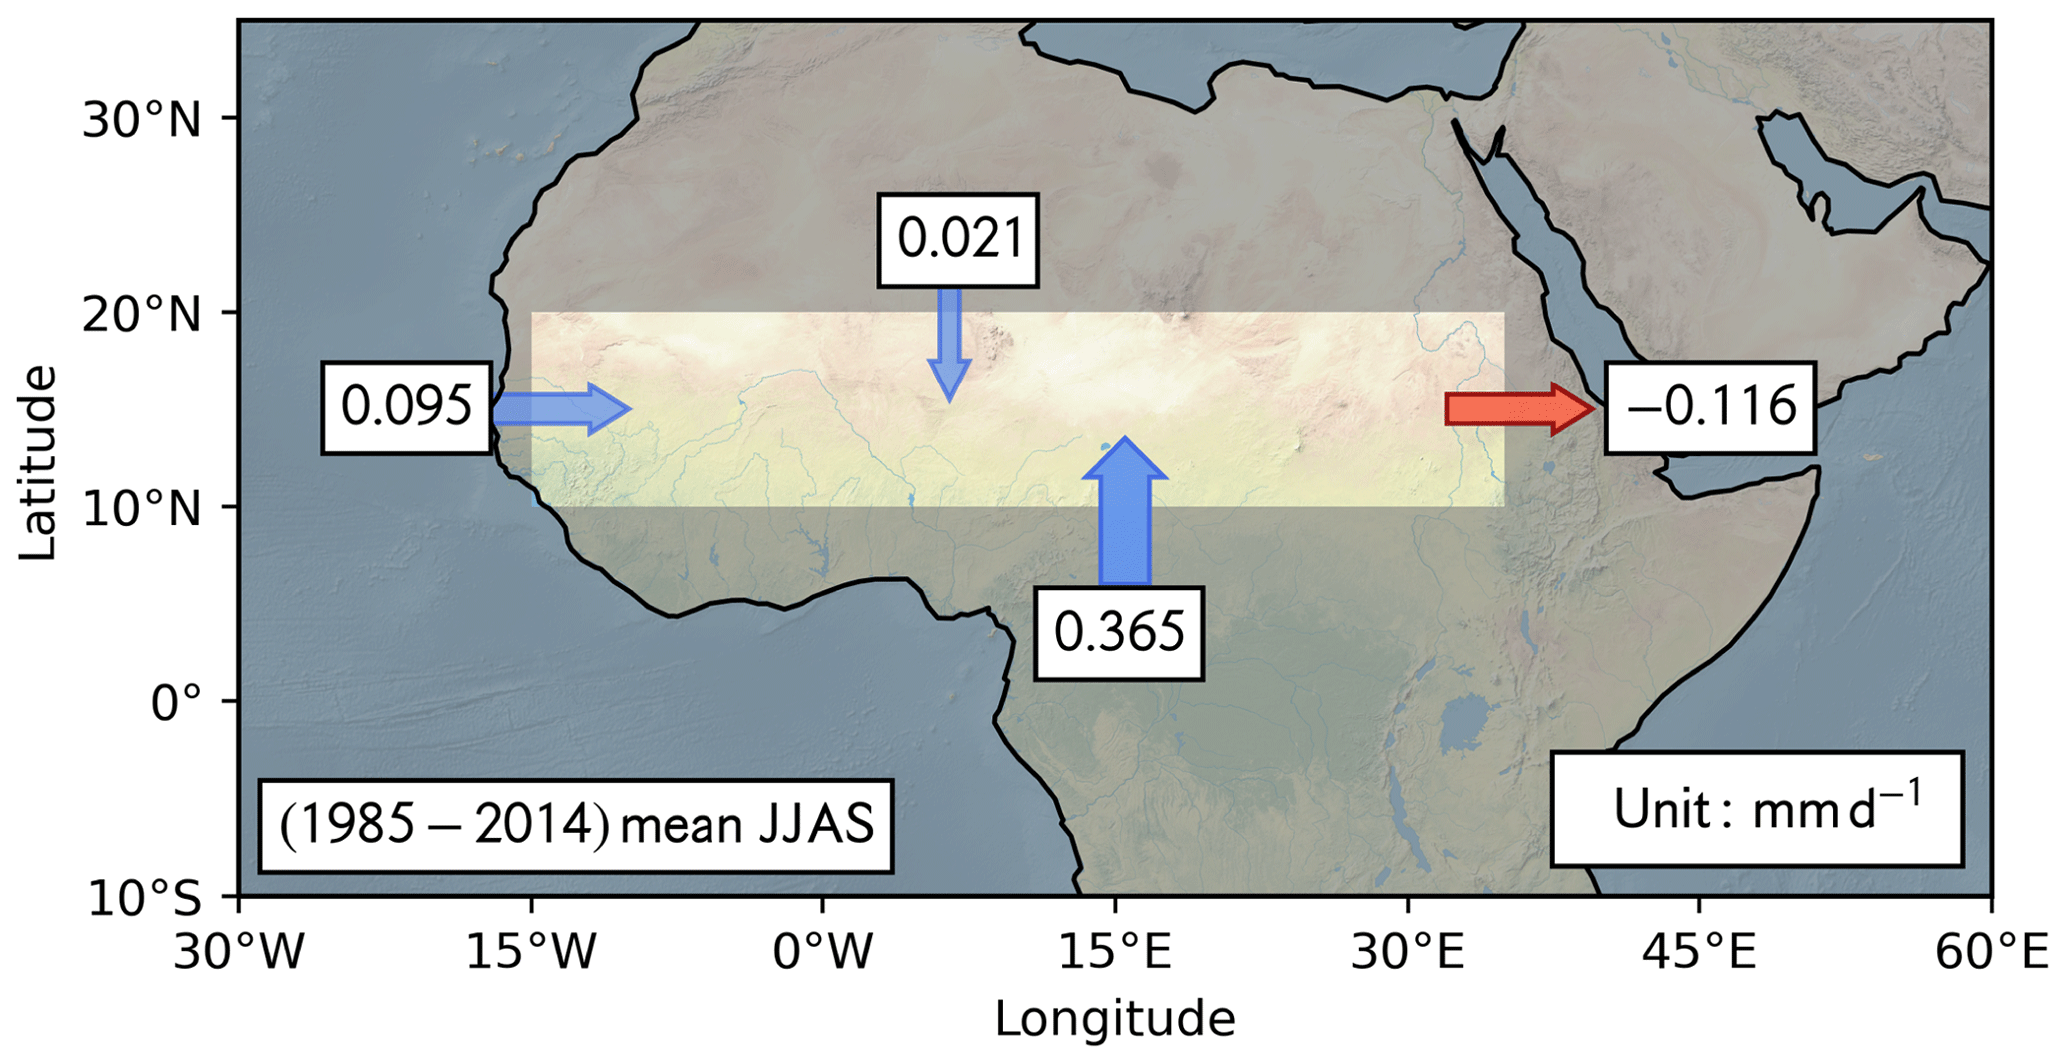
Figure 6Differences in water fluxes (millimeters per day), integrated between the surface and 200 hPa, through the boundaries of the Sahel region, for a 30-year mean (1985–2014) in JJAS between simulations with and without dust. See Sect. 2 for an explanation of how the fluxes are derived. The total change in precipitation and in evaporation over the Sahel due to the presence of dust amounts, respectively, to 0.40 and 0.09 mm d−1. The Sahel region is indicated with a box. The sign of the water budget difference is positive (negative) if water enters (exits) the Sahel box.
We now analyze if the changes in precipitation in SW and LW upward radiative fluxes brought about by the presence of dust improve or degrade these variables when compared to observations. We selected observations from the Global Precipitation Climatology Project (GPCP) from June to September, during the period 1985 to 2014, and the radiative fluxes measured by CERES. Both the precipitation and the statistics of the SW and LW upward radiative fluxes, based upon the model/measurements comparison, show significant improvements over the Sahel, North Africa and the North Atlantic Ocean. We quantify these improvements in Tables 2, 3 and 4 through a comparison of the bias, root mean square error (RMSE) and spatial correlation between the simulated and observed fields. For precipitation, the largest changes occur over the Sahel where precipitation increases by 21 % over the period, and the negative bias and the RMSE are reduced by 34 % and 29 %, respectively. The spatial correlation of the precipitation is also improved from 0.951 to 0.965. Other regions where all of the mentioned statistics are improved are the North Atlantic and the West Indian Ocean. Over northern Africa, the strong dust absorption causes an excess of precipitation, but there are improvements in the RMSE and the spatial correlation.
Table 2Statistics of the simulated precipitation between scenarios without dust and with dust compared to the GPCP observations for the months of June–September (JJAS). The last column indicates the precipitation change (millimeters per day) over the period JJAS. Both simulated and observed precipitation fields are compared for the same JJAS period (from 1985 to 2014). The statistics in italics (bold) indicate an improvement or degradation from 5 % to 15 % (> 15 %) of the bias, RMSE, and correlation for the region indicated in the first column.
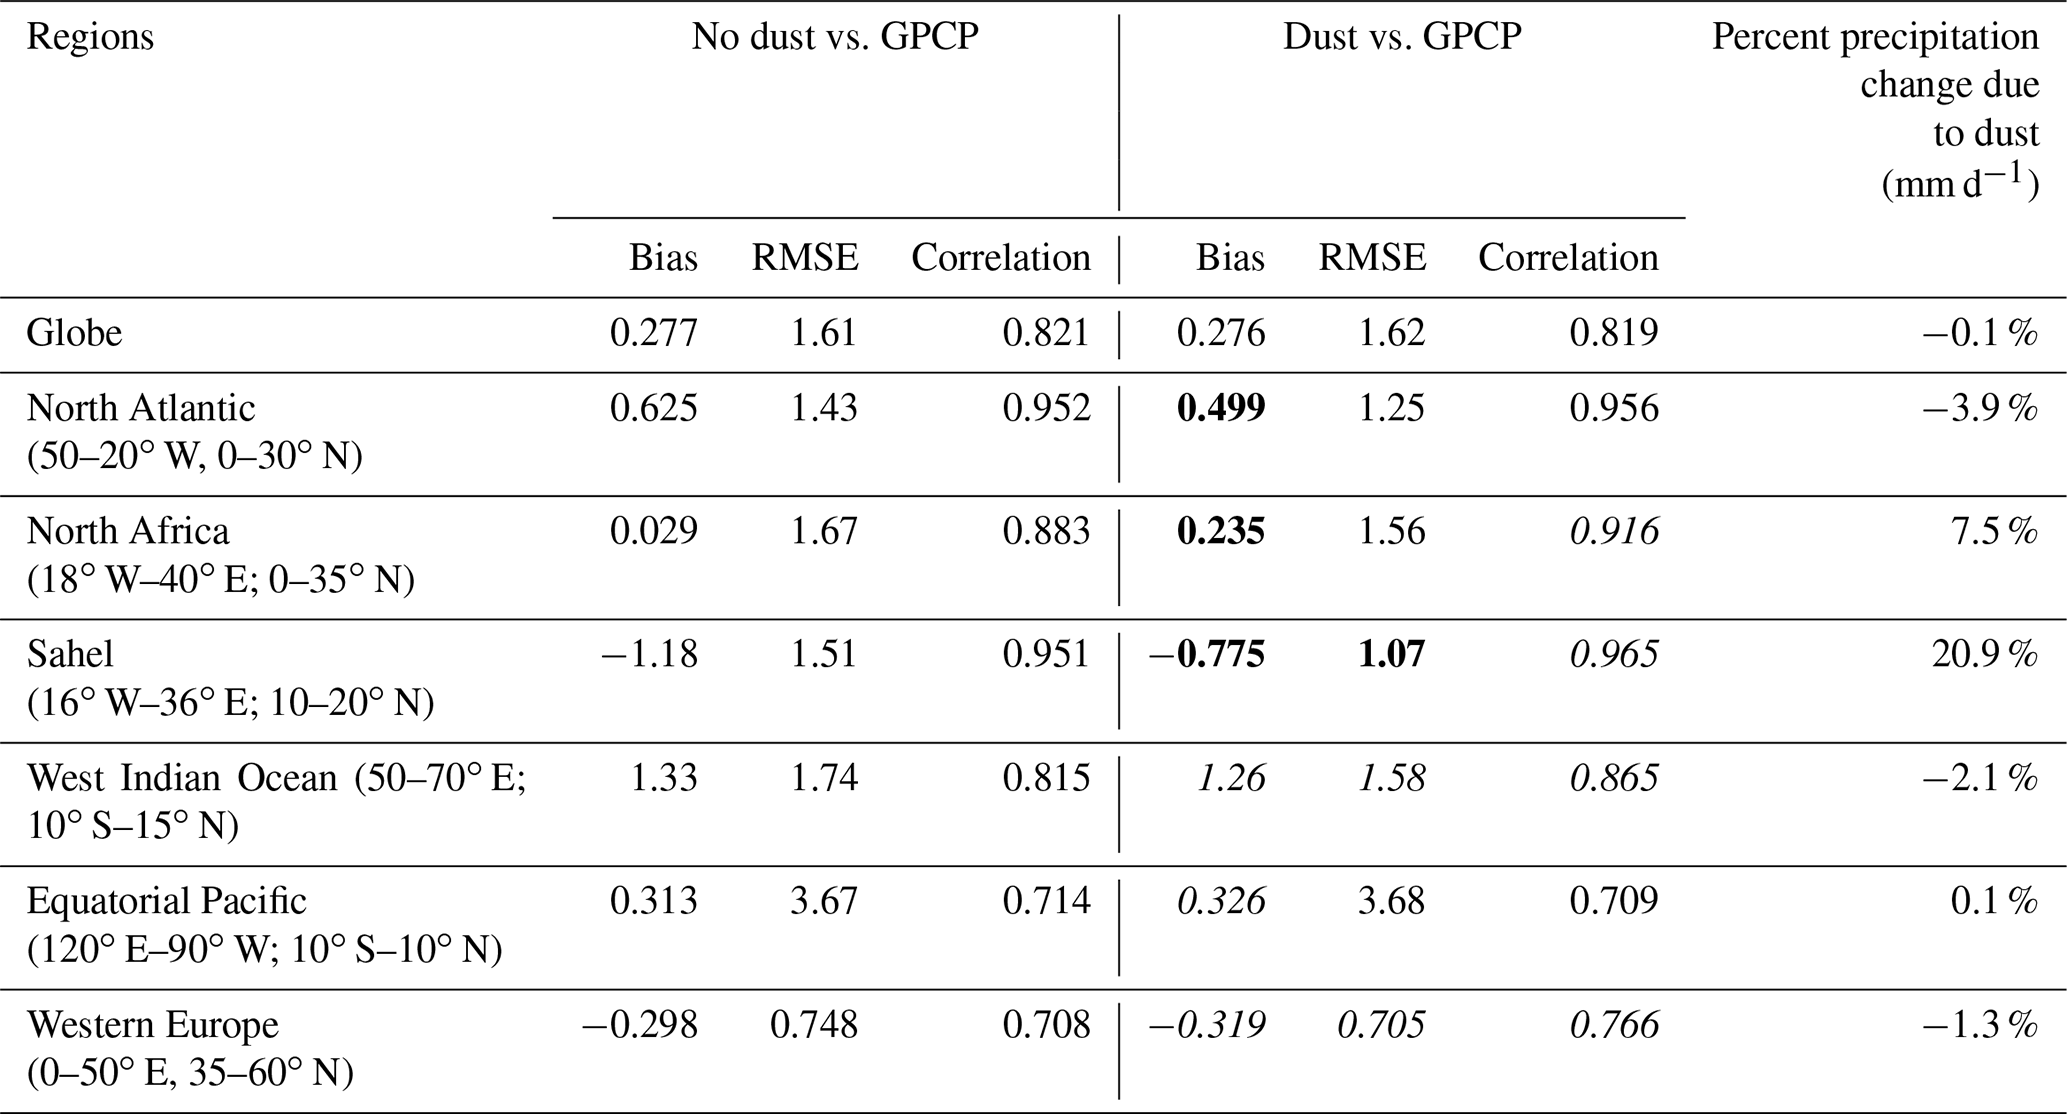
Table 3Comparison of the simulated LW TOA outgoing fluxes (in W m−2) to CERES observations over the regions indicated in the first column. For 2-D maps, see https://vesg.ipsl.upmc.fr/thredds/fileServer/, last access: 26 July 2021.

Table 4Comparison of the simulated SW TOA outgoing fluxes (in W m−2) with the CERES observations over the regions indicated in the first column. For 2-D maps, see https://vesg.ipsl.upmc.fr/thredds/fileServer/, last access: 27 July 2021.
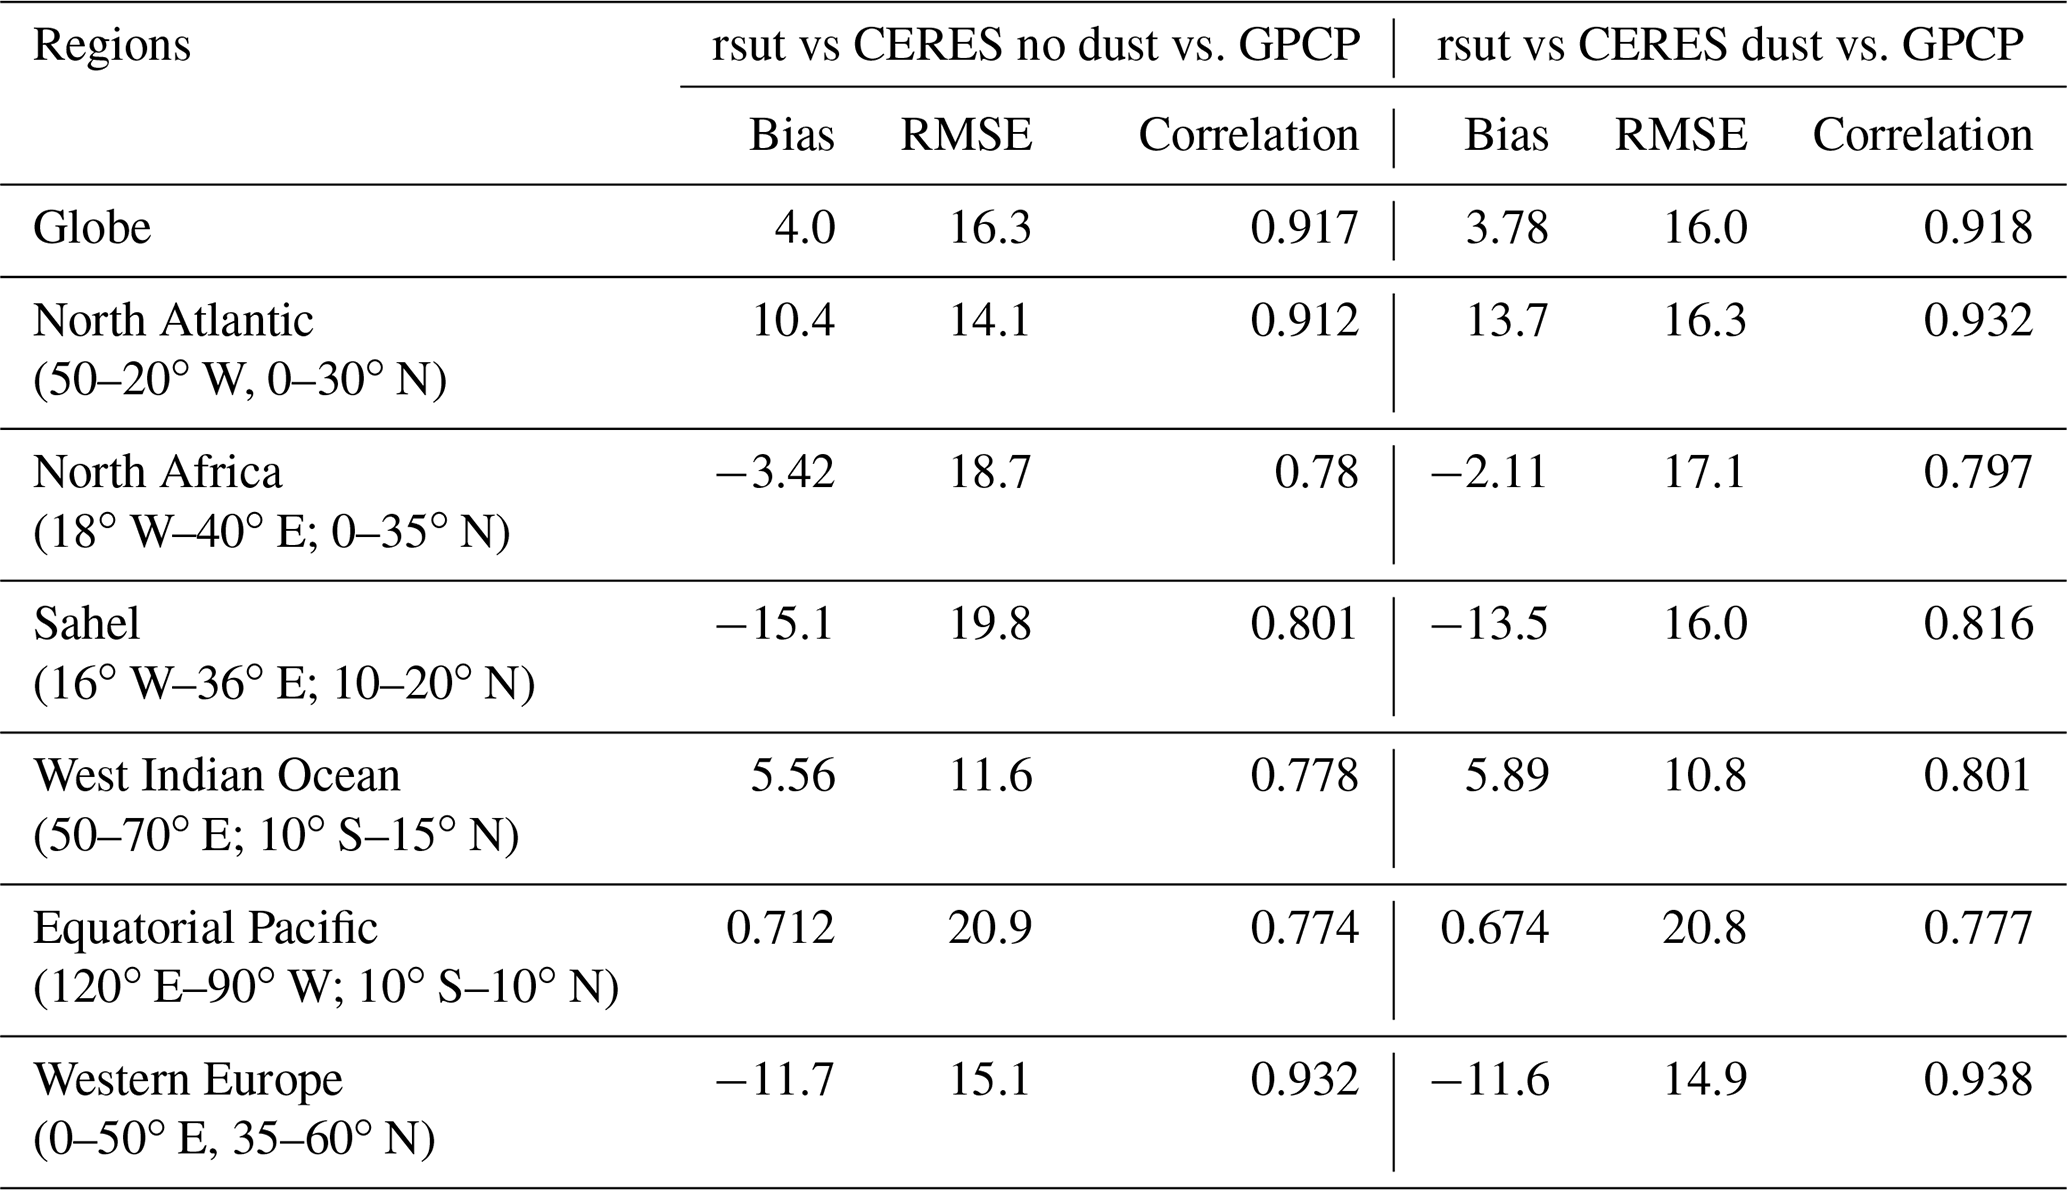
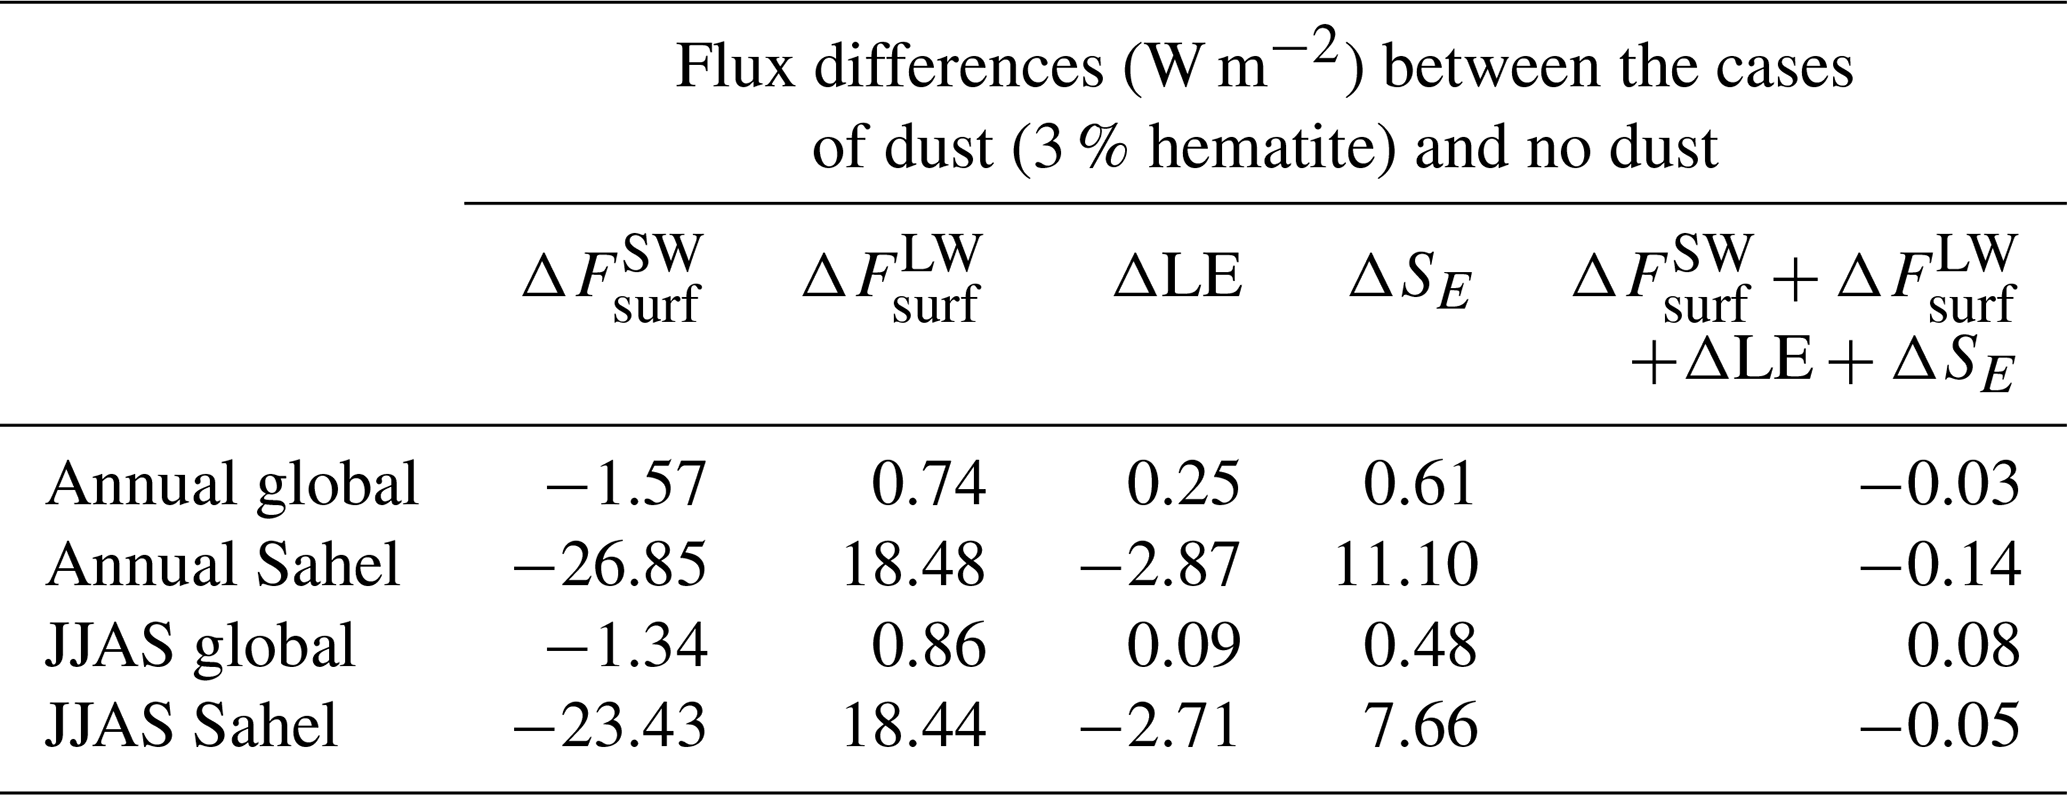
Table 5Annual and JJAS flux differences in surface fluxes (and their residuals; in W m−2) estimated globally and for the Sahel region (15∘ W–35∘ E; 10–20∘ N) between the dust and no dust experiments. and represent the net changes in, respectively, the SW and LW radiative fluxes at the surface, and the two other terms, ΔLE and ΔSE, indicate the changes in the turbulent fluxes of latent and sensible heat due to the presence of dust. These terms are computed over the 30-year period from 1985 to 2014.
The Sahel region is prone to substantial atmospheric dust absorption as it is an important mineral dust source region. Being an active source region, the lower troposphere above the Sahel experiences high dust loads, and a large mass fraction comprises large-sized dust particles with diameters above 10 µm (larger particles are more absorbent than smaller ones; see Fig. 8a–b in Ryder et al., 2013). Compounding these effects, soils from the Sahel have a higher iron oxide content than other soils from North Africa (Kandler et al., 2007; Liu et al., 2018; Di Biagio et al., 2019; Formenti et al., 2014). The high atmospheric absorption that exists over the Sahel, and illustrated in Fig. 3, induces water moisture advection from the North Atlantic in regions off the West Coast of Africa during the period of the African summer monsoon (Fig. 4). The action of mineral dust aerosol on precipitation is felt through the modifications of the diabatic heating and how the aerosol affects evaporation.
The terms in the energy balance that influence evaporation are the dimming caused by the aerosol layer of −18 W m−2 over the Sahel (see Fig. 3), which needs to be compensated for by the decrease in net latent heat flux that leaves the surface. Table 5 shows the different terms of the change in surface energy budget. Ignoring the changes in surface heat storage, we have the following:
where and represent the net change in, respectively, the SW and LW radiative fluxes at the surface, and the two other terms, ΔLE and ΔSE, indicate the changes in turbulent fluxes of latent and sensible heat due to the presence of dust. Over the oceans, the change in latent heat flux dominates, and the evaporation is reduced; hence, the precipitation over these regions is diminished (see the last column of Table 1). Figure S2 indicates the vertical amount of transported moist static energy (MSE). In total, two regions can be distinguished, i.e., one over the Sahel, where the transport is upward as a result of the absorbed energy by dust, and one in the surrounding regions, with a downward motion. These are the main perturbations that accompany the precipitation anomaly caused by the presence of dust. Other variables that increase are evaporation, low-level cloud cover and the liquid water path. As noticed by Miller et al. (2004), and reinforced by the results presented here, evaporation over the Sahel increases with dust absorption (Fig. S4), while precipitation increases over the same region. Part of the evaporation is supplied by the moisture brought through precipitation over the same region. One mechanism for supplying the moisture is the advection that is evidenced in Fig. S1 and in the water budget presented in Fig. 6.
To complete the analysis of the possible mechanisms that may have explained this improvement in the Sahel precipitation, we examined whether a different phasing of the Atlantic multidecadal variability (AMV; Enfield et al., 2001), a basin-wide, low-frequency variation in the sea surface temperature over the North Atlantic, could be responsible for reproducing observed precipitation fields better. Figure S5 compares the observed and simulated AMV index (Enfield et al., 2001; Trenberth and Shea, 2006). The AMV index is more in phase in the simulation without dust than in the simulation with dust. We conclude from this analysis that the precipitation improvements brought about by dust absorption, which are also evident for earlier portions of the 100-year long simulations, are not due to a better phasing of natural variability in the dust simulation. Instead, they correspond to dynamical effects that respond to a thermodynamically driven forcing.
This study was designed to realistically represent dust absorption over the Sahel region and describe the mechanisms by which dust stimulates summer precipitation (JJAS) over the region. Our modeling includes two aspects not accounted for in the past. First, it accounts for the high iron oxide content of the region in the optical properties, and second, it takes into consideration the extra-absorption from very large particles with diameters greater than 10 µm, which are generally not represented in climate models. The striking benefit of these refinements in the dust physics is that, at least in the IPSL-CM6 model considered here, tropical precipitation and TOA LW and SW fluxes are significantly improved compared to observations. This important result came almost serendipitously when checking to see if the comparison between simulated and observed precipitation over 30 years showed improvement. In key regions of tropical precipitations, namely the Sahel, tropical North Atlantic and West Indian Ocean, the precipitation in the IPSL-CM6 climate model is significantly improved without degradation elsewhere. We speculate that this improvement may not be restricted to this climate model, as other models participating in the Coupled Model Intercomparison Project (CMIP) exercises have low dust absorption and a similar bias over the Sahel, which is a cause of too little advection of water vapor northward into the region during the Northern Hemisphere summer months. We, thus, provide a path towards improving the precipitation patterns in these regions by more realistically accounting for both the physical (size-based) and optical (absorption) properties of the aerosol. Our results also offer a strong physical basis for a stabilizing feedback loop involving dust emission, atmospheric absorption, the Sahel precipitation and vegetation, as hypothesized by Carslaw et al. (2013), which could create multiannual or multidecadal oscillations at these latitudes that could also interact with natural models of variability in the Atlantic region. Future studies should, therefore, account for the role of water recycling from semi-arid vegetation (Yu et al., 2017), which plays a potentially important role in this loop.
The data sets generated during and/or analyzed during the current study are available from the corresponding author on reasonable request.
The supplement related to this article is available online at: https://doi.org/10.5194/acp-21-11423-2021-supplement.
YB conceived and designed the project and led the writing and preparation, with assistance from RB, OB, RCG and JS. YB and OB analyzed the data and interpreted the results. RCG processed the observational satellite data sets, compared them with the model and participated in the calculation of dust radiative effects. RCG produced Fig. 1.
The authors declare that they have no conflict of interest.
Publisher’s note: Copernicus Publications remains neutral with regard to jurisdictional claims in published maps and institutional affiliations.
We would like to thank Jim Haywood and the two anonymous reviewers, for their suggestions on restructuring the initial draft. Yves Balkanski and Ramiro Checa-Garcia acknowledge the hospitality of the Institut Pascal, Université Paris-Saclay, during the INDICES program of 2019 (Investissements d'avenir ANR-11-IDEX-0003-01 Paris-Saclay). The simulations were performed using the supercomputing resources from the GENCI (Grand Equipement National de Calcul Intensif; grant no. 2020-t2014012201).
This research has been supported by the European Union's Horizon 2020 Research and Innovation programme CRESCENDO (grant no. 641816).
This paper was edited by Ulrich Pöschl and Rolf Müller and reviewed by J. M. Haywood and two anonymous referees.
Atkinson, J. D., Murray, B. J., Woodhouse, M. T., Whale, T. F., Baustian, K. J., Carslaw, K. S., Dobbie, S., O'Sullivan, D., and Malkin, T. L.: The importance of feldspar for ice nucleation by mineral dust in mixed-phase clouds, Nature, 498, 355–358, 2013.
Balkanski, Y., Schulz, M., Moulin, C., and Ginoux, P.: : The formulation of dust emissions on global scale: formulation and validation using satellite retrievals, in: Emissions of Atmospheric Trace Compounds, edited by: Granier, C., Artaxo, P., and Reeves, C., Kluwer Academic Publishers, Dordrecht, 239–267, 2004.
Balkanski, Y., Schulz, M., Claquin, T., and Guibert, S.: Reevaluation of Mineral aerosol radiative forcings suggests a better agreement with satellite and AERONET data, Atmos. Chem. Phys., 7, 81–95, https://doi.org/10.5194/acp-7-81-2007, 2007.
Boucher, O., Servonnat, J., Albright, A. L., Aumont, O., Balkanski, Y., Bastrikov, V., Bekki, S., Bonnet, R., Bony, S., Bopp, L., Braconnot, P., Brockmann, P., Cadule, P., Caubel, A., Cheruy, F., Codron, F., Cozic, A., Cugnet, D., D'Andrea, F., Davini, P., Lavergne, C., Denvil, S., Deshayes, J., Devilliers, M., Ducharne, A., Dufresne, J., Dupont, E., Éthé, C., Fairhead, L., Falletti, L., Flavoni, S., Foujols, M., Gardoll, S., Gastineau, G., Ghattas, J., Grandpeix, J., Guenet, B., Guez, L., E., Guilyardi, E., Guimberteau, M., Hauglustaine, D., Hourdin, F., Idelkadi, A., Joussaume, S., Kageyama, M., Khodri, M., Krinner, G., Lebas, N., Levavasseur, G., Lévy, C., Li, L., Lott, F., Lurton, T., Luyssaert, S., Madec, G., Madeleine, J., Maignan, F., Marchand, M., Marti, O., Mellul, L., Meurdesoif, Y., Mignot, J., Musat, I., Ottlé, C., Peylin, P., Planton, Y., Polcher, J., Rio, C., Rochetin, N., Rousset, C., Sepulchre, P., Sima, A., Swingedouw, D., Thiéblemont, R., Traore, A. K., Vancoppenolle, M., Vial, J., Vialard, J., Viovy, N., and Vuichard, N.: Presentation and Evaluation of the IPSL-CM6A-LR Climate Model, J. Adv. Model. Earth Syst., 12, e2019MS002010, https://doi.org/10.1029/2019MS002010, 2020.
Carslaw, K. S., Lee, L. A., Reddington, C. L., Pringle, K. J., Rap, A., Forster, P. M., Mann, G. W., Spracklen, D. V., Woodhouse, M. T., Regayre, L. A., and Pierce, J. R.: Large contribution of natural aerosols to uncertainty in indirect forcing, Nature, 503, 67–71, 2013.
Checa-Garcia, R., Balkanski, Y., Albani, S., Bergman, T., Carslaw, K., Cozic, A., Dearden, C., Marticorena, B., Michou, M., van Noije, T., Nabat, P., O'Connor, F. M., Olivié, D., Prospero, J. M., Le Sager, P., Schulz, M., and Scott, C.: Evaluation of natural aerosols in CRESCENDO Earth system models (ESMs): mineral dust, Atmos. Chem. Phys., 21, 10295–10335, https://doi.org/10.5194/acp-21-10295-2021, 2021.
Chylek, P., Srivastava, V., Pinnick, R. G., and Wang, T.: Scattering of Electromagnetic waves by composites spherical particles: Experiment and effective medium approximations, Appl. Opt., 27, 2396–2404, 1988.
Claquin, T., Schulz, M., and Balkanski, Y. J.: Modeling the mineralogy of atmospheric dust sources, J. Geophys. Res.-Atmos., 104, 22243–22256, https://doi.org/10.1029/1999JD900416, 1999.
Denjean, C., Cassola, F., and Mazzino, A., Triquet, S., Chevaillier, S., Grand, N., Bourrianne, T., Momboisse, G., Sellegri, K., Schwarzenbock, A., Freney, E., Mallet, M., and Formenti, P.: Size distribution and optical properties of mineral dust aerosols transported in the western Mediterranean, Atmos. Chem. Phys., 16, 1081–1104, https://doi.org/10.5194/acp-16-1081-2016, 2016.
Di Biagio, C., Formenti, P., Balkanski, Y., Caponi, L., Cazaunau, M., Pangui, E., Journet, E., Nowak, S., Andreae, M. O., Kandler, K., Saeed, T., Piketh, S., Seibert, D., Williams, E., and Doussin, J.-F.: Complex refractive indices and single-scattering albedo of global dust aerosols in the shortwave spectrum and relationship to size and iron content, Atmos. Chem. Phys., 19, 15503–15531, https://doi.org/10.5194/acp-19-15503-2019, 2019.
Di Biagio, C., Balkanski, Y., Albani, S., Boucher, O., and Formenti, P.: Direct Radiative Effect by Mineral Dust Aerosols Constrained by New Microphysical and Spectral Optical Data, Geophys. Res. Lett., 47, e2019GL086186, https://doi.org/10.1029/2019GL086186, 2020.
Enfield, D. B., Mestas-Nuñez, A. M., and Trimble, P. J.: The Atlantic Multidecadal Oscillation and its relation to rainfall and river flows in the continental U.S., Geophys. Res. Lett., 28, 2077–2080, https://doi.org/10.1029/2000GL012745, 2001.
Engelbrecht, J. P., Moosmüller, H., Pincock, S., Jayanty, R. K. M., Lersch, T., and Casuccio, G.: Technical note: Mineralogical, chemical, morphological, and optical interrelationships of mineral dust re-suspensions, Atmos. Chem. Phys., 16, 10809–10830, https://doi.org/10.5194/acp-16-10809-2016, 2016.
Fiedler, S., Crueger, T., D'Agostino, R., Peters, K., Becker, T., Leutwyler, D., Paccini, L., Burdanowitz, J., Buehler, S. A., Cortes, A. U., Dauhut, T., Dommenget, D., Fraedrich, K., Jungandreas, L., Maher, N., Naumann, A. K., Rugenstein, M., Sakradzija, M., Schmidt, H., Sielmann, F., Stephan, C., Timmreck, C., Zhu, X., and Stevens, B.: Simulated Tropical Precipitation Assessed across Three Major Phases of the Coupled Model Intercomparison Project (CMIP), Mon. Weather Rev., 148, 3653–3680, https://doi.org/10.1175/MWR-D-19-0404.1, 2020.
Formenti, P., Caquineau, S., Chevaillier, S., Klaver, A., Desboeufs, K., Rajot, J. L., Belin, S., and Briois, V.: Dominance of goethite over hematite in iron oxides of mineral dust from Western Africa: Quantitative partitioning by X-ray absorption spectroscopy, J. Geophys. Res.-Atmos., 119, 12740–12754, https://doi.org/10.1002/2014JD021668, 2014.
Fouquart, Y. and Bonnel, B.: Computations of solar heating of the Earth's atmosphere: A new parameterization, Beitr. Phys. Atmos., 53, 35–62, 1980.
Haywood, J. M., Jones, A., Dunstone, N., Milton, S., Vellinga, M., Bodas-Salcedo, A., Hawcroft, M., Kravitz, B., Cole, J., Watanabe, S., and Stephens, G.: The impact of equilibrating hemispheric albedos on tropical performance in the HadGEM2-ES coupled climate model, Geophys. Res. Lett., 43, 395–403, https://doi.org/10.1002/2015GL066903, 2016.
Hogan, R. J. and Bozzo, A.: A flexible and efficient radiation scheme for the ECMWF model, J. Adv. Model. Earth Syst., 10, 1990–2008, https://doi.org/10.1029/2018MS001364, 2018
Hwang, H. and Frierson, D.: Link between the double-intertropical convergence zone problem and cloud biases over the southern ocean, P. Natl. Acad. Sci. USA, 110, 4935–4940, 2013.
Joseph, J. H., Wiscombe, W. J., and Weinman, J. A.: The delta-Eddington approximation for radiative flux transfer, J. Atmos. Sci., 33, 2452–2459, 1976.
Journet, E., Balkanski, Y., and Harrison, S. P.: A new data set of soil mineralogy for dust-cycle modeling, Atmos. Chem. Phys., 14, 3801–3816, https://doi.org/10.5194/acp-14-3801-2014, 2014.
Kandler, K., Benker, N., Bundke, U., Cuevas, E., Ebert, M., Knippertz, P., Rodríguez, S., Schütz, L., and Weinbruch, S.: Chemical composition and complex refractive index of Saharan Mineral Dust at Izaña, Tenerife (Spain) derived by electron microscopy, Atmos. Environ., 41, 8058–8074, https://doi.org/10.1016/j.atmosenv.2007.06.047, 2007.
Kok, J. F.: Does the size distribution of mineral dust aerosols depend on the wind speed at emission?, Atmos. Chem. Phys., 11, 10149–10156, https://doi.org/10.5194/acp-11-10149-2011, 2011.
Kok, J. F., Ridley, D. A., Zhou, Q., Miller, R. L., Zhao, C., Heald, C. L., Ward, D. S., Albani, S., and Haustein, K.: Smaller desert dust cooling effect estimated from analysis of dust size and abundance, Nat. Geosci., 10, 274–278, https://doi.org/10.1038/ngeo2912, 2017.
Lafon, S., Sokolik, I. N., Dajot, J. L., Caquineau, S., and Gaudichet, A.: Characterization of iron oxides in mineral dust aerosols: Implications for light absorption, J. Geophys. Res.-Atmos., 111, D21207, https://doi.org/10.1029/2005JD007016, 2006.
Liu, D., Taylor, J. W., Crosier, J., Marsden, N., Bower, K. N., Lloyd, G., Ryder, C. L., Brooke, J. K., Cotton, R., Marenco, F., Blyth, A., Cui, Z., Estelles, V., Gallagher, M., Coe, H., and Choularton, T. W.: Aircraft and ground measurements of dust aerosols over the west African coast in summer 2015 during ICE-D and AER-D, Atmos. Chem. Phys., 18, 3817–3838, https://doi.org/10.5194/acp-18-3817-2018, 2018.
Miller, R. L., Tegen, I., and Perlwitz, J.: Surface radiative forcing by soil dust aerosols and the hydrologic cycle, J. Geophys. Res.-Atmos., 109, 4085–4112, https://doi.org/10.1029/2003JD004085, 2004.
Miller, R. L., Knippertz, P., Pérez García-Pando, C., Perlwitz, J. P., and Tegen, I.: Impact of Dust Radiative Forcing upon Climate, in: Mineral Dust: A Key Player in the Earth System, edited by: Knippertz, P. and Stuut, J.-B. W., Springer Netherlands, Dordrecht, 327–357, https://doi.org/10.1007/978-94-017-8978-3_13, 2014.
Milton, S. F., Greed, G., Brooks, M. E., Haywood, J., Johnson, B., Allan, R. P., Slingo, A., and Grey, W. M. F.: Modeled and observed atmospheric radiation balance during the West African dry season: Role of mineral dust, biomass burning aerosol, and surface albedo, J. Geophys. Res., 113, D00C02, https://doi.org/10.1029/2007JD009741, 2008.
Moosmüller, H., Engelbrecht, J. P., Skiba, M., Frey, G., Chakrabarty, R. K., and Arnott, W. P.: Single scattering albedo of fine mineral dust aerosols controlled by iron concentration, J. Geophys. Res., 117, D11210, https://doi.org/10.1029/2011JD016909, 2012.
Morcrette, J.-J. and Fouquart, Y.: The overlapping of cloud layers in shortwave radiation parameterizations, J. Atmos. Sci., 43, 321–328, 1986.
Nenes, A., Murray, B., and Bougiatioti, A.: Mineral Dust and its Microphysical Interactions with Clouds, in: Mineral Dust, edited by: Knippertz, P. and Stuut, J.-B. W., Springer Netherlands, Dordrecht, 287–325, https://doi.org/10.1007/978-94-017-8978-3_12, 2014.
Nickovic, S., Vukovic, A., Vujadinovic, M., Djurdjevic, V., and Pejanovic, G.: Technical Note: High-resolution mineralogical database of dust-productive soils for atmospheric dust modeling, Atmos. Chem. Phys., 12, 845–855, https://doi.org/10.5194/acp-12-845-2012, 2012.
Pérez, C., Nickovic, S., Pejanovic, G., Baldasano, J. M., and Özsoy, E.: Interactive dust-radiation modeling: A step to improve weather forecasts, J. Geophys. Res., 111, D16206, https://doi.org/10.1029/2005JD006717, 2006.
Perlwitz, J. P., Pérez García-Pando, C., and Miller, R. L.: Predicting the mineral composition of dust aerosols – Part 1: Representing key processes, Atmos. Chem. Phys., 15, 11593–11627, https://doi.org/10.5194/acp-15-11593-2015, 2015.
Reid, J. S.: Comparison of size and morphological measurements of coarse mode dust particles from Africa, J. Geophys. Res., 108, 8593, https://doi.org/10.1029/2002JD002485, 2003.
Ridley, D. A., Heald, C. L., Kok, J. F., and Zhao, C.: An observationally constrained estimate of global dust aerosol optical depth, Atmos. Chem. Phys., 16, 15097–15117, https://doi.org/10.5194/acp-16-15097-2016, 2016.
Roehrig, R., Bouniol, D., Guichard, F., Hourdin, F., and Redelsperger, J.-L.: The Present and Future of the West African Monsoon: A Process-Oriented Assessment of CMIP5 Simulations along the AMMA Transect, J. Clim., 26, 6471–6505, https://doi.org/10.1175/JCLI-D-12-00505.1, 2013.
Ryder, C. L., Highwood, E. J., Rosenberg, P. D., Trembath, J., Brooke, J. K., Bart, M., Dean, A., Crosier, J., Dorsey, J., Brindley, H., Banks, J., Marsham, J. H., McQuaid, J. B., Sodemann, H., and Washington, R.: Optical properties of Saharan dust aerosol and contribution from the coarse mode as measured during the Fennec 2011 aircraft campaign, Atmos. Chem. Phys., 13, 303–325, https://doi.org/10.5194/acp-13-303-2013, 2013.
Ryder, C. L., Marenco, F., Brooke, J. K., Estelles, V., Cotton, R., Formenti, P., McQuaid, J. B., Price, H. C., Liu, D., Ausset, P., Rosenberg, P. D., Taylor, J. W., Choularton, T., Bower, K., Coe, H., Gallagher, M., Crosier, J., Lloyd, G., Highwood, E. J., and Murray, B. J.: Coarse-mode mineral dust size distributions, composition and optical properties from AER-D aircraft measurements over the tropical eastern Atlantic, Atmos. Chem. Phys., 18, 17225–17257, https://doi.org/10.5194/acp-18-17225-2018, 2018.
Schulz, M., Balkanski, Y. J., Guelle, W., and Dulac, F.: Role of aerosol size distribution and source location in a three dimensional simulation of a Saharan dust episode tested against satellite-derived optical thicknes, J. Geophys. Res.-Atmos., 103, 10579–10592, 1998.
Sheen, K. L., Smith, D. M., Dunstone, N. J., Eade, R., Rowell, D. P., and Vellinga, M.: Skilful prediction of Sahel summer rainfall on inter-annual and multi-year timescales, Nat. Commun., 8, 14966, https://doi.org/10.1038/ncomms14966, 2017.
Sokolik, I. N. and Toon, O. B.: Direct radiative forcing by anthropogenic airborne mineral aerosols, Nature, 381, 681–683, https://doi.org/10.1038/381681a0, 1996.
Solmon, F., Mallet, M., Elguindi, N., Giorgi, F., Zakey, A., and Konaré, A.: Dust aerosol impact on regional precipitation over western Africa, mechanisms and sensitivity to absorption properties, Geophys. Res. Lett., 35, L24705, https://doi.org/10.1029/2008GL035900, 2008.
Stephens, G. L., Hakuba, M. Z., Hawcroft, M., Haywood, J. M., Behrangi, A., Kay, J. E., and Webster, P. J.: The Curious Nature of the Hemispheric Symmetry of the Earth's Water and Energy Balances, Curr. Clim. Change Rep., 2, 135–147, https://doi.org/10.1007/s40641-016-0043-9, 2016.
Trenberth, K. E.: Atmospheric moisture recycling: Role of advection and local evaporation, J. Clim., 12, 1368–13181, https://doi.org/10.1175/1520-0442(1999)012<1368:AMRROA, 1999.
Trenberth, K. E. and Shea, D. J.: Atlantic hurricanes and natural variability in 2005, Geophys. Res. Lett., 33, L12704, https://doi.org/10.1029/2006GL026894, 2006.
Yoshioka, M., Mahowald, N. M., Conley, A. J., Collins, W. D., Fillmore, D. W., Zender, C. S., and Coleman, D. B.: Impact of Desert Dust Radiative Forcing on Sahel Precipitation: Relative Importance of Dust Compared to Sea Surface Temperature Variations, Vegetation Changes, and Greenhouse Gas Warming, J. Clim., 20, 1445–1467, https://doi.org/10.1175/JCLI4056.1, 2007.
Yu, Y., Notaro, M., Wang, F., Mao, J., Shi, X., and Wei, Y.: Observed positive vegetation-rainfall feedbacks in the Sahel dominated by a moisture recycling mechanism, Nat. Commun., 8, 1873, https://doi.org/10.1038/s41467-017-02021-1, 2017.
IPSL-CM6 is the Earth system model developed at the Institut Pierre-Simon Laplace and described in Boucher et al. (2020).