the Creative Commons Attribution 4.0 License.
the Creative Commons Attribution 4.0 License.
 | 28 Jul 2021
Source apportionment of atmospheric PM10 oxidative potential: synthesis of 15 year-round urban datasets in France
Samuël Weber
Olivier Favez
Lucille Joanna S. Borlaza
Aude Calas
Dalia Salameh
Florie Chevrier
Julie Allard
Jean-Luc Besombes
Alexandre Albinet
Sabrina Pontet
Boualem Mesbah
Grégory Gille
Shouwen Zhang
Cyril Pallares
Eva Leoz-Garziandia
Jean-Luc Jaffrezo
Reactive oxygen species (ROS) carried or induced by particulate matter (PM) are suspected of inducing oxidative stress in vivo, leading to adverse health impacts such as respiratory or cardiovascular diseases. The oxidative potential (OP) of PM, displaying the ability of PM to oxidize the lung environment, is gaining strong interest in examining health risks associated with PM exposure. In this study, OP was measured by two different acellular assays (dithiothreitol, DTT, and ascorbic acid, AA) on PM10 filter samples from 15 yearly time series of filters collected at 14 different locations in France between 2013 and 2018, including urban, traffic and Alpine valley site typologies. A detailed chemical speciation was also performed on the same samples, allowing the source apportionment of PM using positive matrix factorization (PMF) for each series, for a total number of more than 1700 samples. This study then provides a large-scale synthesis of the source apportionment of OP using coupled PMF and multiple linear regression (MLR) models. The primary road traffic, biomass burning, dust, MSA-rich, and primary biogenic sources had distinct positive redox activity towards the OPDTT assay, whereas biomass burning and road traffic sources only display significant activity for the OPAA assay. The daily median source contribution to the total OPDTT highlighted the dominant influence of the primary road traffic source. Both the biomass burning and the road traffic sources contributed evenly to the observed OPAA. Therefore, it appears clear that residential wood burning and road traffic are the two main target sources to be prioritized in order to decrease significantly the OP in western Europe and, if the OP is a good proxy of human health impact, to lower the health risks from PM exposure.
- Article
(3461 KB) - Full-text XML
-
Supplement
(307 KB) - BibTeX
- EndNote


Air quality has become a major public health issue, being considered the fourth largest global cause of mortality, with 7 million premature deaths worldwide per year due to both indoor and outdoor exposure (World Health Organization, 2016). Possibly driving 90 % of this health impact (Lelieveld et al., 2015), particulate matter (PM) is one of the key pollutants in the air linked to health outcomes, although the exact mechanism leading to toxicity is not yet fully understood (Barraza-Villarreal et al., 2008; Beck-Speier et al., 2012; Brauer et al., 2012; Goix et al., 2014; Goldberg, 2011; Saleh et al., 2019). Many urbanized areas, mainly located in low- or middle-income countries, are exposed to PM concentrations far higher than the recommendation guideline of the WHO.
Although PM is now monitored in most countries and large efforts are observed to document ambient concentrations, the underlying processes leading to the observed concentrations in the atmosphere, and particularly the understanding of emission sources, are still active fields of research (Diémoz et al., 2019; El Haddad et al., 2011; Golly et al., 2019; Hodshire et al., 2019; Jaffrezo et al., 2005; Jiang et al., 2019; Marconi et al., 2014; Moreno et al., 2010; Piot et al., 2012; Salameh et al., 2015; Samaké et al., 2019a; Waked et al., 2014). In recent years, strong focus has been put worldwide on source-apportionment methods in order to better understand the processes leading to the airborne concentrations and the accumulation of PM in the atmosphere. This includes direct modeling approaches such as chemistry transport models (CTMs) using tagged species (Brandt et al., 2013; Kranenburg et al., 2013; Mircea et al., 2020; Wagstrom et al., 2008; Wang et al., 2009) or field studies coupled with receptor models (RMs) (Belis et al., 2020; Pernigotti et al., 2016; Simon et al., 2010), notably positive matrix factorization (PMF). PMF can be based either on an aerosol mass spectrometer (AMS) time-resolved spectrum (Bozzetti et al., 2017; Petit et al., 2014; Zhang et al., 2019) or on filter analysis (Amato et al., 2016; Bressi et al., 2014; Fang et al., 2015; Jain et al., 2018, 2020; Liu et al., 2016; Petit et al., 2019; Salameh et al., 2018; Srivastava et al., 2018; Waked et al., 2014) or a mix of these different measurement techniques (Costabile et al., 2017; Vlachou et al., 2018, 2019). Results of these studies indicate that PM originates from a wide variety of sources, not only natural (volcano, sea spray, soil dust, vegetation, bacteria, pollen, etc.) or anthropogenic (road traffic, residential heating, industry, etc.) sources, but it is also formed as a secondary product and condensed from the gaseous phase (ammonium nitrate and ammonium sulfate, etc.). As a result, the chemistry, size distribution or reactivity of PM widely vary from location to location and season to season, which induces large changes in the health impacts depending on all of these parameters (Kelly and Fussell, 2012).
Furthermore, the mass of PM is not the most relevant metric when dealing with health impacts of airborne particles since major properties (chemistry, shape, size distribution, solubility, speciation) driving PM toxicity are not taken into account within this single mass metric. It is now believed that the measurement of the reactive oxygen species (ROS) issued from PM may be more closely linked to the potential adverse health effects of atmospheric PM, since oxidative stress is a key factor in the inflammatory response of the organism, leading for instance to respiratory diseases or when exposed for a long period of time, cardiovascular diseases or even cancer (Lelieveld et al., 2015; Li et al., 2003). Therefore, the oxidative potential (OP) of PM being an indirect measure of the ability of the particles to induce ROS in a biological medium (Ayres et al., 2008; Cho et al., 2005; Li et al., 2009; Sauvain et al., 2008) has been proposed as a potential proxy of the health impacts of atmospheric PM exposure. Indeed, even if the clear demonstration of the OP as a good proxy of health impact is still needed, some recent studies already established associations between OPs and different possible health outcomes (Costabile et al., 2019; Karavalakis et al., 2017; Steenhof et al., 2011; Strak et al., 2017b; Tuet et al., 2017a; Weichenthal et al., 2016) or cellular stress in vitro (Leni et al., 2020).
However, there is also no consensus on a standardized method to measure the OP of PM, and many assays and protocols co-exist (DTT, GSH, AA, ESR, ∘OH or H2O2, among others), with samples extracted with different methods (water, methanol, simulated lung fluid (SLF), etc.) and not always with a constant mass of PM. The dithiothreitol (DTT) and ascorbic-acid (AA) assays are widely used in association with health endpoints (Abrams et al., 2017; Atkinson et al., 2016; Bates et al., 2015; Canova et al., 2014; Fang et al., 2016; Janssen et al., 2015; Strak et al., 2017a; Weichenthal et al., 2016; Yang et al., 2016; Zhang et al., 2016), even if the exact methodologies differ from one study to the other. Results can also differ for the seasonality of OP based on these two assays, and some studies report strong seasonality of OP, whereas others do not (Bates et al., 2015; Calas et al., 2019; Cesari et al., 2019; Fang et al., 2016; Ma et al., 2018; Paraskevopoulou et al., 2019; Perrone et al., 2016; Pietrogrande et al., 2018; Verma et al., 2014; Fang et al., 2015; Weber et al., 2018; Borlaza et al., 2018; Zhou et al., 2019). Finally, several studies have already shown that different sources of PM have different reactivities to OP tests (Verma et al., 2014; Bates et al., 2015; Fang et al., 2016; Weber et al., 2018; Paraskevopoulou et al., 2019; Cesari et al., 2019; Zhou et al., 2019; Daellenbach et al., 2020). In particular, sources with high concentrations of transition metals, such as road traffic, appear to have a higher intrinsic oxidative potential (i.e., OP per microgram of PM) than other sources of PM. However, the number of these studies is still limited, and they do not always take into account complete seasonal cycles and therefore may not encompass the variety of sources for a given site, possibly omitting some important sources. Also, spatial variability at a country scale is currently unknown and requires homogeneous sampling and analysis methodologies for all filters and time series.
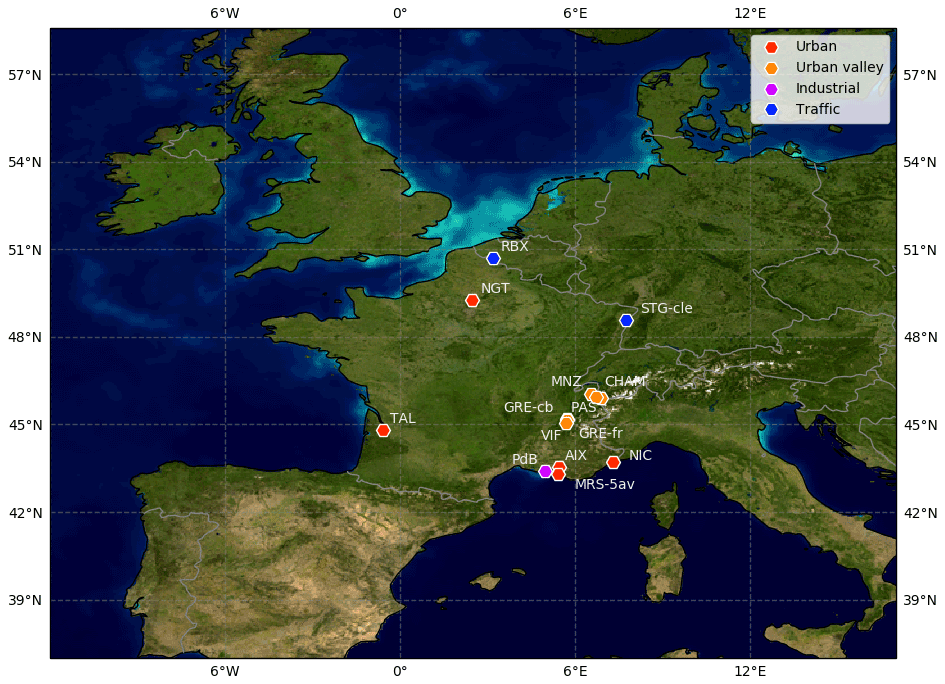
Figure 1Locations of the 14 sampling sites. Color codes denote the typologies of the sites: red, urban; orange, urban valley; magenta, industrial; blue, traffic. Background photography from NASA's Earth Observatory.
For a comprehensive investigation of the intrinsic OPs of various PM sources, we built up an extensive dataset of about 1700 samples from 14 sites consisting of 15 year-round time series of observations over continental France, collected during research programs conducted between 2013 and 2018. In each of these samples, we concurrently measured the OP with the DTT and AA assays together with an extensive chemical characterization allowing PM source apportionment using a harmonized PMF approach (Weber et al., 2019). Then, we apportioned the OP measured by the DTT and AA assays to the emission sources using a multilinear regression approach following Weber et al. (2018). In this way, we can estimate the oxidizing capacity of each microgram of PM from the different identified emission sources but also the relative contribution of the different sources to the OPDTT and OPAA on seasonal and daily bases. These results are presented in this paper.
2.1 Site descriptions
The selected sites had to fulfill three conditions: (1) a yearly sampling period, (2) the required chemical analysis to perform a harmonized PMF analysis and (3) enough filter surface left to assess the OP measurements. A total of 14 sites were included in this study (one being sampled twice at a 5-year interval) taken from different research programs. These sites reflect the diversity of typology we could encounter in western Europe: urban (NGT, TAL, AIX, MRS-5av, NIC), urban Alpine valley (GRE-cb, GRE-fr, VIF, CHAM, MNZ, PAS), industrial (PdB) and traffic (RBX, STG-cle) (see Table S1 in the Supplement) covering different areas of France (Fig. 1). We can note, however, the absence of remote or rural sites in our current dataset. The air quality at all of these sites is operated by the local air quality agencies (Atmo Sud, Atmo Auvergne Rhône-Alpes, Atmo Nouvelle Aquitaine, and Atmo Hauts de France), and most of them are part of the so-called CARA program (Favez et al., 2021).
2.2 Sample analysis
Even if it has been shown that mainly PM2.5 is deposited in lung alveoli (Fang et al., 2017), PM10 is still a public health concern and under regulation in the EU and France (Directive Official Journal of the European Union, 2008). Moreover, recent studies also highlight the role of the coarse fraction of PM in health impacts (Keet et al., 2018; Wang et al., 2018; Chen Renjie et al., 2019). PM10 has the advantage of encompassing all parts of PM potentially reaching the lower respiratory tract.
2.2.1 Chemical speciation
The PM10 concentrations were measured at each site by means of an automatic analyzer, according to EN 16450:2017 (CEN, 2017b), and daily (24 h) filter samples were collected every third day. Samplings were achieved on pre-heated quartz fiber filters using a high-volume sampler (DA80, Digitel), following EN 12341:2014 procedures (CEN, 2014). Offline chemical analysis performed on these filters has been fully described previously (Weber et al., 2019). Briefly, the elemental and organic carbon fractions (EC and OC) were measured via thermo-optical analysis (Sunset Lab. Analyzer Birch and Cary, 1996) using the EUSAAR-2 protocol (Cavalli et al., 2010; CEN, 2017a). Major water-soluble inorganic contents (Cl−, , , , Na+, K+, Mg2+, and Ca2+) and methanesulfonic acid (MSA) were determined using ion chromatography (CEN, 2017b; Jaffrezo et al., 2005). Metals or trace elements (e.g., Al, Ca, Fe, K, As, Ba, Cd, Co, Cu, La, Mn, Mo, Ni, Pb, Rb, Sb, Sr, V, and Zn) were measured by inductively coupled plasma atomic emission spectroscopy or mass spectrometry (ICP-AES or ICP-MS) (Alleman et al., 2010; Mbengue et al., 2014; CEN, 2005). Finally, anhydrosugars and sugar alcohols (including levoglucosan, mannosan, arabitol, sorbitol, and mannitol) were analyzed using liquid chromatography followed by pulsed amperometric detection (LC-PAD) (Verlhac et al., 2013; Yttri et al., 2015).
2.2.2 OP assays
Identical methodologies were applied for all the OP measurements of the collected filters (Calas et al., 2017, 2018, 2019). The extraction of PM was performed using a simulated lung fluid (SLF: Gamble + DPPC) to simulate the bio-accessibility of PM and to closely simulate exposure conditions. In order to take into account the nonlinearity of the OP with PM mass and to have comparable results between sites, the extraction has been carried out at the iso-mass concentration (10 or 25 µg mL−1 of PM, depending on the site, both values being in the low mass range of linear dose response), by adjusting the surface of the filter extracted. The filter extraction method allowed us to include both soluble and insoluble particles in the extracts. After the SLF extraction, particles removed from the filter were not filtrated, and the whole extract was injected in a 96-well plate for analysis. Samples were processed using the AA and DTT assays, as described below.
DTT depletion when in contact with PM extracts was determined by dosing the remaining amount of DTT with DTNB (dithionitrobenzoic acid) at different reaction times (0, 15 and 30 min), and absorbency was measured at 412 nm using a plate spectrophotometer (Tecan, M200 Infinite). An initial concentration of 12.5 nmol of DTT is used (50 µL of 0.25 mM DTT solution in phosphate buffer) to react with 205 µL of phosphate buffer and 40 µL of PM suspension.
The AA assay is a simplified version of the synthetic respiratory tract lining fluid (RTFL) assay (Kelly and Mudway, 2003), where only AA is used. A mix of 80 µL of PM suspension with 24 nmol of AA (100 µL of 0.24 mM AA solution in Milli-Q water) is used, and AA depletion was read continuously for 30 min by absorbency at 265 nm (TECAN, M1000 Infinite). The depletion rate of AA was determined by linear regression of the linear section data. For both assays, the 96-well plate was auto-shaken for 3 s before each measurement and kept at 37 ∘C.
Three filter blanks (laboratory blanks) and three positive controls (1,4-naphthoquinone, 24.7 µmol L−1) were included in each plate (OPAA and OPDTT) of the protocol. The average values of these blanks were then subtracted from the sample measurements of the given plate. The detection limit (DL) value was defined as 3 times the standard deviation of laboratory blank measurements (laboratory blank filters in Gamble + DPPC solution).
Hereafter, the OPDTT and OPAA normalized by air volume are denoted and , respectively, with unit .
2.3 Source apportionment
The source apportionment of the OP can be performed in two main ways: (1) by including the OP as an input variable for the RM (Verma et al., 2014; Fang et al., 2016; Ma et al., 2018; Cesari et al., 2019) or (2) by conducting source attribution to the PM mass and then, using a multilinear regression (MLR) model, assigning OP to each of the sources from the source–receptor model (Bates et al., 2015; Verma et al., 2015b; Weber et al., 2018; Cesari et al., 2019; Paraskevopoulou et al., 2019; Zhou et al., 2019; Daellenbach et al., 2020). We decided to use the second approach since adding the OP variable to the PMF may change the source-apportionment solution. Further, the first method would imply that the intrinsic OP would be positive by construction and not due to relevant physical properties (see below). Moreover, the OP apportionment in a two-step process (PM mass source apportionment and then OP apportionment) allowed us to potentially use different model types for the OP apportionment and re-use results of the PMF for other OP assays later on.
2.3.1 PM mass apportionment: positive matrix factorization
Methodological background
The PM mass source apportionment for the 15 yearly series was conducted using the U.S. Environmental Protection Agency (US-EPA) EPA PMF 5.0 software (US EPA, 2017) with the ME-2 solver from Paatero (1999). Briefly, the PMF was introduced by Paatero and Tapper (1994) and is now one of the most common approaches used for PM source-apportionment studies (Hopke et al., 2020; Karagulian et al., 2015; Belis et al., 2020). It aims at solving the receptor model equation
where X is the n×m observation matrix, G is the n×p contribution matrix and F is the p×m factor profile matrix (or source, despite some factors not being proper emission sources but possibly reflecting secondary processes), with n the number of samples, m the number of measured chemical species and p the number of profiles. Hereafter, the G matrix is expressed in µg m−3 and the F matrix in µg µg−1 of PM.
PMF setup
Some of the PMF analyses included in this paper have been performed during previous programs, namely, SOURCES (http://pmsources.u-ga.fr, last access: 27 July 2021, Weber et al., 2019), DECOMBIO (Chevrier, 2016; Chevrier et al., 2016), or MobilAir (https://mobilair.univ-grenoble-alpes.fr/, last access: 27 July 2021, Borlaza et al., 2021a). In order to get comparable PM source profiles from a common set of input species and constraints in the model, PMF analyses have been run with a harmonized methodology, as previously reported (Weber et al., 2019). Then, the PMF of MNZ and PAS were run specifically for this study, and the ones of MobilAir (GRE-fr_2017, GRE-cb and VIF) are the “classic” runs in Borlaza et al. (2021a). The other ones (AIX, CHAM, GRE-fr_2013, MRS-5av, NGT, NIC, PdB, RBX, STG-cle and TAL) directly come from the SOURCES program (Weber et al., 2019).
The input species were slightly different from one study to another but always included carbonaceous compounds (OC and EC), ions (, , Cl−, , K+, Mg2+, and Ca2+), organic compounds (levoglucosan, mannosan, arabitol and mannitol – the latter two summed and referred to as polyols) and MSA – and a set of trace metals for a total of about 30 species. The list of metals used within the PMF analysis was not the same for each of the sites due to overly low concentrations (lower than the quantification limit) on some filters leading to a very low signal-to-noise ratio (see Table S2). The uncertainties were estimated following the method proposed by Gianini et al. (2012) and were tripled if the signal-to-noise ratio was below 2 (classified as “weak” in the PMF software). Between 8 and 10 factors were identified at the different sites and are summarized in Table S3. For each of the PMF analyses, the possibility of using constraints to refine some of the chemical profiles of factors was considered in order to better disentangle possible mixing between factors and reduce the rotational ambiguity, based on a priori expert knowledge of the geochemistry of the sources. A PMF solution was considered valid if it followed the recommendation of the “European guide on air pollution source apportionment with receptor models” (Belis et al., 2019), also requiring a proper geochemical identification of the various factors. Estimation of the uncertainties of the PMF was obtained on both the base and constrained runs using the bootstrap (BS) and displacement (DISP) functions of the EPA PMF5.0 (Brown et al., 2015).
2.3.2 Similarity assessment of the PMF factors
Since PMF resolved site-specific PM factors, we checked whether a given factor had a consistent chemical profile over the different sites. For this purpose, as presented in Weber et al. (2019), a similarity assessment of all PMF factor profiles was run following the DeltaTool approach (Pernigotti and Belis, 2018). Using this tool, we compared pairs of factor profiles based on their mass-normalized chemical compounds using two different metrics, namely, the Pearson distance (PD) and the standardized identity distance (SID) (Belis et al., 2015). The first one is defined as
with r2 the Pearson correlation coefficient, and might be strongly influenced by individual extreme points. The second one, SID, can expressed as follows:
where x and y are two different factor profiles expressed in relative mass, and m, the number of common species in x and y, is evenly sensitive to every species since it includes a normalization term.
2.4 OP apportionment
The computation was done thanks to the statsmodels 0.12 python package (Seabold and Perktold, 2010), and the graphics were produced with matplotlib 3.3.1 (Hunter, 2007; Caswell et al., 2020) and seaborn 0.11 (Waskom, 2021).
2.4.1 Apportionment using multilinear regression (MLR)
MLR was conducted independently at each site, with results from the two (DTT and AA) OP assays being the dependent variables and the source contributions obtained from the PMF being the explanatory variables, following the equation (Eq. 4), similarly to Weber et al. (2018):
where OPobs is a vector of size n×1 of the observed or in , G is the matrix () of the mass contribution of PM sources obtained from the PMF in µg m−3 and a constant unit term for the intercept (no unit), β are the coefficients (i.e., intrinsic OP of the source and the intercept) of size () in for the intrinsic OP and in for the intercept. The residual term ε (n×1) accounts for the misfit between the observations and the model.
The intercept was not forced to zero on purpose. Indeed, if the system is well constrained, the intercept should spontaneously be close to zero, and conversely a non-zero intercept would point out missing explanatory variables.
A weighted least-square regression (WLS) was finally used to consider the uncertainties of the OP measurements. The uncertainties of the coefficients β given by the MLR were estimated by bootstrapping the solutions 500 times, randomly selecting 70 % of the samples each time to account for possible remaining extreme events or seasonal variations of the intrinsic OP per source. The uncertainty of the PMF result G was however not considered because the EPA PMF software only returns to the user the uncertainties associated with the profile matrix F (see Weber et al., 2019, for a first-order estimation of the G uncertainties).
2.4.2 Contribution of the sources to the OP
The contribution GOP in of the sources to the OP was computed at each site independently and was calculated following Eq. (5):
where k is the source considered, G the PMF sources' contribution in mass concentration (µg m−3) and β the intrinsic OP of the sources in . The uncertainties of GOP were computed using the uncertainties of β estimated from the 500 bootstraps.
2.5 Focus on the main PMF factors
This study focuses on the main drivers of OP at the regional scale. For this reason, we decided to include in the main discussion only the PMF factors identified in at least two-thirds of the series (i.e., 10 out of 15 series), namely, the aged salt, biomass burning, dust, MSA-rich, nitrate-rich, primary biogenic, primary road traffic and sulfate-rich factors. However, the remaining sources, often local, barely contributed to the total PM mass, and important uncertainties were often attached to them. The only notable exception is the HFO (heavy fuel oil) profile identified at some coastal sites, discussed hereafter in its own section.
As a large set of results has been obtained in the present study and cannot be exhaustively presented here, an interactive visualization tool providing details on PM and OP source time series and apportionment outputs is available online at http://getopstandop.u-ga.fr/ (last access: 27 July 2021, and also http://pmsources.u-ga.fr, last access: 27 July 2021, for the chemical part of the SOURCES ones) and is proposed as the Supplement of this paper including all factors for all series.
Note that, since there are more samples where PMF has been run compared to available OP measurements (around 1700 concomitant OP and PMF samples compared to 2048 samples with a PMF solution), the discussion hereafter on the source contributions to the OP takes into account the whole PMF analysis, including days when models were not trained but predicted by the above-mentioned approach.
3.1 PMF results
In this section, we summarize the main results acquired from the harmonized PMF approach conducted for the present paper, but we invite the reader to refer to the previous study (Weber et al., 2019) and to the website to have a more complete view of the results.
3.1.1 PMF source apportionment
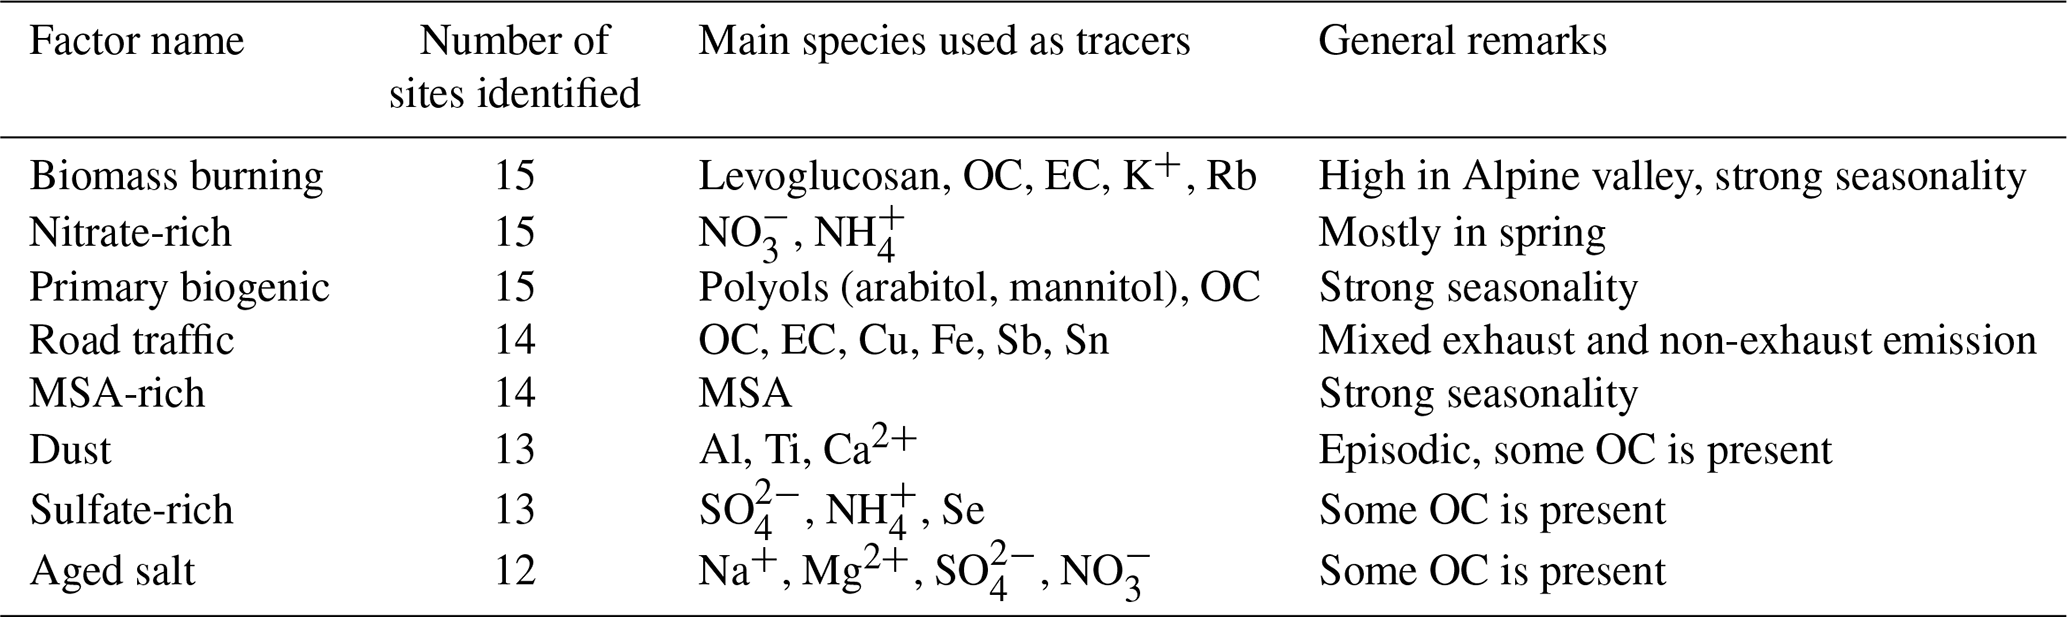
The list of the identified factors at each site is given in Table S3, and individual profiles and time series together with uncertainties can be found at http://getopstandop.u-ga.fr/results?component=pmf_profile_and_contribution (last access: 27 July 2021). Table 1 summarizes the main PMF factors found at least at 10 out of the 15 series. Shortly, we obtained PMF factors corresponding to biomass burning (mainly from residential heating), primary road traffic, mineral dust, secondary inorganic nitrate-rich and sulfate-rich, salt (fresh and aged) as well as primary biogenic and MSA-rich. Some other local sources were also identified at some sites, targeting some local heavy-loaded metal sources with a very low contribution to the total PM mass – supposedly linked to the industrial process – which contained a wide variety of chemicals but shared a common set of metals (Al, As, Cd, Mn, Mo, Pb, Rb, Zn). Finally, a factor related to shipping emission (namely, HFO) was obtained at some coastal sites.
Table 1Main PMF factors identified (at least at two-thirds of the series, i.e., 10 out of 15) and species used as proxies for the determination.
3.1.2 PMF similarities between sites
The similarities between chemical profile composition estimated by the PD and SID metrics are presented in Fig. S2. We observed a strong similarity for the main sources of PM, namely, biomass burning, nitrate-rich, primary biogenic, sulfate-rich and to a lesser extent road traffic. The dust, aged salt and MSA-rich were often identified and presented acceptable SID but also showed large values for the PD metric. As the PD is sensitive to “extreme points”, this translates in our case to different contributions for the chemical species contributing most to the PM mass (mainly OC and EC). MSA-rich is the most variable factor, and a detailed analysis of its chemistry profile indicated many differences from site to site for the concentrations of EC but also and . This factor being essentially a secondary organic factor, this variability may be explained by different formation or evolution pathways or different levels of aging. We can also point out that the industrial source had a very diverse chemical composition since it is related to different local industrial processes.
Nevertheless, the geochemical stability of the majority of PMF factors on a regional scale allows us to consider that these emission sources are rather homogeneous over France.
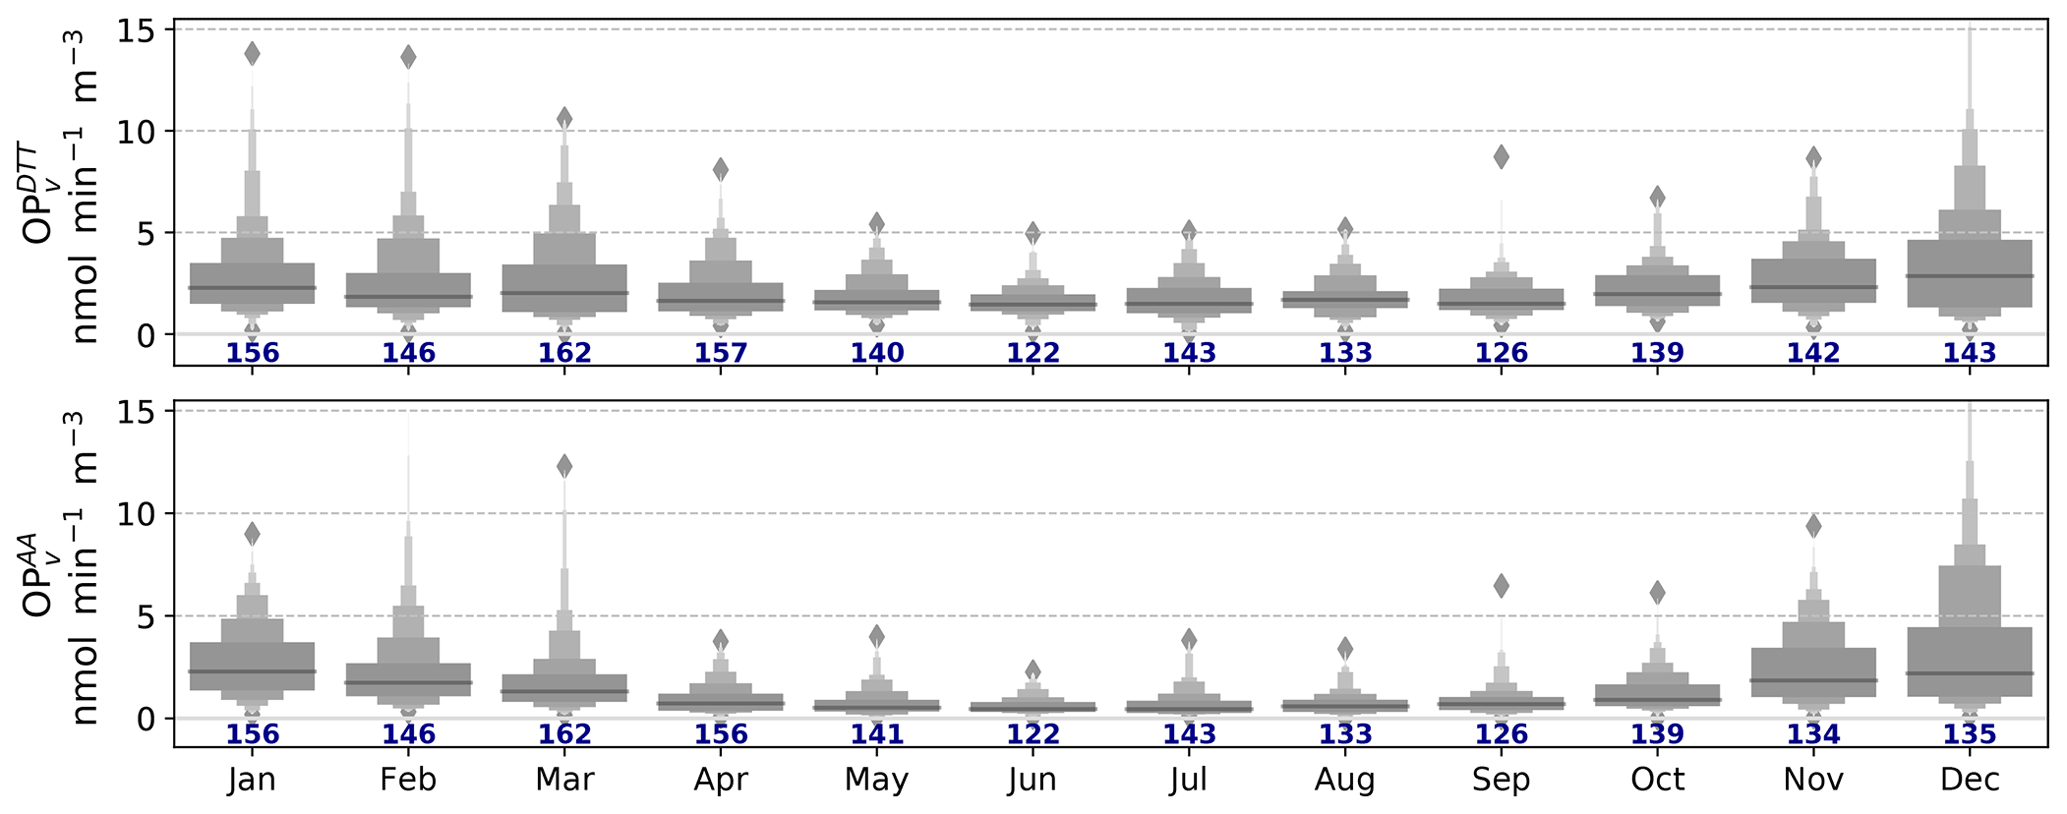
Figure 2Box plot of and seasonal values. The numbers in the x axis indicate the number of observations. Each box represents one decile, and the black horizontal lines indicate the median of the distributions. Some values greater than 15.5 are not displayed for graphical purposes.
3.2 OP results and seasonality
The 15 time series for both OPDTT and OPAA at each site are presented on the website (http://getopstandop.u-ga.fr/results?component=rd_ts, last access: 27 July 2021). A monthly aggregated view is given in Fig. 2 for and , respectively. As the dataset covered complete full years, including the influence of different PM sources with different seasonal activities, the results obtained are representative of spatio-temporal patterns of the OPs at least over France and probably over large parts of western Europe.
As reported previously by Calas et al. (2018, 2019), we observed a seasonality of both and , with higher OP values during the colder months (October–March) compared to the warmer months (April–September). We also noted that during the winter period, the statistical distribution of OP values did not follow a normal distribution, and a significant variability was observed. This was especially the case for the sites located in the Alpine area (GRE-fr, GRE-cb, VIF, CHAM, MNZ, PAS) showing stronger seasonality compared to the other locations. Such specificity was already reported previously by Calas et al. (2019) together with some rapid variation of the OPDTT and OPAA, with drastic increase or decrease within the time frame of a few days, similarly to the PM10 mass concentration. This behavior may be related to the formation of thermal inversion layers in such valleys, leading to the accumulation of pollutants and the promotion of the secondary processes inducing increased formation of secondary organic aerosol (SOA) and of key organic species, like polyaromatic quinones (Albinet et al., 2008; Tomaz et al., 2017; Srivastava et al., 2018) or humic-like substances (HULIS) (Baduel et al., 2010) with a significant impact on the OP.
Several sites exhibit much lower seasonality in the OP values, especially traffic sites (RBX and STG-cle), the urban traffic site (NIC), or the industrial one (PdB). The lack of seasonality for some sites excludes the hypothesis of the OP being driven only by synoptic meteorological parameters such as sunshine or temperature, as it would impact all the sites similarly. It is clearly the difference in PM chemical compounds and reactivity, together with the timing of emission, that induces the seasonality of OP values when it is observed.
For comparison with previous studies, the Spearman correlation between chemical species, source contributions and OPs is also reported in Appendix A of this paper.
3.3 Results of OP models for the main PMF sources
3.3.1 Model accuracy and linear limitation
The MLR statistical validation was carried out by a residual analysis between the OP observed and the OP reconstructed by the model. For this evaluation, the intrinsic OP of the sources was set to the mean of the 500 bootstrap values. All but two sites present a very good correlation between observed and reconstructed OP (r2>0.7) and a regression line close to unity (see Table S4; details and individual scatter plots are given at http://getopstandop.u-ga.fr/results?component=op_obsvsmodel, last access: 27 July 2021). We therefore consider our models valid, and each intrinsic OP (i.e., coefficient of the regression) may be explored individually to geochemically explain the observed OP.
However, despite our models being able to reproduce most of the observations with normally distributed residuals, it also tends to underestimate the highest values, and the residuals are often heteroscedastics (i.e., the higher the values, the higher the uncertainties). Then, the underlying hypothesis of linearity between endogenous variables (PM concentration of the sources) and exogenous variables (OPs) may be deemed invalid. It is also important to note that nonlinear processes are strongly suspected of the source apportionment of OP, as already noted by Charrier et al. (2016) or Calas et al. (2018) and Samaké et al. (2017). As a result, future development on OP apportionment models should focus on this suspected nonlinearity, either by introducing covariation terms or using nonlinear models such as neural networks, for instance (Borlaza et al., 2021b).
3.3.2 Intrinsic OP of the main PMF sources
Even if the models reproduce the observations correctly, this does not guarantee that the geochemical meaning extracted is the same for each of the models; i.e., the intrinsic OPs of the sources may completely differ from site to site. The question is then to identify whether a given source contributes similarly to the OP at all the sites. In other words, do all the models extract any general geochemical information relative to the OP?
Figure 3 presents the intrinsic OPDTT and OPAA for the selected subset of sources in terms of median and interquartile range (Q1 and Q3) to investigate the general information given by the different model. The values of mean and standard deviation and details per station for all sources are given in Tables S5–S7.
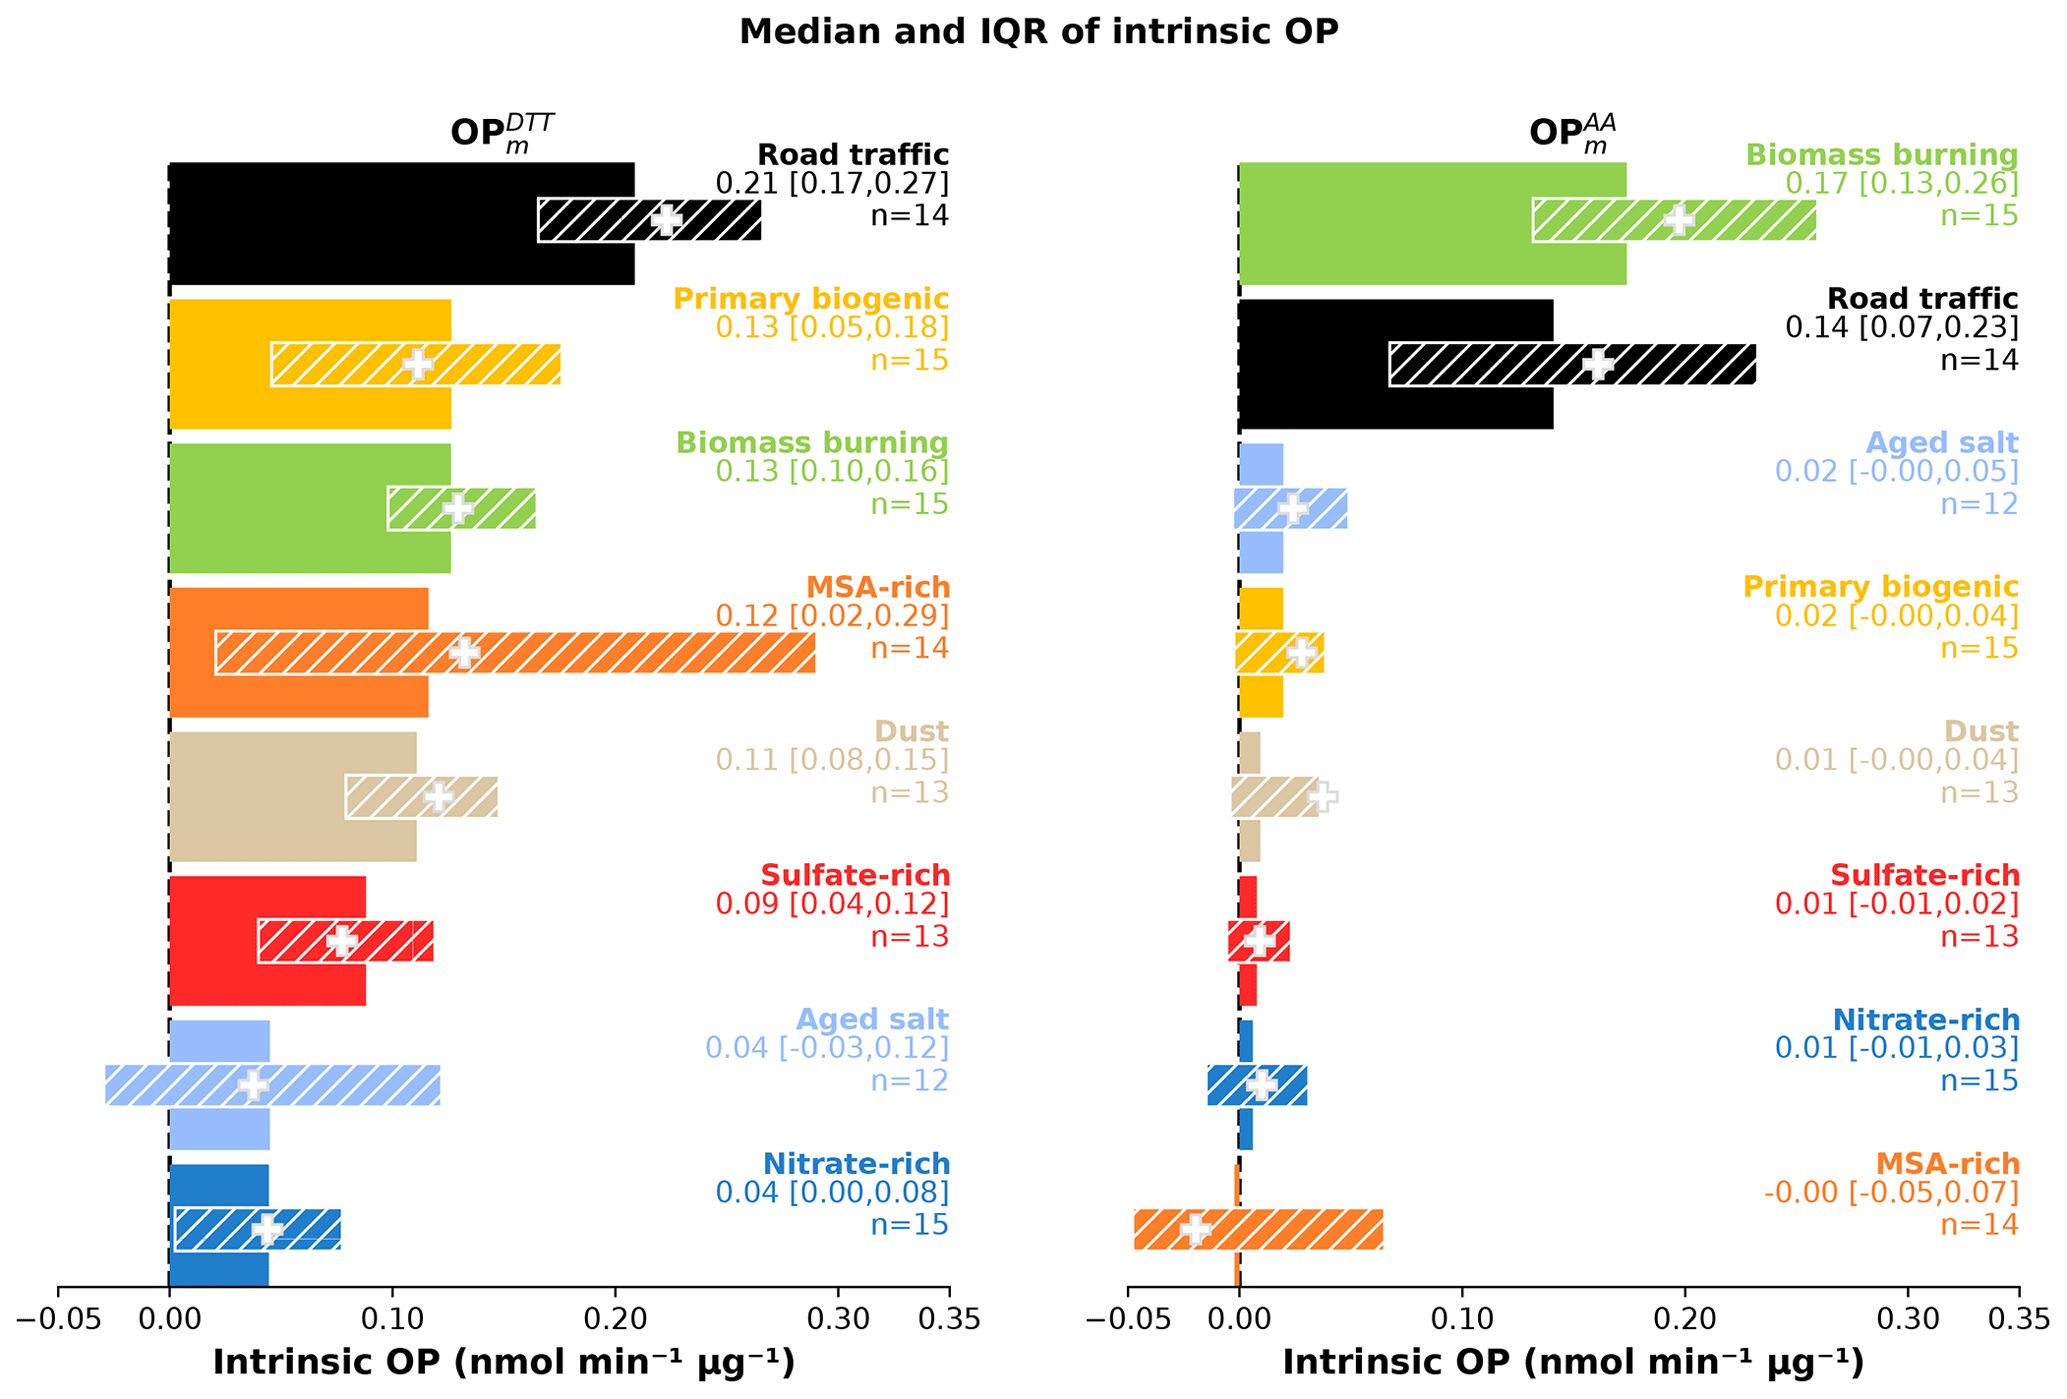
Figure 3Median and interquartile range (solid bars and values in the figure) and mean (cross) of intrinsic OPDTT and OPAA values for the sources identified for at least two-thirds of the site (i.e., 10 series). The number of data considered are n×N, with n the number of series where the source was identified and N=500 bootstraps: Road traffic: 7000, biomass burning: 7500, dust: 6500, primary biogenic: 7500, nitrate-rich: 7500, sulfate-rich: 7500, MSA-rich: 7000, aged salt: 6000. The values of means and standard deviations for each site are given in the Supplement.
For most of the sources identified, positive intrinsic OP values were observed considering the whole dataset. Small negative median values were only observed for the MSA-rich factor for the AA assay associated with large variance. Such results highlighted again that airborne particles, whatever their sources of origin, have significant oxidative properties.
We also observed a clear distinction between the intrinsic OP values for the different PM sources, with the median ranging from 0.04 to 0.21 for the OPDTT and from −0.00 to 0.17 for the OPAA. Such results agree with previous studies reporting different reactivities (or intrinsic OPs) for different sources based on receptor-model techniques (Ayres et al., 2008; Bates et al., 2015; Cesari et al., 2019; Costabile et al., 2019; Fang et al., 2016; Paraskevopoulou et al., 2019; Perrone et al., 2019; Verma et al., 2014; Weber et al., 2018; Zhou et al., 2019; Daellenbach et al., 2020).
Concerning the difference between the two tests, a road traffic source is the most reactive source towards OPDTT, with a value of about 0.21 . Such a value is almost twice as high as the ones observed for other significantly reactive sources, namely, primary biogenic sources (0.13 ), biomass burning (0.13 ), MSA-rich (0.12 ), mineral dust (0.11 ) and sulfate-rich (0.09 ). Based on the intrinsic OPAA results, a small number of PM sources shows significant redox activity, as already pointed out in previous studies (Bates et al., 2019, and references therein). Only the biomass burning and road traffic sources show intrinsic OP values significantly higher than 0 (0.17 and 0.14 , respectively). Overall, the OPDTT is sensitive to more sources than the OPAA, as already pointed out by Fang et al. (2016) and Weber et al. (2018), and seems to target all the sources containing either metals or organic species. However, it is not sensitive to the nitrate-rich source.
We then confirm what previous studies found for these two assays, either by direct OP measurements at the emission source or by source apportionment. It is however hard to directly compare the absolute values from our results to the literature since the measurement protocols used are highly variable from one study to another.
3.3.3 Profile of intrinsic OP sources
The coefficients of variation (CVs, standard deviation over the mean) of the intrinsic OPs are lowest for the biomass burning and primary road traffic for the DTT assay, with values of 0.50 and 0.38, respectively, as well as for the AA assay with values of 0.52 and 0.67, respectively. However, since several intrinsic OPs are close to 0, the interquartile range (IQR) is also used to quantify the variability of intrinsic OP.
Biomass burning
The variability of the biomass burning intrinsic OP is somewhat site-dependent, with a low uncertainty within a given site but with slightly different intrinsic OPs between sites. This suggests that the variability is not linked to uncertainties of the MLR but may be due to actual local variations of the chemical composition of this profile.
This result contrasts with the fact that the biomass burning was identified as displaying relatively homogeneous chemical profiles between site profiles, with PD < 0.1 and SID < 0.7 (Fig. S2). Actually, the variability of OP-intrinsic values may be related to species that are not directly measured in our dataset. That is, polycyclic aromatic hydrocarbons (PAHs), oxy-PAHs, OH-PAHs, nitro-PAHs and especially polyaromatic quinones could not be measured at each of the sites used in the present study. These compounds are known to generate ROS and to contribute to the OP (Bolton et al., 2000; Charrier and Anastasio, 2012; Chung et al., 2006; McWhinney et al., 2013; Lakey et al., 2016; Jiang et al., 2016; Tuet et al., 2019; Gao et al., 2020; Bates et al., 2019), have short lifetimes and are heavily influenced by the climatic condition (Miersch et al., 2019). Similarly, the importance of the HULIS fraction within different biomass burning emissions might play a role in OP variability.
Road traffic
For the DTT assay, the uncertainty of the road-traffic-intrinsic OP at each site lies in the uncertainties of the other sites (but one, CHAM). Then, even if known with some uncertainties, these sources behave similarly at a large scale with regard to the OPDTT and represent the most redox-active source.
For the OPAA, even if the CV is one of the lowest due to the high intrinsic OP of this source on average, the IQR is high. The different MLR models do not agree on a common intrinsic OP, with values ranging from 0.02 to 0.35 , without clear distinction by typology or groups of sites.
The chemical profile of the road traffic presents noticeable variability between sites, and no distinction between exhaust and non-exhaust emission is available with the current PMF analysis. Although all the profiles agree with a high loading of metals (notably Cd, Cu, Fe, Mo, Sb, and Sn) and organic carbon, the exact amount per microgram of PM differs from site to site (http://getopstandop.u-ga.fr/results?component=pmf_profiles, last access: 27 July 2021).
Also, the higher variability of the AA test outputs, compared to the DTT, suggests that some chemical species that are not measured here may influence more the OPAA than the OPDTT of vehicular emissions, as for biomass burning aerosols. These unmeasured species might vary in terms of loading between sites due to the different traffic-related sources, notably the extent of SOA or that of exhaust and non-exhaust emissions, which could have a high impact on OP, as shown by Daellenbach et al. (2020).
Nitrate-rich
The nitrate-rich factor, one of the most stable factors in terms of chemical fingerprint, is mainly composed of nitrate and ammonium, and very low amounts of OC or metals are present. At some sites, sulfate is also partly apportioned in this factor. Since nothing of this species is known to contribute to the OP, this factor presents logically almost null intrinsic OP for both assays.
Interestingly, this factor correlates fairly well with OPDTTv (r=0.43) but is associated with the lowest intrinsic OPDTT value (0.04 ). This emphasizes the need to apply a relevant technique for OP source apportionment, beyond simple correlation.
We then confirm previous analysis of the low impact of secondary inorganic aerosols (SIA), at least for the nitrate part, on OP measurement (Daellenbach et al., 2020) in favor of the subsequent moderate role of SIA in human toxicity (Cassee et al., 2013).
Sulfate-rich
Similarly to the nitrate-rich factor, this secondary inorganic factor displays rather stable chemical composition at all the sites. It is mainly composed of sulfate and ammonium but also organic carbon (between 5 % and 33 % of total OC*) and Se. The latter two species present some site-to-site discrepancies, and it should be mentioned that, when adding complementary organic markers such as 3-MBTCA to some sets of PMF input data, the sulfate-rich factor has been shown to split into two factors, revealing a biogenic SOA factor (Borlaza et al., 2021a). Without these molecular markers, such mixing in the present study might explain a fraction of the variability of the OC apportioned and then of the intrinsic OP.
Interestingly, this factor does present an intrinsic OP for the DTT assay but almost none for the AA assay. Then, most probably the OC* apportioned in this factor affects only the DTT assay and not the AA one, which contrasts with the biomass burning and road traffic sources (see above).
Mineral dust
The mineral dust displays a rather low variability when considering all datasets, but a deeper analysis showed two groups of sites: AIX-RBX-VIF vs. all other sites. The first group presents a high intrinsic OP for both assays (around 0.25 OPDTT and 0.16 from OPAA), whereas sites from the second group display halved (around 0.1 for OPDTT) or almost null (OPAA) intrinsic OPs.
A first conclusion is that 80 % of the sites present a common intrinsic OP for the dust source, hence the low IQR observed for this source. This factor apportions some OC* but most of the Ca2+, Al, Co, Cs, Mn and Sr. Then, none of these species appear to present intrinsic redox activity for the AA assay. It is not clear however whether the DTT is reacting with the organic species, with the metals, or both.
The differences between the two groups of sites may be further explained by difference in the chemical profile of the PMF factors. Indeed, since the dust factor at VIF highly differs from the other dust factors with PD > 0.75 (mostly due to a very low amount of OC*) when compared to the other sites, we expect to have different intrinsic OPs. The biggest difference between VIF and other sites for the dust factor relies on the very low amount of PM apportioned in this factor, linked with important uncertainties. It is then expected that this factor will present an uncertain intrinsic OP for this source at this site.
For the sites of VIF, AIX and RBX, it appears that they also have higher loading in metals compared to other sites. Also, all three sites have important uncertainties associated with different metals (notably Cu, Sn or V; see http://getopstandop.u-ga.fr/results?component=pmf_unc, last access: 27 July 2021). Finally, it is also hypothesized that unmeasured trace species might be responsible for these differences, possibly coming from road dust resuspension and/or secondary processes leading to oxy-PAHs (Ringuet et al., 2012a, b) or HULIS (Srivastava et al., 2018).
MSA-rich (secondary organic aerosols)
It has been shown that biogenic SOA species generally contribute to the OPDTT or to the generation of ROS (Jiang et al., 2016; Tuet et al., 2017b; Park et al., 2018; Kramer et al., 2016; Manfrin et al., 2019). In our study, the MSA-rich factor is the only one strictly included in this category. However, the intrinsic OP of the MSA-rich source presents high variability between sites, with CVs of 3.1 and 7.8 for the DTT and AA assays, respectively, and the highest IQR, all sites combined, with no consistent similarity by typology or proximity. For instance, GRE-cb and VIF are within 15 km with similar sampling periods but present, respectively, the highest and lower intrinsic OPDTT for this factor. We also observe important variability within each MLR model result at every site. This secondary organic source appears to be the most variable source in terms of intrinsic OPs, notably for the DTT assay.
The MSA-rich factor is identified thanks to a single marker (MSA), and very few studies only have reported it so far (Srivastava et al., 2019; Lanzafame et al., 2020; Borlaza et al., 2021a). As a result, we do not know for instance the loading of HULIS, quinone or isoprene-derived compounds contained in this factor nor the amount of aging it presents at each site. The exact primary sources or processes leading to this factor are still under discussion for non-Arctic regions (Golly et al., 2019). Hence, these uncertainties in the additional chemical compounds included in this factor, despite the excellent tracer capability of the MSA itself, might explain the diversity of its observed intrinsic OPs.
Moreover, this factor represents a low amount of PM mass. Its important uncertainties apportioned by the different PMF for this factor (between 0.7 % and 5.5 % of the total PM10 mass) make it unclear whether the variability is mainly due to the sources' chemical component variability or to the inversion method used. Hence, we prefer not to conclude a clear effect of this source on the OP.
Primary biogenic organic aerosols
The primary biogenic source, mainly traced by polyols, presents some variability for the OPDTT. Samaké et al. (2017) highlighted that spores or bacteria do contribute to the OPDTT and OPAA activities, even when the microbial cells are dead. However, the authors also present the inhibition of the DTT loss rate in the presence of 1,4-naphthoquinone or Cu. The presence of both synergistic and antagonistic effects between species and microbiota might explain the variability of intrinsic OPDTT observed in Fig. 3, reflecting the different local microbiology carried by the PM, or covariations of the primary biogenic source with other metals or quinone-rich sources for instance.
Another hypothesis to explain the variability of the intrinsic OPs might be the “aging” of this factor, since Samaké et al. (2019b) pointed out that some secondary species may be incorporated in this factor at some sites, possibly making it a mix of primary biogenic and SOA (see also Waked et al., 2014). SOA mixed in the primary biogenic factor may then influence the intrinsic OP of this factor in different ways, similarly to our hypothesis for the MSA-rich factor.
Aged salt
Being mostly composed of Cl−, , , Na+ and Mg2+, this factor barely reacts with anti-oxidants (in both the DTT and AA assays). However, the variability observed for this factor is suspected of coming from the aging process, leading to the aggregation of organic compounds (between 0 % and 9 % of the total OC* apportioned in this factor).
Local PMF factors
Some other factors were obtained in a limited set of PMF outputs, and their chemical profiles are somewhat variable. It is however interesting to discuss their local impact on OP.
The HFO source is identified at MRS-5av and PdB, both sites being located close to harboring activities in large ports on the Mediterranean coast. It presents an intrinsic OPDTT of 0.51±0.14 and 0.21±0.04 , respectively, and an intrinsic OPAA of 0.04±0.02 and 0.11±0.03 , respectively. The intrinsic OPDTT is then on average higher than the road traffic one, making HFO the second contributor of the daily mean and median source contribution at MRS-5av for the OPDTT contribution and the fourth one for the OPAA contribution (see the website). For the PdB site, the contributions are a bit lower. Although only two sites presented an HFO factor, and similarly to previous studies (Hu et al., 2008; Kuang et al., 2017; Moldanová et al., 2013; Mousavi et al., 2019; Wang et al., 2020), it suggests that the PM that originated from this source may significantly contribute to the total OP in and around harbor cities.
For the industrial factor, and as already stated, the chemical composition profile highly varies from site to site for the six sites where it is determined. As a matter of fact, the intrinsic OPs of this profile are also highly variable. The intrinsic OPDTT are high for GRE-cb and GRE-fr_2017 (0.52±0.30 and 0.37±0.27 , respectively), as are the intrinsic OPAA (0.82±0.29 and 0.61±0.17 , respectively). However, both are close to 0 for the other sites where this factor is found (PdB, AIX, TAL and VIF). The high intrinsic OP again suggests the role of metals in the OP of PM; however, since this factor has strong uncertainties associated with the PMF results and then with the intrinsic OP, further work on the source profiles is needed to draw firmer conclusions.
Overall geochemical agreement
Finally, despite the differences within PMF solutions from one site to another, including the slightly different number of source factors and the different OP signals, the rather low variability of the intrinsic OP determined for a given source suggests that most of the sources of PM behave coherently with regards to the OP over a large geographical area in France. It then supports the idea that, at the national scale, the sources described above have a rather stable intrinsic OP. We also stressed the importance of the underlying source apportionment method (here the PMF) and the investigation of its uncertainties in order to interpret the variabilities of the intrinsic OP.
3.4 Contribution of the sources to the OPs
The relative importance of the contributions of the sources to the total PM10 OPs is weighted by their different intrinsic OPs. The question, therefore, is to what extent the contributions of the sources to the OPs differ from their contributions to the PM mass concentration. In this part, we present an aggregated view of the seasonal contribution of the sources to the OP in Fig. 4 and the daily contribution in Figs. 5 and 6, considering all sites. Details per sites are presented in the website provided herewith as the Supplement.

Figure 4Mean monthly contribution of the eight main sources to the (a) PM10 mass, (b) and (c) , taking into account each source contribution of every site; their respective normalized contributions are presented in (d) PM10 mass, (e) and (f) .

Figure 5Averaged daily contribution of the sources to (a) the PM10 mass, (b) the and (c) the . The bars represent the mean, and the error bars represent the 95 % confidence interval of the mean.
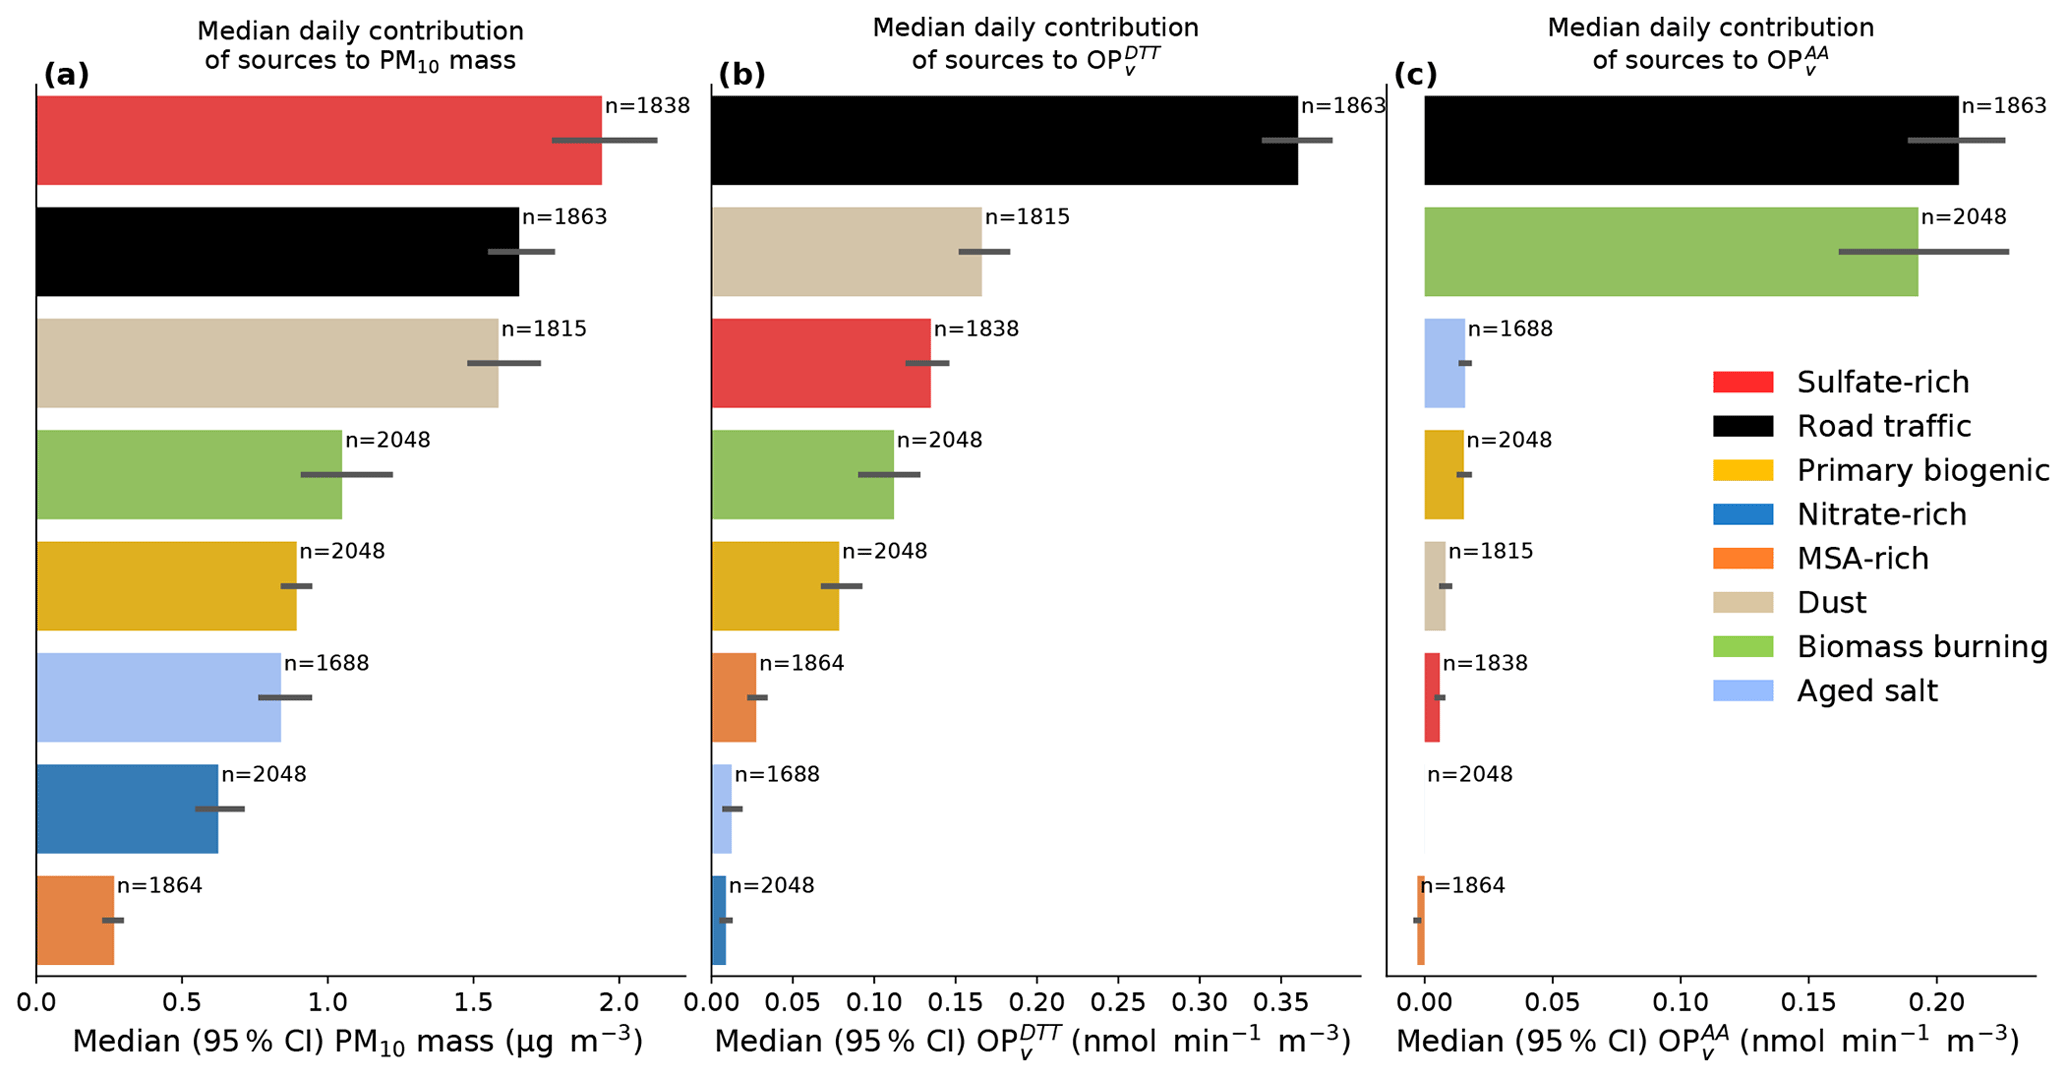
Figure 6Median daily contribution of the sources to (a) the PM mass, (b) the and (c) the . The bars represent the mean and the error bars represent the 95 % confidence interval of the median.
We would like to stress here that our dataset included an important proportion of Alpine sites as well as urban sites. Then, the extrapolation to the whole of France or to other regions of western Europe should be done cautiously.
3.4.1 Seasonality of the contribution by mass or OPs
As already shown by some previous studies in France (Petit et al., 2019; Srivastava et al., 2018; Waked et al., 2014; Weber et al., 2019; Favez et al., 2021), the seasonal mean contributions to the PM10 mass show the importance of the biomass burning source, followed by secondary inorganic (sulfate-rich and nitrate-rich), dust and road traffic. As a direct consequence of the different intrinsic OPs for these sources, we do observe a redistribution of their relative importance for the total OP. That is, the nitrate-rich source that may contribute a significant amount to the PM10 mass, notably in spring, barely contributes to the or to the , in agreement with Daellenbach et al. (2020). Conversely, the road traffic contributes about 15 % during summer to the mean PM10 mass but represents more than 50 % of the mean in the same period (Fig. 4d–f). However, the biomass burning sources are still major contributors to both the and during the winter months. We note that the primary biogenic source also contributes to the but to a lesser extent to the . Finally, the dust source is an important contributor to the but not to the . These results confirm and extend what previous studies have already found (Cesari et al., 2019; Daellenbach et al., 2020; Weber et al., 2018). Overall, the main contributors to OPs are the three factors suspected of including anthropogenic SOA (biomass burning, road traffic and dust, including possible resuspension of road dust for the latter one). It follows that, considering the seasonality of OPs, regulations should target the biomass burning emission in order to decrease the PM10 OPs during winter by a large amount but also the road traffic that contributes homogeneously to both OPs around the whole year.
3.4.2 Daily mean and median contribution: insights for exposure
A concise view of the same results, this time on the daily-aggregated basis, is provided in Figs. 5 and 6, presenting the contributors to PM10 mass and OPs, ranked in decreasing order. Figure 5 reports the typical “mean” daily value, a parameter generally used in the atmospheric community, while Fig. 6 reports the “median” daily value, often used in epidemiological studies in order to discuss the chronic exposure of the population and avoid the high impact of infrequent low or high events that highly influence the mean value.
Due to the non-normality of the contribution and the high contributions of some sources at some sites (for instance, the biomass burning source in Alpine valleys), the results highly differ when considering the mean or the median contributions, and the two statistical indicators may not address the same questions (the mean is more related to the identification of the major source contributors and the median to the exposure of the population). The skewness of the distribution is not surprising as some high-PM10 events (i.e., a short time event in the dataset) were present in our measurements. This is also specifically anticipated in Alpine areas (CHAM, PAS, MNZ, VIF, GRE-cb, GRE-fr_2013 and GRE-fr_2017), where the frequent development of atmospheric thermal inversion layers in winter is causing increased pollutant concentrations.
We observed (Fig. 5) a redistribution of the daily mean contribution sources' rank between the PM10 mass, and similarly to the monthly mean contribution discussed above. The biomass burning source, being an important contributor to the PM10 mass, contributes also significantly to both OP and is ranked as the first contributor to both and mean daily contribution (mean 0.51 and 0.72 , respectively). The road traffic source contribution, due to its highest intrinsic OP in both assays, presents almost the same daily mean contribution as the biomass burning for the and is the second contributor to the daily mean , with half the contribution of the biomass burning (mean 0.50 and 0.34 , respectively). The other sources barely contribute to the (<0.1 ). For the , the dust is the third contributor (mean 0.34 ), followed by sulfate-rich and primary biogenic (0.23 and 0.16 , respectively). The nitrate-rich, aged sea salt and MSA-rich present a low contribution (mean <0.1 ) due either to their low intrinsic OP or to their low contribution to the PM mass.
However, for the daily median contribution, due to the high seasonality of the biomass burning source and the consistent contribution throughout the year of the primary road traffic, sulfate-rich and dust sources, the ranks of the sources are drastically redistributed between the three metrics considered (Fig. 6). Moreover, the absolute values of the contributions are also lowered compared to the mean daily contribution due to low frequencies of highly loaded PM events. The major source contributing to the is now the primary road traffic (median 0.36 ), contributing more than twice as much as the second source, namely, the dust one (median 0.16 ), followed by sulfate-rich (median 0.13 ) and then biomass burning (median 0.11 ). For the , the two dominant sources are the primary road traffic (median 0.29 ) and the biomass burning (median 0.19 ), all other sources being now negligible (aged salt 0.016 , primary biogenic 0.015 and the others contributing less than 0.01 ).
The high differences between the mean and median contributions could have strong implication for air quality policies. Indeed, as previously shown, the biomass burning may contribute more than 50 % of the high OPs during winter, and even more for some days. However, such events do not represent well the daily exposure of the population over the full year. Even if the regulations should target those events to prevent acute exposure, they should also strongly take into account the long-term exposure to a lower but constant level of pollutant, since there is no threshold below which PM is no longer harmful (World Health Organization, 2013). In this respect, the emissions from the road traffic become a major concern as well, showing that this source might actually be the most important one to be targeted in order to decrease adverse health effects due to chronic exposure to PM pollutants.
In this study, we focused on major sources and trends and hence limited our study to some aspects. Notably, the PMF standardized approach allows common source identification at the national scale but may also damper some site specificities. Also, the choice to focus on the main sources of PM and to discuss the aggregated results shortens the discussion on some local specificity, notably potential local sources that contribute to the OP (for instance HFO or industry) and that may be relevant for some sites but that are not applicable to a wider area.
One main limitation is also the use of linear regression tools, whereas it has been shown that OP is not fully proportional to the mass of compounds. The residual analysis seems to agree with this experimental finding since the highest OP samples are underestimated by the MLR model. The addition of a covariation term or even the use of nonlinear regression may be the next step to better explain the OP of the sources (Borlaza et al., 2021b).
Moreover, if the intrinsic OP results from the MLR can be extrapolated to any given site with a similar regional background to the urbanized area used in this study, the source contribution extrapolation should be taken cautiously since our dataset displays an over-representation of the Alpine sites with regard to the whole of France.
To our knowledge, this study gathers the most important database of OP samples, with concomitant observations of chemistry analysis, source apportionment through PMF, and the measure of two OP assays (DTT and AA) for 15 yearly time series over France spanning between 2013 and 2018 for a total of >1700 samples.
We demonstrated that source apportionment of OP through a “simple” multilinear regression without any constraint on the coefficient provides good statistical results and can explain the observed and .
-
The intrinsic OPs of the main regional sources present values in the same range at each site, especially for the primary road traffic, biomass burning, nitrate-rich, dust, and sulfate-rich PMF factors. Biogenic and MSA-rich factors present higher discrepancy according to the site together with the highest uncertainties at each site.
-
Some site-specific sources might have an important intrinsic OP and can account for a non-negligible part of the observed OP (notably in harbor cities or near industrial sites).
-
Different sensitivities for the two OP assays to a given source are highlighted. The DTT appears to be sensitive to a wide range of sources, whereas the AA targets mainly the biomass burning and primary road traffic factors.
-
With consistency at the regional scale, the primary road traffic and biomass burning factor are the main absolute OP contributors, together with dust and secondary sulfate for OPDTT to a lesser extent. Conversely, the nitrate-rich factor barely contributes to OPs.
-
In order to assess the chronic population exposure, the median daily contributions of sources to the and are also reported and present important differences in ranking compared to the mean contributions. The importance of the primary road traffic source drastically increases, notably for the , whereas the biomass burning contribution is lowered. However, only the road traffic and biomass burning sources contribute to the daily median of the .
Finally, the relatively stable intrinsic OP at a large geographical scale for the main PM sources allows future work on the implementation of the OP in the regional chemistry transport model. This step would allow a quantitative estimation of the population exposure OP, expanding potential cross-over studies with epidemiology.
The Spearman correlations between the chemical species and and are presented in Fig. A1, while the Spearman correlations between the source mass apportionment from the PMF and the measured and are presented in Fig. A2. All samples from all sites were considered in the results presented here.
First, we can see that both OP assays correlated well with each other () but do not present an exact similitude. Notably, the OP has stronger seasonality than OP, and higher correlations are found during winter than summer. Details of the individual time series are given on the website.
Second, the only source that strongly correlates with one OP (r>0.6) is the biomass burning with the . Some low to mild correlations () are found for the vs. road traffic, biomass burning, nitrate-rich and dust and for the vs. nitrate-rich and road traffic. The copper, mostly apportioned by the road traffic, is the most correlated metal with the OP and the second for OP. For the levoglucosan and mannosan, strong correlations are found with the OPAA. These results are in agreement with previous studies, either with the source correlation (Weber et al., 2018) or with the proxies of sources (namely, levoglucosan for biomass burning and EC, and iron, copper or PAH for road traffic) (Fig. A1 and Calas et al., 2018, 2019; Charrier and Anastasio, 2012, 2015; Cho et al., 2005; Hu et al., 2008; Janssen et al., 2015; Künzli et al., 2006; Ntziachristos et al., 2007; Pietrogrande et al., 2018; Verma et al., 2009, 2014, 2015a; Borlaza et al., 2018).
Figures A1 and A2 also indicate that the nitrate and nitrate-rich source concentrations mildly correlate with both OPs. However, neither nitrate nor the chemical species included in the chemistry profile of the nitrate-rich source present redox-active capabilities. Conversely, crustal elements (mainly Ti and Ca2+) present no to low correlation with OPs. Although mineral dust has been reported to contribute to the OP, the episodic event of Saharan wind may be insufficient to be reflected in the simple r2 value. Also, as already stated, the strong seasonal cycle leads to negative correlation between some sources or species and the OP (MSA or polyols species and MSA-rich and primary biogenic factors). When considering only the warm period, they appear positively correlated with both OPs due to the exclusion of the strong impact of the biomass burning source (not shown here).
These examples indicate that it is hard to assess robustly the links between OPs and chemistry when using only correlations. Moreover, even a good correlation may not reflect any causality, and the multilinear regression should disentangle possible covariation due to meteorological effects (accumulation or long-range transport).
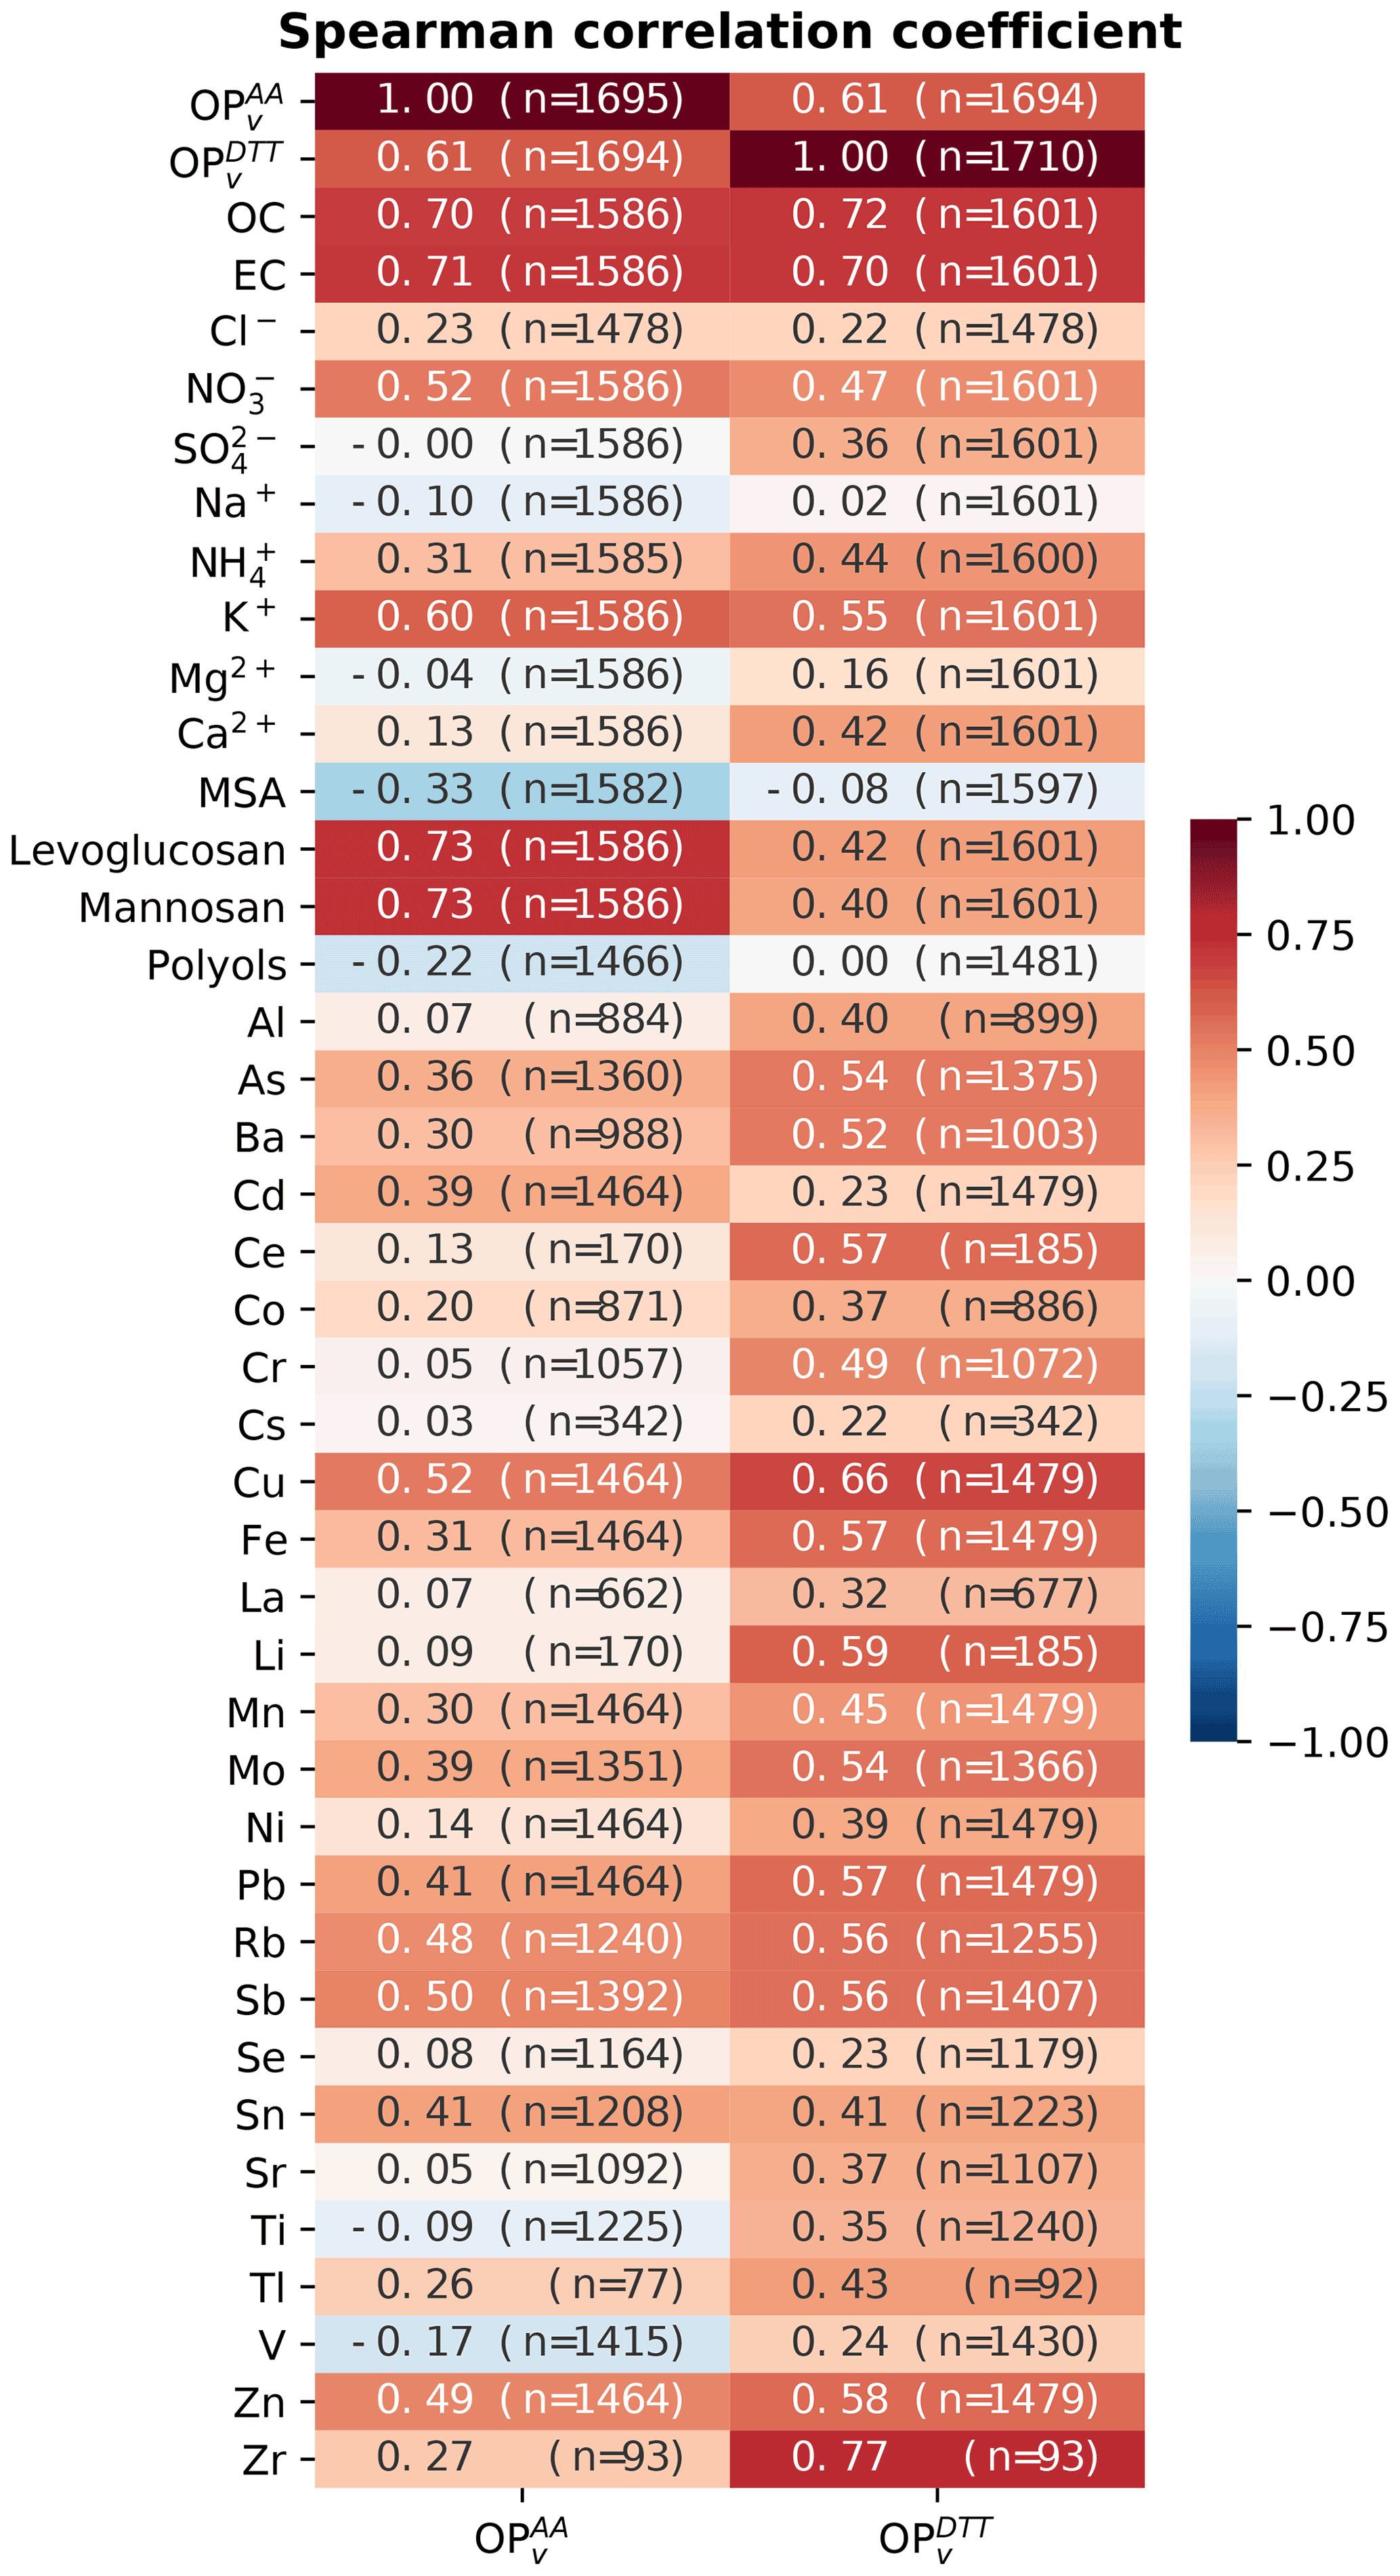
Figure A1Spearman correlation coefficients between and and the chemical species observed at each site. The numbers of samples are specified in parentheses.
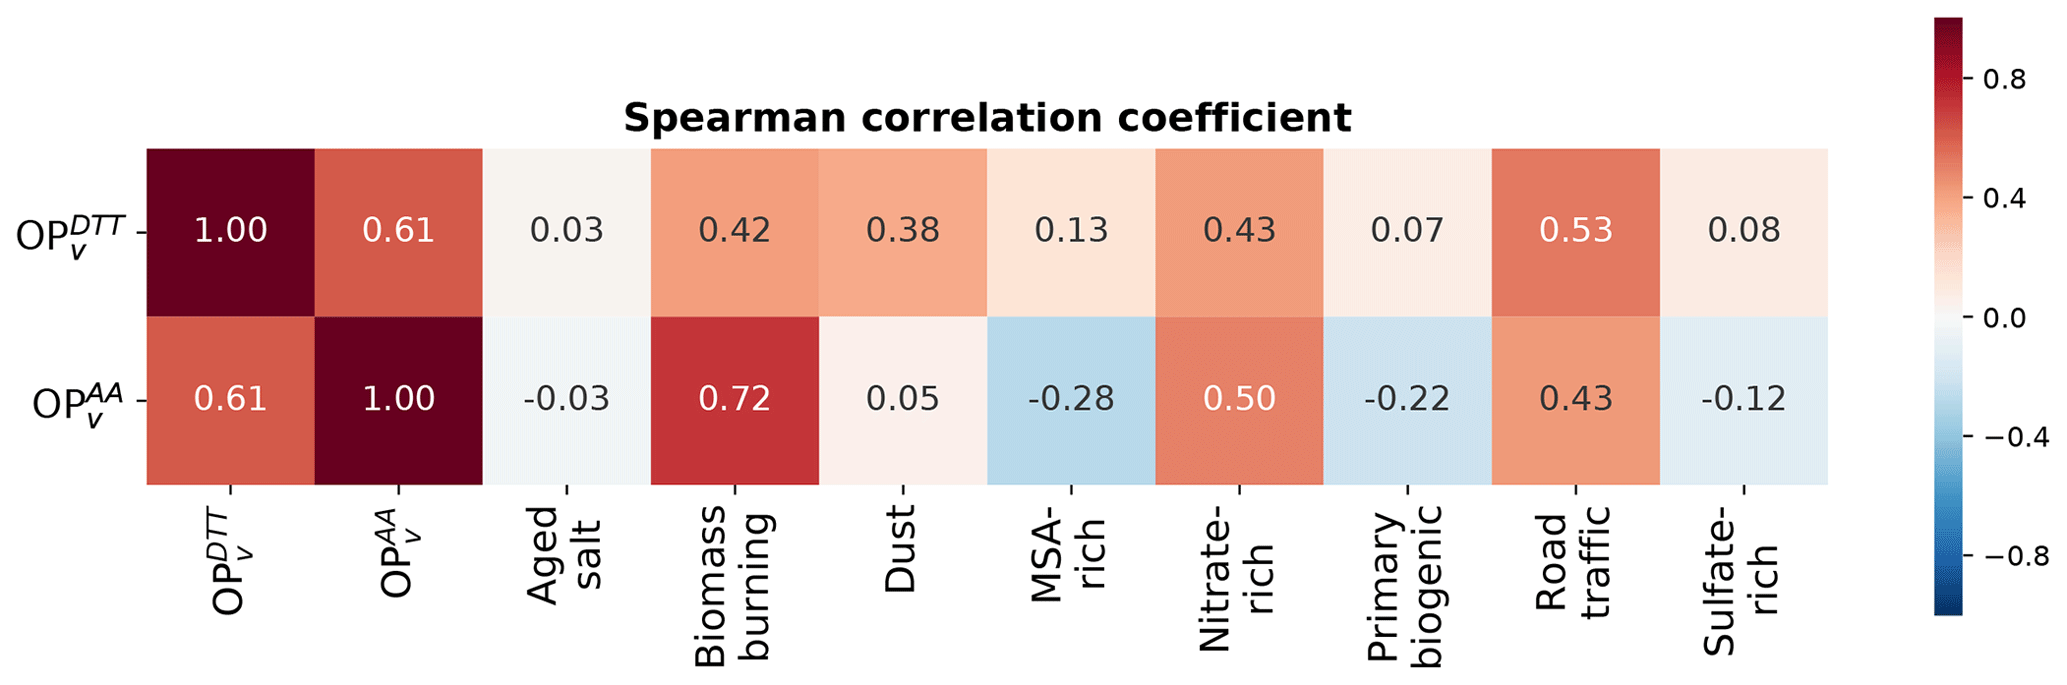
Figure A2Spearman correlation coefficient between or and the different PM sources identified for at least two-thirds of the sites. All the sites are merged, and whole time series of measurements were considered. The number of observations considered for the different sources are as follows: aged salt: 1430; biomass burning: 1700, dust: 1489, MSA-rich: 1595, nitrate-rich: 1700, primary biogenic: 1700, road traffic: 1587, sulfate-rich: 1524.
Data available on request at gaelle.uzu@ird.fr. Website code available at https://gricad-gitlab.univ-grenoble-alpes.fr/pmall/app_op (last access: 27 July 2021) (commit fb99ed42e3f704464e88deca9548b74128fd7b24) (Weber, 2021).
The supplement related to this article is available online at: https://doi.org/10.5194/acp-21-11353-2021-supplement.
OF, JLJ, GU and JLB were in charge of the coordination of different research programs and funding acquisitions. DS did the data curation and ran the PMF for the SOURCES program, FC and JA did the data curation and ran the PMF for the DECOMBIO program, and SW and LJSB did the data curation and ran the PMF for the MobilAir program. AC and GU set up the two OP assay methodologies. SW designed the methodology, did the formal analysis and prepared the present manuscript and figures. GU and JLJ designed, reviewed and edited the first draft of the manuscript. All the co-authors read and edited the manuscript.
The authors declare that there is no conflict of interest.
Publisher's note: Copernicus Publications remains neutral with regard to jurisdictional claims in published maps and institutional affiliations.
This work was partially funded by ANSES for OP measurements (ExPOSURE program, grant 2016-CRD-31), an IDEX UGA grant for innovation 2017 ROS-ONLINE and CDP IDEX UGA MOBILAIR (ANR-15-IDEX-02). It was also supported by the French Ministry of Environment as part of the national reference laboratory for air quality monitoring (LCSQA, program CARA), for some of the chemical analysis related to the GRE-fr, TAL, RBX, STG-cle, MRS-5av and NIC stations. The study in CHAM, MNZ and PAS was funded by ADEME and PRIMEQUAL within the DECOMBIO program (1362C0028). The studies in GRE-cb and VIF were funded by the UGA IDEX MobilAir program (ANR-19-CE34-0002-01) and the ADEME QAMECS program (1262c0011). Regional monitoring networks (namely, Atmo AuRA, Atmo Sud, Atmo HdF, Atmo NA and Atmo GE) financially contributed to sampling and/or chemical analyses for samples from their respective sites. The PhD of Samuël Weber was funded by a grant from ENS Paris. This study was also supported by direct funding by IGE (technician salary), the LEFE CHAT (program 863353: “Le PO comme proxy de l'impact sanitaire”), and LABEX OSUG@2020 (ANR-10-LABX-56) (for funding of analytical instruments).
The authors wish to thank all the numerous people (who could not be listed exhaustively here) from the different laboratories (IGE and Air-O-Sol analytical platform, Ineris and PTAL analytical platform of EDYTEM) and from the regional air quality monitoring networks listed as co-author affiliations, who actively participated in filter sampling and/or analysis. The Institute Mines Telecom (IMT-Lille Douai, PI: Laurent Y. Alleman) and the Laboratoire des Sciences du Climat et de l'Environnement (LSCE, PI: Nicolas Bonnaire) are also warmly thanked for their contribution to chemical analysis of samples collected at RBX, NGT TAL and STG-Cle.
This research has been supported by the Agence Nationale de Sécurité Sanitaire de l'Alimentation, de l'Environnement et du Travail (grant no. 2016-CRD-31), the Université Grenoble Alpes (grant nos. ROS-ONLINE and ANR-19CE34-0002-01), the Agence Nationale de la Recherche (grant nos. ANR-15-IDEX-02 and ANR-10-LABX-56), and the Agence de l'Environnement et de la Maîtrise de l'Energie (grant nos. 1362C0028 and 1262C0011).
This paper was edited by Manabu Shiraiwa and reviewed by two anonymous referees.
Abrams, J. Y., Weber, R. J., Klein, M., Samat, S. E., Chang, H. H., Strickland, M. J., Verma, V., Fang, T., Bates, J. T., Mulholland, J. A., Russell, A. G., and Tolbert, P. E.: Associations between Ambient Fine Particulate Oxidative Potential and Cardiorespiratory Emergency Department Visits, Environ. Health Persp., 125, 107008, https://doi.org/10.1289/EHP1545, 2017. a
Albinet, A., Leoz-Garziandia, E., Budzinski, H., Villenave, E., and Jaffrezo, J.-L.: Nitrated and Oxygenated Derivatives of Polycyclic Aromatic Hydrocarbons in the Ambient Air of Two French Alpine Valleys Part 2: Particle Size Distribution, Atmos. Environ., 42, 55–64, https://doi.org/10.1016/j.atmosenv.2007.10.008, 2008. a
Alleman, L. Y., Lamaison, L., Perdrix, E., Robache, A., and Galloo, J.-C.: PM10 Metal Concentrations and Source Identification Using Positive Matrix Factorization and Wind Sectoring in a French Industrial Zone, Atmos. Res., 96, 612–625, https://doi.org/10.1016/j.atmosres.2010.02.008, 2010. a
Amato, F., Alastuey, A., Karanasiou, A., Lucarelli, F., Nava, S., Calzolai, G., Severi, M., Becagli, S., Gianelle, V. L., Colombi, C., Alves, C., Custódio, D., Nunes, T., Cerqueira, M., Pio, C., Eleftheriadis, K., Diapouli, E., Reche, C., Minguillón, M. C., Manousakas, M.-I., Maggos, T., Vratolis, S., Harrison, R. M., and Querol, X.: AIRUSE-LIFE+: a harmonized PM speciation and source apportionment in five southern European cities, Atmos. Chem. Phys., 16, 3289–3309, https://doi.org/10.5194/acp-16-3289-2016, 2016. a
Atkinson, R. W., Samoli, E., Analitis, A., Fuller, G. W., Green, D. C., Anderson, H. R., Purdie, E., Dunster, C., Aitlhadj, L., Kelly, F. J., and Mudway, I. S.: Short-Term Associations between Particle Oxidative Potential and Daily Mortality and Hospital Admissions in London, Int. J Hyg. Envir. Heal., 219, 566–572, https://doi.org/10.1016/j.ijheh.2016.06.004, 2016. a
Ayres, J. G., Borm, P., Cassee, F. R., Castranova, V., Donaldson, K., Ghio, A., Harrison, R. M., Hider, R., Kelly, F., Kooter, I. M., Marano, F., Maynard, R. L., Mudway, I., Nel, A., Sioutas, C., Smith, S., Baeza-Squiban, A., Cho, A., Duggan, S., and Froines, J.: Evaluating the Toxicity of Airborne Particulate Matter and Nanoparticles by Measuring Oxidative Stress Potential – A Workshop Report and Consensus Statement, Inhal. Toxicol., 20, 75–99, https://doi.org/10.1080/08958370701665517, 2008. a, b
Baduel, C., Voisin, D., and Jaffrezo, J.-L.: Seasonal variations of concentrations and optical properties of water soluble HULIS collected in urban environments, Atmos. Chem. Phys., 10, 4085–4095, https://doi.org/10.5194/acp-10-4085-2010, 2010. a
Barraza-Villarreal, A., Sunyer, J., Hernandez-Cadena, L., Escamilla-Nuñez, M. C., Sienra-Monge, J. J., Ramírez-Aguilar, M., Cortez-Lugo, M., Holguin, F., Diaz-Sánchez, D., Olin, A. C., and Romieu, I.: Air Pollution, Airway Inflammation, and Lung Function in a Cohort Study of Mexico City Schoolchildren, Environ. Health Persp., 116, 832–838, https://doi.org/10.1289/ehp.10926, 2008. a
Bates, J. T., Weber, R. J., Abrams, J., Verma, V., Fang, T., Klein, M., Strickland, M. J., Sarnat, S. E., Chang, H. H., Mulholland, J. A., Tolbert, P. E., and Russell, A. G.: Reactive Oxygen Species Generation Linked to Sources of Atmospheric Particulate Matter and Cardiorespiratory Effects, Environ. Sci. Technol., 49, 13605–13612, https://doi.org/10.1021/acs.est.5b02967, 2015. a, b, c, d, e
Bates, J. T., Fang, T., Verma, V., Zeng, L., Weber, R. J., Tolbert, P. E., Abrams, J. Y., Sarnat, S. E., Klein, M., Mulholland, J. A., and Russell, A. G.: Review of Acellular Assays of Ambient Particulate Matter Oxidative Potential: Methods and Relationships with Composition, Sources, and Health Effects, Environ. Sci. Technol., 53, 4003–4019, https://doi.org/10.1021/acs.est.8b03430, 2019. a, b
Beck-Speier, I., Karg, E., Behrendt, H., Stoeger, T., and Alessandrini, F.: Ultrafine Particles Affect the Balance of Endogenous Pro- and Anti-Inflammatory Lipid Mediators in the Lung: In-Vitro and in-Vivo Studies, Part. Fibre Toxicol., 9, 27, https://doi.org/10.1186/1743-8977-9-27, 2012. a
Belis, C. A., Pernigotti, D., Karagulian, F., Pirovano, G., Larsen, B., Gerboles, M., and Hopke, P. K.: A New Methodology to Assess the Performance and Uncertainty of Source Apportionment Models in Intercomparison Exercises, Atmos. Environ., 119, 35–44, https://doi.org/10.1016/j.atmosenv.2015.08.002, 2015. a
Belis, C. A., Favez, O., Mircea, M., Diapouli, E., Manousakas, M.-I., Vratolis, S., Gilardoni, S., Paglione, M., Decesari, S., Mocnik, G., Mooibroek, D., Salvador, P., Takahama, S., Vecchi, R., Paatero, P., European Commission, and Joint Research Centre: European Guide on Air Pollution Source Apportionment with Receptor Models: Revised Version 2019, Publication Office of the European Union, Luxembourg, 2019. a
Belis, C. A., Pernigotti, D., Pirovano, G., Favez, O., Jaffrezo, J.-L., Kuenen, J., Denier van Der Gon, H., Reizer, M., Riffault, V., Alleman, L. Y., Almeida, M., Amato, F., Angyal, A., Argyropoulos, G., Bande, S., Beslic, I., Besombes, J. L., Bove, M. C., Brotto, P., Calori, G., Cesari, D., Colombi, C., Contini, D., De Gennaro, G., Di Gilio, A., Diapouli, E., El Haddad, I., Elbern, H., Eleftheriadis, K., Ferreira, J., Vivanco, M. G., Gilardoni, S., Golly, B., Hellebust, S., Hopke, P. K., Izadmanesh, Y., Jorquera, H., Krajsek, K., Kranenburg, R., Lazzeri, P., Lenartz, F., Lucarelli, F., Maciejewska, K., Manders, A., Manousakas, M., Masiol, M., Mircea, M., Mooibroek, D., Nava, S., Oliveira, D., Paglione, M., Pandolfi, M., Perrone, M., Petralia, E., Pietrodangelo, A., Pillon, S., Pokorna, P., Prati, P., Salameh, D., Samara, C., Samek, L., Saraga, D., Sauvage, S., Schaap, M., Scotto, F., Sega, K., Siour, G., Tauler, R., Valli, G., Vecchi, R., Venturini, E., Vestenius, M., Waked, A., and Yubero, E.: Evaluation of Receptor and Chemical Transport Models for PM10 Source Apportionment, Atmos. Environ.: X, 5, 100053, https://doi.org/10.1016/j.aeaoa.2019.100053, 2020. a, b
Birch, M. E. and Cary, R. A.: Elemental Carbon-Based Method for Monitoring Occupational Exposures to Particulate Diesel Exhaust, Aerosol Sci. Tech., 25, 221–241, https://doi.org/10.1080/02786829608965393, 1996. a
Bolton, J. L., Trush, M. A., Penning, T. M., Dryhurst, G., and Monks, T. J.: Role of Quinones in Toxicology, Chem. Res. Toxicol., 13, 135–160, https://doi.org/10.1021/tx9902082, 2000. a
Borlaza, L. J. S., Cosep, E. M. R., Kim, S., Lee, K., Joo, H., Park, M., Bate, D., Cayetano, M. G., and Park, K.: Oxidative Potential of Fine Ambient Particles in Various Environments, Environ. Pollut., 243, 1679–1688, https://doi.org/10.1016/j.envpol.2018.09.074, 2018. a, b
Borlaza, L. J. S., Weber, S., Uzu, G., Jacob, V., Cañete, T., Micallef, S., Trébuchon, C., Slama, R., Favez, O., and Jaffrezo, J.-L.: Disparities in particulate matter (PM10) origins and oxidative potential at a city scale (Grenoble, France) – Part 1: Source apportionment at three neighbouring sites, Atmos. Chem. Phys., 21, 5415–5437, https://doi.org/10.5194/acp-21-5415-2021, 2021a. a, b, c, d
Borlaza, L. J. S., Weber, S., Jaffrezo, J.-L., Houdier, S., Slama, R., Rieux, C., Albinet, A., Micallef, S., Trébluchon, C., and Uzu, G.: Disparities in particulate matter (PM10) origins and oxidative potential at a city scale (Grenoble, France) – Part 2: Sources of PM10 oxidative potential using multiple linear regression analysis and the predictive applicability of multilayer perceptron neural network analysis, Atmos. Chem. Phys., 21, 9719–9739, https://doi.org/10.5194/acp-21-9719-2021, 2021b. a, b
Bozzetti, C., Sosedova, Y., Xiao, M., Daellenbach, K. R., Ulevicius, V., Dudoitis, V., Mordas, G., Byčenkienė, S., Plauškaitė, K., Vlachou, A., Golly, B., Chazeau, B., Besombes, J.-L., Baltensperger, U., Jaffrezo, J.-L., Slowik, J. G., El Haddad, I., and Prévôt, A. S. H.: Argon offline-AMS source apportionment of organic aerosol over yearly cycles for an urban, rural, and marine site in northern Europe, Atmos. Chem. Phys., 17, 117–141, https://doi.org/10.5194/acp-17-117-2017, 2017. a
Brandt, J., Silver, J. D., Christensen, J. H., Andersen, M. S., Bønløkke, J. H., Sigsgaard, T., Geels, C., Gross, A., Hansen, A. B., Hansen, K. M., Hedegaard, G. B., Kaas, E., and Frohn, L. M.: Contribution from the ten major emission sectors in Europe and Denmark to the health-cost externalities of air pollution using the EVA model system – an integrated modelling approach, Atmos. Chem. Phys., 13, 7725–7746, https://doi.org/10.5194/acp-13-7725-2013, 2013. a
Brauer, M., Amann, M., Burnett, R. T., Cohen, A., Dentener, F., Ezzati, M., Henderson, S. B., Krzyzanowski, M., Martin, R. V., Van Dingenen, R., van Donkelaar, A., and Thurston, G. D.: Exposure Assessment for Estimation of the Global Burden of Disease Attributable to Outdoor Air Pollution, Environ. Sci. Technol., 46, 652–660, https://doi.org/10.1021/es2025752, 2012. a
Bressi, M., Sciare, J., Ghersi, V., Mihalopoulos, N., Petit, J.-E., Nicolas, J. B., Moukhtar, S., Rosso, A., Féron, A., Bonnaire, N., Poulakis, E., and Theodosi, C.: Sources and geographical origins of fine aerosols in Paris (France), Atmos. Chem. Phys., 14, 8813–8839, https://doi.org/10.5194/acp-14-8813-2014, 2014. a
Brown, S. G., Eberly, S., Paatero, P., and Norris, G. A.: Methods for Estimating Uncertainty in PMF Solutions: Examples with Ambient Air and Water Quality Data and Guidance on Reporting PMF Results, Sci. Total Environ., 518–519, 626–635, https://doi.org/10.1016/j.scitotenv.2015.01.022, 2015. a
Calas, A., Uzu, G., Martins, J. M. F., Voisin, D., Spadini, L., Lacroix, T., and Jaffrezo, J.-L.: The Importance of Simulated Lung Fluid (SLF) Extractions for a More Relevant Evaluation of the Oxidative Potential of Particulate Matter, Sci. Rep.-UK, 7, 11617, https://doi.org/10.1038/s41598-017-11979-3, 2017. a
Calas, A., Uzu, G., Kelly, F. J., Houdier, S., Martins, J. M. F., Thomas, F., Molton, F., Charron, A., Dunster, C., Oliete, A., Jacob, V., Besombes, J.-L., Chevrier, F., and Jaffrezo, J.-L.: Comparison between five acellular oxidative potential measurement assays performed with detailed chemistry on PM10 samples from the city of Chamonix (France), Atmos. Chem. Phys., 18, 7863–7875, https://doi.org/10.5194/acp-18-7863-2018, 2018. a, b, c, d
Calas, A., Uzu, G., Besombes, J.-L., Martins, J. M. F., Redaelli, M., Weber, S., Charron, A., Albinet, A., Chevrier, F., Brulfert, G., Mesbah, B., Favez, O., and Jaffrezo, J.-L.: Seasonal Variations and Chemical Predictors of Oxidative Potential (OP) of Particulate Matter (PM), for Seven Urban French Sites, Atmosphere, 10, 698, https://doi.org/10.3390/atmos10110698, 2019. a, b, c, d, e
Canova, C., Minelli, C., Dunster, C., Kelly, F., Shah, P. L., Caneja, C., Tumilty, M. K., and Burney, P.: PM10 Oxidative Properties and Asthma and COPD, Epidemiology, 25, 467–468, https://doi.org/10.1097/EDE.0000000000000084, 2014. a
Cassee, F. R., Héroux, M.-E., Gerlofs-Nijland, M. E., and Kelly, F. J.: Particulate Matter beyond Mass: Recent Health Evidence on the Role of Fractions, Chemical Constituents and Sources of Emission, Inhal. Toxicol., 25, 802–812, https://doi.org/10.3109/08958378.2013.850127, 2013. a
Caswell, T. A., Droettboom, M., Lee, A., Hunter, J., Firing, E., Elliott Sales de Andrade, Hoffmann, T., Stansby, D., Klymak, J., Varoquaux, N., Nielsen, J. H., Root, B., May, R., Elson, P., Seppänen, J. K., Dale, D., Jae-Joon Lee, McDougall, D., Straw, A., Hobson, P., Gohlke, C., Yu, T. S., Ma, E., Vincent, A. F., Silvester, S., Moad, C., Kniazev, N., hannah, Ernest, E., and Ivanov, P.: Matplotlib/Matplotlib: REL: V3.3.1, Zenodo, https://doi.org/10.5281/zenodo.3984190, 2020. a
Cavalli, F., Viana, M., Yttri, K. E., Genberg, J., and Putaud, J.-P.: Toward a standardised thermal-optical protocol for measuring atmospheric organic and elemental carbon: the EUSAAR protocol, Atmos. Meas. Tech., 3, 79–89, https://doi.org/10.5194/amt-3-79-2010, 2010. a
CEN: Ambient Air Quality – Standard Method for the Measurement of Pb, Cd, As and Ni in the PM10 Fraction of Suspended Particulate Matter, Technical Report EN 14902:2005, CEN, Brussels, Belgium, 2005. a
CEN: Ambient Air – Standard Gravimetric Measurement Method for the Determination of the PM10 or PM2.5 Mass Concentration of Suspended Particulate Matter, Technical Report EN 12341:2014, CEN, Brussels, Belgium, 2014. a
CEN: Ambient Air – Automated Measuring Systems for the Measurement of the Concentration of Particulate Matter (PM10; PM2.5), Technical Report EN 16450:2017, CEN, Brussels, Belgium, 2017a. a
CEN: Ambient Air – Standard Method for Measurement of NO, SO42−, Cl−, NH4+, Na+, K+, Mg2+, Ca2+ in PM2.5 as Deposited on Filters, Technical Report EN 16913:2017, CEN, Brussels, Belgium, 2017b. a, b
Cesari, D., Merico, E., Grasso, F. M., Decesari, S., Belosi, F., Manarini, F., De Nuntiis, P., Rinaldi, M., Volpi, F., Gambaro, A., Morabito, E., and Contini, D.: Source Apportionment of PM2.5 and of Its Oxidative Potential in an Industrial Suburban Site in South Italy, Atmosphere, 10, 758, https://doi.org/10.3390/atmos10120758, 2019. a, b, c, d, e, f
Charrier, J. G. and Anastasio, C.: On dithiothreitol (DTT) as a measure of oxidative potential for ambient particles: evidence for the importance of soluble transition metals, Atmos. Chem. Phys., 12, 9321–9333, https://doi.org/10.5194/acp-12-9321-2012, 2012. a, b
Charrier, J. G. and Anastasio, C.: Rates of Hydroxyl Radical Production from Transition Metals and Quinones in a Surrogate Lung Fluid, Environ. Sci. Technol., 49, 9317–9325, https://doi.org/10.1021/acs.est.5b01606, 2015. a
Charrier, J. G., McFall, A. S., Vu, K. K.-T., Baroi, J., Olea, C., Hasson, A., and Anastasio, C.: A Bias in the “Mass-Normalized” DTT Response – An Effect of Non-Linear Concentration-Response Curves for Copper and Manganese, Atmos. Environ., 144, 325–334, https://doi.org/10.1016/j.atmosenv.2016.08.071, 2016. a
Chen, R., Yin, P., Meng, X., Wang, L., Liu, C., Niu, Y., Liu, Y., Liu, J., Qi, J., You, J., Kan, H., and Zhou, M.: Associations between Coarse Particulate Matter Air Pollution and Cause-Specific Mortality: A Nationwide Analysis in 272 Chinese Cities, Environ. Health Persp., 127, 017008, https://doi.org/10.1289/EHP2711, 2019. a
Chevrier, F.: Chauffage au bois et qualité de l'air en Vallée de l'Arve: définition d'un système de surveillance et impact d'une politique de rénovation du parc des appareils anciens., PhD thesis, Université Grenoble Alpes, Grenoble, 2016. a
Chevrier, F., Ježek, I., Brulfert, G., Močnik, G., Marchand, N., Jaffrezo, J.-L., and Besombes, J.-L.: DECOMBIO-Contribution de La Combustion de La Biomasse Aux PM10 En Vallée de l'Arve: Mise En Place et Qualification d'un Dispositif de Suivi, 2268–3798, Pollution Atmosphérique, 231–232, 2016. a
Cho, A. K., Sioutas, C., Miguel, A. H., Kumagai, Y., Schmitz, D. A., Singh, M., Eiguren-Fernandez, A., and Froines, J. R.: Redox Activity of Airborne Particulate Matter at Different Sites in the Los Angeles Basin, Environ. Res., 99, 40–47, https://doi.org/10.1016/j.envres.2005.01.003, 2005. a, b
Chung, M. Y., Lazaro, R. A., Lim, D., Jackson, J., Lyon, J., Rendulic, D., and Hasson, A. S.: Aerosol-Borne Quinones and Reactive Oxygen Species Generation by Particulate Matter Extracts, Environ. Sci. Technol., 40, 4880–4886, https://doi.org/10.1021/es0515957, 2006. a
Costabile, F., Alas, H., Aufderheide, M., Avino, P., Amato, F., Argentini, S., Barnaba, F., Berico, M., Bernardoni, V., Biondi, R., Casasanta, G., Ciampichetti, S., Calzolai, G., Canepari, S., Conidi, A., Cordelli, E., Di Ianni, A., Di Liberto, L., Facchini, M. C., Facci, A., Frasca, D., Gilardoni, S., Grollino, M. G., Gualtieri, M., Lucarelli, F., Malaguti, A., Manigrasso, M., Montagnoli, M., Nava, S., Perrino, C., Padoan, E., Petenko, I., Querol, X., Simonetti, G., Tranfo, G., Ubertini, S., Valli, G., Valentini, S., Vecchi, R., Volpi, F., Weinhold, K., Wiedensohler, A., Zanini, G., Gobbi, G. P., and Petralia, E.: First Results of the “Carbonaceous Aerosol in Rome and Environs (CARE)” Experiment: Beyond Current Standards for PM10, Atmosphere, 8, 249, https://doi.org/10.3390/atmos8120249, 2017. a
Costabile, F., Gualtieri, M., Canepari, S., Tranfo, G., Consales, C., Grollino, M. G., Paci, E., Petralia, E., Pigini, D., and Simonetti, G.: Evidence of Association between Aerosol Properties and In-Vitro Cellular Oxidative Response to PM1, Oxidative Potential of PM2.5, a Biomarker of RNA Oxidation, and Its Dependency on Combustion Sources, Atmos. Environ., 213, 444–455, https://doi.org/10.1016/j.atmosenv.2019.06.023, 2019. a, b
Daellenbach, K. R., Uzu, G., Jiang, J., Cassagnes, L.-E., Leni, Z., Vlachou, A., Stefenelli, G., Canonaco, F., Weber, S., Segers, A., Kuenen, J. J. P., Schaap, M., Favez, O., Albinet, A., Aksoyoglu, S., Dommen, J., Baltensperger, U., Geiser, M., El Haddad, I., Jaffrezo, J.-L., and Prévôt, A. S. H.: Sources of Particulate-Matter Air Pollution and Its Oxidative Potential in Europe, Nature, 587, 414–419, https://doi.org/10.1038/s41586-020-2902-8, 2020. a, b, c, d, e, f, g
Diémoz, H., Barnaba, F., Magri, T., Pession, G., Dionisi, D., Pittavino, S., Tombolato, I. K. F., Campanelli, M., Della Ceca, L. S., Hervo, M., Di Liberto, L., Ferrero, L., and Gobbi, G. P.: Transport of Po Valley aerosol pollution to the northwestern Alps – Part 1: Phenomenology, Atmos. Chem. Phys., 19, 3065–3095, https://doi.org/10.5194/acp-19-3065-2019, 2019. a
El Haddad, I., Marchand, N., Wortham, H., Piot, C., Besombes, J.-L., Cozic, J., Chauvel, C., Armengaud, A., Robin, D., and Jaffrezo, J.-L.: Primary sources of PM2.5 organic aerosol in an industrial Mediterranean city, Marseille, Atmos. Chem. Phys., 11, 2039–2058, https://doi.org/10.5194/acp-11-2039-2011, 2011. a
Fang, T., Guo, H., Verma, V., Peltier, R. E., and Weber, R. J.: PM2.5 water-soluble elements in the southeastern United States: automated analytical method development, spatiotemporal distributions, source apportionment, and implications for heath studies, Atmos. Chem. Phys., 15, 11667–11682, https://doi.org/10.5194/acp-15-11667-2015, 2015. a, b
Fang, T., Verma, V., Bates, J. T., Abrams, J., Klein, M., Strickland, M. J., Sarnat, S. E., Chang, H. H., Mulholland, J. A., Tolbert, P. E., Russell, A. G., and Weber, R. J.: Oxidative potential of ambient water-soluble PM2.5 in the southeastern United States: contrasts in sources and health associations between ascorbic acid (AA) and dithiothreitol (DTT) assays, Atmos. Chem. Phys., 16, 3865–3879, https://doi.org/10.5194/acp-16-3865-2016, 2016. a, b, c, d, e, f
Fang, T., Zeng, L., Gao, D., Verma, V., Stefaniak, A. B., and Weber, R. J.: Ambient Size Distributions and Lung Deposition of Aerosol Dithiothreitol-Measured Oxidative Potential: Contrast between Soluble and Insoluble Particles, Environ. Sci. Technol., 51, 6802–6811, https://doi.org/10.1021/acs.est.7b01536, 2017. a
Favez, O., Weber, S., Petit, J.-E., Alleman, L. Y., Albinet, A., Riffault, V., Chazeau, B., Amodeo, T., Salameh, D., Zhang, Y., Srivastava, D., Samaké, A., Aujay-Plouzeau, R., Papin, A., Bonnaire, N., Boullanger, C., Chatain, M., Chevrier, F., Detournay, A., Dominik-Sègue, M., Falhun, R., Garbin, C., Ghersi, V., Grignion, G., Levigoureux, G., Pontet, S., Rangognio, J., Zhang, S., Besombes, J.-L., Conil, S., Uzu, G., Savarino, J., Marchand, N., Gros, V., Marchand, C., Jaffrezo, J.-L., and Leoz-Garziandia, E.: Overview of the French Operational Network for In Situ Observation of PM Chemical Composition and Sources in Urban Environments (CARA Program), Atmosphere, 12, 207, https://doi.org/10.3390/atmos12020207, 2021. a, b
Gao, D., Ripley, S., Weichenthal, S., and Godri Pollitt, K. J.: Ambient Particulate Matter Oxidative Potential: Chemical Determinants, Associated Health Effects, and Strategies for Risk Management, Free Radical Bio. Med., 151, 7–25, https://doi.org/10.1016/j.freeradbiomed.2020.04.028, 2020. a
Gianini, M., Fischer, A., Gehrig, R., Ulrich, A., Wichser, A., Piot, C., Besombes, J.-L., and Hueglin, C.: Comparative Source Apportionment of PM10 in Switzerland for 2008/2009 and 1998/1999 by Positive Matrix Factorisation, Atmos. Environ., 54, 149–158, https://doi.org/10.1016/j.atmosenv.2012.02.036, 2012. a
Goix, S., Lévêque, T., Xiong, T.-T., Schreck, E., Baeza-Squiban, A., Geret, F., Uzu, G., Austruy, A., and Dumat, C.: Environmental and Health Impacts of Fine and Ultrafine Metallic Particles: Assessment of Threat Scores, Environ. Res., 133, 185–194, https://doi.org/10.1016/j.envres.2014.05.015, 2014. a
Goldberg, M.: A Systematic Review of the Relation Between Long-Term Exposure to Ambient Air Pollution and Chronic Diseases, Rev. Environ. Health, 23, 243–298, https://doi.org/10.1515/REVEH.2008.23.4.243, 2011. a
Golly, B., Waked, A., Weber, S., Samake, A., Jacob, V., Conil, S., Rangognio, J., Chrétien, E., Vagnot, M. P., Robic, P. Y., Besombes, J.-L., and Jaffrezo, J.-L.: Organic Markers and OC Source Apportionment for Seasonal Variations of PM2.5 at 5 Rural Sites in France, Atmos. Environ., 198, 142–157, https://doi.org/10.1016/j.atmosenv.2018.10.027, 2019. a, b
Hodshire, A. L., Campuzano-Jost, P., Kodros, J. K., Croft, B., Nault, B. A., Schroder, J. C., Jimenez, J. L., and Pierce, J. R.: The potential role of methanesulfonic acid (MSA) in aerosol formation and growth and the associated radiative forcings, Atmos. Chem. Phys., 19, 3137–3160, https://doi.org/10.5194/acp-19-3137-2019, 2019. a
Hopke, P. K., Dai, Q., Li, L., and Feng, Y.: Global Review of Recent Source Apportionments for Airborne Particulate Matter, Sci. Total Environ., 740, 140091, https://doi.org/10.1016/j.scitotenv.2020.140091, 2020. a
Hu, S., Polidori, A., Arhami, M., Shafer, M. M., Schauer, J. J., Cho, A., and Sioutas, C.: Redox activity and chemical speciation of size fractioned PM in the communities of the Los Angeles-Long Beach harbor, Atmos. Chem. Phys., 8, 6439–6451, https://doi.org/10.5194/acp-8-6439-2008, 2008. a, b
Hunter, J. D.: Matplotlib: A 2D Graphics Environment, Comput. Sci. Eng., 9, 90–95, https://doi.org/10.1109/MCSE.2007.55, 2007. a
Jaffrezo, J.-L., Aymoz, G., Delaval, C., and Cozic, J.: Seasonal variations of the water soluble organic carbon mass fraction of aerosol in two valleys of the French Alps, Atmos. Chem. Phys., 5, 2809–2821, https://doi.org/10.5194/acp-5-2809-2005, 2005. a, b
Jain, S., Sharma, S., Mandal, T., and Saxena, M.: Source Apportionment of PM10 in Delhi, India Using PCA/APCS, UNMIX and PMF, Particuology, 37, 107–118, https://doi.org/10.1016/j.partic.2017.05.009, 2018. a
Jain, S., Sharma, S. K., Vijayan, N., and Mandal, T. K.: Seasonal Characteristics of Aerosols (PM2.5 and PM10) and Their Source Apportionment Using PMF: A Four Year Study over Delhi, India, Environ. Pollut., 262, 114337, https://doi.org/10.1016/j.envpol.2020.114337, 2020. a
Janssen, N. A. H., Strak, M., Yang, A., Hellack, B., Kelly, F. J., Kuhlbusch, T. A. J., Harrison, R. M., Brunekreef, B., Cassee, F. R., Steenhof, M., and Hoek, G.: Associations between Three Specific A-Cellular Measures of the Oxidative Potential of Particulate Matter and Markers of Acute Airway and Nasal Inflammation in Healthy Volunteers, Occup. Environ. Med., 72, 49–56, https://doi.org/10.1136/oemed-2014-102303, 2015. a, b
Jiang, H., Jang, M., Sabo-Attwood, T., and Robinson, S. E.: Oxidative Potential of Secondary Organic Aerosols Produced from Photooxidation of Different Hydrocarbons Using Outdoor Chamber under Ambient Sunlight, Atmos. Environ., 131, 382–389, https://doi.org/10.1016/j.atmosenv.2016.02.016, 2016. a, b
Jiang, J., Aksoyoglu, S., El-Haddad, I., Ciarelli, G., Denier van der Gon, H. A. C., Canonaco, F., Gilardoni, S., Paglione, M., Minguillón, M. C., Favez, O., Zhang, Y., Marchand, N., Hao, L., Virtanen, A., Florou, K., O'Dowd, C., Ovadnevaite, J., Baltensperger, U., and Prévôt, A. S. H.: Sources of organic aerosols in Europe: a modeling study using CAMx with modified volatility basis set scheme, Atmos. Chem. Phys., 19, 15247–15270, https://doi.org/10.5194/acp-19-15247-2019, 2019. a
Karagulian, F., Belis, C. A., Dora, C. F. C., Prüss-Ustün, A. M., Bonjour, S., Adair-Rohani, H., and Amann, M.: Contributions to Cities' Ambient Particulate Matter (PM): A Systematic Review of Local Source Contributions at Global Level, Atmos. Environ., 120, 475–483, https://doi.org/10.1016/j.atmosenv.2015.08.087, 2015. a
Karavalakis, G., Gysel, N., Schmitz, D. A., Cho, A. K., Sioutas, C., Schauer, J. J., Cocker, D. R., and Durbin, T. D.: Impact of Biodiesel on Regulated and Unregulated Emissions, and Redox and Proinflammatory Properties of PM Emitted from Heavy-Duty Vehicles, Sci. Total Environ., 584–585, 1230–1238, https://doi.org/10.1016/j.scitotenv.2017.01.187, 2017. a
Keet, C. A., Keller, J. P., and Peng, R. D.: Long-Term Coarse Particulate Matter Exposure Is Associated with Asthma among Children in Medicaid, Am. J. Resp. Crit. Care, 197, 737–746, https://doi.org/10.1164/rccm.201706-1267OC, 2018. a
Kelly, F. J. and Fussell, J. C.: Size, Source and Chemical Composition as Determinants of Toxicity Attributable to Ambient Particulate Matter, Atmos. Environ., 60, 504–526, https://doi.org/10.1016/j.atmosenv.2012.06.039, 2012. a
Kelly, F. J. and Mudway, I. S.: Protein Oxidation at the Air-Lung Interface, Amino Acids, 25, 375–396, https://doi.org/10.1007/s00726-003-0024-x, 2003. a
Kramer, A. J., Rattanavaraha, W., Zhang, Z., Gold, A., Surratt, J. D., and Lin, Y.-H.: Assessing the Oxidative Potential of Isoprene-Derived Epoxides and Secondary Organic Aerosol, Atmos. Environ., 130, 211–218, https://doi.org/10.1016/j.atmosenv.2015.10.018, 2016. a
Kranenburg, R., Segers, A. J., Hendriks, C., and Schaap, M.: Source apportionment using LOTOS-EUROS: module description and evaluation, Geosci. Model Dev., 6, 721–733, https://doi.org/10.5194/gmd-6-721-2013, 2013. a
Kuang, X. M., Scott, J. A., da Rocha, G. O., Betha, R., Price, D. J., Russell, L. M., Cocker, D. R., and Paulson, S. E.: Hydroxyl Radical Formation and Soluble Trace Metal Content in Particulate Matter from Renewable Diesel and Ultra Low Sulfur Diesel in At-Sea Operations of a Research Vessel, Aerosol Sci. Tech., 51, 147–158, https://doi.org/10.1080/02786826.2016.1271938, 2017. a
Künzli, N., Mudway, I. S., Götschi, T., Shi, T., Kelly, F. J., Cook, S., Burney, P., Forsberg, B., Gauderman, J. W., Hazenkamp, M. E., Heinrich, J., Jarvis, D., Norbäck, D., Payo-Losa, F., Poli, A., Sunyer, J., and Borm, P. J.: Comparison of Oxidative Properties, Light Absorbance, and Total and Elemental Mass Concentration of Ambient PM2.5 Collected at 20 European Sites, Environ. Health Persp., 114, 684–690, https://doi.org/10.1289/ehp.8584, 2006. a
Lakey, P. S. J., Berkemeier, T., Tong, H., Arangio, A. M., Lucas, K., Pöschl, U., and Shiraiwa, M.: Chemical Exposure-Response Relationship between Air Pollutants and Reactive Oxygen Species in the Human Respiratory Tract, Sci. Rep.-UK, 6, 32916, https://doi.org/10.1038/srep32916, 2016. a
Lanzafame, G. M., Srivastava, D., Favez, O., Bandowe, B. A. M., Shahpoury, P., Lammel, G., Bonnaire, N., Alleman, L. Y., Couvidat, F., Bessagnet, B., and Albinet, A.: One-Year Measurements of Secondary Organic Aerosol (SOA) Markers in the Paris Region (France): Concentrations, Gas/Particle Partitioning and SOA Source Apportionment, Sci. Total Environ., 757, 143921, https://doi.org/10.1016/j.scitotenv.2020.143921, 2020. a
Lelieveld, J., Evans, J. S., Fnais, M., Giannadaki, D., and Pozzer, A.: The Contribution of Outdoor Air Pollution Sources to Premature Mortality on a Global Scale, Nature, 525, 367–371, https://doi.org/10.1038/nature15371, 2015. a, b
Leni, Z., Cassagnes, L. E., Daellenbach, K. R., Haddad, I. E., Vlachou, A., Uzu, G., Prévôt, A. S. H., Jaffrezo, J.-L., Baumlin, N., Salathe, M., Baltensperger, U., Dommen, J., and Geiser, M.: Oxidative Stress-Induced Inflammation in Susceptible Airways by Anthropogenic Aerosol, PLOS One, 15, e0233425, https://doi.org/10.1371/journal.pone.0233425, 2020. a
Li, N., Hao, M., Phalen, R. F., Hinds, W. C., and Nel, A. E.: Particulate Air Pollutants and Asthma: A Paradigm for the Role of Oxidative Stress in PM-Induced Adverse Health Effects, Clin. Immunol., 109, 250–265, https://doi.org/10.1016/j.clim.2003.08.006, 2003. a
Li, N., Wang, M., Bramble, L. A., Schmitz, D. A., Schauer, J. J., Sioutas, C., Harkema, J. R., and Nel, A. E.: The Adjuvant Effect of Ambient Particulate Matter Is Closely Reflected by the Particulate Oxidant Potential, Environ. Health Persp., 117, 1116–1123, https://doi.org/10.1289/ehp.0800319, 2009. a
Liu, Q., Baumgartner, J., Zhang, Y., and Schauer, J. J.: Source Apportionment of Beijing Air Pollution during a Severe Winter Haze Event and Associated Pro-Inflammatory Responses in Lung Epithelial Cells, Atmos. Environ., 126, 28–35, https://doi.org/10.1016/j.atmosenv.2015.11.031, 2016. a
Ma, Y., Cheng, Y., Qiu, X., Cao, G., Fang, Y., Wang, J., Zhu, T., Yu, J., and Hu, D.: Sources and oxidative potential of water-soluble humic-like substances (HULISWS) in fine particulate matter (PM2.5) in Beijing, Atmos. Chem. Phys., 18, 5607–5617, https://doi.org/10.5194/acp-18-5607-2018, 2018. a, b
Manfrin, A., Nizkorodov, S. A., Malecha, K. T., Getzinger, G. J., McNeill, K., and Borduas-Dedekind, N.: Reactive Oxygen Species Production from Secondary Organic Aerosols: The Importance of Singlet Oxygen, Environ. Sci. Technol., 53, 8553–8562, https://doi.org/10.1021/acs.est.9b01609, 2019. a
Marconi, M., Sferlazzo, D. M., Becagli, S., Bommarito, C., Calzolai, G., Chiari, M., di Sarra, A., Ghedini, C., Gómez-Amo, J. L., Lucarelli, F., Meloni, D., Monteleone, F., Nava, S., Pace, G., Piacentino, S., Rugi, F., Severi, M., Traversi, R., and Udisti, R.: Saharan dust aerosol over the central Mediterranean Sea: PM10 chemical composition and concentration versus optical columnar measurements, Atmos. Chem. Phys., 14, 2039–2054, https://doi.org/10.5194/acp-14-2039-2014, 2014. a
Mbengue, S., Alleman, L. Y., and Flament, P.: Size-Distributed Metallic Elements in Submicronic and Ultrafine Atmospheric Particles from Urban and Industrial Areas in Northern France, Atmos. Res., 135–136, 35–47, https://doi.org/10.1016/j.atmosres.2013.08.010, 2014. a
McWhinney, R. D., Zhou, S., and Abbatt, J. P. D.: Naphthalene SOA: redox activity and naphthoquinone gas–particle partitioning, Atmos. Chem. Phys., 13, 9731–9744, https://doi.org/10.5194/acp-13-9731-2013, 2013. a
Miersch, T., Czech, H., Hartikainen, A., Ihalainen, M., Orasche, J., Abbaszade, G., Tissari, J., Streibel, T., Jokiniemi, J., Sippula, O., and Zimmermann, R.: Impact of Photochemical Ageing on Polycyclic Aromatic Hydrocarbons (PAH) and Oxygenated PAH (Oxy-PAH/OH-PAH) in Logwood Stove Emissions, Sci. Total Environ., 686, 382–392, https://doi.org/10.1016/j.scitotenv.2019.05.412, 2019. a
Mircea, M., Calori, G., Pirovano, G., and Belis, C. A.: European Guide on Air Pollution Source Apportionment for Particulate Matter with Source Oriented Models and Their Combined Use with Receptor Models, Tech. Rep. EUR 30052 EN, Publications Office of the European Union, Luxembourg, 2020. a
Moldanová, J., Fridell, E., Winnes, H., Holmin-Fridell, S., Boman, J., Jedynska, A., Tishkova, V., Demirdjian, B., Joulie, S., Bladt, H., Ivleva, N. P., and Niessner, R.: Physical and chemical characterisation of PM emissions from two ships operating in European Emission Control Areas, Atmos. Meas. Tech., 6, 3577–3596, https://doi.org/10.5194/amt-6-3577-2013, 2013. a
Moreno, T., Querol, X., Alastuey, A., de la Rosa, J., Sánchez de la Campa, A. M., Minguillón, M., Pandolfi, M., González-Castanedo, Y., Monfort, E., and Gibbons, W.: Variations in Vanadium, Nickel and Lanthanoid Element Concentrations in Urban Air, Sci. Total Environ., 408, 4569–4579, https://doi.org/10.1016/j.scitotenv.2010.06.016, 2010. a
Mousavi, A., Sowlat, M. H., Hasheminassab, S., Polidori, A., Shafer, M. M., Schauer, J. J., and Sioutas, C.: Impact of Emissions from the Ports of Los Angeles and Long Beach on the Oxidative Potential of Ambient PM0.25 Measured across the Los Angeles County, Sci. Total Environ., 651, 638–647, https://doi.org/10.1016/j.scitotenv.2018.09.155, 2019. a
Ntziachristos, L., Froines, J. R., Cho, A. K., and Sioutas, C.: Relationship between Redox Activity and Chemical Speciation of Size-Fractionated Particulate Matter, Part. Fibre Toxicol., 4, 5, https://doi.org/10.1186/1743-8977-4-5, 2007. a
Official Journal of the European Union: Directive 2008/50/CE, 2008. a
Paatero, P.: The Multilinear Engine: A Table-Driven, Least Squares Program for Solving Multilinear Problems, Including the n-Way Parallel Factor Analysis Model, J. Comput. Graph. Stat., 8, 854, https://doi.org/10.2307/1390831, 1999. a
Paatero, P. and Tapper, U.: Positive Matrix Factorization: A Non-Negative Factor Model with Optimal Utilization of Error Estimates of Data Values, Environmetrics, 5, 111–126, 1994. a
Paraskevopoulou, D., Bougiatioti, A., Stavroulas, I., Fang, T., Lianou, M., Liakakou, E., Gerasopoulos, E., Weber, R. J., Nenes, A., and Mihalopoulos, N.: Yearlong Variability of Oxidative Potential of Particulate Matter in an Urban Mediterranean Environment, Atmos. Environ., 206, 183–196, https://doi.org/10.1016/j.atmosenv.2019.02.027, 2019. a, b, c, d
Park, M., Joo, H. S., Lee, K., Jang, M., Kim, S. D., Kim, I., Borlaza, L. J. S., Lim, H., Shin, H., Chung, K. H., Choi, Y.-H., Park, S. G., Bae, M.-S., Lee, J., Song, H., and Park, K.: Differential Toxicities of Fine Particulate Matters from Various Sources, Sci. Rep.-UK, 8, 1–11, https://doi.org/10.1038/s41598-018-35398-0, 2018. a
Pernigotti, D. and Belis, C. A.: DeltaSA Tool for Source Apportionment Benchmarking, Description and Sensitivity Analysis, Atmos. Environ., 180, 138–148, https://doi.org/10.1016/j.atmosenv.2018.02.046, 2018. a
Pernigotti, D., Belis, C. A., and Spanò, L.: SPECIEUROPE: The European Data Base for PM Source Profiles, Atmos. Pollut. Res., 7, 307–314, https://doi.org/10.1016/j.apr.2015.10.007, 2016. a
Perrone, M. G., Zhou, J., Malandrino, M., Sangiorgi, G., Rizzi, C., Ferrero, L., Dommen, J., and Bolzacchini, E.: PM Chemical Composition and Oxidative Potential of the Soluble Fraction of Particles at Two Sites in the Urban Area of Milan, Northern Italy, Atmos. Environ., 128, 104–113, https://doi.org/10.1016/j.atmosenv.2015.12.040, 2016. a
Perrone, M. R., Bertoli, I., Romano, S., Russo, M., Rispoli, G., and Pietrogrande, M. C.: PM2.5 and PM10 Oxidative Potential at a Central Mediterranean Site: Contrasts between Dithiothreitol- and Ascorbic Acid-Measured Values in Relation with Particle Size and Chemical Composition, Atmos. Environ., 210, 143–155, https://doi.org/10.1016/j.atmosenv.2019.04.047, 2019. a
Petit, J.-E., Favez, O., Sciare, J., Canonaco, F., Croteau, P., Močnik, G., Jayne, J., Worsnop, D., and Leoz-Garziandia, E.: Submicron aerosol source apportionment of wintertime pollution in Paris, France by double positive matrix factorization (PMF2) using an aerosol chemical speciation monitor (ACSM) and a multi-wavelength Aethalometer, Atmos. Chem. Phys., 14, 13773–13787, https://doi.org/10.5194/acp-14-13773-2014, 2014. a
Petit, J.-E., Pallarès, C., Favez, O., Alleman, L. Y., Bonnaire, N., and Rivière, E.: Sources and Geographical Origins of PM10 in Metz (France) Using Oxalate as a Marker of Secondary Organic Aerosols by Positive Matrix Factorization Analysis, Atmosphere, 10, 370, https://doi.org/10.3390/atmos10070370, 2019. a, b
Pietrogrande, M. C., Perrone, M. R., Manarini, F., Romano, S., Udisti, R., and Becagli, S.: PM10 Oxidative Potential at a Central Mediterranean Site: Association with Chemical Composition and Meteorological Parameters, Atmos. Environ., 188, 97–111, https://doi.org/10.1016/j.atmosenv.2018.06.013, 2018. a, b
Piot, C., Jaffrezo, J.-L., Cozic, J., Pissot, N., El Haddad, I., Marchand, N., and Besombes, J.-L.: Quantification of levoglucosan and its isomers by High Performance Liquid Chromatography – Electrospray Ionization tandem Mass Spectrometry and its applications to atmospheric and soil samples, Atmos. Meas. Tech., 5, 141–148, https://doi.org/10.5194/amt-5-141-2012, 2012. a
Ringuet, J., Albinet, A., Leoz-Garziandia, E., Budzinski, H., and Villenave, E.: Diurnal/Nocturnal Concentrations and Sources of Particulate-Bound PAHs, OPAHs and NPAHs at Traffic and Suburban Sites in the Region of Paris (France), Sci. Total Environ., 437, 297–305, https://doi.org/10.1016/j.scitotenv.2012.07.072, 2012a. a
Ringuet, J., Leoz-Garziandia, E., Budzinski, H., Villenave, E., and Albinet, A.: Particle size distribution of nitrated and oxygenated polycyclic aromatic hydrocarbons (NPAHs and OPAHs) on traffic and suburban sites of a European megacity: Paris (France), Atmos. Chem. Phys., 12, 8877–8887, https://doi.org/10.5194/acp-12-8877-2012, 2012b. a
Salameh, D., Detournay, A., Pey, J., Pérez, N., Liguori, F., Saraga, D., Bove, M. C., Brotto, P., Cassola, F., Massabò, D., Latella, A., Pillon, S., Formenton, G., Patti, S., Armengaud, A., Piga, D., Jaffrezo, J. L., Bartzis, J., Tolis, E., Prati, P., Querol, X., Wortham, H., and Marchand, N.: PM2.5 Chemical Composition in Five European Mediterranean Cities: A 1-Year Study, Atmos. Res., 155, 102–117, https://doi.org/10.1016/j.atmosres.2014.12.001, 2015. a
Salameh, D., Pey, J., Bozzetti, C., El Haddad, I., Detournay, A., Sylvestre, A., Canonaco, F., Armengaud, A., Piga, D., Robin, D., Prevot, A. S. H., Jaffrezo, J. L., Wortham, H., and Marchand, N.: Sources of PM2.5 at an Urban-Industrial Mediterranean City, Marseille (France): Application of the ME-2 Solver to Inorganic and Organic Markers, Atmos. Res., 214, 263–274, https://doi.org/10.1016/j.atmosres.2018.08.005, 2018. a
Saleh, Y., Antherieu, S., Dusautoir, R., Y. Alleman, L., Sotty, J., De Sousa, C., Platel, A., Perdrix, E., Riffault, V., Fronval, I., Nesslany, F., Canivet, L., Garçon, G., and Lo-Guidice, J.-M.: Exposure to Atmospheric Ultrafine Particles Induces Severe Lung Inflammatory Response and Tissue Remodeling in Mice, Int. J. Environ. Res. Pu., 16, 1210, https://doi.org/10.3390/ijerph16071210, 2019. a
Samaké, A., Uzu, G., Martins, J. M., Calas, A., Vince, E., Parat, S., and Jaffrezo, J.-L.: The Unexpected Role of Bioaerosols in the Oxidative Potential of PM, Sci. Rep.-UK, 7, 10978, https://doi.org/10.1038/s41598-017-11178-0, 2017. a, b
Samaké, A., Jaffrezo, J.-L., Favez, O., Weber, S., Jacob, V., Albinet, A., Riffault, V., Perdrix, E., Waked, A., Golly, B., Salameh, D., Chevrier, F., Oliveira, D. M., Bonnaire, N., Besombes, J.-L., Martins, J. M. F., Conil, S., Guillaud, G., Mesbah, B., Rocq, B., Robic, P.-Y., Hulin, A., Le Meur, S., Descheemaecker, M., Chretien, E., Marchand, N., and Uzu, G.: Polyols and glucose particulate species as tracers of primary biogenic organic aerosols at 28 French sites, Atmos. Chem. Phys., 19, 3357–3374, https://doi.org/10.5194/acp-19-3357-2019, 2019a. a
Samaké, A., Jaffrezo, J.-L., Favez, O., Weber, S., Jacob, V., Canete, T., Albinet, A., Charron, A., Riffault, V., Perdrix, E., Waked, A., Golly, B., Salameh, D., Chevrier, F., Oliveira, D. M., Besombes, J.-L., Martins, J. M. F., Bonnaire, N., Conil, S., Guillaud, G., Mesbah, B., Rocq, B., Robic, P.-Y., Hulin, A., Le Meur, S., Descheemaecker, M., Chretien, E., Marchand, N., and Uzu, G.: Arabitol, mannitol, and glucose as tracers of primary biogenic organic aerosol: the influence of environmental factors on ambient air concentrations and spatial distribution over France, Atmos. Chem. Phys., 19, 11013–11030, https://doi.org/10.5194/acp-19-11013-2019, 2019b. a
Sauvain, J.-J., Deslarzes, S., and Riediker, M.: Nanoparticle Reactivity toward Dithiothreitol, Nanotoxicology, 2, 121–129, https://doi.org/10.1080/17435390802245716, 2008. a
Seabold, S. and Perktold, J.: Statsmodels: Econometric and Statistical Modeling with Python, in: vol. 57, Proceedings of the 9th Python in Science Conference, 28 June–3 July 2020, Austin, Texas, 61 pp., 2010. a
Simon, H., Beck, L., Bhave, P. V., Divita, F., Hsu, Y., Luecken, D., Mobley, J. D., Pouliot, G. A., Reff, A., Sarwar, G., and Strum, M.: The Development and Uses of EPA's SPECIATE Database, Atmos. Pollut. Res., 1, 196–206, https://doi.org/10.5094/APR.2010.026, 2010. a
Srivastava, D., Tomaz, S., Favez, O., Lanzafame, G. M., Golly, B., Besombes, J.-L., Alleman, L. Y., Jaffrezo, J.-L., Jacob, V., Perraudin, E., Villenave, E., and Albinet, A.: Speciation of Organic Fraction Does Matter for Source Apportionment. Part 1: A One-Year Campaign in Grenoble (France), Sci. Total Environ., 624, 1598–1611, https://doi.org/10.1016/j.scitotenv.2017.12.135, 2018. a, b, c, d
Srivastava, D., Favez, O., Petit, J.-E., Zhang, Y., Sofowote, U. M., Hopke, P. K., Bonnaire, N., Perraudin, E., Gros, V., Villenave, E., and Albinet, A.: Speciation of Organic Fractions Does Matter for Aerosol Source Apportionment. Part 3: Combining off-Line and on-Line Measurements, Sci. Total Environ., 690, 944–955, https://doi.org/10.1016/j.scitotenv.2019.06.378, 2019. a
Steenhof, M., Gosens, I., Strak, M., Godri, K. J., Hoek, G., Cassee, F. R., Mudway, I. S., Kelly, F. J., Harrison, R. M., Lebret, E., Brunekreef, B., Janssen, N. A., and Pieters, R. H.: In Vitro Toxicity of Particulate Matter (PM) Collected at Different Sites in the Netherlands Is Associated with PM Composition, Size Fraction and Oxidative Potential – the RAPTES Project, Part. Fibre Toxicol., 8, 26, https://doi.org/10.1186/1743-8977-8-26, 2011. a
Strak, M., Janssen, N., Beelen, R., Schmitz, O., Karssenberg, D., Houthuijs, D., van den Brink, C., Dijst, M., Brunekreef, B., and Hoek, G.: Associations between Lifestyle and Air Pollution Exposure: Potential for Confounding in Large Administrative Data Cohorts, Environ. Res., 156, 364–373, https://doi.org/10.1016/j.envres.2017.03.050, 2017a. a
Strak, M., Janssen, N., Beelen, R., Schmitz, O., Vaartjes, I., Karssenberg, D., van den Brink, C., Bots, M. L., Dijst, M., Brunekreef, B., and Hoek, G.: Long-Term Exposure to Particulate Matter, NO2 and the Oxidative Potential of Particulates and Diabetes Prevalence in a Large National Health Survey, Environ. Int., 108, 228–236, https://doi.org/10.1016/j.envint.2017.08.017, 2017b. a
Tomaz, S., Jaffrezo, J.-L., Favez, O., Perraudin, E., Villenave, E., and Albinet, A.: Sources and Atmospheric Chemistry of Oxy- and Nitro-PAHs in the Ambient Air of Grenoble (France), Atmos. Environ., 161, 144–154, https://doi.org/10.1016/j.atmosenv.2017.04.042, 2017. a
Tuet, W. Y., Chen, Y., Fok, S., Gao, D., Weber, R. J., Champion, J. A., and Ng, N. L.: Chemical and Cellular Oxidant Production Induced by Naphthalene Secondary Organic Aerosol (SOA): Effect of Redox-Active Metals and Photochemical Aging, Sci. Rep.-UK, 7, 15157, https://doi.org/10.1038/s41598-017-15071-8, 2017a. a
Tuet, W. Y., Chen, Y., Xu, L., Fok, S., Gao, D., Weber, R. J., and Ng, N. L.: Chemical oxidative potential of secondary organic aerosol (SOA) generated from the photooxidation of biogenic and anthropogenic volatile organic compounds, Atmos. Chem. Phys., 17, 839–853, https://doi.org/10.5194/acp-17-839-2017, 2017b. a
Tuet, W. Y., Liu, F., de Oliveira Alves, N., Fok, S., Artaxo, P., Vasconcellos, P., Champion, J. A., and Ng, N. L.: Chemical Oxidative Potential and Cellular Oxidative Stress from Open Biomass Burning Aerosol, Environ. Sci. Tech. Let., 6, 126–132, https://doi.org/10.1021/acs.estlett.9b00060, 2019. a
US EPA: Positive Matrix Factorization Model for Environmental Data Analyses, available at: https://www.epa.gov/air-research/positive-matrix-factorization-model-environmental-data-analyses (last access: 21 July 2021), 2017. a
Verlhac, S., Favez, O., and Albinet, A.: Interlaboratory comparison organized for the European laboratories involved in the analysis of levoglucosan and its isomers, LCSQA, Verneuil-en-Halatte, 2013. a
Verma, V., Ning, Z., Cho, A. K., Schauer, J. J., Shafer, M. M., and Sioutas, C.: Redox Activity of Urban Quasi-Ultrafine Particles from Primary and Secondary Sources, Atmos. Environ., 43, 6360–6368, https://doi.org/10.1016/j.atmosenv.2009.09.019, 2009. a
Verma, V., Fang, T., Guo, H., King, L., Bates, J. T., Peltier, R. E., Edgerton, E., Russell, A. G., and Weber, R. J.: Reactive oxygen species associated with water-soluble PM2.5 in the southeastern United States: spatiotemporal trends and source apportionment, Atmos. Chem. Phys., 14, 12915–12930, https://doi.org/10.5194/acp-14-12915-2014, 2014. a, b, c, d, e
Verma, V., Fang, T., Xu, L., Peltier, R. E., Russell, A. G., Ng, N. L., and Weber, R. J.: Organic Aerosols Associated with the Generation of Reactive Oxygen Species (ROS) by Water-Soluble PM2.5, Environ. Sci. Technol., 49, 4646–4656, https://doi.org/10.1021/es505577w, 2015a. a
Verma, V., Wang, Y., El-Afifi, R., Fang, T., Rowland, J., Russell, A. G., and Weber, R. J.: Fractionating Ambient Humic-like Substances (HULIS) for Their Reactive Oxygen Species Activity – Assessing the Importance of Quinones and Atmospheric Aging, Atmos. Environ., 120, 351–359, https://doi.org/10.1016/j.atmosenv.2015.09.010, 2015b. a
Vlachou, A., Daellenbach, K. R., Bozzetti, C., Chazeau, B., Salazar, G. A., Szidat, S., Jaffrezo, J.-L., Hueglin, C., Baltensperger, U., Haddad, I. E., and Prévôt, A. S. H.: Advanced source apportionment of carbonaceous aerosols by coupling offline AMS and radiocarbon size-segregated measurements over a nearly 2-year period, Atmos. Chem. Phys., 18, 6187–6206, https://doi.org/10.5194/acp-18-6187-2018, 2018. a
Vlachou, A., Tobler, A., Lamkaddam, H., Canonaco, F., Daellenbach, K. R., Jaffrezo, J.-L., Minguillón, M. C., Maasikmets, M., Teinemaa, E., Baltensperger, U., El Haddad, I., and Prévôt, A. S. H.: Development of a versatile source apportionment analysis based on positive matrix factorization: a case study of the seasonal variation of organic aerosol sources in Estonia, Atmos. Chem. Phys., 19, 7279–7295, https://doi.org/10.5194/acp-19-7279-2019, 2019. a
Wagstrom, K. M., Pandis, S. N., Yarwood, G., Wilson, G. M., and Morris, R. E.: Development and Application of a Computationally Efficient Particulate Matter Apportionment Algorithm in a Three-Dimensional Chemical Transport Model, Atmos. Environ., 42, 5650–5659, https://doi.org/10.1016/j.atmosenv.2008.03.012, 2008. a
Waked, A., Favez, O., Alleman, L. Y., Piot, C., Petit, J.-E., Delaunay, T., Verlinden, E., Golly, B., Besombes, J.-L., Jaffrezo, J.-L., and Leoz-Garziandia, E.: Source apportionment of PM10 in a north-western Europe regional urban background site (Lens, France) using positive matrix factorization and including primary biogenic emissions, Atmos. Chem. Phys., 14, 3325–3346, https://doi.org/10.5194/acp-14-3325-2014, 2014. a, b, c, d
Wang, J., Jiang, H., Jiang, H., Mo, Y., Geng, X., Li, J., Mao, S., Bualert, S., Ma, S., Li, J., and Zhang, G.: Source Apportionment of Water-Soluble Oxidative Potential in Ambient Total Suspended Particulate from Bangkok: Biomass Burning versus Fossil Fuel Combustion, Atmos. Environ., 235, 117624, https://doi.org/10.1016/j.atmosenv.2020.117624, 2020. a
Wang, X., Qian, Z., Wang, X., Hong, H., Yang, Y., Xu, Y., Xu, X., Yao, Z., Zhang, L., Rolling, C. A., Schootman, M., Liu, T., Xiao, J., Li, X., Zeng, W., Ma, W., and Lin, H.: Estimating the Acute Effects of Fine and Coarse Particle Pollution on Stroke Mortality of in Six Chinese Subtropical Cities, Environ. Pollut., 239, 812–817, https://doi.org/10.1016/j.envpol.2018.04.102, 2018. a
Wang, Z., Chien, C.-J., and Tonnesen, G. S.: Development of a Tagged Species Source Apportionment Algorithm to Characterize Three-Dimensional Transport and Transformation of Precursors and Secondary Pollutants, J. Geophys. Res.-Atmos., 114, D21, https://doi.org/10.1029/2008JD010846, 2009. a
Waskom, M. L.: seaborn: statistical data visualization, J. Open Source Softw., 6, 3021, https://doi.org/10.21105/joss.03021, 2021. a
Weber, S.: Get OP stand OP website [code], University Grenoble Alpes, available at: https://gricad-gitlab.univ-grenoble-alpes.fr/pmall/app_op, last access: 27 July 2021. a
Weber, S., Uzu, G., Calas, A., Chevrier, F., Besombes, J.-L., Charron, A., Salameh, D., Ježek, I., Močnik, G., and Jaffrezo, J.-L.: An apportionment method for the oxidative potential of atmospheric particulate matter sources: application to a one-year study in Chamonix, France, Atmos. Chem. Phys., 18, 9617–9629, https://doi.org/10.5194/acp-18-9617-2018, 2018. a, b, c, d, e, f, g, h, i
Weber, S., Salameh, D., Albinet, A., Alleman, L. Y., Waked, A., Besombes, J.-L., Jacob, V., Guillaud, G., Mesbah, B., Rocq, B., Hulin, A., Dominik-Sègue, M., Chrétien, E., Jaffrezo, J.-L., and Favez, O.: Comparison of PM10 Sources Profiles at 15 French Sites Using a Harmonized Constrained Positive Matrix Factorization Approach, Atmosphere, 10, 310, https://doi.org/10.3390/atmos10060310, 2019. a, b, c, d, e, f, g, h, i
Weichenthal, S., Crouse, D. L., Pinault, L., Godri-Pollitt, K., Lavigne, E., Evans, G., van Donkelaar, A., Martin, R. V., and Burnett, R. T.: Oxidative Burden of Fine Particulate Air Pollution and Risk of Cause-Specific Mortality in the Canadian Census Health and Environment Cohort (CanCHEC), Environ. Res., 146, 92–99, https://doi.org/10.1016/j.envres.2015.12.013, 2016. a, b
World Health Organization: Review of Evidence on Health Aspects of Air Pollution – REVIHAAP Project, Tech. rep., WHO European Centre for Environment and Health, Copenhagen, Denmark, 2013. a
World Health Organization: Ambient Air Pollution: A Global Assessment of Exposure and Burden of Disease, Tech. rep., World Health Organization, Geneva, Switzerland, 2016. a
Yang, A., Janssen, N. A. H., Brunekreef, B., Cassee, F. R., Hoek, G., and Gehring, U.: Children's Respiratory Health and Oxidative Potential of PM2.5: The PIAMA Birth Cohort Study, Occup. Environ. Med., 73, 154–160, https://doi.org/10.1136/oemed-2015-103175, 2016. a
Yttri, K. E., Schnelle-Kreis, J., Maenhaut, W., Abbaszade, G., Alves, C., Bjerke, A., Bonnier, N., Bossi, R., Claeys, M., Dye, C., Evtyugina, M., García-Gacio, D., Hillamo, R., Hoffer, A., Hyder, M., Iinuma, Y., Jaffrezo, J.-L., Kasper-Giebl, A., Kiss, G., López-Mahia, P. L., Pio, C., Piot, C., Ramirez-Santa-Cruz, C., Sciare, J., Teinilä, K., Vermeylen, R., Vicente, A., and Zimmermann, R.: An intercomparison study of analytical methods used for quantification of levoglucosan in ambient aerosol filter samples, Atmos. Meas. Tech., 8, 125–147, https://doi.org/10.5194/amt-8-125-2015, 2015. a
Zhang, X., Staimer, N., Gillen, D. L., Tjoa, T., Schauer, J. J., Shafer, M. M., Hasheminassab, S., Pakbin, P., Vaziri, N. D., Sioutas, C., and Delfino, R. J.: Associations of Oxidative Stress and Inflammatory Biomarkers with Chemically-Characterized Air Pollutant Exposures in an Elderly Cohort, Environ. Res., 150, 306–319, https://doi.org/10.1016/j.envres.2016.06.019, 2016. a
Zhang, Y., Favez, O., Petit, J.-E., Canonaco, F., Truong, F., Bonnaire, N., Crenn, V., Amodeo, T., Prévôt, A. S. H., Sciare, J., Gros, V., and Albinet, A.: Six-year source apportionment of submicron organic aerosols from near-continuous highly time-resolved measurements at SIRTA (Paris area, France), Atmos. Chem. Phys., 19, 14755–14776, https://doi.org/10.5194/acp-19-14755-2019, 2019. a
Zhou, J., Elser, M., Huang, R.-J., Krapf, M., Fröhlich, R., Bhattu, D., Stefenelli, G., Zotter, P., Bruns, E. A., Pieber, S. M., Ni, H., Wang, Q., Wang, Y., Zhou, Y., Chen, C., Xiao, M., Slowik, J. G., Brown, S., Cassagnes, L.-E., Daellenbach, K. R., Nussbaumer, T., Geiser, M., Prévôt, A. S. H., El-Haddad, I., Cao, J., Baltensperger, U., and Dommen, J.: Predominance of secondary organic aerosol to particle-bound reactive oxygen species activity in fine ambient aerosol, Atmos. Chem. Phys., 19, 14703–14720, https://doi.org/10.5194/acp-19-14703-2019, 2019. a, b, c, d
- Abstract
- Introduction
- Materials and methods
- Results and discussion
- Limitations of the study
- Conclusions
- Appendix A: Correlation between OP, chemical species, and sources
- Code and data availability
- Author contributions
- Competing interests
- Disclaimer
- Acknowledgements
- Financial support
- Review statement
- References
- Supplement