the Creative Commons Attribution 4.0 License.
the Creative Commons Attribution 4.0 License.
 | 23 Jul 2021
Sunlight-absorbing aerosol amplifies the seasonal cycle in low-cloud fraction over the southeast Atlantic
Jianhao Zhang
Paquita Zuidema
The mean altitude of the smoke loading over the southeast Atlantic moves from the boundary layer in July to the free troposphere by October. This study details the month-by-month changes in cloud properties and the large-scale environment as a function of the biomass burning aerosol loading at Ascension Island (8∘ S, 14.5∘ W) from July to October, based on island measurements, satellite retrievals, and reanalysis. In July and August, the smoke loading predominantly varies within the boundary layer. During both months, the low-cloud fraction is less and is increasingly cumuliform when more smoke is present, with the exception of a late morning boundary layer deepening that encourages a short-lived cloud development. The meteorology varies little, suggesting aerosol–cloud interactions explain the cloudiness changes. September marks a transition month during which midlatitude disturbances can intrude into the Atlantic subtropics, constraining the free tropospheric aerosol closer to the African coast. Stronger boundary layer winds on cleaner days help deepen, dry, and cool much of the marine boundary layer compared to that on days with high smoke loadings, with stratocumulus reducing everywhere but at the northern deck edge. The September free troposphere is better mixed on smoky days compared to October. Longwave cooling rates, generated by a sharp water vapor gradient at the aerosol layer top, encourage a small-scale vertical mixing that could help maintain the well-mixed smoky September free troposphere. The October meteorology primarily varies as a function of the strength of the free tropospheric winds advecting aerosol offshore. The free tropospheric aerosol loading is less than in September, and the moisture variability is greater. Low-level clouds increase and are more stratiform in October when the smoke loadings are higher. The increased free tropospheric moisture can help sustain the clouds through a reduction in evaporative drying during cloud-top entrainment. Enhanced subsidence above the coastal upwelling region, increasing cloud droplet number concentrations, may further prolong cloud lifetime through microphysical interactions. Reduced subsidence underneath stronger free tropospheric winds at Ascension Island supports slightly higher cloud tops during smokier conditions. Overall, the monthly changes in the large-scale aerosol and moisture vertical structure act to amplify the seasonal cycle in low-cloud amount and morphology. This is climatically important, as cloudiness changes dominate changes in the top-of-atmosphere radiation budget.
- Article
(9981 KB) - Full-text XML
-
Supplement
(686 KB) - BibTeX
- EndNote


The impact of absorbing aerosol on marine boundary layer clouds is governed by the relative location of the aerosol layer to the cloud layer, with aerosol embedded within the cloud layer, giving rise to local aerosol–cloud microphysical and radiative interactions, while aerosol above a cloud layer can only be radiatively active until it is entrained into the cloud (Johnson et al., 2004; Johnson, 2005; Costantino and Bréon, 2013; Yamaguchi et al., 2015; Zhou et al., 2017; Zhang and Zuidema, 2019; Kacarab et al., 2020; Herbert et al., 2020; Che et al., 2021). Many studies focusing on the southeastern Atlantic region apply a seasonal averaging to improve the robust detection of absorbing aerosol impacts (e.g., Wilcox, 2010, 2012; Adebiyi and Zuidema, 2018; Mallet et al., 2020). This averages, over a noticeable rise in the smoke layer mostly from within the boundary layer in July (Zuidema et al., 2018) to a mixture of boundary layer and free tropospheric smoke in August (Zhang and Zuidema, 2019; Redemann et al., 2021; Haywood et al., 2021), which is mostly above and distinctly separated from the cloud layer by September and October (Shinozuka et al., 2020; Redemann et al., 2021; Haywood et al., 2021).
Zhang and Zuidema (2019, hereafter ZZ19) characterized the diurnal behavior of the cloudy boundary layer thermodynamic structure as a function of the near-surface smoke loading during August over Ascension Island (8∘ S, 14.5∘ W). This was motivated by the observation that the near-surface refractory black carbon (rBC) mass concentrations are largest during August, based on measurements from 2 years gathered through the Layered Atlantic Smoke Interactions with Clouds (LASIC; Zuidema et al., 2015, 2018) campaign. When more smoke is present within the marine boundary layer (MBL) in August, low clouds are fewer, with lower liquid water paths and lower precipitation frequencies and intensities compared to clouds occupying a cleaner MBL. The reduction in cloudiness, which often spans multiple days, is consistent with a boundary layer semi-direct effect (Ackerman et al., 2000) wherein the relative humidity is reduced within a warmer boundary layer and less able to sustain cloud. The August analyses also support a novel finding in which the boundary layer is more coupled in the late morning (after sunrise) under smokier conditions, facilitating the cloud vertical development and deepening the boundary layer. Boundary layer decoupling from afternoon to predawn encourages the trapping of subcloud moisture that is then ventilated upwards in the morning. The coupling is short-lived, and most of the cloudiness reduction occurs in the afternoon.
Here we build on ZZ19 and extend the analyses to the other months with biomass burning aerosol, straddling July through October. Already known is that the free tropospheric transport of smoke to the remote part of the southeast Atlantic is related to variability in the strength of the southern African easterly jet (AEJ-S; Adebiyi and Zuidema, 2016), primarily during September–October, and that the AEJ-S can also advect water vapor (Adebiyi et al., 2015; Deaconu et al., 2019; Pistone et al., 2021). The meteorology governing aerosol transport in July–August is less well known, although case studies indicate that lower-level easterlies bring aerosol in closer contact with the cloud layer then, easing entrainment (Diamond et al., 2018; Zuidema et al., 2018). Also less well known is how the cloud properties are influenced solely by meteorology, separate from the aerosol transport, and by the co-varying moisture loading. This affects our understanding of how much synoptics could also be imprinting into possible aerosol–cloud interactions. The unique island-based field measurements, combined with specifically developed satellite data sets, provide more detailed characterizations capable of supporting new insights than were possible prior to 2016.
This study characterizes the subseasonal evolution in low-cloud properties and thermodynamic structures as a function of the aerosol loading from July–October in 2016 and 2017. LASIC field measurements are combined with space-based retrievals of aerosol and low-cloud properties that can distinguish the above-cloud aerosol optical depth (Meyer et al., 2015), diurnally resolved geostationary satellite cloud retrievals, and the newer ERA5 reanalysis (Hersbach et al., 2020). Compositing methods and data sets are introduced in Sect. 2. Sections 3–6 present an overview of the seasonal cycle and the observed differences by month for high and low smoke loading. Section 7 illustrates how sharp water vapor gradient in the free troposphere can help maintain a well-mixed free troposphere. Section 8 summarizes the key findings.
Ground-based measurements were collected by the Department of Energy (DOE) Atmospheric Radiation Measurement (ARM) Mobile Facility 1 (AMF1; Miller et al., 2016). Radiosonde measurements of temperature, water vapor mixing ratio (qv), relative humidity (RH), and wind characterize the thermodynamic and dynamic vertical structure above Ascension Island and St. Helena (5∘ W, 15∘ S; southeast of Ascension Island; hereafter Ascension). Cloud capping inversion base and top heights are derived from the radiosonde potential temperature (θ) and qv profiles following Yin and Albrecht (2000), with corrections made to profiles that fail the identification algorithm based on visual inspections. An intensive observation period in 2016 deployed eight radiosondes per day in August–September and otherwise four per day. A Ka band 35 GHz zenith-pointing cloud radar (KAZR) provides the diurnal cycle of the cloud vertical structure. Microwave radiometers at both the AMF1 site and the airport (∼5 km away from the AMF1) provide a measure of the cloud liquid water path (LWP). Surface rain frequencies and intensities were measured by a disdrometer and a tipping bucket rain gauge at the AMF1 site. No radar or disdrometer data are available for October 2017. The near-surface rBC mass concentrations are derived from a single-particle soot photometer (SP2). A micropulse lidar underpins vertically resolved extinction profiles (Delgadillo et al., 2018) for the radiative transfer calculations. Surface observers from the United Kingdom's Meteorological Office at Ascension Island, trained to look away from the island, report cloud types following the World Meteorological Organization's (WMO) protocol (WMO, 1974) every 3 h. These reports inform the frequency of occurrence of cumuliform and stratiform clouds over Ascension. Cumuliform clouds include low-cloud type 1 (CL=1; cumulus with little vertical extent) and CL=2 (cumulus with moderate or strong vertical extent). Stratiform clouds include CL=4 (stratocumulus formed by the spreading out of cumulus), CL=5 (stratocumulus), CL=6 (stratus but not of bad weather), and CL=8 (stratocumulus and cumulus with bases at different levels). Detailed descriptions of LASIC observations, including quality control and post-processing information, can be found in Sect. 2 of ZZ19.
The MODerate resolution Imaging Spectroradiometer (MODIS) on board the Terra and Aqua satellites supported collection 6 retrievals of liquid cloud properties (Platnick et al., 2003) and fine-mode aerosol optical depths at 550 nm (τaf; Levy et al., 2013) at 1∘ resolution (level 3). The fine-mode distinction is chosen to exclude contributions from large nonsmoke particles, primarily from sea spray. Above-cloud aerosol optical depth at 550 nm (ACAOD) from the same platforms, at 0.1∘ resolution, are available from Meyer et al. (2015, hereafter MODIS–Meyer). Cloud droplet number concentrations (Nd) are calculated based on cloud effective radius (re) and cloud optical thickness (τcld) from the MODIS–Meyer product, following Painemal and Zuidema (2011). MODIS–Meyer cloud and aerosol retrievals are aggregated to 1∘ resolution to match the level 3 MODIS retrievals, if the former can provide an areal coverage of at least 20 %. Daily mean MODIS-based retrievals rely on averages between the Terra and Aqua retrievals weighted by their frequency, subsequently averaged spatially over 2∘ by 2∘, 3∘ by 3∘, and 4∘ by 4∘ domains centered on Ascension. Low-cloud fractions across the diurnal cycle are retrieved using the visible infrared solar-infrared split window technique (VISST; Minnis et al., 2008) from the Spinning Enhanced Visible and Infrared Imager (SEVIRI) on board the geostationary Meteosat-10 satellite. These are averaged over a 4∘ by 4∘ domain latitudinally centered on Ascension but centered slightly to the island's east (6–10∘ S, 15–11∘ W) to better capture the upwind clouds more typical of the island. All-sky albedos at the top of atmosphere (TOA), at Terra and Aqua overpass times, are the ratio of the reflected shortwave fluxes at TOA to the incoming solar radiation measured by the Clouds and the Earth's Radiant Energy Systems (CERES; Wielicki et al., 1996) sensors, drawing on the CERES Single Scanner Footprint (SSF; resolution of 20 km; edition 4) product (Su et al., 2015).
Geopotential height, temperature, and wind velocity maps are based on the European Centre for Medium-Range Weather Forecasts (ECMWF) fifth-generation atmospheric reanalysis (ERA5; Hersbach et al., 2020), available every hour and gridded to 0.25∘ spatial resolution. Back trajectories from Ascension at 2000 m, or just above the cloud tops, help indicate the transport of aerosol most likely to entrain into the boundary layer near Ascension. The back trajectories rely on the NOAA Hybrid Single-Particle Lagrangian Integrated Trajectory (HYSPLIT; Draxler and Hess, 1998) model, initialized by the NOAA National Center for Environmental Prediction (NCEP) Global Data Assimilation System (GDAS) at 0.5∘ spatial resolution and relying on the model vertical velocity. Radiative transfer calculations rely on the Atmospheric and Environmental Research Rapid Radiative Transfer Model for Global Climate Models (RRTMG; Clough et al., 2005), using version 4.84 of the longwave (LW) code and version 3.8 of the shortwave (SW) code.
The basic approach is to construct composites of the more and less smoky conditions for each month and to analyze the differences in cloud properties with an eye on the accompanying meteorology and aerosol. Composites can identify representative conditions more robustly than case studies and are more forgiving of anomalies as long as the anomalies do not dominate. A difficulty rests with what to call smoky in each month; surface-based measurements may not be indicative of the free tropospheric aerosol loading and vice versa. Joint histograms of daily ACAOD and rBC mass concentrations over Ascension, by month, indicate that smoke is predominantly present in the boundary layer during July, equally frequent in the boundary layer and free troposphere in August, and mostly in the free troposphere in September and October (Fig. 1a–d). This is consistent with aircraft in situ and lidar assessments, when available (Haywood et al., 2021; Redemann et al., 2021), and with the surface-based lidar assessments, although the latter can be obscured by lower cloud, and, as a point measurement, may not be representative of a larger region. Yet, ACAOD is only available when there is cloud underneath (Meyer et al., 2015), allowing free tropospheric smoke in clear conditions to go undetected. The ACAOD measure may be most suspect in July, when there is less low-cloud compared to other months (ZZ19). To better detect all smoke, the daily mean clear-sky τaf is also examined. The joint histogram of τaf and rBC mass concentrations in July confirms that the free troposphere is frequently clean and that smoky periods primarily consist of high loading of near-surface rBC mass concentrations (Fig. 1e). Later in the season, in September and October, the level of agreement between the joint histograms of rBC–ACAOD and rBC–τaf further supports the interpretation of a shift in smoke vertical distribution towards the free troposphere over time (Fig. 1g and h). That said, ACAOD and τaf are not entirely interchangeable, with a correlation of only ∼0.55 over a 3∘ by 3∘ domain average in September and October and with ACAOD often exceeding τaf (Fig. 2). Comparisons to aircraft-derived above-cloud aerosol optical depths reveal a genuinely high bias to the satellite ACAOD estimates (Chang et al., 2021) which is thought to reflect too high a single-scattering albedo assumption within the retrieval (Peers et al., 2021).
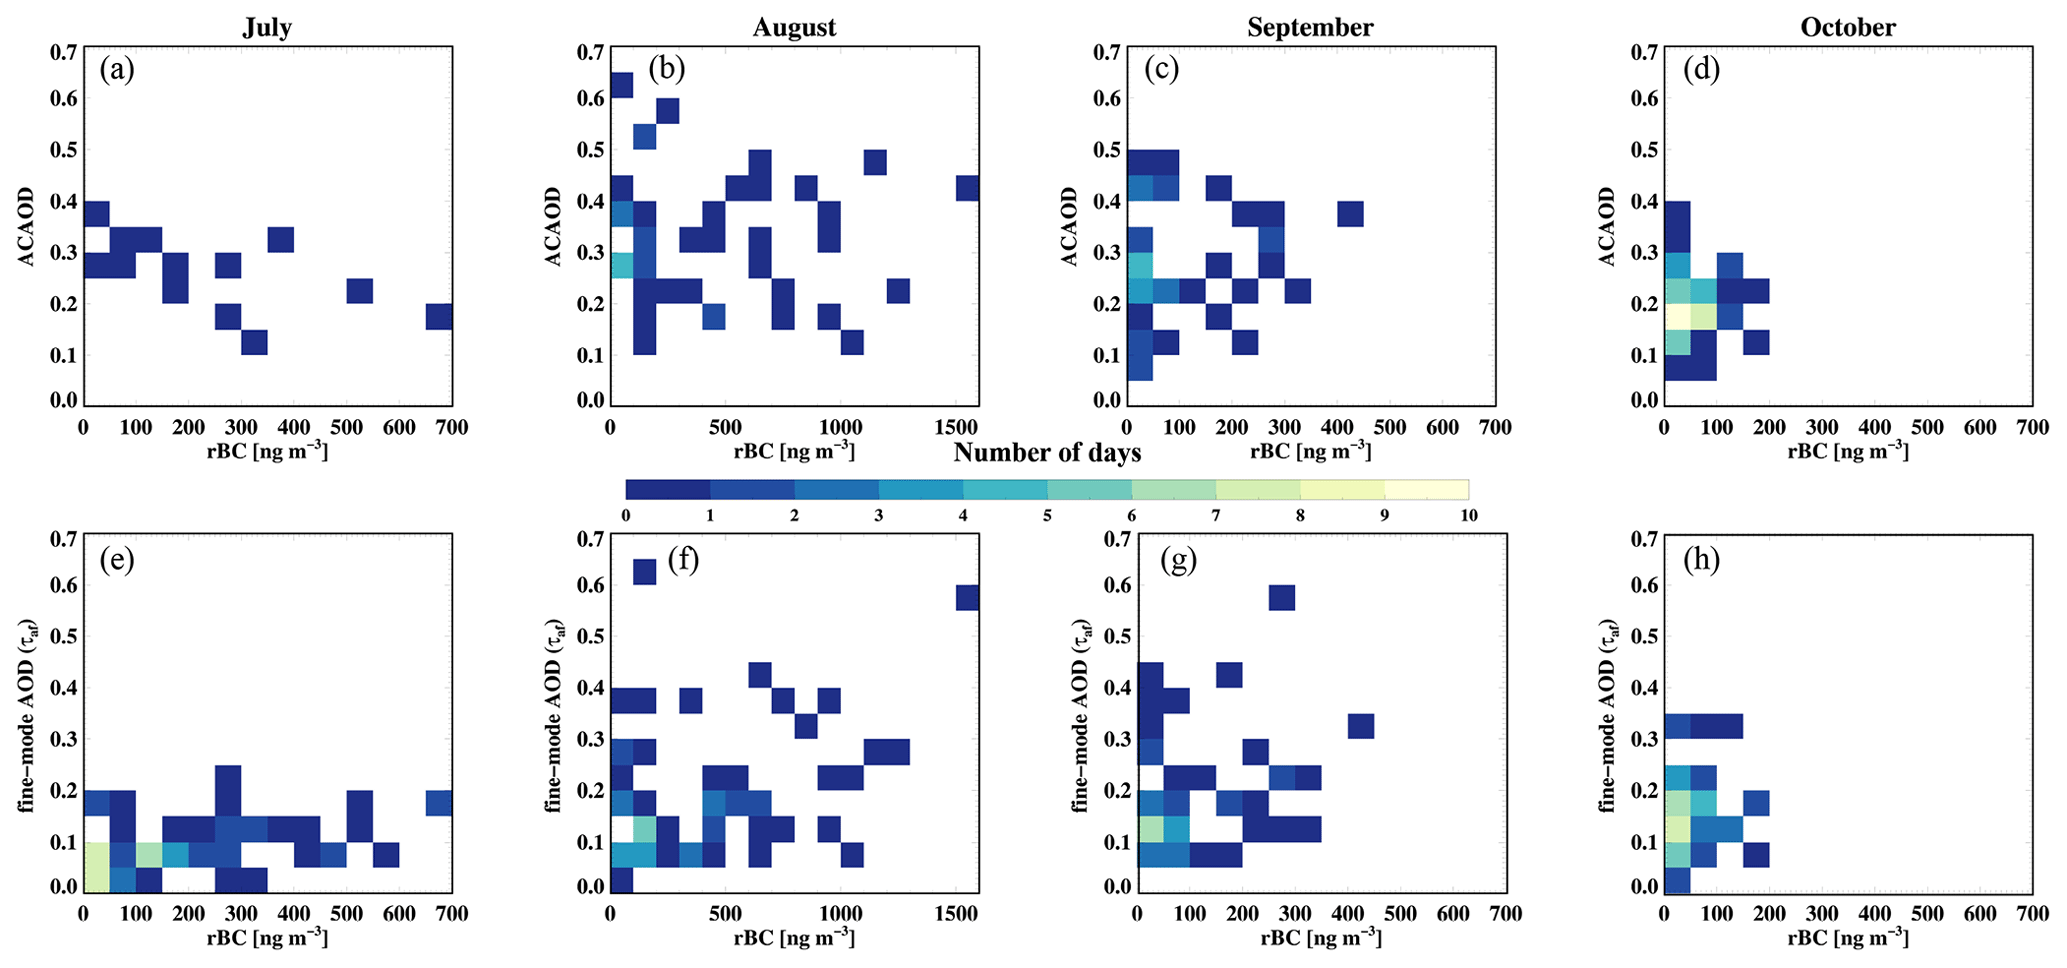
Figure 1Joint histogram of (a–d) MODIS–Meyer above-cloud aerosol optical depth (ACAOD; Meyer et al., 2015) and near-surface rBC mass concentrations and a joint histogram of (e–h) MODIS-retrieved fine-mode AOD (τaf) and rBC mass concentrations for July through October, by month, for 2016 and 2017 combined. Note that the x axis range is larger for August than the other months.
Elevated smoke layers are rarely present over Ascension in July (Fig. 1a). A few days exist with high ACAOD (above 0.2), with those in 2017 coinciding with high near-surface rBC mass concentrations, but this is not so in early July 2016 (Fig. 3) and is confirmed by lidar observations (not shown). Variations in column τaf track the near-surface rBC variations, except for early July 2016 (Fig. 3). This suggests that the surface-based rBC values can reasonably indicate when aerosol exists within the atmospheric column, most of the time, for July. In August, τaf and ACAOD variations are instead more similar when they are both available within a 3∘ by 3∘ domain. High ACAODs τafs appear to anticipate high near-surface smoke loadings by up to a week (Fig. 3). As an elevated smoke layer is almost always present above Ascension during August (Fig. 1b and visual inspections of island-based lidar profiles), surface-based rBC variations are deemed to better represent the variability in total column aerosol loading than ACAOD. Therefore, for August, the composite classifications follow those of ZZ19, which are based on the near-surface smoke loading. Occasionally, an increase in the free tropospheric smoke loadings is evident over the larger (3∘ by 3∘) domain before it is perceived by the island-based rBC measurement, for example, during the third week in August 2016. In September and October, the near-surface smoke loadings are much less than in July–August (Fig. 1), and τaf and ACAOD vary more similarly instead (Fig. 3). The τaf confirm that those days with missing ACAODs indeed correspond to days with little free tropospheric aerosol (e.g., early September 2016; second week of October 2016 and 2017).
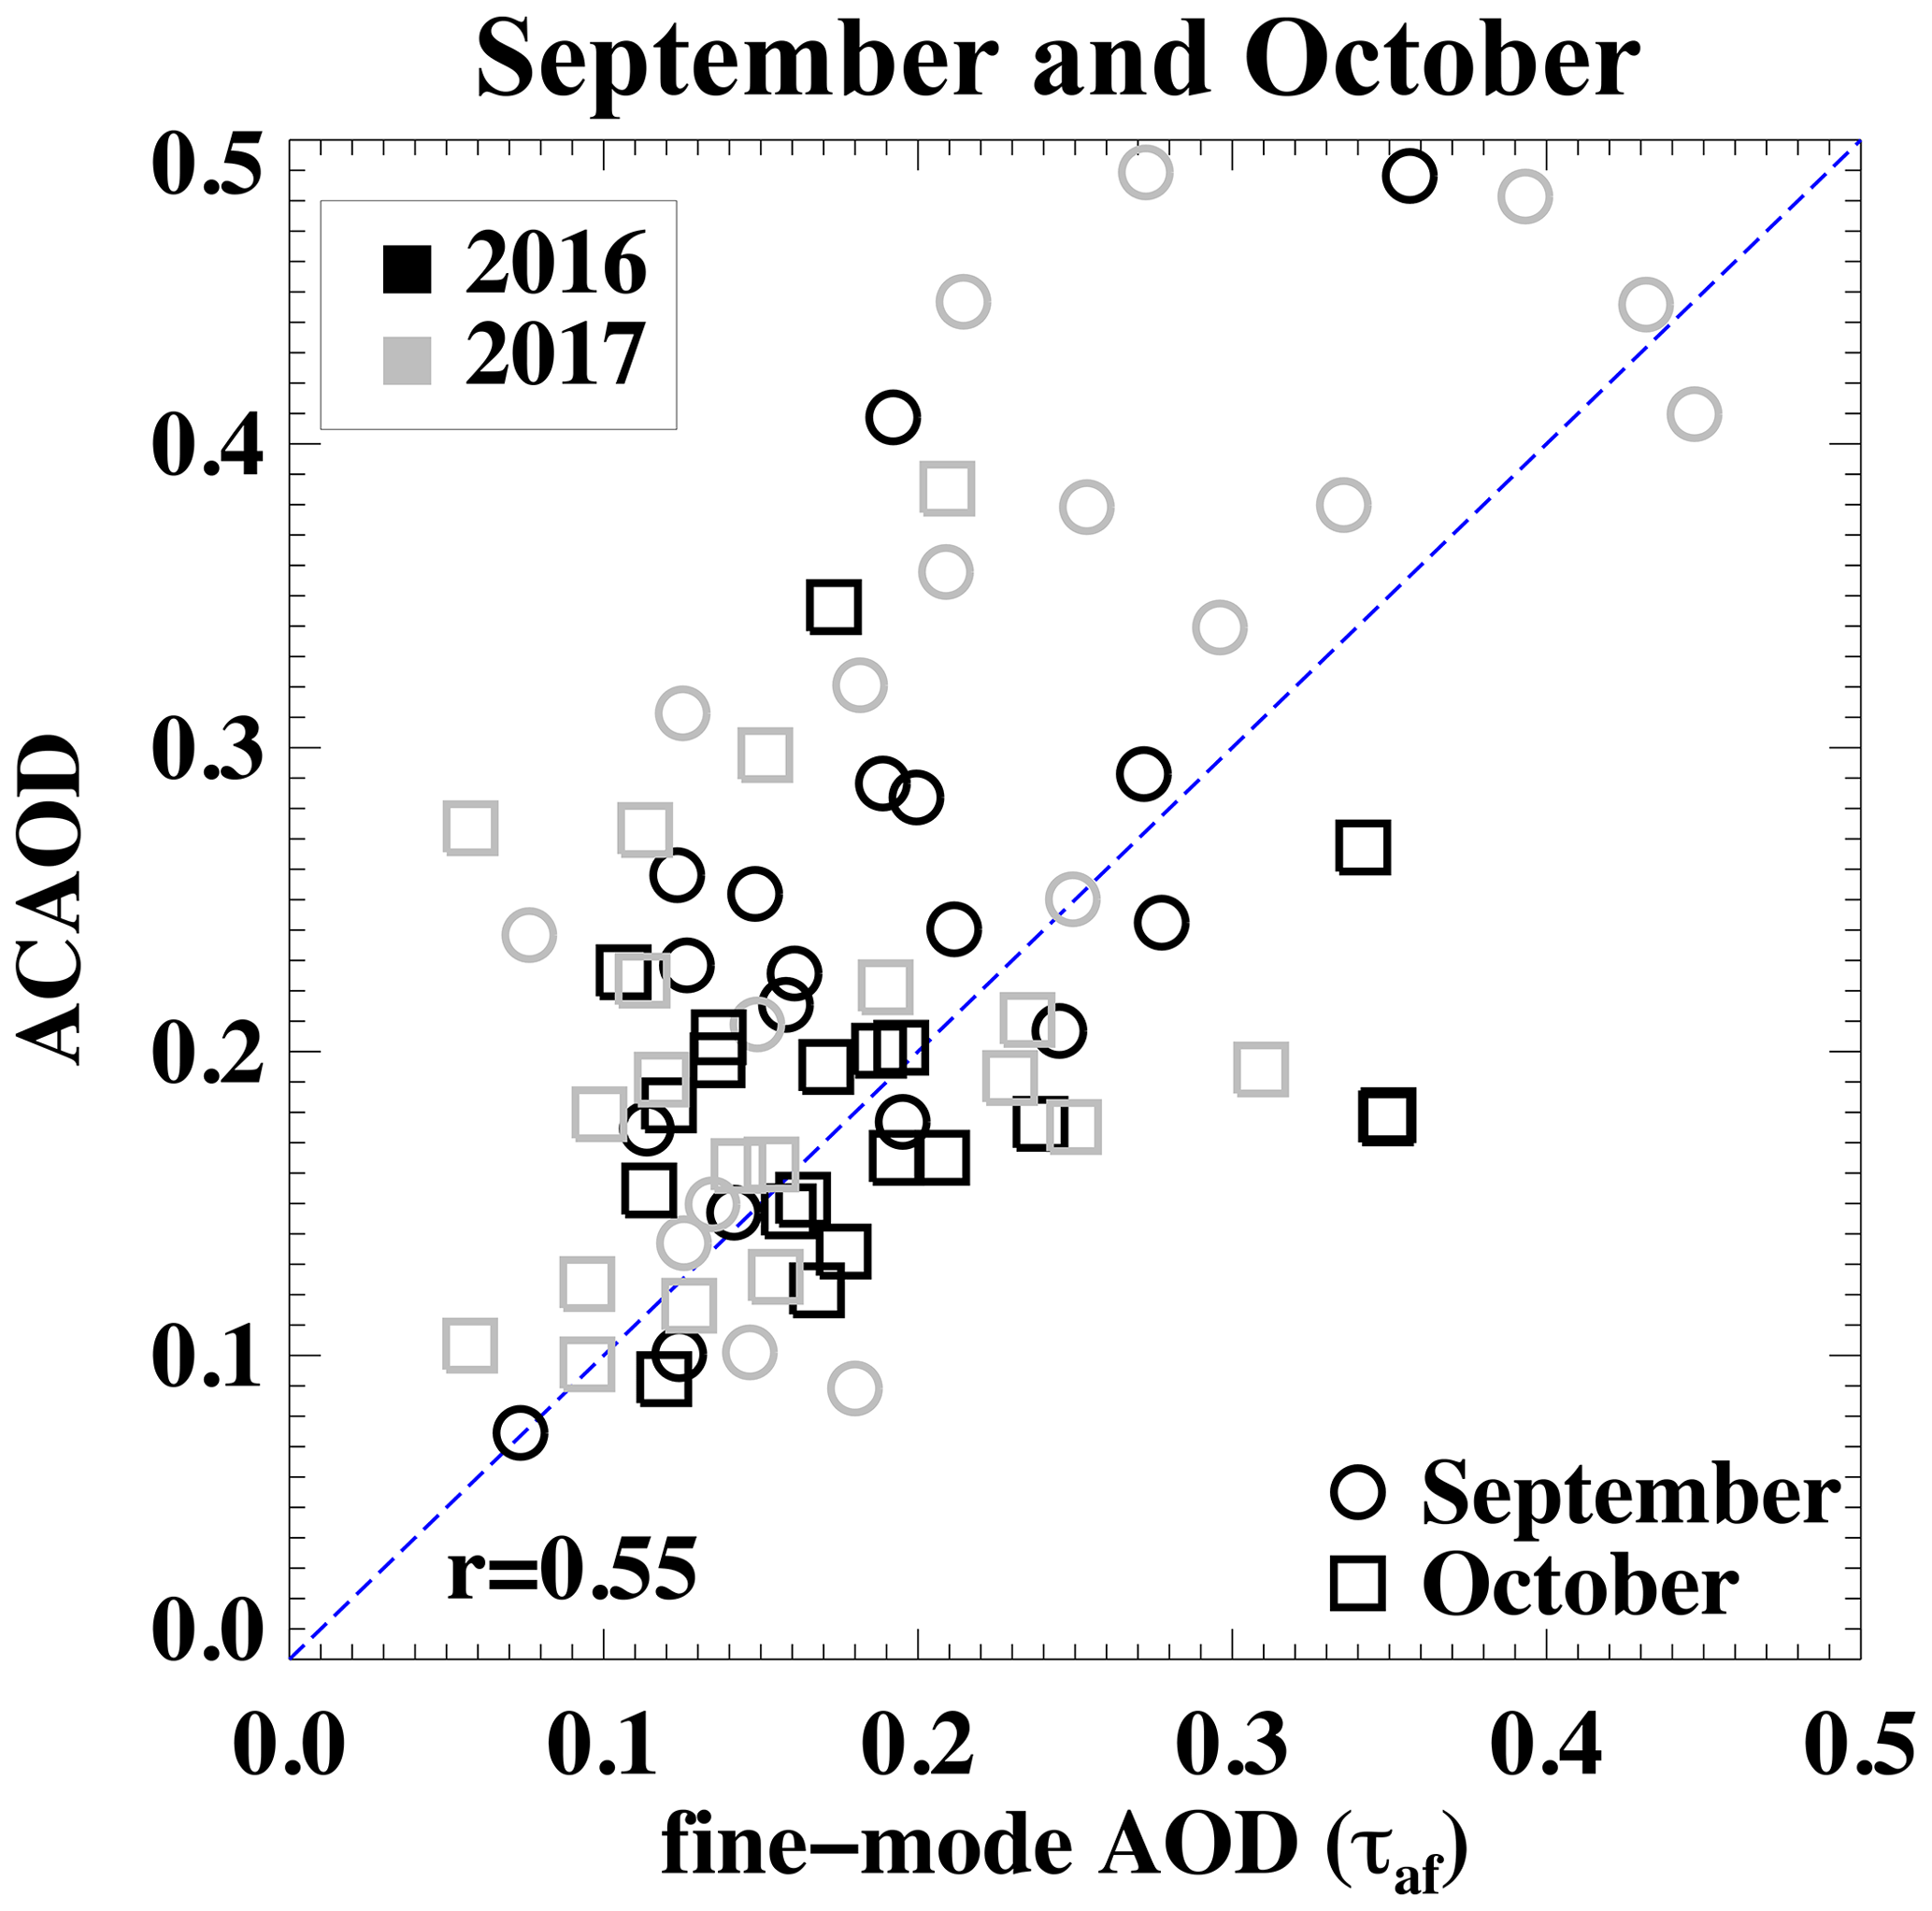
Figure 2MODIS–Meyer ACAOD versus MODIS fine-mode AOD (τaf), for September and October, using 3∘ by 3∘ domain averages.
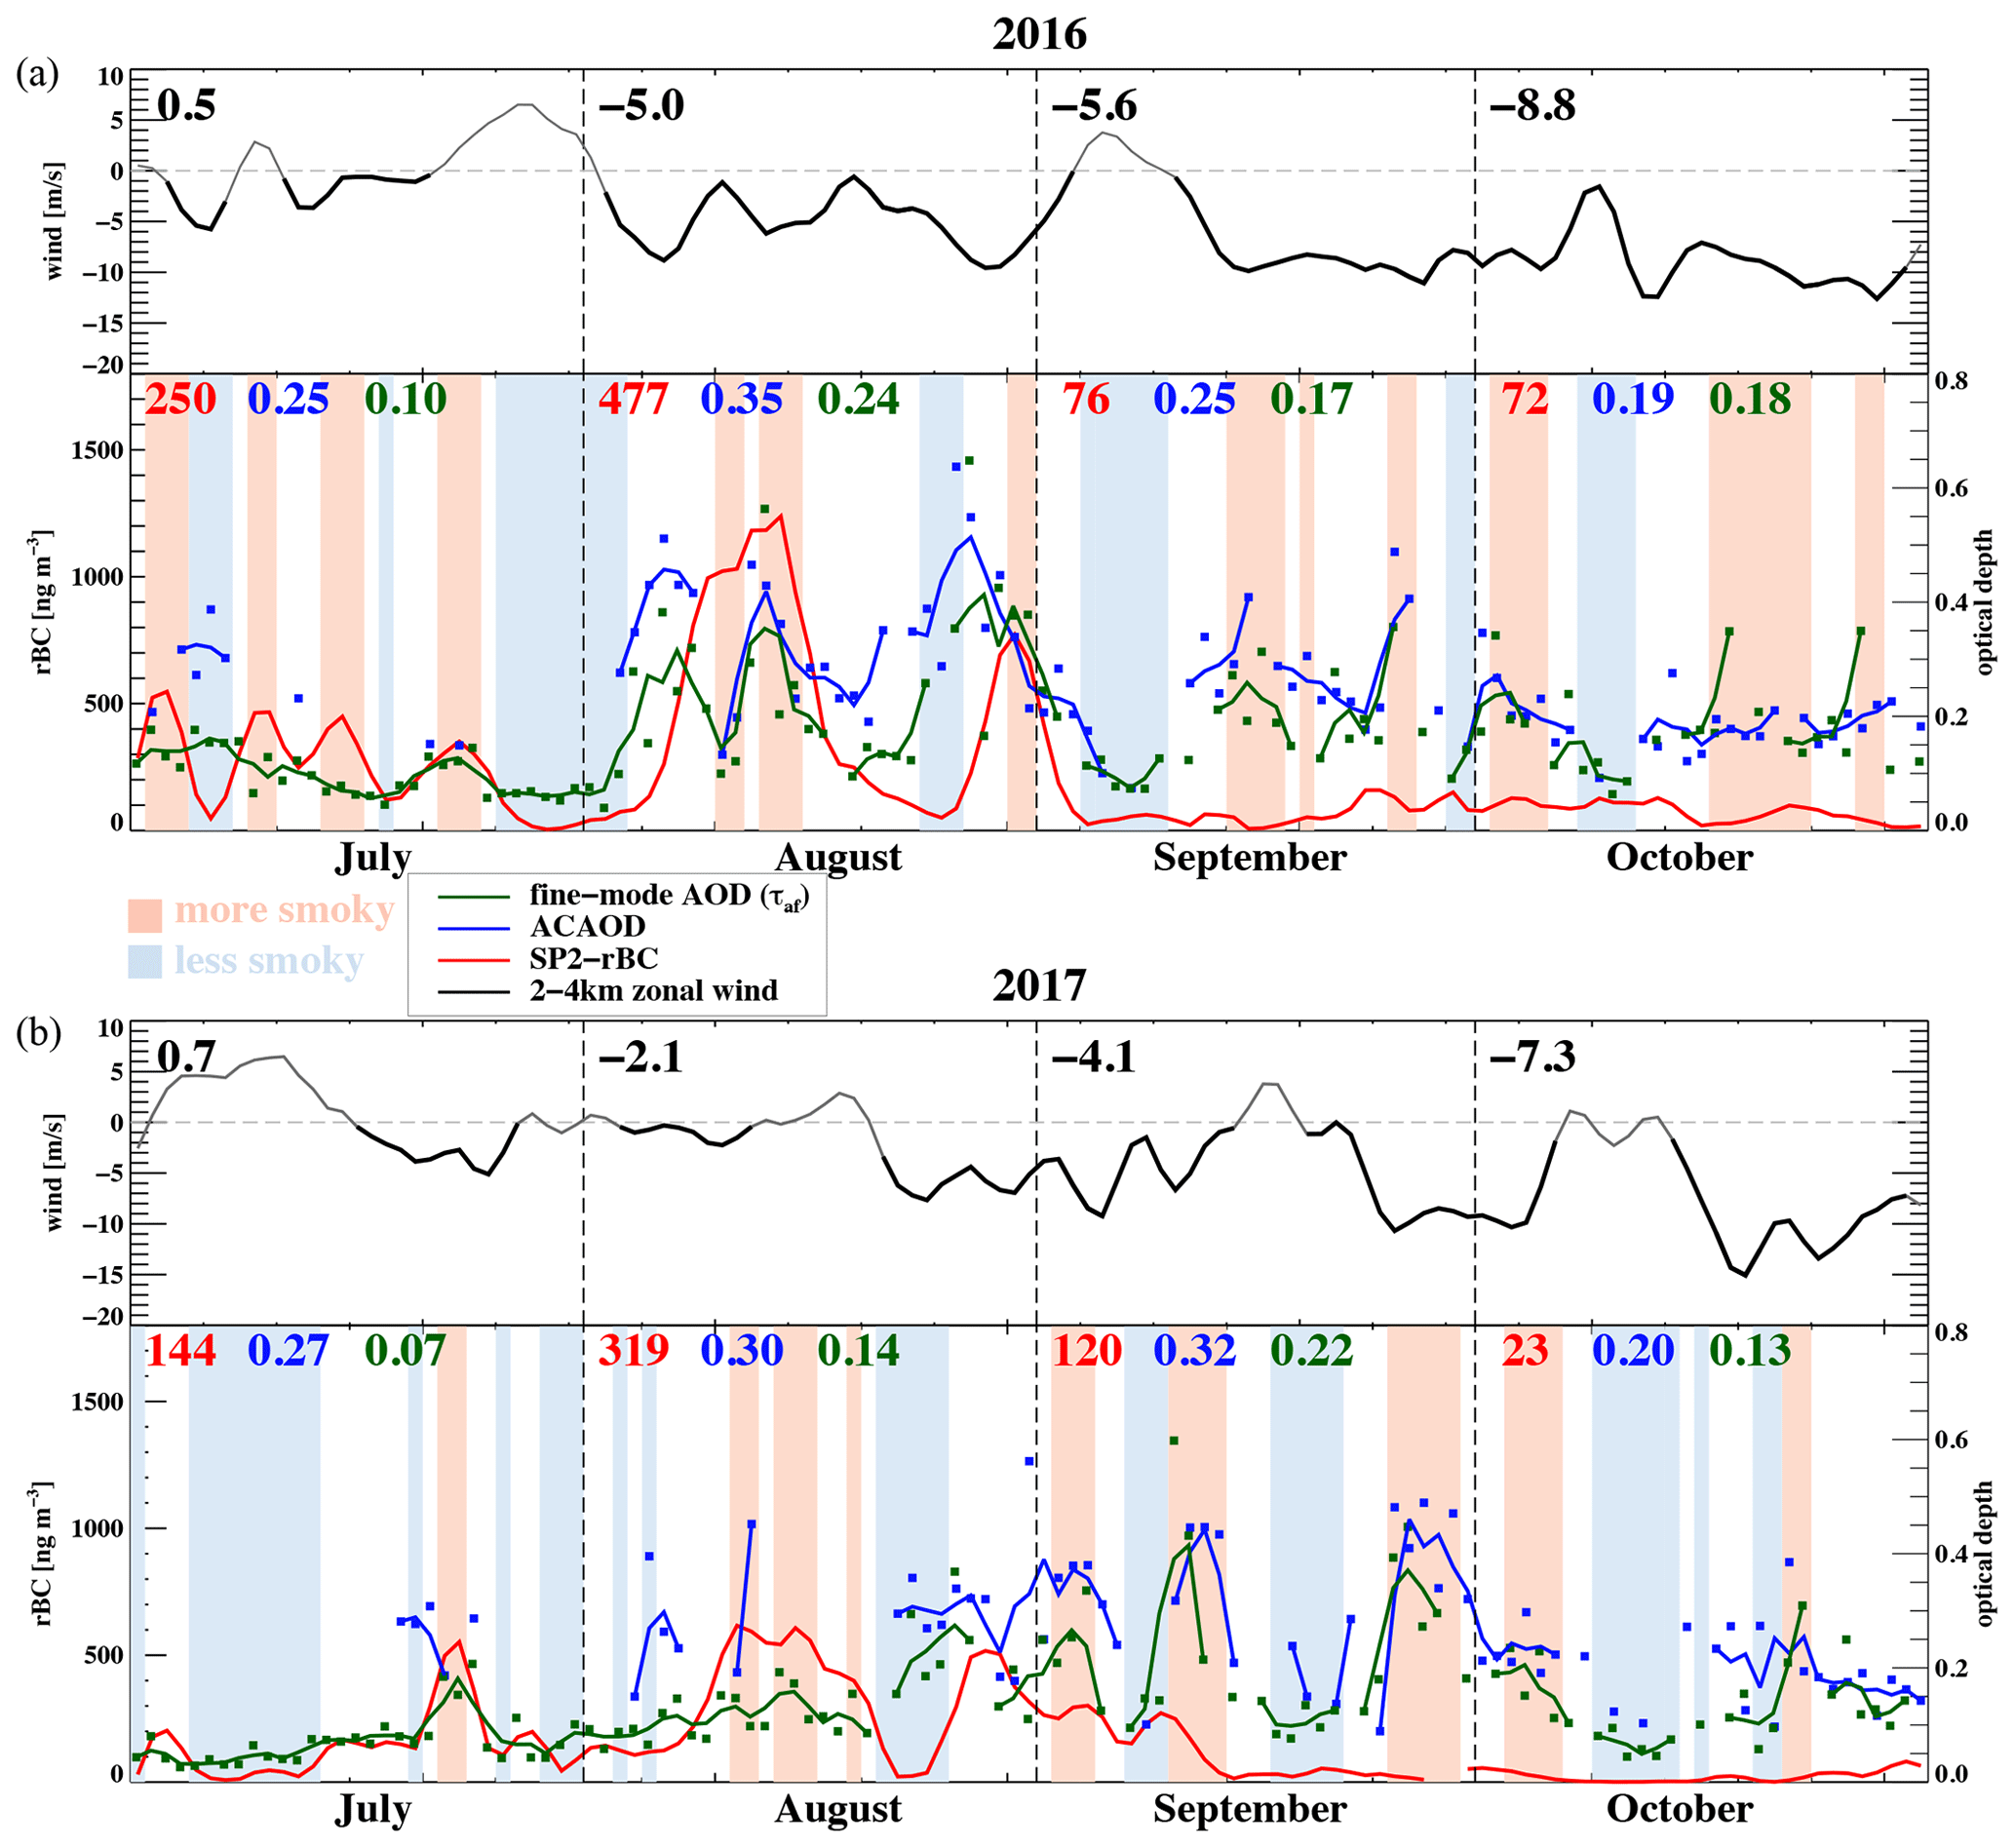
Figure 3Time series of daily rBC mass concentrations (red), ACAOD (blue), τaf (dark green), and 2–4 km mean zonal winds (gray or black) from July through October for (a) 2016 and (b) 2017. A 3 d running mean is applied to all, easterlies lasting at least 5 d are highlighted with a thicker black line, and monthly mean values are indicated. More (less) smoky composites are indicated by light red (light blue) shading.
We use approximate daily mean thresholds to establish the more or less smoky composites for each month, relying primarily on the rBC values for July and August, and τaf (primarily) and ACAOD (secondarily) for September and October. The latter choice is because the τaf values vary more smoothly with time than the ACAOD values do. Although the τaf and ACAOD values over Ascension mostly rely on 2∘ by 2∘ domain averages, when that information is limited, it is supplemented by averages over larger domains (3∘ by 3∘ and 4∘ by 4∘). The bias between the τaf and ACAOD values (Fig. 2) is left as is, with ACAOD primarily used as a sanity check on τaf. Threshold values account for differences in biomass burning activity between the months and are relaxed to whole numbers for ease in interpretation. Visual inspections of spatial maps of ACAOD and τaf ensure the classification into more or less smoky days is representative of a larger region around Ascension. The thresholds applied are rBC mass concentrations of 100 and 300 ng m−3, respectively, for low and high smoke loadings in July; similarly, 100 and 500 ng m−3 thresholds are applied for the smokier month of August. In September, optical depths of 0.15 and 0.26, respectively, indicate low and high smoke loadings, decreasing to 0.11 and 0.19 for October. These thresholds lead to 14 (25) d which are selected for the high (low) smoke loading composite for July, 13 (13) d for August, 19 (16) d for September, and 19 (13) d for October from the 2 years combined. The larger clean composite size in July of 25 d, produces results similar to those for the cleanest 13 d (which would be more balanced with the number of high smoke loading days) but are more robust. The number of high and low smoke loading days is not necessarily evenly distributed between the 2 years; for example, more smoky days are identified in October 2016 than in 2017, owing to interannual variabilities in biomass burning activities over the southern African continent and in the seasonally shifting large-scale circulation pattern (Redemann et al., 2021; Ryoo et al., 2021). Prior work establishes that the variability in aerosol loading is primarily governed by the zonal wind strength in September and October (Adebiyi and Zuidema, 2018). A compositing based on aerosol conditions will also be selected for the representative synoptic regime, independent of differences between the 2 years. Although the classifications can be wrong on occasion, composites are more statistically robust and can prevent unique time periods from dominating perceptions of the representative aerosol–cloud interaction behavior. An example is the time period from early July 2016, classified as less smoky despite relatively high satellite-derived optical depths. This classification is not completely correct, but the composite is nevertheless dominated by those days for which the full atmospheric column is truly clean (e.g., early July 2017) because there are more of them.
The boundary layer cools, shoals, and moistens over Ascension from July to October (Fig. 4), with the free troposphere warming more quickly than the surface, increasing the lower tropospheric stability from July to October (Fig. 4). The boundary layer is most likely to be decoupled in July, although the mean thermodynamic profiles indicate some decoupling between the subcloud and cloud layer for all 4 months. The free tropospheric wind speeds increase from July to October (Fig. 3). These are primarily easterly winds above 2 km and affect the timing of free tropospheric smoke arriving above Ascension. The easterly wind episodes become more frequent beginning in August (Fig. 3). In September, the amount of smoke in the boundary layer reduces abruptly (Haywood et al., 2021, see also). In October, as convection moves southward over the African continent and biomass burning activity reduces (Adebiyi et al., 2015; Redemann et al., 2021), less smoke is present both below and above the low clouds, despite continuing strong easterlies, reflecting the southward movement of convection. In September and October, the more smoky periods correlate well with the strength of the 2–4 km easterlies (Fig. 3), reflecting the critical role of the free tropospheric zonal jet in transporting biomass burning smoke over the remote ocean. The August–September transitions in synoptic regimes occur earlier in 2016 than 2017, which is evident in the time series of the various aerosol measures (Fig. 3) and consistent with larger-scale spatial distributions (Redemann et al., 2021).
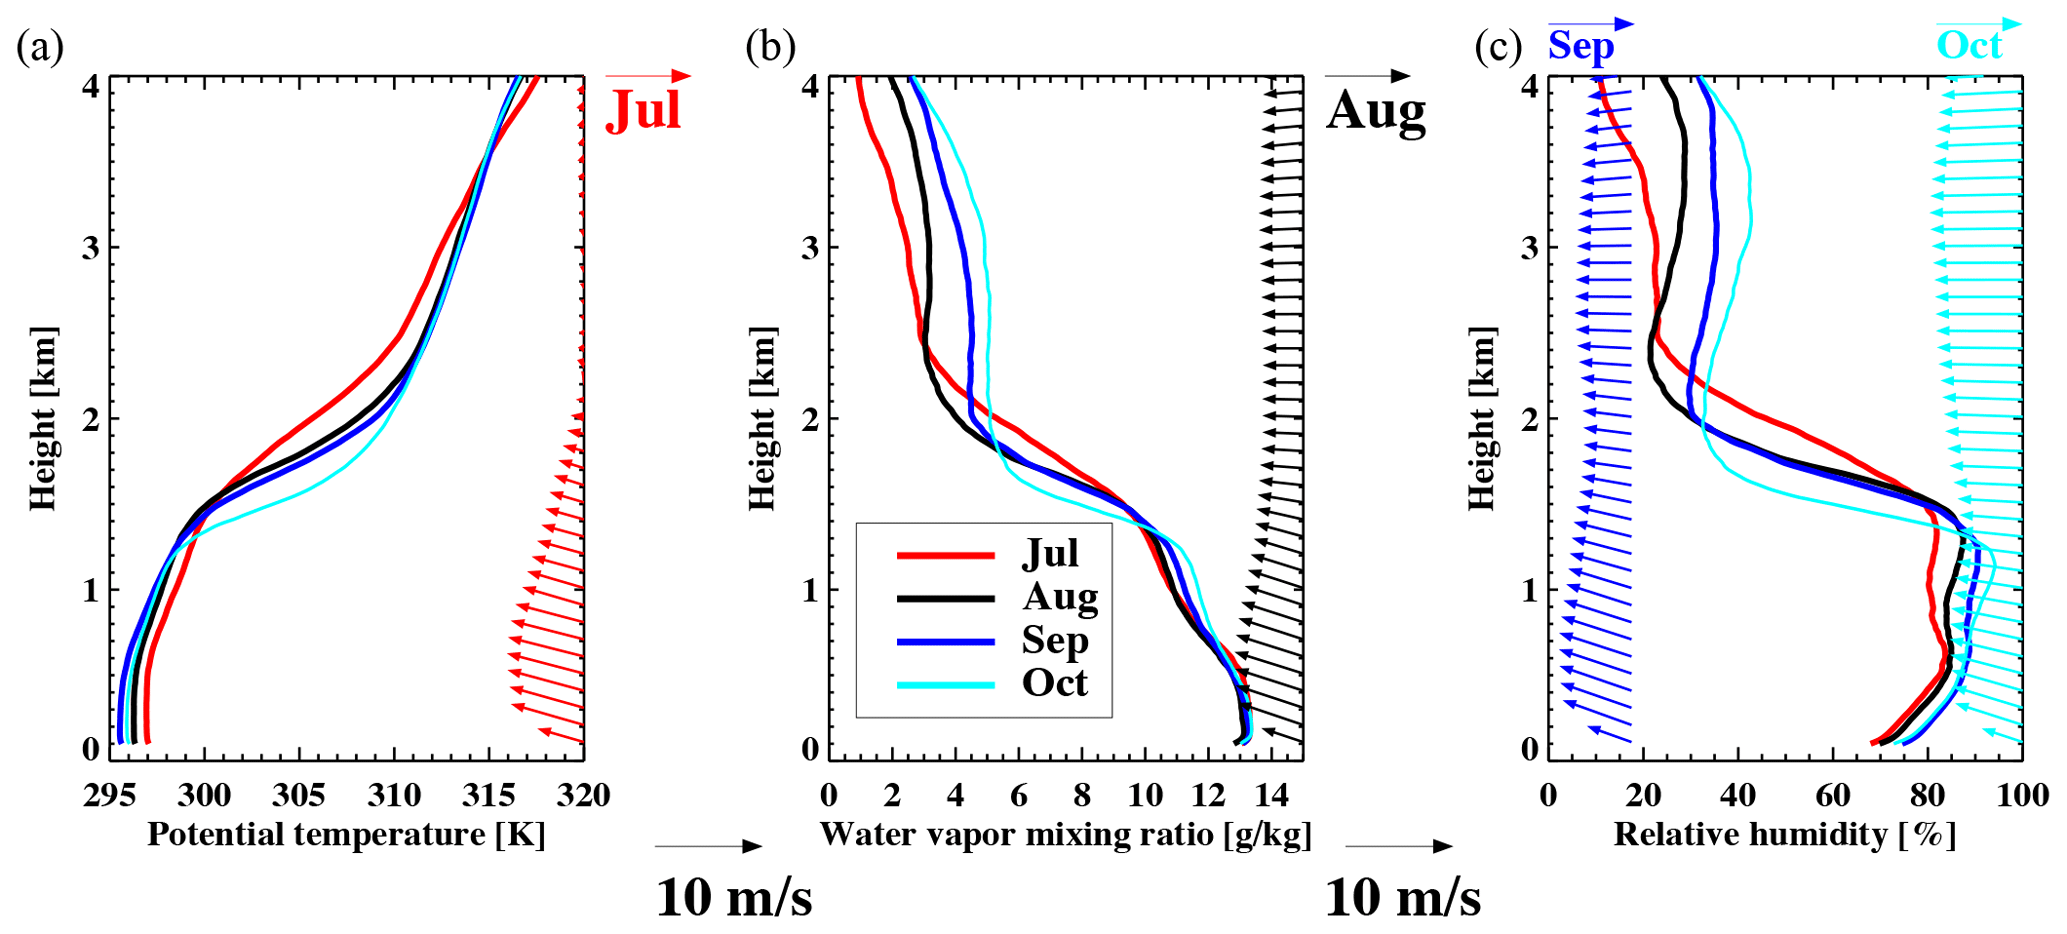
Figure 4Monthly mean radiosonde profiles (0–4 km above sea level) of (a) potential temperature, (b) water vapor mixing ratio, (c) relative humidity, and winds (colored vectors), by month, for 2016 and 2017 combined.
Figure 5(a) SEVIRI-derived diurnally averaged areal mean (4∘ × 4∘) low-cloud fraction, with the diurnal range and median values also indicated, together with the (b) surface-observed cloud type frequency of occurrence (stratiform and cumuliform; empty and filled circles, respectively) and (c) all-sky areal mean CERES albedo for both Terra and Aqua. All are composited by high and low smoke (red and blue) loadings, as a function of the month.
Consistent with the strengthening and lowering of the trade wind temperature inversion from July to October (Fig. 4), the satellite-derived low cloud cover increases around Ascension from July to October (Fig. 5a), regardless of the smoke loading. Stratiform clouds become more common, and cumuliform clouds less so, according to the surface observer reports (Fig. 5b). Ascension is slightly downstream of the main southeastern Atlantic stratocumulus region (10–0∘ E, 10–20∘ S, as per Klein and Hartmann, 1993), and the gross aspects of the seasonal cycle in a low-cloud fraction, so that the properties and meteorology appear similar (Fuchs et al., 2017; Scott et al., 2020).
The striking feature of Fig. 5 is that when more absorbing aerosol is present over the remote southeastern Atlantic, the seasonal cycle in low-level cloudiness and cloud morphology becomes amplified. The low-cloud fraction reduces in July and August, favoring more cumuliform and less stratiform cloud, whereas in October, the low cloud cover increases, with stratiform clouds occurring more frequently compared to cleaner time periods (Fig. 5). A compositing on smaller domains (2∘ × 2∘ within the 4∘ × 4∘ domain; not shown) does not affect this result. A spatial gradient exists, with more cloud to the southeast and less to the northwest, but the cloud fraction evolutions agree between the domains. The amplitude of the diurnal cycle (Fig. 5a) is mostly unaffected by the smoke loading, except in August, when a more pronounced diurnal amplitude can be related to the afternoon clearing of stratiform clouds under smokier conditions (ZZ19). Overall, the modulation of the cloudiness seasonal cycle by the presence (or lack of) smoke is important because the cloudiness changes ultimately dominate the change to the TOA shortwave radiation balance (Fig. 5c). The all-sky albedo decreases or increases, depending on the first order of the changes in the cloudiness fraction.
For more smoky conditions in July, low cloud is less frequent throughout the day (Fig. 6a), cloud bases are higher by 50–90 m, and cloud tops are typically lower, by up to 150 m, compared to less smoky conditions. An exception is the morning (06:00–12:00 LST – local sidereal time), when the cloud-top heights and liquid water paths do not vary with the smoke loading (Fig. 6a, b), and precipitation frequencies almost match (Fig. 6c). This is reminiscent of the morning cumulus invigoration documented for August (see Fig. 8b in ZZ19) when more boundary layer smoke is present. Rain frequency is otherwise reduced throughout the day (Fig. 6c) in smokier July conditions and most pronounced in the afternoon when the cloud LWP is also substantially reduced (Fig. 6b). The low-cloud fraction is reduced over a larger area than just at Ascension when the boundary layer is smokier (Fig. 6d).
Figure 6(a) Diurnal cycle in the mean cloud frequencies derived using the Ka band zenith-pointing cloud radar (KAZR) reflectivities dBZ at their vertical resolution of 30 m. Composite mean KAZR-derived (cloud frequency >0.05) cloud-top heights (solid line) and cloud base heights (long dash) are overlain. (b) Diurnal cycle of liquid water paths at the airport for July 2017, shown as medians (filled circles) and interquartile ranges (vertical bars). (c) Disdrometer-derived rain frequencies, at the AMF1 site, shown as 3 h aggregations of 1 min samples, with rain rates exceeding 0 mm/h. (d) Difference in MODIS daily liquid cloud fraction (LCF; filled contours; high smoke minus low smoke), overlain with July mean sea level pressure (hectopascals; purple) and LCF (black). Ascension and St. Helena island locations are indicated with red and blue stars, respectively. (e) Radiosonde profiles (0–5 km above sea level) of potential temperature (θ), water vapor mixing ratio (qv), relative humidity, and wind speed (horizontal bars indicate the 10th and 90th percentile values). Composite mean (median) MODIS–Meyer cloud droplet number concentrations (Nd; 2∘ by 2∘ means centered over Ascension) and statistics of inversion base height (unfilled box and whisker plots), inversion top height (filled box and whisker plots), mean change in θ, and qv across inversion are included in the two left panels. Panels (a)–(c) and (e) are composited by high smoke (red) and low smoke (blue) conditions. The 2016 and 2017 data are combined, unless specified otherwise.
When more smoke is present, the entire boundary layer is warmer by ∼0.3 K (Fig. 6e). The boundary layers are more decoupled, with a more moist subcloud layer and a drier cloud layer (Fig. 6e), consistent with the reduction in cloudiness. The cloud-top inversions are weaker (by ∼1 K), lower (by ∼200 m), and thinner (by ∼40 m), compared to less smoky conditions (Figs. 6e and S1). Given that smokier conditions last for a few days (Fig. 3), the shortwave absorption can warm the subcloud layer over multiple days, with the warmer subcloud layer persisting through the night (shown for August in ZZ19), supporting a boundary layer semi-direct effect. An aerosol–cloud microphysical interaction is also apparent in the doubling of the satellite-derived Nd (see values printed on Fig. 6e; left panel). The radiosonde-derived wind speeds indicate slightly weaker free tropospheric winds when the boundary layer is more smoky, but the atmospheric circulation patterns are not significantly different (not shown). The lack of strong synoptic variations suggests the observed low-cloud variability is mostly driven by the presence of the shortwave-absorbing smoke.
Previous studies assessing the impact of above-cloud absorbing aerosol on the boundary layer height are not in full agreement. The regional modeling studies of Sakaeda et al. (2011) and Lu et al. (2018) report an increase in cloud-top heights when biomass burning aerosols are present above clouds, attributed to a reduced free tropospheric subsidence caused by aerosol heating. This can increase the contact with the smoke layer, enhancing entrainment of aerosol into the cloud, increasing Nd and further increasing the cloud-top height (Lu et al., 2018). In contrast, observational studies report a reduction in the cloud-top height (Wilcox, 2010, 2012; Adebiyi et al., 2015), which could be because an enhanced lower-tropospheric stability reduces cloud-top entrainment. A climate-scale modeling study (Gordon et al., 2018) also produces a decrease in boundary layer depth under a plume of biomass burning smoke when the model free tropospheric conditions are nudged to reanalysis. Most higher-resolution process modeling studies (Johnson et al., 2004; Herbert et al., 2020; Yamaguchi et al., 2015; Zhou et al., 2017) impose a free tropospheric model velocity, disallowing an aerosol feedback. The change in boundary layer height accompanying free tropospheric aerosol is important to clarify because more shallow boundary layer heights tend to be better coupled to the surface (Zuidema et al., 2009), with the surface moisture fluxes better able to sustain higher cloud fractions. On the other hand, if the cloud base remains invariant while the MBL shoals, the clouds should thin.
The radar-derived cloud-top height varies little with smoke loading, with a slight increase in the afternoon and after sunset, by up to 60 m, on days with more smoke (Fig. 7a). More clear is that cloud frequencies, particularly in the lower levels, increase with the smoke loading, by up to ∼ 20 %. This is because the cloud bases lower, by up to 230 m, when more smoke is present (Fig. 7a). The island-based cloud frequency profiles can be limited in interpreting cloud cover over a larger area, due to a systemic island orographic effect and subsampling by the relatively short time series of point measurements, but diurnal cycle composites of SEVIRI-derived low-cloud fraction also indicate an increase in afternoon cloud cover, if weak (Fig. S2). Cloud occurrence increases just above lifting condensation level when more smoke is present (more pronounced in the morning; Fig. 7a), while surface observers only report a subtle shift in low-cloud type as a function of smoke loading (Fig. 5b).
Figure 7Panels (a) and (b) are as in Fig. 6a and e but for September. Composite mean cloud-top heights and bases included in (a) in kilometers. Composite mean (median) rBC mass concentrations are shown in left panel of (b). (c, d) HYSPLIT 7 d back trajectories initialized at 2 km over Ascension at noon for September (red lines) for days with (c) more and (d) less smoke, overlain on composite mean ACAOD (colored contours), 700 hPa ERA5 geopotential heights (meters; gray contours) and winds (purple vectors). (e) Low-high smoke composite difference in 800 hPa geopotential heights (m; black contours), winds (blue vectors) and vertical velocity (hectopascals per day; hereafter hPa d−1; colored background). (f) Low–high smoke composite difference in MODIS daily liquid cloud fraction (LCF; filled-contours), overlain with September mean LCF (black contours). (g) Height cross section of the vertical velocity low–high smoke composite difference (colored background) and zonal or meridional winds (vectors; free tropospheric differences <2 m s−1 are omitted) between St. Helena and Ascension (red and blue stars, respectively, in c–g).
A focus on the cleaner conditions provides a useful alternative perspective. When the free troposphere is less aerosol laden, the boundary layer is less humid (qv decreases by 1 g kg−1; RH decreases by ∼ 5 %), and the cloud layer is cooler (∼ 1 K at inversion base), with a stronger and slightly higher cloud-top inversion (1.8 K and 70 m; Figs. 7b and S3). The changes in the free troposphere are equally dramatic, with much weaker winds, less moisture, and a more stable thermodynamic structure. Differences between the composite mean Nds and rBC mass concentrations are statistically insignificant (numbers printed on Fig. 7b), indicating negligible aerosol–cloud microphysical interactions (as expected, given the small amount of boundary layer aerosol). The 700 hPa atmospheric circulation differs significantly between days with low and high free tropospheric smoke loadings at Ascension (Fig. 7c and d). On days with more smoke, the AEJ-S extends further westward, and back-trajectories from Ascension near the cloud-top clearly trace back to continental Africa (Fig. 7c). On days with little smoke, the circulation is anticyclonic about a deeper land-based pressure high, with the aerosol remaining closer to the coast and further south. The above-cloud air at Ascension is more likely to come from the north and west on these days (Fig. 7d).
The primary distinction between the two composite circulations is a disruption of the midlatitude eastward flow in which a high-pressure ridge at 700 hPa, associated with baroclinic activity from further south, counteracts the free tropospheric zonal jet at 10∘ S. The subsidence above the cloud top is stronger on the less smoky days when the boundary layer at Ascension is also higher (Fig. 7a, b, e, and g). The increased subsidence also reflects the midlatitude intrusion; the anomalous westerlies weakening the free tropospheric winds also create an anomalous convergence, supporting an anomalous subsidence (Fig. 7e). This is most pronounced east of the 700 hPa pressure ridge (right above the region bounded by Ascension and St. Helena), where the flow shifts from cyclonic to anti-cyclonic, and the AEJ-S is most weakened (Fig. 7d). At the surface, the midlatitude disturbance strengthens the south Atlantic high and shifts it slightly to the southwest (not shown), strengthening the southerlies in the boundary layer, although weakly felt over the Ascension region (Fig. 7g; cyan vectors). Closer to St. Helena, the prevailing southeasterly boundary layer flow is weakened by the anomalous westerlies, corresponding to the upper-level (700 hPa) midlatitude disturbance. These changes in the regional atmospheric circulation correlate with a pronounced cloudiness reduction within the main southeastern Atlantic stratocumulus deck, except at the northern edge of the deck encompassing Ascension (Fig. 7f).
St. Helena is located approximately 2 d upwind within the boundary layer flow, with Lagrangian forward trajectories from St. Helena placing boundary layer air near, if slightly west of, Ascension (Fig. 7 within Zuidema et al., 2015). A height cross section between Ascension and St. Helena (16∘ S, 6∘ W; gray dashed line in Fig. 7e), indicates a consistent increase in the 700–800 hPa subsidence on days with less free tropospheric smoke loadings (Fig. 7g). As such, the radiosondes at St. Helena can provide insight into the 24–48 h adjustment of clouds to their large-scale environmental conditions (Klein et al., 1995; Mauger and Norris, 2010; Eastman et al., 2016) for the clouds characterized at Ascension.
A 2 d lead is incorporated into the St. Helena comparisons between low or high smoke days in Fig. . A total of 2 d prior to the less smoky days at Ascension, the boundary layer heights are much higher at St. Helena (by 320 m compared to more smoky days), with a weaker temperature and moisture cloud-top inversion gradient (1.6 K and 1.6 g kg−1; Figs. a and S4). This indicates that the cloud tops at Ascension are higher, despite stronger subsidence, because the boundary layer is deeper upstream. The potential temperature, qv, and RH vertical structure differences as a function of smoke loading are qualitatively similar to those at Ascension (Fig. a). The boundary layer is deeper and less humid near the surface (Fig. a), and the lower tropospheric stability is substantially reduced on days with less smoke overhead. The boundary layer southerlies extend up to 2 km (Fig. a) before reversing in response to the deeper land-based heat low. Spatial climatologies indicate that the radiosonde composites are representing a larger pattern (Fig. b–e). Important for the boundary layer cloud characteristics, the strengthened surface Atlantic high encourages advection of air off the Southern Ocean by near-surface winds (Fig. d; black contours and gray vectors). A pronounced decrease in lower tropospheric stability near and south of St. Helena (Fig. d; colored contours) is in full agreement with the radiosonde profiles sampled over St. Helena (Fig. a) for low smoke loading days. This can be explained by anomalous negative horizontal temperature advection at 800 hPa (Fig. e, colored contours), as a result of anomalous southerly flows (gray vectors) corresponding to negative geopotential height anomalies at 800 hPa (black contours). The MODIS-derived low-level cloudiness is substantially reduced and disrupted west of the prime meridian (Fig. c; colored contours), compared to days dominated by free tropospheric flow off of the continent (Fig. b).

Figure 8(a) Similar to Fig. 7b but for St. Helena from 2 d prior to those with high and low smoke loadings at Ascension. Zonal and meridional components of the winds are shown instead of wind speed. (b, c) Corresponding composite mean MODIS daily liquid cloud fraction (colored contours), 700 hPa ERA5 geopotential heights (meters; gray contours), and winds (gray vectors). (d) Difference (low–high) in composite mean lower tropospheric stability (LTS; defined as θ800 hPa−θ1000 hPa; colored contours), sea level pressure (SLP; hectopascals; black contours), and 10 m winds (gray vectors). (e) Low–high smoke composite difference in 800 hPa horizontal temperature advection (colored contours), geopotential heights (meters; black contours) and winds (gray vectors). Locations of Ascension and St. Helena are indicated in red and blue stars, respectively, in panels (b–e).
September is a transitional month when the continent is warming up but the ocean is still cool, and the midlatitude westerlies are positioned further north, similar to the southeastern Pacific (Painemal and Zuidema, 2010). These Atlantic midlatitude disturbances, also discussed in Baró Pérez et al. (2021), are most frequent in September in our study and are consistent with the climatologies of Fuchs et al. (2017) and Gaetani et al. (2021). Other examples are documented in Diamond et al. (2018), Adebiyi and Zuidema (2018), and Abel et al. (2020). Pennypacker et al. (2020) also document that ultra-clean days at Ascension are most common during September, although they only partially attribute these to a Southern Ocean origin.
In October, the temperature gradient between the continental heat low in southern Africa and equatorial convection continues to encourage stronger free tropospheric easterlies (Tyson et al., 1996; Nicholson and Grist, 2003; Adebiyi and Zuidema, 2016) capable of transporting biomass burning smoke far westward at altitudes reaching up to 5–6 km. This encourages smoke to stay predominantly in the free troposphere over the southeastern Atlantic (Figs. 1 and 3). Nevertheless, reduced burning and increased moist convection on the African continent reduces aerosol transport but increases moisture transport, compared to September.
At Ascension, the radar-derived cloud frequency profiles (October 2016 only) emphasize a more persistent stratiform cloud structure through the linear increase in cloud frequency with height, lasting throughout the diurnal cycle and invariant of the smoke loading (Fig. 8a). Cloud occurs more frequently when it is less smoky (Fig. 8a; confirmed through a Student's t test), consistent with the satellite-derived low-cloud fraction covering a larger area (Fig. 5a), except in the afternoon (12:00–18:00 LST). There is some indication that the cloud layer rises under smokier conditions, with higher cloud bases by up to 90 m in the late morning, a reduced subcloud relative humidity (Fig. 8c), and higher cloud tops by up to 70 m in the afternoon (Fig. 8a). Surface observations indicate more stratiform clouds under smokier conditions (Fig. 5b), but cloud liquid water paths are also less, and rain is less frequent (Fig. 8b). When combined, these observations suggest that smokier conditions correspond with thinner stratiform cloud layers near the trade wind inversion. Figure 8c indicates slightly warmer and drier subcloud layers in smokier conditions. The moisture and wind profiles clearly differ, with more moisture overhead between 1.5 and 3.5 km and stronger winds from the surface to 4 km on days with more free tropospheric smoke. The increase in free tropospheric moisture immediately above the cloud tops reduces the gradients of RH and qv across the inversion by ∼2 g kg−1 (Figs. 8c and S5). This should help sustain the stratiform cloud layer through suppressing evaporative drying by cloud-top entrainment. Figure 8d indicates a broad, zonally oriented band of elevated τaf, also seen in ACAOD (not shown). The satellite-derived low-cloud fraction is enhanced west of 5∘ W by up to 0.35 (including at Ascension) and is slightly reduced to the south, east of 0∘ E by at most 0.1 (Fig. 8e), indicating a more zonally oriented, westward extending cloud deck when more smoke is present overhead.

Figure 9(a) As in Fig. 7a but for the high–low smoke composite difference in October 2016 only. (b) As in Fig. 6b and c but for October, with 3 h rain frequencies derived from the tipping bucket. (c) As in Fig. 7b but for October. (d) MODIS daily τaf (color-filled contours), overlain with October mean sea level pressure (hectopascals; purple), (e) MODIS daily liquid cloud fraction (LCF; color-filled contours), overlain with October mean LCF (black), (f) ERA5 geopotential heights (meters; black contours), subsidence (color-filled contours), and horizontal winds (blue vectors) at 700 hPa, and (g) daily MODIS–Meyer Nd, overlain on differences in sea level pressure (hectopascals; gray contours) and 10 m winds (gray vectors). Ascension and St. Helena island locations are indicated with red and blue stars, respectively, in panels (d–g). Panels (b)–(f) are for October 2016 and 2017 combined, representing high–low smoke composite differences.
An anomalous anti-cyclonic October circulation at 700 hPa offshore of continental Africa indicates a strengthening of the dominating large-scale circulation on the days when the smoke loading is elevated over Ascension (Fig. 8f), consistent with the measured stronger winds. The free tropospheric subsidence is reduced underneath the strengthened easterlies centered on 10∘ S, consistent with a secondary circulation (Adebiyi and Zuidema, 2016) and explaining the slight increase in cloud-top heights at Ascension on smokier days. Also notable in Fig. 8f is the enhancement in the subsidence just off of the coast of Namibia (17–28∘ S) to the southwest of the strengthened anticyclonic high, correlating with a local increase in Nd on days with more smoke (Fig. 8g). A broad expanse of increased Nd, stretching from near the Namibian coast to beyond Ascension, is evident. At Ascension, the composite mean MODIS–Meyer-derived Nd and surface-based rBC almost double between the high versus low smoke conditions (Fig. 8c). Christensen et al. (2020) select days with enhanced clear-sky τa to the south of the main stratocumulus deck and find an increase in cloud fraction or lifetime far downwind, within Lagrangian trajectories, consistent with the increased low-cloud fraction to the west in Fig. 8e. This, along with the rain suppression occurring on smokier days and little change in the lower tropospheric stability (Fig. 8b and c), supports the idea that an aerosol lifetime effect (Albrecht, 1989) is active, consistent with Christensen et al. (2020). To this we can add that the increase in free tropospheric moisture also helps maintain the cloud against entrainment-driven cloud thinning. The elevated Nd on more smoky days can also contribute to the significant brightening of the cloudy scene near Ascension in October, despite the reduction in the cloud liquid water path (all told, there is a net ∼0.05 increase in TOA all-sky albedo; Fig. 5c).
We lack an explanation for the smaller reduction in cloud fraction to the south of the main stratocumulus deck. The contrasting decrease in Nd over a narrow region, confined within ∼ 2∘ along the coast of Namibia on more smoky days (Fig. 8g), correlates with anomalous near-surface northerly winds (gray vectors; Fig. 8g). This circulation pattern advects moist, warm air along the coast of Namibia, encouraging an inland fog (Andersen et al., 2020). Perhaps this produces enough precipitation to reduce Nd near the shore, although that remains speculation.
In comparison to October, the September thermodynamic profile is better mixed, to a higher altitude, over the southeast Atlantic (Figs. 7a and a) when more absorbing aerosol is present. Individual profiles often indicate clear collocations between the elevated humid layer and the aerosol layer (see examples in the Supplement of ZZ19; Adebiyi et al., 2015; Deaconu et al., 2019; Pistone et al., 2021). The aerosol or humidity layer may already be well mixed when leaving the African continent; here we show that longwave cooling at the top of the humidity layers can help maintain their vertical structure through encouraging downward small-scale mixing. The individual free tropospheric humidity layers typically include a stability cap at the top, ensuring a sharp gradient to the water vapor mixing ratio, with qv reductions to near 0 g kg−1 above the aerosol layer reflecting the large-scale subsidence. The extremely dry overlying atmosphere provides a strong exposure of the underlying water vapor to outer space, creating a longwave radiative cooling profile that is maximized at the top of the moisture layer and helps maintain a stability cap (Mapes and Zuidema, 1996). A negative buoyancy, generated at the top of these layers, can aid downward mixing. Although the longwave cooling from the additional water vapor transported within the aerosol layers is typically small compared to that from the aerosol shortwave absorption (Marquardt Collow et al., 2020), the vertical structure of the radiative heating is also altered, with most of the longwave cooling occurring above the maximum in the shortwave heating from aerosol. It is this displacement that helps maintain a better mixed aerosol or humidity layer.
Figure 10(a) Calculated instantaneous shortwave (red), longwave (blue), and net (black) heating rate profiles at noon on 2 September 2017. The insert magnifies to the 4.2–4.5 km range, centered on the layer top. (b) θ (red) and qv (blue) profiles from the noon sounding, and the MBL-derived extinction profile (black; following Delgadillo et al., 2018). The corresponding column-integrated AOD and cloud water path are indicated.
An example is made of a characteristic profile over Ascension, from 2 September 2017, in which well-mixed aerosol extinction (derived from the micropulse lidar according to Delgadillo et al., 2018, and constrained to an aerosol optical depth of 0.35) and humidity vertical structures are clearly well colocated (Fig. ). Instantaneous radiative transfer calculations are based on a noon solar zenith angle, a spectrally dependent single scattering albedo (SSA) of 0.8 at 529 nm based on Zuidema et al. (2018), and an asymmetry parameter of 0.67, loosely based on Cochrane et al. (2021). The spectral dependence of SSA relies on an absorption Ångström exponent of 1 and a mean Ångström exponent of 1.9 (Zuidema et al., 2018), with no humidity dependence. A cloud layer consists of cloud water content calculated from the radiosonde profiles using the adiabatic assumption, with cloud optical properties calculated assuming a cloud droplet number concentration of 40 cm−3 following Painemal and Zuidema (2011). These yield a sharply defined longwave cooling profile, maximized at K d−1 over a 50 m distance at the top of the free tropospheric aerosol or moisture layer (Fig. ). The noontime shortwave heating produced by the smoke is larger, with a maximum of ∼34 K d−1 over a 50 m layer. A key feature is that the maximum shortwave heating occurs lower in the atmosphere than the maximum longwave cooling does (Fig. ; insert). As a result, a net cooling ( K d−1 50 m−1) pervades the top 100 m of the layer, even during the time of day when the shortwave warming is strongest. The net heating profile encourages a small-scale downward vertical mixing that can allow aerosol to move vertically more freely, regardless of the time of day. Although such mixing is not deep, based on a simple diabatic heating or static stability calculation, it does help explain why the free troposphere is often stratified into individually well-mixed layers (Redemann et al., 2021; Pistone et al., 2021). In October, more of the convection over land is moist (Ryoo et al., 2021), which will produce more complex thermodynamic profiles from, e.g., microphysical melting and downdrafts. This may also help explain why the thermodynamic profiles are less well mixed in October, also evident in Pistone et al. (2021), and do not reach as high (because surface land heating is reduced).
This study characterizes the subseasonal evolution of marine boundary layer clouds over the remote southeastern Atlantic, from July to October during 2016 and 2017, as a function of the aerosol loading and its vertical distribution. We extend the work of ZZ19, which focused on August only, and distinguish this from previous studies that apply a longer timescale averaging over the biomass burning season (e.g., Wilcox, 2010, 2012; Costantino and Bréon, 2013; Adebiyi and Zuidema, 2018; Deaconu et al., 2019). The monthly timescale is emphasized primarily because of the dramatic rise in altitude of the aerosol mass centroid from July to October over the southeastern Atlantic. Smoke episodes arriving at Ascension mainly occupy the boundary layer in July, with the boundary layer smoke loading reaching a maximum in August. Smoke within the free troposphere becomes more frequent in September, and that within the boundary layer reduces dramatically. In October, the free tropospheric zonal winds reaching Ascension remain strong but transport more moisture than aerosol. This synoptic evolution occurs approximately 2 weeks later in 2017 compared to 2016 (Figs. 1–3). This aerosol–meteorological co-evolution affects which aerosol–cloud interactions are likely to dominate, since changes in meteorology potentially dominating the cloud response. Our key findings are as follows:
-
When smoke is present, the seasonal evolution in low-cloud amount is amplified. The low-cloud amount first reduces in July–August but then increases and becomes more stratiform in October. The cloudiness changes dominate the TOA all-sky albedo changes associated with the smoke (Fig. 5), although the cloudiness changes are not necessarily attributable to the aerosol.
-
In July, the cloud cover, LWP, and rain occurrence are reduced when more smoke is present, particularly in the afternoon. The thermodynamic and wind vertical structures are similar, regardless of the smoke loading, suggesting that the variability in the cloud response is primarily driven by the aerosol rather than synoptics (Fig. 6). A morning increase in LWP, even under smokier conditions, is similar to a recoupling of the cloud layer to the subcloud layer detailed more comprehensively for August in ZZ19.
-
In September, the days with less free tropospheric smoke over Ascension are distinguished by midlatitude synoptic intrusions into the subtropics. An upper-level pressure ridge constrains the circulation around the land-based heat low to the coastal region, reducing the westward extent of the free tropospheric zonal winds at 10∘S that normally disperse the aerosol (Fig. 7). A stronger surface anticyclone over the Atlantic strengthens boundary layer southerlies more likely to advect cleaner Southern Ocean air. The lower tropospheric stability is reduced, despite stronger synoptically aided subsidence, helping to raise the boundary layer top, which is particularly noticeable at St. Helena (Fig. ). This provides an alternative explanation as to why the observed cloud-top heights are lower on the smokier days despite the weakened subsidence.
-
In October, the free tropospheric zonal winds are stronger when more aerosol is present over Ascension. The same winds enhance the humidity above the cloud top, reducing entrainment-driven evaporative drying. This helps support the increased occurrence of stratiform clouds and satellite-derived low-cloud fraction. Cloud tops are slightly higher at Ascension when the smoke loading is higher, which is consistent with reduced subsidence from the secondary circulation induced by the strong zonal winds (Fig. 8). A possible aerosol indirect effect is indicated, in that the Nd double when more smoke is present overhead. Enhanced subsidence off the coast of Namibia may provide another pathway for aerosol to enter the boundary layer and, ultimately, reach Ascension. The additional aerosol may help prolong the cloud lifetime and enhancing their brightness (Fig. 5c; Christensen et al., 2020). These two effects (an additional moisture source and an aerosol cloud lifetime effect) help explain why the low-cloud fraction is higher, despite a lower liquid water path, compared to the southeast Pacific stratocumulus deck during this time of year (Zuidema et al., 2016).
-
The September free tropospheric thermodynamic profile is better mixed than in October. The sharp gradient in water vapor mixing ratio at the top of a September free tropospheric aerosol layer generates a net cooling at the layer top, even at solar noon, that is offset vertically from the larger shortwave warming occurring below through aerosol absorption. The negative buoyancy can facilitate a downward vertical mixing and vertical dispersion of the free tropospheric aerosol over small distances (Fig. ). A greater prevalence of moist convection over land in October, for which microphysical and dynamical processes produce more complex thermodynamic vertical structures, may help explain why the thermodynamic profiles are less well-mixed in October (Fig. 8c; Ryoo et al., 2021).
Previous studies applying a seasonal averaging successfully isolate a cloud thickening when more aerosol is present in the free troposphere but typically overlook a cloud reduction when more smoke is present in the boundary layer. It may have required recent field measurements to better appreciate that the boundary layer can also be smoky. The cloudiness changes are most dramatic over the main stratocumulus region in September (Fig. 7f), in part because of substantial cloud clearings during the less smoky time periods (e.g., Abel et al., 2020). Figure 5c also indicates that, over the July to October time frame, the all-sky albedo changes in October are the most dramatic near Ascension, consistent with higher cloud fractions and potentially an aerosol-induced cloud brightening effect (Christensen et al., 2020). Thus, this study also suggests that seasonally averaged changes in the regional radiation budget induced by biomass burning aerosols might be dominated by the contribution from September to October, when the low-cloud fraction is large and more easily varied, which then helps explain why the boundary layer semi-direct effect has been difficult to isolate in previous studies over the southeast Atlantic.
The LASIC ground-based data sets are publicly available from the Atmospheric Radiation Measurement Climate Research Facility (https://www.arm.gov/research/campaigns/amf2016lasic; Atmospheric Radiation Measurement Climate Research Facility, 2021). The HYSPLIT model is publicly available from the NOAA Air Resources Laboratory (https://www.arl.noaa.gov/hysplit/; NOAA Air Resources Laboratory, 2021). The UK Met Office synoptic hourly weather reports are publicly available from the Comprehensive Environmental Data Archive (CEDA) of the Met Office Integrated Data Archive System (MIDAS; http://catalogue.ceda.ac.uk/uuid/77910bcec71c820d4c92f40d3ed3f249; Comprehensive Environmental Data Archive (CEDA) of the Met Office Integrated Data Archive System, 2021). The RRTMG code is publicly available from http://rtweb.aer.com/ (Atmospheric and Environmental Research, 2021). The MODIS level 3 data sets are publicly available from NASA's Atmosphere Archive & Distribution System Distributed Active Archive Center (https://ladsweb.modaps.eosdis.nasa.gov/; NASA's Atmosphere Archive & Distribution System Distributed Active Archive Center, 2021). The SEVIRI retrievals and CERES SSF data are publicly available from NASA's Langley Research Center (https://satcorps.larc.nasa.gov/; NASA's Langley Research Center, 2021). The fifth-generation ECMWF (ERA5) atmospheric reanalyses of the global climate data are available through the Copernicus Climate Change Service (C3S; https://cds.climate.copernicus.eu/; Copernicus Climate Change Service, 2021). The above-cloud aerosol optical depth (ACAOD) data set is available upon request.
The supplement related to this article is available online at: https://doi.org/10.5194/acp-21-11179-2021-supplement.
JZ and PZ conceived this study. JZ analyzed the results, and PZ contributed to their interpretation. JZ wrote the paper, with edits from PZ.
The authors declare that they have no conflict of interest.
Publisher’s note: Copernicus Publications remains neutral with regard to jurisdictional claims in published maps and institutional affiliations.
This article is part of the special issue “New observations and related modelling studies of the aerosol–cloud–climate system in the Southeast Atlantic and southern Africa regions (ACP/AMT inter-journal SI)”. It is not associated with a conference.
We are indebted to the LASIC scientists, instrument mentors, and logistics staff, who made this analysis possible through their efforts in deploying and maintaining the instruments and processing and calibrating the campaign data sets. We thank Kerry Meyer for providing the MODIS-derived above-cloud aerosol optical depth (ACAOD) product. We thank Michael Jensen and another anonymous reviewer, for their constructive comments and suggestions that helped us improve the original paper, and Franck Eckhardt and Johannes Quaas, for their editorship.
This research has been supported by the U.S. Department of Energy, Office of Science (grant nos. DE-SC0018272 and DE-SC0021250).
This paper was edited by Johannes Quaas and reviewed by Michael Jensen and one anonymous referee.
Abel, S. J., Barrett, P. A., Zuidema, P., Zhang, J., Christensen, M., Peers, F., Taylor, J. W., Crawford, I., Bower, K. N., and Flynn, M.: Open cells exhibit weaker entrainment of free-tropospheric biomass burning aerosol into the south-east Atlantic boundary layer, Atmos. Chem. Phys., 20, 4059–4084, https://doi.org/10.5194/acp-20-4059-2020, 2020. a, b
Ackerman, A. S., Toon, O. B., Stevens, D. E., Heymsfield, A. J., Ramanathan, V., and Welton, E. J.: Reduction of tropical cloudiness by soot, Science, 288, 1042–1047, https://doi.org/10.1126/science.288.5468.1042, 2000. a
Adebiyi, A. A. and Zuidema, P.: The role of the southern African easterly jet in modifying the southeast Atlantic aerosol and cloud environments, Q. J. Roy. Meteor. Soc., 142, 1574–1589, https://doi.org/10.1002/qj.2765, 2016. a, b, c
Adebiyi, A. A. and Zuidema, P.: Low Cloud Cover Sensitivity to Biomass-Burning Aerosols and Meteorology over the Southeast Atlantic, J. Climate, 31, 4329–4346, https://doi.org/10.1175/JCLI-D-17-0406.1, 2018. a, b, c, d
Adebiyi, A. A., Zuidema, P., and Abel, S. J.: The Convolution of Dynamics and Moisture with the Presence of Shortwave Absorbing Aerosols over the Southeast Atlantic, J. Climate, 28, 1997–2024, https://doi.org/10.1175/JCLI-D-14-00352.1, 2015. a, b, c, d
Albrecht, B. A.: Aerosols, Cloud Microphysics, and Fractional Cloudiness, Science, 245, 1227–1230, https://doi.org/10.1126/science.245.4923.1227, 1989. a
Andersen, H., Cermak, J., Fuchs, J., Knippertz, P., Gaetani, M., Quinting, J., Sippel, S., and Vogt, R.: Synoptic-scale controls of fog and low-cloud variability in the Namib Desert, Atmos. Chem. Phys., 20, 3415–3438, https://doi.org/10.5194/acp-20-3415-2020, 2020. a
Atmospheric and Environmental Research: RRTMG code, available at: http://rtweb.aer.com/, last access: 27 February 2021. a
Atmospheric Radiation Measurement Climate Research Facility: LASIC ground-based data sets, available at: https://www.arm.gov/research/campaigns/ amf2016lasic, last access: 27 February 2021. a
Baró Pérez, A., Devasthale, A., Bender, F. A.-M., and Ekman, A. M. L.: Impact of smoke and non-smoke aerosols on radiation and low-level clouds over the southeast Atlantic from co-located satellite observations, Atmos. Chem. Phys., 21, 6053–6077, https://doi.org/10.5194/acp-21-6053-2021, 2021. a
Chang, I., Gao, L., Burton, S. P., Chen, H., Diamond, M., Ferrare, R. A., Flynn, C. J., Kacenelenbogen, M., LeBlanc, S. E., Meyer, K. G., Pistone, K., Schmidt, S., Segal-Rozenhaimer, M., Shinozuka, Y., Wood, R., Zuidema, P., Redemann, J., and Christopher, S. A.: Spatiotemporal heterogeneity of aerosol and cloud properties over the southeast Atlantic: An observational analysis, Geophys. Res. Lett., 48, e2020GL091469, https://doi.org/10.1029/2020GL091469, 2021. a
Che, H., Stier, P., Gordon, H., Watson-Parris, D., and Deaconu, L.: Cloud adjustments dominate the overall negative aerosol radiative effects of biomass burning aerosols in UKESM1 climate model simulations over the south-eastern Atlantic, Atmos. Chem. Phys., 21, 17–33, https://doi.org/10.5194/acp-21-17-2021, 2021. a
Christensen, M. W., Jones, W. K., and Stier, P.: Aerosols enhance cloud lifetime and brightness along the stratus-to-cumulus transition, P. Natl. Acad. Sci. USA, 117, 17591–17598, https://doi.org/10.1073/pnas.1921231117, 2020. a, b, c, d
Clough, S. A., Shephard, M. W., Mlawer, E. J., Delamere, J. S., Iacono, M. J., Cady-Pereira, K., Boukabara, S., and Brown, P. D.: Atmospheric radiative transfer modeling: A summary of the AER codes, J. Quant. Spectrosc. Ra., 91, 233–244, https://doi.org/10.1016/j.jqsrt.2004.05.058, 2005. a
Cochrane, S. P., Schmidt, K. S., Chen, H., Pilewskie, P., Kittelman, S., Redemann, J., LeBlanc, S., Pistone, K., Kacenelenbogen, M., Segal Rozenhaimer, M., Shinozuka, Y., Flynn, C., Dobracki, A., Zuidema, P., Howell, S., Freitag, S., and Doherty, S.: Empirically derived parameterizations of the direct aerosol radiative effect based on ORACLES aircraft observations, Atmos. Meas. Tech., 14, 567–593, https://doi.org/10.5194/amt-14-567-2021, 2021. a
Comprehensive Environmental Data Archive (CEDA) of the Met Office Integrated Data Archive System: Met Office synoptic hourly weather reports, available at: http://catalogue.ceda.ac.uk/uuid/77910bcec71c820d4c92f40d3ed3f249, last access: 27 February 2021. a
Copernicus Climate Change Service: fifth-generation ECMWF (ERA5) atmospheric reanalyses of the global climate data, available at: https://cds.climate.copernicus.eu/, last access: 27 February 2021. a
Costantino, L. and Bréon, F.-M.: Aerosol indirect effect on warm clouds over South-East Atlantic, from co-located MODIS and CALIPSO observations, Atmos. Chem. Phys., 13, 69–88, https://doi.org/10.5194/acp-13-69-2013, 2013. a, b
Deaconu, L. T., Ferlay, N., Waquet, F., Peers, F., Thieuleux, F., and Goloub, P.: Satellite inference of water vapour and above-cloud aerosol combined effect on radiative budget and cloud-top processes in the southeastern Atlantic Ocean, Atmos. Chem. Phys., 19, 11613–11634, https://doi.org/10.5194/acp-19-11613-2019, 2019. a, b, c
Delgadillo, R., Voss, K. J., and Zuidema, P.: Characteristics of Optically Thin Coastal Florida Cumuli Derived From Surface-Based Lidar Measurements, J. Geophys. Res.-Atmos., 123, 10591–10605, https://doi.org/10.1029/2018JD028867, 2018. a, b, c
Diamond, M. S., Dobracki, A., Freitag, S., Small Griswold, J. D., Heikkila, A., Howell, S. G., Kacarab, M. E., Podolske, J. R., Saide, P. E., and Wood, R.: Time-dependent entrainment of smoke presents an observational challenge for assessing aerosol–cloud interactions over the southeast Atlantic Ocean, Atmos. Chem. Phys., 18, 14623–14636, https://doi.org/10.5194/acp-18-14623-2018, 2018. a, b
Draxler, R. R. and Hess, G. D.: An Overview of the HYSPLIT 4 Modelling System for Trajectories, Dispersion, and Deposition, Aust. Meteorol. Mag., 47, 295–308, 1998. a
Eastman, R., Wood, R., and Bretherton, C. S.: Time Scales of Clouds and Cloud-Controlling Variables in Subtropical Stratocumulus from a Lagrangian Perspective, J. Atmos. Sci, 73, 3079–3091, https://doi.org/10.1175/JAS-D-16-0050.1, 2016. a
Fuchs, J., Cermak, J., Andersen, H., Hollmann, R., and Schwarz, K.: On the Influence of Air Mass Origin on Low-Cloud Properties in the Southeast Atlantic, J. Geophys. Res.-Atmos., 122, 11076–11091, https://doi.org/10.1002/2017JD027184, 2017. a, b
Gaetani, M., Pohl, B., Alvarez Castro, M. C., Flamant, C., and Formenti, P.: A weather regime characterisation of winter biomass aerosol transport from southern Africa, Atmos. Chem. Phys. Discuss. [preprint], https://doi.org/10.5194/acp-2021-337, in review, 2021. a
Gordon, H., Field, P. R., Abel, S. J., Dalvi, M., Grosvenor, D. P., Hill, A. A., Johnson, B. T., Miltenberger, A. K., Yoshioka, M., and Carslaw, K. S.: Large simulated radiative effects of smoke in the south-east Atlantic, Atmos. Chem. Phys., 18, 15261–15289, https://doi.org/10.5194/acp-18-15261-2018, 2018. a
Haywood, J. M., Abel, S. J., Barrett, P. A., Bellouin, N., Blyth, A., Bower, K. N., Brooks, M., Carslaw, K., Che, H., Coe, H., Cotterell, M. I., Crawford, I., Cui, Z., Davies, N., Dingley, B., Field, P., Formenti, P., Gordon, H., de Graaf, M., Herbert, R., Johnson, B., Jones, A. C., Langridge, J. M., Malavelle, F., Partridge, D. G., Peers, F., Redemann, J., Stier, P., Szpek, K., Taylor, J. W., Watson-Parris, D., Wood, R., Wu, H., and Zuidema, P.: The CLoud–Aerosol–Radiation Interaction and Forcing: Year 2017 (CLARIFY-2017) measurement campaign, Atmos. Chem. Phys., 21, 1049–1084, https://doi.org/10.5194/acp-21-1049-2021, 2021. a, b, c, d
Herbert, R. J., Bellouin, N., Highwood, E. J., and Hill, A. A.: Diurnal cycle of the semi-direct effect from a persistent absorbing aerosol layer over marine stratocumulus in large-eddy simulations, Atmos. Chem. Phys., 20, 1317–1340, https://doi.org/10.5194/acp-20-1317-2020, 2020. a, b
Hersbach, H., Bell, B., Berrisford, P., Hirahara, S., Horányi, A., Muñoz-Sabater, J., Nicolas, J., Peubey, C., Radu, R., Schepers, D., Simmons, A., Soci, C., Abdalla, S., Abellan, X., Balsamo, G., Bechtold, P., Biavati, G., Bidlot, J., Bonavita, M., De Chiara, G., Dahlgren, P., Dee, D., Diamantakis, M., Dragani, R., Flemming, J., Forbes, R., Fuentes, M., Geer, A., Haimberger, L., Healy, S., Hogan, R. J., Hólm, E., Janisková, M., Keeley, S., Laloyaux, P., Lopez, P., Lupu, C., Radnoti, G., de Rosnay, P., Rozum, I., Vamborg, F., Villaume, S., and Thépaut, J.-N.: The ERA5 global reanalysis, Q. J. Roy. Meteor. Soc., 146, 1999–2049, https://doi.org/10.1002/qj.3803, 2020. a, b
Johnson, B. T.: Large-eddy simulations of the semidirect aerosol effect in shallow cumulus regimes, J. Geophys. Res.-Atmos., 110, D14206, https://doi.org/10.1029/2004JD005601, 2005. a
Johnson, B. T., Shine, K. P., and Forster, P. M.: The semi-direct aerosol effect: Impact of absorbing aerosols on marine stratocumulus, Q. J. Roy. Meteor. Soc., 130, 1407–1422, https://doi.org/10.1256/qj.03.61, 2004. a, b
Kacarab, M., Thornhill, K. L., Dobracki, A., Howell, S. G., O'Brien, J. R., Freitag, S., Poellot, M. R., Wood, R., Zuidema, P., Redemann, J., and Nenes, A.: Biomass burning aerosol as a modulator of the droplet number in the southeast Atlantic region, Atmos. Chem. Phys., 20, 3029–3040, https://doi.org/10.5194/acp-20-3029-2020, 2020. a
Klein, S. A. and Hartmann, D. L.: The Seasonal Cycle of Low Stratiform Clouds, J. Climate, 6, 1587–1606, https://doi.org/10.1175/1520-0442(1993)006<1587:TSCOLS>2.0.CO;2, 1993. a
Klein, S. A., Hartmann, D. L., and Norris, J. R.: On the Relationships among Low-Cloud Structure, Sea Surface Temperature, and Atmospheric Circulation in the Summertime Northeast Pacific, J. Climate, 8, 1140–1155, https://doi.org/10.1175/1520-0442(1995)008<1140:OTRALC>2.0.CO;2, 1995. a
Levy, R. C., Mattoo, S., Munchak, L. A., Remer, L. A., Sayer, A. M., Patadia, F., and Hsu, N. C.: The Collection 6 MODIS aerosol products over land and ocean, Atmos. Meas. Tech., 6, 2989–3034, https://doi.org/10.5194/amt-6-2989-2013, 2013. a
Lu, Z., Liu, X., Zhang, Z., Zhao, C., Meyer, K., Rajapakshe, C., Wu, C., Yang, Z., and Penner, J. E.: Biomass smoke from southern Africa can significantly enhance the brightness of stratocumulus over the southeastern Atlantic Ocean, P. Natl. Acad. Sci. USA, 115, 2924–2929, https://doi.org/10.1073/pnas.1713703115, 2018. a, b
Mallet, M., Solmon, F., Nabat, P., Elguindi, N., Waquet, F., Bouniol, D., Sayer, A. M., Meyer, K., Roehrig, R., Michou, M., Zuidema, P., Flamant, C., Redemann, J., and Formenti, P.: Direct and semi-direct radiative forcing of biomass-burning aerosols over the southeast Atlantic (SEA) and its sensitivity to absorbing properties: a regional climate modeling study, Atmos. Chem. Phys., 20, 13191–13216, https://doi.org/10.5194/acp-20-13191-2020, 2020. a
Mapes, B. E. and Zuidema, P.: Radiative-Dynamical Consequences of Dry Tongues in the Tropical Troposphere, J. Atmos. Sci, 53, 620–638, https://doi.org/10.1175/1520-0469(1996)053<0620:RDCODT>2.0.CO;2, 1996. a
Marquardt Collow, A. B., Miller, M. A., Trabachino, L. C., Jensen, M. P., and Wang, M.: Radiative heating rate profiles over the southeast Atlantic Ocean during the 2016 and 2017 biomass burning seasons, Atmos. Chem. Phys., 20, 10073–10090, https://doi.org/10.5194/acp-20-10073-2020, 2020. a
Mauger, G. S. and Norris, J. R.: Assessing the Impact of Meteorological History on Subtropical Cloud Fraction, J. Climate, 23, 2926–2940, https://doi.org/10.1175/2010JCLI3272.1, 2010. a
Meyer, K., Platnick, S., and Zhang, Z.: Simultaneously inferring above-cloud absorbing aerosol optical thickness and underlying liquid phase cloud optical and microphysical properties using MODIS, J. Geophys. Res.-Atmos., 120, 5524–5547, https://doi.org/10.1002/2015JD023128, 2015. a, b, c, d
Miller, M. A., Nitschke, K., Ackerman, T. P., Ferrell, W. R., Hickmon, N., and Ivey, M.: The ARM Mobile Facilities, Meteor. Mon., 57, 9.1–9.15, https://doi.org/10.1175/AMSMONOGRAPHS-D-15-0051.1, 2016. a
Minnis, P., Nguyen, L., Palikonda, R., Heck, P. W., Spangenberg, D. A., Doelling, D. R., Kirk Ayers, J., Smith, W. L., Khaiyer, M. M., Trepte, Q. Z., Avey, L. A., Chang, F.-L., Yost, C. R., Chee, T. L., and Szedung, T. L.: Near-real time cloud retrievals from operational and research meteorological satellites, Proc. SPIE, 7107, 710703, https://doi.org/10.1117/12.800344, 2008. a
NASA's Atmosphere Archive & Distribution System Distributed Active Archive Center: MODIS level 3 retrievals, available at: https://ladsweb.modaps.eosdis.nasa.gov, last access: 27 February 2021. a
NASA's Langley Research Center: SEVIRI retrievals and CERES SSF data, available at: https://satcorps.larc.nasa.gov/, last access: 27 February 2021. a
Nicholson, S. E. and Grist, J. P.: The seasonal evolution of the atmospheric circulation over west Africa and equatorial Africa, J. Climate, 16, 1013–1030, https://doi.org/10.1175/1520-0442(2003)016<1013:TSEOTA>2.0.CO;2, 2003. a
NOAA Air Resources Laboratory: HYSPLIT model code, available at: https://www.arl.noaa.gov/ hysplit, last access: 27 February 2021. a
Painemal, D. and Zuidema, P.: Microphysical variability in southeast Pacific Stratocumulus clouds: synoptic conditions and radiative response, Atmos. Chem. Phys., 10, 6255–6269, https://doi.org/10.5194/acp-10-6255-2010, 2010. a
Painemal, D. and Zuidema, P.: Assessment of MODIS cloud effective radius and optical thickness retrievals over the southeast Pacific with VOCALS-REx in situ measurements, J. Geophys. Res.-Atmos., 116, 1–16, https://doi.org/10.1029/2011JD016155, 2011. a, b
Peers, F., Francis, P., Abel, S. J., Barrett, P. A., Bower, K. N., Cotterell, M. I., Crawford, I., Davies, N. W., Fox, C., Fox, S., Langridge, J. M., Meyer, K. G., Platnick, S. E., Szpek, K., and Haywood, J. M.: Observation of absorbing aerosols above clouds over the south-east Atlantic Ocean from the geostationary satellite SEVIRI – Part 2: Comparison with MODIS and aircraft measurements from the CLARIFY-2017 field campaign, Atmos. Chem. Phys., 21, 3235–3254, https://doi.org/10.5194/acp-21-3235-2021, 2021. a
Pennypacker, S., Diamond, M., and Wood, R.: Ultra-clean and smoky marine boundary layers frequently occur in the same season over the southeast Atlantic, Atmos. Chem. Phys., 20, 2341–2351, https://doi.org/10.5194/acp-20-2341-2020, 2020. a
Pistone, K., Zuidema, P., Wood, R., Diamond, M., da Silva, A. M., Ferrada, G., Saide, P. E., Ueyama, R., Ryoo, J.-M., Pfister, L., Podolske, J., Noone, D., Bennett, R., Stith, E., Carmichael, G., Redemann, J., Flynn, C., LeBlanc, S., Segal-Rozenhaimer, M., and Shinozuka, Y.: Exploring the elevated water vapor signal associated with the free tropospheric biomass burning plume over the southeast Atlantic Ocean, Atmos. Chem. Phys., 21, 9643–9668, https://doi.org/10.5194/acp-21-9643-2021, 2021. a, b, c, d
Platnick, S., King, M. D., Ackerman, S. A., Menzel, W. P., Baum, B. A., Riedi, J. C., and Frey, R. A.: The MODIS cloud products: algorithms and examples from Terra, IEEE Trans. Geos. Remote Sens., 41, 459–473, https://doi.org/10.1109/TGRS.2002.808301, 2003. a
Redemann, J., Wood, R., Zuidema, P., Doherty, S. J., Luna, B., LeBlanc, S. E., Diamond, M. S., Shinozuka, Y., Chang, I. Y., Ueyama, R., Pfister, L., Ryoo, J.-M., Dobracki, A. N., da Silva, A. M., Longo, K. M., Kacenelenbogen, M. S., Flynn, C. J., Pistone, K., Knox, N. M., Piketh, S. J., Haywood, J. M., Formenti, P., Mallet, M., Stier, P., Ackerman, A. S., Bauer, S. E., Fridlind, A. M., Carmichael, G. R., Saide, P. E., Ferrada, G. A., Howell, S. G., Freitag, S., Cairns, B., Holben, B. N., Knobelspiesse, K. D., Tanelli, S., L'Ecuyer, T. S., Dzambo, A. M., Sy, O. O., McFarquhar, G. M., Poellot, M. R., Gupta, S., O'Brien, J. R., Nenes, A., Kacarab, M., Wong, J. P. S., Small-Griswold, J. D., Thornhill, K. L., Noone, D., Podolske, J. R., Schmidt, K. S., Pilewskie, P., Chen, H., Cochrane, S. P., Sedlacek, A. J., Lang, T. J., Stith, E., Segal-Rozenhaimer, M., Ferrare, R. A., Burton, S. P., Hostetler, C. A., Diner, D. J., Seidel, F. C., Platnick, S. E., Myers, J. S., Meyer, K. G., Spangenberg, D. A., Maring, H., and Gao, L.: An overview of the ORACLES (ObseRvations of Aerosols above CLouds and their intEractionS) project: aerosol–cloud–radiation interactions in the southeast Atlantic basin, Atmos. Chem. Phys., 21, 1507–1563, https://doi.org/10.5194/acp-21-1507-2021, 2021. a, b, c, d, e, f, g
Ryoo, J.-M., Pfister, L., Ueyama, R., Zuidema, P., Wood, R., Chang, I., and Redemann, J.: A meteorological overview of the ORACLES (ObseRvations of Aerosols above CLouds and their intEractionS) campaign over the southeast Atlantic during 2016–2018, Atmos. Chem. Phys. Discuss. [preprint], https://doi.org/10.5194/acp-2021-274, in review, 2021 a, b, c
Sakaeda, N., Wood, R., and Rasch, P. J.: Direct and semidirect aerosol effects of southern African biomass burning aerosol, J. Geophys. Res.-Atmos., 116, 1–19, https://doi.org/10.1029/2010JD015540, 2011. a
Scott, R. C., Myers, T. A., Norris, J. R., Zelinka, M. D., Klein, S. A., Sun, M., and Doelling, D. R.: Observed Sensitivity of Low-Cloud Radiative Effects to Meteorological Perturbations over the Global Oceans, J. Climate, 33, 7717–7734, https://doi.org/10.1175/JCLI-D-19-1028.1, 2020. a
Shinozuka, Y., Saide, P. E., Ferrada, G. A., Burton, S. P., Ferrare, R., Doherty, S. J., Gordon, H., Longo, K., Mallet, M., Feng, Y., Wang, Q., Cheng, Y., Dobracki, A., Freitag, S., Howell, S. G., LeBlanc, S., Flynn, C., Segal-Rosenhaimer, M., Pistone, K., Podolske, J. R., Stith, E. J., Bennett, J. R., Carmichael, G. R., da Silva, A., Govindaraju, R., Leung, R., Zhang, Y., Pfister, L., Ryoo, J.-M., Redemann, J., Wood, R., and Zuidema, P.: Modeling the smoky troposphere of the southeast Atlantic: a comparison to ORACLES airborne observations from September of 2016, Atmos. Chem. Phys., 20, 11491–11526, https://doi.org/10.5194/acp-20-11491-2020, 2020. a
Su, W., Corbett, J., Eitzen, Z., and Liang, L.: Next-generation angular distribution models for top-of-atmosphere radiative flux calculation from CERES instruments: methodology, Atmos. Meas. Tech., 8, 611–632, https://doi.org/10.5194/amt-8-611-2015, 2015. a
Tyson, P. D., Garstang, M., and Swap, R.: Large-Scale Recirculation of Air over Southern Africa, J. Appl. Meteorol., 35, 2218–2236, https://doi.org/10.1175/1520-0450(1996)035<2218:LSROAO>2.0.CO;2, 1996. a
Wielicki, B. A., Barkstrom, B. R., Harrison, E. F., Lee, R. B., Smith, G. L., and Cooper, J. E.: Clouds and the Earth's Radiant Energy System (CERES): An Earth Observing System Experiment, B. Am. Meteorol. Soc., 77, 853–868, https://doi.org/10.1175/1520-0477(1996)077<0853:CATERE>2.0.CO;2, 1996. a
Wilcox, E. M.: Stratocumulus cloud thickening beneath layers of absorbing smoke aerosol, Atmos. Chem. Phys., 10, 11769–11777, https://doi.org/10.5194/acp-10-11769-2010, 2010. a, b, c
Wilcox, E. M.: Direct and semi-direct radiative forcing of smoke aerosols over clouds, Atmos. Chem. Phys., 12, 139–149, https://doi.org/10.5194/acp-12-139-2012, 2012. a, b, c
WMO: Manual on Codes, 306, World Meteorological Organization Publications, 1 edn., Geneva, Switzerland, 1974. a
Yamaguchi, T., Feingold, G., Kazil, J., and McComiskey, A.: Stratocumulus to cumulus transition in the presence of elevated smoke layers, Geophys. Res. Lett., 42, 10478–10485, https://doi.org/10.1002/2015GL066544, 2015. a, b
Yin, B. and Albrecht, B. A.: Spatial Variability of Atmospheric Boundary Layer Structure over the Eastern Equatorial Pacific, J. Climate, 13, 1574–1592, https://doi.org/10.1175/1520-0442(2000)013<1574:SVOABL>2.0.CO;2, 2000. a
Zhang, J. and Zuidema, P.: The diurnal cycle of the smoky marine boundary layer observed during August in the remote southeast Atlantic, Atmos. Chem. Phys., 19, 14493–14516, https://doi.org/10.5194/acp-19-14493-2019, 2019. a, b, c
Zhou, X., Ackerman, A. S., Fridlind, A. M., Wood, R., and Kollias, P.: Impacts of solar-absorbing aerosol layers on the transition of stratocumulus to trade cumulus clouds, Atmos. Chem. Phys., 17, 12725–12742, https://doi.org/10.5194/acp-17-12725-2017, 2017. a, b
Zuidema, P., Painemal, D., deSzoeke, S., and Fairall, C.: Stratocumulus cloud top height estimates and their climatic implications, J. Climate, 22, 4652–4666, https://doi.org/10.1175/2009JCLI2708.1, 2009. a
Zuidema, P., Chiu, C., Fairall, C., Ghan, S., Kollias, P., McFarguhar, G., Mechem, D., Romps, D., Wong, H., Yuter, S., Alvarado, M., DeSzoeke, S., Feingold, G., Haywood, J., Lewis, E., McComiskey, A., Redemann, J., Turner, D., Wood, R., and Zhu, P.: Layered Atlantic Smoke Interactions with Clouds (LASIC) science plan: DOE Office of Science Atmospheric Radiation Measurement (ARM) Program, available at: http://www.osti.gov/scitech/servlets/purl/1232658 (last access: 27 February 2021), 2015. a, b
Zuidema, P., Chang, P., Medeiros, B., Kirtman, B. P., Mechoso, R., Schneider, E. K., Toniazzo, T., Richter, I., Small, R. J., Bellomo, K., Brandt, P., de Szoeke, S., Farrar, J. T., Jung, E., Kato, S., Li, M., Patricola, C., Wang, Z., Wood, R., and Xu, Z.: Challenges and Prospects for Reducing Coupled Climate Model SST Biases in the Eastern Tropical Atlantic and Pacific Oceans: The U.S. CLIVAR Eastern Tropical Oceans Synthesis Working Group, B. Am. Meteorol. Soc., 97, 2305–2328, https://doi.org/10.1175/BAMS-D-15-00274.1, 2016. a
Zuidema, P., Sedlacek, A. J., Flynn, C., Springston, S., Delgadillo, R., Zhang, J., Aiken, A. C., Koontz, A., and Muradyan, P.: The Ascension Island Boundary Layer in the Remote Southeast Atlantic is Often Smoky, Geophys. Res. Lett., 45, 4456–4465, https://doi.org/10.1002/2017GL076926, 2018. a, b, c, d, e
- Abstract
- Introduction
- Data sets and compositing approach
- July–October overview
- July: smoke reduces cloud fraction
- September: midlatitude disturbances reduce stratocumulus cloud and raise boundary layer heights on cleaner days
- October: increased cloud cover on smokier days
- September: longwave cooling by water vapor maintains a well-mixed free troposphere
- Concluding remarks
- Data availability
- Author contributions
- Competing interests
- Disclaimer
- Special issue statement
- Acknowledgements
- Financial support
- Review statement
- References
- Supplement