the Creative Commons Attribution 4.0 License.
the Creative Commons Attribution 4.0 License.
 | 22 Jul 2021
Vertical profiles of trace gas and aerosol properties over the eastern North Atlantic: variations with season and synoptic condition
Yang Wang
Guangjie Zheng
Michael P. Jensen
Daniel A. Knopf
Alexander Laskin
Alyssa A. Matthews
David Mechem
Ryan Moffet
Arthur J. Sedlacek
John E. Shilling
Stephen Springston
Amy Sullivan
Jason Tomlinson
Daniel Veghte
Rodney Weber
Robert Wood
Maria A. Zawadowicz
Because of their extensive coverage, marine low clouds greatly impact the global climate. Presently, the response of marine low clouds to the changes in atmospheric aerosols remains a major source of uncertainty in climate simulations. One key contribution to this large uncertainty derives from the poor understanding of the properties and processes of marine aerosols under natural conditions and the perturbation by anthropogenic emissions. The eastern North Atlantic (ENA) is a region of persistent but diverse subtropical marine boundary layer (MBL) clouds, where cloud albedo and precipitation are highly susceptible to perturbations in aerosol properties. Here we examine the key processes that drive the cloud condensation nuclei (CCN) population in the MBL using comprehensive characterizations of aerosol and trace gas vertical profiles during the Aerosol and Cloud Experiments in the Eastern North Atlantic (ACE-ENA) field campaign. During ACE-ENA, a total of 39 research flights were conducted in the Azores: 20 during summer 2017 and 19 during winter 2018. During summer, long-range-transported aerosol layers were periodically observed in the lower free troposphere (FT), leading to elevated FT CCN concentrations (NCCN). Both biomass burning and pollution from North America contribute to submicron aerosol mass in these layers, with pollution likely the dominant contributor. In contrast, long-range transported continental emissions have a much weaker influence on the aerosol properties in the ENA during the winter season. While the entrainment of FT air is a major source of particle number in the MBL for both seasons, on average it does not serve as a direct source of CCN in the MBL because the average FT NCCN is the same or even lower than that in the MBL. The particle number flux due to FT entrainment is dominated by pre-CCN (particles that are too small to form cloud droplets under typical conditions, i.e., particles with sizes below the Hoppel minimum) due to the elevated Npre-CCN in the lower FT. Once these pre-CCN are entrained into the MBL, they can grow and reach CCN size range through condensational growth, representing an indirect and major source of MBL CCN in the ENA. The impact of synoptic conditions on the aerosol properties is examined. Under pre-front and post-front conditions, shallow convective activity often leads to a deep and decoupled boundary layer. Coalescence scavenging and evaporation of drizzle below clouds lead to reduced NCCN and larger accumulation-mode particle sizes in the upper cloud-containing decoupled layer, indicating that surface measurements overestimate the NCCN relevant to the formation of MBL clouds under decoupled conditions.
- Article
(6396 KB) - Full-text XML
-
Supplement
(2895 KB) - BibTeX
- EndNote


Remote marine low cloud systems have a large spatial coverage and are particularly susceptible to aerosol perturbations because of their relatively low optical thickness and low background cloud condensation nuclei (CCN) concentrations. The response of low cloud systems to changes in aerosols is a major source of uncertainty in simulations of climate change (Bony and Dufresne, 2005; Wyant et al., 2006; Turner et al., 2007; Carslaw et al., 2013). One major contribution to this large uncertainty derives from the poor understanding of the properties and processes of marine aerosols under natural conditions and the perturbation by anthropogenic emissions. The processes that control CCN population in the marine boundary layer (MBL) have been examined by a number of studies. These processes include entrainment of free troposphere aerosols (Raes, 1995; Clarke et al., 2013), new particle formation (NPF) (Bates et al., 1998; O'Dowd et al., 2010), production of sea spray aerosols (O'Dowd et al., 2004; Russell et al., 2010; Prather et al., 2013; Quinn et al., 2017), condensational growth of Aitken-mode particles (Sanchez et al., 2018; Zheng et al., 2018, 2020a), interstitial particle scavenging by cloud droplets (Pierce et al., 2015), and the removal of CCN by coalescence scavenging (Wood et al., 2012, 2017). In addition, synoptic conditions also strongly influence entrainment and coalescence scavenging and therefore the population of MBL aerosols (Bates et al., 2000; Wood et al., 2015, 2017).
The eastern North Atlantic (ENA) is a region of persistent but diverse subtropical MBL clouds (Wood et al., 2015; Rémillard and Tselioudis, 2015). The origins of the aerosols arriving at the ENA are diverse, varying from clean marine air masses to those that are strongly influenced by continental emissions (O'Dowd and Smith, 1993; Wood et al., 2015; China et al., 2017; Zawadowicz et al., 2021). Zheng et al. (2018) examined MBL aerosol in the ENA using 3 years of measurements (2015–2017) at the US Department of Energy Atmospheric Radiation Measurement (ARM) site on Graciosa Island in the Azores, Portugal. In the ENA, MBL aerosol concentrations in different size ranges exhibit strong seasonal variations. For example, larger accumulation-mode aerosols (Dp>300 nm) are dominated by sea spray aerosols with a higher concentration in winter than in summer, largely due to the seasonal variation in wind speed. The growth of nucleation- and Aitken-mode aerosols in the MBL represents a substantial source of accumulation-mode aerosols, with the highest contribution potentially reaching 60 % during summer (Zheng et al., 2018). Using the long-term measurement data from the size-resolved CCN measurement system, Zheng et al. (2020a) further found that over the ENA, organics represent an important or even dominant condensing species for the growth of pre-CCN particles. Potential precursors of the secondary organics are volatile organic compounds from the ocean biological activities and those produced by the air–sea interfacial oxidation. The properties of aerosols from the ENA were also studied using long-term observations at the Mace Head Atmospheric Research Station located on the west coast of Ireland (O'Dowd et al., 2004; Ovadnevaite et al., 2014; Yoon et al., 2007). These studies show that a major driver of the seasonal variation of midlatitude marine aerosol is biological activity because the majority of the aerosol mass, both inorganic sea salt and organic matter, was linked to bubble-mediated aerosol production. The organic fraction was also linked to organic matter concentrated at the ocean surface resulting from plankton bloom (Behrenfeld et al., 2019; Ovadnevaite et al., 2014).
While previous studies have greatly advanced our understanding of MBL aerosol properties and processes, they are mostly based on measurements at ground and sea level, whereas the vertical profiles of aerosol properties are needed to understand some of the key processes that drive CCN populations in the MBL, including long-range transport of continental emissions, entrainment of free tropospheric (FT) air, and the interactions between aerosols and clouds. Airborne measurements were carried out during several field campaigns in the 1990s, including the North Atlantic Regional Experiment (NARE) (Parrish et al., 1998), the Atlantic Stratocumulus Transition Experiment (ASTEX) (Albrecht et al., 1995), the Marine Aerosol and Gas Exchange (MAGE) campaign (Huebert et al., 1996) that organized the chemical experiment within ASTEX, and the Aerosol Characterization Experiment (ACE-2) (Raes et al., 2000). The emphasis of NARE was mostly on ozone chemistry, and ASTEX was focused on the transition of marine stratocumulus clouds. During ACE-2, the variation of aerosol size distribution and chemical composition was examined during three Lagrangian experiments over periods of ∼30 h as air masses advected over the North Atlantic (Johnson et al., 2000). These experiments show that the production of sea salt particles at elevated wind speeds leads to an increase in accumulation-mode particle concentration (Hoell et al., 2000). The reduction of the Aitken-mode particle concentration is attributed to collision with cloud droplets and accumulation-mode particles (Johnson et al., 2000). Dilution by entrainment, in particular when the depth of the MBL increases as the air mass moves over a warmer ocean, is the main reason for a general reduction in the aerosol concentration.
In this study, we present comprehensive airborne measurements of aerosols and trace gases in both summer and winter seasons during the Aerosol and Cloud Experiments in the Eastern North Atlantic (ACE-ENA) campaign (Wang et al., 2021). The large number of the flights provides statistically robust characterization of the vertical profiles of aerosol properties and allows for understanding of the aerosol properties under natural conditions (i.e., aerosols mostly produced by natural processes) and those strongly influenced by anthropogenic emissions. Key processes that control the population of CCN in the MBL are investigated by examining the vertical profiles of aerosol properties and their variations between the seasons. The impact of synoptic conditions on MBL structure and the vertical profiles of the aerosol populations are examined, and the implications for studying aerosol–cloud interactions using ground-based aerosol measurements are discussed.
During the ACE-ENA campaign, the ARM Aerial Facility Gulfstream-1 (G-1) research aircraft was deployed in the Azores, Portugal, as part of two intense operation periods (IOPs) during summer 2017 (June to July, summer IOP) and winter 2018 (January to February, winter IOP). The G-1 aircraft was stationed at the Lajes airport on Terceira Island, and a total of 39 flights (20 in summer and 19 in winter) were conducted. The dates and durations of the flights are summarized in Fig. 1. The deployments during both seasons allow for the examination of key aerosol and cloud processes under a variety of representative meteorological and cloud conditions. Each flight consisted of four to six vertical profiles (excluding those leaving and arriving at the Lajes airport), providing the aerosol and trace gas properties as a function of altitude. The flights also included horizontal legs near the surface of the ocean (∼100 m a.g.l.), just below cloud base, within the cloud, at cloud top, and above clouds in the lower FT. To maximize the synergy between the G-1 and ground measurements at the ARM ENA observatory on Graciosa Island (39∘3′5′′ N 28∘0′51′′ W), most of the flights were conducted within 50 km of the ENA observatory. The geographical location of the Azores and the flight track of a representative research flight are shown in Fig. 2. The aerosol and trace gas properties presented here are based on the measurements in the MBL and lower FT (<3 km) over the open ocean near Graciosa Island.

Figure 1Date and time periods of research flights during summer (a) and winter (b) IOPs of the ACE-ENA campaign.
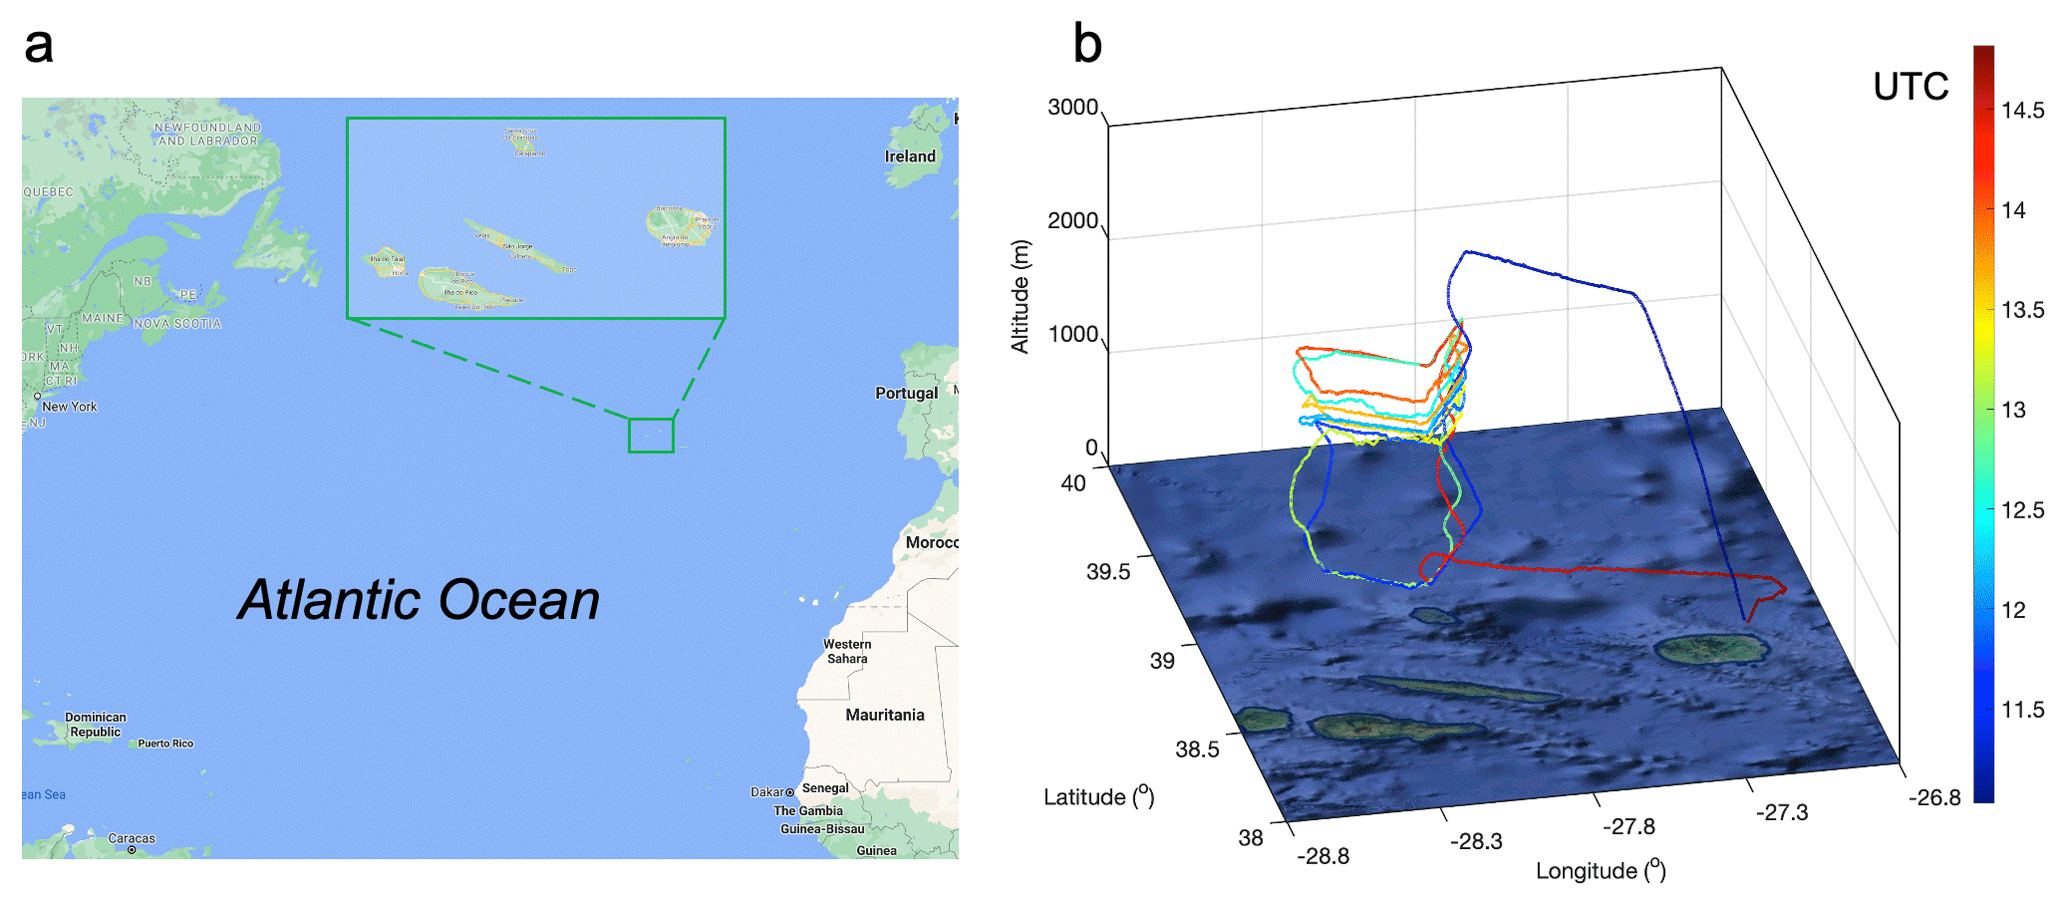
Figure 2(a) The geographical location of the ACE-ENA campaign. (b) An example of a representative flight pattern on 25 January 2018. The G-1 flew an L-shaped pattern consisting of along-wind legs upwind of Graciosa Island and cross-wind legs over the ocean. Maps are obtained from © Google Maps.
Measurements on board the G-1 included meteorological parameters, trace gas species, aerosol, and cloud properties (Wang et al., 2021). Measurements used in this study are summarized in Table 1 and described briefly below. The height of the MBL is derived from the measured vertical profile of potential temperature, from which the boundary between the MBL and FT is often clearly defined by an abrupt increase in the potential temperature with altitude (i.e., temperature inversion). When the inversion is not obvious, liquid water content (LWC) and water vapor mixing ratio (w) profiles are used to help identify the cloud top and define the MBL height (rapid increase in LWC or decrease in w). The water vapor mixing ratio is calculated from the ambient temperature and dew point measured on board the G-1. The mixing ratios of CO and O3 were measured by trace gas monitors (Los Gatos Research, Inc., N2O/COR-23r and Thermo Scientific model 49i, respectively). The aerosol particles were sampled using an isokinetic inlet that has a 50 % upper cutoff size of 5 µm (Schmid et al., 2014) and were subsequently dried with a Nafion tube. Aerosol size distributions from 10 to ∼600 nm were measured by a fast-integrated mobility spectrometer (FIMS) (Wang et al., 2018). The total number concentration of particles larger than 10 nm in diameter (N>10) was measured by a condensation particle counter (CPC 3772, TSI Inc.). Another CPC (CPC 3010, TSI Inc., modified to achieve a lower cutoff size of 10 nm) was operated downstream of a thermal denuder operated at 300 ∘C (Fierz et al., 2007), which allows volatility-based separation by exploiting the higher volatility of organics and sulfates versus sea salt and refractory black carbon (BC) (Clarke et al., 2013). The volatile particle number fraction (fvol) is derived as 1 – , where represents the number concentration of thermally denuded aerosols measured by the modified CPC 3010.
Table 1Instrumentation deployed during the ACE-ENA that are used for data analysis in this study. All measurements were made at a frequency of 1 Hz except for the HR-ToF-AMS, PILS, and thermal denuder.
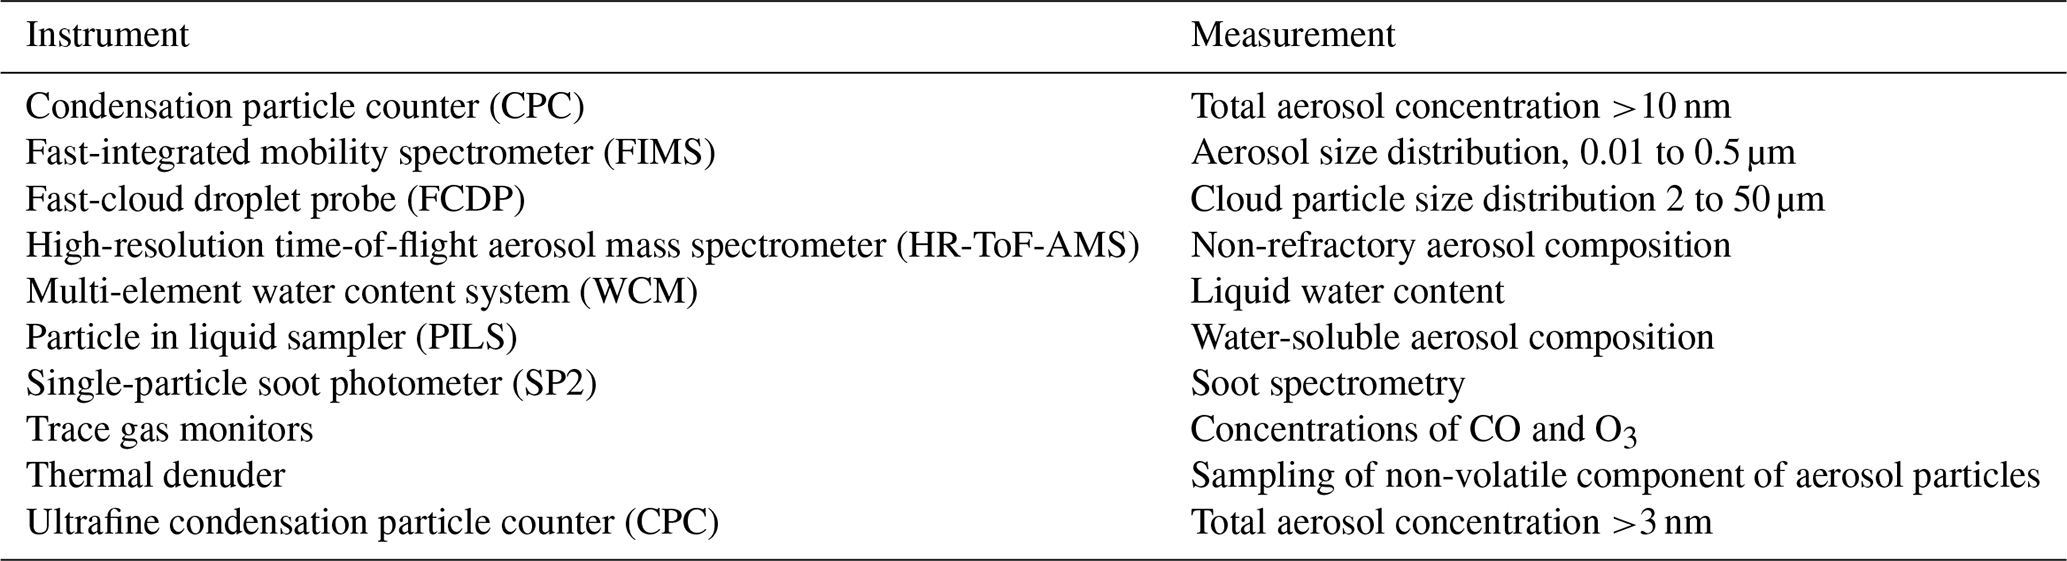
BC mass concentration was characterized by a single-particle soot photometer (SP2, DMT Inc., Longmont, CO). A high-resolution time-of-flight aerosol mass spectrometer (HR-ToF-AMS) (Jayne et al., 2000; DeCarlo et al., 2006; Zawadowicz et al., 2021) and a particle-into-liquid sampler (PILS) coupled with offline ion chromatography (Orsini et al., 2003; Sullivan et al., 2019) were deployed to characterize sub-micrometer non-refractory aerosol composition. Both the HR-ToF-AMS and the PILS were deployed downstream of an impactor with a cutoff size of 1 µm. Cloud LWC is calculated by integrating the droplet size distribution measured by a fast-cloud droplet probe (FCDP, SPEC Inc., Boulder CO) and validated by a multi-element water content system (WCM-2000, SEI Inc., Tolland, CT). To minimize artifacts due to droplet shattering on the aerosol sampling inlet, we exclude aerosol measurements inside clouds (i.e., LWC > 10−3 g m−3) from our analysis. In addition, only measurements collected at least 5 km away from Graciosa Island and Terceira Island are included in the analysis to minimize the potential impact of local island emissions.
3.1 Air mass origins
The vertical profiles of potential temperature and LWC show that the MBL heights during the summer and winter IOPs are 1220 ± 450 and 1640 ± 480 m (mean ± standard deviation), respectively, indicating a strong seasonal variation. The shallower MBL during summer is due to the presence of a stronger Azores high-pressure system that favors MBL low cloud occurrence through enhanced synoptic-scale subsidence, lower tropospheric stability, and increased low-level relative humidity. To understand the air mass origin and its impact on the vertical profiles of trace gases and aerosols, we calculated the 10 d back trajectories of air masses arriving at three altitudes (500, 1500, and 3000 m) above the ENA site during the G-1 flight days using the Hybrid Single-Particle Lagrangian Integrated Trajectory (HYSPLIT) version 4 model (Stein et al., 2015). The back trajectories were simulated with a time step of 6 h using the National Center for Environmental Prediction (NCEP) Global Data Assimilation System (GDAS) meteorological data as input. A cluster analysis of the trajectories was then performed (Abdalmogith and Harrison, 2005) for each IOP and arriving altitude (i.e., 500, 1500, or 3000 m) (Fig. 3). Based on these solutions, the air masses are classified into three main clusters of different originating locations: (1) North America, (2) the recirculating flow around the Azores high, and (3) the Arctic. This classification is consistent with previous studies of the air mass origins over the ENA (O'Dowd and Smith, 1993; Zheng et al., 2018). Among the three clusters, the Arctic cluster has the lowest frequency of occurrence. A large fraction of the air masses arriving at 1500 m over the ENA site (i.e., lower FT) originated from North America, suggesting a strong influence of continental emissions. Nearly half of the air masses arriving at the ENA MBL during the summer had circulated around the Azores high over the ocean for more than 10 d. Air mass trajectories during the summertime show relatively weaker vertical motion, whereas most of the wintertime air masses arriving at all three altitudes over the ENA site originated from above 3000 m 10 d before, suggesting that the wintertime air masses arriving at the ENA are less influenced by anthropogenic emissions near the surface.
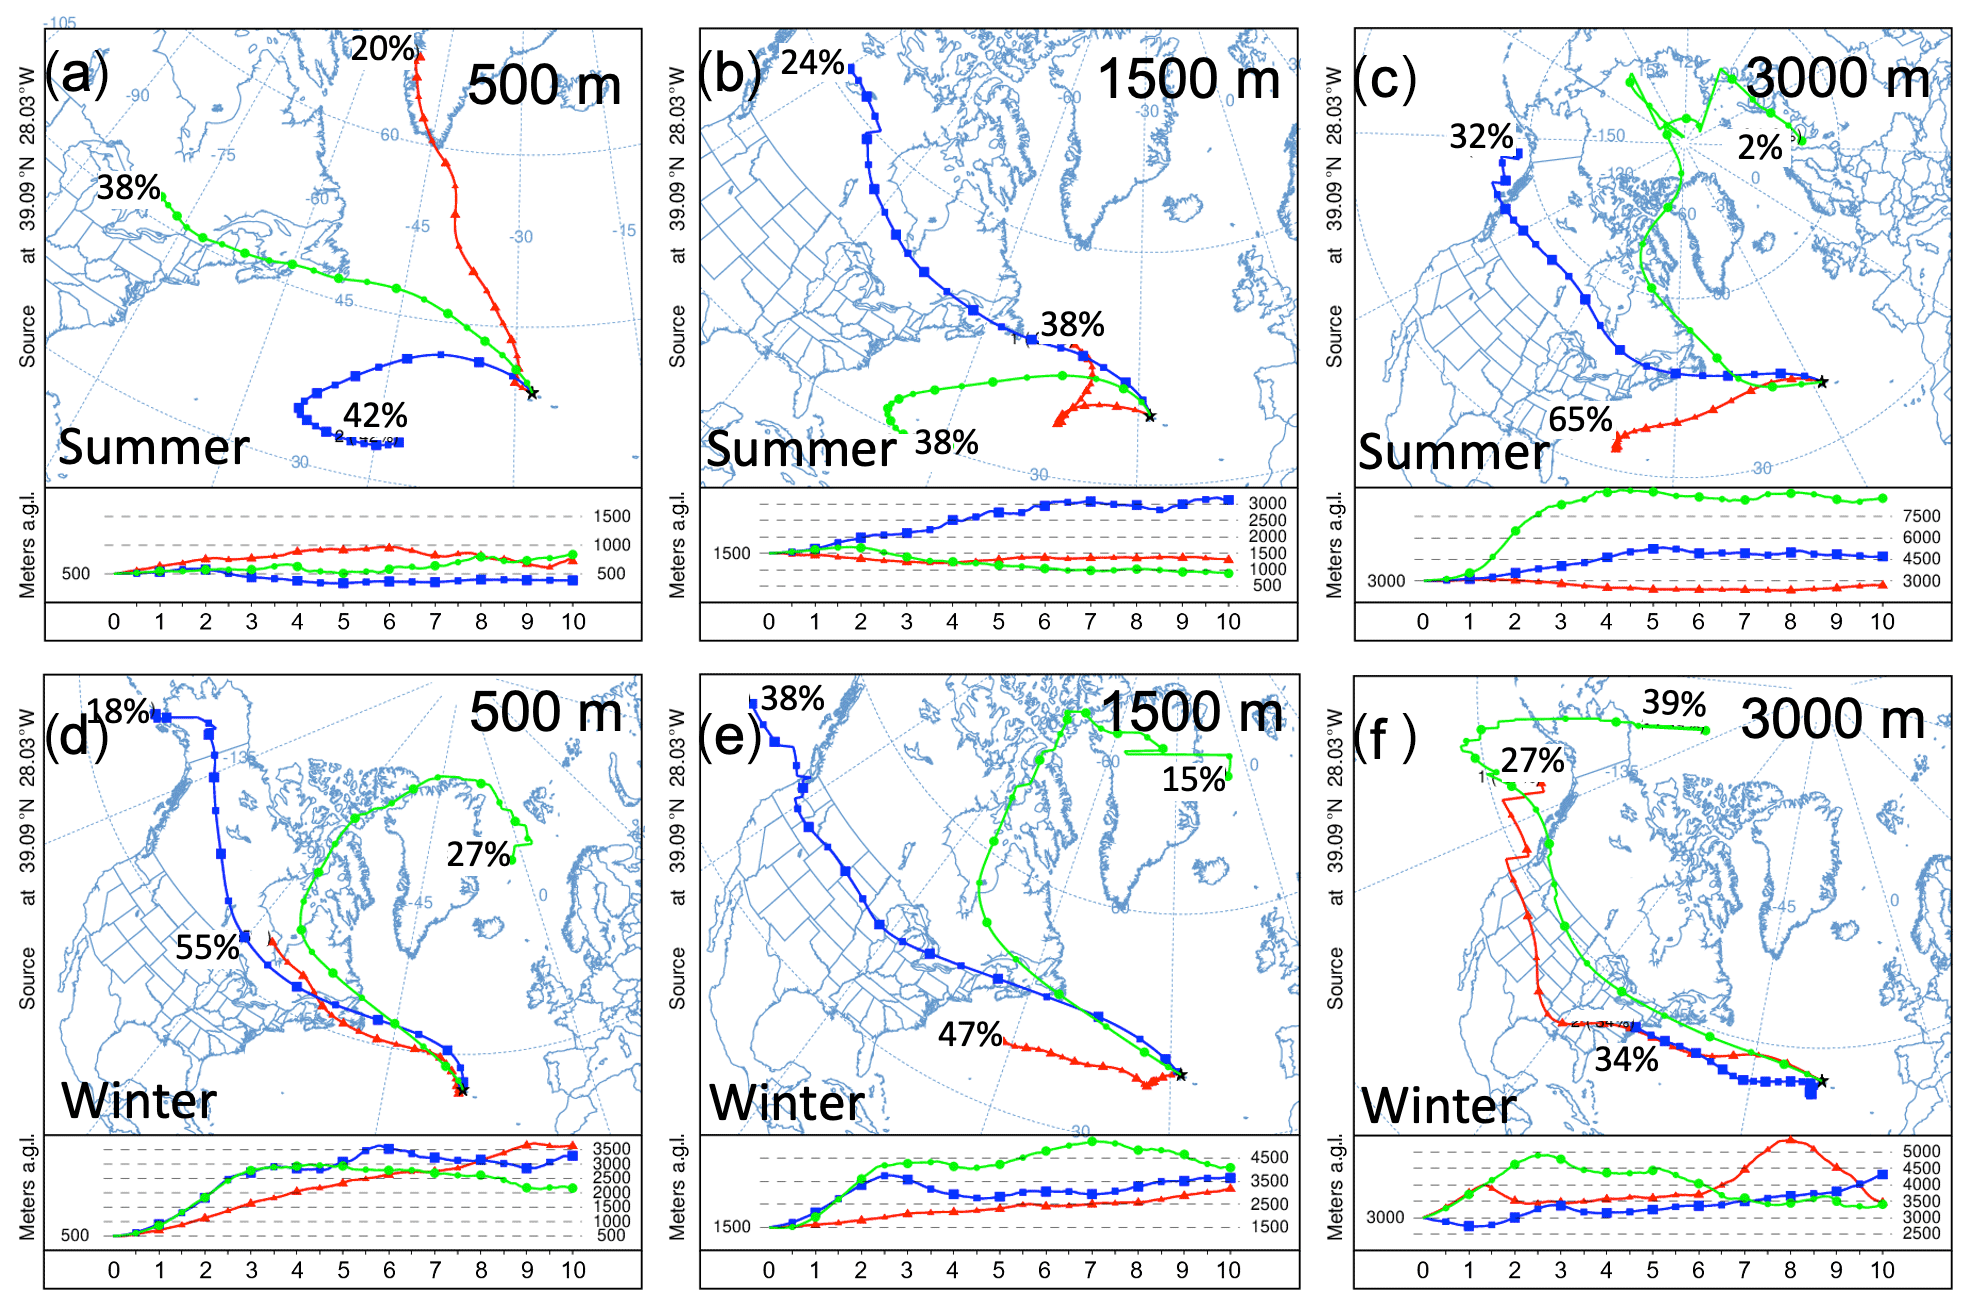
Figure 3Cluster analysis of 10 d back trajectories arriving at 500, 1500, and 3000 m above the ENA site during the summer (a)–(c) and winter (d)–(f) IOP. The average 10 d back trajectories of the three clusters are represented by red, green, and blue lines, and the associated numbers denote the occurrence percentages of the clusters.
3.2 Vertical profiles of trace gas mixing ratios
Mixing ratios of water vapor, CO, and O3 measured on board the G-1 aircraft are grouped into 200 m altitude bins, and their statistics are shown as a function of altitude in Fig. 4 for both the summer (red) and winter (blue) IOPs. The vertical profiles indicate a strong seasonal variation. Due to the lower ambient temperature and thus the lower saturation vapor pressure, the average water vapor concentration during winter is significantly lower than that during summer (by 2–5 g m−3). The CO mixing ratio during winter (>100 ppbv) is higher than that during the summertime (<85 ppbv) at all altitudes sampled, which is a result of the seasonal variation of the hydroxyl radical (OH) concentration. The major sink of atmospheric CO is oxidation by OH, which accounts for about 90 % of the loss, the remainder being mainly due to dry deposition (Thompson, 1992). Because there is no substantial emission of CO over the open ocean in the ENA, the vertical profile of the CO mixing ratio is largely controlled by the long-range transport of CO (i.e., source) and its oxidation by OH (i.e., sink). Due to the high actinic flux, the concentration of OH is higher during the summer months, leading to a lower CO mixing ratio (Novelli et al., 1998). The vertical trends of CO also differ between summer and winter. The average CO mixing ratio during wintertime decreases with increasing altitude, from 110 ppbv near the ocean surface to 100 ppbv at an altitude of 3000 m. The temperature of the land surface is substantially colder than that of the ocean during winter; therefore, continental outflow tends to stabilize the lower atmosphere, limiting vertical mixing to the lowest portion of the atmosphere. Because the major CO sources over continents are near the surface, the ENA CO mixing ratio during winter decreases with increasing altitude as a result of the weaker impact of continental emissions aloft (Holloway et al., 2000). In addition, a higher OH concentration and thus a higher CO sink in the FT also contributes to the vertical trend (Spivakovsky et al., 1990). The CO mixing ratio exhibits an opposite vertical trend during summer, increasing from 76 ppbv near the ocean surface to 85 ppbv at an altitude of 3000 m. This reverse of the vertical trend is due to stronger influences of biomass burning and pollution from North America (Honrath et al., 2004). In North America, biomass burning is more frequent and its emissions are stronger during summertime. A large fraction of the biomass burning emissions is lofted into the FT (Zheng et al., 2020b). In addition, due to the warmer land surface temperature compared to that of the ocean, the lower atmosphere is destabilized and continental outflow is often lifted above the MBL as it is transported over the Atlantic Ocean.
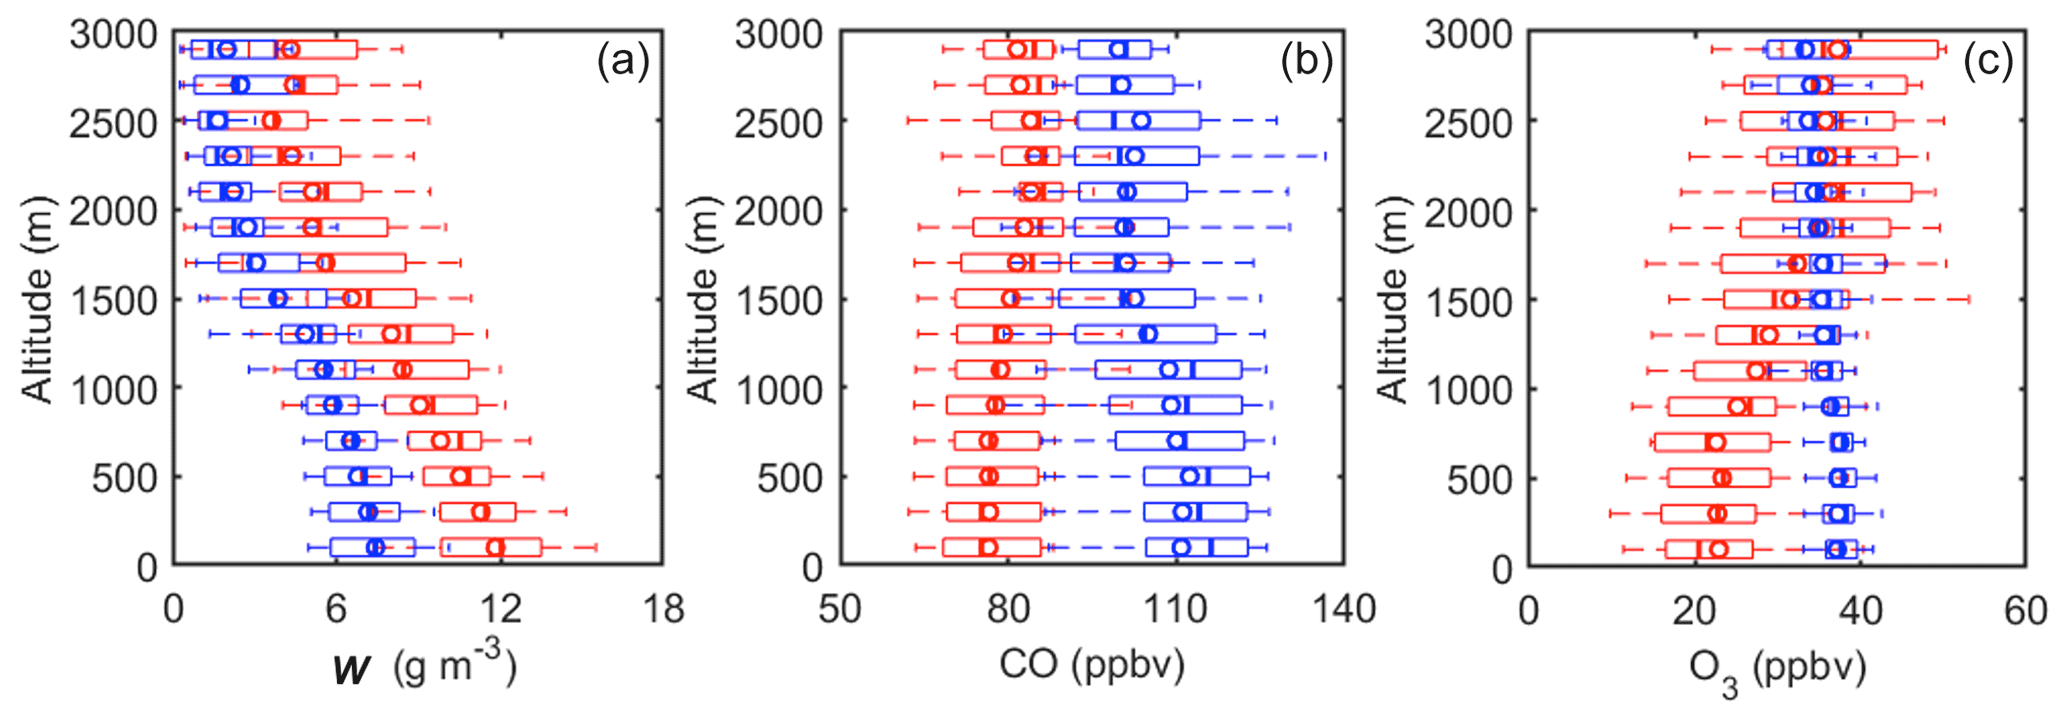
Figure 4Vertical profiles of (a) water vapor mixing ratio (w), (b) carbon monoxide mixing ratio (CO), and (c) ozone mixing ratio (O3) over the ENA site during the summer IOP (red) and winter IOP (blue). The mixing ratios are normalized to standard temperature and pressure (273.15 K and 101.325 kPa; STP). The line and circle markers represent the median and mean concentrations, and the edges of the box indicate the 25th and 75th percentiles, respectively.
Both biomass burning and anthropogenic pollution generate the precursors of O3, including nitrogen oxides (NOx), CO, and volatile organic compounds (VOCs) (Thompson et al., 2001; Jaffe et al., 2004). As a result, during the summer IOP, the G-1 detected increased O3 concentrations as a function of altitude from 23 ppbv at the ocean surface to 37 ppbv at 3000 m above the ocean. The wider range of O3 concentration during summer (23 to 37 ppbv) compared to that during winter (35 to 37 ppbv) suggests an episodic influence of long-range-transported plumes in summer months. There is also a relatively strong correlation between O3 and CO in the FT during summer (R2=0.63) due to the long-range transport of continental emissions (Fig. S1). The correlation coefficient is substantially lower during winter (R2=0.23), revealing that the transport of CO and O3 may be decoupled during winter due to a weaker impact of pollution events. This observation generally agrees with the data collected during the NARE campaign over the North Atlantic region, where anthropogenic pollution leads to a positive correlation between O3 and CO (Parrish et al., 1998). The presence of O3 of stratospheric origin in the lower FT is unlikely, as the transport of O3 from the stratosphere is generally associated with a rapid and significant increase in O3 under special meteorological conditions (Jaeglé et al., 2017), which were not encountered during ACE-ENA. As the signature of such stratospheric air is elevated O3 with low CO levels, the transport of stratosphere air leads to a negative O3 and CO correlation (Parrish et al., 1998), which was also not observed in the lower FT over the ENA (Fig. S1b).
3.3 Aerosol properties and processes over the ENA
3.3.1 Vertical profiles of aerosol properties
The average dry aerosol size distributions within the MBL are bimodal with a clear Hoppel minimum for both seasons (Fig. 5a). The Hoppel minimum represents an average particle size at which particles become CCN. Although the Hoppel minimum shows some variation from day to day, its value is relatively constant during the same flight day. To facilitate the discussion of aerosol processes that influence the MBL CCN population, we define pre-CCN as particles with diameters smaller than the Hoppel minimum (i.e., particles that are too small to form cloud droplets under typical conditions in the MBL). CCN are defined as the particles with diameters larger than the Hoppel minimum. Therefore, both nucleation- and Aitken-mode particles belong to the pre-CCN. During ACE-ENA, since the Aitken-mode particles often dominated the pre-CCN population, the concentrations of pre-CCN (Npre-CCN) and CCN (NCCN) are close to the concentrations of Aitken and accumulation modes, respectively, and they are used interchangeably in this study. In this study, Npre-CCN and NCCN are derived by integrating the aerosol size distributions below and above the Hoppel minimum that was determined for each flight. Compared to the CCN concentrations measured by a CCN counter at fixed supersaturations, the derived NCCN based on the Hoppel minimum takes into consideration the variation of the supersaturation relevant to MBL cloud formation and is therefore a more realistic representation of the CCN concentration.
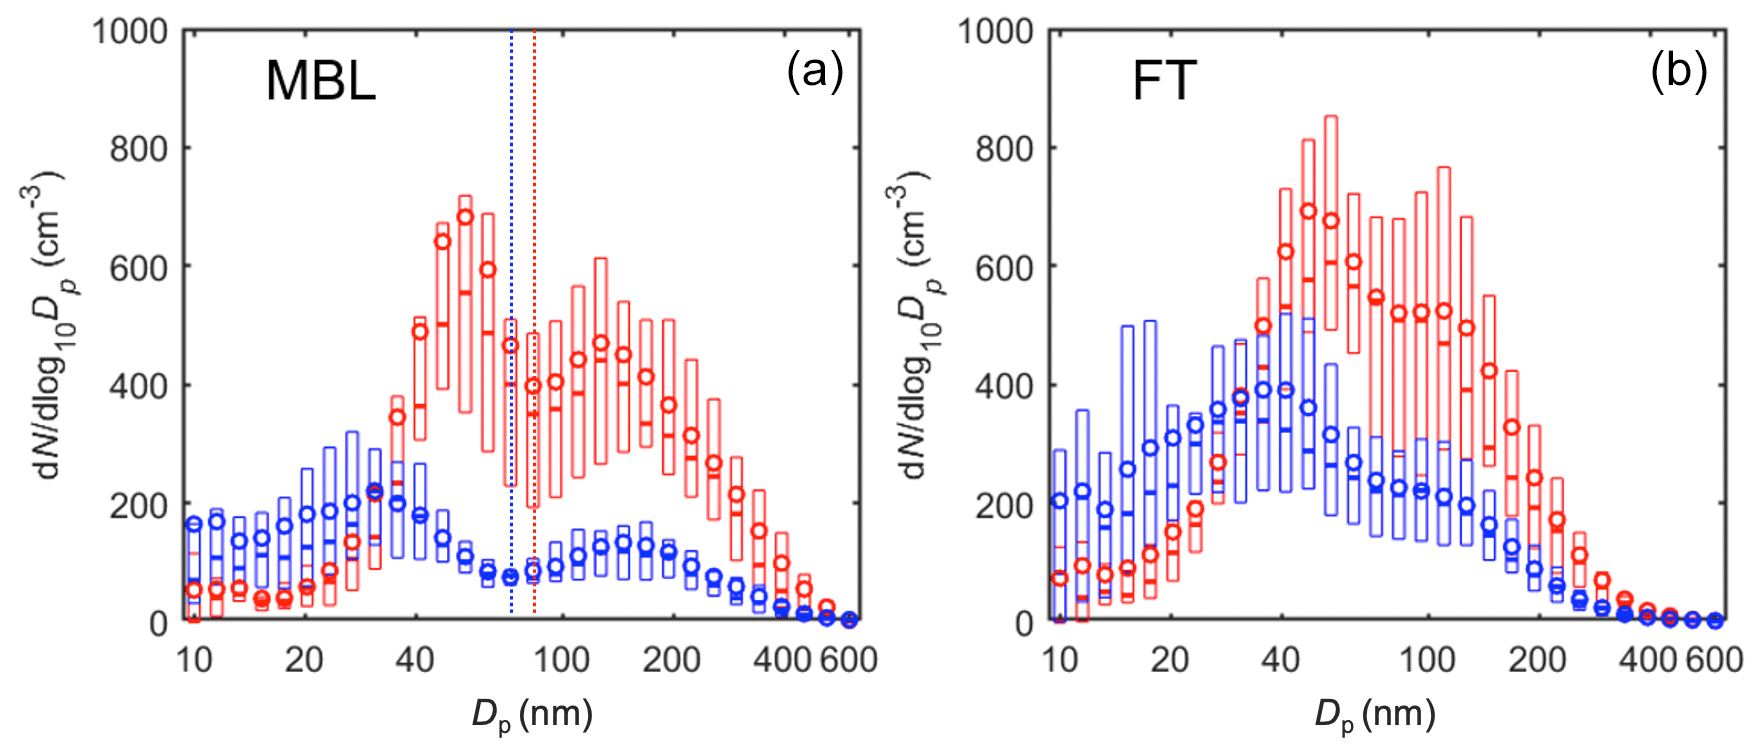
Figure 5Aerosol size distributions measured by the FIMS on board the G-1 aircraft within (a) the MBL and (b) lower FT during the summer IOP (red) and winter IOP (blue). The line and circle markers represent the median and mean of the size distribution, and the edges of the box indicate the 25th and 75th percentiles, respectively. The dotted lines in panel (a) show the Hoppel minimum for the averaged size distributions in the MBL.
Figure 6 shows the vertical profiles of particle number concentrations normalized to standard temperature and pressure (STP, 273.15 K and 101.325 kPa; Fig. 6a–c), mean particle diameter of Aitken and accumulation modes (Fig. 6e–f), and the number fraction of volatile particles (Fig. 6d). During both the summer and winter IOPs, the total aerosol number concentration (N>10) in the FT is higher than that in the MBL (Fig. 6a), largely due to the elevated Npre-CCN (Fig. 6b) in the FT. In contrast, NCCN in the FT (e.g., at an altitude of 2000–3000 m) is about the same as or even slightly lower than that in the MBL during both summer and winter seasons (Fig. 6c). It is worth noting that there are some vertical variations of NCCN within the MBL because the MBL in the ENA is often decoupled (see Sect. 3.5.2). Particle number concentrations exhibit strong seasonal variations, and on average, NCCN, Npre-CCN, and N>10 are higher in summer than winter at all altitudes sampled. The average number fraction of volatile particles (fvol) increases from ∼50 % near the ocean surface to ∼60 % and ∼75 % near the top of the MBL (i.e., ∼1500 m) during summer and winter, respectively. The value of fvol remains relatively constant in the lower FT (Fig. 6d). Free tropospheric fvol is higher in the winter, consistent with less influence of long-range-transported aerosols as discussed below. The mean Aitken-mode particle size (Dp,Ait) during summer is approximately 20 nm larger than that during winter in the MBL (Fig. 6e), The vertical profiles of accumulation-mode diameters (Dp,Acc) are similar for the two seasons, expect at altitudes between 500 and 1500 m (i.e., the upper MBL), where mean Dp,Acc is larger during winter (200 nm) than summer (170 nm).
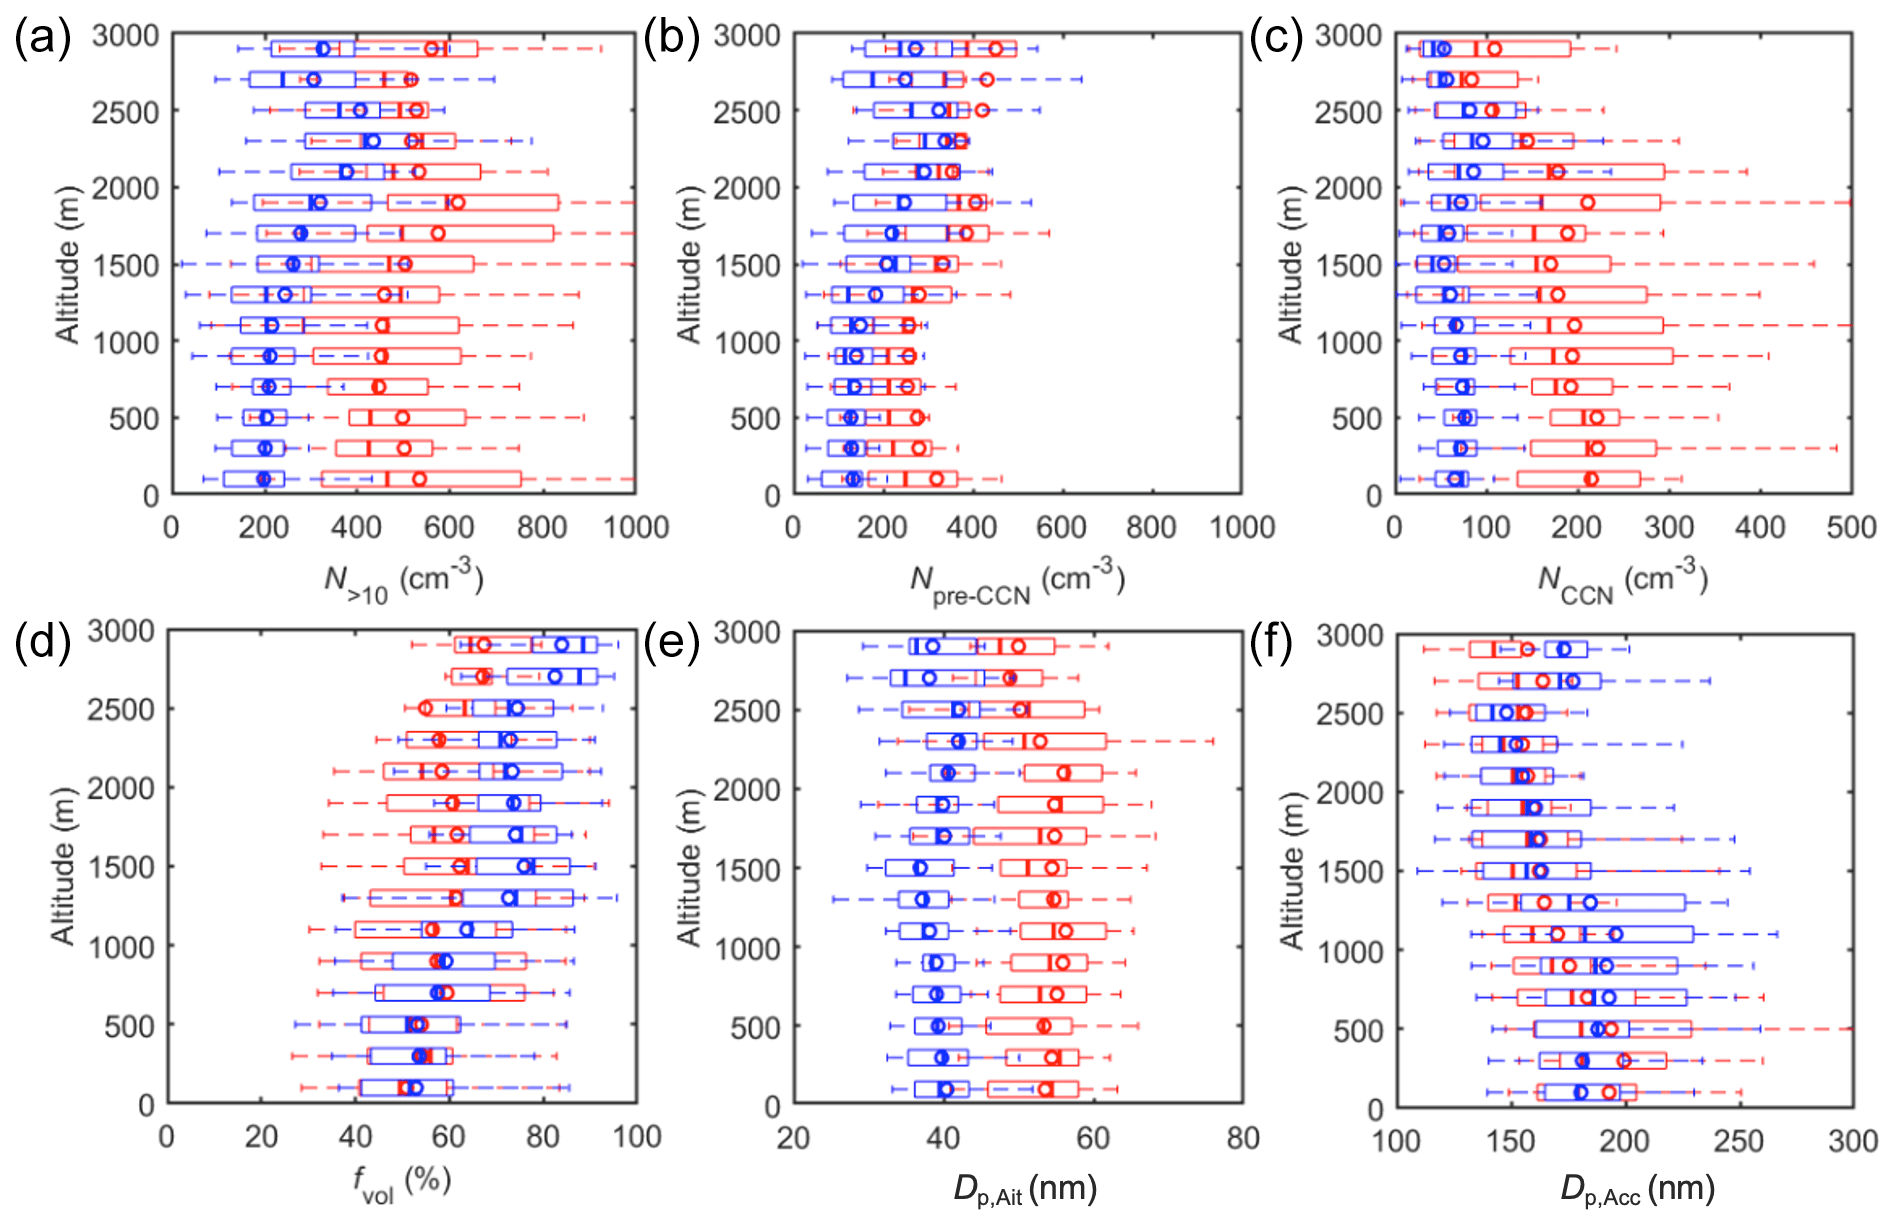
Figure 6Vertical profiles showing the (a) concentration of particles larger than 10 nm (N>10), (b) concentration of Aitken-mode aerosols or aerosols too small to form cloud droplets (Npre-CCN), (c) concentration of accumulation-mode aerosols or CCN (NCCN), (d) aerosol volatile fraction (fvol), (e) average size of Aitken-mode aerosol (Dp,Ait), and (f) average size of accumulation-mode aerosol (Dp,Acc) over the ENA site during the summer IOP (red) and winter IOP (blue). The concentrations are normalized to standard temperature and pressure (273.15 K and 101.325 kPa; STP). The line and circle markers represent the median and mean of the data, and the edges of the box indicate the 25th and 75th percentiles, respectively.
Figure 7 shows the vertical profiles of the mass concentrations of non-refractory species measured by HR-ToF-AMS and BC mass concentration measured by SP2 for both seasons. Sulfate, organics, and ammonium constitute almost 99 % of the non-refractory sub-micrometer aerosol mass, whereas nitrate concentration is negligible. The sulfate concentration maximizes near the ocean surface, reaching approximately 0.5 µg m−3 during the summer. The decrease in sulfate with increasing altitude indicates a surface source. The organics, ammonium, and nitrate mass concentrations show elevated values near the surface (i.e., below ∼1000 m) and in the lower FT (i.e., between 1500 and 2500 m). BC mass concentration increases with altitude and peaks around 2200 m in the lower FT, indicating that the major source of BC is long-range transport in the FT. All species show higher concentrations during the summer season.

Figure 7Vertical profiles of the mass concentrations of (a) sulfate, (b) organics, (c) ammonium, (d) nitrate, and (e) black carbon (BC) in the ENA during the summer IOP (red) and winter IOP (blue). BC is measured by the SP2, and the rest of the compositions are measured by the HR-ToF-AMS. The line and circle markers represent the median and mean of the data, and the edges of the box indicate the 25th and 75th percentiles, respectively. The concentrations are normalized to standard temperature and pressure (273.15 K and 101.325 kPa; STP).
3.3.2 Differences between MBL and FT aerosols
The vertical gradients of Npre-CCN and NCCN shown in Fig. 6 suggest that the entrainment of FT air may impact the aerosol properties in the MBL. During summer, at an altitude of around 2000 m, the mean NCCN and mBC are substantially higher than the corresponding median values (Figs. 6c and 7e), indicating occasional abnormally high NCCN and mBC in the lower FT. Given the much lower mBC in the MBL, the abnormally high NCCN and mBC are attributed to long-range transport of continental emissions. In addition, nitrate, organics, and ammonium (Fig. 7) also show a local maximum in a similar altitude range (i.e., 1500 to 2500 m), consistent with the influence of continental emissions. Both urban pollution and biomass burning in North America likely contribute to the long-range-transported aerosol layers, which will be discussed further in Sect. 3.4. The influence of the plumes is also evident from the comparison of the vertical profiles with those under background conditions. In this study, we define background conditions (i.e., with minimum influence from continental emissions) as those when mBC is less than 5 ng m−3. The vertical profiles of the aerosol properties under the background conditions are shown in Figs. S2 and S3. Once the influence from continental plumes is excluded, the average NCCN in the FT during the summer shows a significant decrease. As a result, NCCN under the background condition (NCCN,bg) in the FT becomes substantially lower than that in the MBL. For the aerosol chemical composition, both sulfate and organic mass concentrations at altitudes between 1500 and 2500 m are substantially reduced when the measurements are limited to those with mBC less than 5 ng m−3 (Fig. S3a and b). This indicates that sulfate, organics, and BC coexist in the long-range-transported aerosol layers. For the winter IOP, NCCN only exhibits a minor peak at the altitude of around 2200 m and there is little difference between NCCN and NCCN,bg in the lower FT, suggesting a relatively weak influence from the long-range-transported plumes over the ENA. This is consistent with the 10 d back trajectories showing that, during winter, air masses arriving at the lower FT in the ENA mostly descended from higher altitudes (Fig. 3). As MBL aerosol in the ENA is continually being modified by air entrained from the FT, these vertical profiles indicate that except for occasional periods during summer when long-range-transported plumes are present, the entrainment of FT air does not serve as a direct source of CCN in the MBL. Instead, the entrainment of FT air dilutes and acts to reduce MBL CCN concentrations. We note that aerosols under the background conditions during ACE-ENA are likely influenced by diluted and aged continental plumes. Therefore, NCCN under natural conditions (i.e., during the pre-industrial era) is expected to be even lower, possibly leading to a more pronounced difference in NCCN between the lower FT and the MBL.
In contrast, during both seasons, Npre-CCN in the FT is substantially higher than that in the MBL, leading to an increasing N>10 with altitude from the MBL to the lower FT. Therefore, entrainment of FT air increases MBL pre-CCN concentrations and total particle number concentrations in the MBL. Compared to NCCN, the vertical profiles of Npre-CCN,bg are very similar to those of Npre-CCN, implying that, on average, continental emissions have a relatively weaker impact on Npre-CCN. This is consistent with the picture that aged aerosols in long-range-transported continental plumes are dominated by accumulation-mode particles (Zheng et al., 2020b) and a substantial fraction of Aitken-mode particles in the FT is produced by NPF in the outflow of convective and frontal clouds, followed by the coagulation and condensational growth (Clarke et al., 1998; Andreae et al., 2018; Williamson et al., 2019; McCoy et al., 2020) .
3.3.3 Growth of pre-CCN into CCN size range
Once pre-CCN are entrained into the MBL, they can grow and reach CCN-active sizes through condensation (Yoon et al., 2007; Sanchez et al., 2018; Zheng et al., 2018, 2020a). Therefore, the entrainment of FT Aitken-mode aerosol represents an indirect source of MBL CCN in the ENA. It has long been recognized that sulfates produced from dimethyl sulfide (DMS) oxidation are major species for the condensational growth of pre-CCN in remote marine environments. Methanesulfonic acid (MSA), another product of DMS oxidation, may also participate in particle condensational growth (Kerminen et al., 1997; Ayers and Gillett, 2000; Karl et al., 2011; Willis et al., 2016; Hodshire et al., 2019). Using measurements during ACE-ENA, Zheng et al. (2020a) show that secondary organics contribute substantially to pre-CCN condensational growth and thus the formation of CCN in the remote marine environments, consistent with some early studies (Meskhidze and Nenes, 2006; Facchini et al., 2008; Wurl et al., 2011; Dall'Osto et al., 2012; Willis et al., 2017; Mungall et al., 2017; Brüggemann et al., 2018). The higher MBL NCCN during summer is due in part to the higher particle growth rate as a result of stronger oceanic volatile organic compound (VOC) emission (Zawadowicz et al., 2021).
Another mechanism for the formation of CCN within the MBL is the activation of Aitken-mode particles in a stronger than average updraft, which causes a higher peak supersaturation (Kaufman and Tanré, 1994). These Aitken-mode particles would otherwise remain in the interstitial air of clouds. Once activated, sulfate and organics can be produced through aqueous chemistry inside droplets. Unless these droplets are removed by precipitation, they become CCN upon evaporation outside the clouds and readily participate in subsequent cloud formation. The effect of this mechanism on the MBL CCN budget is difficult to evaluate with measurements only and will be a subject of future studies. The vertical profile of sulfate mass concentration indicates a surface source, consistent with the picture that over the open ocean, most submicron sulfate is derived from DMS through both gas-phase and in-cloud oxidation (Hegg and Hobbs, 1981; Gurciullo et al., 1999; Ovadnevaite et al., 2014; McCoy et al., 2015). The higher MBL sulfate mass concentration during the summer season is a result of stronger DMS emission (Zawadowicz et al., 2021) and higher oxidant (e.g., OH) concentrations. During summer, nearly half of the air masses arriving in the ENA MBL had been circulating around the Azores high over open ocean for more than 10 d, indicating that Aitken-mode aerosols have extended time to grow by condensation and in-cloud processes.
3.3.4 Contribution from marine primary aerosols
For both seasons, fvol is largely altitude-independent in the lower FT, and it deceases nearly linearly from the top of the MBL to the ocean surface (Fig. 6d). Due to the lower existing condensation sink and higher radiation intensity, NPF often occurs in the FT (Clarke et al., 1998). Sulfuric acid is recognized to be the major component of these freshly formed particles, while ammonia, amines, and biogenic VOCs may also participate in the particle formation process (Dunne et al., 2016). The newly formed particles can subsequently grow to Aitken-mode size through coagulation and condensation. These particles can represent a large fraction of the FT particle number and are volatile at 300 ∘C, leading to a relatively higher fvol in the FT. The volatile fraction in the FT is lower during summer (Fig. 6d) due to the stronger influence of long-range-transported continental plumes that consist of refractory aerosol components (i.e., BC). This is also supported by the comparable FT fvol values for both seasons under background conditions (Fig. S2). The decrease in fvol from the top of the MBL towards the ocean surface is attributed to sea spray aerosol emitted from the ocean, which contributes to the MBL aerosol population (Pirjola et al., 2000) and is mostly non-volatile (Rasmussen et al., 2017; Bates et al., 2012). One can notice the elevated Npre-CCN and NCCN values near the ocean surface (Fig. 6b and c), which is mainly due to the cloud scavenging that reduces Npre-CCN and NCCN values in the upper MBL. The ocean is unlikely a source of Aitken-mode aerosols because NPF near the ocean surface is rare due to the large condensation and coagulation sinks (Pirjola et al., 2000).
Enhanced organic mass concentration was observed in the MBL during summer (Fig. 7b). Comparison of the vertical profiles of mBC and organic mass concentration indicates that long-range-transported continental emissions have a minor contribution to the organics in the MBL during the summer, suggesting a dominant surface source of the organics. The enhanced organic mass concentration is attributed to both primary marine aerosol and secondary organic aerosol formed from oceanic VOCs. Previous long-term HR-ToF-AMS measurements at Mace Head station in the North Atlantic show that the aerosol organics are similar to those observed during primary marine organic “plume” events (Ovadnevaite et al., 2011), and the mass fingerprints and H:C and O:C features were consistent with organics originating from primary marine sources. Ocean emitted VOCs can also lead to formation of secondary organic aerosol as discussed in the previous section. The seasonal trend of ammonium is consistent with the contribution from marine sources shown by previous isotopic analysis (Jickells et al., 2003).
3.3.5 Seasonal variation
NCCN, Npre-CCN, and N>10 are higher in the summer than the winter at all altitudes (Fig. 6a–c). The higher NCCN in the FT during summer is to a large degree due to more frequent occurrence of long-range-transported continental plumes from North America. It is important to note that FT NCCN,bg is consistently higher during the summer (Fig. S2). This higher background is likely due to the greater influence of diluted continental emissions, as evidenced by the slightly higher mBC,bg in the FT during summer. The seasonal variation of the FT Npre-CCN is likely due to stronger NPF during summer as a result of the higher DMS emissions over the open ocean (Clarke et al., 1998; Williamson et al., 2019). The higher Npre-CCN and NCCN in the FT contribute to the elevated values in the MBL during the summer through entrainment. The higher MBL NCCN during summer is also partially due to the increased growth rate of nucleation- and Aitken-mode particles as a result of stronger oceanic VOC emission (Zawadowicz et al., 2021; Zheng et al., 2020b). Stronger precipitation and thus coalescence scavenging of CCN can also contribute to the seasonal variation of NCCN in the MBL.
The spectral shape of submicron aerosol size distributions shows a strong variability between seasons and between the MBL and FT (Fig. 5). A clear separation between the Aitken and accumulation modes by a Hoppel minimum is evident in the MBL. What stands out in the wintertime aerosol size distribution is the larger proportion of particles below 20 nm, potentially resulting from more NPF events due to low existing surface area concentrations. A recent study showed that over the ENA, NPF takes place in the upper part of the decoupled MBL following the passage of cold fronts when open-cell convection and scattered cumulus clouds frequently occur (Zheng et al., 2021). The NPF is due to the combination of low existing aerosol surface area, cold air temperature, availability of reactive gases, and high actinic fluxes in the clear regions between scattered cumulus clouds. The larger fraction of particles below 20 nm in the MBL during the winter is attributed, at least partially, to the more frequent passage of cold fronts over the ENA and NPF in the upper MBL (Kolstad et al., 2009). These newly formed particles can continuously grow into the Aitken mode and contribute to the CCN in the MBL (Zheng et al., 2018, 2020a). The mean Aitken-mode particle size (Dp,Ait) during summer is approximately 20 nm larger than that during winter in the MBL (Figs. 5, and 6e), likely due to a combination of the following two reasons. First, faster Aitken-mode particle growth is expected given stronger summertime emissions of ocean biogenic precursors. Second, both stronger wintertime convective activities and low CCN concentration lead to higher supersaturation, which allows the activation of smaller particles, leading to a smaller Hoppel minimum size and thus smaller Dp,Ait. The vertical profiles of Dp,Acc in the two seasons are similar except at altitudes between 500 and 1500 m, where Dp,Acc is substantially larger during the winter (200 nm) compared to the summer (170 nm). The larger Dp,Acc during winter is attributed to the formation of large accumulation-mode particles by evaporating drizzle (see Sect. 3.5.2 for further discussion). The average size distributions in the MBL and FT during both IOPs are fitted with lognormal size distributions, and the Aitken- and accumulation-mode diameters and concentrations, along with the geometric standard deviations, are listed in Table 2.
Table 2The fitting parameters of average aerosol size distributions for the Aitken mode and accumulation mode during the summer IOP and winter IOP in the MBL and FT. The particle concentrations are normalized to standard temperature and pressure (273.15 K and 101.325 kPa; STP).

The contribution of FT entrainment to MBL particle concentrations is estimated from the entrainment velocity and the difference in the average particle concentrations between the lower FT and MBL. The entrainment flux FX is calculated as
where we is the entrainment velocity, and XFT and XMBL are the average of property X in the lower FT and MBL, respectively. The value of we can be estimated from the dynamics of the MBL height zi (Caldwell et al., 2005; Russell et al., 1998). The time variation of zi is described by
where ws is the large-scale subsidence rate, Vh is the horizontal wind vector, and Vh⋅∇zi represents the variation of boundary layer height due to the horizontal advection. Assuming that steady-state conditions for boundary layer height (i.e., ), we have
In the 40∘ (north and south) latitude range (i.e., the latitude of the ENA site), the average lower tropospheric subsidence rate (700 hPa) during low cloud conditions is around 8 mm s−1 (McCoy et al., 2017). Assuming lower tropospheric divergence is constant with height (consistent with previous analyses; Wood et al., 2009), the mean subsidence rates at the top of the MBL (typically ∼1.5 km) will be around 4 mm s−1. The advection term Vh⋅∇zi is more difficult to estimate in general. For subtropical eastern ocean regions (e.g., SE Pacific, NE Pacific), the advection term is roughly about of ws (Wood and Bretherton, 2004). Assuming this relationship also applies in the ENA, we estimate the entrainment velocity at the top of the MBL using Eq. (3) as ∼5 mm s−1. The change in concentration X due to the entrainment is given by
Taking into account the seasonal variation of the average MBL height (i.e., ∼1200 and ∼1600 m for summer and winter, respectively), we estimate the particle concentrations above the MBL as the averages between altitudes of 1600 and 2200 m during summer and 2000 to 2600 m during winter. Particle concentrations inside the MBL are averaged from 400 to 1000 m for both seasons (Table 3).
Table 3Average particle concentrations in the MBL and lower FT, as well as the change rates of MBL particle number concentrations due to the entrainment from FT. The particle concentrations and change rates are normalized to standard temperature and pressure (273.15 K and 101.325 kPa; STP).
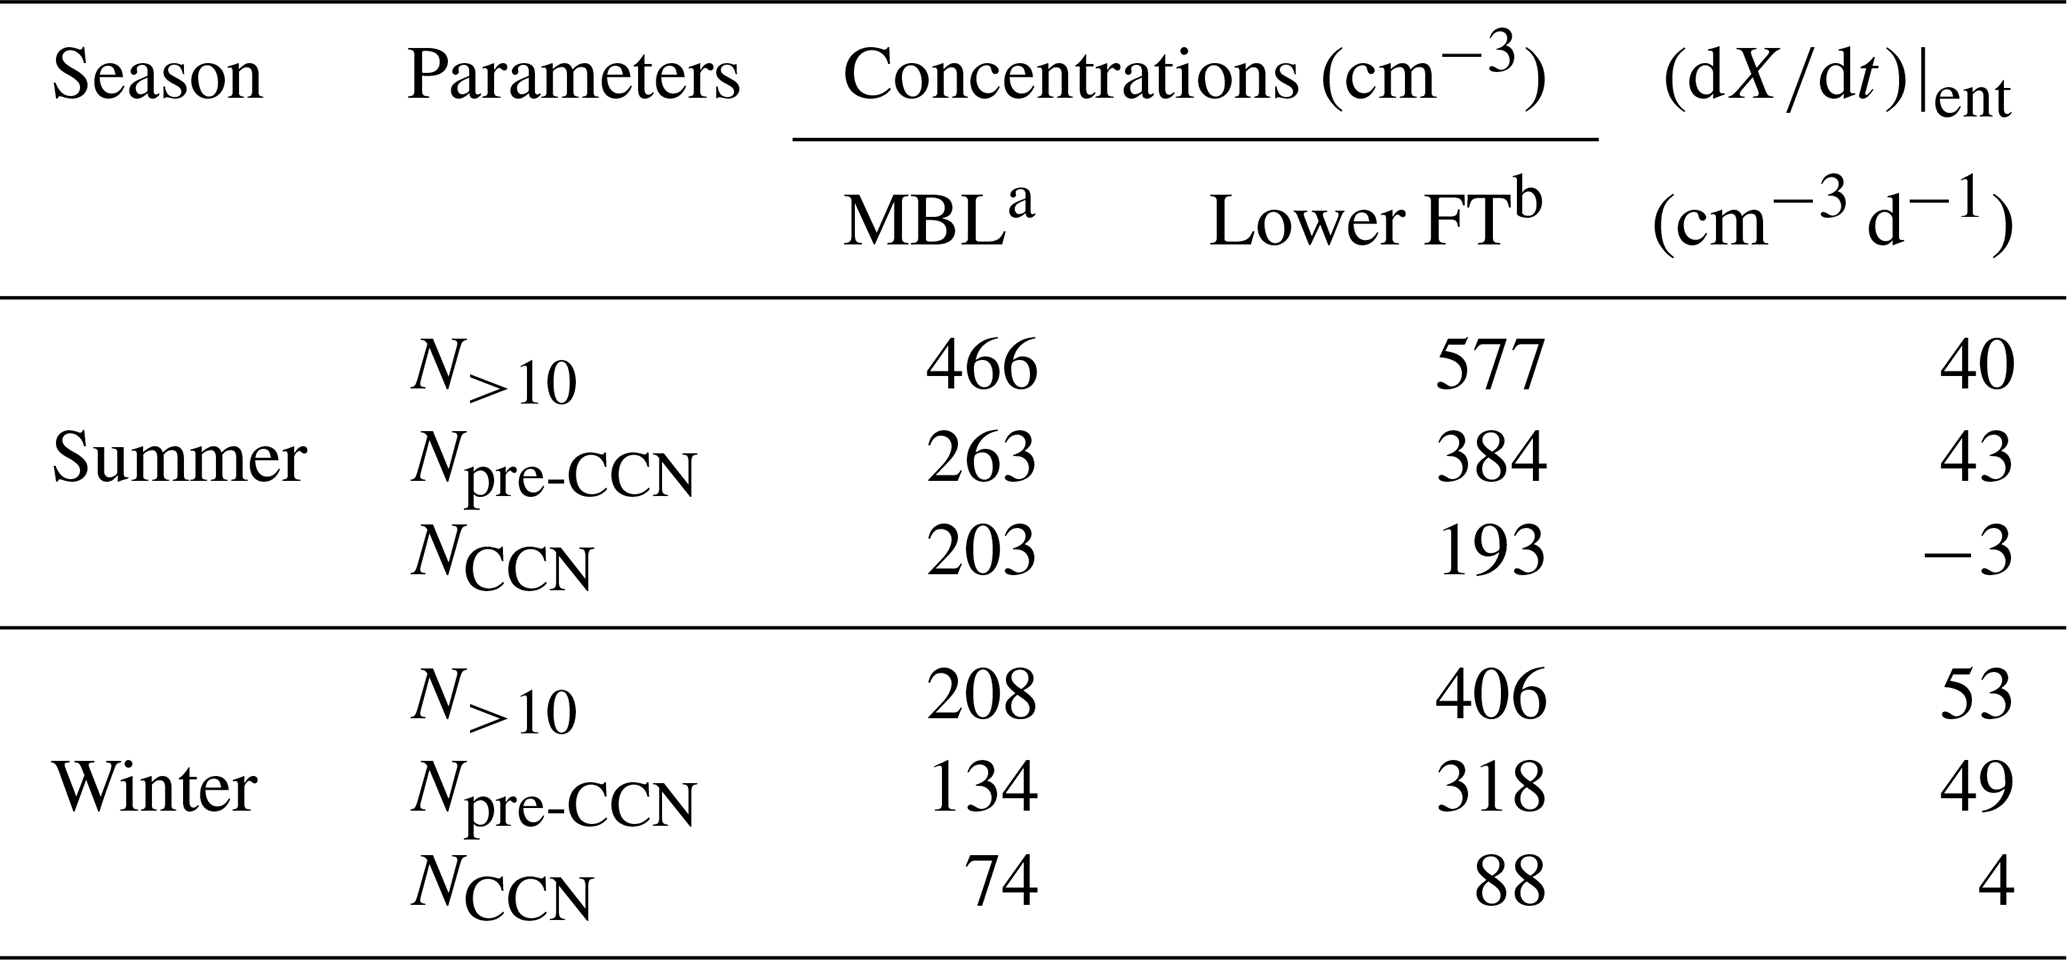
a Particle concentrations inside the MBL are averaged from 400 to 1000 m for both seasons. b Particle concentrations in lower FT are averages between altitudes of 1600 and 2200 m during summer and 2000 to 2600 m during winter.
The rate of N>10 change due to FT entrainment mixing (i.e., ) is estimated as 40 cm−3 d−1 and 53 cm−3 d−1 for the summer and winter, respectively. The total source of particle number is balanced by total loss under steady-state conditions. The major particle number sinks in the MBL are intermodal coagulation (i.e., coagulation of Aitken and accumulation mode), in-cloud coagulation of interstitial aerosol, and in-cloud coalescence scavenging of CCN (Zheng et al., 2018). Using the long-term data collected at the ENA site, Zheng et al. (2018) estimated the sink for summer and winter seasons as 59 and 53 cm−3 d−1, respectively. The estimated suggests that the FT entrainment represents the dominant source of particle number in the MBL for both seasons. The rate of N>10 change due to FT entrainment mixing is dominated by pre-CCN (i.e., ) and the contribution from CCN (i.e., ) is essentially negligible (Table 3). It is worth noting that whereas the pre-CCN concentration in the MBL is lower during the winter season, is higher than that during the summer. The combination of higher and lower concentration suggests more efficient removal of MBL pre-CCN in winter, which is likely due to the following two reasons. First, the diameters of pre-CCN particles during winter are smaller than during summer, leading to a higher coagulation coefficient with larger particles (i.e., CCN and droplets). Higher concentrations of sea salt particles, as a result of stronger winds, may also contribute to higher coagulation rates during winter (Zheng et al., 2018). Second, abnormally high updraft velocities may be more frequent due to more convective activity during the winter, therefore growing more pre-CCN into the CCN size range through aqueous-phase reactions.
3.4 Long-range transport of continental aerosols
As shown earlier, aerosol layers with elevated NCCN and mBC were observed above the MBL in the ENA during the summer IOP. These aerosol layers may strongly influence the aerosol properties in the region. The back trajectories of the air masses arriving at the altitudes of the observed aerosol layers are examined to understand their origins. One example is on 29 June 2017 (Fig. 8), when an aerosol layer was observed at altitudes between 1300 and 2000 m. On this day, the vertical profile of potential temperature shows an MBL height of 400 m. The aerosol layer exhibited elevated concentrations of accumulation-mode particles (modal diameter of ∼120 nm). An increased BC mass concentration and CO mixing ratio were also observed in the layer. A frequency analysis of hourly 10 d back trajectories shows that a large fraction of air masses arriving on 29 June had traveled over the northern United States, likely bringing anthropogenic pollution and biomass burning aerosols to the ENA. Taking into account the transport time of an air mass from North America to the ENA site (generally 3 to 6 d), we generated a fire emission map from 23 to 26 June (Fig. S4), which suggests relatively strong biomass burning emissions along the air mass trajectories over the North America. A similar case of long-range transport on 18 July 2017 is also illustrated in Fig. S5.
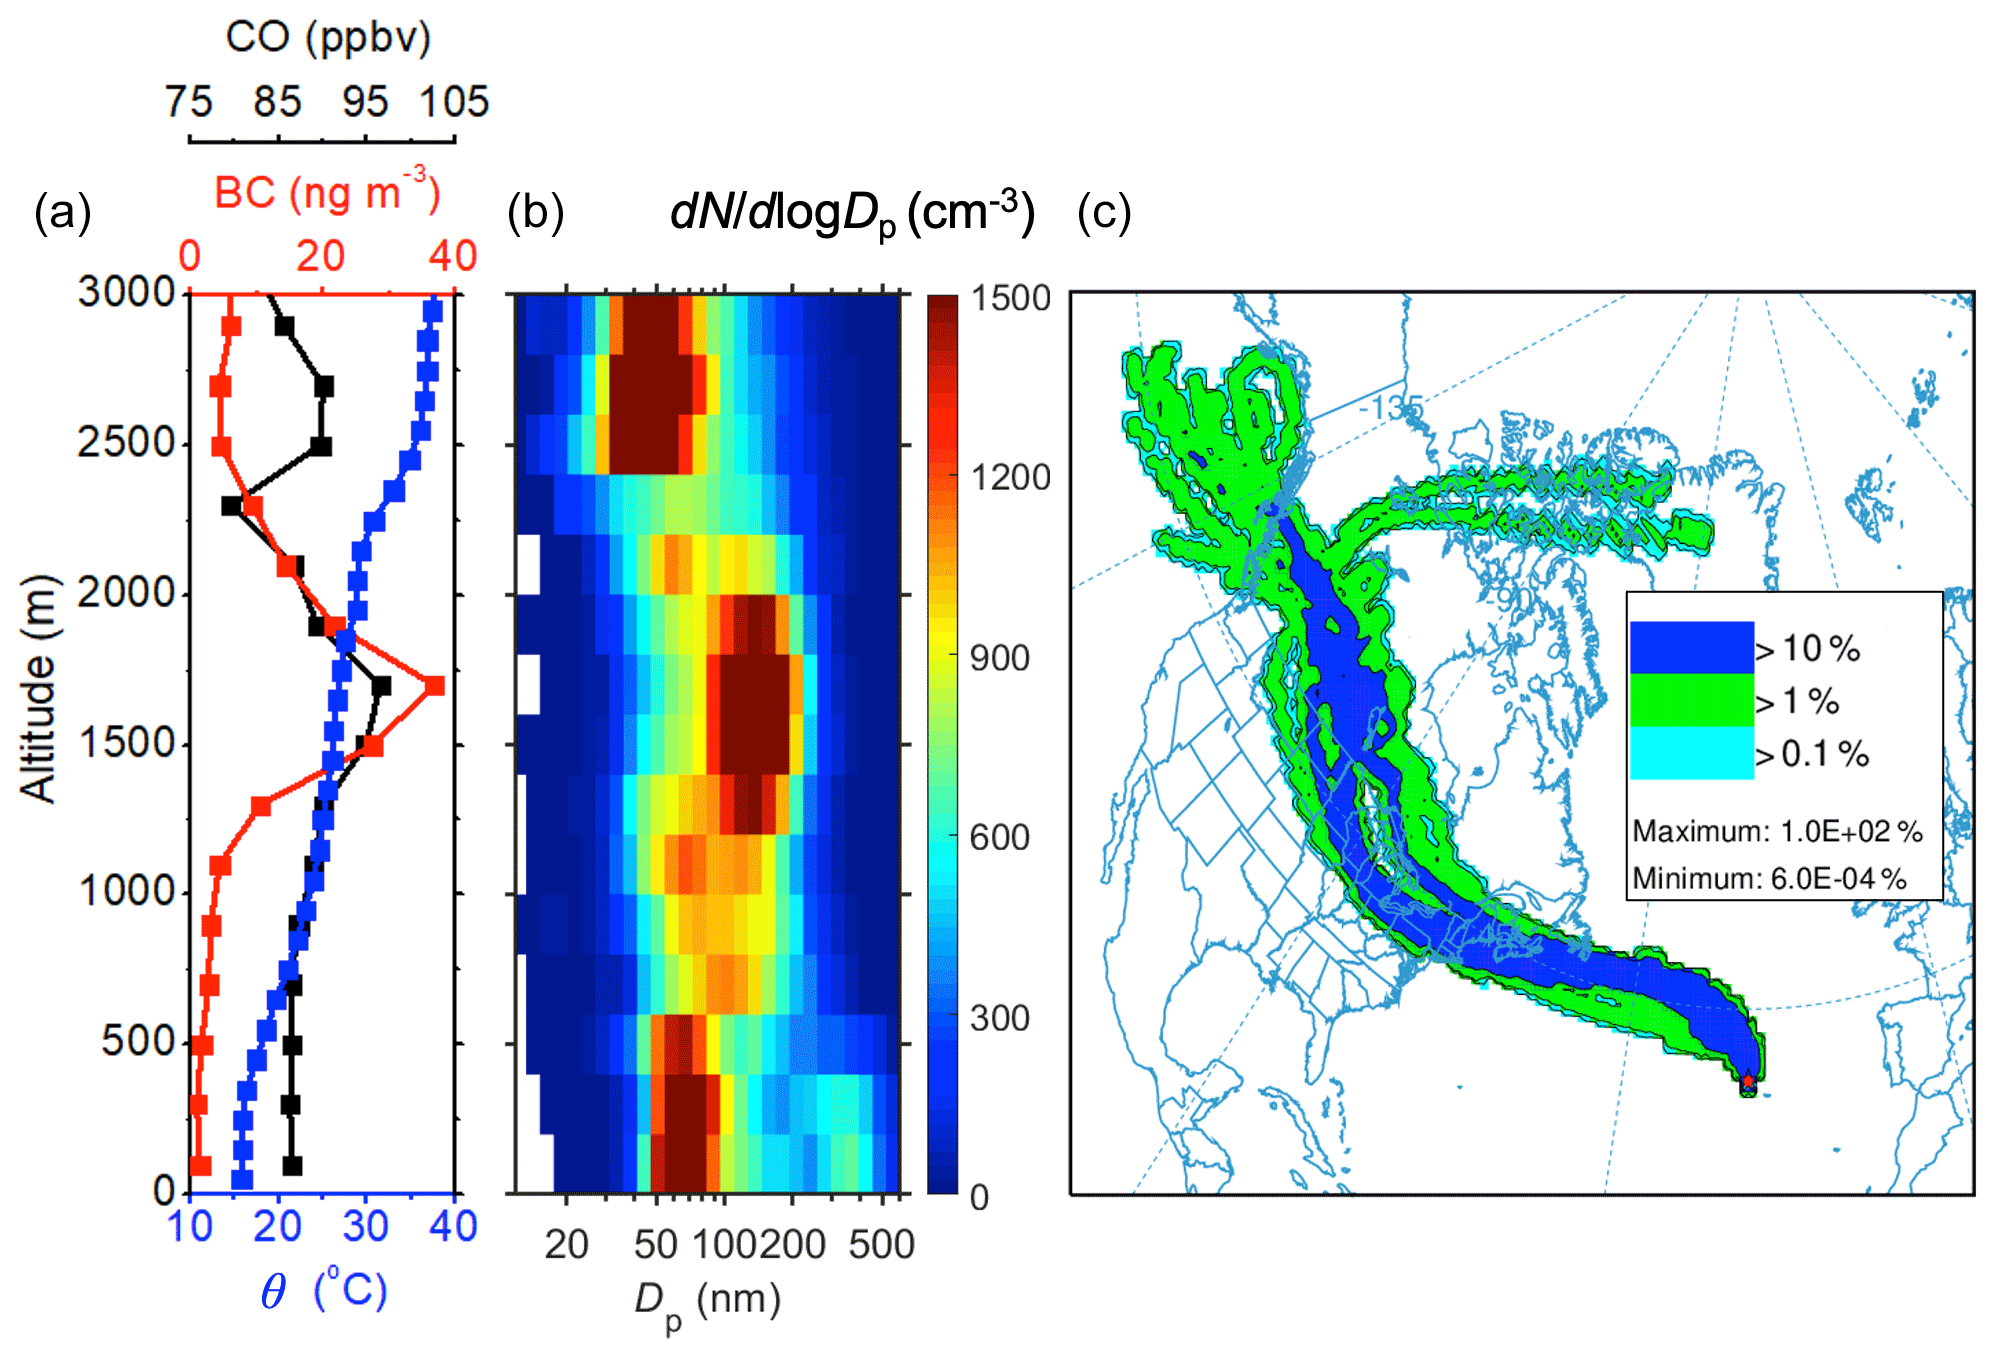
Figure 8A long-range transport event observed during the research flight on 29 June 2017. (a) Vertical profiles of potential temperature (θ), black carbon (BC) mass concentration, and carbon monoxide (CO) mixing ratio. (b) Vertical contour of aerosol size distributions as a function of altitude measured by the FIMS. (c) Frequency analysis of hourly back trajectories arriving at the ENA site on 29 June 2017 generated by HYSPLIT. The frequency is the sum of the number of trajectories that passed through each grid cell divided by the total number of trajectories analyzed. The CO mixing ratio, BC concentration, and size distributions are normalized to standard temperature and pressure (273.15 K and 101.325 kPa; STP).
Previous ground observations at the Pico mountaintop station showed frequent elevations of summertime CO and O3 concentrations (Honrath et al., 2004; China et al., 2017). Based on air mass back trajectories, these events were attributed to the long-range transport of biomass burning emissions and anthropogenic pollution from North America. Air masses arriving from the continental US, western Atlantic, and northern North America exhibited elevated CO and O3 concentrations. When the long-range-transported plume was dominated by North American pollution with a minimum biomass burning influence, the slopes of the linear fit between O3 and CO (d[O3] d[CO]) ranged from 0.81 to 1.28, and the correlation coefficients (R2) ranged from 0.53 to 0.83. During biomass-burning-dominated events, the slopes were between 0.4 and 0.9, and the value of R2 was reduced to 0.4 to 0.5 (Honrath et al., 2004). The value of d[O3] d[CO] observed in the lower FT during the summer IOP of ACE-ENA is 0.79 (Fig. S1a), which is close to or within the ranges previously observed during anthropogenic pollution and biomass burning events. The correlation coefficient for this study is 0.63, which is within the range of R2 when air masses observed at the Pico mountaintop station were dominated by North America pollution.
The composition of FT aerosol layers provides additional insight into the source of the long-range-transported aerosols. There are relatively strong correlations among the mass concentrations of BC, sulfate, and organics in the FT aerosol layers compared to those in the MBL (Fig. S6), consistent with previous measurements of summertime aerosols at the Pico mountaintop station, which show that the FT aerosols are generally internal mixtures, including soot and sulfate coated by organic matter (China et al., 2017). During ACE-ENA, on average the sulfate mass fraction between 1600 and 2600 m (i.e., the altitude range of FT aerosol layers during the summer IOP) outside the background conditions (mBC>5 ng m−3) is about 35 %. For the two aerosol layers observed on 29 June and 18 July, the aerosol sulfate mass fractions are 38 % and 30 %, respectively. Typically, fresh biomass burning particles are >90 % carbonaceous material and the sulfate mass fraction is very low (Reid et al., 2005). As biomass burning particles age in the atmosphere, the sulfate mass fraction could increase as a result of condensation of secondary sulfate and/or coagulation with particles with a higher sulfate fraction. However, the air mass trajectories (e.g., in the cases of 29 June and 18 July 2017) show that the aerosol layers were above the MBL over the Atlantic Ocean before arriving at the ENA, and hence it is unlikely that the sulfate in the aerosol layers derived from oxidation of DMS emitted from the ocean. In addition, the sulfate in the aerosol layers was fully neutralized, in contrast to the typical acidic sulfate observed in the MBL aerosols (Zawadowicz et al., 2021; Zheng et al., 2020a). These pieces of evidence indicate that the sulfate in the aerosol layers originated from continental instead of oceanic emissions.
The sulfate mass fraction (∼35 %) in these FT aerosol layers is also substantially higher than that of aged biomass burning plumes elsewhere. For example, previous FT aerosol sampled at the Pico mountaintop station under the impact of the long-range transport of the North America biomass burning plumes had an average sulfate fraction of around 16.3 % (Dzepina et al., 2015). Holanda et al. (2020) sampled long-range-transported African biomass burning in the FT offshore near the Brazilian coast of the Atlantic Ocean and found that sulfate represented 16 % of the submicron aerosol mass. Furthermore, the mass concentration of potassium measured by PILS, a tracer of biomass burning aerosol (Andreae, 1983; Sciare et al., 2008), shows no correlation with organic mass loading for the measurements within the altitude range of the aerosol layers during the summer (i.e., from 1600 to 2600 m) (Fig. S7). Although the back trajectories suggest a contribution of biomass burning, the above evidence indicates that biomass burning aerosols are likely mixed with anthropogenic pollution as they travel through the North American continent. On average, continental pollution represents a major, and potentially the dominant, source of the aerosol mass in the layers observed in the lower FT over the ENA.
3.5 Aerosol properties under different synoptic conditions
3.5.1 Classification of synoptic conditions
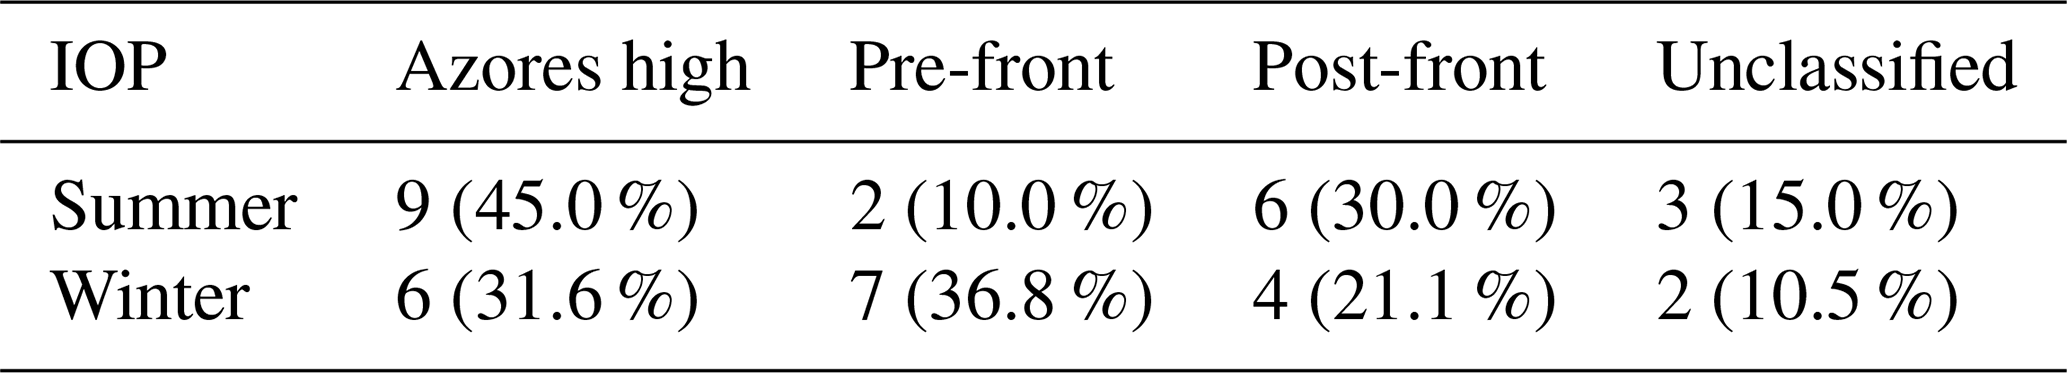
The synoptic condition strongly influences the structure of the MBL and thus aerosol properties. The Azores consistently lie in an area of substantial variability in synoptic configuration, thermodynamic environment, and cloud properties. The ENA site is under a strong influence from the North Atlantic high-pressure system (Azores high) and is periodically subject to frontal passages (Rémillard et al., 2012). The synoptic conditions for the 39 flight days during ACE-ENA are classified as Azores high, pre-front, front, post-front, or unclassified conditions following the method described in Mechem et al. (2018). The classification of the synoptic conditions is based on the reanalysis fields of geopotential height at 500 hPa pressure levels (Gelaro et al., 2017). The 6-hourly reanalysis products are examined to judge the category of the synoptic conditions. This classification process is further combined with the archived surface weather maps obtained from the National Meteorological Service of Germany (Deutscher Wetterdienst – DWD; http://www2.wetter3.de/index_en.html, last access: 17 July 2021). The fractions of different synoptic conditions during all 39 flight days are 38.5 % for the Azores high, 23.1 % for pre-front, 25.6 % for post-front, and 12.8 % for unclassified conditions. The fractions of the synoptic conditions in each IOP are further shown in Table 4. No flight day was classified as front because no research flight was conducted on a day of a frontal passage due to logistical challenges. Under the Azores high, a strong inversion is often present at the top of the boundary layer, and the MBL is often shallower and more likely to be well-mixed, while under the pre-front, front, and post-front conditions, strong convective activities often lead to deeper boundary layers. As the MBL deepens, the turbulence produced from surface heating and cloud-top radiative cooling becomes insufficient to maintain a well-mixed layer. Consequently, the MBL begins to “decouple” into a surface mixed layer and an upper decoupled layer (Wood and Bretherton, 2004; Bretherton et al., 2010). Earlier studies show that the boundary layer over the ENA tends to be decoupled much of the time (Rémillard et al., 2012). Another study found that only 14 % of the soundings over Graciosa were well-mixed (Ghate et al., 2015).
Table 4Number of flight days under different synoptic conditions during the summer IOP and winter IOP. The corresponding percentages over the IOP are shown in the parentheses.
3.5.2 Case analysis of aerosol characteristics under different synoptic conditions
Azores high and well-mixed boundary layer
Figure 9 shows the vertical profiles of meteorological parameters, CO mixing ratio, and aerosol properties measured on 8 July, an example of Azores high conditions. On this day, the potential temperature and LWC indicate a well-mixed MBL with shallow clouds below a strong temperature inversion at around 1000 m. Inside the MBL, the bimodal aerosol size distribution shows a clear Hoppel minimum, which is a result of cloud processing (Hoppel et al., 1994). The aerosol size distribution was largely uniform at different altitudes within the MBL. The aerosol in the lower FT showed a layered structure, with properties clearly different from that in the MBL, demonstrating the heterogeneity within the FT under a stable atmospheric structure controlled by the Azores high. An elevated concentration of Aitken-mode particles with mode diameter of ∼35 nm was observed at altitudes ranging from 1600 to 2400 m. The elevated Aitken-mode concentration (i.e., Npre-CCN, ∼900 cm−3) also coincides with an increased volatile fraction (i.e., up to ∼80 %) and low NCCN and mBC, suggesting that Aitken-mode particles derive from NPF in the FT over the open ocean when the existing accumulation-mode particle concentration is low (Clarke et al., 1998; Williamson et al., 2019). An aerosol layer with elevated mBC (∼25 ng m−3) was observed above 2300 m. This layer exhibits a higher CO mixing ratio and mBC and is attributed to long-range-transported continental emissions. The gradual change in CO mixing ratio and mBC at altitudes above 1500 m also suggests mixing between the layers of high Aitken-mode concentration due to NPF and long-range-transported continental emissions.
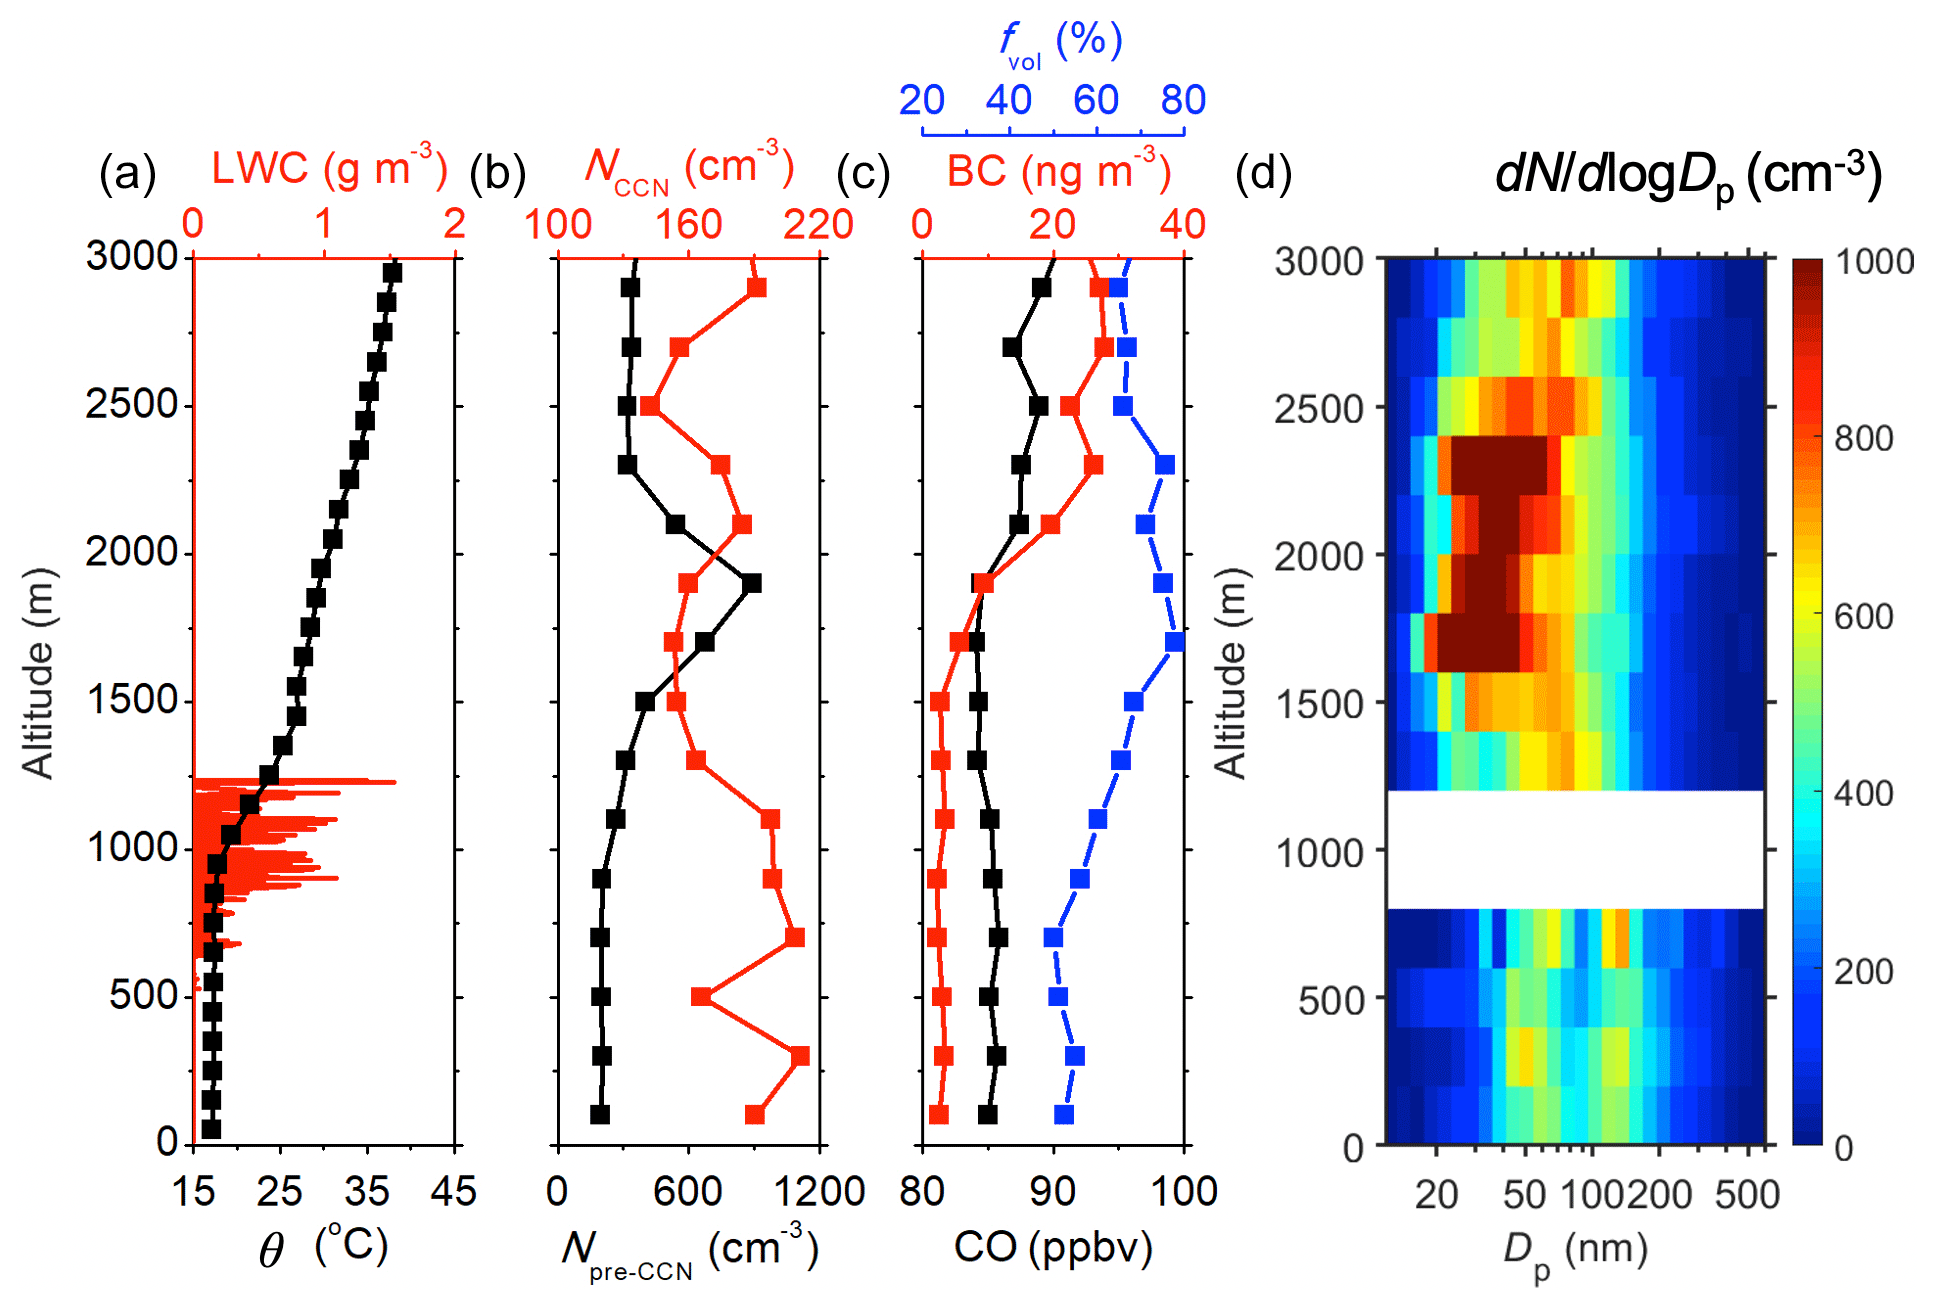
Figure 9Vertical profiles of parameters under the synoptic condition of Azores high on 8 July 2017. (a) Potential temperature (θ) and liquid water content (LWC). (b) Npre-CCN and NCCN. (c) Concentrations of carbon monoxide (CO) and black carbon (BC), as well as the aerosol volatile fraction (fv). (d) Vertical contour of aerosol size distributions as a function of altitude. Size distributions between 800 and 1200 m are not shown due to the interference of cloud droplet shattering. The CO mixing ratio, BC concentration, particle concentrations, and size distributions are normalized to standard temperature and pressure (273.15 K and 101.325 kPa; STP).
Pre-front and post-front conditions: decoupled boundary layer
Figure 10 shows an example of vertical profiles of meteorological parameters, CO mixing ratio, and aerosol properties when the MBL is decoupled. The measurements were carried out on 8 February 2018, when the front and associated cloud band were located north of the Azores (i.e., pre-front condition). The vertical profile of potential temperature indicates a deep decoupled MBL that consisted of the surface mixed layer below 500 m and the upper decoupled layer from 500 to 1900 m. A thin layer of stratus was observed near the top of the surface mixed layer, and cumulus clouds were observed in the upper decoupled layer (Fig. 10a). Inside the surface mixed layer, the aerosol size distribution is bimodal and independent of altitude. In contrast, the aerosol size distribution varied with altitude inside the upper decoupled layer. NCCN decreased with increasing altitude and exhibits a significantly lower value at the cloud level as a result of coalescence scavenging by the cumulus clouds. Similar features are also evident from the averages of the vertical profiles during the IOPs (Fig. 6c). The lower NCCN in the upper decoupled layer where the cumulus clouds form indicates that surface measurements overestimate the concentration of CCN that are relevant for cumulus cloud formation when the MBL is decoupled. Npre-CCN also exhibits a decreasing trend with altitude due to interstitial coagulation with cloud droplets. The accumulation-mode diameter inside the upper decoupled layer, below the cumulus cloud level (i.e., 600–1200 m), is substantially larger than that in the surface mixed layer (Fig. 10d). This larger accumulation-mode diameter is likely due to the formation of drizzle drops through autoconversion and accretion of cloud droplets. The evaporation of the drizzle drops below clouds leads to fewer but larger accumulation-mode particles. Such a process also explains the vertical profile of accumulation-mode diameter shown in Fig. 6f given the deeper MBL and higher drizzle rate during the winter season. A similar phenomenon can be observed under the post-front condition (Fig. S8), showing that the presence of the decoupled layer during pre-front and post-front conditions can lead to vertical heterogeneity of aerosol properties in the MBL.
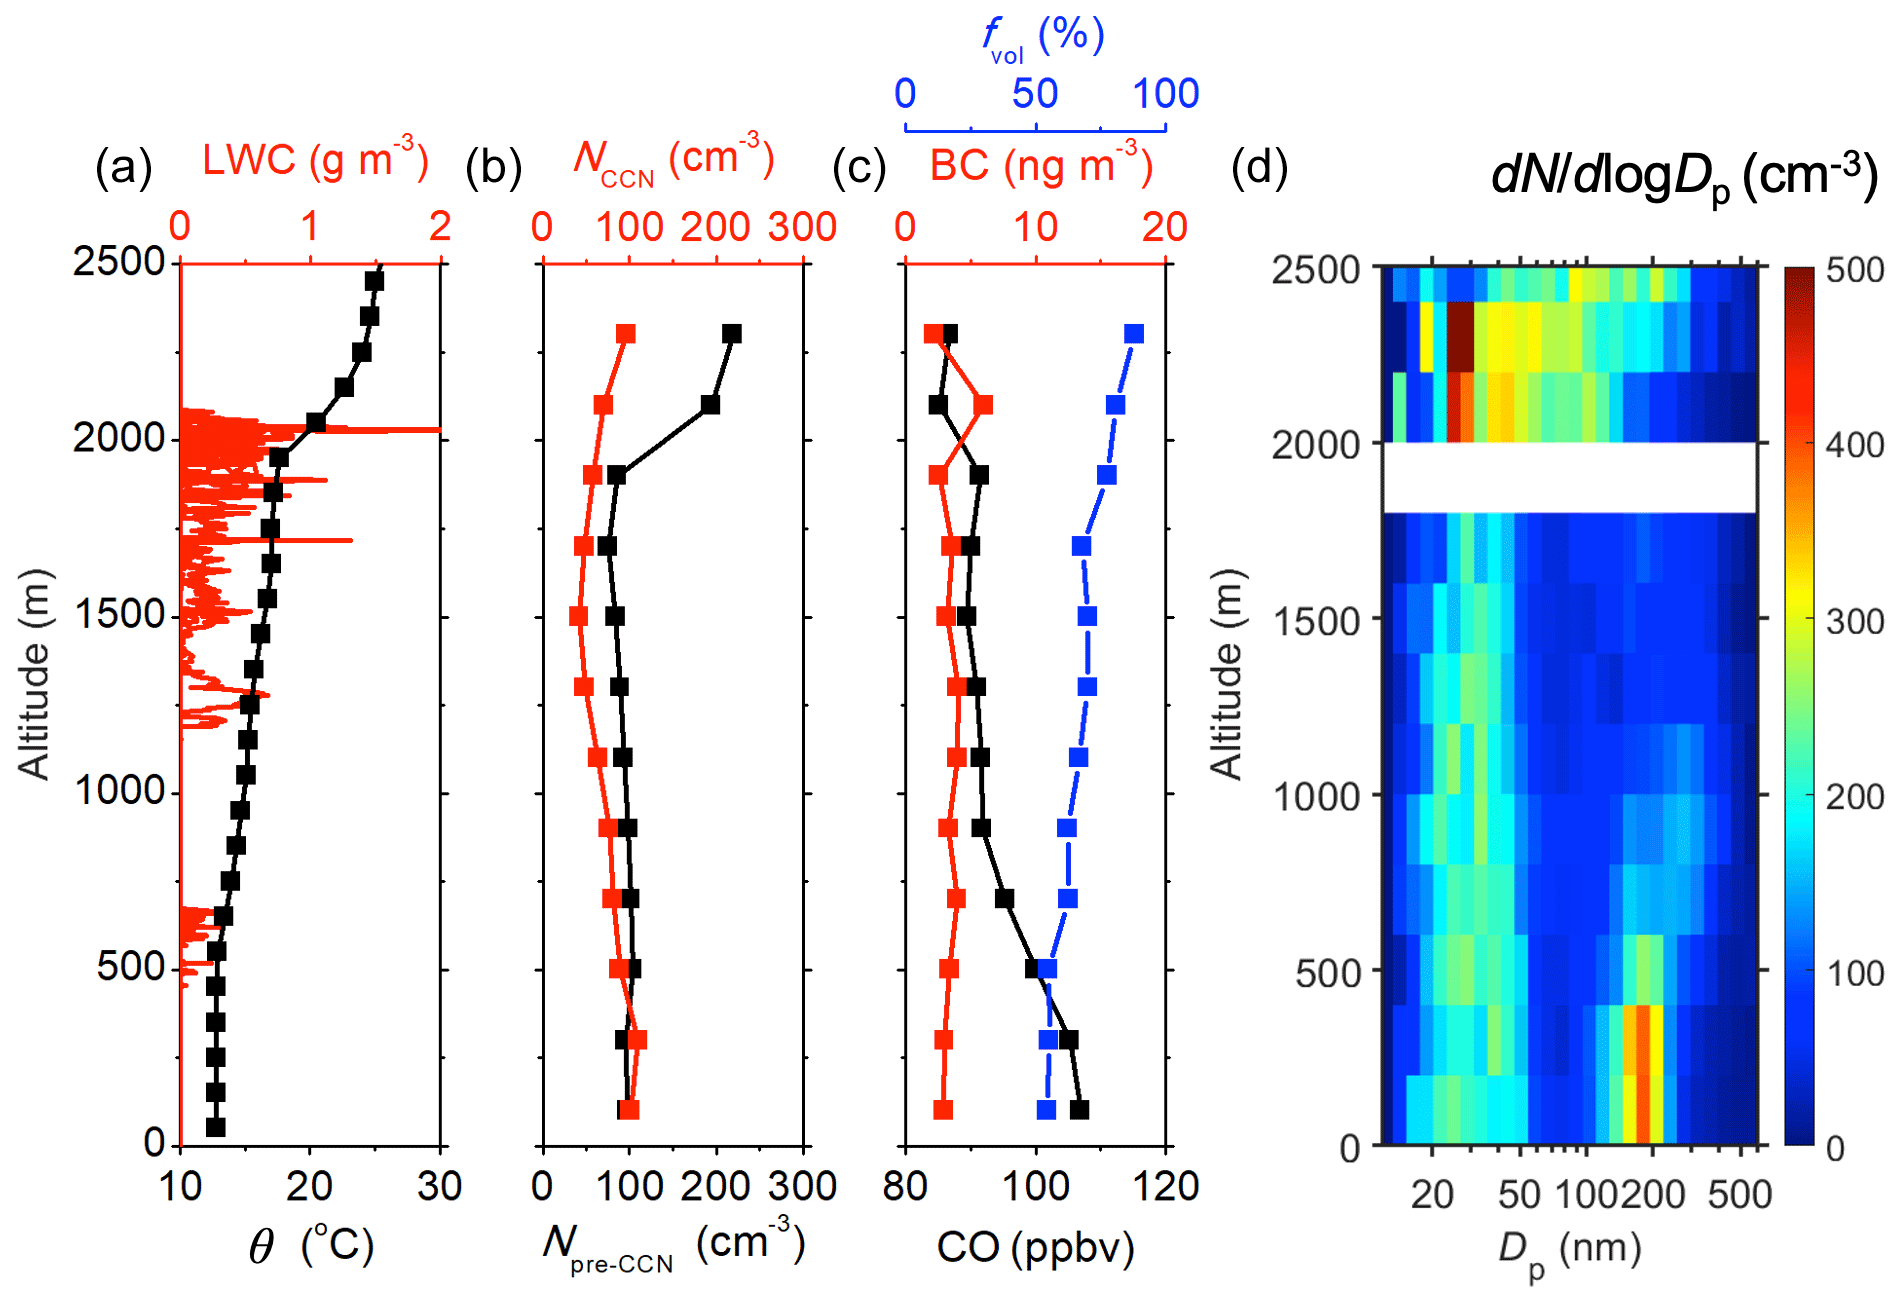
Figure 10Vertical profiles of parameters under the synoptic condition of pre-front on 8 February 2018. (a) Potential temperature (θ) and liquid water content (LWC). (b) Npre-CCN and NCCN. (c) Concentrations of carbon monoxide (CO) and black carbon (BC), as well as the aerosol volatile fraction (fv). (d) Vertical contour of aerosol size distributions as a function of altitude. Size distributions between 1800 and 2000 m are not shown due to the interference of cloud droplet shattering. The CO mixing ratio, BC concentration, particle concentrations, and size distributions are normalized to standard temperature and pressure (273.15 K and 101.325 kPa; STP).
In this study, we present aerosol properties, trace gas mixing ratios, and meteorological parameters characterized on board the G-1 aircraft during both the summer and winter IOPs of the ACE-ENA campaign. The key processes that drive the CCN population in the MBL are investigated by examining the variation of aerosol properties with altitude, season, and synoptic condition. On average, all particle concentrations (i.e., NCCN, Npre-CCN, and N>10) are higher in summer than winter at all altitudes. The elevated FT NCCN during summer is due to the periodic presence of long-range-transported aerosol layers in the lower FT. The sources of aerosol in the layers include both biomass burning and anthropogenic pollution from North America, with the contribution of anthropogenic pollution likely the dominant one for aerosol mass. In comparison, the influence of long-range-transported continental emissions on FT Npre-CCN is weaker. Most of the observed seasonal variation in FT Npre-CCN is likely due to stronger NPF during summer as a result of higher DMS emission rates over the open ocean. On average, FT NCCN is slightly lower than that in the MBL, indicating that entrainment of FT air does not serve as a direct source of CCN in the MBL. However, entrainment of FT air is a major source of particle number (N>10) in the MBL for both seasons. The particle number flux due to FT entrainment is dominated by the pre-CCN due to elevated Npre-CCN in the FT. Once the pre-CCN (i.e., nucleation- and Aitken-mode particles) are entrained into the MBL, they can grow and reach CCN size ranges through condensational growth. The higher MBL NCCN during summer is also partially due to the increased growth rate of pre-CCN as a result of stronger oceanic VOC emissions. Stronger precipitation and thus coalescence scavenging of CCN may also contribute to the seasonal variation of NCCN in the MBL.
The chemical composition analysis shows that sulfate, organics, and ammonium dominate the non-refractory aerosol mass concentration (around 99 % in both the summer and winter IOPs). The vertical profile of sulfate mass concentration indicates a surface source, consistent with the picture that over the open ocean sulfate in submicron aerosol is mostly derived from DMS through both gas-phase and in-cloud oxidation. Stronger DMS emissions and higher oxidant (e.g., OH) concentrations lead to a higher MBL sulfate mass concentration during summer. An enhanced organic mass concentration was also observed in the MBL during summer and is attributed to surface sources including stronger emission of primary organic marine aerosol and production of secondary organic aerosol from oceanic VOCs.
The impact of synoptic conditions on the MBL structure and aerosol properties is examined. Under the pre-front and post-front conditions, stronger convective activities often lead to a deeper and decoupled boundary layer consisting of two sublayers: a surface mixed layer and an upper decoupled layer. In comparison, a well-mixed boundary layer is more prevalent under Azores high conditions. Aerosol in the decoupled boundary layers exhibits strong vertical variations. Coagulation scavenging and evaporation of drizzle below clouds lead to reduced NCCN and larger accumulation-mode size in the upper decoupled layer. Therefore, surface measurements (within the surface mixed layer) overestimate NCCN that is relevant for the formation of MBL clouds under decoupled conditions.
The data specifically related to the ACE-ENA campaign can be found at http://arm.gov/research/campaigns/aaf2017ace-ena (Wang, 2018).
The supplement related to this article is available online at: https://doi.org/10.5194/acp-21-11079-2021-supplement.
JW designed the study. YW, GZ, DAK, AL, AAM, FM, RM, AJS, JES, StS, AS, JT, RWe, RWo, MAZ, and JW collected and analyzed the aerosol and trace gas data aboard the G-1. YW, GZ, MPJ, DM, DV, RWo, and JW analyzed the cloud data and synoptic conditions. YW and JW prepared the paper with contributions from all co-authors.
The authors declare that they have no conflict of interest.
Publisher's note: Copernicus Publications remains neutral with regard to jurisdictional claims in published maps and institutional affiliations.
This article is part of the special issue “Marine aerosols, trace gases, and clouds over the North Atlantic (ACP/AMT inter-journal SI)”. It is not associated with a conference.
The ACE-ENA campaign was supported by the Atmospheric Radiation Measurement (ARM) Climate Research Facility and the Environmental Molecular Sciences Laboratory (EMSL); both are US Department of Energy (DOE) Office of Science User Facilities sponsored by the Office of Biological and Environmental Research. We thank Tamara Pinterich for her help in the preparation and operation of the FIMS during the IOPs. This research was supported by the Atmospheric System Research (ASR) program as part of the DOE Office of Biological and Environmental Research under award nos. DE-SC0020259, KP1701000/57131, DE-SC0013489, DE-SC0012704 (BNL), DE-SC0018948, and DE-SC0021256. The Pacific Northwest National Laboratory is operated for the DOE by the Battelle Memorial Institute (DE-AC05-76RL01830). Amy Sullivan and Rodney Weber were supported under contract DOE 333890. Daniel A. Knopf acknowledges support by the US Department of Energy, Office of Science (BER), Atmospheric System Research (DE-SC0016370). The authors thank Tamara Pinterich for her help in the preparation and deployment of the FIMS on board the G-1 aircraft and the G-1 flight and ground crews (Mike Hubbell, John Hubbe, Clayton Eveland, Mike Crocker, Pete Carroll, Matt Newburn, Mikhail Pekour, Lexie Goldberger, and Jon Ray) for their support of the ACE-ENA mission.
This research has been supported by the US Department of Energy (grant nos. DE-SC0020259, KP1701000/57131, DE-SC0013489, DE-SC0012704, DE-SC0018948, DE-AC05-76RL01830, DE-SC0016370, and DE-SC0021256).
This paper was edited by Lynn M. Russell and reviewed by two anonymous referees.
Abdalmogith, S. S. and Harrison, R. M.: The use of trajectory cluster analysis to examine the long-range transport of secondary inorganic aerosol in the UK, Atmos. Environ., 39, 6686–6695, 2005.
Albrecht, B. A., Bretherton, C. S., Johnson, D., Scubert, W. H., and Frisch, A. S.: The Atlantic stratocumulus transition experiment-ASTEX, B. Am. Meteorol. Soc., 76, 889–904, 1995.
Andreae, M. O.: Soot carbon and excess fine potassium: Long-range transport of combustion-derived aerosols, Science, 220, 1148–1151, 1983.
Andreae, M. O., Afchine, A., Albrecht, R., Holanda, B. A., Artaxo, P., Barbosa, H. M. J., Borrmann, S., Cecchini, M. A., Costa, A., Dollner, M., Fütterer, D., Järvinen, E., Jurkat, T., Klimach, T., Konemann, T., Knote, C., Krämer, M., Krisna, T., Machado, L. A. T., Mertes, S., Minikin, A., Pöhlker, C., Pöhlker, M. L., Pöschl, U., Rosenfeld, D., Sauer, D., Schlager, H., Schnaiter, M., Schneider, J., Schulz, C., Spanu, A., Sperling, V. B., Voigt, C., Walser, A., Wang, J., Weinzierl, B., Wendisch, M., and Ziereis, H.: Aerosol characteristics and particle production in the upper troposphere over the Amazon Basin, Atmos. Chem. Phys., 18, 921–961, https://doi.org/10.5194/acp-18-921-2018, 2018.
Ayers, G. and Gillett, R.: DMS and its oxidation products in the remote marine atmosphere: implications for climate and atmospheric chemistry, J. Sea Res., 43, 275–286, 2000.
Bates, T., Quinn, P., Frossard, A., Russell, L., Hakala, J., Petäjä, T., Kulmala, M., Covert, D., Cappa, C., and Li, S. M.: Measurements of ocean derived aerosol off the coast of California, J. Geophys. Res.-Atmos., 117, D00V15, https://doi.org/10.1029/2012JD017588, 2012.
Bates, T. S., Kapustin, V. N., Quinn, P. K., Covert, D. S., Coffman, D. J., Mari, C., Durkee, P. A., De Bruyn, W. J., and Saltzman, E. S.: Processes controlling the distribution of aerosol particles in the lower marine boundary layer during the First Aerosol Characterization Experiment (ACE 1), J. Geophys. Res.-Atmos., 103, 16369–16383, 1998.
Bates, T. S., Quinn, P. K., Covert, D. S., Coffman, D. J., Johnson, J. E., and Wiedensohler, A.: Aerosol physical properties and processes in the lower marine boundary layer: A comparison of shipboard sub-micron data from ACE-1 and ACE-2, Tellus B, 52, 258–272, 2000.
Behrenfeld, M. J., Moore, R. H., Hostetler, C. A., Graff, J., Gaube, P., Russell, L. M., Chen, G., Doney, S. C., Giovannoni, S., Liu, H., Proctor, C., Bolaños, L. M., Baetge, N., Davie-Martin, C., Westberry, T. K., Bates, T. S., Bell, T. G., Bidle, K. D., Boss, E. S., Brooks, S. D., Cairns, B., Carlson, C., Halsey, K., Harvey, E. L., Hu, C., Karp-Boss, L., Kleb, M., Menden-Deuer, S., Morison, F., Quinn, P. K., Scarino, A. J., Anderson, B., Chowdhary, J., Crosbie, E., Ferrare, R., Hair, J. W., Hu, Y., Janz, S., Redemann, J., Saltzman, E., Shook, M., Siegel, D. A., Wisthaler, A., Martin, M. Y., and Ziemba, L.: The North Atlantic aerosol and marine ecosystem study (NAAMES): science motive and mission overview, Frontiers in Marine Science, 6, 122, https://doi.org/10.3389/fmars.2019.00122, 2019.
Bony, S. and Dufresne, J. L.: Marine boundary layer clouds at the heart of tropical cloud feedback uncertainties in climate models, Geophys. Res. Lett., 32, L20806, https://doi.org/10.1029/2005GL023851, 2005.
Bretherton, C. S., Wood, R., George, R. C., Leon, D., Allen, G., and Zheng, X.: Southeast Pacific stratocumulus clouds, precipitation and boundary layer structure sampled along 20∘ S during VOCALS-REx, Atmos. Chem. Phys., 10, 10639–10654, https://doi.org/10.5194/acp-10-10639-2010, 2010.
Brüggemann, M., Hayeck, N., and George, C.: Interfacial photochemistry at the ocean surface is a global source of organic vapors and aerosols, Nature communications, 9, 2101, https://doi.org/10.1038/s41467-018-04528-7, 2018.
Caldwell, P., Bretherton, C. S., and Wood, R.: Mixed-layer budget analysis of the diurnal cycle of entrainment in southeast Pacific stratocumulus, J. Atmos. Sci. 62, 3775–3791, 2005.
Carslaw, K., Lee, L., Reddington, C., Pringle, K., Rap, A., Forster, P., Mann, G., Spracklen, D., Woodhouse, M., and Regayre, L.: Large contribution of natural aerosols to uncertainty in indirect forcing, Nature, 503, 67–71, 2013.
China, S., Alpert, P. A., Zhang, B., Schum, S., Dzepina, K., Wright, K., Owen, R. C., Fialho, P., Mazzoleni, L. R., and Mazzoleni, C.: Ice cloud formation potential by free tropospheric particles from long-range transport over the Northern Atlantic Ocean, J. Geophys. Res.-Atmos., 122, 3065–3079, 2017.
Clarke, A., Varner, J., Eisele, F., Mauldin, R., Tanner, D., and Litchy, M.: Particle production in the remote marine atmosphere: Cloud outflow and subsidence during ACE 1, J. Geophys. Res.-Atmos., 103, 16397–16409, 1998.
Clarke, A. D., Freitag, S., Simpson, R. M. C., Hudson, J. G., Howell, S. G., Brekhovskikh, V. L., Campos, T., Kapustin, V. N., and Zhou, J.: Free troposphere as a major source of CCN for the equatorial pacific boundary layer: long-range transport and teleconnections, Atmos. Chem. Phys., 13, 7511–7529, https://doi.org/10.5194/acp-13-7511-2013, 2013.
Dall'Osto, M., Ceburnis, D., Monahan, C., Worsnop, D. R., Bialek, J., Kulmala, M., Kurtén, T., Ehn, M., Wenger, J., and Sodeau, J.: Nitrogenated and aliphatic organic vapors as possible drivers for marine secondary organic aerosol growth, J. Geophys. Res.-Atmos., 117, D12311, https://doi.org/10.1029/2012JD017522, 2012.
DeCarlo, P. F., Kimmel, J. R., Trimborn, A., Northway, M. J., Jayne, J. T., Aiken, A. C., Gonin, M., Fuhrer, K., Horvath, T., and Docherty, K. S.: Field-deployable, high-resolution, time-of-flight aerosol mass spectrometer, Anal. Chem., 78, 8281–8289, 2006.
Dunne, E. M., Gordon, H., Kürten, A., Almeida, J., Duplissy, J., Williamson, C., Ortega, I. K., Pringle, K. J., Adamov, A., and Baltensperger, U.: Global atmospheric particle formation from CERN CLOUD measurements, Science, 354, 1119–1124, 2016.
Dzepina, K., Mazzoleni, C., Fialho, P., China, S., Zhang, B., Owen, R. C., Helmig, D., Hueber, J., Kumar, S., Perlinger, J. A., Kramer, L. J., Dziobak, M. P., Ampadu, M. T., Olsen, S., Wuebbles, D. J., and Mazzoleni, L. R.: Molecular characterization of free tropospheric aerosol collected at the Pico Mountain Observatory: a case study with a long-range transported biomass burning plume, Atmos. Chem. Phys., 15, 5047–5068, https://doi.org/10.5194/acp-15-5047-2015, 2015.
Facchini, M. C., Rinaldi, M., Decesari, S., Carbone, C., Finessi, E., Mircea, M., Fuzzi, S., Ceburnis, D., Flanagan, R., and Nilsson, E. D.: Primary submicron marine aerosol dominated by insoluble organic colloids and aggregates, Geophys. Res. Lett., 35, L17814, https://doi.org/10.1029/2008GL034210, 2008.
Fierz, M., Vernooij, M. G., and Burtscher, H.: An improved low-flow thermodenuder, J. Aerosol Sci., 38, 1163–1168, 2007.
Gelaro, R., McCarty, W., Suárez, M. J., Todling, R., Molod, A., Takacs, L., Randles, C. A., Darmenov, A., Bosilovich, M. G., and Reichle, R.: The modern-era retrospective analysis for research and applications, version 2 (MERRA-2), J. Climate, 30, 5419–5454, 2017.
Ghate, V. P., Miller, M. A., Albrecht, B. A., and Fairall, C. W.: Thermodynamic and radiative structure of stratocumulus-topped boundary layers, J. Atmos. Sci., 72, 430–451, 2015.
Gurciullo, C., Lerner, B., Sievering, H., and Pandis, S.: Heterogeneous sulfate production in the remote marine environment: Cloud processing and sea-salt particle contributions, J. Geophys. Res.-Atmos., 104, 21719–21731, 1999.
Hegg, D. A. and Hobbs, P. V.: Cloud water chemistry and the production of sulfates in clouds, Atmos. Environ., 15, 1597–1604, 1981.
Hodshire, A. L., Campuzano-Jost, P., Kodros, J. K., Croft, B., Nault, B. A., Schroder, J. C., Jimenez, J. L., and Pierce, J. R.: The potential role of methanesulfonic acid (MSA) in aerosol formation and growth and the associated radiative forcings, Atmos. Chem. Phys., 19, 3137–3160, https://doi.org/10.5194/acp-19-3137-2019, 2019.
Hoell, C., O’Dowd, C., Osborne, S., and Johnson, D.: Chemical and Physical Meteorology, Tellus B, 52, 423–438, 2000.
Holanda, B. A., Pöhlker, M. L., Walter, D., Saturno, J., Sörgel, M., Ditas, J., Ditas, F., Schulz, C., Franco, M. A., Wang, Q., Donth, T., Artaxo, P., Barbosa, H. M. J., Borrmann, S., Braga, R., Brito, J., Cheng, Y., Dollner, M., Kaiser, J. W., Klimach, T., Knote, C., Krüger, O. O., Fütterer, D., Lavrič, J. V., Ma, N., Machado, L. A. T., Ming, J., Morais, F. G., Paulsen, H., Sauer, D., Schlager, H., Schneider, J., Su, H., Weinzierl, B., Walser, A., Wendisch, M., Ziereis, H., Zöger, M., Pöschl, U., Andreae, M. O., and Pöhlker, C.: Influx of African biomass burning aerosol during the Amazonian dry season through layered transatlantic transport of black carbon-rich smoke, Atmos. Chem. Phys., 20, 4757–4785, https://doi.org/10.5194/acp-20-4757-2020, 2020.
Holloway, T., Levy, H., and Kasibhatla, P.: Global distribution of carbon monoxide, J. Geophys. Res.-Atmos., 105, 12123–12147, 2000.
Honrath, R., Owen, R. C., Val Martin, M., Reid, J., Lapina, K., Fialho, P., Dziobak, M. P., Kleissl, J., and Westphal, D.: Regional and hemispheric impacts of anthropogenic and biomass burning emissions on summertime CO and O3 in the North Atlantic lower free troposphere, J. Geophys. Res.-Atmos., 109, D24310, https://doi.org/10.1029/2004JD005147, 2004.
Hoppel, W., Frick, G., Fitzgerald, J., and Larson, R.: Marine boundary layer measurements of new particle formation and the effects nonprecipitating clouds have on aerosol size distribution, J. Geophys. Res.-Atmos., 99, 14443–14459, 1994.
Huebert, B. J., Pszenny, A., and Blomquist, B.: The ASTEX/MAGE Experiment, J. Geophys. Res.-Atmos., 101, 4319–4329, 1996.
Jaeglé, L., Wood, R., and Wargan, K.: Multiyear Composite View of Ozone Enhancements and Stratosphere-to-Troposphere Transport in Dry Intrusions of Northern Hemisphere Extratropical Cyclones, J. Geophys. Res.-Atmos., 122, 13436–13457, 2017.
Jaffe, D., Bertschi, I., Jaeglé, L., Novelli, P., Reid, J. S., Tanimoto, H., Vingarzan, R., and Westphal, D. L.: Long-range transport of Siberian biomass burning emissions and impact on surface ozone in western North America, Geophys. Res. Lett., 31, L16106, https://doi.org/10.1029/2004GL020093, 2004.
Jayne, J. T., Leard, D. C., Zhang, X., Davidovits, P., Smith, K. A., Kolb, C. E., and Worsnop, D. R.: Development of an aerosol mass spectrometer for size and composition analysis of submicron particles, Aerosol Sci. Tech., 33, 49–70, 2000.
Jickells, T., Kelly, S., Baker, A., Biswas, K., Dennis, P., Spokes, L., Witt, M., and Yeatman, S.: Isotopic evidence for a marine ammonia source, Geophys. Res. Lett., 30, 1374, https://doi.org/10.1029/2002GL016728, 2003.
Johnson, D. W., Osborne, S., Wood, R., Suhre, K., Johnson, R., Businger, S., Quinn, P. K., Wiedensohler, A., Durkee, P. A., and Russell, L. M.: An overview of the Lagrangian experiments undertaken during the North Atlantic regional Aerosol Characterisation Experiment (ACE-2), Tellus B, 52, 290–320, 2000.
Karl, M., Gross, A., Pirjola, L., and Leck, C.: A new flexible multicomponent model for the study of aerosol dynamics in the marine boundary layer, Tellus B, 63, 1001–1025, 2011.
Kaufman, Y. J. and Tanré, D.: Effect of variations in super-saturation on the formation of cloud condensation nuclei, Nature, 369, 45–48, 1994.
Kerminen, V. M., Wexler, A. S., and Potukuchi, S.: Growth of freshly nucleated particles in the troposphere: Roles of NH3, H2SO4, HNO3, and HCl, J. Geophys. Res.-Atmos., 102, 3715–3724, 1997.
Kolstad, E. W., Bracegirdle, T. J., and Seierstad, I. A.: Marine cold-air outbreaks in the North Atlantic: Temporal distribution and associations with large-scale atmospheric circulation, Clim. Dynam., 33, 187–197, 2009.
McCoy, D. T., Burrows, S. M., Wood, R., Grosvenor, D. P., Elliott, S. M., Ma, P.-L., Rasch, P. J., and Hartmann, D. L.: Natural aerosols explain seasonal and spatial patterns of Southern Ocean cloud albedo, Science Advances, 1, e1500157, https://doi.org/10.1126/sciadv.1500157, 2015.
McCoy, I. L., Wood, R., and Fletcher, J. K.: Identifying meteorological controls on open and closed mesoscale cellular convection associated with marine cold air outbreaks, J. Geophys. Res.-Atmos., 122, 11678–11702, 2017.
McCoy, I. L., Bretherton, C. S., Wood, R., Twohy, C. H., Gettelman, A., Bardeen, C., and Toohey, D. W.: Recent Particle Formation and Aerosol Variability Near Southern Ocean Low Clouds, J. Geophys. Res.-Atmos., https://doi.org/10.1002/essoar.10503719.1, submitted, 2020.
Mechem, D. B., Wittman, C. S., Miller, M. A., Yuter, S. E., and De Szoeke, S. P.: Joint synoptic and cloud variability over the Northeast Atlantic near the Azores, J. Appl. Meteorol. Clim., 57, 1273–1290, 2018.
Meskhidze, N. and Nenes, A.: Phytoplankton and cloudiness in the Southern Ocean, Science, 314, 1419–1423, 2006.
Mungall, E. L., Abbatt, J. P., Wentzell, J. J., Lee, A. K., Thomas, J. L., Blais, M., Gosselin, M., Miller, L. A., Papakyriakou, T., and Willis, M. D.: Microlayer source of oxygenated volatile organic compounds in the summertime marine Arctic boundary layer, P. Natl. Acad. Sci. USA, 114, 6203–6208, 2017.
Novelli, P., Masarie, K., and Lang, P.: Distributions and recent changes of carbon monoxide in the lower troposphere, J. Geophys. Res.-Atmos., 103, 19015–19033, 1998.
O'Dowd, C., Monahan, C., and Dall'Osto, M.: On the occurrence of open ocean particle production and growth events, Geophys. Res. Lett., 37, L19805, https://doi.org/10.1029/2010GL044679, 2010.
O'Dowd, C. D. and Smith, M. H.: Physicochemical properties of aerosols over the northeast Atlantic: Evidence for wind-speed-related submicron sea-salt aerosol production, J. Geophys. Res.-Atmos., 98, 1137–1149, 1993.
O'Dowd, C. D., Facchini, M. C., Cavalli, F., Ceburnis, D., Mircea, M., Decesari, S., Fuzzi, S., Yoon, Y. J., and Putaud, J.-P.: Biogenically driven organic contribution to marine aerosol, Nature, 431, 676–680, 2004.
Orsini, D. A., Ma, Y., Sullivan, A., Sierau, B., Baumann, K., and Weber, R. J.: Refinements to the particle-into-liquid sampler (PILS) for ground and airborne measurements of water soluble aerosol composition, Atmos. Environ., 37, 1243–1259, 2003.
Ovadnevaite, J., O'Dowd, C., Dall'Osto, M., Ceburnis, D., Worsnop, D. R., and Berresheim, H.: Detecting high contributions of primary organic matter to marine aerosol: A case study, Geophys. Res. Lett., 38, L02807, https://doi.org/10.1029/2010GL046083, 2011.
Ovadnevaite, J., Ceburnis, D., Leinert, S., Dall'Osto, M., Canagaratna, M., O'Doherty, S., Berresheim, H., and O'Dowd, C.: Submicron NE Atlantic marine aerosol chemical composition and abundance: Seasonal trends and air mass categorization, J. Geophys. Res.-Atmos., 119, 11850–11863, 2014.
Parrish, D., Trainer, M., Holloway, J., Yee, J., Warshawsky, M., Fehsenfeld, F., Forbes, G., and Moody, J.: Relationships between ozone and carbon monoxide at surface sites in the North Atlantic region, J. Geophys. Res.-Atmos., 103, 13357–13376, 1998.
Pierce, J. R., Croft, B., Kodros, J. K., D'Andrea, S. D., and Martin, R. V.: The importance of interstitial particle scavenging by cloud droplets in shaping the remote aerosol size distribution and global aerosol-climate effects, Atmos. Chem. Phys., 15, 6147–6158, https://doi.org/10.5194/acp-15-6147-2015, 2015.
Pirjola, L., O'Dowd, C. D., Brooks, I. M., and Kulmala, M.: Can new particle formation occur in the clean marine boundary layer?, J. Geophys. Res.-Atmos., 105, 26531–26546, 2000.
Prather, K. A., Bertram, T. H., Grassian, V. H., Deane, G. B., Stokes, M. D., DeMott, P. J., Aluwihare, L. I., Palenik, B. P., Azam, F., and Seinfeld, J. H.: Bringing the ocean into the laboratory to probe the chemical complexity of sea spray aerosol, P. Natl. Acad. Sci. USA, 110, 7550–7555, 2013.
Quinn, P., Coffman, D., Johnson, J., Upchurch, L., and Bates, T.: Small fraction of marine cloud condensation nuclei made up of sea spray aerosol, Nat. Geosci., 10, 674–679, 2017.
Raes, F.: Entrainment of free tropospheric aerosols as a regulating mechanism for cloud condensation nuclei in the remote marine boundary layer, J. Geophys. Res.-Atmos., 100, 2893–2903, 1995.
Raes, F., Bates, T., McGovern, F., and Van Liedekerke, M.: The 2nd Aerosol Characterization Experiment (ACE-2): General overview and main results, Tellus B, 52, 111–125, 2000.
Rasmussen, B. B., Nguyen, Q. T., Kristensen, K., Nielsen, L. S., and Bilde, M.: What controls volatility of sea spray aerosol? Results from laboratory studies using artificial and real seawater samples, J. Aerosol Sci., 107, 134–141, 2017.
Reid, J. S., Koppmann, R., Eck, T. F., and Eleuterio, D. P.: A review of biomass burning emissions part II: intensive physical properties of biomass burning particles, Atmos. Chem. Phys., 5, 799–825, https://doi.org/10.5194/acp-5-799-2005, 2005.
Rémillard, J. and Tselioudis, G.: Cloud regime variability over the Azores and its application to climate model evaluation, J. Climate, 28, 9707–9720, 2015.
Rémillard, J., Kollias, P., Luke, E., and Wood, R.: Marine boundary layer cloud observations in the Azores, J. Climate, 25, 7381–7398, 2012.
Russell, L. M., Lenschow, D. H., Laursen, K. K., Krummel, P. B., Siems, S. T., Bandy, A. R., Thornton, D. C., and Bates, T. S.: Bidirectional mixing in an ACE 1 marine boundary layer overlain by a second turbulent layer, J. Geophys. Res.-Atmos., 103, 16411–16432, 1998.
Russell, L. M., Hawkins, L. N., Frossard, A. A., Quinn, P. K., and Bates, T. S.: Carbohydrate-like composition of submicron atmospheric particles and their production from ocean bubble bursting, P. Natl. Acad. Sci. USA, 107, 6652–6657, 2010.
Sanchez, K. J., Chen, C.-L., Russell, L. M., Betha, R., Liu, J., Price, D. J., Massoli, P., Ziemba, L. D., Crosbie, E. C., and Moore, R. H.: Substantial seasonal contribution of observed biogenic sulfate particles to cloud condensation nuclei, Scientific Reports, 8, 3235, https://doi.org/10.1038/s41598-018-21590-9, 2018.
Schmid, B., Tomlinson, J. M., Hubbe, J. M., Comstock, J. M., Mei, F., Chand, D., Pekour, M. S., Kluzek, C. D., Andrews, E., and Biraud, S.: The DOE ARM aerial facility, B. Am. Meteorol. Soc., 95, 723–742, 2014.
Sciare, J., Oikonomou, K., Favez, O., Liakakou, E., Markaki, Z., Cachier, H., and Mihalopoulos, N.: Long-term measurements of carbonaceous aerosols in the Eastern Mediterranean: evidence of long-range transport of biomass burning, Atmos. Chem. Phys., 8, 5551–5563, https://doi.org/10.5194/acp-8-5551-2008, 2008.
Spivakovsky, C., Yevich, R., Logan, J., Wofsy, S., McElroy, M., and Prather, M.: Tropospheric OH in a three-dimensional chemical tracer model: An assessment based on observations of CH3CCl3, J. Geophys. Res.-Atmos., 95, 18441–18471, 1990.
Stein, A., Draxler, R. R., Rolph, G. D., Stunder, B. J., Cohen, M., and Ngan, F.: NOAA's HYSPLIT atmospheric transport and dispersion modeling system, B. Am. Meteorol. Soc., 96, 2059–2077, 2015.
Sullivan, A., Guo, H., Schroder, J., Campuzano-Jost, P., Jimenez, J., Campos, T., Shah, V., Jaeglé, L., Lee, B., and Lopez-Hilfiker, F.: Biomass burning markers and residential burning in the WINTER aircraft campaign, J. Geophys. Res.-Atmos., 124, 1846–1861, 2019.
Thompson, A. M.: The oxidizing capacity of the Earth's atmosphere: Probable past and future changes, Science, 256, 1157–1165, 1992.
Thompson, A. M., Witte, J. C., Hudson, R. D., Guo, H., Herman, J. R., and Fujiwara, M.: Tropical tropospheric ozone and biomass burning, Science, 291, 2128–2132, 2001.
Turner, D. D., Vogelmann, A., Austin, R. T., Barnard, J. C., Cady-Pereira, K., Chiu, J. C., Clough, S. A., Flynn, C., Khaiyer, M. M., and Liljegren, J.: Thin liquid water clouds: Their importance and our challenge, B. Am. Meteorol. Soc., 88, 177–190, 2007.
Wang, J.: Aerosol and Cloud Experiments in the Eastern North Atlantic (ACE-ENA), available at: http://arm.gov/research/campaigns/aaf2017ace-ena (last access: 17 July 2021), 2018.
Wang, J., Wood, R., Jensen, M. P., Chiu, J. C., Liu, Y., Desai, N., Giangrande, S. E., Knopf, D. A., Kollias, P., Liu, X., Lu, C., Mechem, D., Mei, F., Starzec, M., Wang, Y., Yum, S., Zheng, G., Aiken, A. C., Azevedo, B., Blanchard, Y., Dong, X., Gallo, F., Gao, S., Ghate, V. P., Glienke, S., Goldberger, L., Hardin, J. C., Luke, E. P., Matthews, A. A., Miller, M. A., Moffet, R., Schmid, B., Sedlacek, A. J., Shaw, R. A., Shilling, J. E., Suski, K., Veghte, D. P., Weber, R., Wyant, M., Zawadowicz, M., and Zhang, Z.: Aerosol and Cloud Experiments in the Eastern North Atlantic (ACE-ENA), B. Am. Meteorol. Soc., https://doi.org/10.1175/BAMS-D-19-0220.1, accepted, 2021.
Wang, Y., Pinterich, T., and Wang, J.: Rapid measurement of sub-micrometer aerosol size distribution using a fast integrated mobility spectrometer, J. Aerosol Sci., 121, 12–20, 2018.
Williamson, C. J., Kupc, A., Axisa, D., Bilsback, K. R., Bui, T., Campuzano-Jost, P., Dollner, M., Froyd, K. D., Hodshire, A. L., and Jimenez, J. L.: A large source of cloud condensation nuclei from new particle formation in the tropics, Nature, 574, 399–403, 2019.
Willis, M. D., Burkart, J., Thomas, J. L., Köllner, F., Schneider, J., Bozem, H., Hoor, P. M., Aliabadi, A. A., Schulz, H., Herber, A. B., Leaitch, W. R., and Abbatt, J. P. D.: Growth of nucleation mode particles in the summertime Arctic: a case study, Atmos. Chem. Phys., 16, 7663–7679, https://doi.org/10.5194/acp-16-7663-2016, 2016.
Willis, M. D., Köllner, F., Burkart, J., Bozem, H., Thomas, J. L., Schneider, J., Aliabadi, A. A., Hoor, P. M., Schulz, H., and Herber, A. B.: Evidence for marine biogenic influence on summertime Arctic aerosol, Geophys. Res. Lett., 44, 6460–6470, 2017.
Wood, R. and Bretherton, C. S.: Boundary layer depth, entrainment, and decoupling in the cloud-capped subtropical and tropical marine boundary layer, J. climate, 17, 3576–3588, 2004.
Wood, R., Köhler, M., Bennartz, R., and O'Dell, C.: The diurnal cycle of surface divergence over the global oceans, Q. J. Roy. Meteor. Soc., 135, 1484–1493, 2009.
Wood, R., Leon, D., Lebsock, M., Snider, J., and Clarke, A. D.: Precipitation driving of droplet concentration variability in marine low clouds, J. Geophys. Res.-Atmos., 117, D19210, https://doi.org/10.1029/2012JD018305, 2012.
Wood, R., Wyant, M., Bretherton, C. S., Rémillard, J., Kollias, P., Fletcher, J., Stemmler, J., De Szoeke, S., Yuter, S., and Miller, M.: Clouds, aerosols, and precipitation in the marine boundary layer: An arm mobile facility deployment, B. Am. Meteorol. Soc., 96, 419–440, 2015.
Wood, R., Stemmler, J. D., Rémillard, J., and Jefferson, A.: Low-CCN concentration air masses over the eastern North Atlantic: Seasonality, meteorology, and drivers, J. Geophys. Res.-Atmos., 122, 1203–1223, 2017.
Wurl, O., Wurl, E., Miller, L., Johnson, K., and Vagle, S.: Formation and global distribution of sea-surface microlayers, Biogeosciences, 8, 121–135, https://doi.org/10.5194/bg-8-121-2011, 2011.
Wyant, M. C., Bretherton, C. S., Bacmeister, J. T., Kiehl, J. T., Held, I. M., Zhao, M., Klein, S. A., and Soden, B. J.: A comparison of low-latitude cloud properties and their response to climate change in three AGCMs sorted into regimes using mid-tropospheric vertical velocity, Clim. Dynam., 27, 261–279, 2006.
Yoon, Y., Ceburnis, D., Cavalli, F., Jourdan, O., Putaud, J., Facchini, M., Decesari, S., Fuzzi, S., Sellegri, K., and Jennings, S.: Seasonal characteristics of the physicochemical properties of North Atlantic marine atmospheric aerosols, J. Geophys. Res.-Atmos., 112, D04206, https://doi.org/10.1029/2005JD007044, 2007.
Zawadowicz, M. A., Suski, K., Liu, J., Pekour, M., Fast, J., Mei, F., Sedlacek, A. J., Springston, S., Wang, Y., Zaveri, R. A., Wood, R., Wang, J., and Shilling, J. E.: Aircraft measurements of aerosol and trace gas chemistry in the eastern North Atlantic, Atmos. Chem. Phys., 21, 7983–8002, https://doi.org/10.5194/acp-21-7983-2021, 2021.
Zheng, G., Wang, Y., Aiken, A. C., Gallo, F., Jensen, M. P., Kollias, P., Kuang, C., Luke, E., Springston, S., Uin, J., Wood, R., and Wang, J.: Marine boundary layer aerosol in the eastern North Atlantic: seasonal variations and key controlling processes, Atmos. Chem. Phys., 18, 17615–17635, https://doi.org/10.5194/acp-18-17615-2018, 2018.
Zheng, G., Kuang, C., Uin, J., Watson, T., and Wang, J.: Large contribution of organics to condensational growth and formation of cloud condensation nuclei (CCN) in the remote marine boundary layer, Atmos. Chem. Phys., 20, 12515–12525, https://doi.org/10.5194/acp-20-12515-2020, 2020a.
Zheng, G., Sedlacek, A. J., Aiken, A. C., Feng, Y., Watson, T. B., Raveh-Rubin, S., Uin, J., Lewis, E. R., and Wang, J.: Long-range transported North American wildfire aerosols observed in marine boundary layer of eastern North Atlantic, Environ. Int., 139, 105680, https://doi.org/10.1016/j.envint.2020.105680, 2020b.
Zheng, G., Wang, Y., Wood, R., Jensen, M. P., Kuang, C., McCoy, I. L., Matthews, A., Mei, F., Tomlinson, J. M., and Shilling, J. E.: New particle formation in the remote marine boundary layer, Nat. Commun., 12, 527, https://doi.org/10.1038/s41467-020-20773-1, 2021.