the Creative Commons Attribution 4.0 License.
the Creative Commons Attribution 4.0 License.
 | 15 Jul 2021
Technical note: A new approach to discriminate different black carbon sources by utilising fullerene and metals in positive matrix factorisation analysis of high-resolution soot particle aerosol mass spectrometer data
James Brooks
Paul I. Williams
Ernesto Reyes-Villegas
Michael Priestley
Carl J. Percival
James D. Allan
Atmospheric aerosol particles are known to have detrimental effects on human health and climate. Black carbon is an important constituent of atmospheric aerosol particulate matter (PM), emitted from incomplete combustion. Source apportionment of BC is very important, to evaluate the influence of different sources. The high-resolution soot particle aerosol mass spectrometer (HR-SP-AMS) instrument uses a laser vaporiser, which allows the real-time detection and characterisation of refractory black carbon (rBC) and its internally mixed particles such as metals, coating species, and rBC subcomponents in the form of HOA + fullerene. In this case study, the soot data were collected by using HR-SP-AMS during Guy Fawkes Night on 5 November 2014. Positive matrix factorisation was applied to positively discriminate between different wood-burning and bonfire sources for the first time, which no existing black carbon source apportionment technique is currently able to do. Along with this, the use of the fullerene signals in differentiating between soot sources and the use of metals as a tracer for fireworks has also been investigated, which did not significantly contribute to the rBC concentrations. The addition of fullerene signals and successful positive matrix factorisation (PMF) application to HR-SP-AMS data apportioned rBC into more than two sources. These bonfire sources are HOA + fullerene, biomass burning organic aerosol, more oxidised oxygenated organic aerosol (MO-OOA), and non-bonfire sources such as hydrocarbon-like OA and domestic burning. The result of correlation analysis between HR-SP-AMS data and previously published Aethalometer, MAAP, and CIMS data provides an effective way of gaining insights into the relationships between the variables and provide a quantitative estimate of the source contributions to the BC budget during this period. This research study is an important demonstration of using HR-SP-AMS for the purpose of BC source apportionment.
- Article
(2726 KB) - Full-text XML
-
Supplement
(614 KB) - BibTeX
- EndNote


Aerosol particles in the atmosphere are known to have very harmful effects on the air quality, human health, and climate (Highwood and Kinnersley, 2006). An important component of atmospheric aerosol particles is black carbon (BC), i.e. soot, which has extremely detrimental impacts on human health and air quality (Janssen and WHO Joint, 2012). BC's main emission source is through the incomplete combustion of fossil fuel and biomass. Sources include transportation, open biomass burning, power generation sources, and residential heating (Bond et al., 2011; Cooke et al., 1999; US EPA, 2012). In the atmosphere, BC can be mixed with organic and inorganic aerosol species, either at the point of emission or through gas-to-particle conversion processes in the atmosphere.
As well as harmful impacts on human health, BC can also absorb cancer-inducing pollutants such as volatile organic compounds (VOCs) and polycyclic aromatic hydrocarbons (PAHs) due to its carbonaceous nature and large surface area. As a result of its smaller size, it can be deposited in weasands and lungs, leading to severe health problems (Cao et al., 2012; Dachs and Eisenreich, 2000). According to hypothesised mechanisms, the ultrafine BC is the cause of abnormal cardiovascular functions and endothelial senescence at the molecular level (Büchner et al., 2013). Along with being harmful to human health, it also affects visibility, reduces agricultural productivity, harms ecosystems, and exacerbates global warming (Grahame and Schlesinger, 2010).
Most BC sources are of anthropogenic origin, but source apportionment is important to establish which specific sources are responsible. There are multiple measurement techniques available for this purpose, but they are subject to considerable uncertainties (Martinsson, 2014). One of the most widely used techniques is the multiwavelength Aethalometer, which was first described by Hansen et al. (1984). Later Sandradewi et al. (2008) described how the Aethalometer can be used to apportion different sources of light-absorbing aerosols such as wood-burning, which in contrast to traffic emissions absorbs additional light in the UV region, over what would be expected in the near-infrared region. Another source apportionment method is to measure the radiocarbon (14C) content (Hellborg et al., 2003). This method has not been used as widely because it requires very specialist equipment (Barescut et al., 2005).
Positive matrix factorisation can in principle, identify multiple categories of soot; however, it needs a large data set and relevant chemical data of several species. A soot-specific instrument that may be able to provide such data is the soot particle aerosol mass spectrometer (SP-AMS) (Onasch et al., 2012), which generates online mass spectra of refractory black carbon (rBC) and its coatings. Using this instrument, Onasch et al. (2015) distributed the carbon ions in the mass spectrum into small carbon clusters (C1–C5), larger carbon cluster ions (C6–29), and fullerene (> C30) ions. Other research studies, such as Rivellini et al. (2020), have also used the SP-AMS for the detection of rBC and its coatings along with trace metals in the highly urbanised city of Singapore, and results showed that 43 % of total rBC mainly originated from traffic emissions while the rest of the partially resolved fraction of rBC was emitted from various sources such as traffic (use of internal combustion engine), industrial, and shipping emissions. Carbone et al. (2015) used SP-AMS to quantify and detect the trace metals linked with rBC particles, and Wang et al. (2016) reported a fullerene time series in eastern China.
The current study aims to develop the SP-AMS as a source apportionment tool, which will subsequently improve our understanding of the sources of atmospheric soot. For this purpose, Bonfire Night 2014 in Manchester was taken as a case study because it is known that there were at least three sources of BC (traffic, domestic wood burning, bonfires, and potentially fireworks) and weather conditions that night favoured the high concentrations of primary emissions. This event has been described in previous studies (Liu et al., 2017; Priestley et al., 2018; Reyes-Villegas et al., 2018). In terms of air quality, it has been recognised that Bonfire Night is one of the most polluted days in the UK. Every year, this event is celebrated on 5 November (or on a weekend day near this date) where open fires are lit and fireworks are set off at individual households, as well as large community events. These bonfire activities have a strong flaming segment which roughly starts during the evening and lasts for up to 2 h. The fires after flaming are not refuelled, therefore leading to an extended phase of smouldering as the fires are left to completely burn and die down (Dyke et al., 1997; Mari et al., 2010; Pongpiachan et al., 2015).
Different research case studies have previously been published about Bonfire Night around the UK. For example, Clark (1997) studied the PM10 concentrations emitted during Bonfire Night event in different parts of the UK. In Oxford, dioxin measurements in the ambient air were conducted by Dyke et al. (1997). Colbeck and Chung (1996) targeted the particle size distribution. Polycyclic aromatic hydrocarbons (PAHs) were measured in Lancaster (Farrar et al., 2004), while in 2018, Reyes-Villegas et al. (2018) studied insights into nitrate chemistry during Bonfire Night by applying the chemical ionisation mass spectrometry measurements and aerosol mass spectrometry simultaneously. Observations of the nitro-compounds including nitrate, amide, and isocyanate were studied during Bonfire Night in Manchester (Priestley et al., 2018). In previous studies, specifically during bonfire event and general aerosol measurements, several different source apportionment techniques have been performed. The Aethalometer AE31 model was used to do the source apportionment analysis and successfully apportion the rBC into BC from wood burning and BC from the traffic emissions (Reyes-Villegas et al., 2018). During the same study, Multilinear Engine-2 and PMF tools were also used over the AMS data through the source apportionment interface (SoFi version 4.8 as presented by Canonaco et al., 2013) to find the organic aerosol sources according to proposed strategies by Reyes-Villegas et al. (2016) and recommendations made by Crippa et al. (2014). Liu et al. (2019) also studied the BC sources from wood burning and diesel traffic emissions using an SP2 to examine the BC particles' mixing state and optical properties.
In order to test the ability of HR-SP-AMS to apportion rBC (with multiple BC types) the data were collected during Bonfire Night from 29 October–11 November 2014 at the University of Manchester. As a result of strong meteorological conditions, very high and mixed concentrations of pollutants were observed. Traditionally the PMF tool is applied to conventional AMS data (as with Reyes-Villegas et al., 2018), but the objective of this study is to demonstrate a new way to source-apportion black carbon based on highly time-resolved mass spectrometric composition data of the population of particles that contain black carbon, and it uses information on the composition of black carbon and information on internally mixed fullerene and condensed material.
Fullerenes are a class of exclusively high-molecular-weight carbon clusters (C60, C70, etc.) having a unique hollow cage-like structure, which were discovered by Kroto et al. (1985) for the first time. They were identified as ionised particles in low-pressure fuel-rich flat premixed acetylene and benzene–oxygen flames by molecular-beam sampling combined with mass spectrometer analysis (Gerhardt et al., 1988). These have been reported previously in HR-SP-AMS data, but whether they are formed in the flame or during the vaporisation process is not clear (Fortner et al., 2012).
2.1 Sampling site overview
Measurements were conducted at the South Campus University of Manchester (53.467∘ N, 2.232∘ W) before, during and after Bonfire Night event on 5 November as described in the previous publications (Liu et al., 2017; Reyes-Villegas et al., 2018; Priestley et al., 2018). Different instruments were set up for the online measurement of ambient aerosols and gases. A compact time-of-flight aerosol mass spectrometer (cToF-AMS) was used to measure all PM1 components as described by Reyes-Villegas et al. (2018). A time-of-flight chemical ionisation mass spectrometer (ToF-CIMS) using iodide as a reagent was used to measure the gas phase concentrations of aerosols (Priestley et al., 2018). BC source apportionment was performed by using an Aethalometer model AE31 which measured the absorption of light at seven different wavelengths (Reyes-Villegas et al., 2018) while a MAAP was used to measure the concentrations of BC emitted during the bonfire event and inform the corrections needed to process the AE31 data (Collaud et al., 2010).
2.2 Instrument overview – HR-SP-AMS
In this case study, the high-resolution soot particle aerosol mass spectrometer (HR-SP-AMS) was used, which is a combination of single-particle soot photometer (SP2) laser and high-resolution time-of-flight aerosol mass spectrometer (HR-ToF-AMS). The laser vaporiser is an intracavity Nd:YAG (1064 nm) that heats up and vaporises black-carbon-containing particles along with metal nanoparticles (Onasch et al., 2012; Carbone et al., 2015). While the instrument is sometimes operated with the standard AMS tungsten vaporiser present, in this instance it was removed. Ionisation is performed using the same 70 eV electron source as the standard AMS, and like the AMS, the separation of the vaporisation and ionisation stages ensures quantitative measurements. A catalytic stripper was also attached to the aerosol sampling lines, which switched between catalytic stripper and direct measurements every 30 min (Liu et al., 2017). In our case, the results have been analysed by using the direct measurements only.
During the experiment, a measurement of the relative ionisation efficiency (RIE) was not obtained owing to technical difficulties associated with generating a suitable test aerosol; however, this only affects absolution quantification and not the ability of the instrument to apportion fractions of the signal, which is the subject of investigation here. The RIE, as defined by Allan et al. (2004), is a constant factor applied to the signals as part of the conversion from a signal in the mass spectrometer to an ambient mass concentration. Because this is a purely multiplicative operation, this will affect all data and associated errors equally, and therefore the factors derived in the PMF model described by Ulbrich et al. (2009) will simply by multiplied by the exact same amount. So, when PMF factors are derived using data that have not had an RIE applied (and corollary to this, other multiplicative factors such as ionisation efficiency, collection efficiency, and inlet flow rate), the relative contributions of the different factors as a function of time will be the same as data that had this applied. The only difference is that the absolute units of the factors are as an arbitrary mass spectral response (in s−1) rather than an ambient mass concentration (in µg m−3). The only potential difference is in the relative signal strengths of organic and elemental carbon, which will likely have different RIE values (Onasch et al., 2012). This is explored in more detail in Sect. 4.2 where the relative contributions of the different factors to the HR-SP-AMS signal and the BC mass fraction are explained.
The HR-SP-AMS data were analysed using the data analysis toolkit ToF-AMS HR Analysis 1.20O (DeCarlo et al., 2006). The high-resolution PIKA feature of toolkit allows the direct separation of most ions from the organic and inorganic species at the same nominal mass-to-charge ratio and grouping into families such as CxHy, CxHyOz, and CxHyOzNp (Aiken et al., 2007). This high-resolution analysis on SP-AMS data also detected various metal pollutants such as iron (Fe), titanium (Ti), strontium (Sr), and caesium (Cs). The instrument alternated between three mass spectrometer configurations, spending 3 min on each: the standard “V” mode, high-resolution “W” mode (DeCarlo et al., 2006), and an alternative “V” mode whereby the orthogonal extractor was pulsed every 95 instead of 34 µs. This lower frequency delivered data up to rather than 380, with the intention of characterising the fullerene signals described by Onasch et al. (2012) at the expense of overall signal-to-noise ratio. The data presented in this paper are a combination of the standard “V” mode for the lower peaks, processed using the PIKA high-resolution analysis tool, and the long pulser period “V” mode for the fullerene peaks, processed using the unit mass resolution (UMR) method. The reason for using the UMR method instead of HR was that the peaks in this regime were not sufficiently resolved, due to the limit of the mass spectrometer. Instead, the UMR method integrates all the available signals without needing to discriminate discrete peaks. The “W” mode data were deemed not to have a sufficient signal-to-noise ratio to contribute to this work.
2.3 Positive matrix factorisation
Positive matrix factorisation (PMF) is an advanced factor-analysis technique developed by Paatero and Tapper (1994). In the previous research, PMF has been used extensively to apportion organics with the standard AMS data but not so often to apportion BC from SP-AMS data (Crippa et al., 2013; Saarikoski et al., 2014). In this research study positive matrix factorisation (PMF) was applied to HR-SP-AMS data to apportion BC in to more than two sources. PMF assumes that a matrix of data can be explained by a linear combination of “factors” with characteristic profiles and varying temporal contributions (Paatero and Tapper, 1994; Ulbrich et al., 2009). The analysis was conducted using the PMF Evaluation Tool (Ulbrich et al., 2009; Zhang et al., 2011).
As with all PMF analysis, error estimates have to be provided but because of the lower signals and the combination of different data retrieval methods used for the fullerene signals (UMR rather than HR), greater emphasis had to be placed on these signals. Corbin et al. (2015) presented a very detailed error model for HR data employing a Monte Carlo method to explore multiple sources of error. But because UMR was used in this instance, we were unable to apply this method, so we took an empirical approach. This was done by applying an additional “model error” to the error matrix, i.e. an error term proportional to the signal intensity in addition to its square root, as per the standard AMS error model (Ulbrich et al., 2009; Comero et al., 2009). The model error value was increased from 0 to 0.10 to downweight the larger signals and place more of an emphasis on the fullerene signals. The details about model error value modification are available in the Supplement (Figs. S3a, b, S4a, b, S5a, b). While the methods of Corbin et al. (2015) cannot be directly applied here, they are in broad agreement with the values we have used. According to Corbin et al. (2015), the peak width “w” is predicted during the peak fit integration from an empirical fit to the data. This “w” prediction has a linked proportional uncertainty σw=w. In that data set, σw=w was 2.5 %, which was independently treated as 2 % or 3 % uncertainty in the isolated peak heights, so these two can be combined in quadrature. And for the isolated peaks the value for the total percentage uncertainty is about 5 %, which is conceptually equivalent to 0.05 model error. This is comparable to the 0.1 model error σw=w used here. Along with placing greater emphasis on the smaller fullerene signals, the application of this model error also increased the number of “weak” variables, defined as having a signal-to-noise ratio (SNR) below 2 (Paatero and Hopke, 2003; Ulbrich et al., 2009), which were downweighted by a factor of 2. No variables were “bad” in the sense of having SNR < 0.2 (Paatero and Hopke, 2003).
3.1 Weather measurements and overview of highly polluted time period
The weather data are, as presented by Reyes-Villegas et al. (2018), and results showed quiet stagnant conditions with a low temperature of 4 ∘C, high relative humidity of 85 % alongside the wind speed of 1.5 m s−1, and varying wind directions. This type of weather condition promotes the accumulation of pollution in the atmosphere. During the stagnant conditions, the very high concentrations of BC and Sr were also observed with the signal of 3400 and 53 s−1 respectively, during the bonfire event at 22:20 and 21:50 UTC, compared to BC concentrations of 100–500 s−1 before Bonfire Night and 250–300 s−1 after Bonfire Night and Sr concentrations of 5 and 1 s−1 before and after Bonfire Night Fig. 1. The time period of Bonfire Night when the pollutants were very high is called as high-pollutant-concentration time period.
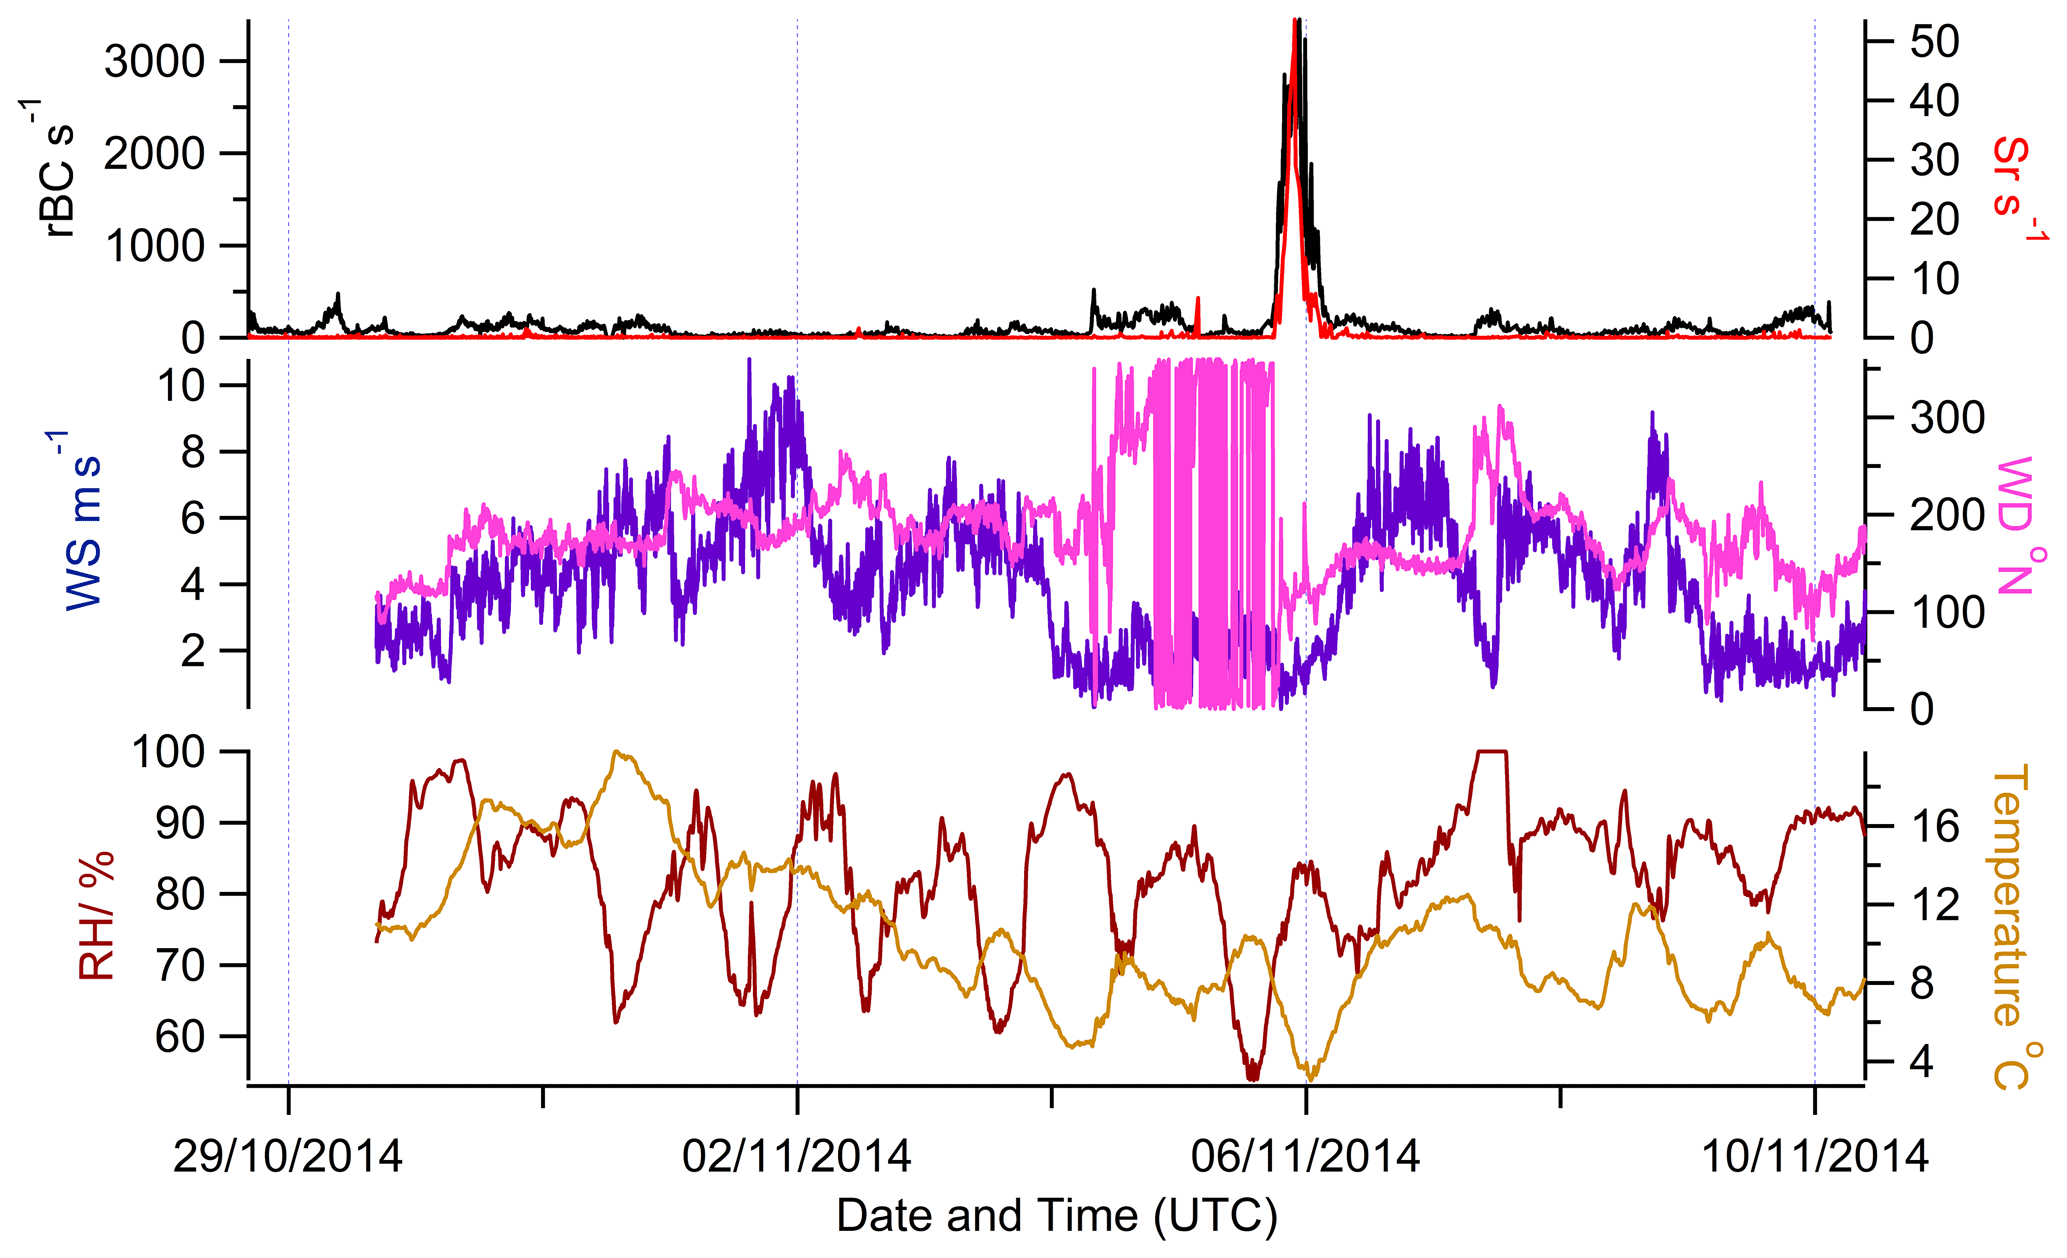
Figure 1Meteorological measurements of relative humidity (RH), temperature, wind direction (WD), and wind speed (WS) along with the time series of BC and strontium (Sr), a firework tracer emitted during Bonfire Night.
3.2 Time series of different variable concentrations observed during the bonfire event
3.2.1 Firework burning tracer
To attempt to identify a unique tracer for fireworks, the HR-SP-AMS data were analysed for metals. Reyes-Villegas et al. (2018) concluded that fireworks were not a major factor in the overall mass concentrations but could not conclusively prove this assertion with the data available. Fireworks release several pollutants such as manganese, cadmium, strontium, aluminium, other suspended particles, carbon monoxide, carbon dioxide, and sulfur dioxide (Lemieux et al., 2004; Shi et al., 2011). The metal compounds are in the form of metal salts such as potassium chlorates, perchlorates, strontium nitrates, potassium nitrates, barium nitrates, sodium oxalate, manganese, sulfur, iron, and aluminium. These metals are mainly used to give different bright colours; for example, Sr can be used for giving red colour to the fireworks (Mclain, 1980). During the analysis, different metal peaks, such as iron (Fe), strontium (Sr), caesium (Cs), and titanium (Ti), which could be associated with the fireworks, were detected (Fig. 2a). The Sr was most unambiguously associated with the fireworks due to the fact that there is no other signal present in the atmosphere outside of Bonfire Night. Other metals may have other sources, such as mineral or brake dust in the case of iron, and may be receiving signal interference from other mass spectral peaks. The highest peak of Sr concentrations, i.e. 53.6 s−1, was detected as compared to the concentrations of Sr, before and after the bonfire event (1.6 and 0.9 s−1).

Figure 2Time series of different variables observed during the bonfire event. (a) Time series of various metal pollutant concentrations; (b) time series of high-resolution rBC concentrations and its coating species (organics and inorganics); (c) time series of black carbon measured by different instruments, i.e HR SP-AMS (rBC), AE31 (eBC and BrC), and MAAP (eBC); (d) time series of rBC and primary (pPON) and secondary (sPON) organic nitrate.
3.2.2 HR time series of BC and its coating species
Figure 2b shows that the signals associated with refractory BC (rBC) and its coating species (Org, SO4, NO3, Chl, and NH4) were particularly very high during Bonfire Night. The HR time series of the whole sampling time period shows that the majority of non-refractory PMBC signal was mainly organic matter, having very high concentrations, followed by Chl, SO4, NH4, and NO3. It is worth mentioning that the signals of these aerosols were very high during Bonfire Night compared to the before and after time periods except the NO3 signal, which was 0.8 s−1 before the bonfire event on 30 October at 08:30 UTC and 1.8 s−1 after Bonfire Night on 7 November at 16:15 UTC. The high Chl peak was strongly related to Bonfire Night because wood burning is an important source of chloride in the atmosphere (Lobert et al., 1999). Fireworks can also be a source of Chl because chlorates and perchlorates can provide oxygen for the combustion of fireworks. Also, the high peak of nitrate can be linked with the combustion sources such as wood burning and biomass burning emissions (Reyes-Villegas et al., 2018). The peak signals for rBC and organic aerosols were at different times. For example, the concentrations of rBC started increasing first at 19:54 UTC followed by organic aerosol concentrations increasing at 20:30 to 21:00 UTC (highest).
3.2.3 Correlation analysis of rBC with other pollutants
The HR-SP-AMS data were compared against those of other instruments such as AE31, CIMS, MAAP, and AMS presented in the previous studies (Reyes-Villegas et al., 2018; Priestley et al., 2018), and a statistically significant correlation (see Table S2, S3, and S4 in the Supplement) was found between the black carbon measured by three different instruments, i.e. rBC from HR-SP-AMS, eBC from MAAP, and eBC and BrC from AE31. The BC measured by AE31 and MAAP was named eBC (equivalent BC) according to Petzold et al. (2013) recommendations. Reyes-Villegas et al. (2018) measured eBCwb (equivalent black carbon emissions from wood burning) and eBCtr (eBCtr (equivalent black carbon emission from traffic) at 470 and 950 nm with the mass absorption cross section (MAC) of 31.1 and 15.4 m2 g−1 while eBC from MAAP was measured at 630 nm with MAC of 6.67 m2 g−1. A very high concentration of rBC and eBC was measured from all instruments that could detect these. The peak of brown carbon (BrC) measured by AE31 was also very high during the event night and indicates a wood-burning source (details found at Reyes-Villegas et al., 2018).
Reyes-Villegas et al. (2018) used AMS to estimate the concentrations of particulate organic oxides of nitrogen (PONs), i.e. 2.8 µg m−3. Particulate organic oxides of nitrogen (PONs) were estimated using the 46 : 30 ratios from aerosol mass spectrometer (AMS) measurements, according to previously published methods. The study also identified two PON factors as primary PON and secondary PON by applying ME-2 source apportionment to organic aerosol concentrations from different sources after modification of the fragmentation table. Figure 2d shows the time series of rBC, primary particulate organic oxide of nitrogen (pPON) and secondary particulate organic oxide of nitrogen (sPON). The result in Fig. 2d showed that the concentration of up to 2.8 µg m−3 for PON was detected, which was over the detection range as reported by Bruns et al. (2010). Moreover, BC was also detected with very high signals of 3400 s−1. The reason behind this high correlation is that rBC is a primary pollutant, so it is well correlated with the primary PON as both are directly emitted from the bonfire event. However, the correlation of rBC with the sPON is not very good, i.e. r2=0.35, because the secondary pollutants appeared later.
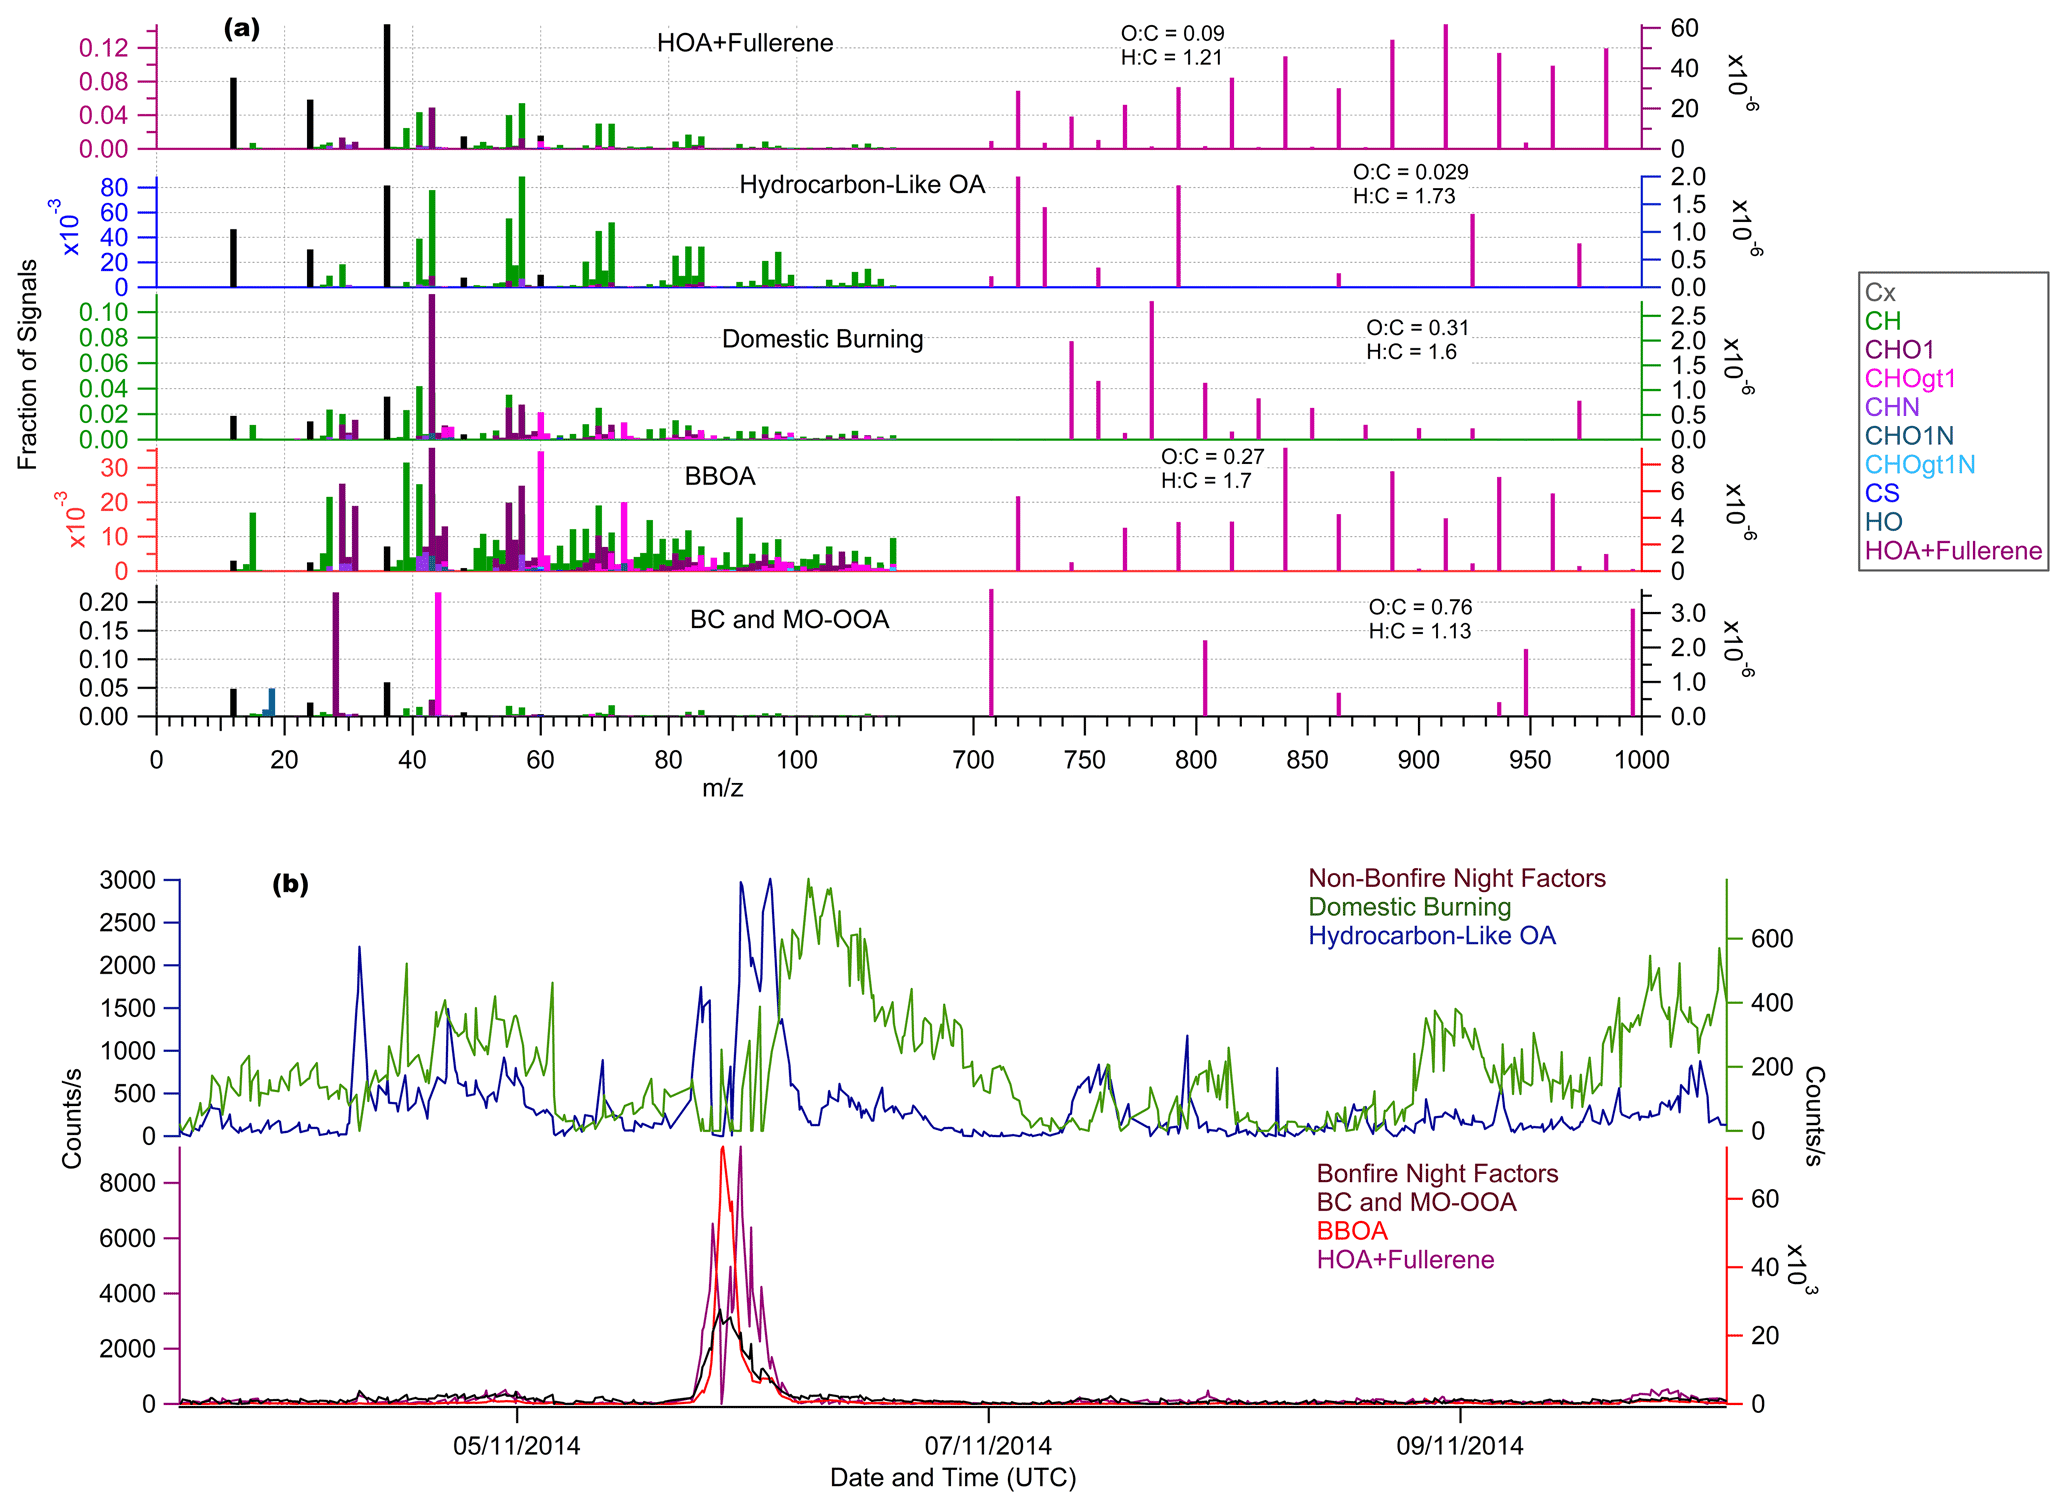
Figure 3PMF solution. (a) Five-factor source profile (BC and MO-OOA, BBOA, domestic burning OA, hydrocarbon-like OA, and HOA + fullerene). (b) The time series of non-Bonfire Night and Bonfire Night factors obtained.
3.3 BC source apportionment analysis
3.3.1 PMF factorisation result
To provide a baseline result and explore the effect of adding fullerene signals, the factorisation was first performed in a standard configuration without the inclusion of fullerene signals in the data matrix. The f-peak parameter was varied between −2.0 and +2.0 with an f-peak interval of 0.2 and model error of 0.10. The result shown in the Supplement is the five-factor solution (Fig. S1a and b), shown for the purpose of comparison with the solution presented below. The factors are identified as BC and MO-OOA, SV-OOA, BBOA, hydrocarbon-like OA, and domestic burning. In that case, only two unambiguously Bonfire Night sources of BC were identified, with a degree of “mixing” between Bonfire Night factor and traffic noted in the HOA factor, which manifests as common features in the time series and profiles. Also, the SV-OOA and domestic burning factors exhibit mixing in their time series as well. While five factors could be resolved, the factorisation without fullerene signals was judged to be poor.
Next, PMF was performed with the inclusion of fullerene data, and for the selection of an optimum number of factors, a stepwise approach was used, beginning with a two-factor model and successively adding factors up to a maximum of six. In our case, five factors gave the best solution based on the criteria of near 1, the squares of scaled residuals' total sum, and all the matrix points fitted within their expected error (Paatero et al., 2002). The rotational ambiguity of the five-factor solution was explored by varying the f-peak between −2.0 and +2.0 with an f-peak interval of 0.2. The changes in the fractional contributions of the PMF factors were very small for all the factors, indicating a low amount of rotational freedom. The solution for f-peak = 0 was used for all subsequent work, as also recommended by Paatero et al. (2002). In order to test whether any of the factors could be associated with fireworks, PMF analysis was also performed to force the inclusion of Sr in the factorisation. For this purpose, the Sr concentrations were upweighted by multiplying the total concentrations of Sr (but not the associated error) by 10, 100, and 1000, but despite this, a factor containing Sr was not found. This implies that none of the HR-SP-AMS factors could be associated with fireworks.
Table 1Explanation of the time series used in Figs. 4 and 5.
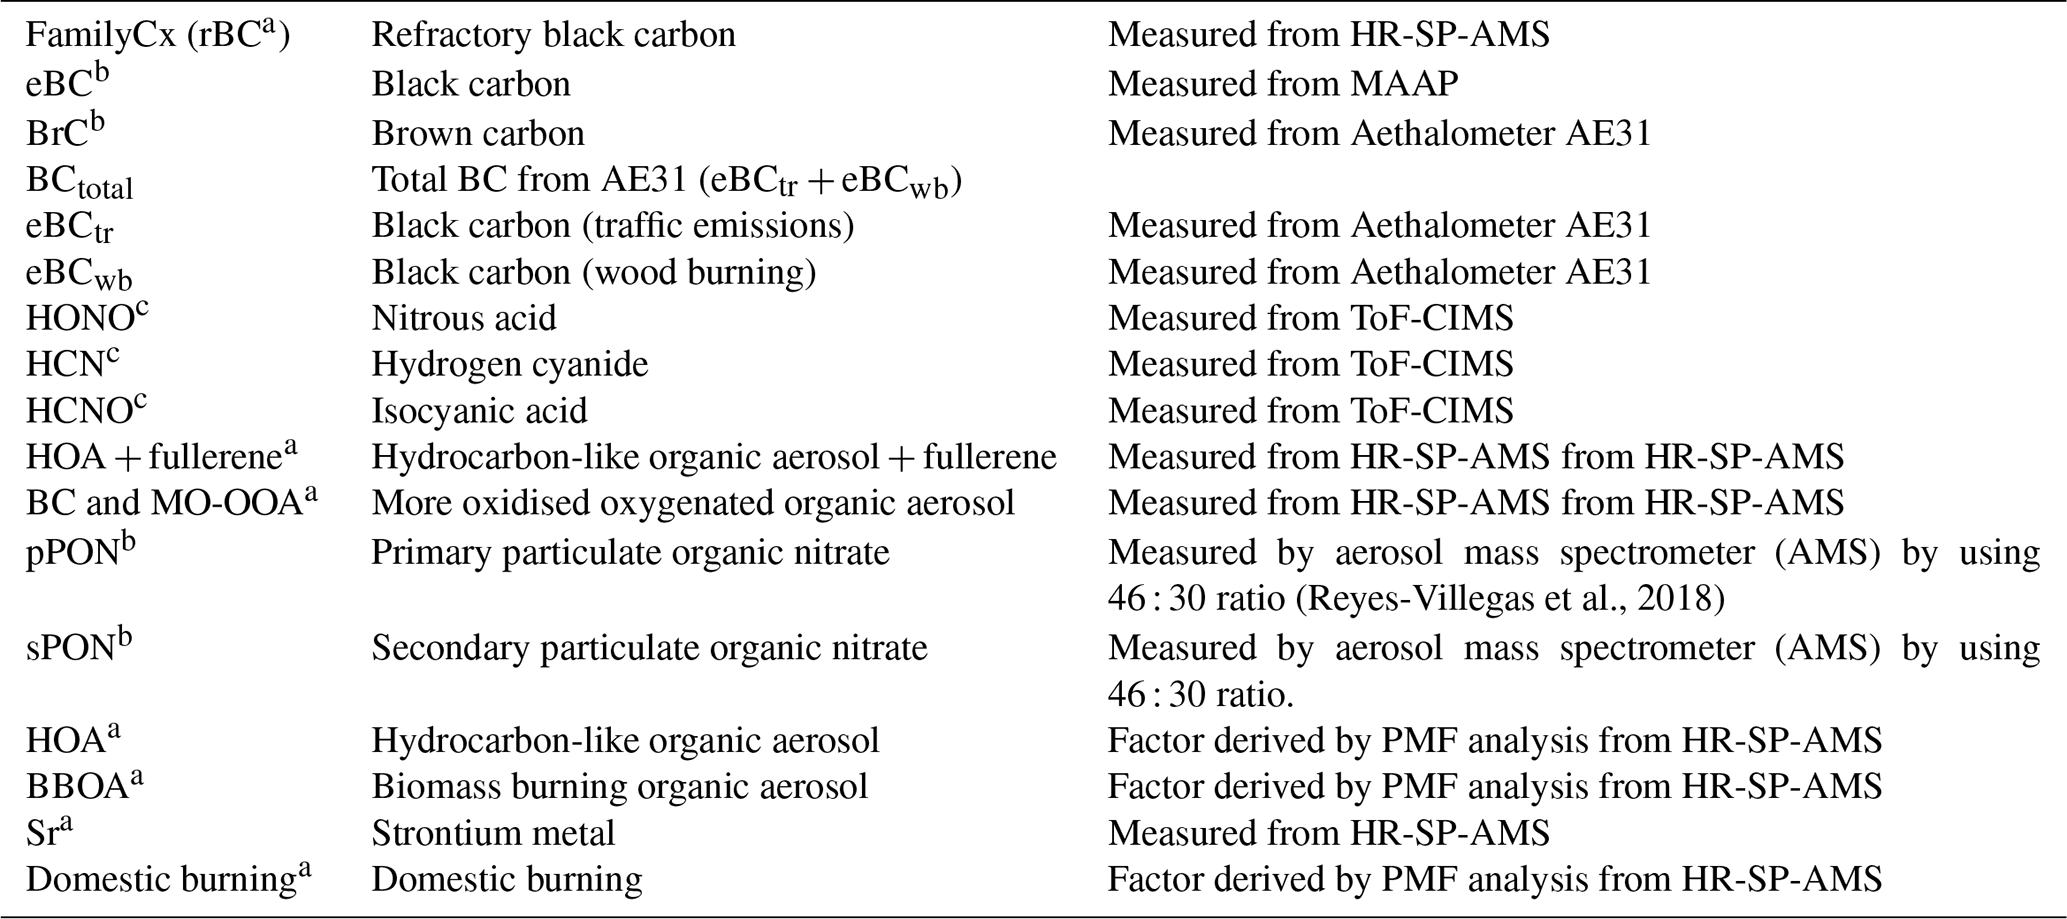
a rBC, Sr, HOA + fullerene, hydrocarbon-like OA, domestic burning, BBOA, and BC and MO-OOA (current study) derived by PMF from HR-SP-AMS. b pPON, sPON, eBC and BrC, (AE31), and eBC (MAAP) (Reyes-Villegas et al., 2018). c HCN, HCNO, and HONO (Priestley et al., 2018).
Figure 3a shows the signal concentrations and mass spectra of five different factors. Two of them (HOA + fullerene and BBOA) are directly linked with the bonfire event. The factors identified as domestic burning and hydrocarbon-like OA show activity outside of this period and are referred to as non-Bonfire Night sources. The remaining factor, BC and MO-OOA, is mainly associated with the bonfire but also shows activity outside of this, indicating it has multiple sources.
The factor identified as “BC and MO-OOA” (more oxidised oxygenated organic aerosol) is associated with bonfire and non-bonfire sources and identified as such due to its similarity to previously reported profiles, in particular the prominent signal at 44 (CO). MO-OOA is often associated with heavily aged secondary organic aerosol (Lanz et al., 2008; Zhu et al., 2018), but the highly oxygenated material that gives rise to the 44 peak can also be present in biomass burning (Lin et al., 2010). Because of the extensive pyrolysis of these organic aerosol types, the AMS is not capable of distinguishing these, so BC and MO-OOA is associated with the both bonfire source and secondary organic aerosol (SOA) outside of the burning period.
Another bonfire factor is the biomass burning OA (BBOA), which had strong signals at 60 and 73 corresponding to levoglucosan and related anhydrous sugars (Fig. 3a), associated with wood-burning organic aerosols (Alfarra et al., 2007). The time series of BBOA also shows very high signals of 75×103 during the biomass burning on Bonfire Night only (Fig. 3b).
“HOA + fullerene” is also one of the bonfire sources and is heavily weighted by HOA and fullerene, showing a peak at 720 (C), possibly due to the fact that polycyclic aromatic hydrocarbons can transform into soot containing HOA + fullerene during combustion (Wang et al., 2015, 2016; Reilly et al., 2000). The time series of HOA + fullerene also shows the very high concentration of 8000 counts/s only during the bonfire event, so it is identified as one of the bonfire sources (Fig. 3b).
The non-bonfire factor “hydrocarbon-like organic aerosols (HOA)” is related to traffic emissions (fossil fuel combustion), presenting high signals at 55 and 57, associated with aliphatic hydrocarbons (Canagaratna et al., 2004). Diesel exhaust is typically dominated by re-condensed engine lubricating oil and consists mainly of n-alkanes, branched alkanes, cycloalkanes, and aromatics (Canagaratna et al., 2004; Chirico et al., 2010), leading to high signal at the ion series CnH and CnH. In particular, 57 is a major mass fragment and often used as a tracer for HOA (Zhang et al., 2005). The next factor had high signals at 43, 55, 57, and 60, which is concordant with hydrocarbon-like OA from traffic emission and BBOA from biomass burning, but was observed outside of the bonfire event, so this factor was associated with domestic wood-burning (Allan et al., 2010).
When inspecting the HOA + fullerene component of the mass spectral, it is found that it varies between different factors, with the maximum signal contributions of the various factors being HOA = , domestic burning = , BBOA = , and BC and MO-OOA = , HOA + fullerene = . Onasch et al. (2015) reported that the variations within the mass spectral region of fullerene signal were negligible, which is contrary to the results presented here. But in our case, all the factors except the “HOA + fullerene” factor have very low signal contributions, so it is difficult to conclude with confidence that these variations represent anything physical.
In previous AMS studies, cooking could be one of the important sources of PM2.5 (Sun et al., 2013), but in this study cooking was not identified by PMF because it is not co-emitted with rBC and so is not vaporised by the HR-SP-AMS.
4.1 Correlation between different pollutants
Correlation analysis gives an effective way of quickly gaining an idea of how variables are related with one another. The data analysis software “openair” was used to generate the hierarchical cluster analysis chart (Carslaw and Ropkins, 2012) using the “corplot” function on the Bonfire Night data only. Hierarchical cluster analysis (HCA) provides an effective way of understanding the order in which different variables appear due to their similarity to one another. Variables from this (such as rBC, BC & MO-OOA, BBOA, domestic burning, hydrocarbon-like OA, and HOA + fullerene) and previous publications such as HCNO, HCN, and HONO from Priestley et al. (2018) and sPON, pPON, eBCtr, eBCwb, and eBCtotal from Reyes-Villegas et al. (2018) were plotted in a dendrogram, to provide the additional information to help visualise how groups of variables are related to one another. The explanation of all these time series names and how they were measured is given in Table 1.

Figure 4The similarity between different pollutant time series through hierarchical cluster analysis (HCA).

Figure 5Time series of the pollutants, grouped according to the hierarchical cluster analysis in Fig. 9.
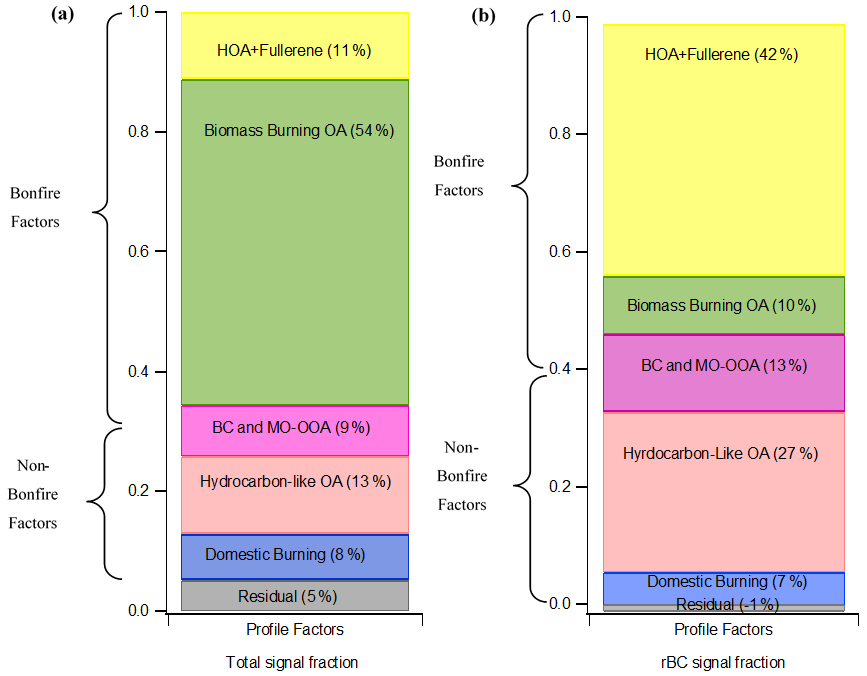
Figure 6Panel (a) shows the relative contributions of total mass fraction to HR-SP-AMS signal, and (b) shows rBC mass fraction accounted for by each PMF factor.

Figure 7The contributions of BC signals in µg/m3 after normalising it to the concentrations of eBC950 from the Aethalometer (AE31) (Reyes-Villegas et al., 2018).
In Fig. 4, a significant correlation was observed between HOA + fullerene, eBCtotal, HONO, HCN, and rBC. The reason is that all of these are primary pollutants and directly released from the bonfire emissions. HCN and HONO are nitrogen-containing gases that were released during Bonfire Night from the wood fires (Le Breton et al., 2013; Wang et al., 2016). eBCtr has also shown a strong correlation with the rBC because it is also contributed to by primary pollutants and is also influenced by the bonfires. MO-OOA and BBOA have a very close relationship, which indicates that both are bonfire factors, but on the other hand MO-OOA also has a relationship with the secondary sources as discussed previously. Hydrocarbon-like OA and sPON have a close similarity just like sPON; the peak of hydrocarbon-like OA has been observed before and after the event night. The firework tracer Sr has shown some correlation with pPON and BBOA, but their peaks occurred at slightly different times. So, in spite of the high correlation, this implies that they are not identical, and “Sr” is behaving as a separate factor when subject to PMF analysis. It could be that if the firework display occurred at the beginning of the bonfire event their emissions may be coincident with the pyrolysis emissions at the beginning of the bonfire event, as distinct from the smouldering emissions later (Haslett et al., 2018). But without specific knowledge of the timings of the events that contribute to these emissions, it is difficult to reach firm conclusions. This, coupled with the fact that Sr could not be associated with any of the factors in this study, would be consistent with Reyes-Villegas et al. (2018) in concluding that fireworks are not a significant source of the material observed.
A correlation was seen between BrC and eBCwb, which is expected, as BrC is normally associated with wood burning. And the last factor, i.e. domestic burning, behaves as a separate factor and shows no or very little correlation with any sources.
Based on the HCA plot, a time series graph was also plotted to investigate the timings of all pollutants having strong relationships among one another (Fig. 5). The second group which showed the strong correlation was HCNO and (HOA + fullerene with the r2 value of 0.96). Isocyanic acid (HNCO) is another highly toxic, long-lived gas (lifetime of days to decades; Borduas et al., 2016) emitted from biomass burning (BB) with similar anthropogenic and biogenic sources as HCN. Alternative urban sources of HNCO are attributed to primary activity such as automotive emission (Jathar et al., 2017), residential heating (BB) (Woodward-Massey et al., 2014), and industrial processes (Sarkar et al., 2016), although it is clearly related to the bonfire event here. A reason for the close but not perfect relationship between the groups could be their same emission sources but at different stages of the burning during Bonfire Night, or possibly different bonfires in the region whose plumes arrived at the site at different times.
Another close correlation was the BC and MO-OOA factor with an r2 of 0.82 with HOA + fullerene. The reason for this high correlation is because of the very high concentration released during the bonfire event. In terms of sPON and hydrocarbon-like OA (traffic emissions), both show moderate correlation i.e. r2=0.64. The r2 in this case is much lower than the other grouping because traffic emissions are the primary source, not a secondary source, so their relationship is likely coincidental, maybe modulated by the boundary layer. The last group of pollutants having close correlation included pPON, Sr, and BBOA. In a previous research study (Reyes-Villegas et al., 2018), ME-2 analysis indicated the presence of two different types of PON, in which particularly pPON is primarily emitted along with BBOA concentrations. According to Zhang et al. (2016), pPON is related mainly to the primary sources of combustion.
4.2 Relative contributions of the different factors to the HR-SP-AMS signal and the BC budget
These results can be used to estimate the relative contributions of the different sources to the overall signal and the black carbon assuming that the divergence of the aerosol in the beam is the same for all particle types, and hence the efficiency is same for all particle types. Figure 6a illustrates the total signal fraction of BC accounted for by each BC source released during the bonfire event. The total signal fraction was obtained directly by the PMF analysis. The five factors have been divided into two different categories, i.e. bonfire factors and non-bonfire factors. The bonfire factors are HOA + fullerene and BBOA, while hydrocarbon-like OA and domestic burning are the non-bonfire sources, and BC & MO-OOA have contributions from both. The biggest contribution from the event was BBOA, contributing 54 % out of total signal fraction followed by traffic emissions (13 %), HOA + fullerene (11 %), BC & MO-OOA (9 %), and domestic burning (8 %). Figure 6b shows the mass fraction of only rBC (Cn peaks) from each PMF factor profile. The BC-only mass fraction was calculated by multiplying the total signal fraction with the fraction of rBC in each factor and then renormalising to 1. According to analysis, HOA + fullerene contributed the highest fraction, i.e. 42 %, followed by the non-bonfire factor hydrocarbon-like OA (traffic emissions) with a 27 % contribution. BC & MO-OOA and BBOA have 13 % and 10 % contributions respectively while domestic burning has the least part with 7 % only. Therefore, it has been clearly found that the two major sources of rBC are HOA + fullerene and traffic emissions. Figure 7 shows the quantitative data of BC signals in µg m−3 after scaling them to the AE31 eBC950 data. This time series was generated by following the same procedure for BC signal fraction out of total signal fraction and normalising to the total BC signal. According to the time series, rBC from HOA + fullerene and BBOA showed the highest signals during the bonfire night-time period followed by BC & MO-OOA, domestic burning, and traffic emissions.
This study has shown that for the first time, the inclusion of fullerene data in PMF applied to HR-SP-AMS data can be used to apportion soot into five sources during an event that superimposes emissions from a bonfire event over urban pollution. The five soot sources can be divided into Bonfire Night factors (HOA + fullerene, BBOA) and non-Bonfire Night factors (i.e. domestic wood-burning, hydrocarbon-like organic aerosol), with one factor exhibiting a contribution from both (BC and MO-OOA). Metals were also observed at the time of the fireworks display such as Fe, Ti, Cs, and Sr. But Sr was most unambiguously associated with the fireworks, due to the fact that there is no other Sr signal present outside of Bonfire Night. The addition of fullerene signals and a model error value of 0.10 was found to provide the best factorisation results. The fullerene data were successfully incorporated into rBC signals and linked with the bonfire emissions directly while Sr metal signals did not incorporate into rBC or any other factors, implying fireworks were not contributing significantly to the signal. Also, the inspection of the fullerene signals helped to differentiate between different factors. The results correlate well with the other BC and soot proxies provided by other instruments presented in previous papers and can be used to estimate the relative contributions of the different sources to total BC. This technique will be useful in future studies to better differentiate between the different soot sources in complex polluted environments.
Data are archived at the University of Manchester and available on request.
The supplement related to this article is available online at: https://doi.org/10.5194/acp-21-10763-2021-supplement.
ZB performed the data analysis and wrote the paper. JDA and PIW designed the experiment and operated the SP-AMS. ERV, MP, and CJP provided measurements and data from other instruments. ZB was supervised by JDA and HC, with ERV and JB assisting with PMF analysis.
The authors declare that they have no conflict of interest.
Publisher's note: Copernicus Publications remains neutral with regard to jurisdictional claims in published maps and institutional affiliations.
This research has been supported by the Natural Environment Research Council (COM-PART (grant no. NE/K014838/1)) and the University of Manchester, UK (Deans Scholarship Award). Zainab Bibi's PhD was funded by a Dean's Award Scholarship from the Faculty of Science and Engineering, University of Manchester, UK.
This paper was edited by Eleanor Browne and reviewed by two anonymous referees.
Aiken, A. C., DeCarlo, P. F., and Jimenez, J. L.: Elemental Analysis of Organic Species with Electron Ionization High-Resolution Mass Spectrometry, Anal. Chem., 79, 8350–8358, 2007.
Allan, J. D., Delia, A. E., Coe, H., Bower, K. N., Alfarra, M. R., Jimenez, J. L., Middlebrook, A. M., Drewnick, F., Onasch, T. B., Canagaratna, M. R., and Jayne, J. T.: A generalised method for the extraction of chemically resolved mass spectra from Aerodyne aerosol mass spectrometer data, J. Aerosol Sci., 35, 909–922, 2004.
Allan, J. D., Williams, P. I., Morgan, W. T., Martin, C. L., Flynn, M. J., Lee, J., Nemitz, E., Phillips, G. J., Gallagher, M. W., and Coe, H.: Contributions from transport, solid fuel burning and cooking to primary organic aerosols in two UK cities, Atmos. Chem. Phys., 10, 647–668, https://doi.org/10.5194/acp-10-647-2010, 2010.
Alfarra, M. R., Prevot, A. S. H., Szidat, S., Sandradewi, J., Weimer, S., Lanz, V. A., Schreiber, D., Mohr, M., and Baltensperger, U.: Identification of the mass spectral signature of organic aerosols from wood burning emissions, Environ. Sci. Technol., 41, 5770–5777, https://doi.org/10.1021/Es062289b, 2007.
Barescut, J. C., Gariel, J. C., Péres, J. M., Olivier, A., Tenailleau, L., Baron, Y., Maro, D., and Fontugne, M.: Measurement of the carbon 14 activity at natural level in air samples, Radioprotection, 40, S791–S796, 2005.
Bond, T. C., Zarzycki, C., Flanner, M. G., and Koch, D. M.: Quantifying immediate radiative forcing by black carbon and organic matter with the Specific Forcing Pulse, Atmos. Chem. Phys., 11, 1505–1525, https://doi.org/10.5194/acp-11-1505-2011, 2011.
Borduas, N., Place, B., Wentworth, G. R., Abbatt, J. P. D., and Murphy, J. G.: Solubility and reactivity of HNCO in water: insights into HNCO's fate in the atmosphere, Atmos. Chem. Phys., 16, 703–714, https://doi.org/10.5194/acp-16-703-2016, 2016.
Büchner, N., Ale-Agha, N., Jakob, S., Sydlik, U., Kunze, K., Unfried, K., Altschmied, J., and Haendeler, J.: Unhealthy diet and ultrafine carbon black particles induce senescence and disease associated phenotypic changes, Exp. Gerontol., 48, 8–16, 2013.
Bruns, E. A., Perraud, V., Zelenyuk, A., Ezell, M. J., Johnson, S. N., Yu, Y., Imre, D., Finlayson-Pitts, B. J., and Alexander, M. L.: Comparison of ftir and particle mass spectrometry for the measurement of particulate organic nitrates, Environ. Sci. Technol., 44, 1056–1061, https://doi.org/10.1021/es9029864, 2010.
Canagaratna, M. R., Jayne, J. T., Ghertner, D. A., Herndon, S., Shi, Q., Jimenez, J. L., Silva, P. J., Williams, P., Lanni, T., Drewnick, F., Demerjian, K. L., Kolb, C. E., and Worsnop, D. R.: Chase studies of particulate emissions from in-use new york city vehicles, Aerosol Sci. Tech., 38, 555–573, https://doi.org/10.1080/02786820490465504, 2004.
Canonaco, F., Crippa, M., Slowik, J. G., Baltensperger, U., and Prévôt, A. S. H.: SoFi, an IGOR-based interface for the efficient use of the generalized multilinear engine (ME-2) for the source apportionment: ME-2 application to aerosol mass spectrometer data, Atmos. Meas. Tech., 6, 3649–3661, https://doi.org/10.5194/amt-6-3649-2013, 2013.
Cao, J., Xu, H., Xu, Q., Chen, B., and Kan, H.: Fine particulate matter constituents and cardiopulmonary mortality in a heavily polluted Chinese city, Environ. Health Persp., 120, 373–378, 2012.
Carbone, S., Onasch, T., Saarikoski, S., Timonen, H., Saarnio, K., Sueper, D., Rönkkö, T., Pirjola, L., Häyrinen, A., Worsnop, D., and Hillamo, R.: Characterization of trace metals on soot aerosol particles with the SP-AMS: detection and quantification, Atmos. Meas. Tech., 8, 4803–4815, https://doi.org/10.5194/amt-8-4803-2015, 2015.
Carslaw, D. C. and Ropkins, K.: Openair – an R package for air quality data analysis, Environ. Modell. Softw., 27, 52–61, 2012.
Chirico, R., DeCarlo, P. F., Heringa, M. F., Tritscher, T., Richter, R., Prévôt, A. S. H., Dommen, J., Weingartner, E., Wehrle, G., Gysel, M., Laborde, M., and Baltensperger, U.: Impact of aftertreatment devices on primary emissions and secondary organic aerosol formation potential from in-use diesel vehicles: results from smog chamber experiments, Atmos. Chem. Phys., 10, 11545–11563, https://doi.org/10.5194/acp-10-11545-2010, 2010.
Clark, H.: New directions. Light blue touch paper and retire, Atmos. Environ., 31, 2893–2894, https://doi.org/10.1016/s1352-2310(97)88278-7, 1997.
Cooke, W. F., Liousse, C., Cachier, H., and Feichter, J.: Construction of a 1∘ × 1∘ fossil fuel emission data set for carbonaceous aerosol and implementation and radiative impact in the ECHAM4 model, J. Geophys. Res., 104, 22137–22162, 1999.
Crippa, M., Canonaco, F., Slowik, J. G., El Haddad, I., DeCarlo, P. F., Mohr, C., Heringa, M. F., Chirico, R., Marchand, N., Temime-Roussel, B., Abidi, E., Poulain, L., Wiedensohler, A., Baltensperger, U., and Prévôt, A. S. H.: Primary and secondary organic aerosol origin by combined gas-particle phase source apportionment, Atmos. Chem. Phys., 13, 8411–8426, https://doi.org/10.5194/acp-13-8411-2013, 2013.
Crippa, M., Canonaco, F., Lanz, V. A., Äijälä, M., Allan, J. D., Carbone, S., Capes, G., Ceburnis, D., Dall'Osto, M., Day, D. A., DeCarlo, P. F., Ehn, M., Eriksson, A., Freney, E., Hildebrandt Ruiz, L., Hillamo, R., Jimenez, J. L., Junninen, H., Kiendler-Scharr, A., Kortelainen, A.-M., Kulmala, M., Laaksonen, A., Mensah, A. A., Mohr, C., Nemitz, E., O'Dowd, C., Ovadnevaite, J., Pandis, S. N., Petäjä, T., Poulain, L., Saarikoski, S., Sellegri, K., Swietlicki, E., Tiitta, P., Worsnop, D. R., Baltensperger, U., and Prévôt, A. S. H.: Organic aerosol components derived from 25 AMS data sets across Europe using a consistent ME-2 based source apportionment approach, Atmos. Chem. Phys., 14, 6159–6176, https://doi.org/10.5194/acp-14-6159-2014, 2014.
Colbeck, I. and Chung, M.-C.: Ambient aerosol concentrations at a site in se england during bonfire night 1995, J. Aerosol Sci., 27, S449–S450, https://doi.org/10.1016/0021-8502(96)00297-2, 1996.
Collaud Coen, M., Weingartner, E., Apituley, A., Ceburnis, D., Fierz-Schmidhauser, R., Flentje, H., Henzing, J. S., Jennings, S. G., Moerman, M., Petzold, A., Schmid, O., and Baltensperger, U.: Minimizing light absorption measurement artifacts of the Aethalometer: evaluation of five correction algorithms, Atmos. Meas. Tech., 3, 457–474, https://doi.org/10.5194/amt-3-457-2010, 2010.
Comero, S., Capitani, L., and Gawlik, B. M.: Positive Matrix Factorisation (PMF)–An introduction to the chemometric evaluation of environmental monitoring data using PMF, Office for Official Publications of the European Communities, Luxembourg, 59 pp., 2009.
Corbin, J. C., Othman, A., Allan, J. D., Worsnop, D. R., Haskins, J. D., Sierau, B., Lohmann, U., and Mensah, A. A.: Peak-fitting and integration imprecision in the Aerodyne aerosol mass spectrometer: effects of mass accuracy on location-constrained fits, Atmos. Meas. Tech., 8, 4615–4636, https://doi.org/10.5194/amt-8-4615-2015, 2015.
Dachs, J. and Eisenreich, S. J.: Adsorption onto aerosol soot carbon dominates gas-particle partitioning of polycyclic aromatic hydrocarbons Environ. Sci. Technol., 34, 3690–3697, 2000.
DeCarlo, P. F., Kimmel, J. R., Trimborn, A., Northway, M. J., Jayne, J. T., Aiken, A. C., Gonin, M., Fuhrer, K., Horvath, T., Docherty, K. S., Worsnop, D. R., and Jimenez, J. L.: Fielddeployable, high-resolution, time-of-flight aerosol mass spectrometer, Anal. Chem., 78, 8281–8289, 2006.
Dyke, P., Coleman, P., and James, R.: Dioxins in ambient air, bonfire night 1994, Chemosphere, 34, 1191–1201, 1997.
Farrar, N. J., Smith, K. E. C., Lee, R. G. M., Thomas, G. O., Sweetman, A. J., and Jones, K. C.: Atmospheric emissions of polybrominated diphenyl ethers and other persistent organic pollutants during a major anthropogenic combustion event, Environ. Sci. Technol., 38, 1681–1685, https://doi.org/10.1021/es035127d, 2004.
Fortner, E. C., Brooks, W. A., Onasch, T. B., Canagaratna, M. R., Massoli, P., Jayne, J. T., Franklin, J. P., Knighton, W. B., Wormhoudt, J., Worsnop, D. R., Kolb, C. E., and Herndon, S. C.: Particulate Emissions Measured During the TCEQ Comprehensive Flare Emission Study, Ind. Eng. Chem. Res., 51, 12586–12592, 2012.
Gerhardt, P., Loffler, S., and Homann, K. H.: The formation of polyhedral carbon ions in fuel-rich acetylene and benzene flames, in: 22nd Symp. (Int.) on Combustion, Combustion Inst., Pittsburgh, 395–401, 1988.
Grahame, T. J. and Schlesinger, R. B.: Cardiovascular health and particulate vehicular emissions: a critical evaluation of the evidence, Air Qual. Atmos. Hlth., 1, 3–27, 2010.
Hansen, A. D. A., Rosen, H., and Novakov, T.: The Aethalometer – An instrument for the real-time measurement of optical absorption by aerosol particles, Sci. Total Environ., 36, 191–196, 1984.
Haslett, S. L., Thomas, J. C., Morgan, W. T., Hadden, R., Liu, D., Allan, J. D., Williams, P. I., Keita, S., Liousse, C., and Coe, H.: Highly controlled, reproducible measurements of aerosol emissions from combustion of a common African biofuel source, Atmos. Chem. Phys., 18, 385–403, https://doi.org/10.5194/acp-18-385-2018, 2018.
Hellborg, R., Faarinen, M., Kiisk, M., Magnusson, C. E., Persson, P., Skog, G., and Stenström, K.: Accelerator mass spectronomy-an overview, Vacuum, 70, 365–372, 2003.
Highwood, E. J. and Kinnersley, R. P.: When smoke gets in our eyes: The multiple impacts of atmospheric black carbon on climate, air quality and health, Environ. Int., 32, 560–566, 2006.
Janssen, N. A. and WHO Joint: Health effects of black carbon, 1–86, WHO Regional Office for Europe, Copenhagen, 2012.
Jathar, S. H., Heppding, C., Link, M. F., Farmer, D. K., Akherati, A., Kleeman, M. J., de Gouw, J. A., Veres, P. R., and Roberts, J. M.: Investigating diesel engines as an atmospheric source of isocyanic acid in urban areas, Atmos. Chem. Phys., 17, 8959–8970, https://doi.org/10.5194/acp-17-8959-2017, 2017.
Kroto, H. W., Heath, J. R., O'Brien, S. C., Curl, R. F., and Smalley, R. E.: C60: Buckminsterfullerene, Nature, 318, 162–163, 1985.
Lanz, V. A., Alfarra, M. R., Baltensperger, U., Buchmann, B., Hueglin, C., Szidat, S., Wehrli, M. N., Wacker, L., Weimer, S., Caseiro, A., and Puxbaum, H.: Source Attribution of Submicron Organic Aerosols During Wintertime Inversions by Advanced Factor Analysis of Aerosol Mass Spectra, Environ. Sci. Technol., 42, 214–220, 2008.
Le Breton, M., Bacak, A., Muller, J. B. A., O'Shea, S. J., Xiao, P., Ashfold, M. N. R., Cooke, M. C., Batt, R., Shallcross, D. E., Oram, D. E., Forster, G., Bauguitte, S. J.-B., Palmer, P. I., Parrington, M., Lewis, A. C., Lee, J. D., and Percival, C. J.: Airborne hydrogen cyanide measurements using a chemical ionisation mass spectrometer for the plume identification of biomass burning forest fires, Atmos. Chem. Phys., 13, 9217–9232, https://doi.org/10.5194/acp-13-9217-2013, 2013.
Lemieux, P. M., Lutes, C. C., and Santoianni, D. A.: Emissions of organic air toxics from open burning: a comprehensive review, Prog. Energ. Combust., 30, 1–32, 2004.
Lin, P., Huang, X.-F., He, L.-Y., and Yu, J.-Z.: Abundance and size distribution of HULIS in ambient aerosols at a rural site in South China, J. Aerosol Sci., 41, 74–87, 2010.
Liu, D., Whitehead, J., Alfarra, M. R., Reyes-Villegas, E., Spracklen, D. V., Reddington, C. L., Kong, S., Williams, P. I., Ting, Y.-C., Haslett, S., Taylor, J. W., Flynn, M. J., Morgan, W. T., McFiggans, G., Coe, H., and Allan, J. D.: Black-carbon absorption enhancement in the atmosphere determined by particle mixing state, Nat. Geosci., 10, 184–188, https://doi.org/10.1038/ngeo2901, 2017.
Liu, D., Joshi, R., Wang, J., Yu, C., Allan, J. D., Coe, H., Flynn, M. J., Xie, C., Lee, J., Squires, F., Kotthaus, S., Grimmond, S., Ge, X., Sun, Y., and Fu, P.: Contrasting physical properties of black carbon in urban Beijing between winter and summer, Atmos. Chem. Phys., 19, 6749–6769, https://doi.org/10.5194/acp-19-6749-2019, 2019.
Lobert, J. M., Keene, W. C., Logan, J. A., and Yevich, R.: Global chlorine emissions from biomass burning: Reactive chlorine emissions inventory, J. Geophys. Res.-Atmos., 104, 8373–8389, 1999.
Mari, M., Harrison, R. M., Schuhmacher, M., Domingo, J. L., and Pongpiachan, S.: Inferences over the sources and processes affecting polycyclic aromatic hydrocarbons in the atmosphere derived from measured data, Sci. Total Environ., 408, 2387–2393, 2010.
Martinsson, J.: Using the Aethalometer for Source Apportionment of Carbonaceous Aerosols, Lund University, Division of Nuclear Physics, 2014.
Mclain, J.: Pyrotechnics: From the viewpoint of solid-state chemistry (Book), Philadelphia, Pa., Franklin Institute Press, 1980.252, 1980.
Onasch, T. B., Trimborn, A., Fortner, E. C., Jayne, J. T., Kok, G. L., Williams, L. R., Davidovits, P., and Worsnop, D. R: Soot particle aerosol mass spectrometer: development, validation, and initial application, Aerosol Sci. Tech., 46, 804–817, 2012.
Onasch, T. B., Fortner, E. C., Trimborn, A. M., Lambe, A. T., Tiwari, A. J., Marr, L. C., Corbin, J. C., Mensah, A. A., Williams, L. R., Davidovits, P., and Worsnop, D. R.: Investigations of SP-AMS carbon ion distributions as a function of refractory black carbon particle type, Aerosol Sci. Tech., 49, 409–422, 2015.
Paatero, P. and Hopke, P. K.: Discarding or down-weighting high-noise variables in factor analytic models, Anal. Chim. Acta, 490, 277–289, 2003.
Paatero, P. and Tapper, U.: Positive matrix factorisation: A non-negative factor model with optimal utilisation of error estimates of data values, Environmetrics, 5, 111–126, 1994.
Paatero, P., Hopke, P. K., Song, X. H., and Ramadan, Z.: Understanding and Controlling Rotations in Factor Analytic Models, Chemom. Intell. Lab. Syst., 60, 253–264, 2002.
Petzold, A., Ogren, J. A., Fiebig, M., Laj, P., Li, S.-M., Baltensperger, U., Holzer-Popp, T., Kinne, S., Pappalardo, G., Sugimoto, N., Wehrli, C., Wiedensohler, A., and Zhang, X.-Y.: Recommendations for reporting “black carbon” measurements, Atmos. Chem. Phys., 13, 8365–8379, https://doi.org/10.5194/acp-13-8365-2013, 2013.
Pongpiachan, S., Tipmanee, D., Khumsup, C., Kittikoon, I., and Hirunyatrakul, P.: Assessing risks to adults and preschool children posed by PM2.5-bound polycyclic aromatic hydrocarbons (pahs) during a biomass burning episode in Northern Thailand, Sci. Total Environ., 508, 435–444, 2015.
Priestley, M., Breton, M. L., Bannan, T. J., Leather, K. E., Bacak, A., Reyes-Villegas, E., Vocht, F. D., Shallcross, B. M. A., Brazier, T., Khan, M. A., Allan, J., Shallcross, D. E., Coe, H., and Percival, C. J.: Observations of isocyanate, amide, nitrate, and nitro compounds from an anthropogenic biomass burning event using a ToF-CIMS, J. Geophys. Res.-Atmos., 123, 7687–7704, 2018.
Reilly, P. T. A., Gieray, R. A., Whitten, W. B., and Ramsey, J. M.: Fullerene Evolution in Flame-Generated Soot, J. Am. Chem. Soc., 122, 11596–11601, 2000.
Reyes-Villegas, E., Green, D. C., Priestman, M., Canonaco, F., Coe, H., Prévôt, A. S. H., and Allan, J. D.: Organic aerosol source apportionment in London 2013 with ME-2: exploring the solution space with annual and seasonal analysis, Atmos. Chem. Phys., 16, 15545–15559, https://doi.org/10.5194/acp-16-15545-2016, 2016.
Reyes-Villegas, E., Priestley, M., Ting, Y.-C., Haslett, S., Bannan, T., Le Breton, M., Williams, P. I., Bacak, A., Flynn, M. J., Coe, H., Percival, C., and Allan, J. D.: Simultaneous aerosol mass spectrometry and chemical ionisation mass spectrometry measurements during a biomass burning event in the UK: insights into nitrate chemistry, Atmos. Chem. Phys., 18, 4093–4111, https://doi.org/10.5194/acp-18-4093-2018, 2018.
Rivellini, L.-H., Adam, M. G., Kasthuriarachchi, N., and Lee, A. K. Y.: Characterization of carbonaceous aerosols in Singapore: insight from black carbon fragments and trace metal ions detected by a soot particle aerosol mass spectrometer, Atmos. Chem. Phys., 20, 5977–5993, https://doi.org/10.5194/acp-20-5977-2020, 2020.
Saarikoski, S., Carbone, S., Cubison, M. J., Hillamo, R., Keronen, P., Sioutas, C., Worsnop, D. R., and Jimenez, J. L.: Evaluation of the performance of a particle concentrator for online instrumentation, Atmos. Meas. Tech., 7, 2121–2135, https://doi.org/10.5194/amt-7-2121-2014, 2014.
Sandradewi, J., Prévôt, A. S., Szidat, S., Perron, N., Alfarra, M. R., Lanz, V. A., Weingartner, E., and Baltensperger, U.: Using aerosol light absorption measurements for the quantitative determination of wood burning and traffic emission contributions to particulate matter, Environ. Sci. Technol., 42, 3316–3323, 2008.
Sarkar, C., Sinha, V., Kumar, V., Rupakheti, M., Panday, A., Mahata, K. S., Rupakheti, D., Kathayat, B., and Lawrence, M. G.: Overview of VOC emissions and chemistry from PTR-TOF-MS measurements during the SusKat-ABC campaign: high acetaldehyde, isoprene and isocyanic acid in wintertime air of the Kathmandu Valley, Atmos. Chem. Phys., 16, 3979–4003, https://doi.org/10.5194/acp-16-3979-2016, 2016.
Shi, Y. L., Zhang, N., Gao, J. M., Li, X., and Cai, Y. Q.: Effect of fireworks display on perchlorate in air aerosols during the Spring Festival, Atmos. Environ., 45, 1323–1327, 2011.
Sun, Y. L., Wang, Z. F., Fu, P. Q., Yang, T., Jiang, Q., Dong, H. B., Li, J., and Jia, J. J.: Aerosol composition, sources and processes during wintertime in Beijing, China, Atmos. Chem. Phys., 13, 4577–4592, https://doi.org/10.5194/acp-13-4577-2013, 2013.
Ulbrich, I. M., Canagaratna, M. R., Zhang, Q., Worsnop, D. R., and Jimenez, J. L.: Interpretation of organic components from Positive Matrix Factorization of aerosol mass spectrometric data, Atmos. Chem. Phys., 9, 2891–2918, https://doi.org/10.5194/acp-9-2891-2009, 2009.
US EPA (US Environmental Protection Agency): Report to Congress on Black Carbon March 2012 Department of the Interior, Environment, and Related Agencies Appropriations Act, 2010, 2012.
Wang, J., Onasch, T.B., Ge, X., Collier, S., Zhang, Q., Sun, Y., Yu, H., Chen, M., Prévôt, A.S. and Worsnop, DR: Observation of fullerene soot in eastern China, Environ. Sci. Technol. Lett., 3, 121–126, 2016.
Wang, L. W., Wen, L., Xu, C. H., Chen, J. M., Wang, X. F., Yang, L. X., Wang, W. X., Yang, X., Sui, X., Yao, L., and Zhang, Q. Z.: Hono and its potential source particulate nitrite at an urban site in north china during the cold season, Sci. Total Environ., 538, 93–101, https://doi.org/10.1016/j.scitotenv.2015.08.032, 2015.
Woodward-Massey, R., Taha, Y. M., Moussa, S. G., and Osthoff, H. D.: Comparison of negative-ion proton-transfer with iodide ion chemical ionisation mass spectrometry for quantification of isocyanic acid in ambient air, Atmos. Environ., 98, 693–703, https://doi.org/10.1016/j.atmosenv.2014.09.014, 2014.
Zhang, J. K., Cheng, M. T., Ji, D. S., Liu, Z. R., Hu, B., Sun, Y., and Wang, Y. S.: Characterisation of submicron particles during biomass burning and coal combustion periods in Beijing, China, Sci. Total Environ., 562, 812–821, https://doi.org/10.1016/j.scitotenv.2016.04.015, 2016.
Zhang, Q., Alfarra, M. R., Worsnop, D. R., Allan, J. D., Coe, H., Canagaratna, M. R., and Jimenez, J. L.: Deconvolution and Quantification of Hydrocarbon-Like and Oxygenated Organic Aerosols Based on Aerosol Mass Spectrometry, Environ. Sci. Technol., 39, 4938–4952, 2005.
Zhang, X. L., Lin, Y. H., Surratt, J. D., Zotter, P., Prevot, A. S. H., and Weber, R. J.: Light absorbing soluble organic aerosol in Los Angeles and Atlanta: A contrast in secondary organic aerosol, Geophys. Res. Lett., 38, L21810, https://doi.org/10.1029/2011GL049385, 2011.
Zhu, Q., Huang, X.-F., Cao, L.-M., Wei, L.-T., Zhang, B., He, L.-Y., Elser, M., Canonaco, F., Slowik, J. G., Bozzetti, C., El-Haddad, I., and Prévôt, A. S. H.: Improved source apportionment of organic aerosols in complex urban air pollution using the multilinear engine (ME-2), Atmos. Meas. Tech., 11, 1049–1060, https://doi.org/10.5194/amt-11-1049-2018, 2018.