the Creative Commons Attribution 4.0 License.
the Creative Commons Attribution 4.0 License.
 | 27 Jan 2021
The CLoud–Aerosol–Radiation Interaction and Forcing: Year 2017 (CLARIFY-2017) measurement campaign
Steven J. Abel
Paul A. Barrett
Nicolas Bellouin
Alan Blyth
Keith N. Bower
Melissa Brooks
Ken Carslaw
Haochi Che
Michael I. Cotterell
Ian Crawford
Zhiqiang Cui
Nicholas Davies
Beth Dingley
Paul Field
Paola Formenti
Hamish Gordon
Martin de Graaf
Ross Herbert
Ben Johnson
Anthony C. Jones
Justin M. Langridge
Florent Malavelle
Daniel G. Partridge
Fanny Peers
Jens Redemann
Philip Stier
Kate Szpek
Jonathan W. Taylor
Duncan Watson-Parris
Robert Wood
Huihui Wu
Paquita Zuidema
The representations of clouds, aerosols, and cloud–aerosol–radiation impacts remain some of the largest uncertainties in climate change, limiting our ability to accurately reconstruct past climate and predict future climate. The south-east Atlantic is a region where high atmospheric aerosol loadings and semi-permanent stratocumulus clouds are co-located, providing an optimum region for studying the full range of aerosol–radiation and aerosol–cloud interactions and their perturbations of the Earth's radiation budget. While satellite measurements have provided some useful insights into aerosol–radiation and aerosol–cloud interactions over the region, these observations do not have the spatial and temporal resolution, nor the required level of precision to allow for a process-level assessment. Detailed measurements from high spatial and temporal resolution airborne atmospheric measurements in the region are very sparse, limiting their use in assessing the performance of aerosol modelling in numerical weather prediction and climate models. CLARIFY-2017 was a major consortium programme consisting of five principal UK universities with project partners from the UK Met Office and European- and USA-based universities and research centres involved in the complementary ORACLES, LASIC, and AEROCLO-sA projects. The aims of CLARIFY-2017 were fourfold: (1) to improve the representation and reduce uncertainty in model estimates of the direct, semi-direct, and indirect radiative effect of absorbing biomass burning aerosols; (2) to improve our knowledge and representation of the processes determining stratocumulus cloud microphysical and radiative properties and their transition to cumulus regimes; (3) to challenge, validate, and improve satellite retrievals of cloud and aerosol properties and their radiative impacts; (4) to improve the impacts of aerosols in weather and climate numerical models. This paper describes the modelling and measurement strategies central to the CLARIFY-2017 deployment of the FAAM BAe146 instrumented aircraft campaign, summarizes the flight objectives and flight patterns, and highlights some key results from our initial analyses.
- Article
(13125 KB) - Full-text XML
- BibTeX
- EndNote


The interactions of clouds, aerosols, and radiation are highlighted as key climate uncertainties in the most recent Intergovernmental Panel on Climate Change (IPCC) assessment report (Boucher et al., 2013). Aerosol–radiation interactions stem from direct scattering and absorption of solar and terrestrial radiation by aerosols, thereby changing the planetary albedo. Aerosol–cloud interactions, also termed indirect effects, arise from aerosols acting as cloud condensation nuclei (CCN) or ice nuclei in clouds. An increase in the number of activated CCN for fixed liquid water path translates into larger concentrations of smaller cloud droplets, increasing cloud albedo (Twomey, 1977). Both aerosol–radiation and aerosol–cloud interactions trigger fast adjustments to the profiles of temperature, moisture, and cloud water content, which ultimately may affect cloud formation and precipitation rates and cloud lifetime (e.g. Albrecht, 1989; Pincus and Baker, 1994; Johnson et al., 2004). The quantification of interactions in the cloud–aerosol–radiation system remains elusive. The recent IPCC report (Boucher et al., 2013) stresses that aerosol climate impacts remain the largest uncertainty in driving climate change, with a global mean effective forcing of W m−2 for aerosol–radiation interaction and in the range of 0.0 to −0.9 W m−2 for aerosol–cloud interaction, thereby counterbalancing a significant, but poorly constrained, fraction of greenhouse gas-induced global warming, which is estimated to be W m−2 (Myhre et al., 2013a). This uncertainty impacts our ability to attribute climate change and to quantify climate sensitivity and therefore to improve the accuracy of future climate change projections. In regions with strong anthropogenic influences, aerosol radiative forcings are an order of magnitude larger than their global mean values, limiting our ability to provide reliable regional climate projections.
Biomass burning smoke aerosol (BBA) consists of complex organic carbon compounds mixed with black carbon (BC) and inorganic species such as nitrate and sulfate. Black carbon is a strong absorber of sunlight (e.g. Shindell et al., 2012; Bond et al., 2013), and certain organic compounds (so-called “brown” carbon) also absorb sunlight, particularly at shorter UV wavelengths (e.g. Andreae and Gelencsér, 2006). BBA is an important component of anthropogenic aerosol and is produced from fires associated with deforestation, savannah burning, agricultural waste, and domestic biofuels, with global emissions estimated to have increased by 25 % since pre-industrial times (Lamarque et al., 2010). The African continent is the largest global source of BBA, currently contributing around 2–29 Tg[C] yr−1 (with [C] indicating that this emission rate corresponds to that of carbon) or 50 % of global emissions (e.g. van der Werf et al., 2010; Bond et al., 2013). The meteorological transport of BBA over southern Africa during the dry season is dominated by an anticyclonic circulation, with westward transport on the northern periphery and eastward transport on the southern periphery (Adebiyi and Zuidema, 2016; Swap et al., 2002; Garstang et al., 1996). Over the continent, vertical mixing is inhibited by stable layers at the top of the continental boundary layer and by the main subsidence inversion (around 5–6 km a.s.l. – above sea level) (Harrison, 1993; Garstang et al., 1996).
Over the south-east (SE) Atlantic, the BBA in the residual continental boundary layer (CBL) overrides the marine boundary layer (MBL) where low sea-surface temperatures and large-scale subsidence give rise to persistent stratocumulus cloud, as evidenced in Fig. 1 that shows the climatology of cloud fraction and aerosol optical depth (AOD). A large temperature inversion may inhibit mixing between the BBA in the elevated residual CBL and the marine boundary layer, which, in turn, may limit the interaction with the clouds. However, prior to CLARIFY-2017, the degree of aerosol–cloud interaction was highly uncertain, highlighting the need for comprehensive in situ measurements.

Figure 12003–2011 mean August–October AODs at 550 nm (coloured contours) retrieved from the MODIS satellite, MODIS cloud fraction (black and white colour scale), and Global Fire Emissions Dataset (GFED) aerosol emission estimates (colours over land). The yellow star shows the position of Ascension Island, with a dashed circle representing the approximate operating range of the FAAM aircraft. The position of São Tomé, where ORACLES operations were performed, and Walvis Bay, where both ORACLES and AEROCLO-sA operations were performed, is marked by red and green stars respectively.
While developing the scientific rationale for CLARIFY-2017, it became obvious that interest in aerosol–cloud and aerosol–radiation interactions in the SE Atlantic region extended well beyond the UK community. Not only were additional European project partners entrained into CLARIFY-2017, but synergistic measurement campaigns planned by other multi-national research groups were also developed. Of specific complementary synergy were the following:
-
LASIC (Layered Atlantic Smoke Interactions with Clouds), which deployed a large suite of surface-based observations via the Atmospheric Radiation Measurement (ARM) Mobile Facility (AMF; https://www.arm.gov/capabilities/observatories/amf, last access: January 2021) to Ascension Island between July 2016–October 2017 (Zuidema et al., 2018a);
-
ORACLES (ObseRvations of Aerosols above CLouds and their intEractionS), which deployed the high-altitude ER2 and heavily instrumented P3 aircraft to Walvis Bay, Namibia, in September 2016 and the P3 alone to São Tomé in August 2017 and October 2018 (Redemann et al., 2020);
-
AEROCLO-sA (AErosol, RadiatiOn and CLOuds in southern Africa), which deployed a surface mobile platform and the instrumented French Falcon 20 environmental research aircraft of Safire in Henties Bay and Walvis Bay, respectively, in 2017 (Formenti et al., 2019).
All of these measurement campaigns comprised major deployments of research assets to the South Atlantic region during 2017 (Zuidema et al., 2016). The location of these campaigns is summarized in Fig. 1. The scientific steering committees of the four synergistic projects frequently included members from the other projects. Planning teams from CLARIFY-2017, ORACLES, LASIC, and AEROCLO-sA kept in close contact during their planning, deployment, and analysis phases, which led to many benefits such as forecast model sharing, joint special sessions at the EGU and AGU, and a mutual physically located workshop in Paris and a virtual workshop in Miami (owing to Covid-19 travel restrictions) dedicated to cross-campaign collaboration. An intercomparison flight was performed between the FAAM BAe146 aircraft and the NASA P3 aircraft when both were operating from Ascension Island during 2017, allowing for an assessment and intercomparison of the performance characteristics of the aircraft instruments (Barrett et al., 2021a).
We acknowledge here that the results from CLARIFY-2017, ORACLES, LASIC, and AEROCLO-sA campaigns are already starting to appear in the scientific literature, particularly as part of this thematic special issue. This section lays out the original motivation of the CLARIFY-2017 campaign prior to intensive modelling and observations. We defer a discussion of these various studies to later sections of this work.
1.1 Aerosol–radiation interactions (ARI)
On a global mean basis, BBA is estimated to exert a neutral direct radiative forcing of −0.1 to +0.1 W m−2 (Boucher et al., 2013). Even the sign of the global mean direct radiative forcing is in doubt because the single scattering albedo (SSA, the ratio of optical attenuation coefficients for scattering and extinction) of BBAs is close to the balance point between net reflection and net absorption of sunlight (e.g. Haywood and Shine, 1995). However, regionally, BBA plays a far more important role: nowhere is the uncertainty in the direct radiative effect and forcing more apparent than over the SE Atlantic than during the August–September dry season (Fig. 2).
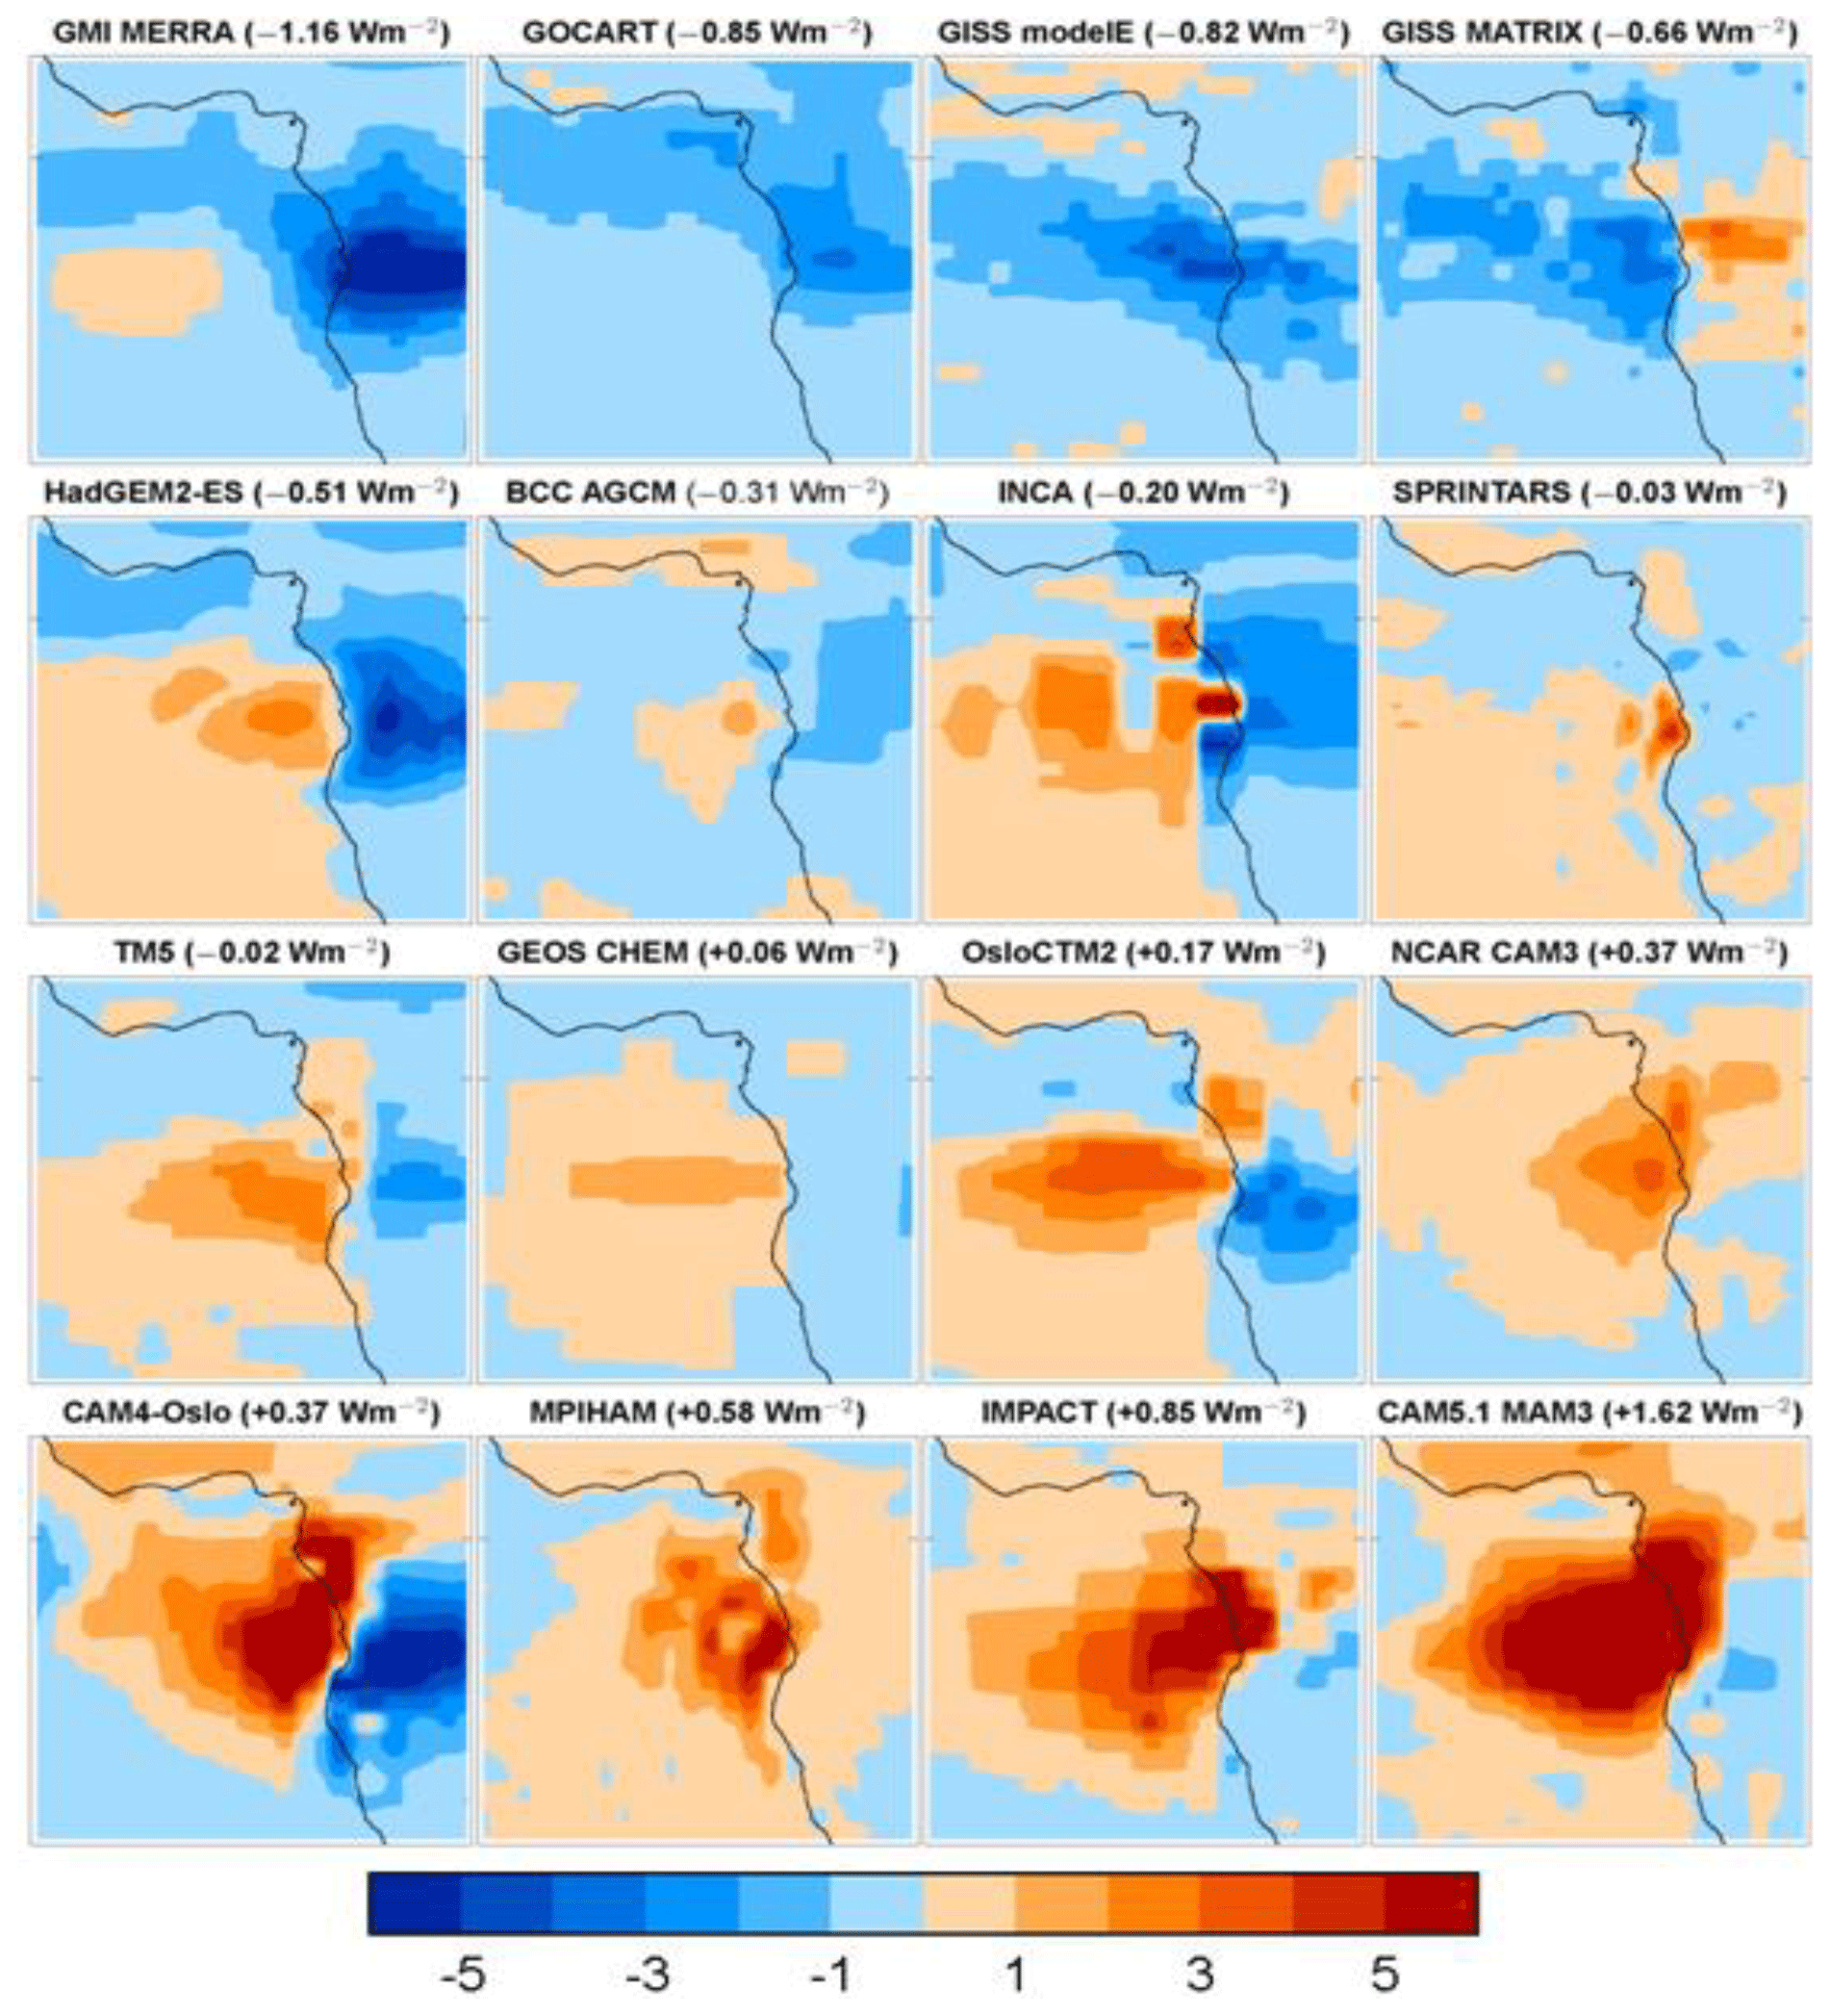
Figure 2The annual mean direct radiative forcing (aerosol–radiation interaction) of BBA calculated by 16 different AEROCOM models. Units are W m−2. The most negative radiative forcing is in the top left-hand corner, while the most positive radiative forcing is the bottom right-hand corner. Reproduced according to Zuidema et al. (2016).
Figure 2 shows the “direct” radiative effect derived from models participating in AEROCOM (Myhre et al., 2013b; Stier et al., 2013), indicating a regional hotspot for BBA forcing over the SE Atlantic but with significant uncertainty because BBA can exist either above the stratocumulus, decreasing the planetary albedo, or above open ocean, where it increases the planetary albedo. To accurately model the aerosol direct effect, models need to represent all of the following correctly: the magnitude and geographic distribution of the AOD, the wavelength-dependent SSA, the BBA vertical profile, the geographic distribution of the cloud, the cloud fraction, the cloud liquid water content, the cloud droplet effective radii, and the cloud vertical profile (Keil and Haywood, 2003; Abel et al., 2005; Samset et al., 2013; Stier et al., 2013). At a more detailed aerosol process level, we need to understand the optical properties of black carbon, organic carbon, and inorganic compounds as a function of mixing state and how these properties vary as a function of altitude and relative humidity and as a function of ageing from emission to deposition.
Another implication of BBA overlying cloud is that satellite retrievals of cloud that rely on visible wavelengths are generally biased low in cloud optical depth (COD) and effective radius (e.g. Hsu et al., 2003; Haywood et al., 2004; Wilcox and Platnick, 2009), with implications for remotely sensed correlative studies of aerosol–cloud interactions (Quaas et al., 2008). Recently, de Graaf et al. (2012) used high spectral resolution satellite data to show that the direct radiative effect of BBA over clouds in the SE Atlantic region could be stronger than +130 W m−2 instantaneously and +23 W m−2 in the monthly mean. These values are far stronger than those diagnosed in climate models which reach only +50 W m−2 instantaneously (e.g. de Graaf et al., 2014), suggesting that models misrepresent at least one of the key parameters noted above.
A further aerosol–radiation interaction occurs as a fast adjustment to the direct effect and is called the semi-direct effect (SDE), whereby the heating of the absorbing BBA layer and the reduction in surface temperature modify the atmospheric stability, surface fluxes, clouds, and hence radiation. Satellite observations over southern Atlantic stratocumulus have shown a thickening of cloud underlying BBA (Wilcox, 2012; Costantino and Breon, 2013), which could be a result of heating of the above-cloud column intensifying the cloud top inversion and reducing entrainment. Wilcox (2012) estimated that this produced a negative radiative effect that compensated for 60 % of the above-cloud positive direct effect. Large eddy model (LEM) simulations have been used to explore the detailed mechanisms of the semi-direct effect (e.g. Johnson et al., 2004; Hill and Dobbie, 2008) although they typically have relatively small domain sizes and therefore cannot account for the impact of aerosol in modifying synoptic-scale circulations. Global modelling studies are able to represent impacts on synoptic- and regional-scale dynamics and circulation patterns (e.g. Allen and Sherwood, 2010; Randles and Ramaswamy, 2010) but are unable to represent the detailed process-level mechanisms captured by LEMs. Studies in LEMs and global climate models have emphasized the importance of the vertical profile of aerosol and the degree of absorption (Johnson, 2004; Randles and Ramaswamy, 2010; Samset et al., 2013). Randles and Ramaswamy (2010) and Allen and Sherwood (2010) document the response to the semi-direct effect via atmospheric impacts on stabilization, reduced surface fluxes, and subsequent evolution of the modelled dynamical impacts. Johnson (2004) found the semi-direct effect to be 5 times smaller in global-scale models compared to LEMs, although these results are challenged by Allen and Sherwood (2010). In addition, internal variability masks local semi-direct effects, severely decreasing the statistical significance in previous studies of modelled semi-direct effects (e.g. Ghan et al., 2012) and our ability to assess their fidelity.
1.2 Aerosol–cloud interactions (ACI)
Despite considerable advances in modelling clouds using models of different resolutions, considerable uncertainties remain in modelling even the relatively simple cases of stratocumulus, owing to uncertainties in precipitation, decoupling, moisture budgets, and entrainment. Unsurprisingly, climate models show considerable inter-model biases in cloud fraction, liquid water path, effective radius, and COD when compared against satellite observations, leading to large discrepancies in the solar fluxes and hence the energy absorbed by the ocean in the region (e.g. Bodas-Salcedo et al., 2014).
Aerosol–cloud interactions, or “indirect effects”, remain one of the most elusive but key parameters in climate prediction (Stevens and Feingold, 2009; Boucher et al., 2013). For stratocumulus, the effect of increased CCN leading to cloud brightening can be modulated by changes in precipitation and subsequent changes to cloud water amounts through entrainment processes (e.g. Ackerman et al., 2004). Satellite-borne lidar studies of aerosol–cloud interactions in the region emphasize the critical role of the vertical profile of aerosol and cloud (Costantino and Breon, 2013) and the relative position of the two to each other (Chand et al., 2009). However, it is difficult to fully discern the level of interaction between clouds and aerosols because of the sensitivity of lidars in the free troposphere (Watson-Parris et al., 2018) and the attenuating effects of a thick layer of aerosols overlying clouds. Global bulk aerosol models and empirical representations of aerosol indirect effects are being replaced with microphysical aerosol models such as ECHAM5-HAM (Stier et al., 2005) and GLOMAP (also known as UKCA mode) (e.g. Mann et al., 2010; Bellouin et al., 2013), and more explicit representations of cloud and precipitation processes (Hill et al., 2015; Grosvenor et al., 2017) have also been developed. Such schemes require extensive evaluation, which is often achieved through multi-model intercomparison studies (e.g. Quaas et al., 2009) and comparison to observations. The spatial resolution of global numerical weather prediction (NWP) and climate models (typically 10–100 km) is widely recognized as inadequate for investigating essential aerosol–cloud interaction processes at the cloud scale (∼10 m; Lebo et al., 2017). Thus, relationships between sub-grid-scale variables such as cloud updraft velocity and entrainment from LEMs and their link to large-scale boundary layer variables are being sought but, while promising, are far from well established (e.g. Golaz et al., 2011; Malavelle et al., 2014). Simulations with HadGEM2 Coupled Large-scale Aerosol Scheme for Studies In Climate (CLASSIC) suggest that while BBA interaction with cloud may be limited by vertical stratification, it does enter the MBL and interact with cloud, producing a strong indirect effect in the region (Fig. 3a). However, the more sophisticated GLOMAP-MODE two-moment scheme leads to a much reduced aerosol indirect effect because an increase in aerosol mass does not necessarily lead to an increase in the aerosol number or CCN as the aerosol size distribution will tend to shift to larger sizes as more volatile organic precursors condense upon pre-existing aerosol particles (Fig. 3b). Therefore, when combined with a slight reduction in the cloud fraction associated with the aerosol-semi direct effect, some areas of the South Atlantic shown in Fig. 3b are subject to a positive radiative effect. The over-strong aerosol–cloud interaction in CLASSIC compared to GLOMAP-MODE has been noted in other studies that have used satellite retrievals to assess their validity (e.g. Malavelle et al., 2017).
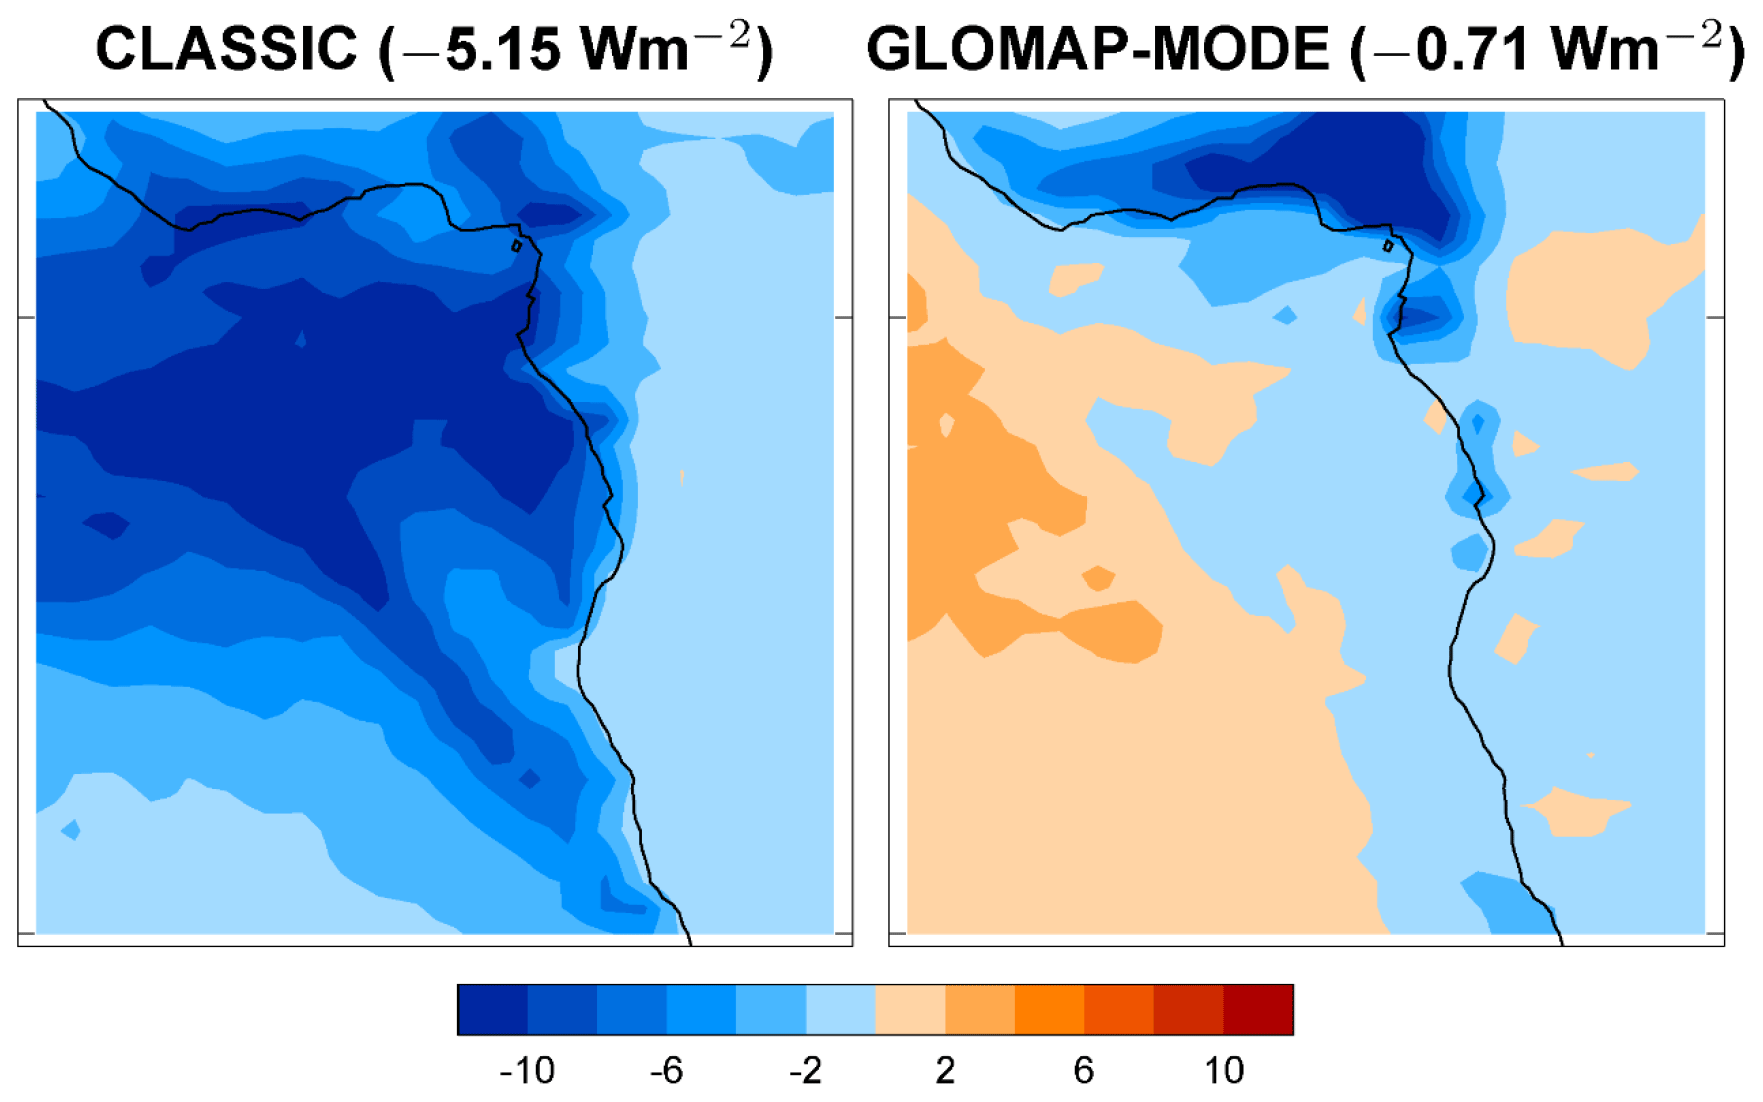
Figure 3The annual mean aerosol indirect effect (cloud–aerosol interaction) and aerosol semi-direct effect diagnosed for two aerosol schemes (CLASSIC and GLOMAP-MODE) within the HadGEM2 climate model. Units are W m−2.
An assessment of parametric uncertainty in the GLOMAP-MODE global model driven by ECMWF meteorology and observed low-level clouds (Lee et al., 2013) showed that BBA particles are one of the largest sources of uncertainty in CCN at cloud base. However, Lee et al. (2013) did not assess the effect of uncertainties in the physical model, which control the extent to which BBA and clouds mix, nor structural model uncertainties.
The stratocumulus decks of the SE Atlantic have been linked via global teleconnections to precipitation anomalies in Brazilian rainfall; SE Atlantic stratocumulus that is too bright can lead to precipitation deficits in the Nordeste and Amazonian regions (Milton and Earnshaw, 2007; Jones et al., 2009). Similarly, Atlantic sea-surface temperature gradients and the hemispherical asymmetry in the energy balance are strongly impacted by SE Atlantic stratocumulus (Jones and Haywood, 2012; Stephens et al., 2016), influencing the position of the intertropical convergence zone (ITCZ) and hence the African and Asian monsoon.
1.3 Previous measurements in the region and advances since then
The last major international measurement campaign investigating biomass burning (BB) in southern Africa was the Southern AFricAn Regional science Initiative in 2000 (SAFARI-2000). The SAFARI-2000 dry-season intensive campaign focussed on the emissions, transport, and transformation of BBA plumes and the validation of satellite remote sensing retrievals of aerosol and cloud from the Terra satellite (Swap et al., 2002). The majority of investigations over the SE Atlantic were basic aerosol microphysics and cloud-free radiative impact studies (Haywood et al., 2003; Keil and Haywood, 2003; Osborne et al., 2004. Magi et al., 2008). Since SAFARI-2000, significant advances in airborne measurement of BC (e.g. Schwarz et al., 2008; McMeeking et al., 2011); organic and inorganic aerosol compounds (Morgan et al., 2010); and aerosol physical properties have occurred. In addition, improvements in the accuracy and sensitivity of measurements of aerosol optical properties, notably absorption (e.g. Sedlacek and Lee, 2007; Lack et al., 2008), have been made. Airborne lidar instrumentation and retrievals allow for concurrent mapping of vertical distributions of aerosols above clouds (e.g. Marenco et al., 2011). An extensive set of measurements of stratocumulus clouds has been performed during VOCALS off the Pacific coast of South America (Wood et al., 2011), with one of the foci being aerosol–cloud interactions (e.g. Yang et al., 2011; Painemal and Zuidema, 2013). However, the aerosol composition, sources, and interaction with the clouds in the VOCALS region are very different to those over the SE Atlantic, which is dominated by relatively strongly absorbing biomass burning aerosol (e.g. Haywood et al., 2003).
Model capabilities have also improved. At the time of SAFARI-2000, aerosol modelling was in its infancy, with only two global chemical transport models reporting the direct radiative forcing and cloud albedo indirect forcing of BBA in the IPCC report (Ramaswamy et al., 2003). Since 2000, the focus for aerosol–radiation interactions has shifted to areas where model results diverge (e.g. SE Atlantic; see Figs. 2 and 3). Global aerosol microphysics models have also been developed and are coupled to climate models and to cloud models at high resolution. Aerosol–cloud interactions are now studied at scales ranging from LEMs with resolutions of a few metres, through cloud resolving models, and limited area numerical weather prediction models to global models with resolutions of ∼100 km. New approaches to understand sources of aerosol uncertainty have also been developed (Lee et al., 2013). However, high-quality validation data in the SE Atlantic with which to challenge the global and cloud resolving models are almost entirely lacking.
1.4 Key aims and objectives
With the rationale as described above, CLARIFY-2017 aimed to use the natural laboratory of the SE Atlantic to improve the representation of BBAs and clouds in models of a range of scales and increase the fidelity of aerosol–radiation and aerosol–cloud interaction processes and cloud representation and their impacts on local, regional, and global weather and climate. Experience suggested that these objectives were best achieved by conducting an intensive airborne field campaign with supporting surface and satellite measurements. The measurements were used to challenge and develop improved models at different spatial scales from the cloud scale to the global scale that couple aerosols, clouds, and radiation.
Specific key objectives of CLARIFY-2017 were as follows:
-
Key objective 1: measure and understand processes governing the physical, chemical, optical and radiative properties of BBAs in the SE Atlantic region.
-
Key objective 2: understand, evaluate and improve the representation of physical properties of the SE Atlantic stratocumulus clouds and their environment in a range of models.
-
Key objective 3: evaluate and improve the representation of BBA–radiation interactions over the SE Atlantic when clouds are absent/present at a range of model scales and resolutions.
-
Key objective 4: evaluate and improve the representation of BBA–cloud interactions over the SE Atlantic at a range of model scales and resolutions.
The purpose of this work is to describe the deployment strategy (Sect. 2), the aircraft- and surface-based instrumentation (Sect. 3), the flight patterns used to deliver specific objectives (Sect. 4), and a summary of the flights performed (Sect. 5) and to signpost certain key initial results (Sect. 6). Conclusions are presented in Sect. 7.
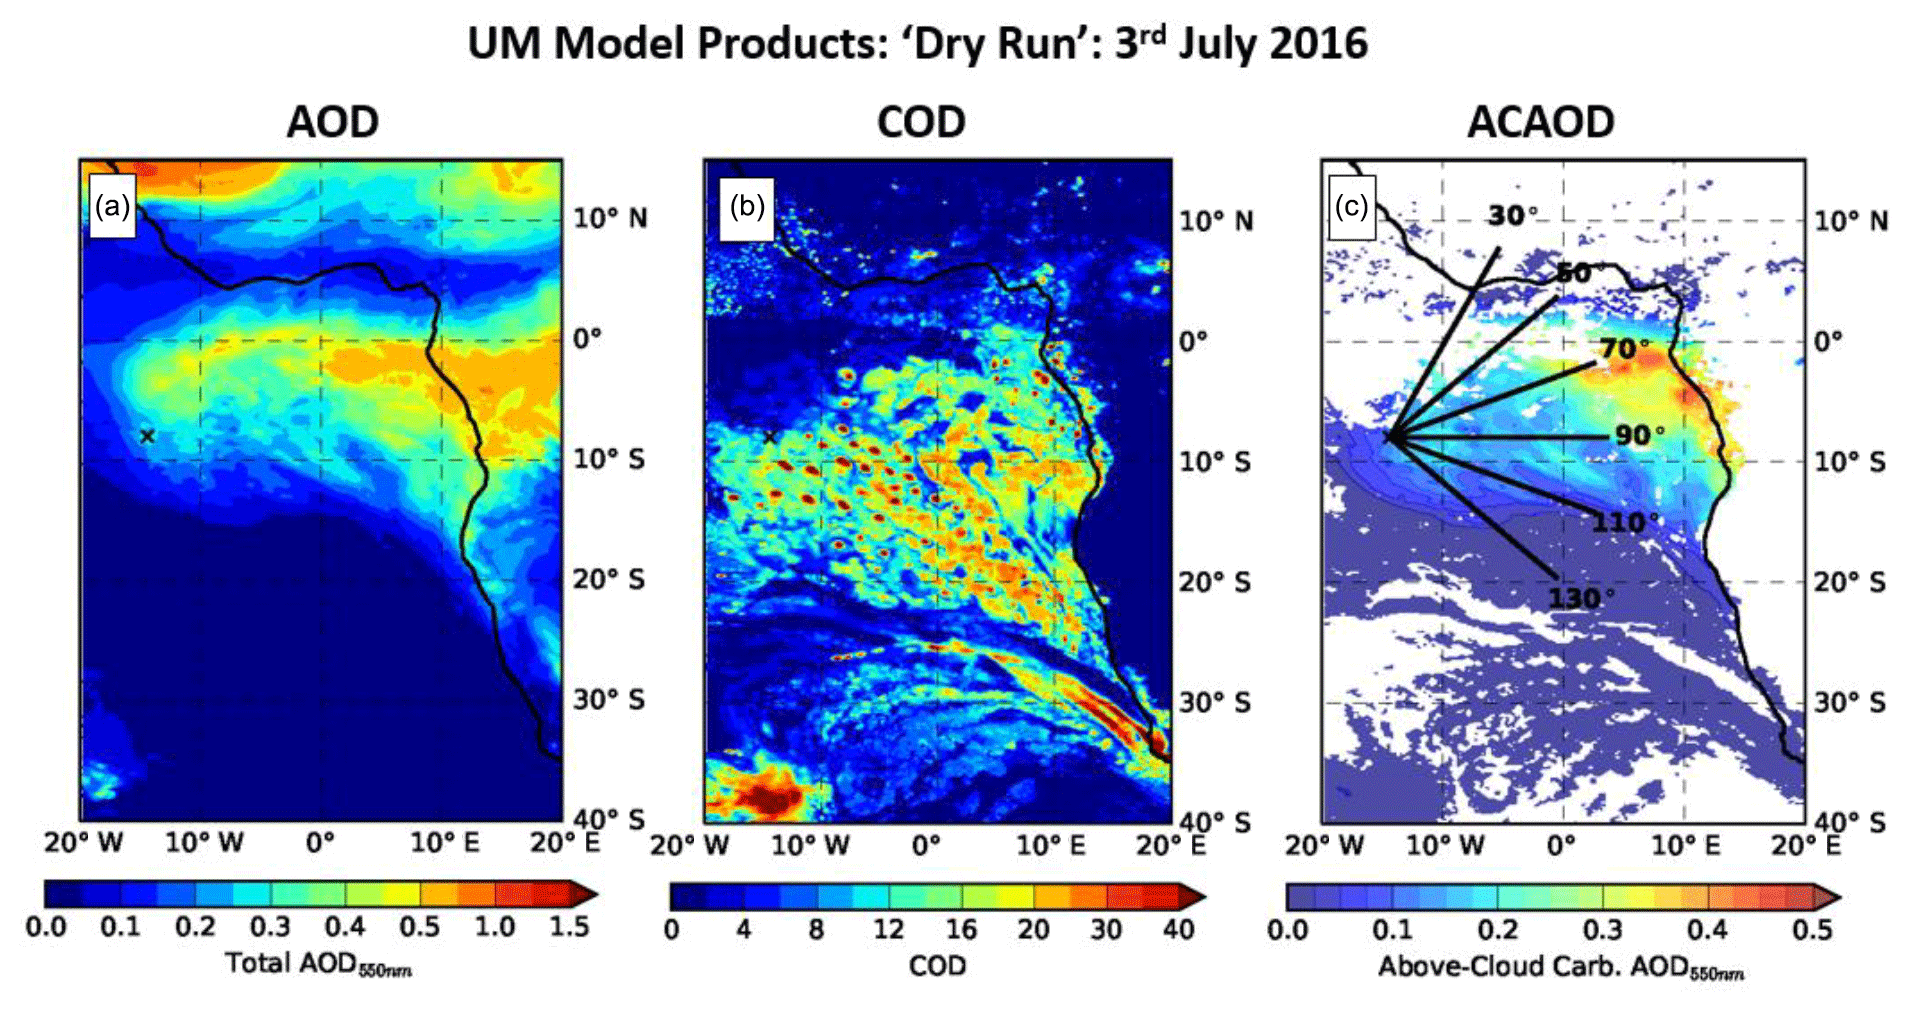
Figure 4Model forecasts with the CLUMP model for a wavelength of 550 nm for (a) aerosol optical depth (AOD), (b) cloud optical depth (COD), and (c) above-cloud AOD (ACAOD; white where there is no cloud). The solid lines in (c) indicate transects over which vertical–horizontal distribution maps aerosol, and cloud properties were provided as data products, some of which are provided in Fig. 5.
CLARIFY was originally scheduled to operate from Walvis Bay, Namibia, in August–September 2016. August–September was chosen as an optimal operating window via analysis of multi-year satellite analyses and surface-based sun photometer observations (Adebiyi et al., 2015; multi-year means presented in detail in Redemann et al., 2020). There was also evidence that suitably high aerosol loadings had been encountered during this period during aircraft operations with the UK's instrumented C-130 aircraft and the University of Washington's CV-580 aircraft during SAFARI-2000 (Haywood et al., 2003; Hobbs, 2003; Osborne et al., 2004). However, operating permissions were not forthcoming, although permission was eventually given for operations in 2016 for the ORACLES campaign and in 2017 for the AEROCLO-sA campaign. Given the ORACLES and AEROCLO-sA deployments were based in continental Africa relatively close to the sources of biomass burning, additional merits were envisaged by locating CLARIFY-2017 operations at a downstream location, enabling very aged BBA to be sampled. These factors, together with the deployment of the AMF under the LASIC proposal, led to the decision to relocate to Ascension Island and delay deployment until August–September 2017, given that the biomass plume and underlying stratocumulus decks could be accessed from Ascension Island. The deployment was given the full support of UK's Joint Forces Command, which aided the logistics of deployment.
To ensure that model and observational products were readily available and that the scientists were familiar with the likely meteorological, cloud, and aerosol conditions, dry run periods were established 1 year ahead of deployment (July–September 2016) and 1 month prior to deployment (July–August 2017). The benefits of holding a dry run during August–September 2016 were enhanced by the in-field operations and the associated modelling support of the ORACLES campaign.
Tools for flight planning included global and regional model forecasts, satellite analyses, and data feeds from surface-based instrumentation. Global modelling efforts for 2016 included the following models: ECMWF, UK Met Office, the Global Forecasting System of NCEP, and the GEOS-5 model (see Redemann et al., 2020), all of which provided their standard meteorological variables, such as cloud fraction, cloud liquid water, and boundary layer depth. In addition, the Met Office developed a bespoke three-component aerosol system for use in its development version of the global NWP model (Walters et al., 2011) which ran at around 15 km spatial resolution. The aerosol model was essentially a derivative of the CLASSIC scheme (e.g. Bellouin et al., 2011) in which aerosols are modelled as externally mixed. The three components that were chosen were (i) sulfate with emissions from industrial pollution and dimethyl sulfide (DMS); (ii) a simplified two-bin mineral dust scheme based on Woodward (2001) with interactive emissions and data assimilation from MODIS Aqua (Pope et al., 2016; O'Sullivan et al., 2020); and (iii) “carbonaceous aerosols” with real-time fire emissions from fossil fuel and biofuel (Global Fire Assimilation System (GFAS); Kaiser et al., 2012) combined into one tracer. The three aerosol components were chosen as a compromise because the model was also used in the South West Asian Aerosol Monsoon Interaction (SWAAMI) campaign (e.g. Brooks et al., 2019) and in the Dynamics–aerosol–chemistry–cloud interactions in West Africa (DACCIWA) project (Knippertz et al., 2015). This three-component aerosol model is known as the CLASSIC-Lumped (CLUMP) model, owing to the emissions being lumped into source terms for the three aerosol components. While the limitations of such single-moment schemes are recognized, the primary purpose of the scheme was to locate the aircraft in approximately the right place at the right time. Note that, with the exception of the impacts of mineral dust that are included in the operational model, aerosol–radiation interactions and aerosol–cloud interactions are explicitly turned off in CLUMP so that the dynamical evolution of the developmental model is identical to the operational model. Examples of some of the bespoke products are shown in Figs. 4 and 5.
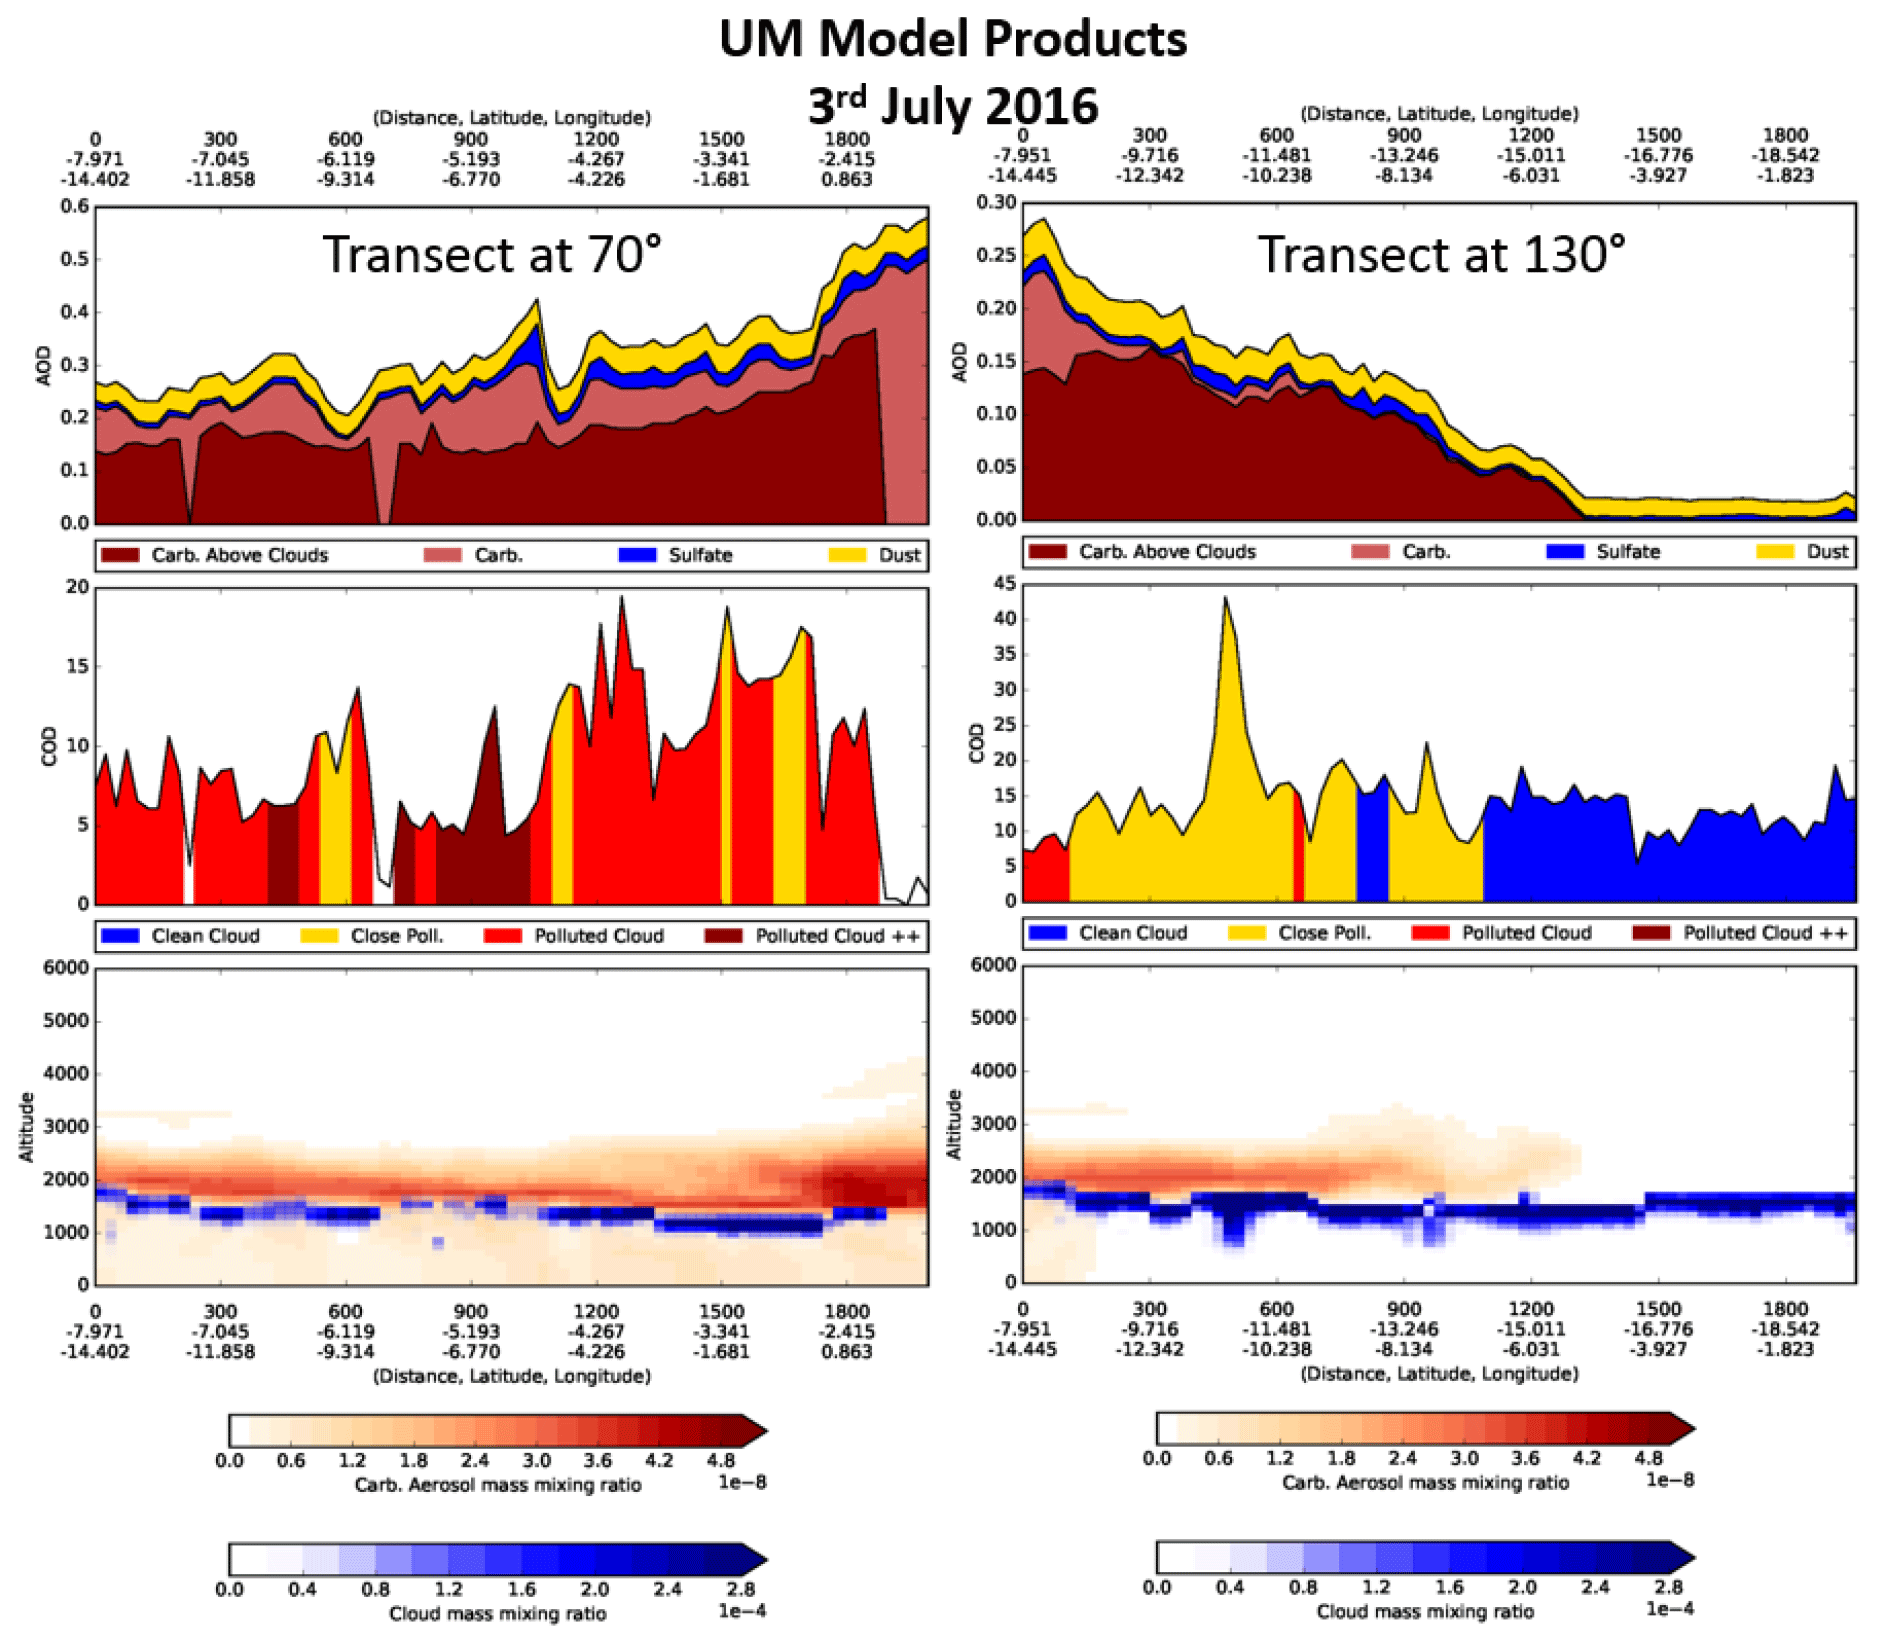
Figure 5Model products derived at the 70∘ transect (column 1) and 130∘ transect (column 2) shown in Fig. 4. Aerosol optical depth (AOD) at 550 nm is split into the three component aerosol types within the CLUMP model, and the carbonaceous (carb) aerosols that include BBA are further subdivided into above-cloud and below-cloud components. Cloud optical depth (COD) is subdivided into (i) “clean” (aerosol concentrations < 3 µg kg−1), (ii) clean but close to pollution (aerosol concentrations < 3 µg kg−1 but within 200 m in the vertical of aerosol ≥ 3 µg kg−1), (iii) polluted (aerosol concentrations ≥ 3 µg kg−1), and (iv) very polluted (aerosol concentrations ≥ 10 µg kg−1). The third row shows the vertical profile of carbonaceous aerosols (red) and cloud (blue) mass mixing ratios.
Figure 4a shows the expected pattern of aerosol optical depth, although it is to the north of the seasonally averaged August–October AODs (Fig. 1), owing to the more northerly location of biomass burning at this time of year. The CODs shown in Fig. 4b show the level of detail that is possible in a high-resolution numerical weather prediction model. Figure 4c shows the above-cloud aerosol optical depth (ACAOD) that is diagnosed from the model, together with transects on radials originating from Ascension Island that were routinely analysed during the dry run and deployment periods.
Figure 5 shows further bespoke model products along the 70 and 130∘ transects shown in Fig. 4c. The 70∘ radial heads into the heart of the biomass burning plume and suggests a very different degree of vertical mixing when compared to that at 130∘. The 70∘ transect suggests that the carbonaceous aerosol originating from biomass burning is mixed throughout the boundary layer with around 75 % on average of carbonaceous aerosol residing above cloud and the remaining 25 % being contained within the MBL. This leads to classifications of cloud that are generally polluted (arbitrary threshold of 3 µg kg−1 of BBA) or very polluted (arbitrary threshold of 10 µg kg−1 of BBA) within the modelling framework.
The 130∘ transect is very different with the carbonaceous aerosol almost entirely overlying cloud. This leads to classifications of cloud that are either “close” to interacting with cloud (when the aerosol base is within 200 m of the cloud) or “clean” when there is little in the way of biomass burning present to the south of the region. Of course, the utility of the model as a forecast tool depends on its ability to accurately represent the details of mixing of the BBA down from the residual CBL into the MBL; we will show that the model is indeed capable of capturing these features in Sect. 6. In addition to the UK Met Office 15 km resolution model, two other global aerosol models were available. ECMWF were a project partner on the CLARIFY project and provided ECMWF-based model forecasts from Copernicus Atmosphere Monitoring Service (CAMS; https://atmosphere.copernicus.eu/, last access: January 2021) and the NASA-based GEOS5 (https://gmao.gsfc.nasa.gov/GEOS/, last access: January 2021) that was run in support of the ORACLES programme (Redemann et al., 2020).
Limited area NWP forecast models were also utilized, with a horizontal grid spacing of 4 km and a domain of around 2000 km × 2000 km, with boundary conditions provided by the global NWP model; this model did not include aerosol transport but provided even higher resolution cloud products. Regional models that did include aerosol were also run in support of ORACLES, e.g. WRF-Chem at 36 km resolution and full chemistry and WRF with aerosol-aware microphysics at 12 km resolution (Saide et al., 2016), the latter model being the primary ORACLES aerosol forecast tool. The formulation and resolution of the WRF with aerosol-aware microphysics simulations are similar to those of the Met Office NWP-CLUMP model, although the NWP-CLUMP model had aerosol–radiation and aerosol–cloud interactions disabled. Output data products from these models were also made available to the CLARIFY team (Redemann et al., 2020).
Satellite products provided another important tool for planning aircraft flights. MODIS was used to provide 1-day-old observations of aerosol optical depth in cloud-free regions, while the geostationary SEVIRI instrument was used for nowcasting cloud conditions, with images of cloud conditions being periodically relayed to the FAAM aircraft throughout the flight. Before the dry runs and deployment, a register of the timing and track of overpasses from polar orbiting satellites (e.g. Terra, Aqua) that were in the vicinity of Ascension Island was made, taking care to exclude areas where the satellite was influenced by sun glint. This allowed scientists to decide on the relative priorities of flights. In the case that forecasted AOD and cloud-cover conditions were expected to be consistent for several days, priority was given to those days with local satellite overpasses, so the aircraft measurements could provide data for satellite validation and allowing the satellite measurements to put the aircraft measurements into a wider geographical context.
Further information from ground-based instrumentation was utilized for nowcasting. This included information on the aerosol optical depth from two Cimel sun photometers based at the AERONET and AMF sites, a handheld Microtops sun photometer based at the operations centre in Georgetown, and a Leosphere depolarizing lidar, operated by KNMI at the airfield. This combination of equipment allowed for an assessment of the aerosol loadings and the vertical distribution of aerosol relative to cloud prior to aircraft take-off. Further details of this instrumentation together with the aircraft instrumentation are given in Sect. 3.
The BAe146 FAAM aircraft is the UK's NERC-funded atmospheric research aircraft and is part-funded by the UK's Met Office. It has the largest payload of any European atmospheric research aircraft, capable of carrying three crew, 18 scientists, and a total scientific payload of up to 4000 kg for a distance of 3700 km with a ceiling of 35 000 ft (feet) (10.7 km) and has a typical science airspeed of 110 m s−1. The endurance of the BAe146 aircraft is typically up to 6 h depending on the scientific payload, the flight patterns, ambient meteorological conditions, and the proximity of diversion airports.
The aircraft instrumentation used in this configuration is an enhanced version of that used in previous aerosol and radiation campaigns such as DABEX and GERBILS (e.g. Haywood et al., 2008, 2011) and is broken down into subsets corresponding to aerosol microphysics, aerosol composition and optical properties, cloud physics, radiation and remote sensing, trace gas chemistry, and thermodynamics (Table 1).
Table 1Summary of instruments of major relevance to detachment. FAAM – Facility for Airborne Atmospheric Measurements, Met O – Met Office, UoM – University of Manchester, NCAS – National Centre for Atmospheric Science. Size classifications for cloud and particle distributions are given in diameter.
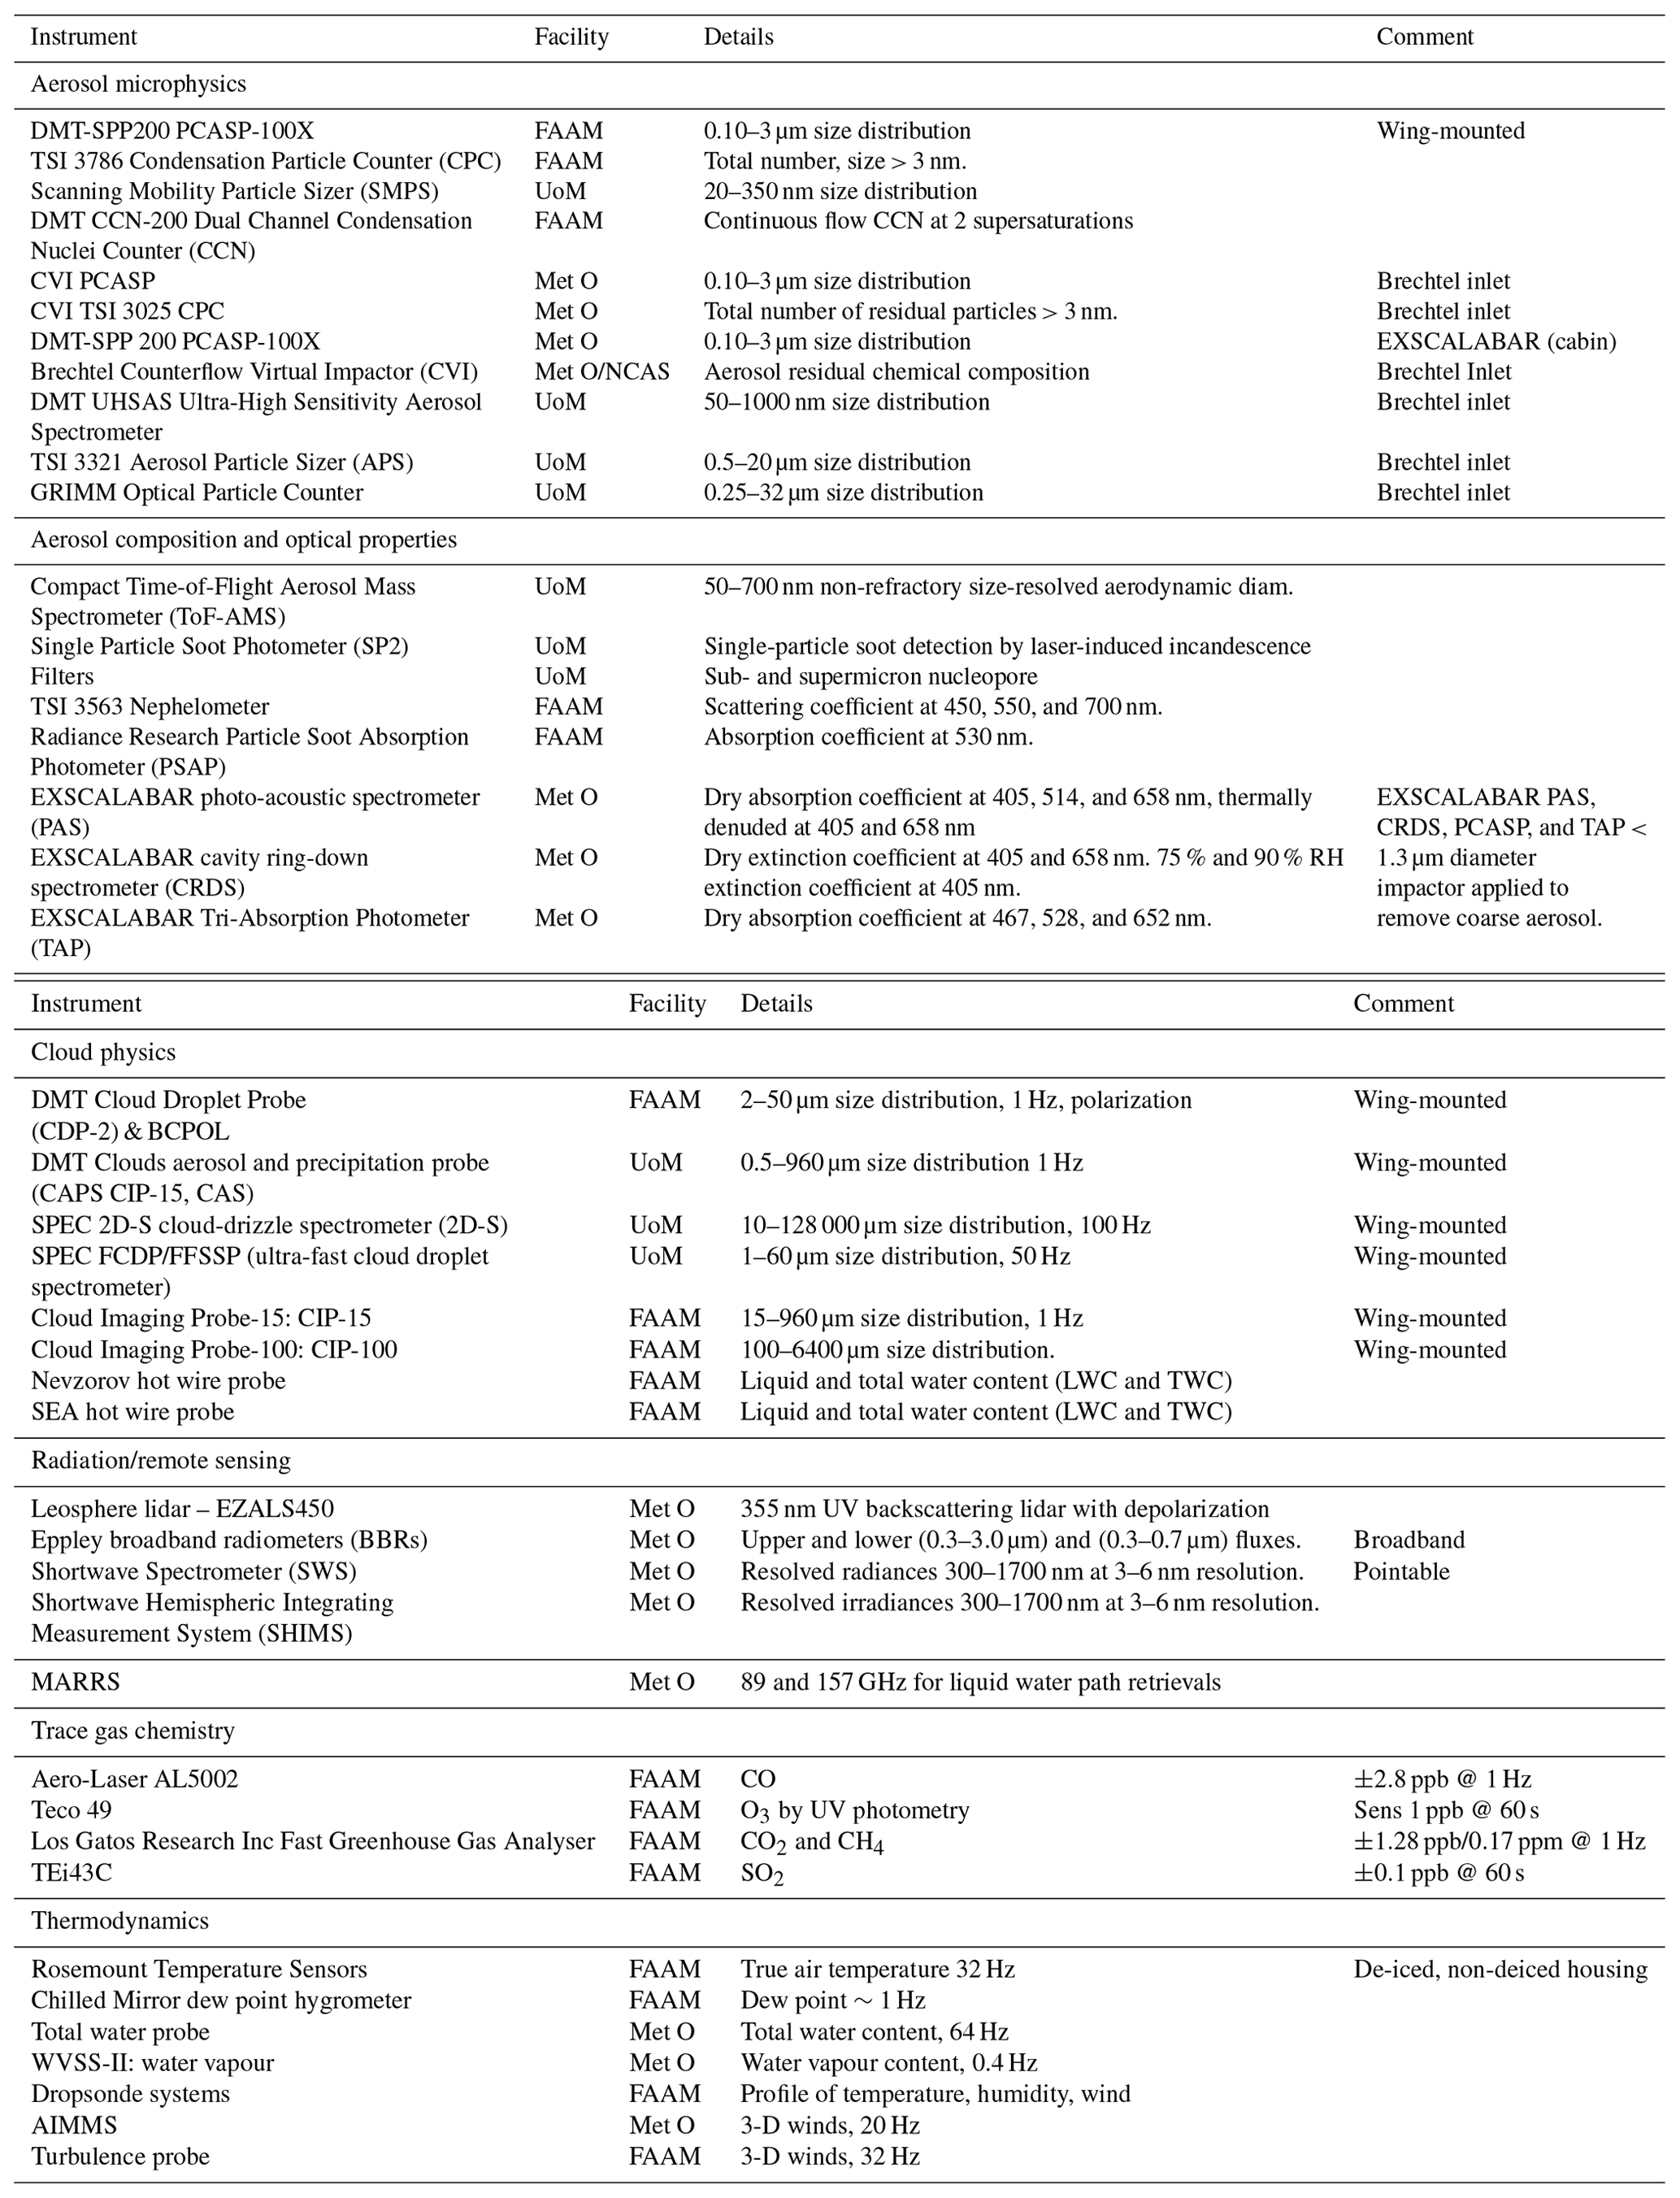
The instrumentation was chosen to provide an optimal instrumentational fit to meet the key objectives while keeping down the operational weight of the aircraft to maintain a reasonable range.
In addition to the aircraft instrumentation and the sun photometer and lidar deployed at the airfield, the campaign benefitted from the synergistic deployment of the AMF to Ascension Island. The AMF was located on a more remote windward side of the island, to avoid local aerosol sources, at a site approximately 300 m (1000 ft) above sea level (Zuidema et al., 2016, 2018a). The deployment spanned July 2016–October 2017 and thus captured two distinct biomass burning seasons. The FAAM aircraft made several fly-pasts of the AMF site at 1000 ft a.s.l. (approximately 300 m), offset by approximately 2 km to the east so that it was operating at the same altitude, thus allowing for a comparison of aerosol, trace gas, and radiation measurements. A new Handix Portable Optical Particle Counter (POPS) was also operated at the AMF by the University of Exeter for the duration of the FAAM deployment to help provide a long-term characterization of the instrument (Liu et al., 2021). Standard meteorological measurements were also made by the Met Office located at the airfield, including precipitation measurements. A long-standing standard Cimel sun photometer has also been operational on Ascension Island as part of the AERONET network since 1998.
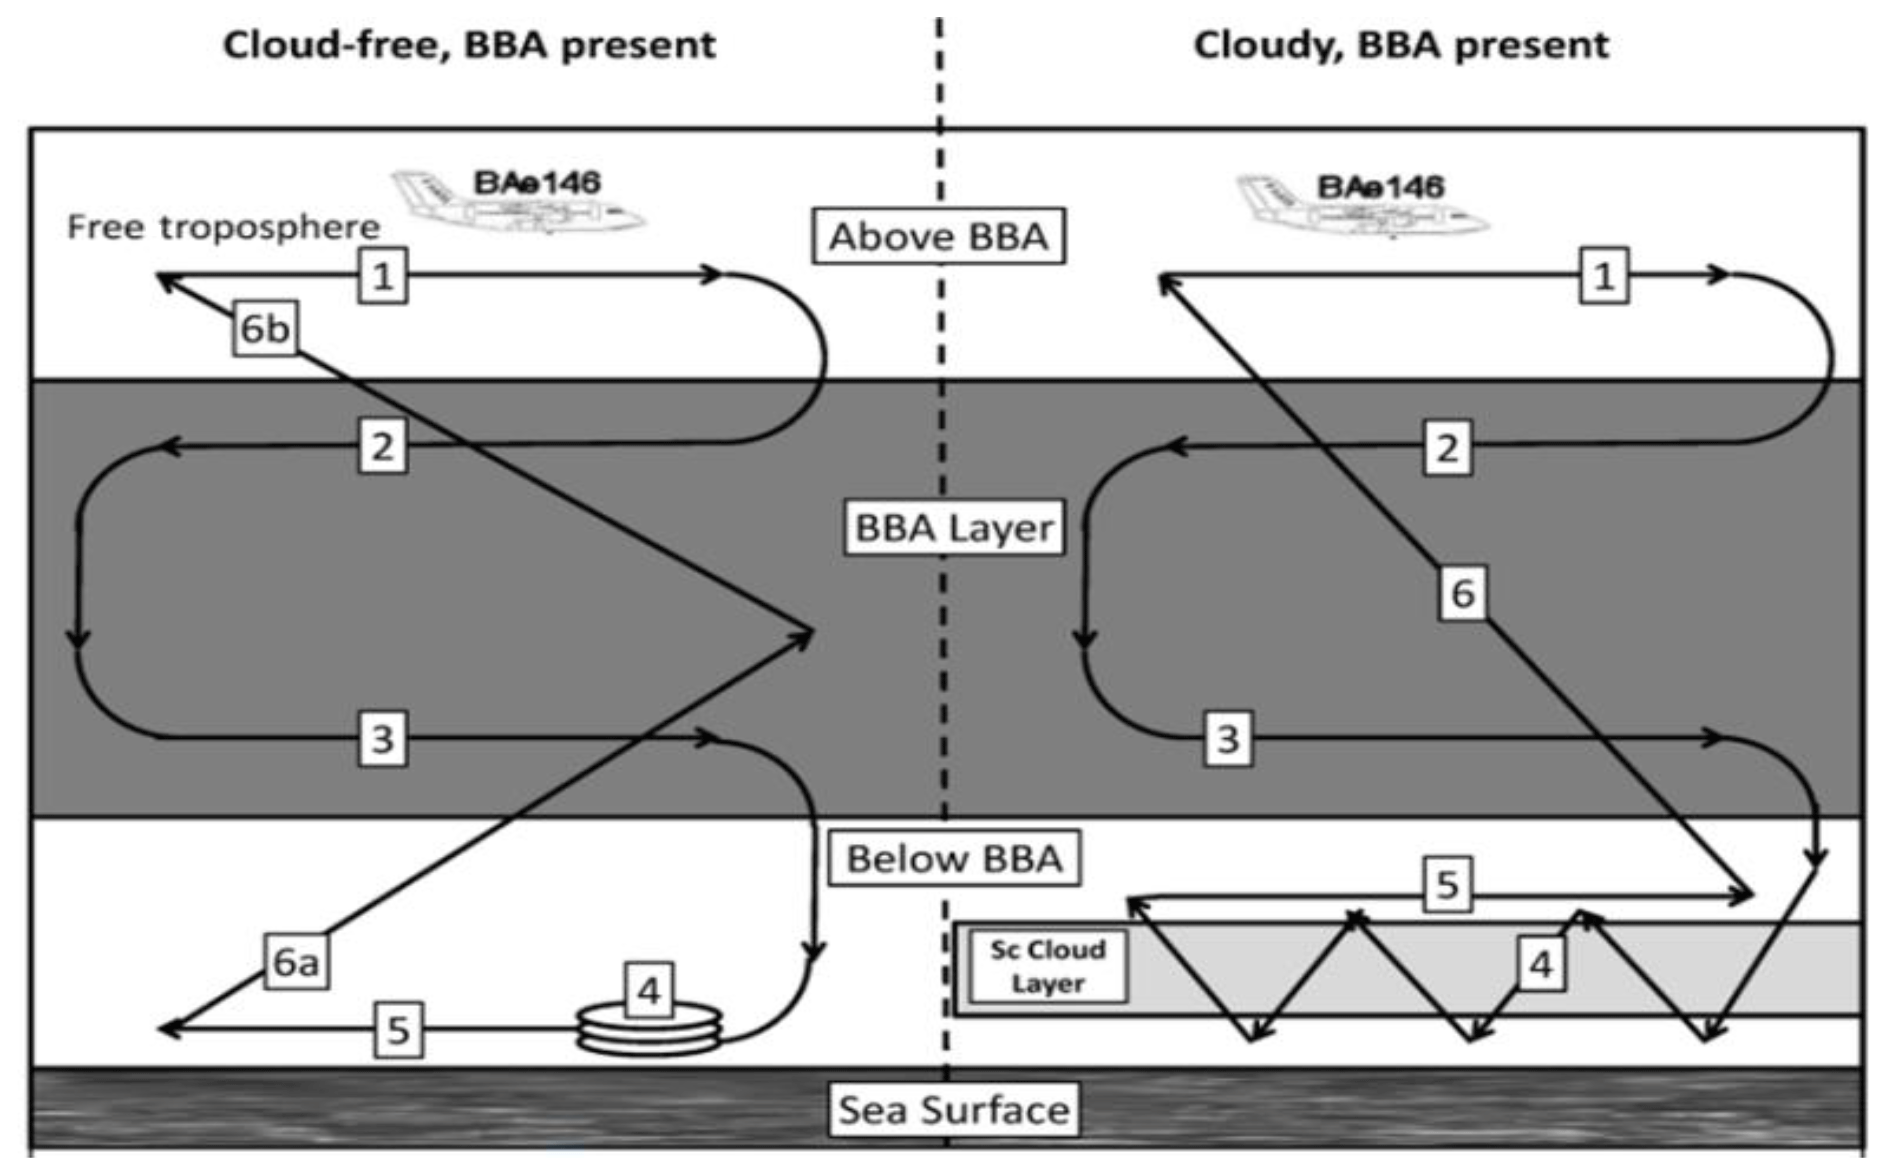
Figure 6Schematic diagram of the manoeuvres that were typically performed during cloud-free and cloudy conditions. The numbers marked on the schematic represent the manoeuvres referred to in the text.
Because the aircraft was operating from Ascension Island where there are no diversion airports, island holding restrictions were in place, resulting in a reduced operating duration of around 3.5–4 h. Owing to these restrictions, extended operations at distances far from Ascension Island were curtailed. However, owing to the significant cooperation of the RAF, USAF, ATC, fire crew, and ground crew, the aircraft was able to operate for two flights per day if required from 09:00–12:30 LT followed by re-fuelling and flying 14:00–17:30 LT Monday–Friday. No flights were permitted on Saturday afternoons, taking account of other air traffic utilizing the airstrip, and Sunday was classed as a hard-down day with no flying permitted to provide a scheduled rest day. Scientific outreach showcasing the aircraft and our science was via guided tours of the aircraft and talks on the scientific research being performed to the general population of Ascension Island (approximately one-third of the island's entire civilian population was present).
Depending on the aerosol and cloud conditions determined from forecast products, satellite retrievals, and ground-based observation data, the FAAM aircraft flights were designed to characterize the main aerosol and cloud state in clean and polluted conditions and to study properties and processes rather than to build a spatially and temporally representative mapping of the region (see Redemann et al., 2020, for ORACLES flight plans for building such a representative mapping). This strategy for flight planning ensured that suitable data sets were collected to facilitate meeting the key objectives described in Sect. 1.4.
A series of predetermined, but flexible, flight patterns were developed (e.g. Fig. 6). Each flight pattern was made up of a series of manoeuvres including “straight and level runs” (SLRs) (denoted no. 1–no. 5 in Fig. 6), “profiles” (denoted no. 6 in Fig. 6), “sawtooths” (denoted no. 4 in the cloudy-flight schematic of Fig. 6), and “orbits” (denoted no. 4 in the cloud-free schematic of Fig. 6). SLRs of differing duration were made at constant pressure levels. Profiles were typically made at a constant rate of descent/ascent of 1000 ft min−1 (5 m s−1) (although 500 ft min−1 (2.5 m s−1) was typical at the lowest levels), while sawtooths were frequently used from cloud top to cloud base to characterize clouds. Orbits in conjunction with the SWS instrument are flown at high angles of bank (typically 60∘), take less than 2 min to complete, and allow for measurements that are analogous to Cimel almucantar scans (Osborne et al., 2008, 2011).
A manoeuvre carried out when the skies were predominantly cloud-free while the aircraft was on the ground consisted of a “pirouette”, rotating the aircraft through 360∘ over a period of around 2 min while the aircraft was on the Ascension Island runway or apron. This allowed two separate measurements to be made. Firstly, levelling corrections for the Eppley BBR and SHIMS instruments (Table 1) could be performed from these manoeuvres, and any impacts of dome degradation via aerosol impaction on the front faces of the BBR and SHIMS domes could be assessed by examining pre- and post-flight data (Barrett et al., 2021a). Secondly, by setting the SWS instruments' viewing geometry to match the solar zenith angle (or the solar angle plus 10∘), the SWS instrument effectively made almucantar scans analogous to those made by Cimel sun photometers where the radiance is mapped out as a function of the scattering angle. By setting the SWS viewing geometry to the solar zenith angle plus 10∘, the range of scattering angles sampled was from 10∘ to twice the solar zenith angle plus 20∘.
Flight patterns for aerosol characterization generally consisted of either SLRs through the BBA layer or vertical profiles/sawtooths to constrain their vertical distribution in the atmospheric column. Because both the radiation and cloud sorties described below involved many measurements of aerosol, specific flight patterns focussing solely on aerosol characterization were not performed; aerosol characterization was implicit within the other sorties and mainly used a combination of SLRs and vertical profiles.
4.1 Flight patterns for radiation objectives
An example of the flight patterns performed for determining the radiative effects of BBA in cloud-free and cloudy skies is shown in Fig. 6 based on preconceived ideas of what we would expect based on prior experience from SAFARI-2000 (Haywood et al., 2003).
The patterns shown in Fig. 6 were typically orientated so that the SLRs and profiles avoided running within 30∘ of the into-sun heading. This is to avoid making radiative transfer measurements where aerosol may have been impacted on the front face of the Eppley BBRs and SHIMS instruments, which could lead to a reduction in measured irradiance. Owing to the variability of cloud, the order of the runs was typically changed during CLARIFY-2017 so that the high-level SLR leg was followed by a reciprocal turn and profile descent followed by a reciprocal turn and SLR just above cloud top. This ensured the minimum length of time had elapsed between the two legs to minimize differences caused by changes in cloud fields below the aircraft (e.g. Peers et al., 2019, 2020). Because of the shape of this sequence, the pattern is known as a “Z pattern”.
Radiometric measurements above and below the BBA characterized broadband and spectral irradiances and radiances, provided aerosol vertical distribution from lidar, and enabled sea-surface reflectance characterization. Profiles through the BBA characterized the aerosol extinction and absorption coefficient from the EXtinction, Scattering and Absorption of Light for AirBorne Aerosol Research (EXSCALABAR) instrument and hence the aerosol optical depth and aerosol absorption optical depth. When BBA overlies cloud, SLRs above and below BBA provided remotely sensed estimates of cloud top droplet effective radius and liquid water path (LWP) from solar and microwave instrumentation.
4.2 Flight patterns for cloud characterization objectives
Flight patterns for examining clouds typically resembled a series of stacked SLRs below cloud, within cloud, above cloud, and within aerosol. Typically, the patterns were used together with a series of sawtooths through the cloud to further characterize the variability of the cloud top and cloud base and to provide detailed characterization of cloud microphysical parameters within cloud and at cloud top from in situ measurements (effective radius, LWP, and liquid water content, LWC).
SLRs just below cloud base and just above cloud base were used to investigate CCN budgets, closure, and aerosol loss due to scavenging. SLRs below cloud, in cloud, and above cloud measured CCN, cloud droplet size distributions, and drizzle size distribution below cloud base to provide information on the entrainment process, the influence of entrainment on cloud microphysics, and constraints on BBA entrainment rates into cloud top. Vertical profile, sawtooth, and stepped profile measurements were made of the size distribution of cloud droplets and precipitation over the diameter size range 2 µm to 6 mm, capturing cloud droplets and precipitation. The onboard AMS, SP2, and OPCs were switched between the CVI inlet to measure droplet residuals and the total inlet to determine the size and composition of the nucleation scavenged and interstitial aerosol as a function of position and height in the cloud. Measurements higher in the cloud together with turbulence measurements examined the evolution of the cloud microphysics as condensational growth and coalescence occur.
4.3 Planning logistics
All satellite overpasses, satellite observations from previous overpasses, model data, and observations from the AMF and from the KNMI lidar installed at the airfield were available to the planning teams (see Sects. 2 and 3). Owing to the high intensity of the flying programme, the flight planning teams were separated into two, an aircraft-based team flying the mission and a second ground-based team which prepared flight plans for the forthcoming flight. The team on the ground also was responsible for sending updates to the aircraft via SATCOM, providing updates of the cloud conditions from the geostationary satellites and measurements from the surface-based instrumentation. After a debrief of the flight, the ground-based team and aircraft-based team then swapped roles so that each team “owned” the flight from inception, through planning and execution. As per standard campaign operating procedures, a running tally of hours allocated to specific aerosol characterization, cloud characterization, aerosol–radiation and aerosol–cloud interactions, and other aspects such as pocket of open cell (POC) investigations was maintained during the campaign so that future flights could target any science gaps in the key objectives.
A total of 28 science flights were performed on 18 d during CLARIFY-2017 for a total of around 99 h (Table 2); the geographic distribution of the flight tracks for CLARIFY-2017 is shown in Fig. 7.

Figure 7(a) Geographical position of the sorties that were performed during CLARIFY-2017 and (b) an analysis of the sampling altitudes during the campaign, with the boundary layer heights from FAAM and the LASIC AMF diagnosed during the campaign shown by the bar and whiskers.
Table 2Details of the flights performed during CLARIFY-2017 including take-off and landing times (GMT). * is used to indicate flights that were part of a double-flight i.e. both in the morning and evening. M refers to BBA positions in the MBL, while C refers to BBA in the residual continental boundary layer. MODIS overpasses and timings are also shown (A is Aqua and T is Terra). The mean daily AOD at 500 nm from AERONET stations is shown in italics, while values obtained from the handheld Microtops sun photometers are shown in bold. MBL is the marine boundary layer, CBL the continental boundary layer, MISR the Multi-angle Imaging SpectroRadiometer, CALIPSO the Cloud-Aerosol Lidar and Infrared Pathfinder Satellite Observations, and POC the pocket of open cells.
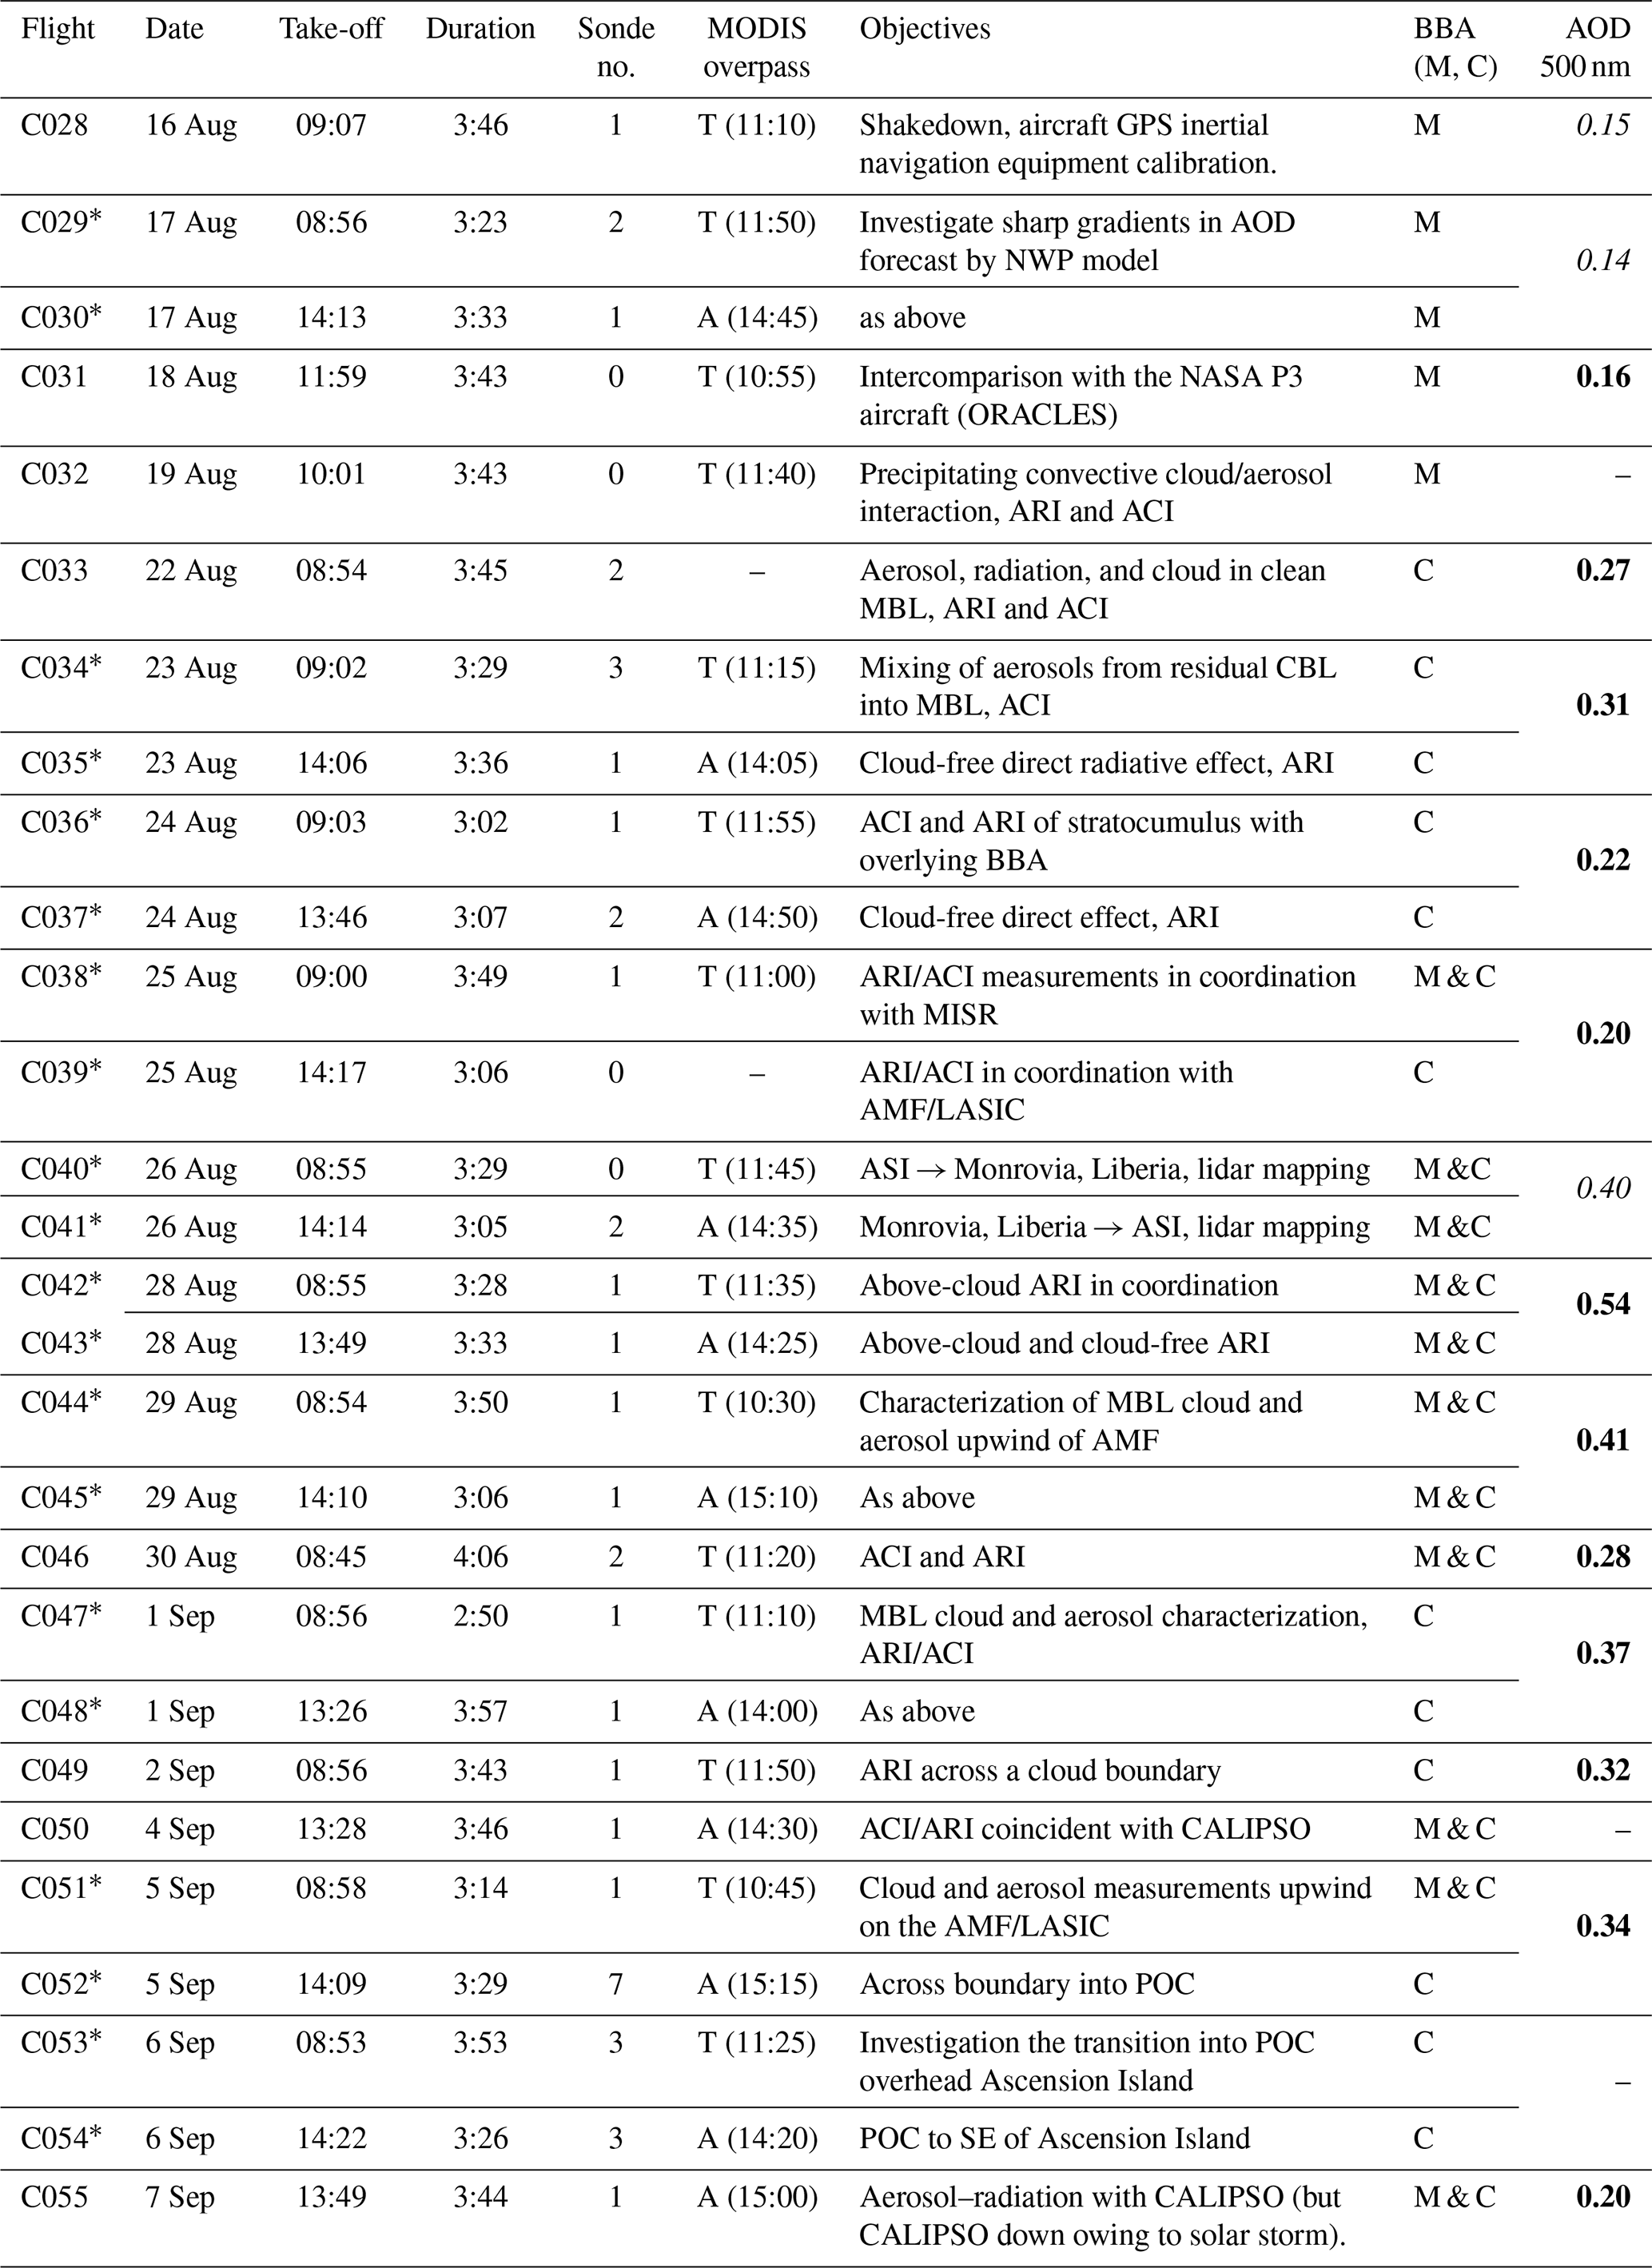
While the climatological mean of the AOD shows a maximum almost directly east of Ascension Island (Fig. 1), in practice Fig. 7a shows that the flights were performed in various directions because of the filament-like nature of the aerosol plume on any specific day. An analysis of the time the aircraft spent at different altitudes is shown in Fig. 7b, which reveals that 45 % of the time the FAAM aircraft was operating in the MBL and 36 % of the time in the residual CBL in the BBA layer, with the remaining time spent above the BBA while transiting to or from mainland Africa (C041, C041) or making radiometric measurements.
The aerosol optical depth measured at Ascension Island via the Cimel and Microtops sun photometers at 500 nm ranged from values of 0.14 to 0.54 (Table 2, Fig. 8), and a t test value of 0.9879 indicates that the AOD was not significantly different from the long-term data from the AERONET Cimel.
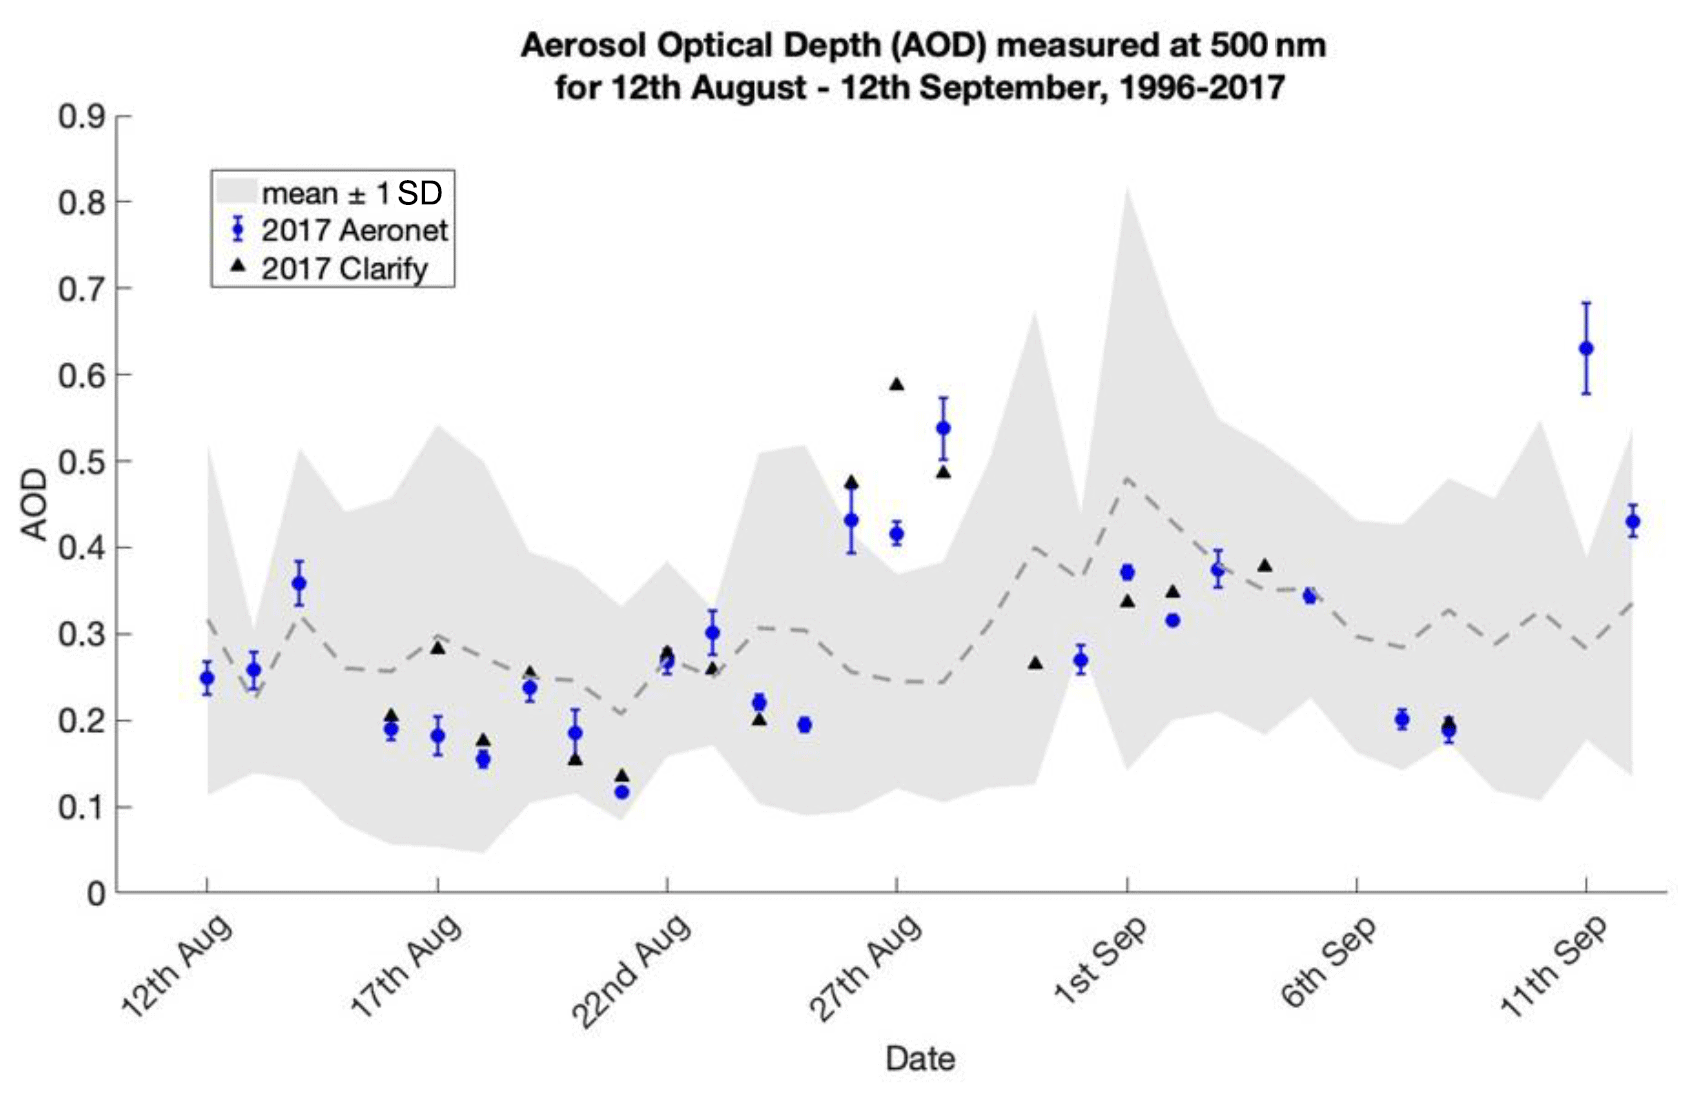
Figure 8AERONET and CLARIFY daily average AOD data, measured at 500 nm, plotted for the period 12 August–12 September 2017. The data from each year are represented by a different colour, with 2017 data shown in black circles. The CLARIFY data, measured with a Microtops sun photometer, are represented by the black triangles, while AERONET data from the ARM Mobile Facility are plotted in blue. The mean of data (1996–2016) is shown by the dashed line, with the grey shaded area representing ±1 SD (standard deviation). The vertical lines on the ARM Mobile Facility AOD data shows ±1 SD of these data.
With reference to the Key Objectives of Sect. 1.4, the following sections report the key results from our analyses.
6.1 Vertical profiles
CLARIFY-2017 was able to show that the vertical structure is quite complex, with aerosols existing either predominantly in the MBL, predominantly in the residual CBL, or existing in both the MBL and residual CBL (Fig. 9).
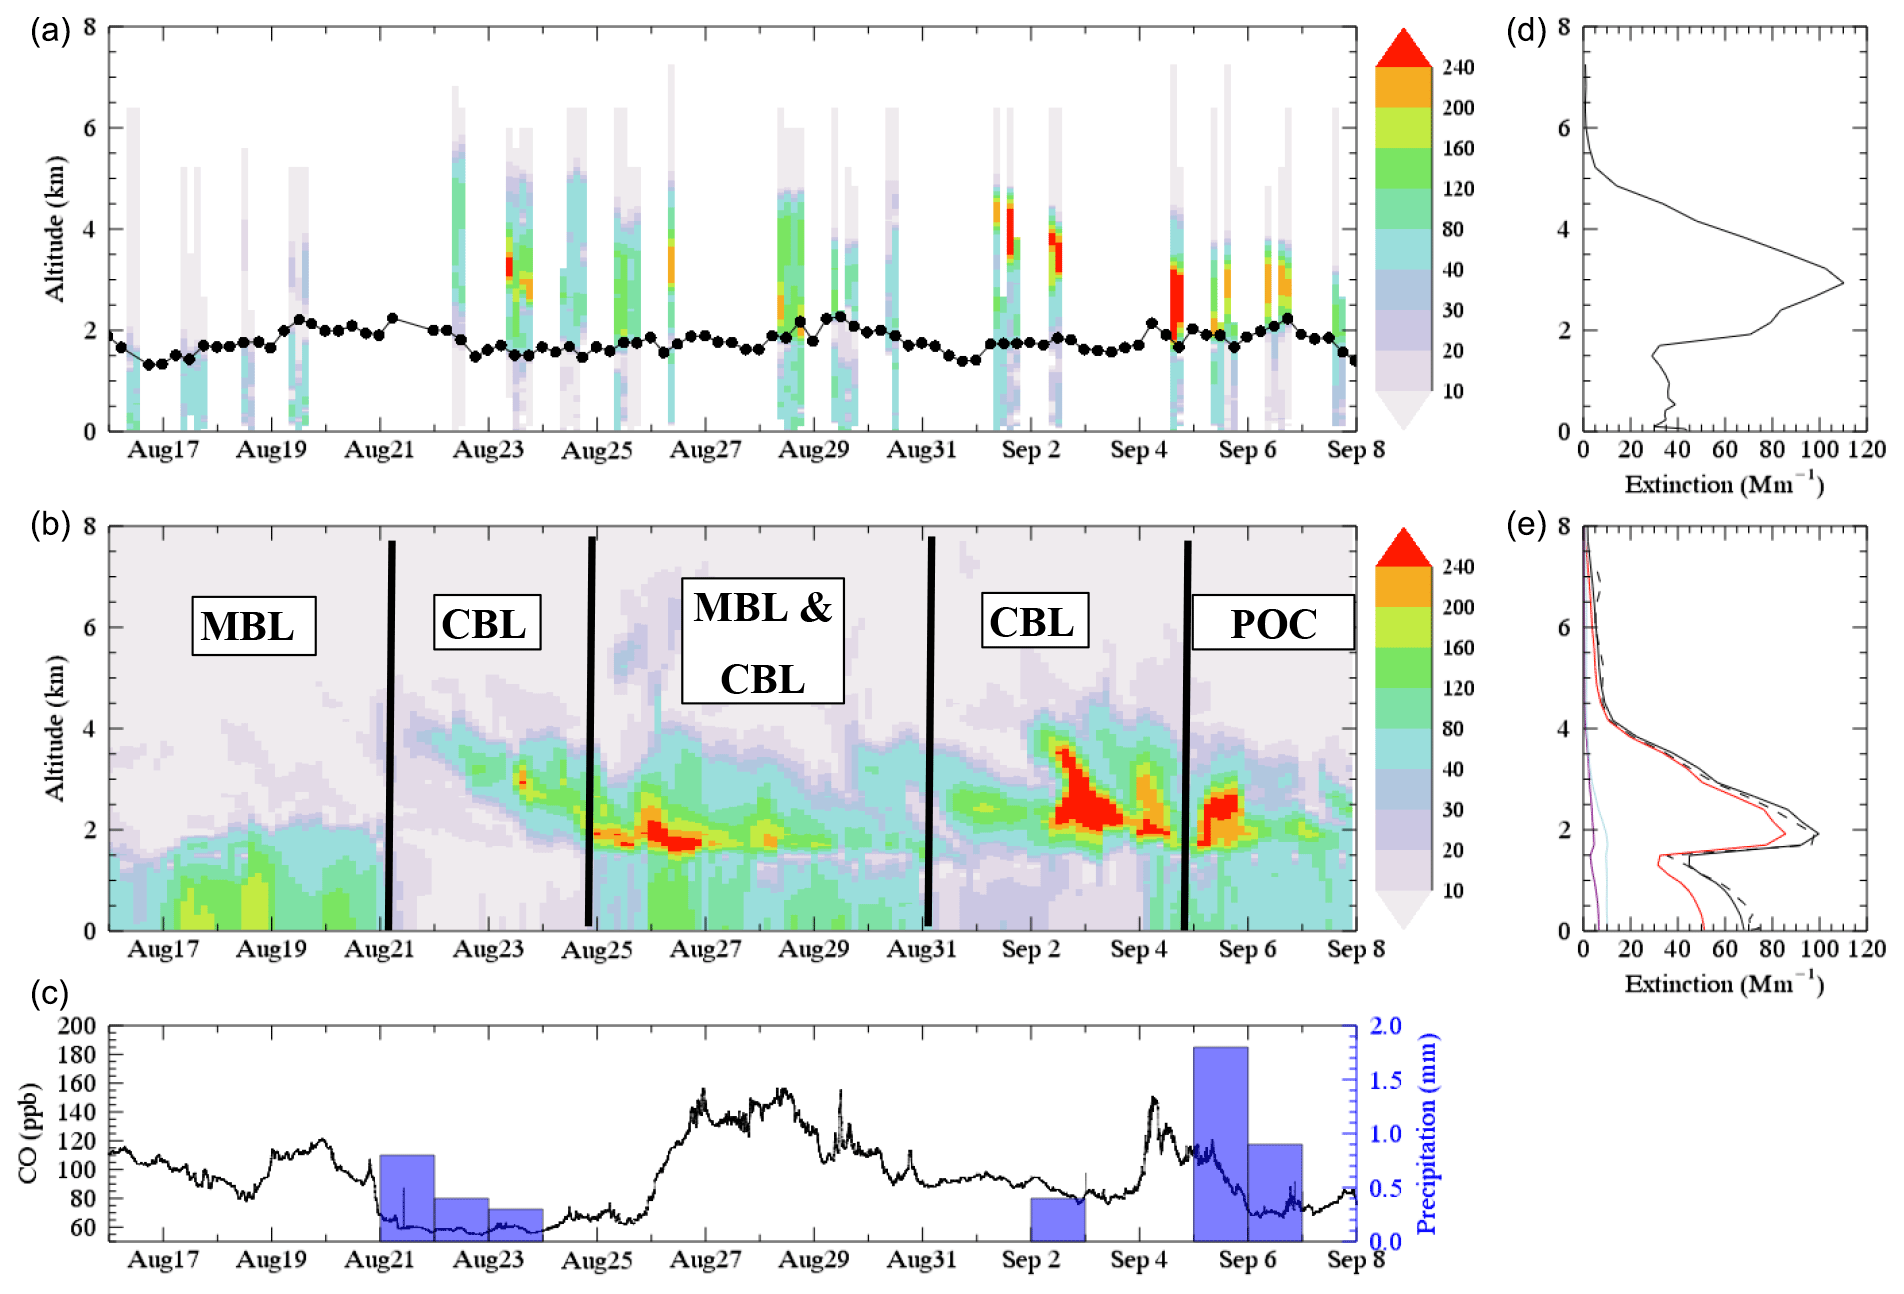
Figure 9Time series plots. (a) Vertical profiles of the submicron aerosol extinction ( m−1) derived from the EXSCALABAR instrument (405 nm, dry), with radiosonde estimates of the MBL inversion height overlaid with black circles. A mean vertical profile of aerosol extinction is also shown in (d). (b) Vertical profiles of aerosol extinction ( m−1, 405 nm, dry) from the Met Office CLUMP forecast model; MBL and CBL and POC are used to discriminate the vertical profile regimes described in Table 2. Panel (e) shows the mean profile of BBA aerosol only in red; industrial aerosol is shown in cyan and mineral dust in blue. The solid and dashed black lines show the mean aerosol profile (dry) and the mean profile (subsampled when there were FAAM flights) for all CLUMP aerosol components. (c) The carbon monoxide (CO) concentrations measured at the AMF on Ascension Island at ∼330 m a.s.l. in the MBL, with precipitation measured at the Met Office on Ascension Island included.
Figure 9 shows that the CLUMP model is generally able to represent the distribution of aerosol in the MBL and the residual CBL. Figure 9 shows that the one notable exception is when a POC was observed over Ascension Island. During the POC event towards the end of the measurement campaign, the model does not accurately represent the close-to-pristine nature of the MBL (see Abel et al., 2020).
A hierarchical cluster analysis was performed based on the mean and maximum BBA concentrations and the altitude of the maximum concentrations in the free troposphere and the mean concentration within the boundary layer for each flight. The cluster analysis based on these criteria revealed two distinct groups, with the first group (G1) including flights C028–C032 (16–19 August 2017) corresponding to the period when the aerosol was solely in the MBL, with a mean concentration over the size range 0.1–3.0 µm (Table 2) measured by the PCASP instrument on the FAAM aircraft of 685 cm−3 in the MBL but just 35 cm−3 in the free troposphere. The second group contained two subgroups with flights C034, C035, C042, and C047–C050, i.e. those showing little aerosol in the MBL (∼78 cm−3) but much in the residual CBL (∼884 cm−3). These are denoted group G2. The mean synoptic geopotential height based on these two clusters and the associated wind speed vectors are shown in Fig. 10.
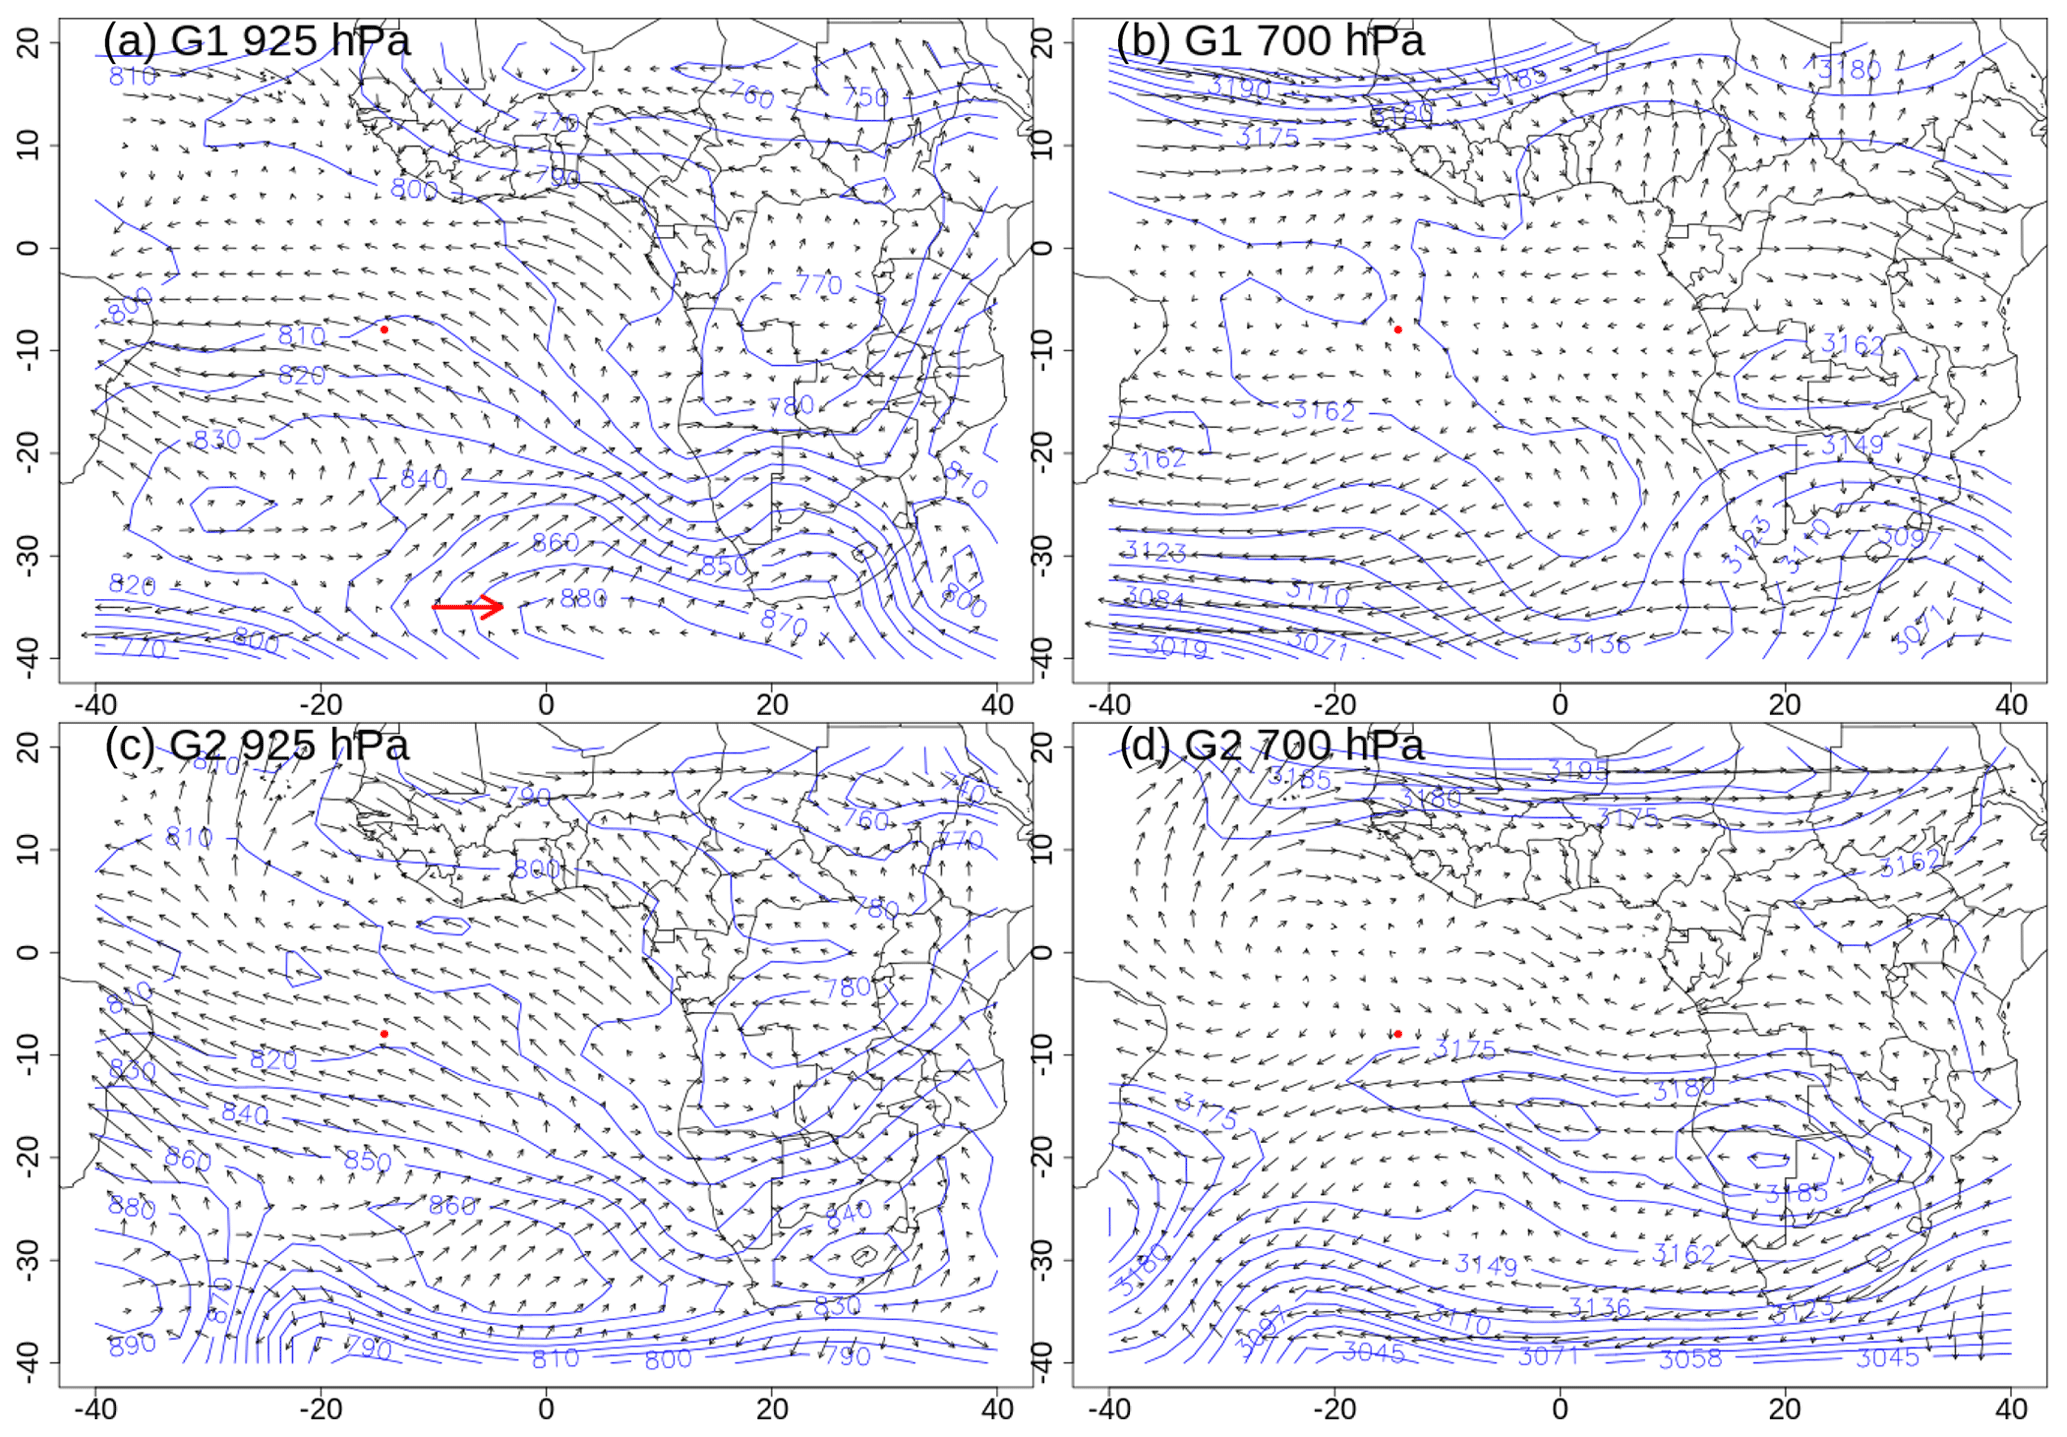
Figure 10Mean geopotential height (m) of (a) group G1 at 925 hPa, (b) group G1 at 700 hPa, (c) group G2 at 925 hPa, and (d) group G2 at 700 hPa. The x axis and y axis are longitude and latitude in degrees, respectively. Ascension Island is marked as a red dot. Wind speed and direction vectors are plotted as arrows with a reference 20 m s−1 westerly wind vector plotted in red for reference in (a).
Figure 10 shows that, although south-east winds associated with a subtropical high dominated in the MBL at the location of Ascension Island (as indicated by the 925 hPa geopotential height contours and wind vectors) for both groups G1 and G2, the locations of the high-pressure centres were different. In G1, the centre of the high pressure was located around 40∘ S, 0–20∘ E, while under G2, the centre of the high pressure was around 30∘ S, 0–10∘ W. For both G1 and G2, the MBL around Ascension Island can be influenced by air of continental origin, but the MBL in G2 is also influenced by air recirculating around the subtropical high that does not pass over the African continent, owing to the non-geostrophic and divergent flow around high pressures. This recirculation characteristic of G2 appears to explain the relatively clean MBL during the periods 21–25 August and 31 August–4 September (Fig. 9). The geopotential height fields at 700 hPa show significant differences in airflows between the two clusters. In G1, where the cases were represented by a relatively clean free troposphere, there was no clear high pressure to the south-east of Ascension Island. In contrast, in G2, high pressure extended from Namibia and Angola to the island, with associated strong easterly winds that transport smoke from the African continent to the Ascension Island region in the residual CBL (Table 2).
This analysis is enhanced by an analysis of back-trajectories (HYSPLIT4; Draxler and Hess, 1997 using ERA5 reanalyses; Hersbach et al., 2020) presented in Fig. 11, which shows trajectories initiated every 1 h for August 2017 at 50 m (lower MBL), 330 m (mid-MBL), 1000 m (upper MBL), and 2000 m (lower residual CBL).
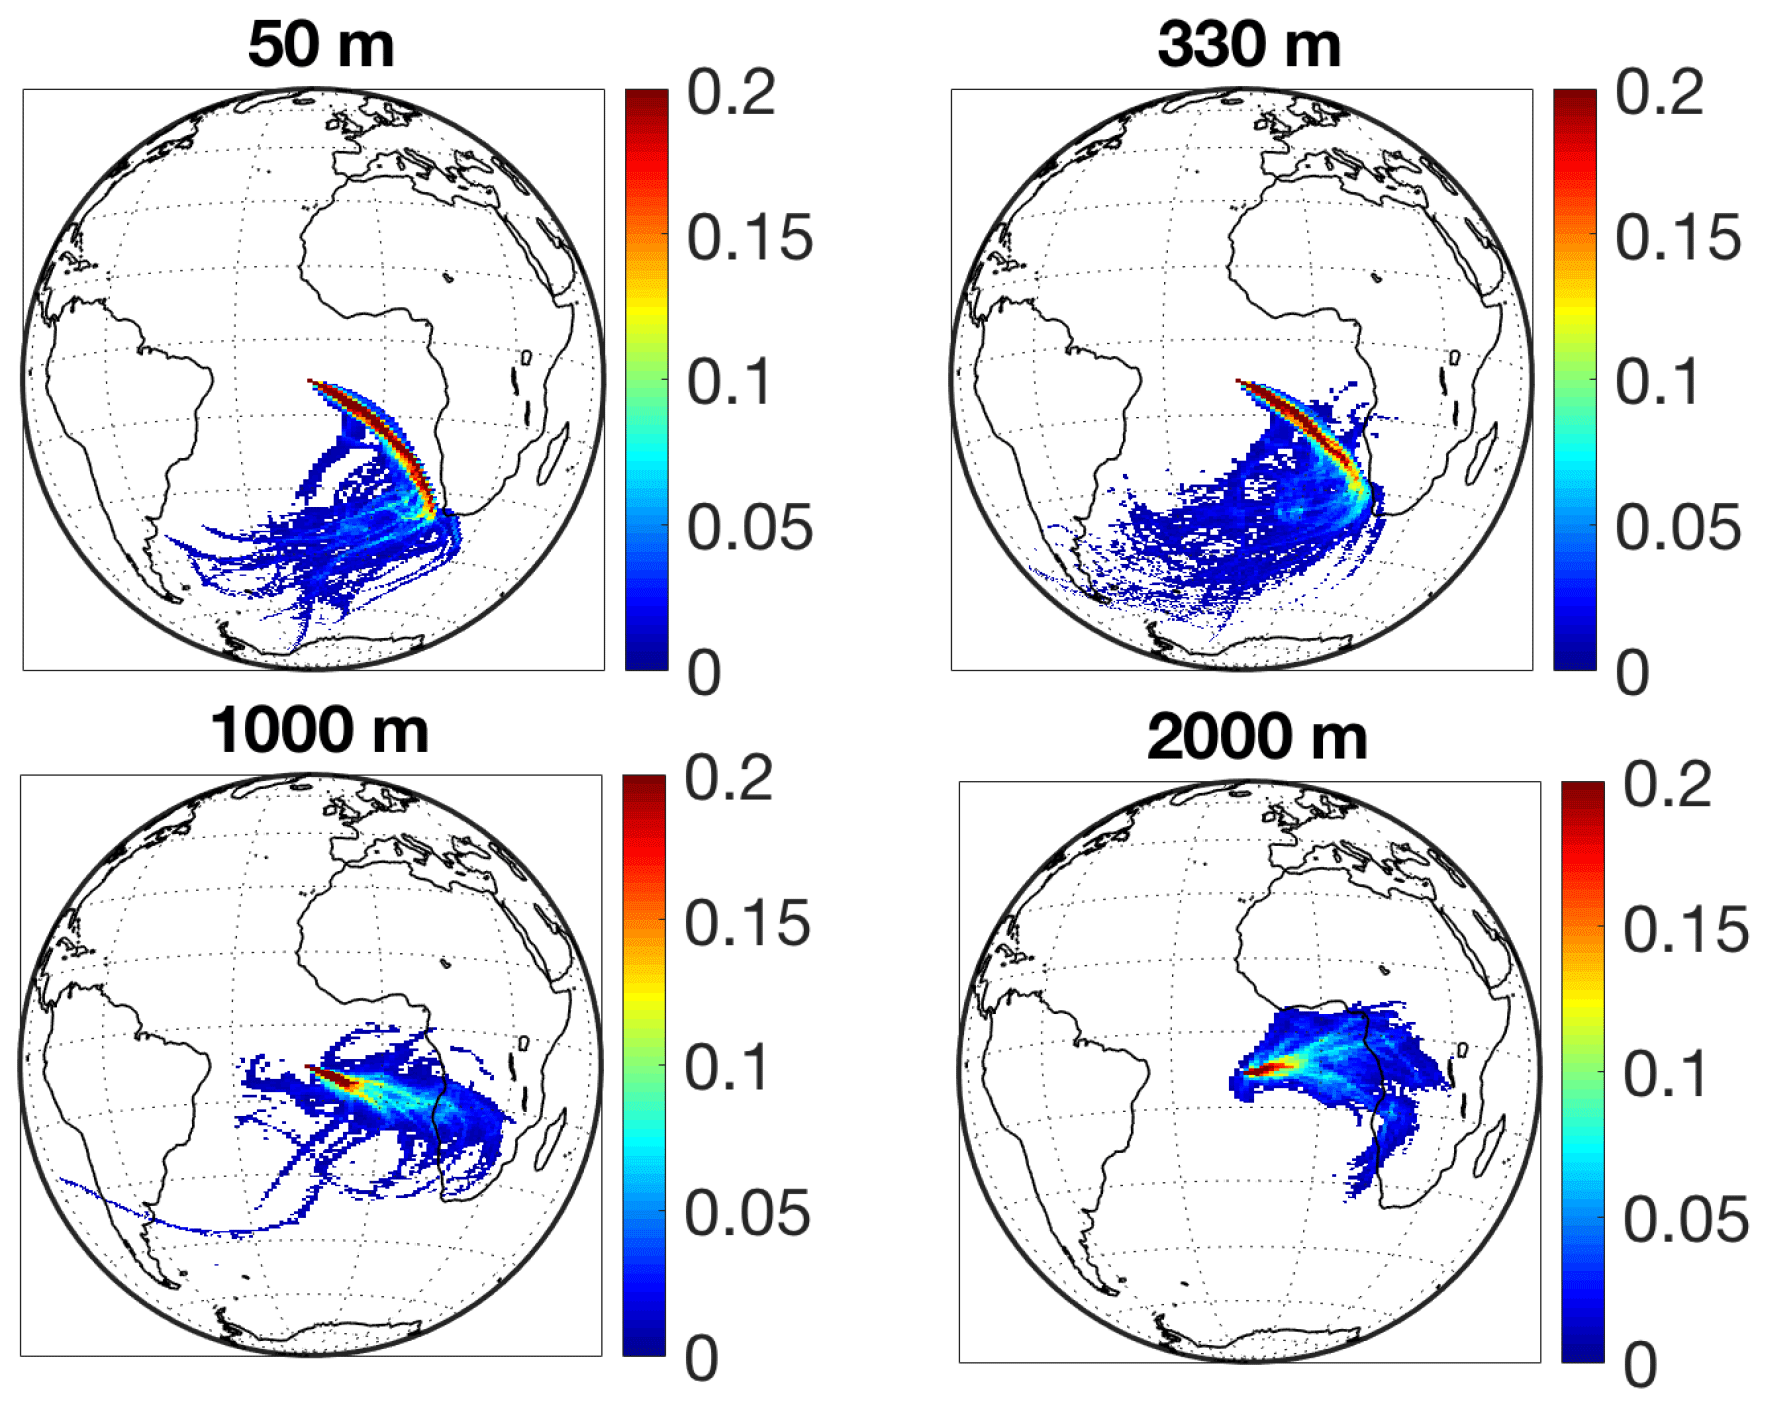
Figure 11Trajectory density plots for starting heights 50, 330, 1000, and 2000 m above sea level using HYSPLIT (Stein et al., 2015) 10 d back trajectories, averaged over August 2017. There is one trajectory initiated each hour. The colour bar depicts the density of trajectories over each latitude–longitude grid cell, with each grid cell having a minimum of five trajectories passing through it and displayed as a relative area weighted frequency.
Back-trajectories originating at 50 and 330 m over Ascension Island indicate that the flow at these levels originates in oceanic regions. At 1000 m (upper MBL), the back-trajectories indicate some influence from land areas in northern Namibia and Angola; these areas experience seasonal burning (e.g. Abel et al., 2003), and thus some of the BBA detected in the MBL is likely to come from these regions. At 2000 m, in the residual CBL, the back-trajectories indicate an easterly flow and hence more northerly source of BBA (northern Angola, Gabon, Congo, Democratic Republic of Congo, Equatorial Guinea, and Cameroon) from an area where fires are most prevalent. BBA in the residual CBL only influences the microphysics of low-lying clouds after those aerosols are entrained into the MBL. Thus, any inferences of aerosol–cloud interactions that depend on relationships between the column AOD and CDNC (e.g. Quaas et al., 2008) may be erroneous in this region (Costantino and Bréon, 2013).
As demonstrated in Fig. 9, comparison of the shape of the mean vertical distribution of aerosol extinction derived from the aircraft-based EXSCALABAR measurements and CLUMP NWP model shows a reasonable agreement, although generally the model does not extend the vertical distribution of aerosol high enough, and there is rather too much aerosol in the MBL. Simulations with the atmosphere only (i.e. not coupled to the ocean model) version of HadGEM3 (Hewitt et al., 2011) indicate that the discrepancy in the vertical distribution of aerosol is very likely due to the lack of account of aerosol radiative effects, in particular the model's neglect of aerosol absorption that “self-lofts” the air containing the BBA (Fig. 12).
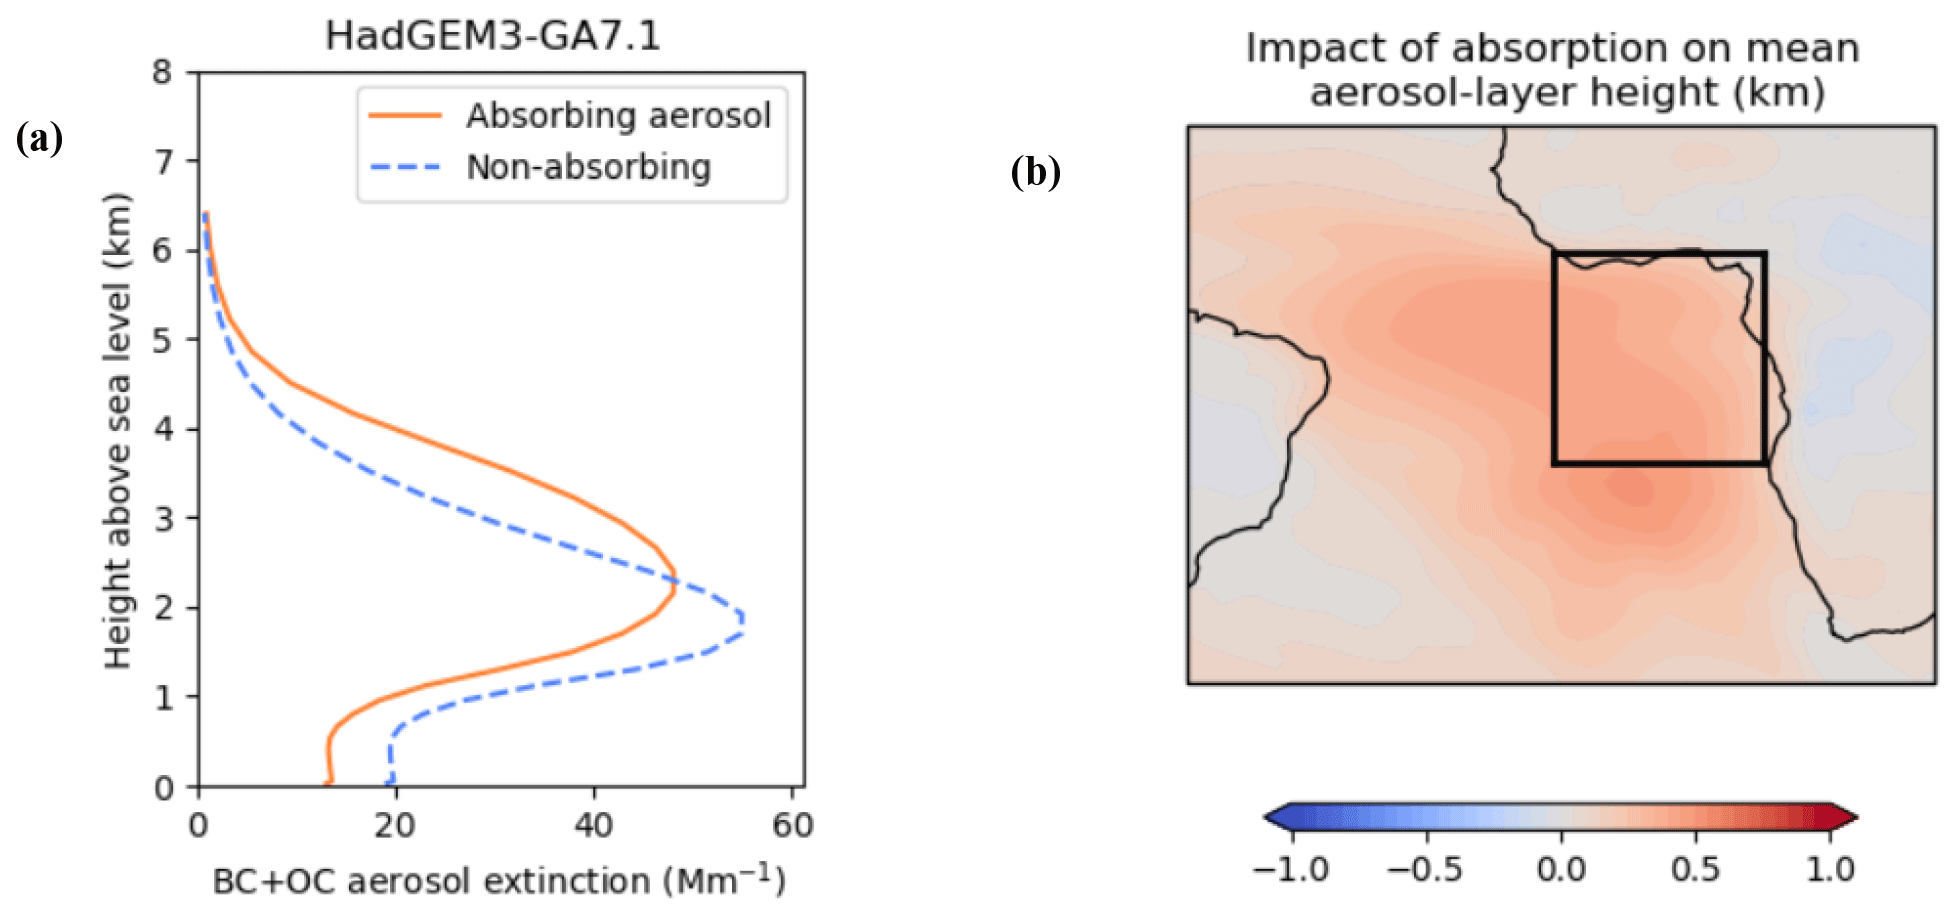
Figure 12(a) The increase in the mean altitude of BBA in the vertical profile in HadGEM3-GA7.1 version of the climate model (atmosphere only) for August/September over the area shown by the box in (b). (b) The change in the mean altitude of the aerosol loading determined as the difference in the altitude of the mean profile (as shown in a) but for each grid box.
While this “self-lofting” has been recognized for decades in smoke plumes (e.g. Westphal and Toon, 1991), the near-continental large-scale nature of the ascent rate and the counterbalancing descent elsewhere hints at a further impact of aerosol beyond aerosol direct, indirect, and semi-direct effects, that of teleconnections. Because atmospheric dynamics are constrained by physical laws of conservation of energy and momentum, any large-scale lifting of air masses must be balanced by the large-scale descent of air masses elsewhere. Figure 12b shows the spatial extent of the ascent (or the reduction in subsidence) over the region caused by absorption of the BBA. This suggests that the lack of inclusion of the radiative impacts of absorbing aerosols owing to computational constraints may have consequences on the performance of NWP models in accurately representing mean vertical velocities. In turn this may influence the strength of the Hadley and Walker circulations. However, it is acknowledged that the atmosphere-only simulations shown here neglect any dynamical changes that may be induced through changes in surface land temperatures or sea-surface temperatures (SSTs) which can induce changes in the thermally direct atmospheric circulation (e.g. Roekner et al., 2006; Sakaeda et al., 2011) and ocean heat transport, which has a large impact on the overall dynamical response (e.g. Hawcroft et al., 2018). The impacts of aerosol direct and semi-direct effects are also investigated in regional high-resolution regional climate models under the AEROCLO-sA measurement campaign (Mallet et al., 2020).
The performance of the HadGEM3 NWP model with CLUMP aerosol scheme compares favourably with the other modelling tools used in forecasting the aerosol spatial distribution. Note that, under the ORACLES project, Shinozuka et al. (2020) performed a multi-model analysis of vertical profiles of BBA against observations from ORACLES during the 2016 deployment when the NASA P3 aircraft was operating from Namibia over a wide area of the SE Atlantic closer to the African continent. Their results suggest that, for that region, each of the models analysed presents its own strengths, weaknesses, and biases, but one common feature is that all models tend to underestimate the height of the base of the smoke layer. This does not appear to be the case with the CLUMP simulations for the CLARIFY-2017 region, where the bottom of the residual CBL aerosol layer frequently corresponds to the top of the MBL (Fig. 9), forcing an accurate lower boundary for the residual CBL plume. The results comparing the CLUMP model to the observations suggest reasonable agreement in aerosol peak concentrations and in the total integrated extinction (Fig. 9), but, as noted earlier, the neglect of aerosol absorption in the NWP model appears to result in a peak aerosol concentration and upper bound of the plume that is approximately 1–2 km too low.
At the top of the MBL, a strong temperature inversion provides a strong energetic barrier to vertical mixing (e.g. Wood and Bretherton, 2006), providing an effective cap to cloud vertical extent. Figure 13 shows the observed boundary layer height as diagnosed from radiosondes launched from Ascension Island and the modelled cloud liquid water path. The Met Office NWP model represents the boundary layer height adequately over Ascension Island. The boundary layer height is important in retrievals of above-cloud aerosol properties from SEVIRI as errors impact the amount of water vapour above cloud that is assumed in the retrieval algorithm (Peers et al., 2019). Figure 13 also shows the cloud droplet number concentration as measured by the CDP instrument over the field campaign. There is clear evidence of the influence of aerosol–cloud interactions in the cloud-droplet number concentration. The cloud droplet number concentration is at its highest at the start of the measurement period, when the BBA is present in large quantities in the MBL, but abruptly transitions to its lowest value when the MBL is close to pristine. Low CDNC values are also found in the measurements when the POC is present towards the end of the deployment period (Fig. 13).
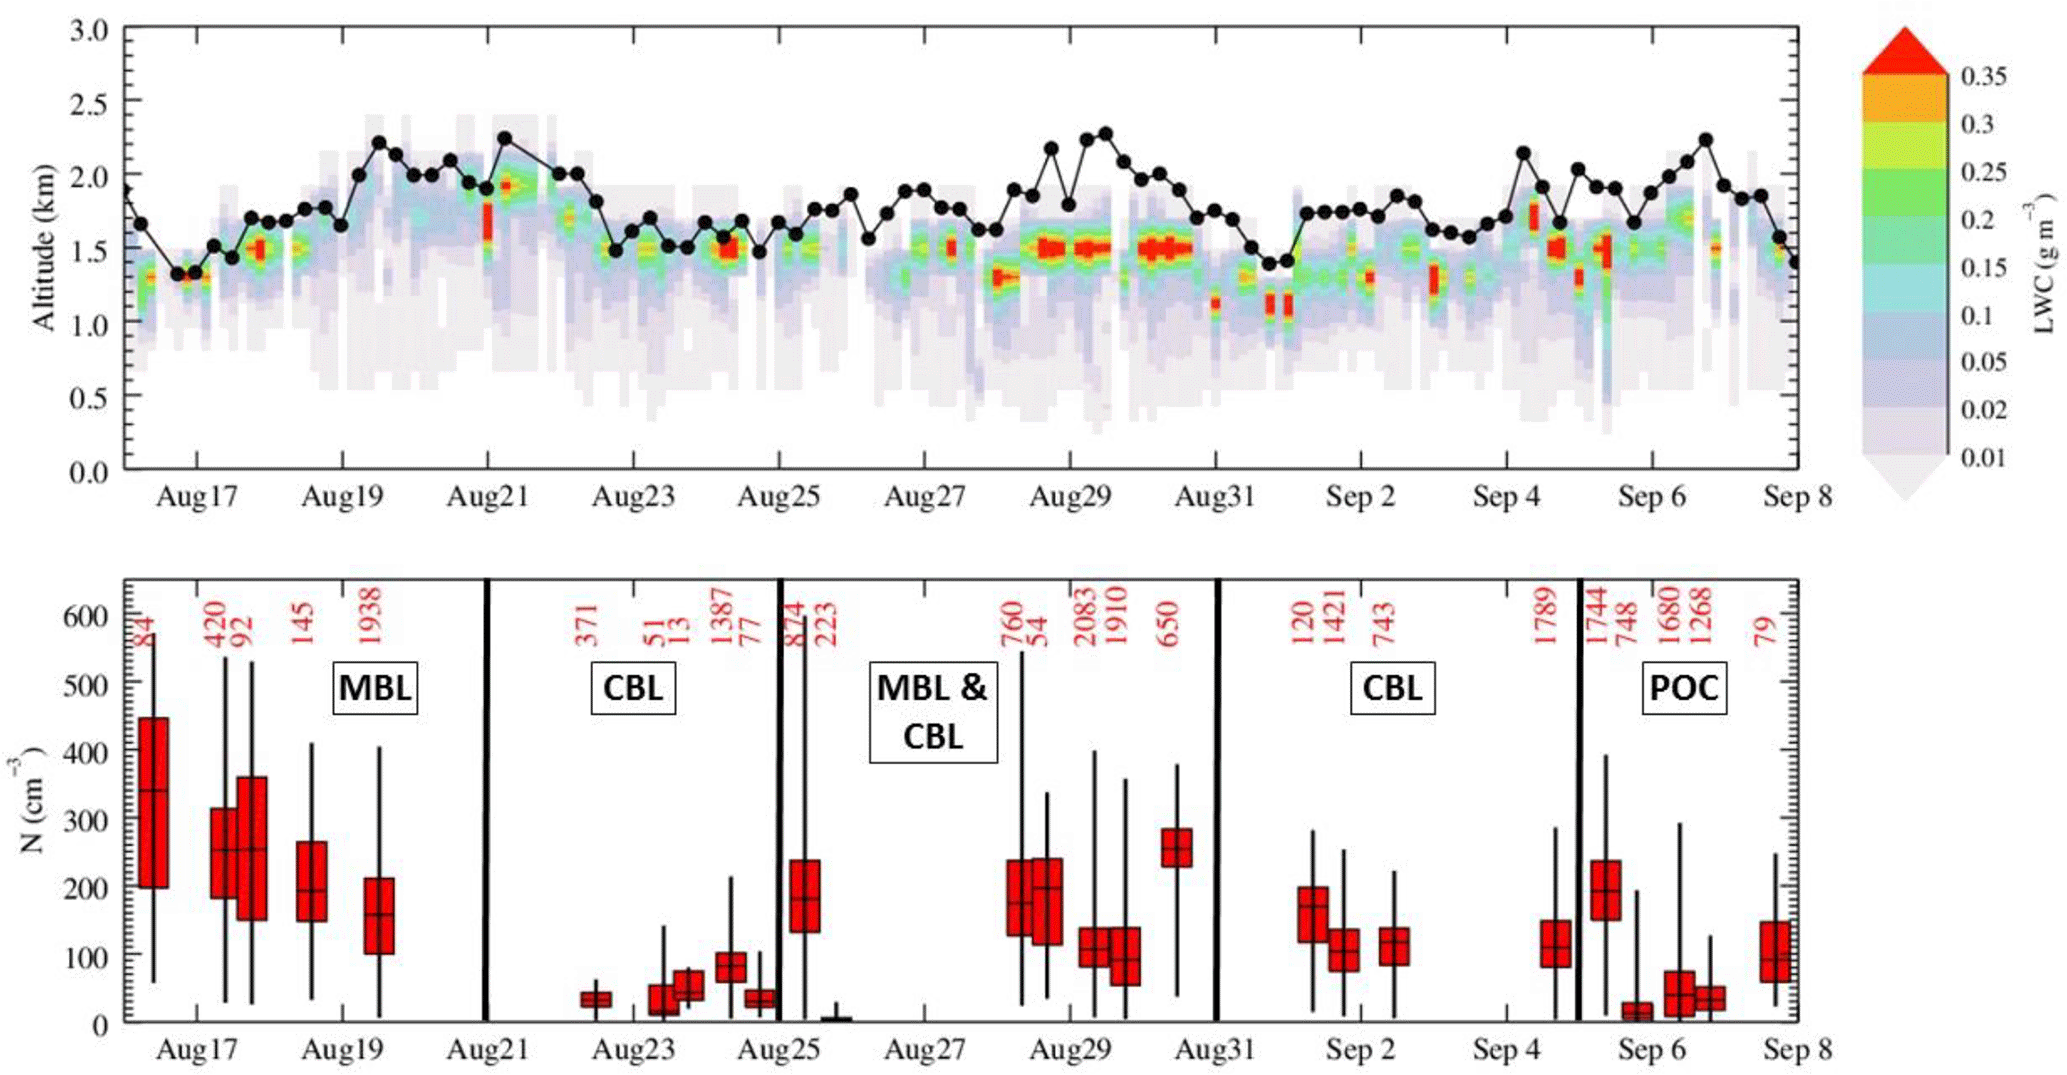
Figure 13(i) Vertical profiles of cloud LWC from the Met Office CLUMP model (colour scale) and the position of the MBL inversion derived from radiosonde ascents (black circles) and (ii) box-and-whisker plots showing the cloud drop number concentration measured from the CDP on each flight. The median value is shown by the horizontal black line, the 25 and 75 percentiles by the limits of the boxes, and the range by the whiskers. CDP data are selected for points where LWC > 0.05 g m−3 and N>5 cm−3. The number of 1 Hz data points that meet these thresholds is displayed on the figure for each flight. The general discrimination between regimes shown in Fig. 9 is shown by the bold vertical lines.
As a result of the strong vertical shear in wind speed, the time for an air parcel to leave the African continent to reach Ascension Island is shorter for aerosol higher up in the residual CBL than lower down in the CBL or in the MBL. Thus, in general, the aerosol at lower altitudes can be significantly older compared to that located at elevated altitudes (see analysis of ORACLES data by Dobracki et al., 2021). There is clear evidence from both Wu et al. (2021) and Dobracki et al. (2021) that aerosol higher up in the residual CBL exhibits a higher SSA (i.e. it is less absorbing on a per particle basis) than that lower down. Taylor et al. (2020) show that the mass absorption coefficient in the CLARIFY domain does not vary significantly with altitude. Wu et al. (2020) and Taylor et al. (2020) propose that the partitioning of a higher fraction of inorganic ammonium nitrate onto the existing particles at the colder temperatures associated with the higher altitudes explains the vertical structure in SSA in the region above Ascension Island. This explanation differs from that of Dobracki et al. (2021), who suggest loss of scattering organic material from the BBA as the aerosol ages based on data from the farther ranging ORACLES flights which encompassed a wider range of aerosol ages (see also Sect. 6.5).
Table 3Showing the models that have been fitted to aerosol size distributions. * Originally a SSA at 550 nm of 0.91 (Ascension Island) and 0.90 (off coast of Namibia) was reported for BBA, but this was reassessed using more rigorous corrections to absorption and scattering corrections to yield 0.88∕0.87 by Johnson et al. (2008). Nx represents the fractional number concentration in mode x. The refractive indices represent the effective refractive indices that combine with the size distribution and Mie scattering theory to yield the reported SSA.
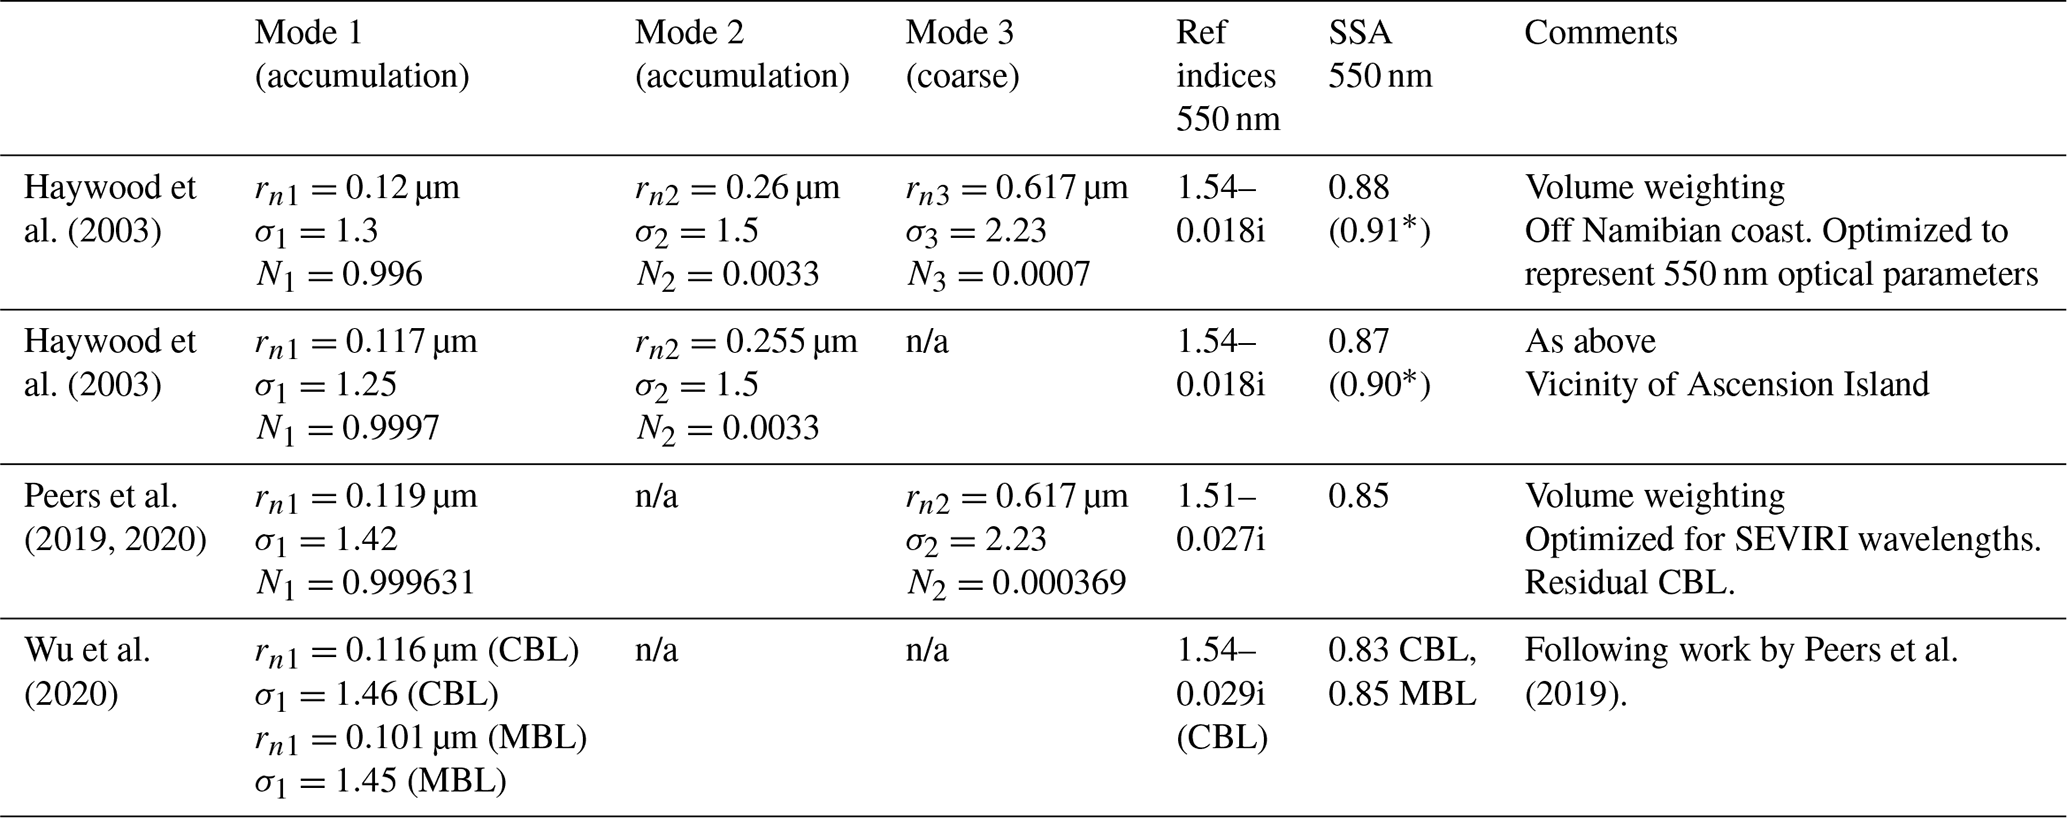
n/a stands for not applicable.
6.2 Analysis of aerosol size distributions
Prior to the ORACLES, AEROCLO-sA, LASIC, and CLARIFY-2017 campaigns, airborne measurements of BBA size distributions in the region were sparse. Haywood et al. (2003) documented the size distribution of BBA during SAFARI-2000, both close to emission source, off the coast of Namibia, and in the vicinity of Ascension Island; both of these cases are of relevance for CLARIFY-2017. Although the data presented here are quality-assured, the specific analyses performed during CLARIFY-2017 inevitably differ due to different sampling locations, sampling periods, and case studies, etc. Therefore, we present a composite of the models that are used to fit data in these studies to allow for a quantification of the error introduced by the assumptions used in each analysis. Generally, these models use log-normal fits of the form:
in which ni(r) represents the number of aerosols of radius r for mode i, rn represents the geometric mean radius, and σ is the geometric standard deviation. Table 3 shows examples of the fits of this equation to the measured or retrieved size distributions during SAFARI-2000 and CLARIFY-2017, effective refractive indices, and the resultant single scattering albedo.
The size distributions for BBA from Peers et al. (2019) and Wu et al. (2021) are consistent with those determined from SAFARI-2000, although Haywood et al. (2003) chose to describe the accumulation mode with two log-normal distributions rather than a single log-normal distribution. The corresponding refractive indices retrieved over the CLARIFY period (16 August–7 September 2017) derived from AERONET Version 2 algorithms for the Ascension Island site are 1.47–0.020i at a wavelength of 550 nm. The smaller value of the real and imaginary part of the refractive indices from AERONET compared to the in situ retrievals documented in Table 3 likely reflects that they represent column-averaged properties, and hence there is a contribution from aerosol components such as sea salt and sulfate of DMS origin within the MBL (Wu et al., 2021; Taylor et al., 2020). Wu et al. (2021) state a mean SSA at 550 nm of approximately 0.81 at 2 km altitude in the residual CBL rising to 0.86 at 5 km altitude and assign the difference in SSA to the thermodynamic impact of temperature on the partitioning of inorganic nitrate into the aerosol phase.
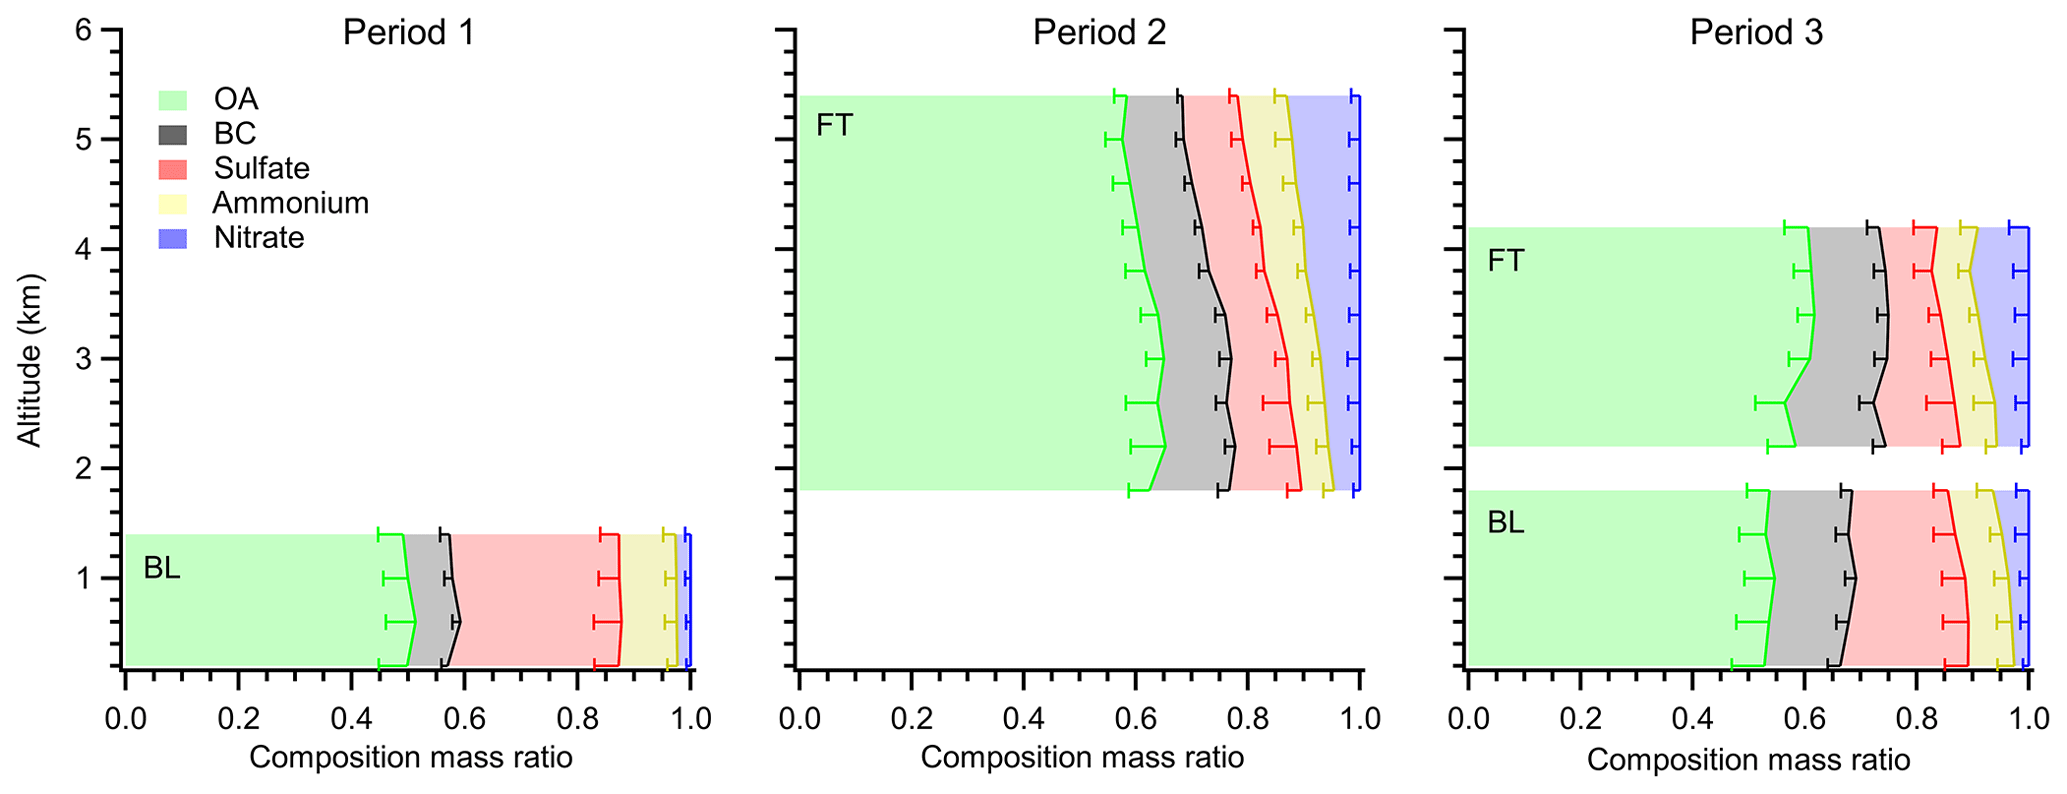
Figure 14The average vertical distribution of PM1 chemical composition ratios in the BB-polluted residual CBL and MBL separately in each period. The width of colour bars represents the average mass ratio of different species in each 400 m bin. The error bars represent 1 standard deviation. Period 1 corresponds to BBA in the MBL (16–21 July), period 2 to BBA in the residual CBL (26–31 July), and period 3 to BBA in both (22–25 July, 1–5 July) as per Fig. 9. The data shown correspond to those analysed by Taylor et al. (2020) and Wu et al. (2020).
6.3 Analysis of aerosol chemical properties
The composition of the aerosol in different layers was measured with an Aerodyne Compact Time-of-Flight airborne AMS (C-ToF AMS; Table 1), which provided organic mass, nitrate, sulfate, and ammonium mass concentrations and an SP2 to determine the BC mass concentration. Vertical profiles of these different chemical components averaged across each of the regimes, together with campaign-average compositions, are shown in Fig. 14. These data have enabled a detailed characterization of the composition of aerosol in the region (Wu et al., 2021). During periods when the residual CBL is filled with BBA, large quantities of predominately organic aerosol are present. The composition fractions (average ± SD – standard deviation) were organic aerosol (OA; 61±5) %, BC (13±3) %, SO4 (11±4) %, NO3 (8±3) %, and NH4 (7±2) % (Wu et al., 2021; Taylor et al., 2020), suggesting a BC ∕ OM (organic matter) ratio of around 0.21. Notably, the inorganic components are present in significant mass concentrations, and the fraction of ammonium and nitrate present increases with altitude. The MBL displays a greater proportion of sulfate than the residual CBL, while the mass fractions of nitrate, BC, and OA are lower in the MBL. This increased sulfate mass fraction in the MBL is likely due to the formation of sulfate from DMS oxidation in the MBL since similar concentrations are present during clean (MBL) periods. The main chemical properties and processes governing the particulate chemistry are discussed in detail by Wu et al. (2021).
6.4 Analysis of in situ aerosol optical properties
A key objective of CLARIFY-2017 was to assess, to the highest degree of accuracy possible, aerosol optical properties, with a particular focus on the aerosol SSA, owing to its strong influence on the aerosol direct radiative effect. Such an objective precludes the use of filter-based observations which are subject to a wide range of empirical corrections (e.g. Bond et al., 1999; Davies et al., 2019) and have been shown under some conditions to yield uncertainties in absorption of over 200 % (Lack et al., 2008; Cappa et al., 2008). Recognizing the crucial importance of aerosol absorption for understanding aerosol–climate interactions, the UK Met Office has developed and tested a new state-of-the-art spectroscopic instrument for accurate measurement of aerosol optical properties. The instrument (EXSCALABAR; Table 1) employs multiple cavity ring-down extinction and photo-acoustic absorption spectrometers to determine multi-wavelength measurements of optical attenuation coefficients for dry, humidified, and thermally denuded aerosols to high precision and accuracy (Davies et al., 2018, 2019; Cotterell et al., 2019, 2020). Davies et al. (2019) examined the biases in filter-based retrievals of the aerosol absorption. While these biases were far more modest than those derived by Lack et al. (2008) and Cappa et al. (2008), they remained of a significant level (∼20 %) for aged BBA and depended on the correction scheme; the biases were reduced to levels of <11 % using advanced two-stream radiative transfer correction schemes (Müller et al., 2014) but took values up to 21 % when using the more common correction scheme of Bond et al. (1999). For other aerosol sources such as urban aerosols, Davies et al. (2019) report an overestimation of absorption from filter-based measurements using the correction scheme of Bond et al. (1999) of up to 45 %.
Davies et al. (2019) performed an analysis of the SSA of aerosol dominated by BBA in both the MBL and the residual CBL derived from EXSCALABAR and presented detailed probability distributions of the derived SSA, finding mean values of 0.84, 0.83, and 0.81 at 467, 528, and 652 nm respectively. Wu et al. (2021) extended this analysis, reporting column-weighted dry SSAs derived from EXSCALABAR, and found a mean and standard deviation of 0.85±0.02, 0.83±0.03, and 0.82±0.03 at 405, 550, and 658 nm respectively in the residual CBL, with evidence that the SSA increased with altitude in the residual CBL. Interestingly, these mean values are somewhat lower than those obtained during ORACLES-2016 measurements (Pistone et al., 2019; SSA at 500 nm of 0.85–0.88) but are in agreement with those from radiometric measurements, which do not rely on filter-based absorption instrumentation, derived from nine above-cloud flights of the NASA P3 aircraft during the 2016 and 2017 ORACLES campaign (Cochrane et al., 2020).
In the MBL, Wu et al. (2021) report SSAs and standard deviations derived from EXSCALABAR of 0.86±0.02, 0.85±0.03, and 0.84±0.03 at 405, 550, and 658 nm respectively. Zuidema et al. (2018b) report SSAs from the ARM site (at ∼330 m a.s.l., i.e. residing in the MBL) of 0.78±0.02 for August 2016–2017 and 0.81±0.03 for September 2016–2017 (interquartile range) at 529 nm, which suggest stronger absorption than the study of Wu et al. (2020). Zuidema et al. (2018b) acknowledge that the filter-based systems are dependent on the artefact-correction algorithm and use the mean of the correction from Virkkula (2010) and Ogren et al. (2010) algorithms. However, their filter-based measurements agreed with measurements made with those from an AERODYNE CAPS-SSA instrument deployed in July–September 2017; both yielded values of 0.77 at 529 nm. Without these additional measurements, the apparent discrepancy between the ARM and CLARIFY measurements could have been attributed to the remaining biases associated with filter-based correction algorithms. Davies et al. (2019) showed that these correction algorithms typically overestimate aerosol absorption, and without moving to more advanced two-stream correction algorithms (Müller et al., 2014), these correction algorithms underestimate the SSA by around 0.03 to 0.04 at 550 nm for measurements made during CLARIFY-2017. In addition, the MBL mass absorption coefficients are consistent between CLARIFY (Taylor et al., 2020) and LASIC (Zuidema et al., 2018b), indicating that it is the scattering measurements that differ between the two campaigns, rather than the more challenging absorption measurements. Work is currently underway to fully investigate these discrepancies. One possibility is that the impactor used in sampling the aerosol for CLARIFY may not correspond exactly to that for the AMF inlet (1.3 and 1.0 µm aerodynamic diameter respectively). Thus, a fraction of supermicron sea salt aerosols may increase the SSA for the CLARIFY-2017 measurements.
It is clear from the results of Wu et al. (2021) and Taylor et al. (2020) that many of the aged BBA particles in the vicinity of Ascension Island consist of a core of black carbon with a thick coating of organic and inorganic material (shell ∕ core diameter ratio ranging from around 2.3 at the surface to approximately 2.6 at 5 km a.s.l.). Over the wavelength range 405–660 nm there is little evidence of absorption by organic “brown” carbon, but there is clear evidence of absorption enhancement via a lensing effect, whereby incident radiation is focussed onto the absorbing core of black carbon; this effect was also suggested by Zuidema et al. (2018b). Taylor et al. (2020) show that aerosol optical properties are not well represented when using Mie scattering theory and volume weighting of refractive indices that is currently used in many GCMs (general circulation models) such simple mixing rules are unable to simultaneously represent both the mass absorption coefficient and the SSA of the BBA. While the models documented in Table 3 utilize volume weighting of refractive indices, the resultant mass absorption coefficient (i.e. the mass-normalized aerosol absorption cross section) using a straightforward Mie theory model with these volume-weighted effective refractive indices does not agree with measurements derived from the EXSCALABAR, AMS, and SP2 instruments (Taylor et al., 2020). Internally consistent optical closure of both the optical parameters and the mass absorption coefficient can be improved using core ∕ shell Mie scattering treatment of a black carbon core and an organic and inorganic coating but can be most accurately reconciled using more complex semi-empirical parameterizations of mixing state (Taylor et al., 2020).
6.5 Aerosol ageing
BBA measured in the vicinity of Ascension Island was always very aged (>7 d from emission; Wu et al., 2021) and consisted of a thick coating of organics and inorganics surrounding an insoluble black carbon core (Taylor et al., 2020). While these measurements alone do not allow us to estimate the impacts of ageing on aerosol physical and optical properties, the same instrumentation has been flown during other campaigns, e.g. Methane Observations and Yearly Assessments (MOYA; Allen et al., 2017; Davies et al., 2019; Wu et al., 2020), that made measurements much closer to the source regions of the biomass burning over continental Africa (Davies et al., 2019; Wu et al., 2020). Wu et al. (2020) use identical measurement systems to those used during CLARIFY-2017 and report mean shell ∕ core diameter ratios for BBA of as little as 1.07 (SD 0.10) for BBA less than 30 min subsequent to emission, increasing to 1.39 (SD 0.06) for BBA 3–6 h subsequent to emission, and 1.66 (SD 0.07) for BBA 9–12 h subsequent to emission. The shell ∕ core ratios of 2.3–2.6 determined during CLARIFY-2017 suggest that the coating has continued to thicken as the BBA ages and the constituent components become increasingly internally mixed. Davies et al. (2019) also use nominally identical EXSCALABAR instrumentation during MOYA to determine a BBA SSA of around 0.91 at wavelengths close to 550 nm for BBA that has aged by 9–12 h since emission. Scanning electron microscope measurements made as long ago as SAFARI-2000 suggested that, on emission, black carbon consisted of individual spherules in chain-like structures (Posfai et al., 2003). Owing to surface tension effects, these chain structures collapse to more compact cores when coated by organic aerosol that was either formed at source or through the condensation of semi-volatile organic species within a few seconds from emission (e.g. Posfai et al., 2003; Abel et al., 2003). The black-carbon chain-like structures have a higher fractal dimension and a higher absorption efficiency compared to the more compact cores (Chakrabarty and Heinson, 2018). Together with the condensation of organic or volatile inorganics, which are predominantly scattering in nature, one might expect the SSA to increase with time (e.g. Abel et al., 2003). However, this condensation of scattering species can have the opposite effect, acting effectively as a lens focussing radiation on the absorbing core. Additionally, oxidation and nitration of the organic components could lead to an increase in absorption by “brown” carbon (e.g. Saleh et al., 2015), but conversely photochemical bleaching of BBA particles has been noted in laboratory studies (e.g. Zhong and Jang, 2014).
Trajectory simulations prove that aerosol high up in the atmosphere is generally younger (Dobracki et al., 2021; Sect. 6.1). From ORACLES measurements, Dobracki et al. (2021) suggest that the changes in the aerosol SSA as the aerosol ages are due to a reduction of organic material through evaporation. However, the vertical profile of the chemical composition of the BBA may be complicated by differences in the thermodynamic structure of the residual CBL and the condensation of inorganic nitrate into the aerosol phase (Wu et al., 2021; Taylor et al., 2020). Taken together, at the process level, the competing effects of fractal-chain collapse, evolving lensing effect from increasing coating thicknesses, changing absorption of the BrC coating, and the details of condensation and evaporation of volatile aerosol components make the ageing process particularly complex and not attributable to a single change in aerosol microphysics. What is clear is that the BBA measured during CLARIFY appears to be more strongly absorbing than that emitted at source, indicating that as BBA ages, the mechanisms that increase absorption outweigh those that may decrease absorption. However, at the time of writing, the contribution of the processes documented above remains an open issue and will undoubtedly be the subject of further work.
6.6 Aerosol–radiation interactions
Aerosol–radiation interactions have been investigated at several scales. Peers et al. (2019, 2020) have developed a novel above-cloud aerosol detection algorithm from the geostationary SEVIRI instrument. Importantly, this retrieval accounts for the impacts of water vapour in the relatively wide SEVIRI spectral bands by assimilating humidity profiles from the Met Office NWP global model, leading to improvements in the accuracy of the retrievals (Chang and Christopher, 2016). A comparison against above-cloud retrieval algorithms developed from MODIS (Meyer et al., 2015) has been performed revealing some systematic differences, but overall the agreement in cloud and aerosol properties is satisfactory (Peers et al., 2020). The geostationary nature of the SEVIRI satellite instrument means that, unlike polar orbiting satellite retrievals which require precise colocation, coherent comparisons between aircraft and SEVIRI retrievals are possible. A number of cases have been investigated, with encouraging agreement between aircraft and SEVIRI retrievals (Peers et al., 2020). Additional work has confirmed the strong magnitude of the above-cloud direct radiative effect using OMI and MODIS (De Graaf et al., 2019), and a comparison of the above-cloud direct radiative effect from various space-borne sensors has been performed (De Graaf et al., 2020).
Herbert et al. (2020) examined semi-direct effects (sometimes referred to as rapid adjustments to aerosol–radiation interactions) from absorbing aerosol layers overlying the southern Atlantic stratocumulus deck using large eddy simulation (LES) modelling. Herbert et al. (2020) diagnose SDEs (W m−2) from changes in the cloud resulting in modelled fast feedbacks. SDEs diagnosed in this way in the region appear to have a strong diurnal cycle, peaking in the morning, so daily averaged SDE is much weaker than instantaneous values would suggest. Aerosol layers located immediately above the cloud exert strong SDE by affecting the temperature inversion at the top of the MBL and reducing the entrainment of air into the stratocumulus. The LES simulations suggest that this SDE weakens considerably with increasing distance between aerosols and clouds, with SDE exerted by aerosol layers 250 m away from the cloud top roughly half of that of layers located just above the cloud top and almost no SDE when the aerosol layer is 500 m above the cloud top. An analysis of lidar profiles from the NASA Cloud–Aerosol Transport System (CATS) lidar (5 km resolution, V3-00, mode 7.2, level 2 Daytime Operational Layer Data Product, 1064 nm wavelength), which, owing to the longer wavelength, has been shown to be able to penetrate through the thick BBA layers over the SE Atlantic (Deconu et al., 2019), suggests that in some 27 % of cases the aerosol base is within 500 m of the cloud top and therefore close enough to exert a SDE (Fig. 15). Additionally, in 22 % of cases the whole BBA layer is within 2 km of the cloud top; yet only 3 % of cases are within 1 km. Of course, this analysis is over a far greater area than that sampled in the vicinity of Ascension Island (Fig. 7) and includes areas off the coast of Angola and Namibia where “clear slots” (Hobbs, 2003; Haywood et al., 2003; Redemann et al., 2020) are more evident.
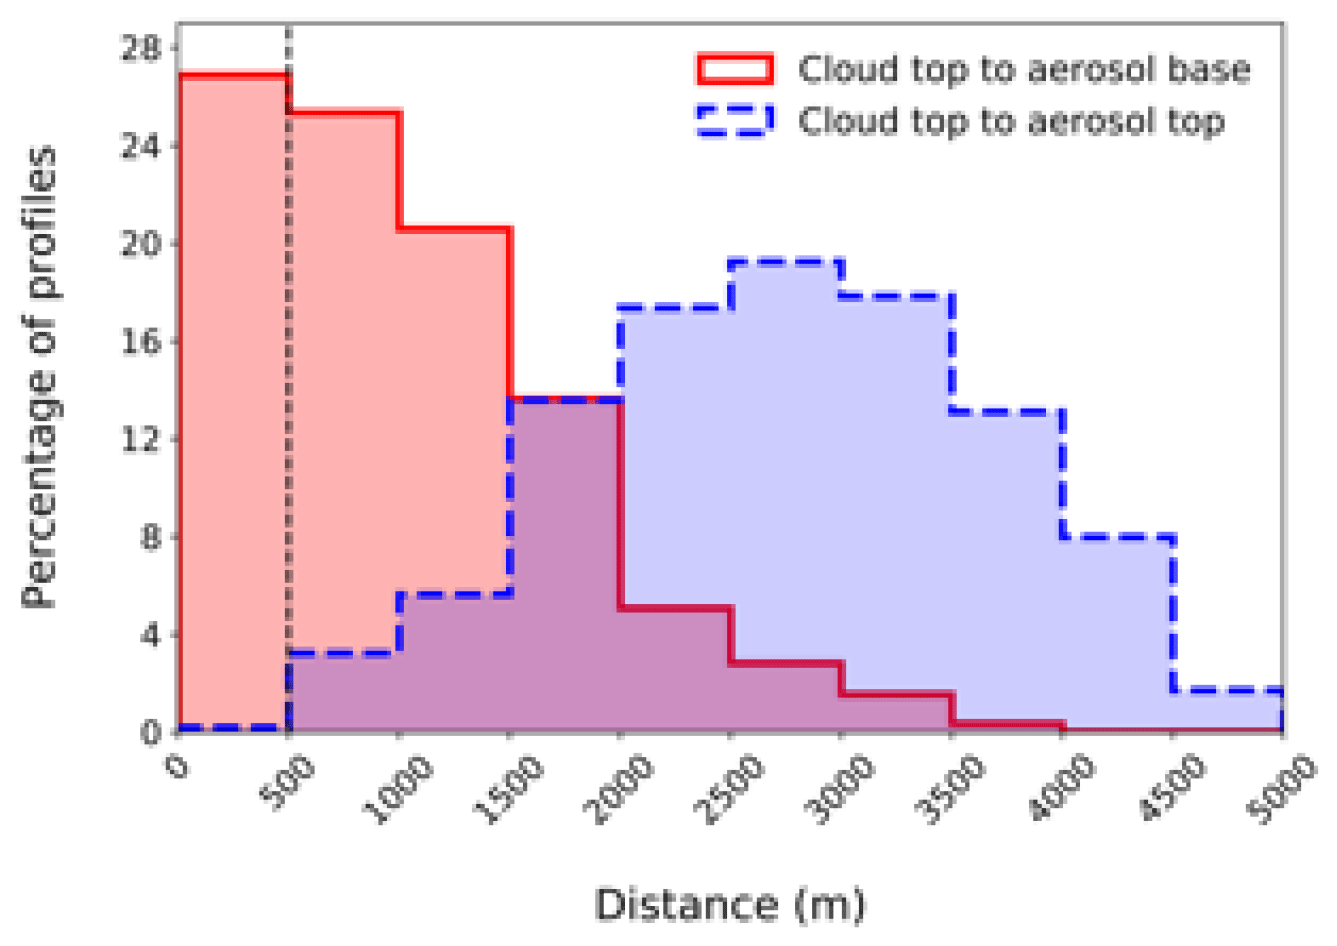
Figure 15Analysis of the vertical gap that is apparent between underlying clouds and overlying BBA observed using the CATS lidar. The data analysed are for July, August, and September in the years 2014–2017. All profiles are within the area 20∘ S–5∘ N and 10∘ W–15∘ E and are taken from retrievals where there is a single liquid cloud layer below 2.5 km and a single BBA layer in the same profile. The solid red line corresponds to the distance between cloud top and BBA base (percentage of occurrence is for all profiles), and the dashed blue line corresponds to the distance between cloud top and BBA top (percentage of occurrence only for profiles where the BBA layer is above the cloud). The dashed black line at 500 m highlights the distance beyond which LES simulations by Herbert et al. (2020) suggest there is little or no SDE.
Note that these results contrast with others. The global-model-focussed work of Che et al. (2020) suggests that aerosol SDEs are stronger than those from direct and indirect effects (see section 6.9). In common with earlier studies (e.g. Johnson et al., 2004), the magnitude and the sign of the SDE are dependent on the relative location of BBA and clouds, as BBA can either increase the underlying cloud LWP or decrease the surrounding droplet numbers depending on whether the BBA are above or inside the cloud. Zhang and Zuidema (2019) also found that the cloud top inversion was often weaker when aerosol was likely present in the free troposphere, during August 2016–2017, rather than stronger, and attributed this to a meteorological effect; the residual of the CBL containing the aerosol is also often cooler than the air it is replacing. Such disagreements may stem from the relative ability of different models to resolve changes in boundary layer moisture and in the temperature inversion above stratocumulus, the lack of weakening of subsidence from BBA heating in LES studies (Myers and Norris, 2013), and confounding effects from meteorology.
6.7 Aerosol–cloud interactions
The magnitude of aerosol–cloud interactions has been the subject of intense debate over the past 2 decades. While there is clear evidence of the Twomey effect (Twomey, 1977) from recent comprehensive satellite assessments of ship-tracks and degassing volcanoes (e.g. Malavelle et al., 2017; Christensen et al., 2014; Toll et al., 2017, 2019), there is generally a lack of clear evidence of the cloud lifetime or Albrecht effect (Albrecht, 1989) as the impact appears to be strongly dependent on the atmospheric state (e.g. Chen et al., 2015; Toll et al., 2019). On a cloud-by-cloud basis, there is considerable evidence from observational studies of subtropical stratocumulus (e.g. Comstock et al., 2004; Wood, 2005; Possner et al., 2020) that if there is an increase in the CDNC at a fixed cloud liquid water content, then the auto-conversion process by which cloud droplets grow to a size big enough to initiate precipitation should be inhibited.
On a statistical basis throughout the CLARIFY-2017 campaign, a strong cloud response to aerosol loading is observed (Fig. 16; see Barrett et al., 2021b, for more details), where increased aerosol concentrations (Na) under polluted MBL conditions (median Na=437 cm−3, interquartile range 305–569 cm−3) resulted in greater cloud droplet concentrations (median CDNC = 111 cm−3, interquartile range 62–170 cm−3) than were observed for clean conditions (median Na=53 cm−3, interquartile range 25–93 cm−3, median CDNC = 7 cm−3, interquartile range 1–34 cm−3), where clean and polluted conditions are defined using a CO threshold of 83 ppb. There was also a corresponding influence on the cloud droplet effective diameter, consistent with the Twomey effect (Twomey, 1977), whereby the cloud droplets were observed to be significantly smaller under polluted conditions than compared to clean conditions (cloud effective radii of 9 and 18 µm respective median values) despite the observation from the LASIC AMF that the LWP generally increases with pollution levels for the CLARIFY time period (Barrett et al., 2021b). Generally the cloud top altitudes (Zct) were found to be higher under polluted conditions than clean conditions. The influence of pollution on precipitation was also examined; approximately 42 % of in-cloud data points (defined as total water content from the Nevzerov probe > 0.01 g m−3) contained drizzle (defined where drizzle water content > 0.01 g m−3) in clean conditions compared to approximately 24 % in polluted conditions. Care must be taken when interpreting these initial results as they may be influenced by the overall sampling strategy and the potential influence of the BBA impacts on reduced subsidence (Myers and Norris, 2013); further work is ongoing examining the co-variability of cloud microphysical and meteorological influences. However, these conclusions do appear consistent with data derived from independent carbon monoxide (CO) and precipitation data obtained from the ARM mobile site and precipitation measurements from the Met Office located on Ascension Island. We extend the analysis period to August–September for 2016 and 2017 and precipitation data from the Met Office at Ascension Island which are less likely to be impacted by orographic effects than precipitation at the LASIC AMF site. Figure 17 shows the resulting distributions of CO concentration for precipitating and non-precipitating days.
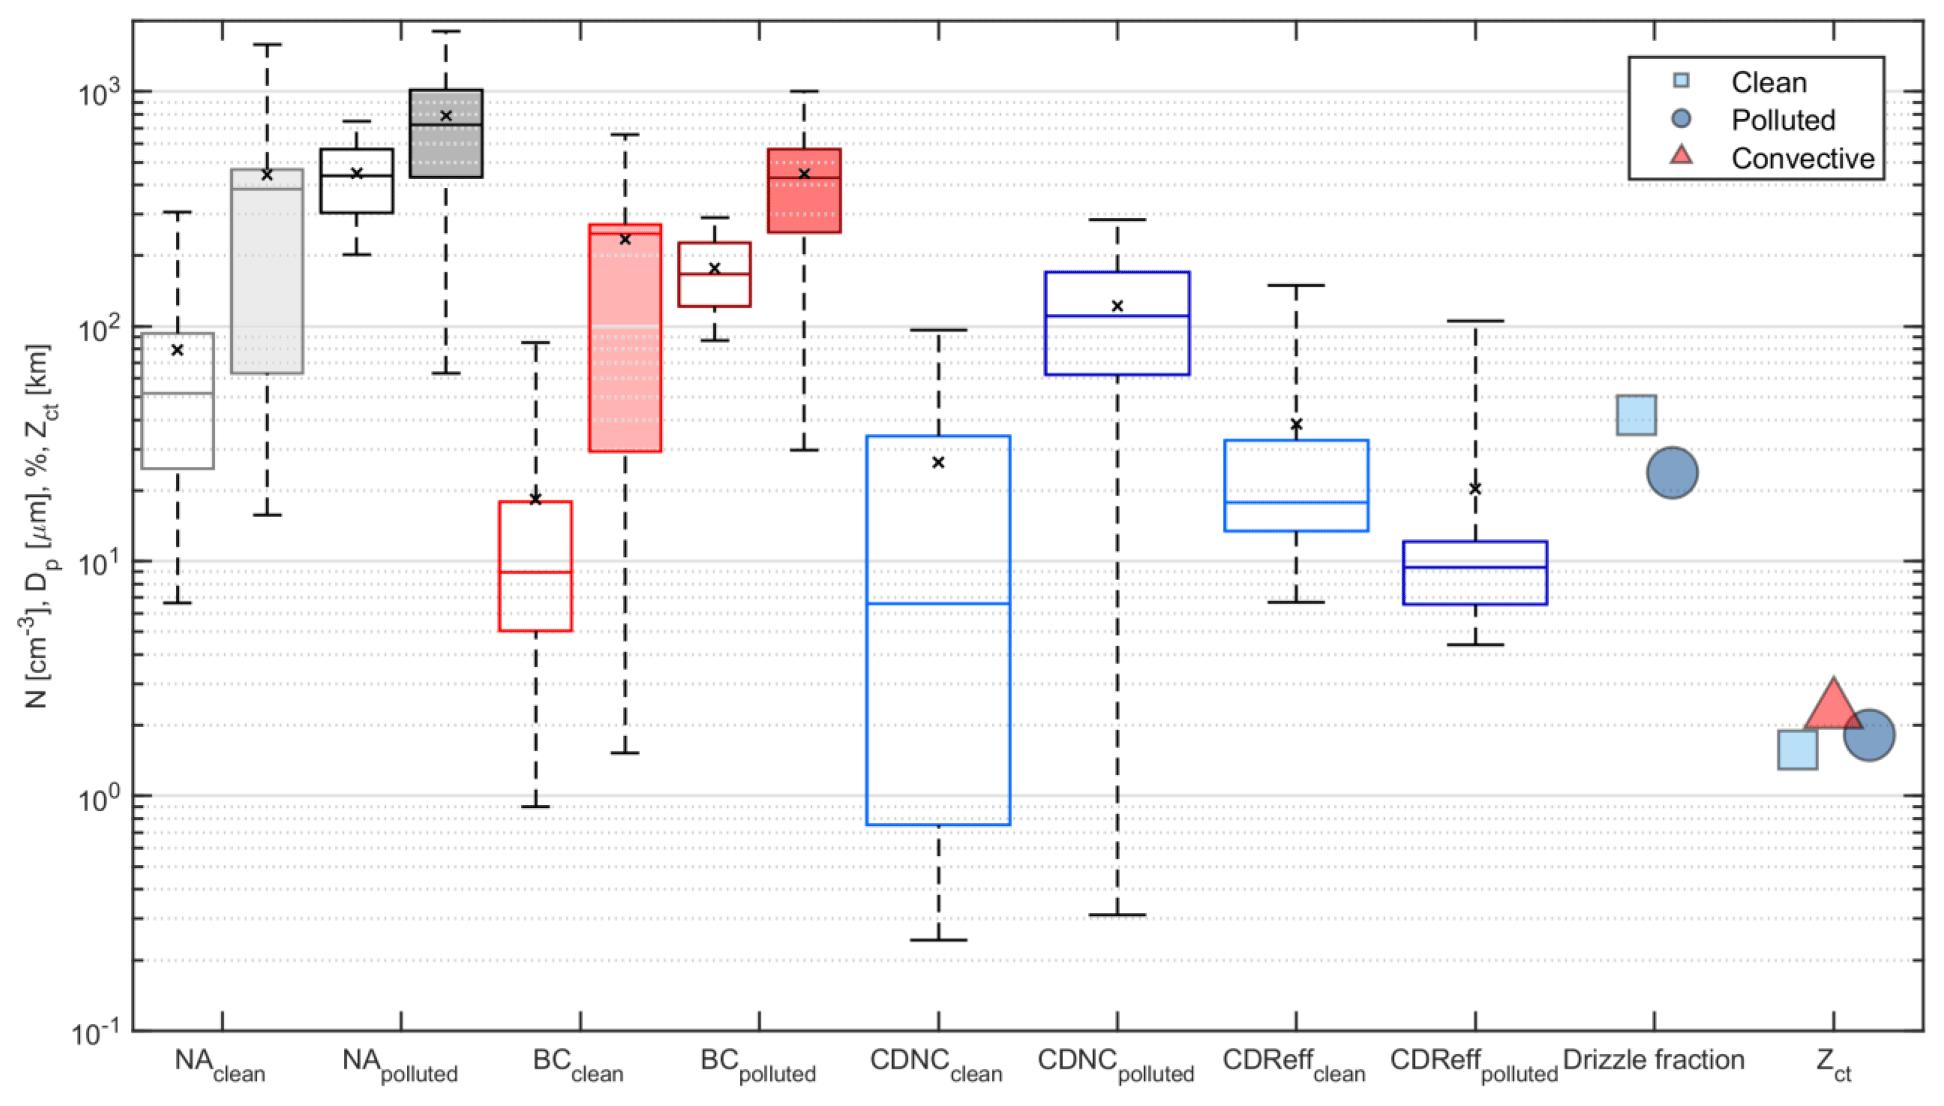
Figure 16Statistical overview of aerosol and cloud properties. Total aerosol (NA, PCASP) and black carbon (BC, SP-2) concentration data are taken from cloud-free conditions (LWC < 0.01 g m−3). Aerosol data are shown for conditions broadly representative of the marine boundary layer (Z<1500 m, unfilled boxes) and free troposphere ( m, filled boxes). Cloud droplet number concentration (CDNC, CDP) and cloud droplet effective radius (CDReff, composite of CDP and 2D-S size distributions) are calculated using a minimum LWC threshold of 0.01 g m−3. Drizzle fraction is the ratio of the total number of data points containing drizzle (D>100 µm, drizzle water content > 0.01 g m−3) to in-cloud data points (total water content > 0.01 g m−3), expressed as a percentage. Cloud top altitude (Zct) is the average value of cloud top determined from aircraft profiles. Convective cases (Zct>2000 m) are removed from the clean and polluted Zct averages and displayed separately. All data have been split into clean (CO < 83 ppb) and polluted (CO > 83 ppb) conditions. Black markers indicate mean, box indicates interquartile range and median values, and whiskers present 5th and 95th percentiles.

Figure 17The carbon monoxide (CO) concentrations for precipitating (red curve) and non-precipitating days (blue bars). A Gaussian fit to the precipitating data is shown by the dotted lines.
Figure 17 suggests that precipitation does appear to be inhibited in polluted days when compared to non-polluted days as evident from the means of the distributions (77.8±30.4 (2 SD) for the 51∕122 precipitating days and 95.7±60.8 (2 SD) for the 71∕122 non-precipitating days). The mode CO is identical for the precipitating and non-precipitating days, while the CO distribution for the non-precipitating days shows evidence of a far longer tail to high values of CO. Note also that the patchy nature of precipitation over the Ascension Island region means that non-precipitating days will likely contain days when there is precipitation in the vicinity, but there is no precipitation detected at the Met Office site. Of course, we acknowledge that this is a purely statistical analysis that uses CO as a proxy for CCN and does not account for cause and effect, nor does it take account of covariability that might influence precipitation such as the boundary layer height, cloud top height and LWP, but these results appear consistent with the results from Zhang and Zuidema (2019), who analysed disdrometer data and polluted and non-polluted conditions determined from the AMF LASIC deployment. The ability of BBA to act as CCN over the SE Atlantic is further elucidated under the ORACLES project (Kacarab et al., 2020).
Certain flight days provided a particular wealth of information on cloud properties in the region. On 19 August 2017, for example, a large cloud feature south of Ascension Island about 1.5∘ in size was sampled at five different altitudes during straight and level runs. The aircraft followed a line of strong echoes on its flight instrument radar. Droplet size distributions and out-of-cloud samples of the aerosol size distributions were obtained at each level up to and above the cloud top height, which was around 2.5 km in altitude. This case study as the cloud changed from an overcast stratocumulus system to organized convective clouds is documented by Cui et al. (2021) and a model–observation comparison by Gordon et al. (2020).
6.8 POCs
The role that the free tropospheric BBA plumes observed over the SE Atlantic play in modulating the evolution of the underlying clouds via microphysical perturbations is dependent on where and when the BBA plumes mix down into the boundary layer. CLARIFY airborne and LASIC ground-based measurements from a case study of both a pocket of open cells (POC) and the surrounding stratiform cloud topped boundary layer highlighted that the efficiency of this entrainment of aerosol can depend on the form of the underlying cloud structure (closed vs. open cellular convection), with a marked reduction in entrainment of BBA in the region of open cells (Abel et al., 2020). An analysis of satellite imagery in Abel et al. (2020) demonstrates that these open cellular cloud regions occur regularly in the offshore environment surrounding Ascension Island during September. If the findings from this case apply more broadly, then this low susceptibility of open cells to intrusions of overlaying BBA could have important implications for aerosol indirect effects in the region, especially given that global climate models are generally not capable of simulating mesoscale features such as POCs, due to their coarse resolution and often relatively simplistic representation of aerosol–cloud–precipitation interactions.
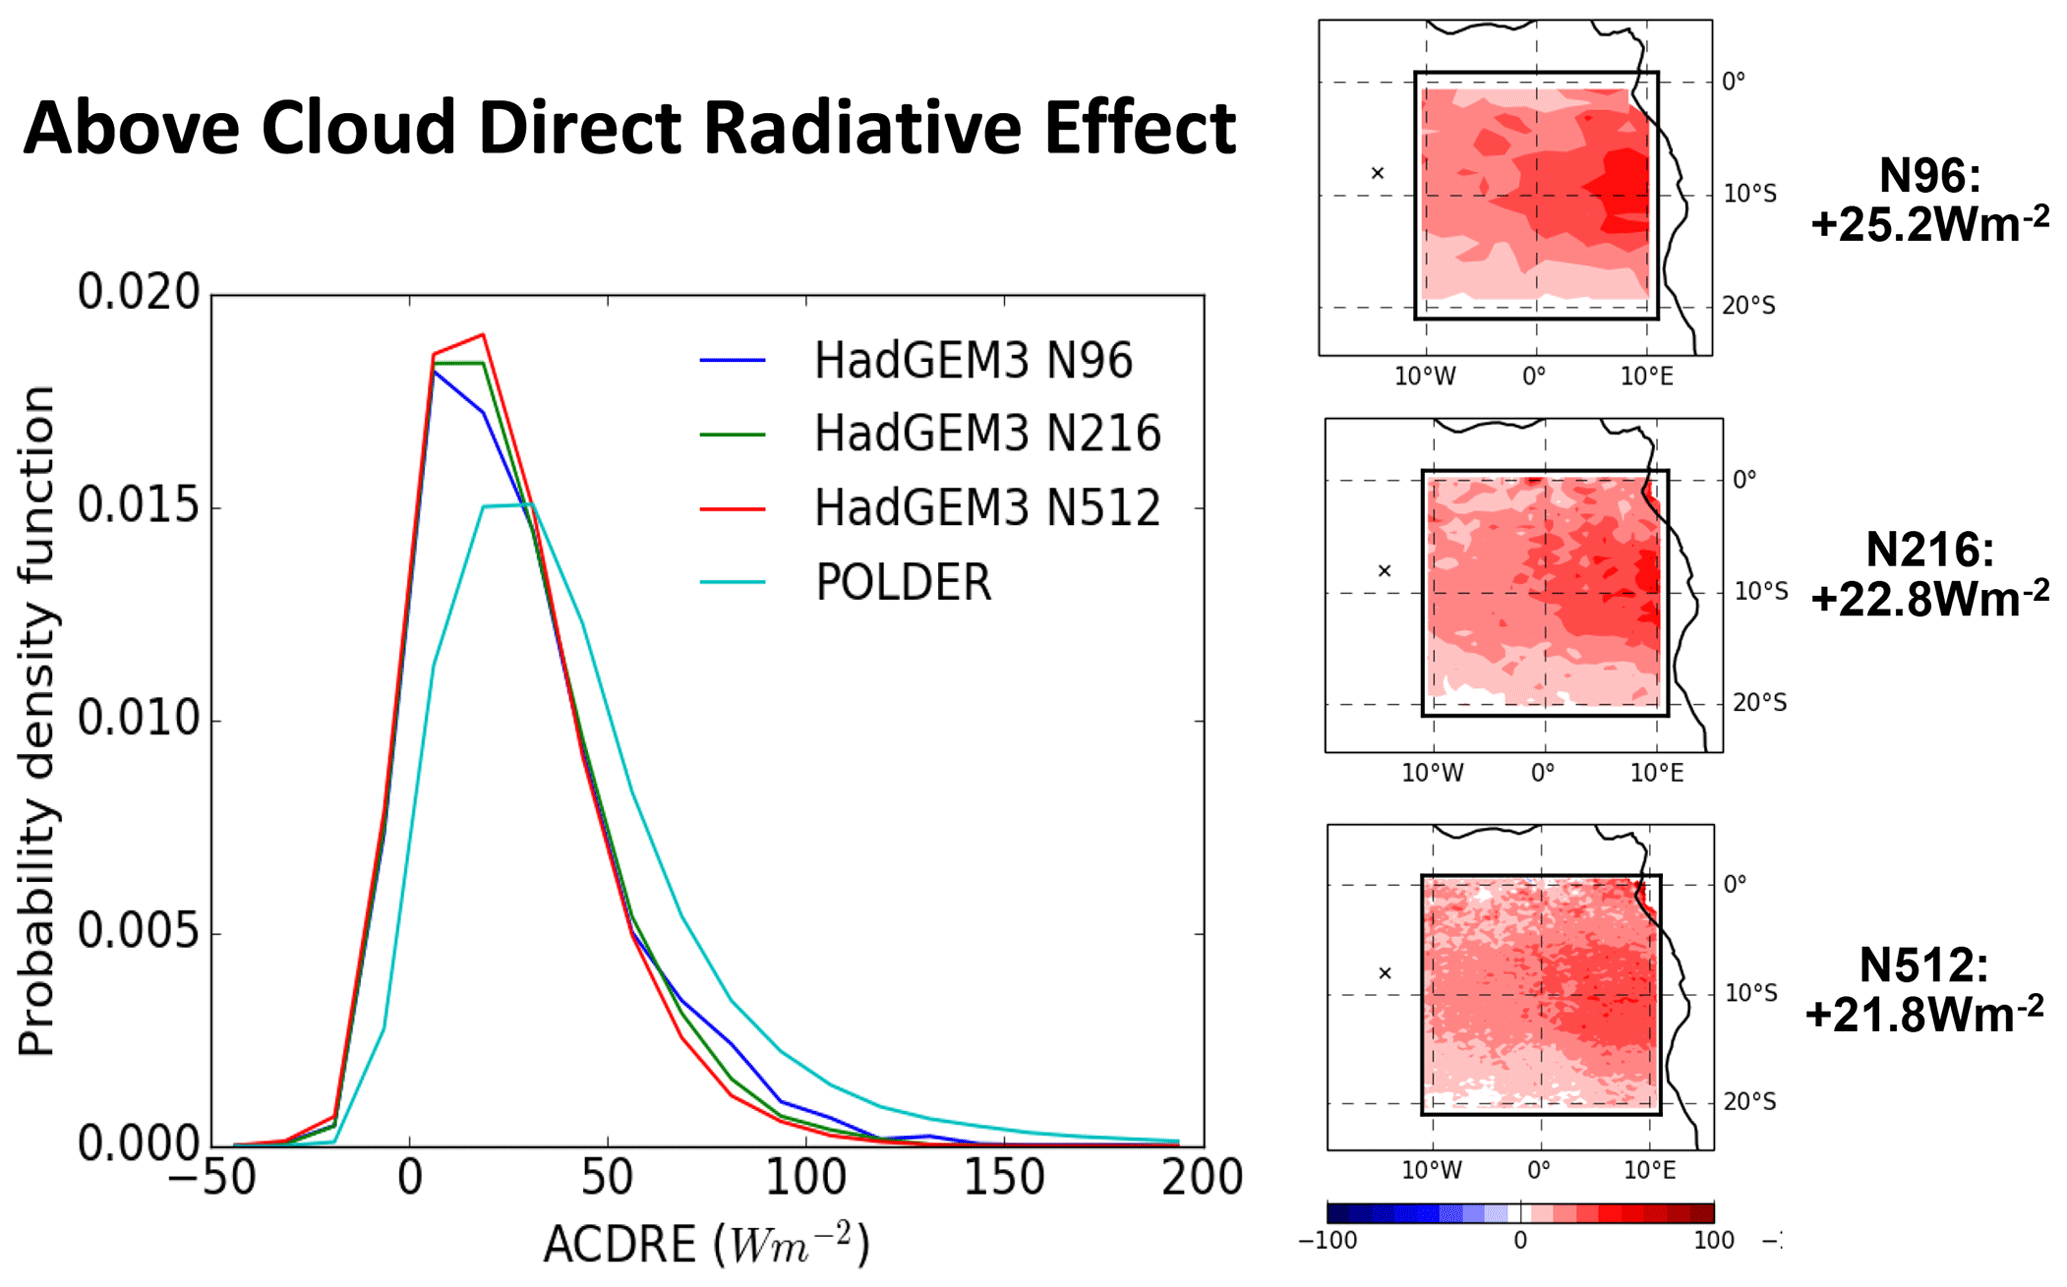
Figure 18The above-cloud direct radiative effect diagnosed from the Unified Model (N96, N216, and N512 resolution, approximately 140, 60, and 25 km respectively) over the area shown in the panels in the right-hand column. The probability density function of the above-cloud direct radiative effect is also shown from POLDER according to Peers et al. (2016). The intercomparison is for August–September 2006, and model data are matched to instantaneous POLDER retrievals.
6.9 Large-scale model-focussed investigations
The data collected during the CLARIFY campaign are already proving a valuable resource for modelling studies. In addition to the modelling work in support of flight planning (Sect. 1), preparatory work funded by the project involved testing the GLOMAP-mode aerosol microphysics scheme in the Unified Model at convection-permitting resolution over the south-east Atlantic (Gordon et al., 2018). The scheme was evaluated against satellites and data from the ARM site at Ascension Island and shown to perform well. The Unified Model global configuration was subsequently also shown to predict properties of smoke aerosol realistically in an evaluation against CLARIFY measurements of extinction (Che et al., 2020) and ORACLES 2016 measurements (Shinozuka et al., 2020).
One aspect that is interesting is that the direct radiative effect of above-cloud aerosol appears to be fairly independent of model resolution. This might be thought of as somewhat of a surprise because finer resolution models can include higher grid box mean AODs and CODs, and they might therefore be expected to give a wider range of direct radiative effects when compared to coarser resolution versions of the model (Fig. 18).
The simulations shown in Fig. 18 are nudged simulations with the Unified Model performed for August–September 2006 to coincide with POLDER observations. The coarser resolution models show a more spatially homogeneous spatial distribution of the direct radiative effect than the higher resolution models, but when averaged over the domain, the probability distribution of the direct radiative effect is a similar shape. That the model direct effects do not diverge as a function of model resolution is a testament to the validity of utilizing a model with identical underlying physics in the Unified Model framework.
A complementary global modelling paper (Che et al., 2020) examines a wider area of the south-east Atlantic in an atmospheric UK Earth System Model (UKESM1) configuration of the Unified Model, at N96 resolution, representative of typical climate model simulations to assess regional and global climate impacts over a longer time period. This work highlights the complex interaction of radiation, microphysics, and dynamical feedbacks. Decomposition of the radiative effects shows that the regional direct radiative effect is generally positive when the biomass burning plume is above the stratocumulus deck (with July–August average +7.5 W m−2), as the surface albedo of the underlying clouds is fairly high (e.g. Keil and Haywood, 2003). However, in UKESM1, rapid adjustments (semi-direct effect) enhance cloud albedo and more than compensate the direct effects, resulting in a net negative radiative effect over the region (July–August average −0.9 W m−2). Microphysical effects of aerosol–cloud further increase cloud albedo and the associated negative radiative effect. In the global mean, rapid adjustments due to biomass burning (semi-direct effects) appear negligible. In a separate work using the same model configuration, Che et al. (2021) perform a source attribution of CCN and resulting cloud droplet numbers for the CLARIFY domain. Che et al. (2021) estimate that during the biomass burning season, upper tropospheric binary nucleation between sulfuric acid and water (Vehkamäki et al., 2002) and BBA contributes a similar amount of CDNC,and these are the most important two sources of CCN in this region. This highlights the importance of upper tropospheric nucleation and subsequent subsidence in subtropical areas for the local cloud regime (e.g. Clarke, 1993) and highlights a route for significant microphysical aerosol effects on clouds, at considerable distance from anthropogenic source regions.
In a separate work based on using the same model configuration, Che et al. (2021) perform a source attribution of CCN and resulting cloud droplet numbers for the CLARIFY domain. Che et al. (2021) note that CCN from upper tropospheric binary nucleation contributes approximately 50 % to BBA impact on droplet numbers in the region, with negligible contributions from sea salt and boundary layer nucleation. This highlights the importance of upper tropospheric nucleation and subsequent subsidence in subtropical areas for the local cloud regime (e.g. Clarke, 1993) and highlights a route for significant microphysical aerosol effects on clouds, at considerable distance from anthropogenic source regions.
Further work on regional modelling includes the coupling of the GLOMAP-MODE two-moment aerosol microphysics to the CASIM two-moment cloud microphysics scheme, which allows for more refined studies of the indirect effect (Gordon et al., 2020). The current intensity of modelling activity suggests that the CLARIFY data set will be a valuable resource for model evaluation for many years to come.
The measurements obtained during the CLARIFY measurement campaign will also, together with data from ORACLES, LASIC, and AEROCLO-sA, contribute a key constraint on the representation of biomass burning aerosols in current climate models as part of the ongoing AeroCom Aircraft intercomparison study (https://wiki.met.no/aerocom/phase3-experiments#baseline_aircraft_experiment, last access: December 2020).
This overview paper documents the planning, logistics, aircraft capabilities, measurement strategies, manoeuvres, and observations made under the CLARIFY-2017 deployment of the FAAM aircraft, together with complementary NWP and climate modelling studies. Given the wide range of science objectives, and the progress made on these specific objectives, CLARIFY-2017 was an overwhelming success. Key observational findings include the following:
-
The vertical profile of the BBA in the vicinity of Ascension Island has been established to be quite variable, with aerosol residing either in the MBL, the residual CBL, or both during the biomass burning season (see also Wu et al., 2021). Large-scale dynamics and the position of the subtropical high appear to have large control over the levels of BBA in the MBL and residual CBL.
-
Biomass burning aerosol size distributions derived from measurements in the residual CBL were found to closely resemble the more limited measurements performed during SAFARI-2000, although a one-mode or two-mode model (Peers et al., 2019, 2020; Taylor et al., 2020; Wu et al., 2021) might be preferred, owing to its relative simplicity when utilized in satellite retrieval algorithms.
-
State-of-the-art measurement equipment developed since SAFARI-2000 including the SP2 and EXSCALABAR instruments has given us a much better idea of the microphysical properties of BBA (Taylor et al., 2020; Wu et al., 2021). The optical properties of many BBA particles can be best represented by a core of black carbon surrounded by a thick shell of organics and, to a lesser extent, inorganics or by semi-empirical mixing rules.
-
The thickness of the shell of organics appears to be much thicker (diameter of shell ∕ core of ∼2.5) compared to measurements made with identical instrumentation close to the BBA source (diameter of shell ∕ core ∼1) for aerosol less than 30 min old (Wu et al., 2020).
-
The BBA was rather more absorbing than the earlier measurements from SAFARI-2000, with a mean dry SSA at 550 nm of around 0.80 in the free troposphere. The SSA of aerosol in the MBL is higher at around 0.85 at 550 nm as it includes a proportion of sea salt aerosol and a higher proportion of sulfate aerosol. We have more confidence in these values owing to the high accuracy of the photo-acoustic spectrometer measurements made by the EXSCALABAR instrument, which are not subject to the high levels of correction from filter-based measurements (Davies et al., 2019; Cotterell et al., 2020).
-
Mie scattering theory using simple mixing rules, such as volume weighting of refractive indices or the Maxwell–Garnet mixing rule, is not able to simultaneously represent both the mass absorption coefficient and the SSA of the BBA (Taylor et al., 2020). This has implications for how to represent aerosol optical properties in global climate models that are fully consistent between the chemical and optical properties.
-
The highest resolution LES models utilized here (Herbert et al., 2020) suggest that for semi-direct effects to be of significant magnitude in the region, the separation between BBA and cloud needs to be less than ∼500 m. However, studies using larger scale model simulations (Che et al., 2020) rather contradict this result. Given the differences in horizontal and vertical resolutions between LES and large-scale models, comparing the responses and their BBA-induced and meteorological drivers could potentially solve the apparent disagreement.
-
The Met Office operational forecast model (spatial resolution ∼11 km) was able to capture the variations in the vertical distribution of the BBA reasonably accurately, suggesting that it is a suitable tool for examining aerosol–radiation and aerosol–cloud interactions and fast-feedback processes (Gordon et al., 2018, 2020; Che et al., 2020). The exception to this was during the POC event that was poorly represented by the model (Abel et al., 2020).
-
Simulations with the UMESM1 climate model performed at different spatial resolutions represent the aerosol direct effect consistently across model resolutions, which shows the advantages of the Unified Model framework in which the underlying physics is identical between high-resolution and lower resolution simulations.
-
The BBA examined during CLARIFY-2017 was universally representative of highly aged BBA aerosols of at least 5–7 d since emission, with little, if any, systematic variation in microphysical and optical properties, except the variation in optical properties with altitude that appear to be linked to enhanced nitrate contribution at altitude (Taylor et al., 2020).
Despite the relatively broad wavebands used by the SEVIRI geostationary sensor, above-cloud aerosol retrievals derived from a newly developed algorithm were shown to compare favourably to those derived from MODIS provided that water vapour profiles were adequately accounted for (Peers et al., 2019, 2020). The geostationary nature of SEVIRI means that the full diurnal cycle of aerosol radiative effects can be examined, with implications for future studies on aerosol–radiation interactions.
Aerosol–cloud interactions determined from a statistical analysis of cloud and aerosol in the region are clear. The reduction in cloud effective radius (Twomey, 1977) in polluted conditions is clearly evident, and two different analyses of precipitation suggest that precipitation is inhibited in polluted clouds, suggesting that changes in the cloud droplet size distribution reduce the coalescence efficiency (Albrecht, 1989). Models need to be utilized to disentangle the impact of aerosol effects on cloud liquid water and cloud fraction from natural variability (e.g. Dagan and Stier, 2020).
CLARIFY-2017 was fortunate enough to be able to make some comprehensive measurements of a POC that evolved with time and passed overhead of Ascension Island (Abel et al., 2020). The limited entrainment of overlying BBA into the MBL under such conditions and the relative frequency of such open cells have implications for understanding aerosol–cloud interactions.
Despite the relative success of the CLARIFY-2017 campaign, which has addressed many of the key objectives, it is envisaged that additional analyses will be performed by the scientific community using the extensive data set of observations. As such, CLARIFY-2017 provides considerable potential legacy work that can be further exploited in the future.
All core and quality-assured non-core observational data, model forecast data, mission scientist logs, and flight summaries pertaining to the CLARIFY-2017 campaign are available from the UK's Natural Environment Research Council's central data archive at http://data.ceda.ac.uk/badc/faam/data/ (last access: 22 January 2021) (CEDA, 2021a). Flight data for specific flights (including test flights) are available from http://data.ceda.ac.uk/badc/faam/data/2017/c026-jul-31 (last access: 22 January 2021) (CEDA, 2021b) through to http://data.ceda.ac.uk/badc/faam/data/2017/c056-sep-09 (last access: 22 January 2021) (CEDA, 2021c).
JMH was the CLARIFY-2017 lead PI responsible for the overall planning and deployment and prepared the paper with input from all co-authors. JMH, SA, AB, NB, KC, HC, PF, and PS were institutional PIs who led the CLARIFY-2017 application and directed the research. JMH, SA, PAB, KB, HC, MIC, IC, ZC, ND, HG, MdG, RH, JML, FP, and JWT were involved in the operational flying during the campaign as mission scientists or operators of non-core instrumentation. Modelling support during the detachment was provided by NB, MB, HCh, DWP, and PS. Post-deployment analysis of observational and model data was carried out by PB, SA, NB, KB, HCC, HCh, MIC, IC, ZC, ND, BD, PF, HG, MdG, RH, BJ, ACJ, JML, FM, DGP, FP, KS, JWT, DWP, and HW. PF provided primary coordination with the AEROCLO-sA campaign, JR and RW provided primary coordination with the ORACLES campaign, and PZ provided primary coordination with the LASIC field campaign.
The authors declare that they have no conflict of interest.
This article is part of the special issue “New observations and related modelling studies of the aerosol–cloud–climate system in the Southeast Atlantic and southern Africa regions (ACP/AMT inter-journal SI)”. It is not associated with a conference.
We would like to thank Sarah Taylor and Ed Gryspeerdt for putting together Fig. 1 at the proposal stage. Tony Radakin and the Joint Forces Command are thanked for their support for the CLARIFY project. Andy Pittock of the RAF was instrumental in making this project a success through the support given to us during the detachment; the can-do attitude of the RAF was very much appreciated throughout the duration of the deployment. Jonny Hobson and the staff of the Obsidian Hotel are thanked for their hospitality, and Jonny deserves particular thanks for providing us with interesting tours of the flora and fauna of the island. The staff of Air Task, Avalon Engineering, and FAAM are thanked for their thoroughly professional service, before, during, and after the deployment. The support from Met Office staff at Ascension Island, Amy Raynor (Senior Met Officer), Emma Sillitoe, John Hill, and Katie Tobin, was also appreciated. This work was mainly supported by the NERC Large Grant NE/L013584/1. Jim M. Haywood, Anthony C. Jones, Florent Malavelle, Michael I. Cotterell, and Fanny Peers were also supported by the Research Council of Norway via the projects AC/BC (240372) and NetBC (244141). Philip Stier would additionally like to acknowledge funding from the European Research Council (ERC) project (RECAP) under the European Union's Horizon 2020 Research and Innovation programme (grant agreement 724602) and the Natural Environment Research Council project NE/P013406/1 (A-CURE).
This research has been supported by the Natural Environment Research Council (grant no. NE/L013584/1 and NE/P013406/1), the European Commission (grant no. RECAP 724602), and the Norges Forskningsråd (grant no. 240372 and 244141).
This paper was edited by Peter Knippertz and reviewed by Johannes Quaas and one anonymous referee.
Abel, S. J., Haywood, J. M., Highwood, E. J., Li, J., and Buseck, P. R.: Evolution of biomass burning aerosol properties from an agricultural fire in southern Africa, Geophys. Res. Lett., 30, ASC 1-1–1-4, https://doi.org/10.1029/2003GL017342, 2003.
Abel, S. J., Highwood, E. J., Haywood, J. M., and Stringer, M. A.: The direct radiative effect of biomass burning aerosols over southern Africa, Atmos. Chem. Phys., 5, 1999–2018, https://doi.org/10.5194/acp-5-1999-2005, 2005.
Abel, S. J., Barrett, P. A., Zuidema, P., Zhang, J., Christensen, M., Peers, F., Taylor, J. W., Crawford, I., Bower, K. N., and Flynn, M.: Open cells exhibit weaker entrainment of free-tropospheric biomass burning aerosol into the south-east Atlantic boundary layer, Atmos. Chem. Phys., 20, 4059–4084, https://doi.org/10.5194/acp-20-4059-2020, 2020.
Ackerman, A. S., Kirkpatrick, M. P., Stevens, D. E., and Toon, O. B.: The impact of humidity above stratiform clouds on indirect aerosol climate forcing, Nature, 432, 1014–1017, 2004.
Adebiyi, A. A. and Zuidema, P.: The role of the southern African easterly jet in modifying the southeast Atlantic aerosol and cloud environments, Q. J. Roy. Meteorol. Soc., 142, 1574–1589, 2016.
Adebiyi, A. A., Zuidema, P., and Abel, S. J.: The convolution of dynamics and moisture with the presence of shortwave absorbing aerosols over the southeast Atlantic, J. Climate, 28, 1997–2024, https://doi.org/10.1175/JCLI-D-14-00352.1, 2015.
Albrecht, B. A.: Aerosols, cloud microphysics, and fractional cloudiness, Science, 245, 1227–1230, 1989.
Allen, G., Pitt, J., Lee, J., Hopkins, J., Young, S., Bauguitte, S., Gallagher, M., Fisher, R., Lowry, D., and Nisbet, E.: The MOYA aircraft campaign: First measurements of methane, ethane and C-13 isotopes from West African biomass burning and other regional sources using the UK FAAM aircraft, EGUGA, Vienna, Austria, p. 8574, 2017.
Allen, R. J. and Sherwood, S. C.: Aerosol-cloud semi-direct effect and land-sea temperature contrast in a GCM, Geophys. Res. Lett., 37, L07702, https://doi.org/10.1029/2010GL042759, 2010.
Andreae, M. O. and Gelencsér, A.: Black carbon or brown carbon? The nature of light-absorbing carbonaceous aerosols, Atmos. Chem. Phys., 6, 3131–3148, https://doi.org/10.5194/acp-6-3131-2006, 2006.
Barrett, P. A., Shinozuka, Y., Abel, S.J., Bauguitte, S., Chen, H., Cochrane, S., Dobracki, A., Howell, S., Jones, A., Podolske, J., Price, H., Schmidt, S., Szpek, K., Taylor, J. W., Trembath, J., Wu, H., Zhang, J., Coe, H., Haywood, J., Redemann, J. and Zuidema, P.: An intercomparison of in-situ and remote-sensing observations pertinent to studying aerosol–cloud-radiation interactions in the south-east Atlantic biomass burning season from ground based and two airborne platforms, Atmos. Meas. Tech., in preparation, 2021a.
Barrett, P. A., Crawford, I., Zhang J., Gordon, H., Abel, S. J., Peers, F., and Zuidema, P.: The impact of biomass burning aerosol laden airmasses on the microphysical and optical properties of clouds in predominantly decoupled boundary layers of the southeast Atlantic as observed by in situ and ground based observations of CLARIFY and LASIC, Atmos. Chem. Phys., in preparation, 2021b.
Bellouin, N., Rae, J., Jones, A., Johnson, C., Haywood, J. and Boucher, O.: Aerosol forcing in the Climate Model Intercomparison Project (CMIP5) simulations by HadGEM2-ES and the role of ammonium nitrate, J. Geophys. Res.-Atmos., 116, D20206, https://doi.org/10.1029/2011JD016074, 2011.
Bellouin, N., Mann, G. W., Woodhouse, M. T., Johnson, C., Carslaw, K. S., and Dalvi, M.: Impact of the modal aerosol scheme GLOMAP-mode on aerosol forcing in the Hadley Centre Global Environmental Model, Atmos. Chem. Phys., 13, 3027–3044, https://doi.org/10.5194/acp-13-3027-2013, 2013.
Bodas-Salcedo, A., Williams, K. D., Ringer, M. A., Beau, I., Cole, J. N., Dufresne, J. L., Koshiro, T., Stevens, B., Wang, Z., and Yokohata, T.: Origins of the solar radiation biases over the Southern Ocean in CFMIP2 models, J. Climate, 27, 41–56, 2014.
Bond, T. C., Anderson, T. L., and Campbell, D.: Calibration and Intercomparison of Filter-Based Measurements of Visible Light Absorption by Aerosols, Aerosol Sci. Tech., 30, 582–600, https://doi.org/10.1080/027868299304435, 1999.
Bond, T.C., Doherty, S. J., Fahey, D. W., Forster, P. M., Berntsen, T., DeAngelo, B. J., Flanner, M. G., Ghan, S., Kärcher, B., Koch, D., and Kinne, S.: Bounding the role of black carbon in the climate system: A scientific assessment, J. Geophys. Res.-Atmos., 118, 5380–5552, 2013.
Boucher, O., Randall, D., Artaxo, P., Bretherton, C., Feingold, G., Forster, P., Kerminen, V.-M., Kondo, Y., Liao, H., Lohmann, U., Rasch, P., Satheesh, S. K., Sherwood, S., Stevens, B., and Zhang, X. Y.: Clouds and Aerosols., in: Climate Change 2013: The Physical Science Basis, Contribution of Working Group I to the Fifth Assessment Report of the Intergovernmental Panel on Climate Change, edited by: Stocker, T. F., Qin, D., Plattner, G.-K., Tignor, M., Allen, S. K., Boschung, J., Nauels, A., Xia, Y., Bex, V., and Midgley, P. M., Cambridge University Press, Cambridge, United Kingdom and New York, NY, USAt, available at: http://www.climatechange2013.org/images/uploads/WGIAR5_WGI-12Doc2b_FinalDraft_Chapter07.pdf (last access: January 2020), 2013.
Brooks, J., Allan, J. D., Williams, P. I., Liu, D., Fox, C., Haywood, J., Langridge, J. M., Highwood, E. J., Kompalli, S. K., O'Sullivan, D., and Babu, S. S.: Vertical and horizontal distribution of sub-micron aerosol chemical composition and physical characteristics across Northern India, during the pre-monsoon and monsoon seasons, Atmos. Chem. Phys., 19, 5615–5656, https://doi.org/10.5194/acp-19-5615-2019, 2019.
Cappa, C. D., Lack, D. A., Burkholder, J. B., and Ravishankara, A. R.: Bias in filter-based aerosol light absorption measurements due to organic aerosol loading: Evidence from laboratory measurements, Aerosol Sci. Tech., 42, 1022–1032, https://doi.org/10.1080/02786820802389285, 2008.
CEDA: Facility for Airborne Atmospheric Measurements (FAAM) flights, available at: http://data.ceda.ac.uk/badc/faam/data/ (last access: 22 January 2021), 2021a.
CEDA: FAAM C026 CLARIFY Test flight: Airborne atmospheric measurements from core instrument suite on board the BAE-146 aircraft, available at: http://data.ceda.ac.uk/badc/faam/data/2017/c026-jul-31 (last access: 22 January 2021), 2021b.
CEDA: FAAM C056 CLARIFY flight: Airborne atmospheric measurements from core instrument suite on board the BAE-146 aircraft, available at: http://data.ceda.ac.uk/badc/faam/data/2017/c056-sep-09 (last access: 22 January 2021), CEDA, 2021c.
Chakrabarty, R. K. and Heinson, W. R.: Scaling Laws for Light Absorption Enhancement Due to Nonrefractory Coating of Atmospheric Black Carbon Aerosol, Phys. Rev. Lett., 121, 218701, https://doi.org/10.1103/PhysRevLett.121.218701, 2018.
Chand, D., Wood, R., Anderson, T. L., Satheesh, S. K., and Charlson, R. J.: Satellite-derived direct radiative effect of aerosols dependent on cloud cover, Nat. Geosci., 2, 181–184, 2009.
Chang, I. and Christopher, S. A.: Identifying absorbing aerosols above clouds from the spinning enhanced visible and infrared imager coupled with NASA A-Train Multiple Sensors, IEEE T. Geosci. Remote, 54, 3163–3173, 2016.
Che, H., Stier, P., Gordon, H., Watson-Parris, D., and Deaconu, L.: The significant role of biomass burning aerosols in clouds and radiation in the South-eastern Atlantic Ocean, Atmos. Chem. Phys. Discuss., https://doi.org/10.5194/acp-2020-532, in review, 2020.
Che, H., Stier, P., Watson-Parris, D., Gordon, H. P., and Deaconu, L.: Source attribution of cloud condensation nuclei and their impact on stratocumulus clouds and radiation in the south-east Atlantic, Atmos. Chem. Phys. in preparation, 2021.
Chen, Y. C., Christensen, M. W., Diner, D. J., and Garay, M. J.: Aerosol–cloud interactions in ship tracks using Terra MODIS/MISR, J. Geophys. Res.-Atmos., 120, 2819–2833, 2015.
Christensen, M. W., Suzuki, K., Zambri, B., and Stephens, G. L.: Ship track observations of a reduced shortwave aerosol indirect effect in mixed-phase clouds, Geophys. Res. Lett., 41, 6970–6977, 2014.
Clarke, A. D.: Atmospheric nuclei in the Pacific mid troposphere: Their nature, concentration, and evolution, J. Geophys. Res.-Atmos., 98, 20633–20647, 1993.
Cochrane, S. P., Schmidt, K. S., Chen, H., Pilewskie, P., Kittelman, S., Redemann, J., LeBlanc, S., Pistone, K., Kacenelenbogen, M., Segal Rozenhaimer, M., Shinozuka, Y., Flynn, C., Dobracki, A., Zuidema, P., Howell, S., Freitag, S., and Doherty, S.: Empirically-Derived Parameterizations of the Direct Aerosol Radiative Effect based on ORACLES Aircraft Observations, Atmos. Meas. Tech. Discuss., https://doi.org/10.5194/amt-2020-137, in review, 2020.
Comstock, K. K., Wood, R., Yuter, S. E., and Bretherton, C. S.: Reflectivity and rain rate in and below drizzling stratocumulus, Q. J. Roy. Meteorol. Soc., 130, 2891–2918, 2004.
Cotterell, M. I., Orr-Ewing, A. J., Szpek, K., Haywood, J. M., and Langridge, J. M.: The impact of bath gas composition on the calibration of photoacoustic spectrometers with ozone at discrete visible wavelengths spanning the Chappuis band, Atmos. Meas. Tech., 12, 2371–2385, https://doi.org/10.5194/amt-12-2371-2019, 2019.
Cotterell, M. I., Szpek, K., Haywood, J. M., and Langridge, J. M.: Sensitivity and Accuracy of Refractive Index Retrieved from Extinction and Absorption Cross Section Measurements of Mobility-Selected Internally-Mixed Light Absorbing Aerosols, Aerosol Sci. Tech., 54, 1034–1057, https://doi.org/10.1080/02786826.2020.1757034, 2020.
Costantino, L. and Bréon, F.-M.: Aerosol indirect effect on warm clouds over South-East Atlantic, from co-located MODIS and CALIPSO observations, Atmos. Chem. Phys., 13, 69–88, https://doi.org/10.5194/acp-13-69-2013, 2013.
Cui, Z., Blyth, A., Abel, S. J., Barrett, P., and Gordon, H.: Enhancement of microphysics of a mesoscale stratiform cloud system during convective transition over the tropical Atlantic Ocean, Atmos. Chem. Phys., in preparation, 2021.
Dagan, G. and Stier, P.: Ensemble daily simulations for elucidating cloud–aerosol interactions under a large spread of realistic environmental conditions, Atmos. Chem. Phys., 20, 6291–6303, https://doi.org/10.5194/acp-20-6291-2020, 2020.
Davies, N. W., Cotterell, M. I., Fox, C., Szpek, K., Haywood, J. M., and Langridge, J. M.: On the accuracy of aerosol photoacoustic spectrometer calibrations using absorption by ozone, Atmos. Meas. Tech., 11, 2313–2324, https://doi.org/10.5194/amt-11-2313-2018, 2018.
Davies, N. W., Fox, C., Szpek, K., Cotterell, M. I., Taylor, J. W., Allan, J. D., Williams, P. I., Trembath, J., Haywood, J. M., and Langridge, J. M.: Evaluating biases in filter-based aerosol absorption measurements using photoacoustic spectroscopy, Atmos. Meas. Tech., 12, 3417–3434, https://doi.org/10.5194/amt-12-3417-2019, 2019.
Deaconu, L. T., Ferlay, N., Waquet, F., Peers, F., Thieuleux, F., and Goloub, P.: Satellite inference of water vapour and above-cloud aerosol combined effect on radiative budget and cloud-top processes in the southeastern Atlantic Ocean, Atmos. Chem. Phys., 19, 11613–11634, https://doi.org/10.5194/acp-19-11613-2019, 2019.
De Graaf, M., Tilstra, L. G., Wang, P., and Stammes, P.: Retrieval of the aerosol direct radiative effect over clouds from spaceborne spectrometry, J. Geophys. Res.-Atmos., 117, D07207, https://doi.org/10.1029/2011JD017160, 2012.
De Graaf, M., Bellouin, N., Tilstra, L. G., Haywood, J. M., and Stammes, P.: Aerosol direct radiative effect from episodic smoke emissions over the southeast Atlantic Ocean from 2006 to 2009, Geophy. Res. Lett., 41, 7723–7730, https://doi.org/10.1002/2014GL061103, 2014.
De Graaf, M., Tilstra, L. G., and Stammes, P.: Aerosol direct radiative effect over clouds from a synergy of Ozone Monitoring Instrument (OMI) and Moderate Resolution Imaging Spectroradiometer (MODIS) reflectances, Atmos. Meas. Tech., 12, 5119–5135, https://doi.org/10.5194/amt-12-5119-2019, 2019.
De Graaf, M., Schulte, R., Peers, F., Waquet, F., Tilstra, L. G., and Stammes, P.: Comparison of south-east Atlantic aerosol direct radiative effect over clouds from SCIAMACHY, POLDER and OMI–MODIS, Atmos. Chem. Phys., 20, 6707–6723, https://doi.org/10.5194/acp-20-6707-2020, 2020.
Dobracki, A., Howell, S., Saide, P., Freitag, S., Aiken, A., Podolske, J., Sedlacek, A., Thornhill, K., Meyers, K., Taylor, J., Wu, H., Coe, H., Redemann, J., Wood, R., and Zuidema, P.: Rethinking the Lifetime of Observed Biomass Burning Aerosol in the Free Troposphere, in preparation, 2021.
Draxler, R. R. and Hess, G. D.: Description of the HYSPLIT4 modeling system, NOAA Technical Memorandum ERL ARL-224, Air Resources Laboratory, Silver Spring, Maryland, 1997.
Formenti, P., D'Anna, B., Flamant, C., Mallet, M., Piketh, S. J., Schepanski, K., Waquet, F., Auriol, F., Brogniez, G., Burnet, F., and Chaboureau, J. P.: The aerosols, radiation and clouds in Southern Africa field campaign in Namibia: overview, illustrative observations, and way forward, B. Am. Meteorol. Soc., 100, 1277–1298, 2019.
Garstang, M., Tyson, P. D., Swap, R., Edwards, M., Kållberg, P., and Lindesay, J. A.: Horizontal and vertical transport of air over southern Africa, J. Geophys. Res.-Atmos., 101, 23721–23736, 1996.
Ghan, S. J., Liu, X., Easter, R. C., Zaveri, R., Rasch, P. J., Yoon, J. H., and Eaton, B.: Toward a minimal representation of aerosols in climate models: Comparative decomposition of aerosol direct, semidirect, and indirect radiative forcing, J. Climate, 25, 6461–6476, 2012.
Golaz, J. C., Salzmann, M., Donner, L. J., Horowitz, L. W., Ming, Y., and Zhao, M.: Sensitivity of the aerosol indirect effect to subgrid variability in the cloud parameterization of the GFDL atmosphere general circulation model AM3, J. Climate, 24, 3145–3160, 2011.
Gordon, H., Field, P. R., Abel, S. J., Dalvi, M., Grosvenor, D. P., Hill, A. A., Johnson, B. T., Miltenberger, A. K., Yoshioka, M., and Carslaw, K. S.: Large simulated radiative effects of smoke in the south-east Atlantic, Atmos. Chem. Phys., 18, 15261–15289, https://doi.org/10.5194/acp-18-15261-2018, 2018.
Gordon, H., Field, P. R., Abel, S. J., Barrett, P., Bower, K., Crawford, I., Cui, Z., Grosvenor, D. P., Hill, A. A., Taylor, J., Wilkinson, J., Wu, H., and Carslaw, K. S.: Development of aerosol activation in the double-moment Unified Model and evaluation with CLARIFY measurements, Atmos. Chem. Phys., 20, 10997–11024, https://doi.org/10.5194/acp-20-10997-2020, 2020.
Grosvenor, D. P., Field, P. R., Hill, A. A., and Shipway, B. J.: The relative importance of macrophysical and cloud albedo changes for aerosol-induced radiative effects in closed-cell stratocumulus: insight from the modelling of a case study, Atmos. Chem. Phys., 17, 5155–5183, https://doi.org/10.5194/acp-17-5155-2017, 2017.
Harrison, M. S. J.: Elevated inversions over southern Africa: Climatological properties and relationships with rainfall, S. Afr. Geogr. J., 75, 1–8, 1993.
Hawcroft, M., Haywood, J. M., Collins, M., and Jones, A.: The contrasting climate response to tropical and extratropical energy perturbations, Clim. Dynam., 51, 3231–3249, 2018.
Haywood, J. M. and Shine, K. P.: The effect of anthropogenic sulfate and soot aerosol on the clear sky planetary radiation budget, Geophys. Res. Lett., 22, 603–606, 1995.
Haywood, J. M., Osborne, S. R., Francis, P. N., Keil, A., Formenti, P., Andreae, M. O., and Kaye, P. H.: The mean physical and optical properties of regional haze dominated by biomass burning aerosol measured from the C-130 aircraft during SAFARI 2000, J. Geophys. Res., 108, 8473, https://doi.org/10.1029/2002JD002226, 2003.
Haywood, J. M., Osborne, S. R., and Abel, S. J.: The effect of overlying absorbing aerosol layers on remote sensing retrievals of cloud effective radius and cloud optical depth, Q. J. Roy. Meteorol. Soc., 130, 779–800, 2004.
Haywood, J. M., Pelon, J., Formenti, P., Bharmal, N., Brooks, M., Capes, G., Chazette, P., Chou, C., Christopher, S., Coe, H., Cuesta, J., Derimian, Y., Desboeufs, K., Greed, G., Harrison, M., Heese, B., Highwood, E. J., Johnson, B., Mallet, M., Marticorena, B., Marsham, J., Milton, S., Myhre, G., Osborne, S. R., Parker, D. J., Rajot, J.-L., Schulz, M., Slingo, A., Tanre, D., and Tulet, P.: Overview of the dust and biomass-burning experiment and African monsoon multidisciplinary analysis special observing period-0, J. Geophys. Res.-Atmos., 113, D00C17, https://doi.org/10.1029/2008JD010077, 2008.
Haywood, J. M., Johnson, B. T., Osborne, S. R., Baran, A. J., Brooks, M., Milton, S. F., Mulcahy, J., Walters, D., Allan, R. P., Klaver, A., Formenti, P., Brindley, H. E., Christopher, S., and Gupta, P.: Motivation, rationale and key results from the GERBILS Saharan dust measurement campaign, Q. J. Roy. Meteorol. Soc., 137, 1106–1116, 2011.
Herbert, R. J., Bellouin, N., Highwood, E. J., and Hill, A. A.: Diurnal cycle of the semi-direct effect from a persistent absorbing aerosol layer over marine stratocumulus in large-eddy simulations, Atmos. Chem. Phys., 20, 1317–1340, https://doi.org/10.5194/acp-20-1317-2020, 2020.
Hersbach, H., Bell, B., Berrisford, P., Hirahara, S., Horányi, A., Muñoz-Sabater, J., Nicolas, J., Peubey, C., Radu, R., Schepers, D., and Simmons, A.: The ERA5 global reanalysis, Q. J. Roy. Meteorol. Soc., 146, 1999–2049, 2020.
Hewitt, H. T., Copsey, D., Culverwell, I. D., Harris, C. M., Hill, R. S. R., Keen, A. B., McLaren, A. J., and Hunke, E. C.: Design and implementation of the infrastructure of HadGEM3: the next-generation Met Office climate modelling system, Geosci. Model Dev., 4, 223–253, https://doi.org/10.5194/gmd-4-223-2011, 2011.
Hill, A. A. and Dobbie, S.: The impact of aerosols on non-precipitating marine stratocumulus. II: The semi-direct effect, Q. J. Roy. Meteorol. Soc., 134, 1155–1165, 2008.
Hill, A. A., Shipway, B. J., and Boutle, I. A.: How sensitive are aerosol–precipitation interactions to the warm rain representation?, J. Adv. Model. Earth Syst., 7, 987–1004, 2015.
Hobbs, P. V.: Clean air slots amid dense atmospheric pollution in southern Africa, J. Geophys. Res., 108, 8490, https://doi.org/10.1029/2002JD002156, 2003.
Hsu, N. C., Herman, J. R., and Tsay, S. C.: Radiative impacts from biomass burning in the presence of clouds during boreal spring in southeast Asia, Geophys. Res. Lett., 30, 1224, https://doi.org/10.1029/2002GL016485, 2003.
Johnson, B. T., Shine, K. P., and Forster, P. M.: The semi-direct aerosol effect: Impact of absorbing aerosols on marine stratocumulus, Q. J. Roy. Meteorol. Soc., 130, 1407–1422, 2004.
Johnson, B. T., Osborne, S. R., Haywood, J. M., and Harrison, M. A. J.: Aircraft measurements of biomass burning aerosol over West Africa during DABEX, J. Geophys. Res.-Atmos., 113, D00C06, https://doi.org/10.1029/2007JD009451, 2008.
Jones, A. and Haywood, J. M.: Sea-spray geoengineering in the HadGEM2-ES earth-system model: radiative impact and climate response, Atmos. Chem. Phys., 12, 10887–10898, https://doi.org/10.5194/acp-12-10887-2012, 2012.
Jones, A., Haywood, J., and Boucher, O.: Climate impacts of geoengineering marine stratocumulus clouds, J. Geophys. Res.-Atmos., 114, D10106, https://doi.org/10.1029/2008JD011450, 2009.
Kacarab, M., Thornhill, K. L., Dobracki, A., Howell, S. G., O'Brien, J. R., Freitag, S., Poellot, M. R., Wood, R., Zuidema, P., Redemann, J., and Nenes, A.: Biomass Burning Aerosol as a Modulator of Droplet Number in the Southeast Atlantic Region, Atmos. Chem. Phys., 20, 3029–3040, https://doi.org/10.5194/acp-20-3029-2020, 2020.
Kaiser, J. W., Heil, A., Andreae, M. O., Benedetti, A., Chubarova, N., Jones, L., Morcrette, J.-J., Razinger, M., Schultz, M. G., Suttie, M., and van der Werf, G. R.: Biomass burning emissions estimated with a global fire assimilation system based on observed fire radiative power, Biogeosciences, 9, 527–554, https://doi.org/10.5194/bg-9-527-2012, 2012.
Keil, A. and Haywood, J. M.: Solar radiative forcing by biomass burning aerosol particles during SAFARI 2000: A case study based on measured aerosol and cloud properties, J. Geophys. Res.-Atmos., 108, 8467, https://doi.org/10.1029/2002JD002315, 2003.
Knippertz, P., Coe, H., Chiu, J. C., Evans, M. J., Fink, A. H., Kalthoff, N., Liousse, C., Mari, C., Allan, R., Brooks, B., Danour, S., Flamant, C., Jegede, O. O., Lohou, F., and Marsham, J. H.: The DACCIWA project: Dynamics–aerosol–chemistry–cloud interactions in West Africa, B. Am. Meteorol. Soc., 96, 1451–1460, 2015.
Lack, D. A., Cappa, C. D., Covert, D. S., Baynard, T., Massoli, P., Sierau, B., Bates, T. S., Quinn, P. K., Lovejoy, E. R., and Ravishankara, A. R.: Bias in filter-based aerosol light absorption measurements due to organic aerosol loading: Evidence from ambient measurements, Aerosol Sci. Tech., 42, 1033–1041, 2008.
Lamarque, J.-F., Bond, T. C., Eyring, V., Granier, C., Heil, A., Klimont, Z., Lee, D., Liousse, C., Mieville, A., Owen, B., Schultz, M. G., Shindell, D., Smith, S. J., Stehfest, E., Van Aardenne, J., Cooper, O. R., Kainuma, M., Mahowald, N., McConnell, J. R., Naik, V., Riahi, K., and van Vuuren, D. P.: Historical (1850–2000) gridded anthropogenic and biomass burning emissions of reactive gases and aerosols: methodology and application, Atmos. Chem. Phys., 10, 7017–7039, https://doi.org/10.5194/acp-10-7017-2010, 2010.
Lebo, Z. J., Shipway, B. J., Fan, J., Geresdi, I., Hill, A., Miltenberger, A., Morrison, H., Rosenberg, P., Varble, A., and Xue, L.: Challenges for Cloud Modeling in the Context of Aerosol–Cloud–Precipitation Interactions, B. Am. Meteorol. Soc., 98, 1749–1755, 2017.
Lee, L. A., Pringle, K. J., Reddington, C. L., Mann, G. W., Stier, P., Spracklen, D. V., Pierce, J. R., and Carslaw, K. S.: The magnitude and causes of uncertainty in global model simulations of cloud condensation nuclei, Atmos. Chem. Phys., 13, 8879–8914, https://doi.org/10.5194/acp-13-8879-2013, 2013.
Liu, Z., Osborne, M., Haywood, J., Anderson, K., Shulter, J. D., Wilson, A., Langridge, J., Yim, S. H. L., Coe, H., Babu, S., Satheesh, S. K., Zuidema, P., Huang, T., and Cheng, J. C. H.: Characterizing the performance of a POPS miniaturized optical particle counter when operated on a quadcopter drone, Atmos. Meas. Tech. Discuss. [preprint], https://doi.org/10.5194/amt-2020-495, in review, 2021.
Magi, B. I., Fu, Q., Redemann, J., and Schmid, B., Using aircraft measurements to estimate the magnitude and uncertainty of the shortwave direct radiative forcing of southern African biomass burning aerosol, J. Geophys. Res., 113, D05213, https://doi.org/10.1029/2007JD009258, 2008.
Malavelle, F. F., Haywood, J. M., Field, P. R., Hill, A. A., Abel, S. J., Lock, A. P., Shipway, B. J., and McBeath, K.: A method to represent subgrid-scale updraft velocity in kilometer-scale models: Implication for aerosol activation, J. Geophys. Res.-Atmos., 119, 4149–4173, 2014.
Malavelle, F. F., Haywood, J. M., Jones, A., Gettelman, A., Clarisse, L., Bauduin, S., Allan, R. P., Karset, I. H. H., Kristjánsson, J. E., Oreopoulos, L., and Cho, N.: Strong constraints on aerosol–cloud interactions from volcanic eruptions, Nature, 546, 485–491, 2017.
Mallet, M., Solmon, F., Nabat, P., Elguindi, N., Waquet, F., Bouniol, D., Sayer, A. M., Meyer, K., Roehrig, R., Michou, M., Zuidema, P., Flamant, C., Redemann, J., and Formenti, P.: Direct and semi-direct radiative forcing of biomass-burning aerosols over the southeast Atlantic (SEA) and its sensitivity to absorbing properties: a regional climate modeling study, Atmos. Chem. Phys., 20, 13191–13216, https://doi.org/10.5194/acp-20-13191-2020, 2020.
Mann, G. W., Carslaw, K. S., Spracklen, D. V., Ridley, D. A., Manktelow, P. T., Chipperfield, M. P., Pickering, S. J., and Johnson, C. E.: Description and evaluation of GLOMAP-mode: a modal global aerosol microphysics model for the UKCA composition-climate model, Geosci. Model Dev., 3, 519–551, https://doi.org/10.5194/gmd-3-519-2010, 2010.
Marenco, F., Johnson, B., Turnbull, K., Newman, S., Haywood, J., Webster, H., and Ricketts, H.:Airborne lidar observations of the 2010 Eyjafjallajökull volcanic ash plume, J. Geophys. Res.-Atmos., 116, D00U05, https://doi.org/10.1029/2011JD016396, 2011.
McMeeking, G. R., Morgan, W. T., Flynn, M., Highwood, E. J., Turnbull, K., Haywood, J., and Coe, H.: Black carbon aerosol mixing state, organic aerosols and aerosol optical properties over the United Kingdom, Atmos. Chem. Phys., 11, 9037–9052, https://doi.org/10.5194/acp-11-9037-2011, 2011.
Meyer, K., Platnick, S., and Zhang, Z.: Simultaneously inferring above-cloud absorbing aerosol optical thickness and underlying liquid phase cloud optical and microphysical properties using MODIS, J. Geophys. Res.-Atmos., 120, 5524–5547, https://doi.org/10.1002/2015JD023128, 2015.
Milton, S. F. and Earnshaw, P.: Evaluation of surface water and energy cycles in the Met Office global NWP model using CEOP data, J. Meteorol. Soc. Jpn. Ser. II, 85, 43–72, 2007.
Morgan, W. T., Allan, J. D., Bower, K. N., Highwood, E. J., Liu, D., McMeeking, G. R., Northway, M. J., Williams, P. I., Krejci, R., and Coe, H.: Airborne measurements of the spatial distribution of aerosol chemical composition across Europe and evolution of the organic fraction, Atmos. Chem. Phys., 10, 4065–4083, https://doi.org/10.5194/acp-10-4065-2010, 2010.
Müller, T., Virkkula, A., and Ogren, J. A.: Constrained two-stream algorithm for calculating aerosol light absorption coefficient from the Particle Soot Absorption Photometer, Atmos. Meas. Tech., 7, 4049–4070, https://doi.org/10.5194/amt-7-4049-2014, 2014.
Myers, T. A. and Norris, J. R.: Observational evidence that enhanced subsidence reduces subtropical marine boundary layer cloudiness, J. Climate, 26, 7507–7524, 2013.
Myhre, G., Shindell, D., Bréon, F.-M., Collins, W., Fuglestvedt, J., Huang, J., Koch, D., Lamarque, J.-F., Lee, D., Mendoza, B., Nakajima, T., Robock, A., Stephens, G., Takemura, T., and Zhang, H.: Anthropogenic and Natural Radiative Forcing, in: Climate Change 2013: The Physical Science Basis, Contribution of Working Group I to the Fifth Assessment Report of the Intergovernmental Panel on Climate Change, edited by: Stocker, T. F., Qin, D., Plattner, G.-K., Tignor, M., Allen, S. K., Boschung, J., Nauels, A., Xia, Y., Bex, V., and Midgley, P. M., Cambridge University Press, Cambridge, UK and New York, NY, USA, available at: http://www.climatechange2013.org/images/uploads/WGIAR5_WGI12Doc2b_FinalDraft_Chapter08.pdf (last access: January 2021), 2013a.
Myhre, G., Samset, B. H., Schulz, M., Balkanski, Y., Bauer, S., Berntsen, T. K., Bian, H., Bellouin, N., Chin, M., Diehl, T., Easter, R. C., Feichter, J., Ghan, S. J., Hauglustaine, D., Iversen, T., Kinne, S., Kirkevåg, A., Lamarque, J.-F., Lin, G., Liu, X., Lund, M. T., Luo, G., Ma, X., van Noije, T., Penner, J. E., Rasch, P. J., Ruiz, A., Seland, Ø., Skeie, R. B., Stier, P., Takemura, T., Tsigaridis, K., Wang, P., Wang, Z., Xu, L., Yu, H., Yu, F., Yoon, J.-H., Zhang, K., Zhang, H., and Zhou, C.: Radiative forcing of the direct aerosol effect from AeroCom Phase II simulations, Atmos. Chem. Phys., 13, 1853–1877, https://doi.org/10.5194/acp-13-1853-2013, 2013b.
Ogren, J. A.: Comment on “Calibration and Intercomparison of Filter-Based Measurements of Visible Light Absorption by Aerosols”, Aerosol Sci. Tech., 44, 589–591, https://doi.org/10.1080/02786826.2010.482111, 2010.
Osborne, S. R., Haywood, J. M., Francis, P. N., and Dubovik, O.: Short-wave radiative effects of biomass burning aerosol during SAFARI2000, Q. J. Roy. Meteorol. Soc., 130, 1423–1447, 2004.
Osborne, S. R., Johnson, B. T., Haywood, J. M., Baran, A. J., Harrison, M. A. J., and McConnell, C. L.: Physical and optical properties of mineral dust aerosol during the Dust and Biomass-burning Experiment, J. Geophys. Res.-Atmos., 113, D00C03, https://doi.org/10.1029/2007JD009551, 2008.
Osborne, S. R., Baran, A. J., Johnson, B. T., Haywood, J. M., Hesse, E., and Newman, S.: Short-wave and long-wave radiative properties of Saharan dust aerosol, Q. J. Roy. Meteorol. Soc., 137, 1149–1167, 2011.
O'Sullivan, D., Marenco, F., Ryder, C. L., Pradhan, Y., Kipling, Z., Johnson, B., Benedetti, A., Brooks, M., McGill, M., Yorks, J., and Selmer, P.: Models transport Saharan dust too low in the atmosphere: a comparison of the MetUM and CAMS forecasts with observations, Atmos. Chem. Phys., 20, 12955–12982, https://doi.org/10.5194/acp-20-12955-2020, 2020.
Painemal, D. and Zuidema, P.: The first aerosol indirect effect quantified through airborne remote sensing during VOCALS-REx, Atmos. Chem. Phys., 13, 917–931, https://doi.org/10.5194/acp-13-917-2013, 2013.
Peers, F., Bellouin, N., Waquet, F., Ducos, F., Goloub, P., Mollard, J., Myhre, G., Skeie, R. B., Takemura, T., Tanré, D., Thieuleux, F., and Zhang, K.: Comparison of aerosol optical properties above clouds between POLDER and AeroCom models over the South East Atlantic Ocean during the fire season, Geophys. Res. Lett., 43, 3991–4000, https://doi.org/10.1002/2016GL068222, 2016.
Peers, F., Francis, P., Fox, C., Abel, S. J., Szpek, K., Cotterell, M. I., Davies, N. W., Langridge, J. M., Meyer, K. G., Platnick, S. E., and Haywood, J. M.: Observation of absorbing aerosols above clouds over the south-east Atlantic Ocean from the geostationary satellite SEVIRI – Part 1: Method description and sensitivity, Atmos. Chem. Phys., 19, 9595–9611, https://doi.org/10.5194/acp-19-9595-2019, 2019.
Peers, F., Francis, P., Abel, S. J., Barrett, P. A., Bower, K. N., Cotterell, M. I., Crawford, I., Davies, N. W., Fox, C., Fox, S., Langridge, J. M., Meyer, K. G., Platnick, S. E., Szpek, K., and Haywood, J. M.: Observation of absorbing aerosols above clouds over the South-East Atlantic Ocean from the geostationary satellite SEVIRI – Part 2: Comparison with MODIS and aircraft measurements from the CLARIFY-2017 field campaign, Atmos. Chem. Phys. Discuss., https://doi.org/10.5194/acp-2019-1176, in review, 2020.
Pincus, R. and Baker, M. B.: Effect of precipitation on the albedo susceptibility of clouds in the marine boundary layer, Nature, 372, 250–252, 1994.
Pistone, K., Redemann, J., Doherty, S., Zuidema, P., Burton, S., Cairns, B., Cochrane, S., Ferrare, R., Flynn, C., Freitag, S., Howell, S. G., Kacenelenbogen, M., LeBlanc, S., Liu, X., Schmidt, K. S., Sedlacek III, A. J., Segal-Rozenhaimer, M., Shinozuka, Y., Stamnes, S., van Diedenhoven, B., Van Harten, G., and Xu, F.: Intercomparison of biomass burning aerosol optical properties from in situ and remote-sensing instruments in ORACLES-2016, Atmos. Chem. Phys., 19, 9181–9208, https://doi.org/10.5194/acp-19-9181-2019, 2019.
Pope, R. J., Marsham, J. H., Knippertz, P., Brooks, M. E., and Roberts, A. J.: Identifying errors in dust models from data assimilation, Geophys. Res. Lett., 43, 9270–9279, 2016.
Pósfai, M., Simonics, R., Li, J., Hobbs, P. V., and Buseck, P. R.: Individual aerosol particles from biomass burning in southern Africa: 1. Compositions and size distributions of carbonaceous particles, J. Geophys. Res.-Atmos., 108, 8483, https://doi.org/10.1029/2002JD002291, 2003.
Possner, A., Eastman, R., Bender, F., and Glassmeier, F.: Deconvolution of boundary layer depth and aerosol constraints on cloud water path in subtropical stratocumulus decks, Atmos. Chem. Phys., 20, 3609–3621, https://doi.org/10.5194/acp-20-3609-2020, 2020.
Quaas, J., O. Boucher, O., Bellouin, N., and Kinne, S.: Satellite-based estimate of the direct and indirect aerosol climate forcing, J. Geophys. Res., 113, D05204, https://doi.org/10.1029/2007JD008962, 2008.
Quaas, J., Ming, Y., Menon, S., Takemura, T., Wang, M., Penner, J. E., Gettelman, A., Lohmann, U., Bellouin, N., Boucher, O., Sayer, A. M., Thomas, G. E., McComiskey, A., Feingold, G., Hoose, C., Kristjánsson, J. E., Liu, X., Balkanski, Y., Donner, L. J., Ginoux, P. A., Stier, P., Grandey, B., Feichter, J., Sednev, I., Bauer, S. E., Koch, D., Grainger, R. G., Kirkevåg, A., Iversen, T., Seland, Ø., Easter, R., Ghan, S. J., Rasch, P. J., Morrison, H., Lamarque, J.-F., Iacono, M. J., Kinne, S., and Schulz, M.: Aerosol indirect effects – general circulation model intercomparison and evaluation with satellite data, Atmos. Chem. Phys., 9, 8697–8717, https://doi.org/10.5194/acp-9-8697-2009, 2009.
Ramaswamy, V., Boucher, O., Haigh, J., Hauglustaine, D., Haywood, J., Myhre, G., Nakajima, T., Shi, G. Y., and Solomon, S.: Radiative Forcing of Climate Change, in: Climate Change 2001: The Scientific Basis, Contribution of Working Group I to the Third Assessment Report of the Intergovernmental Panel on Climate Change, Cambridge University Press, Cambridge, UK, 349–416, 2003.
Randles, C. A. and Ramaswamy, V.: Direct and semi-direct impacts of absorbing biomass burning aerosol on the climate of southern Africa: a Geophysical Fluid Dynamics Laboratory GCM sensitivity study, Atmos. Chem. Phys., 10, 9819–9831, https://doi.org/10.5194/acp-10-9819-2010, 2010.
Redemann, J., Wood, R., Zuidema, P., Doherty, S. J., Luna, B., LeBlanc, S. E., Diamond, M. S., Shinozuka, Y., Chang, I. Y., Ueyama, R., Pfister, L., Ryoo, J., Dobracki, A. N., da Silva, A. M., Longo, K. M., Kacenelenbogen, M. S., Flynn, C. J., Pistone, K., Knox, N. M., Piketh, S. J., Haywood, J. M., Formenti, P., Mallet, M., Stier, P., Ackerman, A. S., Bauer, S. E., Fridlind, A. M., Carmichael, G. R., Saide, P. E., Ferrada, G. A., Howell, S. G., Freitag, S., Cairns, B., Holben, B. N., Knobelspiesse, K. D., Tanelli, S., L'Ecuyer, T. S., Dzambo, A. M., Sy, O. O., McFarquhar, G. M., Poellot, M. R., Gupta, S., O'Brien, J. R., Nenes, A., Kacarab, M. E., Wong, J. P. S., Small-Griswold, J. D., Thornhill, K. L., Noone, D., Podolske, J. R., Schmidt, K. S., Pilewskie, P., Chen, H., Cochrane, S. P., Sedlacek, A. J., Lang, T. J., Stith, E., Segal-Rozenhaimer, M., Ferrare, R. A., Burton, S. P., Hostetler, C. A., Diner, D. J., Platnick, S. E., Myers, J. S., Meyer, K. G., Spangenberg, D. A., Maring, H., and Gao, L.: An overview of the ORACLES (ObseRvations of Aerosols above CLouds and their intEractionS) project: aerosol-cloud-radiation interactions in the Southeast Atlantic basin, Atmos. Chem. Phys. Discuss., https://doi.org/10.5194/acp-2020-449, in review, 2020.
Roeckner, E., Stier, P., Feichter, J., Kloster, S., Esch, M., and Fischer-Bruns, I.: Impact of carbonaceous aerosol emissions on regional climate change, Clim. Dynam., 27, 553–571, 2006.
Saide, P. E., Thompson, G., Eidhammer, T., Da Silva, A. M., Pierce, R. B., and Carmichael, G. R.: Assessment of biomass burning smoke influence on environmental conditions for multiyear tornado outbreaks by combining aerosol-aware microphysics and fire emission constraints, J. Geophys. Res.-Atmos., 121, 10294–10311, https://doi.org/10.1002/2016JD025056, 2016.
Sakaeda, N., Wood, R., and Rasch, P. J.: Direct and semidirect aerosol effects of southern African biomass burning aerosol, J. Geophys. Res., 116, D12205, https://doi.org/10.1029/2010JD015540, 2011.
Saleh, R., Marks, M., Heo, J., Adams, P. J., Donahue, N. M., and Robinson, A. L.: Contribution of brown carbon and lensing to the direct radiative effect of carbonaceous aerosols from biomass and biofuel burning emissions, J. Geophys. Res.-Atmos., 120, 10285–10296, https://doi.org/10.1002/2015JD023697, 2015
Samset, B. H., Myhre, G., Schulz, M., Balkanski, Y., Bauer, S., Berntsen, T. K., Bian, H., Bellouin, N., Diehl, T., Easter, R. C., Ghan, S. J., Iversen, T., Kinne, S., Kirkevåg, A., Lamarque, J.-F., Lin, G., Liu, X., Penner, J. E., Seland, Ø., Skeie, R. B., Stier, P., Takemura, T., Tsigaridis, K., and Zhang, K.: Black carbon vertical profiles strongly affect its radiative forcing uncertainty, Atmos. Chem. Phys., 13, 2423–2434, https://doi.org/10.5194/acp-13-2423-2013, 2013.
Schwarz, J. P., Spackman, J. R., Fahey, D. W., Gao, R. S., Lohmann, U., Stier, P., Watts, L. A., Thomson, D. S., Lack, D. A., Pfister, L., and Mahoney, M. J.: Coatings and their enhancement of black carbon light absorption in the tropical atmosphere, J. Geophys. Res.-Atmos., 113, D03203, https://doi.org/10.1029/2007JD009042, 2008.
Sedlacek, A. and Lee, J.: Photothermal interferometric aerosol absorption spectrometry, Aerosol Sci. Tech., 41, 1089–1101, 2007
Shindell, D., Kuylenstierna, J.C., Vignati, E., van Dingenen, R., Amann, M., Klimont, Z., Anenberg, S. C., Muller, N., Janssens-Maenhout, G., Raes, F., and Schwartz, J.: Simultaneously mitigating near-term climate change and improving human health and food security, Science, 335, 183–189, 2012.
Shinozuka, Y., Saide, P. E., Ferrada, G. A., Burton, S. P., Ferrare, R., Doherty, S. J., Gordon, H., Longo, K., Mallet, M., Feng, Y., Wang, Q., Cheng, Y., Dobracki, A., Freitag, S., Howell, S. G., LeBlanc, S., Flynn, C., Segal-Rosenhaimer, M., Pistone, K., Podolske, J. R., Stith, E. J., Bennett, J. R., Carmichael, G. R., da Silva, A., Govindaraju, R., Leung, R., Zhang, Y., Pfister, L., Ryoo, J.-M., Redemann, J., Wood, R., and Zuidema, P.: Modeling the smoky troposphere of the southeast Atlantic: a comparison to ORACLES airborne observations from September of 2016, Atmos. Chem. Phys., 20, 11491–11526, https://doi.org/10.5194/acp-20-11491-2020, 2020.
Stein, A. F., Draxler, R. R., Rolph, G. D., Stunder, B. J., Cohen, M. D., and Ngan, F.: NOAA's HYSPLIT atmospheric transport and dispersion modeling system, B. Am. Meteorol. Soc., 96, 2059–2077, 2015.
Stephens, G. L., Hakuba, M. Z., Hawcroft, M., Haywood, J. M., Behrangi, A., Kay, J. E., and Webster, P. J.: The curious nature of the hemispheric symmetry of the Earth's water and energy balances. Curr. Clim. Change Rep., 2, 135–147, 2016.
Stevens, B. and Feingold, G.: Untangling aerosol effects on clouds and precipitation in a buffered system, Nature, 461, 607–613, https://doi.org/10.1038/nature08281, 2009.
Stier, P., Feichter, J., Kinne, S., Kloster, S., Vignati, E., Wilson, J., Ganzeveld, L., Tegen, I., Werner, M., Balkanski, Y., Schulz, M., Boucher, O., Minikin, A., and Petzold, A.: The aerosol-climate model ECHAM5-HAM, Atmos. Chem. Phys., 5, 1125–1156, https://doi.org/10.5194/acp-5-1125-2005, 2005.
Stier, P., Schutgens, N. A. J., Bellouin, N., Bian, H., Boucher, O., Chin, M., Ghan, S., Huneeus, N., Kinne, S., Lin, G., Ma, X., Myhre, G., Penner, J. E., Randles, C. A., Samset, B., Schulz, M., Takemura, T., Yu, F., Yu, H., and Zhou, C.: Host model uncertainties in aerosol radiative forcing estimates: results from the AeroCom Prescribed intercomparison study, Atmos. Chem. Phys., 13, 3245–3270, https://doi.org/10.5194/acp-13-3245-2013, 2013.
Swap, R. J., Annegarn, H. J., Suttles, J. T., Haywood, J., Helmlinger, M. C., Hely, C., Hobbs, P. V., Holben, B. N., Ji, J., King, M. D., and Landmann, T.: The Southern African Regional Science Initiative (SAFARI 2000): overview of the dry season field campaign, S. Afr. J. Sci., 8, 125–130, 2002.
Taylor, J. W., Wu, H., Szpek, K., Bower, K., Crawford, I., Flynn, M. J., Williams, P. I., Dorsey, J., Langridge, J. M., Cotterell, M. I., Fox, C., Davies, N. W., Haywood, J. M., and Coe, H.: Absorption closure in highly aged biomass burning smoke, Atmos. Chem. Phys., 20, 11201–11221, https://doi.org/10.5194/acp-20-11201-2020, 2020.
Toll, V., Christensen, M., Gassó, S., and Bellouin, N.: Volcano and Ship Tracks Indicate Excessive Aerosol-Induced Cloud Water Increases in a Climate Model, Geophys. Res. Lett., 44, 12492–12500, https://doi.org/10.1002/2017GL075280, 2017.
Toll, V., Christensen, M., Quaas, J., and Bellouin, N.: Weak average liquid-cloud-water response to anthropogenic aerosols, Nature, 572, 51–55, 2019.
Twomey, S.: The influence of pollution on the shortwave albedo of clouds, J. Atmos. Sci., 34, 1149–1152, 1977.
van der Werf, G. R., Randerson, J. T., Giglio, L., Collatz, G. J., Mu, M., Kasibhatla, P. S., Morton, D. C., DeFries, R. S., Jin, Y., and van Leeuwen, T. T.: Global fire emissions and the contribution of deforestation, savanna, forest, agricultural, and peat fires (1997–2009), Atmos. Chem. Phys., 10, 11707–11735, https://doi.org/10.5194/acp-10-11707-2010, 2010.
Vehkamäki, H., Kulmala, M., Napari, I., Lehtinen, K. E., Timmreck, C., Noppel, M., and Laaksonen, A.: An improved parameterization for sulfuric acid–water nucleation rates for tropospheric and stratospheric conditions, J. Geophys. Res.-Atmos., 107, 4622, https://doi.org/10.1029/2002JD002184, 2002.
Virkkula, A.: Correction of the Calibration of the 3wavelength Particle Soot Absorption Photometer (3λ PSAP), Aerosol Sci. Tech., 44, 706–712, https://doi.org/10.1080/02786826.2010.482110, 2010.
Walters, D. N., Best, M. J., Bushell, A. C., Copsey, D., Edwards, J. M., Falloon, P. D., Harris, C. M., Lock, A. P., Manners, J. C., Morcrette, C. J., Roberts, M. J., Stratton, R. A., Webster, S., Wilkinson, J. M., Willett, M. R., Boutle, I. A., Earnshaw, P. D., Hill, P. G., MacLachlan, C., Martin, G. M., Moufouma-Okia, W., Palmer, M. D., Petch, J. C., Rooney, G. G., Scaife, A. A., and Williams, K. D.: The Met Office Unified Model Global Atmosphere 3.0/3.1 and JULES Global Land 3.0/3.1 configurations, Geosci. Model Dev., 4, 919–941, https://doi.org/10.5194/gmd-4-919-2011, 2011.
Watson-Parris, D., Schutgens, N., Winker, D., Burton, S. P., Ferrare, R. A., and Stier, P.: On the limits of CALIOP for constraining modeled free tropospheric aerosol, Geophys. Res. Lett., 45, 9260–9266, 2018.
Westphal, D. L. and Toon, O. B: Simulations of microphysical, radiative, and dynamical processes in a continental-scale forest fire smoke plume, J. Geophys. Res.-Atmos., 96, 22379–22400, 1991.
Wilcox, E. M.: Direct and semi-direct radiative forcing of smoke aerosols over clouds, Atmos. Chem. Phys., 12, 139–149, https://doi.org/10.5194/acp-12-139-2012, 2012.
Wilcox, E. M. and Platnick, S.: Estimate of the impact of absorbing aerosol over cloud on the MODIS retrievals of cloud optical thickness and effective radius using two independent retrievals of liquid water path, J. Geophys. Res.-Atmos., 114, D05210, https://doi.org/10.1029/2008JD010589, 2009.
Wood, R.: Drizzle in stratiform boundary layer clouds. Part I: Vertical and horizontal structure, J. Atmos. Sci., 62, 3011–3033, 2005.
Wood, R. and Bretherton, C. S.: On the relationship between stratiform low cloud cover and lower-tropospheric stability, J. Climate, 19, 6425–6432, 2006.
Wood, R., Mechoso, C. R., Bretherton, C. S., Weller, R. A., Huebert, B., Straneo, F., Albrecht, B. A., Coe, H., Allen, G., Vaughan, G., Daum, P., Fairall, C., Chand, D., Gallardo Klenner, L., Garreaud, R., Grados, C., Covert, D. S., Bates, T. S., Krejci, R., Russell, L. M., de Szoeke, S., Brewer, A., Yuter, S. E., Springston, S. R., Chaigneau, A., Toniazzo, T., Minnis, P., Palikonda, R., Abel, S. J., Brown, W. O. J., Williams, S., Fochesatto, J., Brioude, J., and Bower, K. N.: The VAMOS Ocean-Cloud-Atmosphere-Land Study Regional Experiment (VOCALS-REx): goals, platforms, and field operations, Atmos. Chem. Phys., 11, 627–654, https://doi.org/10.5194/acp-11-627-2011, 2011.
Woodward, S.: Modeling the atmospheric life cycle and radiative impact of mineral dust in the Hadley Centre climate model, J. Geophys. Res.-Atmos., 106, 18155–18166, 2001.
Wu, H., Taylor, J. W., Langridge, J., Yu, C., Allan, J. D., Williams, P. I., Flynn, M., Szpek, K., Cotterell, M. I., Fox, C., Davies, N. W., Barker, P., Allan, G., and Coe, H.: Rapid transformation of ambient absorbing aerosols from West African biomass burning during MOYA-2017, in preparation, 2020.
Wu, H., Taylor, J. W., Szpek, K., Langridge, J. M., Williams, P. I., Flynn, M., Allan, J. D., Abel, S. J., Pitt, J., Cotterell, M. I., Fox, C., Davies, N. W., Haywood, J., and Coe, H.: Vertical variability of the properties of highly aged biomass burning aerosol transported over the southeast Atlantic during CLARIFY-2017, Atmos. Chem. Phys., 20, 12697–12719, https://doi.org/10.5194/acp-20-12697-2020, 2021.
Yang, Q., W. I. Gustafson Jr., Fast, J. D., Wang, H., Easter, R. C., Morrison, H., Lee, Y.-N., Chapman, E. G., Spak, S. N., and Mena-Carrasco, M. A.: Assessing regional scale predictions of aerosols, marine stratocumulus, and their interactions during VOCALS-REx using WRF-Chem, Atmos. Chem. Phys., 11, 11951–11975, https://doi.org/10.5194/acp-11-11951-2011, 2011.
Zhang, J. and Zuidema, P.: The diurnal cycle of the smoky marine boundary layer observed during August in the remote southeast Atlantic, Atmos. Chem. Phys., 19, 14493–14516, https://doi.org/10.5194/acp-19-14493-2019, 2019.
Zhong, M. and Jang, M.: Dynamic light absorption of biomass-burning organic carbon photochemically aged under natural sunlight, Atmos. Chem. Phys., 14, 1517–1525, https://doi.org/10.5194/acp-14-1517-2014, 2014.
Zuidema, P., Redemann, J., Haywood, J. M., Wood, R., Piketh, S., Hipondoka, M., and Formenti, P.: Smoke and Clouds above the Southeast Atlantic: Upcoming Field Campaigns Probe Absorbing Aerosol's Impact on Climate, B. Am. Meteorol. Soc., 97, 1131–1135, https://doi.org/10.1175/BAMS-D-15-00082.1, 2016.
Zuidema, P., Alvarado, M., Chiu, C., DeSzoeke, S., Fairall, C., Feingold, G., Freedman, A., Ghan, S., Haywood, J., Kollias, P., Lewis, E., McFarquhar, G., McComiskey, A., Mechem, D., Onasch, T., Redemann, J., Romps, D., Turner, D., Wang, H., Wood, R., Yuter, S., and Zhu P.: Layered Atlantic Smoke Interactions with Clouds (LASIC) Field Campaign Report, edited by: Stafford, R., DOE/SC-ARM-18-018, ARM Climate Research Facility, Report DOE/SC-ARM-18-018, US Dept. of Energy, Office of Science, 2018a.
Zuidema, P., Sedlacek III, A. J., Flynn, C., Springston, S., Delgadillo, R., Zhang, J., Aiken, A. C., Koontz, A., and Muradyan, P.: The Ascension Island boundary layer in the remote southeast Atlantic is often smoky, Geophys. Res. Lett., 45, 4456–4465, 2018b.
- Abstract
- Introduction and rationale
- Deployment strategy
- Aircraft and surface-based instrumentation
- Flight patterns for the objectives
- Summary of the flights performed
- Key results
- Conclusions
- Data availability
- Author contributions
- Competing interests
- Special issue statement
- Acknowledgements
- Financial support
- Review statement
- References