the Creative Commons Attribution 4.0 License.
the Creative Commons Attribution 4.0 License.
 | 07 Jul 2021
On the contribution of fast and slow responses to precipitation changes caused by aerosol perturbations
Shipeng Zhang
Philip Stier
Duncan Watson-Parris
Changes in global-mean precipitation are strongly constrained by global radiative cooling, while regional rainfall changes are less constrained because energy can be transported. Absorbing and non-absorbing aerosols have different effects on both global-mean and regional precipitation, due to the distinct effects on energetics. This study analyses the precipitation responses to large perturbations in black carbon (BC) and sulfate (SUL) by examining the changes in atmospheric energy budget terms on global and regional scales, in terms of fast (independent of changes in sea surface temperature, SST) and slow responses (mediated by changes in SST). Changes in atmospheric radiative cooling/heating are further decomposed into contributions from clouds, aerosols, and clear–clean sky (without clouds or aerosols).
Both cases show a decrease in global-mean precipitation, which is dominated by fast responses in the BC case and slow responses in the SUL case. The geographical patterns are distinct too. The intertropical convergence zone (ITCZ), accompanied by tropical rainfall, shifts northward in the BC case, while it shifts southward in the SUL case. For both cases, energy transport terms from the slow response dominate the changes in tropical rainfall, which are associated with the northward (southward) shift of the Hadley cell in response to the enhanced southward (northward) cross-equatorial energy flux caused by increased BC (SUL) emission. The extra-tropical precipitation decreases in both cases. For the BC case, fast responses to increased atmospheric radiative heating contribute most to the reduced rainfall, in which absorbing aerosols directly heat the mid-troposphere, stabilise the column, and suppress precipitation. Unlike BC, non-absorbing aerosols decrease surface temperatures through slow processes, cool the whole atmospheric column, and reduce specific humidity, which leads to decreased radiative cooling from the clear–clean sky, which is consistent with the reduced rainfall. Examining the changes in large-scale circulation and local thermodynamics qualitatively explains the responses of precipitation to aerosol perturbations, whereas the energetic perspective provides a method to quantify their contributions.
- Article
(9339 KB) - Full-text XML
-
Supplement
(2359 KB) - BibTeX
- EndNote


Aerosols have been proposed to affect clouds and precipitation to a large extent by interacting with clouds and radiation (Ramanathan et al., 2001). However, aerosol effects on clouds and precipitation remain highly uncertain due to the complex nature of aerosol–cloud–radiation interactions. For example, satellite-estimated and model-simulated aerosol–cloud interactions show large discrepancies in terms of magnitude and even in sign (e.g. Ackerman et al., 2004; Rosenfeld et al., 2019; Wang et al., 2012). Disagreements between different studies can be attributed to methodologies (Gryspeerdt et al., 2014) and model uncertainties (White et al., 2017) and, importantly, are often related to differences in environmental conditions, such as relative humidity, dynamic background, cloud types, and stability (Alizadeh-Choobari, 2018; Khain, 2009; Khain et al., 2008; Lohmann et al., 2007; Zhang et al., 2016). Knowledge about the chain of processes, from aerosol emission to acting as cloud condensation nuclei (CCN) or ice nuclei (IN) and to cloud microphysics, and dynamics, is critical for reducing the uncertainties and understanding the climate system (Ghan et al., 2016), which is referred to as a “bottom-up” approach. However, this is challenging, considering uncertainties can arise from aerosol emissions, activation, cloud microphysics and dynamic regimes (e.g. Gettelman et al., 2013; Ghan et al., 2012; Michibata et al., 2016; Zhang et al., 2016).
An energetic perspective provides an alternative approach to examine aerosol effects on precipitation, which is referred to as a “top-down” approach. For global scales, in equilibrium, latent heat released from rainfall should be energetically balanced by atmospheric radiative cooling together with surface energy fluxes (Allen and Ingram, 2002; Andrews et al., 2010). Climate forcers, such as greenhouse gases (GHGs) and aerosols, which affect the energy budget, can modify the hydrological responses (Kvalevåg et al., 2013; Stephens and Hu, 2010). The energy constraints can be applied to regional rainfall by introducing the energy transport term (H) (Muller and O'Gorman, 2011; Richardson et al., 2016). The local energy budget at equilibrium can be addressed as the following equation:
where δ denotes the difference between two climate states (e.g. with and without anthropogenic aerosols). L refers to the latent heat of condensation, and P is the precipitation rate, so LP refers to the atmospheric latent heating rate from rainfall. H is the column-integrated divergence of dry static energy, which is expected to be zero on a global scale. Q is the atmospheric diabatic cooling (except for latent heat released from precipitation), consisting of atmospheric radiative cooling (ARC) and downward surface sensible heat flux (−SH). ARC is the difference of shortwave (SW) and longwave (LW) fluxes between the top of the atmosphere (TOA) and the surface. ARC has significant impacts on global hydrological sensitivity (Allen and Ingram, 2002), while changes in the energy transport term (δH) are essential in determining the spatial pattern of precipitation response (Muller and O'Gorman, 2011). Dagan et al. (2019) further demonstrated that whether precipitation responses are more correlated with changes in Q or H depends on the latitude considered. In the extra-tropics, diabatic cooling/heating perturbations are confined to local scales due to strong Coriolis force (thus weak energy transport), and hence the latent heating must balance diabatic cooling according to the energy budget. However, in the tropics, horizontal gradients of dry static energy are small due to the weak Coriolis force. Therefore, local strong diabatic heating perturbations can lead to thermally direct circulations that drive convergence and divergence of moisture and dry static energy. This low-level convergence of mass and moisture can lead to vertical motion and thus an increase in precipitation. So rainfall does not necessarily have to positively correlate with diabatic cooling (Dagan et al., 2019).
Absorbing and non-absorbing aerosols can have different effects on each energy budget term and thus precipitation. On the global scale, black carbon (BC), a strongly absorbing aerosol, can stabilise the atmosphere and suppress precipitation via strong shortwave absorption for short timescales, but it can also increase precipitation by warming up the surface temperature on longer timescales (e.g. Pendergrass and Hartmann, 2012). The net effect can be uncertain among GCMs (Samset et al., 2016) and is sensitive to the altitude where the BC is added (Ming et al., 2010). Unlike BC, non-absorbing aerosols, for example sulfate (SUL), reduce precipitation predominantly by decreasing SST on long timescales through the dimming effect, whereby SUL scatters incoming solar radiation back to the space (Boucher et al., 2013; Kasoar et al., 2018). Additionally, the surface sensible heat flux is more sensitive to changes in BC than SUL (Myhre et al., 2017; Richardson et al., 2018). On zonal scales, due to the relatively short life cycle of aerosols, the radiative forcing caused by aerosols is hemispherically asymmetric, which leads to a warmer Northern Hemisphere for the BC case and a colder one for the SUL case. As a result, the cross-equatorial energy fluxes lead to the intertropical convergent zone (ITCZ) shifting towards the warmer hemisphere (Wang, 2009; Bischoff and Schneider, 2016; Zhao and Suzuki, 2019; Keshtgar et al., 2020; Zanis et al., 2020). On regional scales, it is also worth noting that SUL is usually more suitable as CCN due to its higher hygroscopicity compared to BC. It can therefore alter cloud microphysics and subsequent precipitation formation and regional rainfall by interacting with clouds. However, the susceptibility of precipitation to sulfate aerosols (and the precursors) shows large discrepancies in satellite-estimated precipitation susceptibility to aerosols from several products (Bai et al., 2018; Haynes et al., 2009) and a broad inter-model spread (uncertainty) in GCMs (Ghan et al., 2016; Samset et al., 2016). Some studies also found that the sensitivity of precipitation to sulfate aerosols varies between model-simulated and satellite-estimated results, in terms of magnitude and sometimes in sign (Liu et al., 2020; Wang et al., 2012).
These responses of precipitation have been conventionally suggested to be composed of fast and slow responses (Andrews et al., 2009; Bala et al., 2010). Fast responses, on the timescale from days to months, are independent of changes in sea surface temperature (SST) and mostly dependent on instantaneous changes in atmospheric radiative heating/cooling (O'Gorman et al., 2012; Richardson et al., 2016). It should be noted that even though SST is unchanged in atmosphere-only models, the land surface temperature is generally still allowed to vary (Stjern et al., 2017). Slow responses, on the timescale of years, are mediated by changes in sea surface temperature (SST) and strongly correlate with top-of-atmosphere (TOA) forcing (Kvalevåg et al., 2013; Lambert and Webb, 2008; Suzuki et al., 2017). Distinguishing contributions from fast and slow responses is essential for understanding the mechanisms that cause the precipitation changes. For example, Bony et al. (2013) examined the responses of tropical rainfall to increasing GHGs. They found that the fast processes weaken the vertical motion and counteract a considerable part of the increasing trend induced by surface warming. Shaw and Voigt (2015) have investigated predicted changes in the summertime Asian monsoon under a warming scenario caused by GHGs, and the fast responses caused by direct radiative effect are generally opposite to the slow impacts caused by the SST warming. The changes in circulation are essential for local climate responses, including clouds, radiation, and precipitation (Johnson et al., 2019), whereas the spatial distribution of aerosols' radiative forcing in turn affects atmospheric circulations (Chemke and Dagan, 2018).
Distinguishing contributions from different energetic terms is also helpful for understanding physical processes and model differences (DeAngelis et al., 2015). It has historically been used to distinguish contributions from clouds and aerosols when studying aerosol radiative forcing (Forster et al., 2007; Ghan 2013). While energetics have been applied before to analyse precipitation responses (e.g. Ming et al., 2010; Dagan et al., 2019), here we further decompose them into individual terms to provide additional insights. Changes in the energy transport term (δH) can be decomposed into eddy and mean state components, which are further associated with changes in thermodynamics and dynamics (Muller and O'Gorman, 2011; Richardson et al., 2016). Changes in ARC can be further decomposed into contributions from aerosol (mostly through SW absorption), clouds (LW radiative cooling), and clear–clean sky (mainly from water vapour, greenhouse gases, and the Planck feedback). While it has long been appreciated that changes in ARC are essential in balancing latent heat release from precipitation responses on global scales, their relationship on zonal-mean or regional scales (and which the ARC component dominates) has not been fully explored.
The Precipitation Driver Response Model Intercomparison Project (PDRMIP) (Myhre et al., 2017) has conducted several experiments to study the response of precipitation to different climate forcers, such as GHGs, aerosols, and solar radiation change (e.g. Samset et al., 2016; Stjern et al., 2018). It has been found that the fast response dominates the global-averaged precipitation responses to BC perturbation, which differs from other drivers of climate change (Samset et al., 2017; Stjern et al., 2017). It has also been shown that BC contributes to the most substantial uncertainties among GCMs in simulating the changes in surface temperature and precipitation, due to different parameterisations of physical, chemical, and dynamical processes involved on the path from BC emission to the final climate impact (e.g. Stjern et al., 2017). However, it is worth noting that most PDRMIP research focuses on global-mean changes and addressing uncertainties among GCMs (e.g. Myhre et al., 2017; Richardson et al., 2018; Stjern et al., 2018). Samset et al. (2016) showed the spatial patterns of fast, slow, and total responses of precipitation to different climate forcers including absorbing and non-absorbing aerosols, with a greater focus on the inter-comparison between different GCMs and different climate forcers. Here we study the fast and slow response contribution to total response of precipitation with a focus on the comparison between absorbing and non-absorbing aerosols, and in particular on the underlying mechanisms causing the differences by distinguishing contributions from each energetic term at various scales.
In light of previous work illustrating the potential of energy budget constraints for understanding regional precipitation changes, and the fact that absorbing and non-absorbing aerosols impact the response on two distinct timescales, we aim to answer three questions. (1) What are the contributions of fast and slow responses to total precipitation changes on global and regional scales? (2) What is the dominant energetic term in precipitation responses to absorbing/non-absorbing aerosol perturbations on different spatial and temporal scales? (3) How do we relate changes in local thermodynamics and large-scale circulation to changes in energetic terms and quantify their contribution to precipitation responses?
The global aerosol–climate model ECHAM6–HAM2 (Stier et al., 2005; Zhang et al., 2012; Tegen et al., 2019; Neubauer et al., 2019) is used to perform all the experiments. It is based on the general circulation model ECHAM6 (Stevens et al., 2013) and is coupled to the aerosol module HAM2 (Stier et al., 2005; Zhang et al., 2012). A two-moment cloud microphysics scheme is used to prognostically predict the number and mass mixing ratios for both cloud water and ice (Lohmann et al., 2007; Lohmann and Hoose, 2009). The parameterisations for convection, including cumulus convection and deep convections, are based on the scheme by Tiedtke (1989) and Nordeng (1994). The activation of CCN to cloud droplets is adopted from Abdul-Razzak and Ghan (2000), which is based on Köhler theory (Köhler, 1936). It should be noted that freshly emitted BC is assumed to be hydrophobic and does not act as cloud condensation nuclei. However, subsequent condensation of sulfuric acid and mixing with hydrophilic sulfate aerosols will increase its hygroscopicity so that internally mixed BC particles can activate as CCN (Stier et al., 2006). In HAM2.3, BC can act as ice nuclei through heterogeneous freezing, but only in the accumulation and coarse modes (Neubauer et al., 2019). The parameterisation for autoconversion is from Khairoutdinov and Kogan (2000). There are 16 spectral shortwave bands in the solar radiation scheme and 14 spectrum bands in the longwave radiation scheme (Pincus and Stevens, 2013). The general circulation model ECHAM6 provides essential meteorological backgrounds such as temperature, pressure, wind, and humidity and is coupled to HAM2 for the parameterisations of several aerosol processes such as aerosol activation and deposition.
Emissions of anthropogenic BC, organic carbon, and sulfate are from the Atmospheric Chemistry and Climate Model Intercomparison Project (ACCMIP) emission dataset (Lamarque et al., 2010), including emissions from industry, agriculture, aircraft, domestic, ships, and waste. Biomass burning emissions are also from the ACCMIP dataset, including both natural and anthropogenic biomass burning (Lamarque et al., 2010). Dimethyl sulfide (DMS) emission is interactively related to the 10 m wind speed and concentration in seawater. Biogenic volatile organic carbon and volcanic emissions follow the AeroCom phase II emission dataset (Dentener et al., 2006). All the emissions are prescribed for the year 2000, so there are no interannual variabilities of emissions. Simulations are performed at T63 () spectral resolution using 47 vertical levels (L47).
To study the precipitation response to absorbing and non-absorbing aerosol perturbations, we analyse two scenarios: one with a 10-fold increase in BC emissions (hereafter 10BC) and another with a 5-fold increase in sulfur dioxide (hereafter 5SUL), relative to baseline emissions in the year 2000 (Tegen et al., 2019). It should also be noted that the increases in BC emissions here include both anthropogenic and natural sources. This is because the biomass burning emission, as a large source of BC, includes both anthropogenic emissions (e.g. agricultural waste burning) and naturally occurring wildfire emissions. The anthropogenic contribution to wildfire emissions is assumed to dominate but subject to significant uncertainties (e.g. Lamarque et al., 2010; van Marle et al., 2017), and it is very uncertain to separate the anthropogenic contribution of wildfires. However, the increases in SO2 emissions are all anthropogenic because the sources of volcanic and sulfur are kept the same. The main purpose of this work is to better understand the mechanisms of aerosol–precipitation interactions, with a focus on, but not limited to, anthropogenic aerosol effects. As only particular aerosol emissions are changed in each perturbation, the differences between baseline and the perturbed case can be interpreted as aerosol effects. Geographical patterns of emission aerosol optical depth change can be found in the Supplement (Fig. S1 in the Supplement). We chose the multipliers of aerosol emissions differently here to make the aerosol effects statistically large enough and keep their radiative forcing at the same magnitude (Myhre et al., 2017). Another reason is to make our results comparable with PDRMIP work (Samset et al., 2016).
We run the simulations for 100 years with a mixed-layer ocean (MLO), which is described as 50 m in depth (Dallafior et al., 2016). The ocean heat transport term (also known as the Q flux) is prescribed, which also means the ocean dynamics are unchanged. Therefore, the changes in SST are caused by local responses to net surface heat flux, and the responses in ocean circulations are omitted. To obtain the equilibrium state of precipitation responses to aerosol perturbations, i.e. the total response (ΔPtotal), we use the last 50 years of the simulations because at that time the model has reached approximate equilibrium (Samset et al., 2016). We acknowledge that it might take more than 100 years for a slab ocean model to fully equilibrate. Therefore we also performed a Gregory-style regression (Gregory and Webb, 2008) to check the equilibrium for the BC and SUL cases (see Supplement). For the BC experiment, it is very likely to reach equilibrium after approximately 50 years. For the SUL case, the energy imbalance is significantly reduced and reaches a near equilibrium after a 50-year run as well, but it is suggested that more than 100 years of simulation are needed to fully equilibrate. So the total response of surface temperature to 5-fold SUL should be even lower (more negative). Considering the purpose of our study is to understand the mechanisms of precipitation responses to aerosols, an exact equilibrium is not critical here and our conclusions still apply to an approximate equilibrium. Another simulation is run for 20 years with fixed sea surface temperatures (fSST) and the last 10 years are used. The precipitation responses for fSST simulations can be interpreted as the fast response (ΔPfast). The slow response is then calculated as the difference between the total response and the fast response (Myhre et al., 2017; Samset et al., 2016):
The length of integration period is sufficient to derive the fast and total responses because the fast response of precipitation occurs on timescales from days to months and a slower response on a timescale of years (Myhre et al., 2017).
Since fast and slow responses are examined from an energetic perspective, we focus on how the atmospheric diabatic cooling (Q) and energy transport terms (H) respond to aerosol perturbations in fSST and MLO simulations. H is calculated offline, as a residual by using the energy budget equation. Following previous studies (e.g. Muller and O'Gorman, 2011; Richardson et al., 2016), Q is the combination of atmospheric radiative cooling (ARC) and downward surface sensible flux (−SH), as follows:
ARC is defined as net shortwave (SW) and longwave (LW) radiation loss of the atmospheric column, which can be calculated from the difference between the top of atmosphere (TOA) and surface radiative fluxes (downward positive), defined as
Ghan (2013) suggested using additional diagnostics to distinguish aerosol radiative forcing from aerosols, clouds, and surface albedo. This has been widely adopted in current GCMs to better estimate aerosol effects (e.g. Zhang et al., 2016). Following Ghan (2013), we further decompose ARC into contributions from clouds, aerosols, and clear–clean sky (without aerosols and clouds) separately (Eq. 5), by using the same additional radiation call to calculate ARC from the clear–clean sky (ARCclear,clean):
Since ARC consists of radiative heating/cooling from aerosols (mainly through aerosol direct SW absorption), clouds (primarily through cloud LW absorption/cooling), and clear–clean sky (mainly though LW radiative absorption/cooling from GHGs, water vapour, and Planck feedback), it is helpful to systematically study the effect of absorbing and non-absorbing aerosols on each decomposed energy term and to further connect those to changes in precipitation.
It is worth noting that ΔARCaerosol only includes direct interactions with radiation here and is much more sensitive to absorbing aerosol burden rather than non-absorbing aerosols. Despite the significant negative radiative forcing at TOA (Boucher et al., 2013), non-absorbing aerosols do not significantly modify atmospheric radiative absorption, as they act to decrease net SW radiative fluxes at both the surface and TOA in the same way. Non-absorbing aerosols can affect atmospheric radiative absorption via changing absorbing aerosol life cycles (Stier et al., 2006), but the impacts can be very small. It should also be noted here that changes in ARCcloud include aerosol indirect effects (interactions with clouds) on ARC and cloud feedbacks in slow responses, but most of the changes are from LW radiation from clouds (e.g. Lubin and Vogelman, 2006) rather than SW radiation. And its magnitude depends on the temperature (height) at both cloud top and bottom as well as on the ice concentration at cloud top (see Fig. S2 for baseline ARCcloud). As aerosol effects on convective clouds are not explicitly simulated in ECHAM6–HAM2 (or most GCMs) yet, changes of ARCcloud from convective clouds are mostly caused by aerosol-induced changes in dynamics. Baseline ΔARCaerosol, ΔARCcloud, and ΔARCclear,clean can be seen in the Supplement (Figs. S2–S4).
3.1 Global-mean responses
Table 1 shows the global-mean fast, slow, and total responses of the energy budget terms, including atmospheric latent heat release from precipitation (LΔP) and other atmospheric diabatic cooling terms, in response to increased BC and SUL emission for the fSST and MLO simulations, respectively. Globally averaged precipitation is decreased in both the BC and SUL experiments, and the associated reduced latent heating is primarily balanced by decreased ARC (Table 1). However, there are some substantial differences between BC and SUL cases after decomposition into different contributions.
Table 1ECHAM6–HAM2 simulated multi-annual global averaged fast, slow, and total responses of atmospheric energy budget terms (LP – the atmospheric latent heating rate from rainfall, ARC – atmospheric radiative cooling, SH – sensible heat flux) and surface temperature (T) in response to an increase of a factor of 10 in black carbon (BC) emission and a factor of 5 in sulfate (SUL) precursor emission. ARC has been further decomposed into the contribution from aerosols, clouds, and clear–clean sky. All terms are shown in equivalent precipitation units of mm d−1.
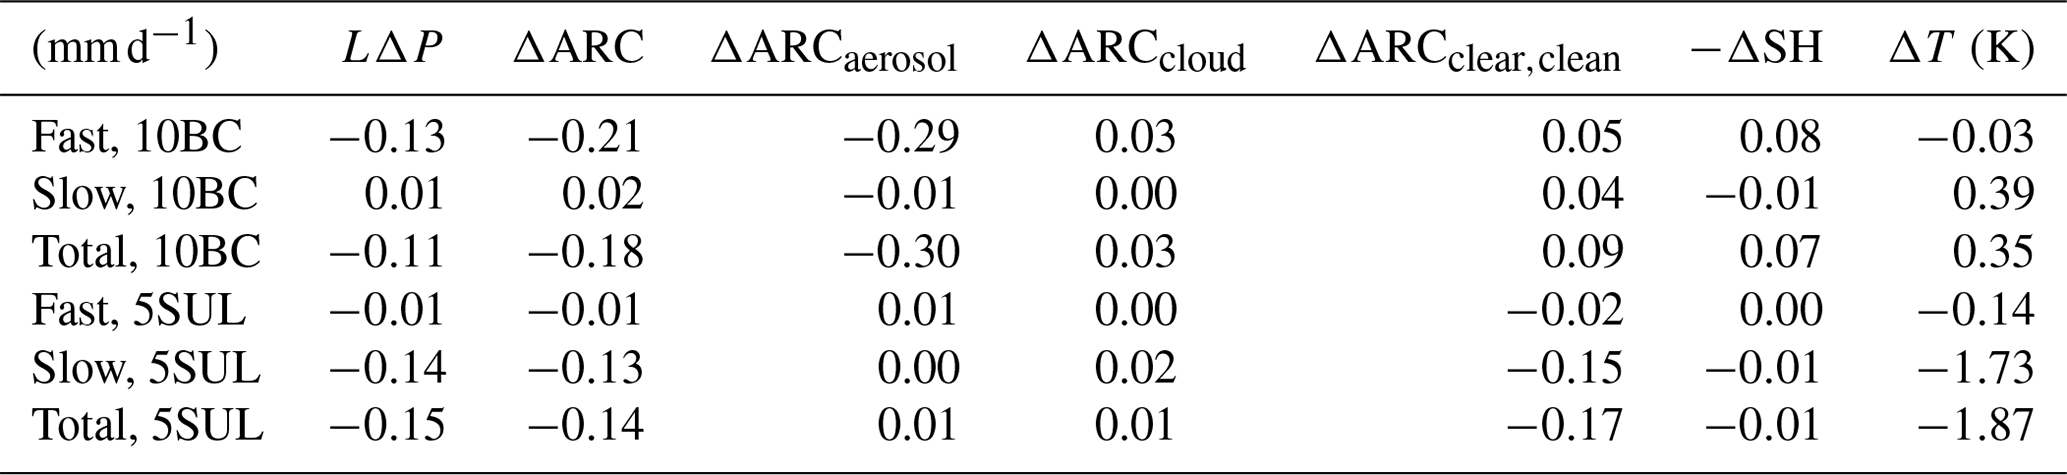
For the BC case, the decreased precipitation from total responses (LΔP around −3.26 W m−2) is mostly contributed by fast responses (LΔP around −3.64 W m−2). Slow responses (LΔP around 0.38 W m−2) lead to precipitation changes that are increased but much smaller in magnitude precipitation compared to the fast responses. Previous studies suggest that fast responses are largely mediated by atmospheric radiative absorption while slow responses scale with surface temperature change (Samset et al., 2016). An increase in BC emissions can increase atmospheric absorption to a large extent, which is a near-instantaneous process. This can be seen from the decomposition of ARC, which shows that the decreased ARC from fast and total responses is mainly due to the increased SW absorption from BC aerosols (ΔARCaerosol) (Table 1). However, the change of global-mean surface temperature in the BC case is small (around 0.4 K). That is because for an increase in BC emissions, reduction of downward SW radiation largely counteracts increased downward LW radiation from the warmer atmosphere. As a result, the change of surface temperature is regionally dependent and globally small (Stjern et al., 2017) (Fig. S2). Large changes in ΔARCaerosol and small changes in global-mean surface temperature lead to a dominating contribution from fast responses to total global-mean rainfall changes for the BC cases.
For the SUL case, the slow response dominates the total response (Table 1). Since SUL is a non-absorbing aerosol, which decreases net SW radiative fluxes at both the surface and TOA through scattering solar radiation, atmospheric absorption changes little. Most of the reduced ARC in the total response is from changes in clear–clean-sky radiative cooling (ΔARCclear,clean) from slow responses mediated via surface flux changes. As SUL decreases SW radiation reaching the surface, the global-mean temperature decreases around 2 K on a relatively long timescale due to the high capacity of oceans (a slow process). Decreased global-mean temperature further leads to reduced ARCclear,clean from decreased atmospheric column temperature (i.e. Planck feedback) (Zelinka et al., 2020) and decreased water vapour content, which is controlled by the Clausius–Clapeyron relationship (Suzuki and Takemura, 2019).
The contribution of changes from SH acts to counteract nearly one-third of the decreased ARC in fast and total responses for the BC case, which is much larger than that in the SUL case. This is because the absorbing aerosols heat the atmosphere and decrease the temperature difference between near-surface air and the surface, resulting in reduced upward SH fluxes. So changes in SH are also dominated by the fast response and mainly act to increase precipitation from an energetic perspective, counteracting the decreasing effect induced by ARC in the BC case (Ming et al., 2010).
3.2 Regional responses and their contributions
The geographical patterns of precipitation responses are substantially different between BC and SUL, in both the fast and total responses (Fig. 1). The patterns are similar to Samset et al. (2016), in which they showed an ensemble result with a focus on inter-comparison among several models and climate forcers. For the total response, it shows a distinct pattern of an ITCZ shift in response to increased BC and SUL emission. ITCZ tends to shift northward in the BC case while it shifts southward in the SUL case (Fig. 1a and b). Since BC warms (SUL cools) the Northern Hemisphere, there is an enhanced southward (northward) cross-equatorial energy flux in response to the aerosol perturbation, resulting in ITCZ being shifted towards the warmer hemisphere (Bischoff and Schneider, 2016; Wang, 2009). Changes in tropical rainfall are dominated by changes in the Hadley cell in response to the enhanced cross-hemispheric energy fluxes. Figure 1e and f further show that the slow response mainly contributes to the ITCZ shift in both cases. This will be further demonstrated in Sect. 3.3 and 3.4.
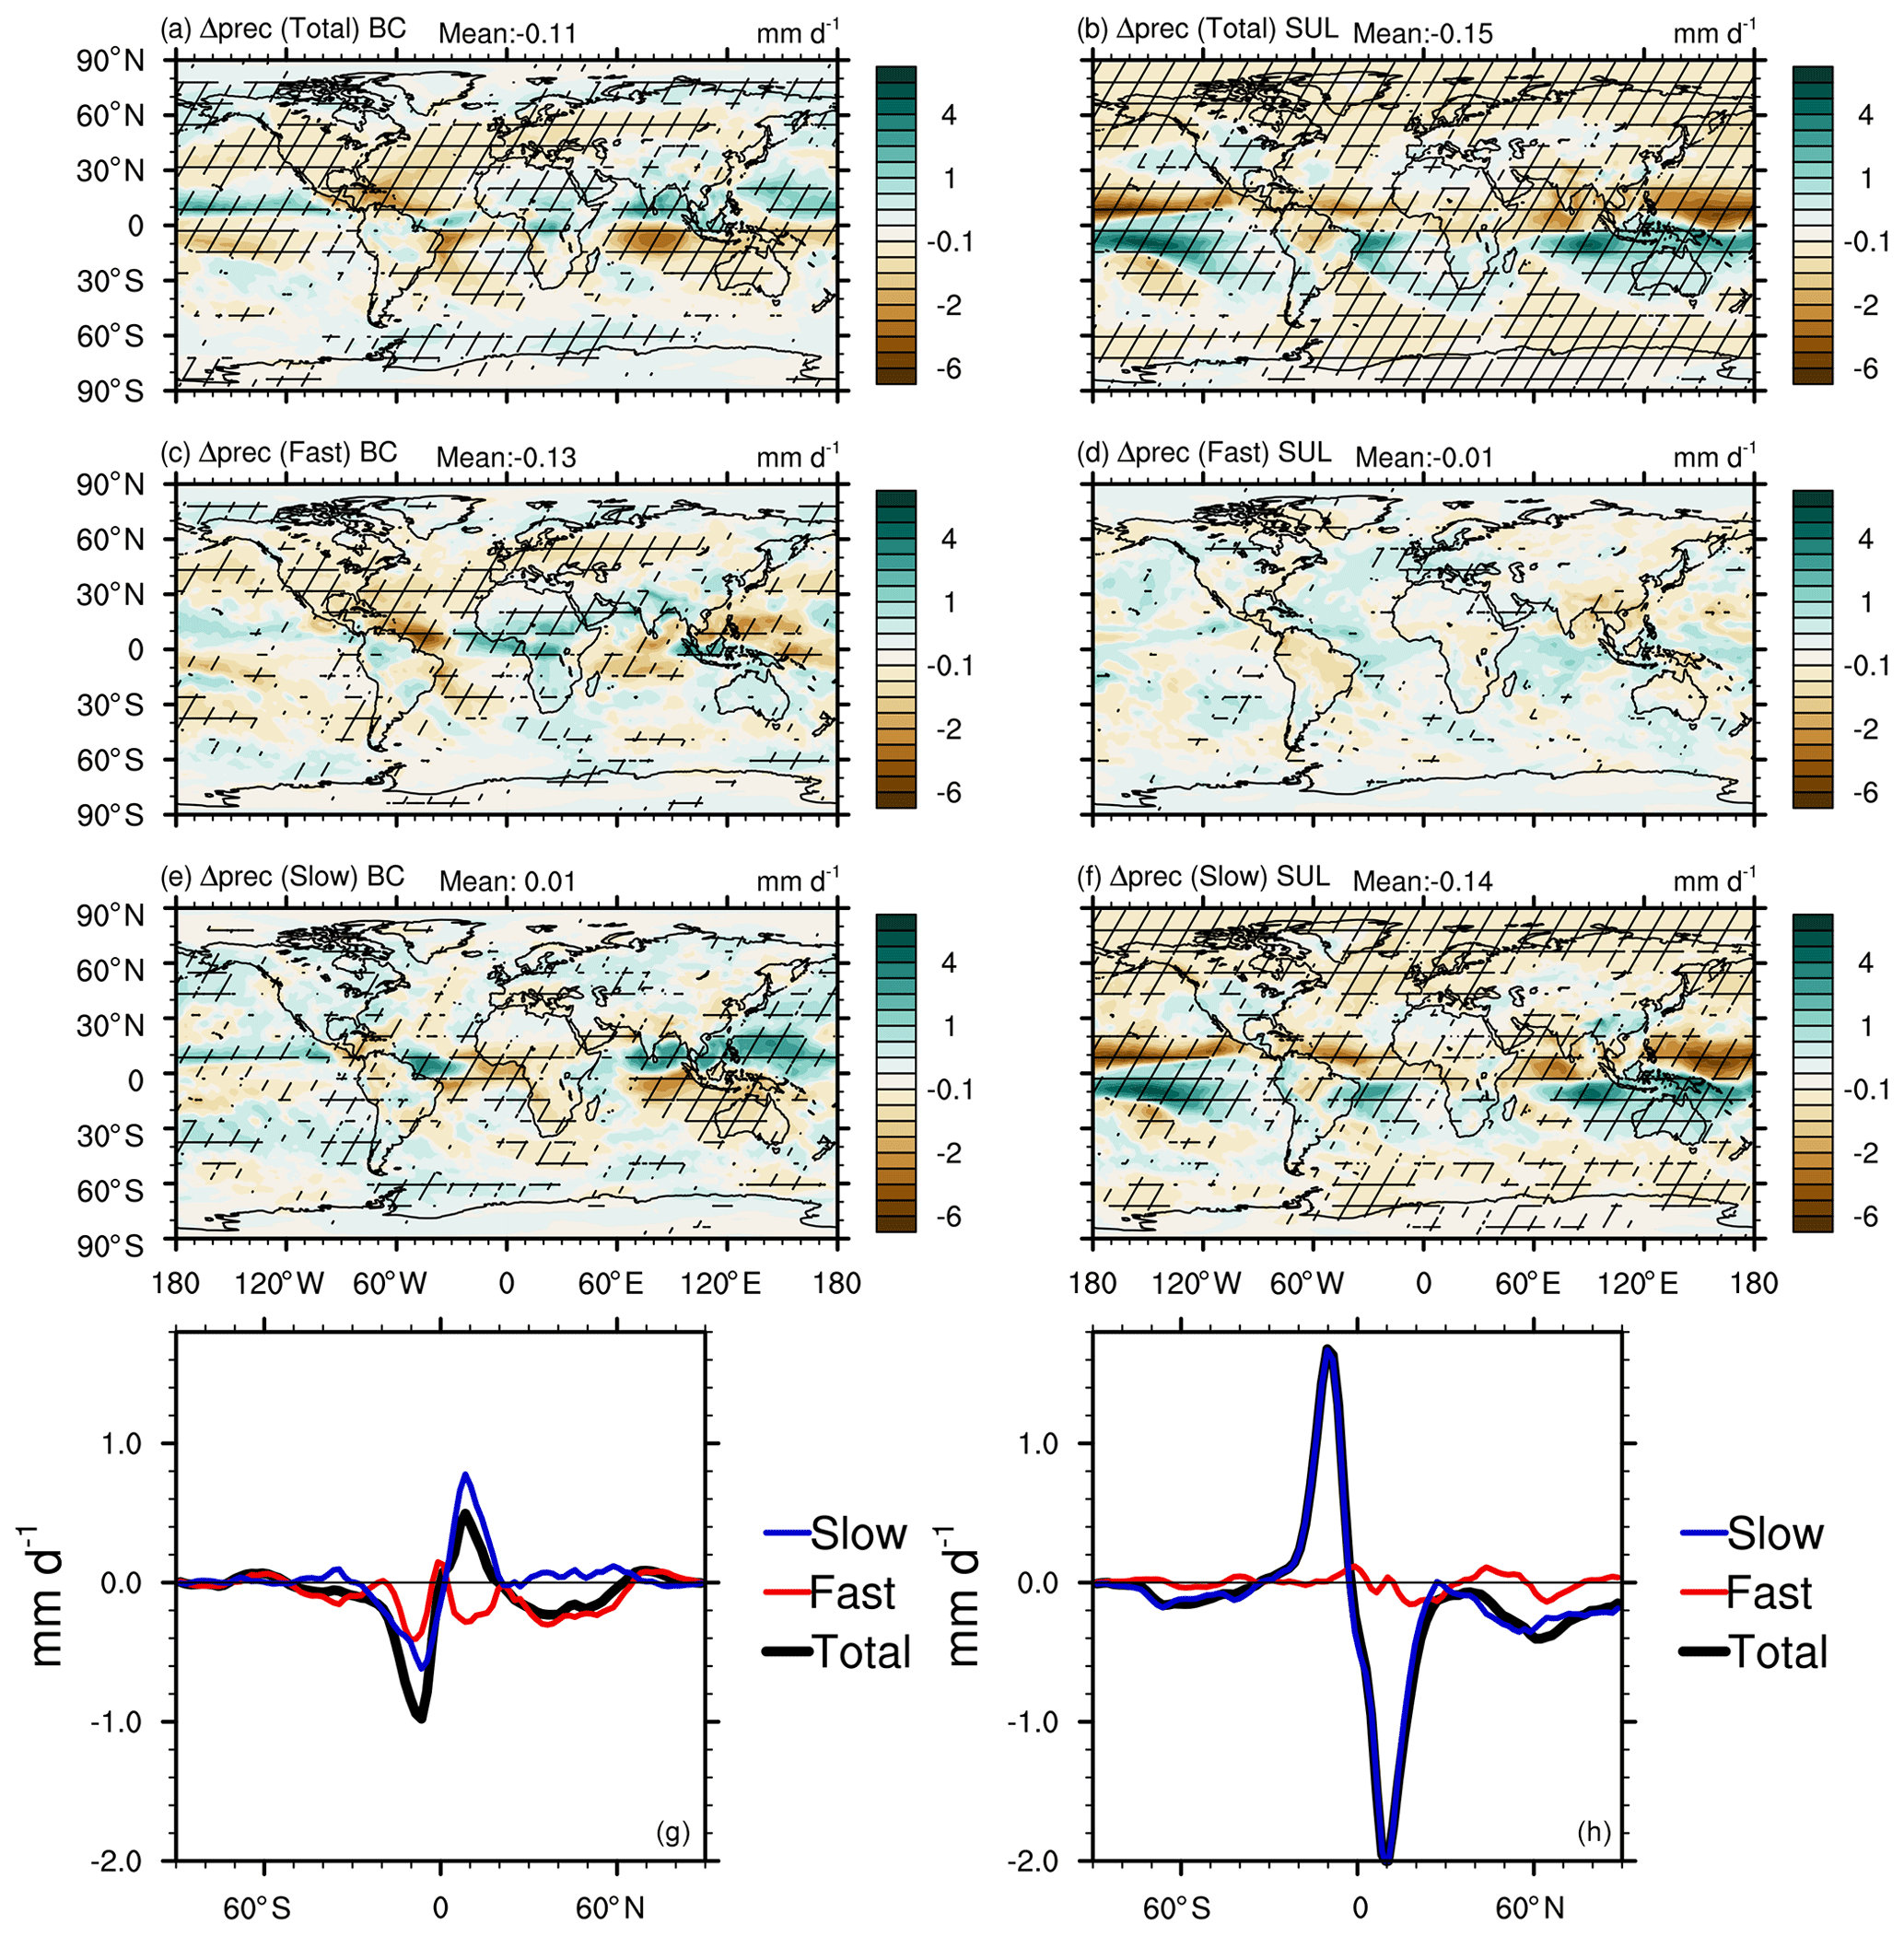
Figure 1ECHAM6–HAM2 simulated geographical patterns of multi-annual mean precipitation change in response to 10-fold increased (a, c, e) BC emissions and (b, d, f) 5-fold increased SUL precursor emissions for (a, b) total, (c, d) fast, and (e, f) slow responses. Hatching indicates where the changes are significant (90 % confidence). (g, h) Zonal averages of changes in precipitation in terms of total, fast, and slow responses to 10-fold increased (g) BC emission and (h) 5-fold increased SUL emission.
The fast response of precipitation in the BC case (Fig. 1c) shows a land–sea contrast pattern in the tropics, in which rainfall increases in central Africa while it decreases in the surrounding tropical ocean. Central Africa is one of the main source regions of BC emission through biomass burning, and a 10-fold increase in BC emissions makes the burden changes significant (Fig. S1). The pattern of the fast precipitation response in the BC case is similar to the pattern of rapid precipitation response to CO2 shown in Richardson et al. (2016). But the mechanism is not exactly the same. In the CO2 case, even though SST remains unchanged, CO2 can increase land surface temperature, and the land–sea temperature contrast (warmer land and unchanged ocean) leads to a shift of convection to over land (Richardson et al., 2016). For an increase in BC emissions, increased downward LW radiation from the warmer atmosphere is largely counteracted by a reduction of downward SW radiation. As a result, surface temperature is decreased in central Africa (Fig. S2), which differs from the CO2 case. But increased BC emission can still warm up the lower troposphere and lead to more ascending motions over central Africa (Fig. S3) (Dagan et al., 2019; Roeckner et al., 2006). As for the SUL case, the rapid precipitation response shows an opposite land–sea contrast pattern in the tropics, because SUL cools the land temperature (Fig. 1d) as land surface temperature is not constrained in fSST runs. However, considering SUL does not directly affect the diabatic heating/cooling in the atmosphere, which differs from BC, the changes are small and not statistically significant over most regions. There are still some exceptions. For example, southeast Asia, which has the largest contribution to SUL emission, and SUL impacts on rainfall through cooling of land temperature as well as interactions with are monsoon (e.g. Wang et al., 2019). Decreased surface temperature over continents, such as South America, leads to a decrease in precipitation in most land regions as well as an increase in surrounding oceans (i.e. southeast Pacific Ocean) (Fig. 1d).
In the zonal mean, precipitation is decreased over northern hemispheric mid-latitudes in both BC and SUL cases for total responses, but different processes contribute to the total response. Most of the precipitation changes over high latitudes are contributed by fast responses in the BC case (Fig. 1g) and slow responses in the SUL case (Fig. 1h). Dagan et al. (2019) showed different responses of rainfall to aerosol perturbation in the tropics and extra-tropics. They demonstrated that precipitation responses are more correlated with the energy transport term (H) in the tropics where heating anomalies can be compensated for by large-scale thermally driven circulations, whereas extra-tropical rainfall responses are constrained by radiative cooling in the extra-tropics due to the stronger Coriolis force (thus weak energy transport). The different contribution from fast and slow processes between the BC and SUL case indicates different responses in the diabatic cooling in the extra-tropics, and this will be addressed in Figs. 3 and 4 from an energetic perspective.
Figure 2 quantifies how fast and slow responses contribute to total responses of precipitation on regional scales. We used the response ratio which has also been used in Samset et al. (2016), as follows:
If Rresp is larger than 0 and close to 1, it means most of the total responses are contributed by fast responses. If Rresp is less than 0 and close to −1, it means slow responses dominate over fast responses. Samset et al. (2016) showed continentally based results of Rresp for different climate forcers and found the variabilities among models. Here Fig. 2 focuses only on BC and SUL perturbations and quantitatively gives us the geographical patterns of contributions from fast and slow responses to total precipitation change. For the BC case, generally the response over northern hemispheric mid-latitudes is consistent with the globally averaged result shown in Table 1, which shows that the precipitation change is dominated by fast responses (Fig. 2a). It can be seen from Fig. 2a that a significant contribution is from fast response over North America, the northern Atlantic Ocean, Europe, most regions in China, and northeastern Pacifica Ocean. However, as for the changes in tropical rainfall, which is associated with the ITCZ shift seen in the total response, slow responses mainly contribute to the northward shift of ITCZ rather than fast responses in the BC case. One exception is central Africa, where the precipitation changes are still dominated by fast responses, and this will be further examined later. For the SUL case, it has been shown that total responses are dominated by slow responses, both globally and regionally (Fig. 2b). Some exceptions are some land regions such as America, China, and the Sahel, where the precipitation change is mostly not significant in total responses.
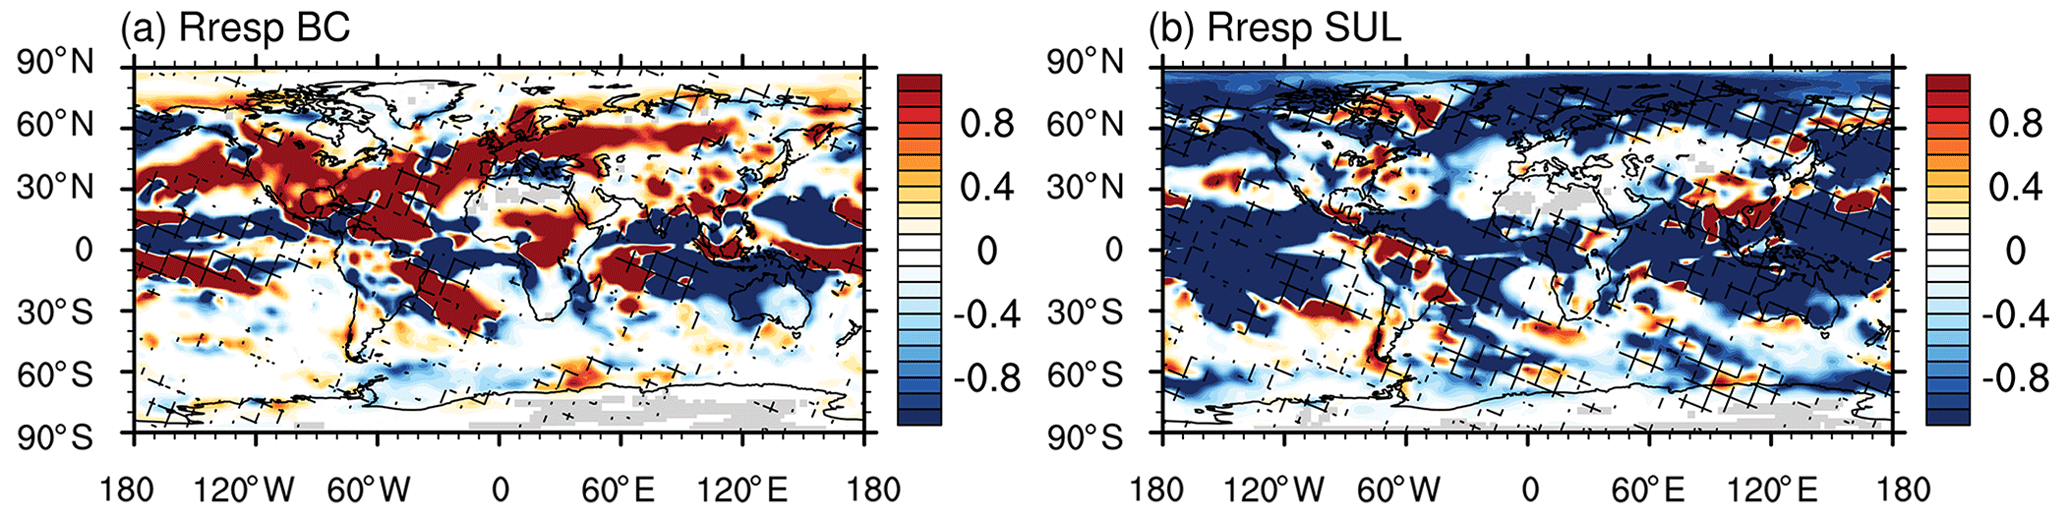
Figure 2Response ratio of fast and slow responses (Rresp) (red denotes fast responses dominate the total responses and blue indicates slow responses dominate) for (a) BC cases and (b) SUL cases. Results have been normalised by total responses of precipitation. Hatching indicates the signs of fast and slow responses are same. If Rresp is around 0, contributions from fast and slow responses are similar. If Rresp is larger than 0, the total response is dominated by fast responses. If Rresp is less than 0, the total response is dominated by slow responses.
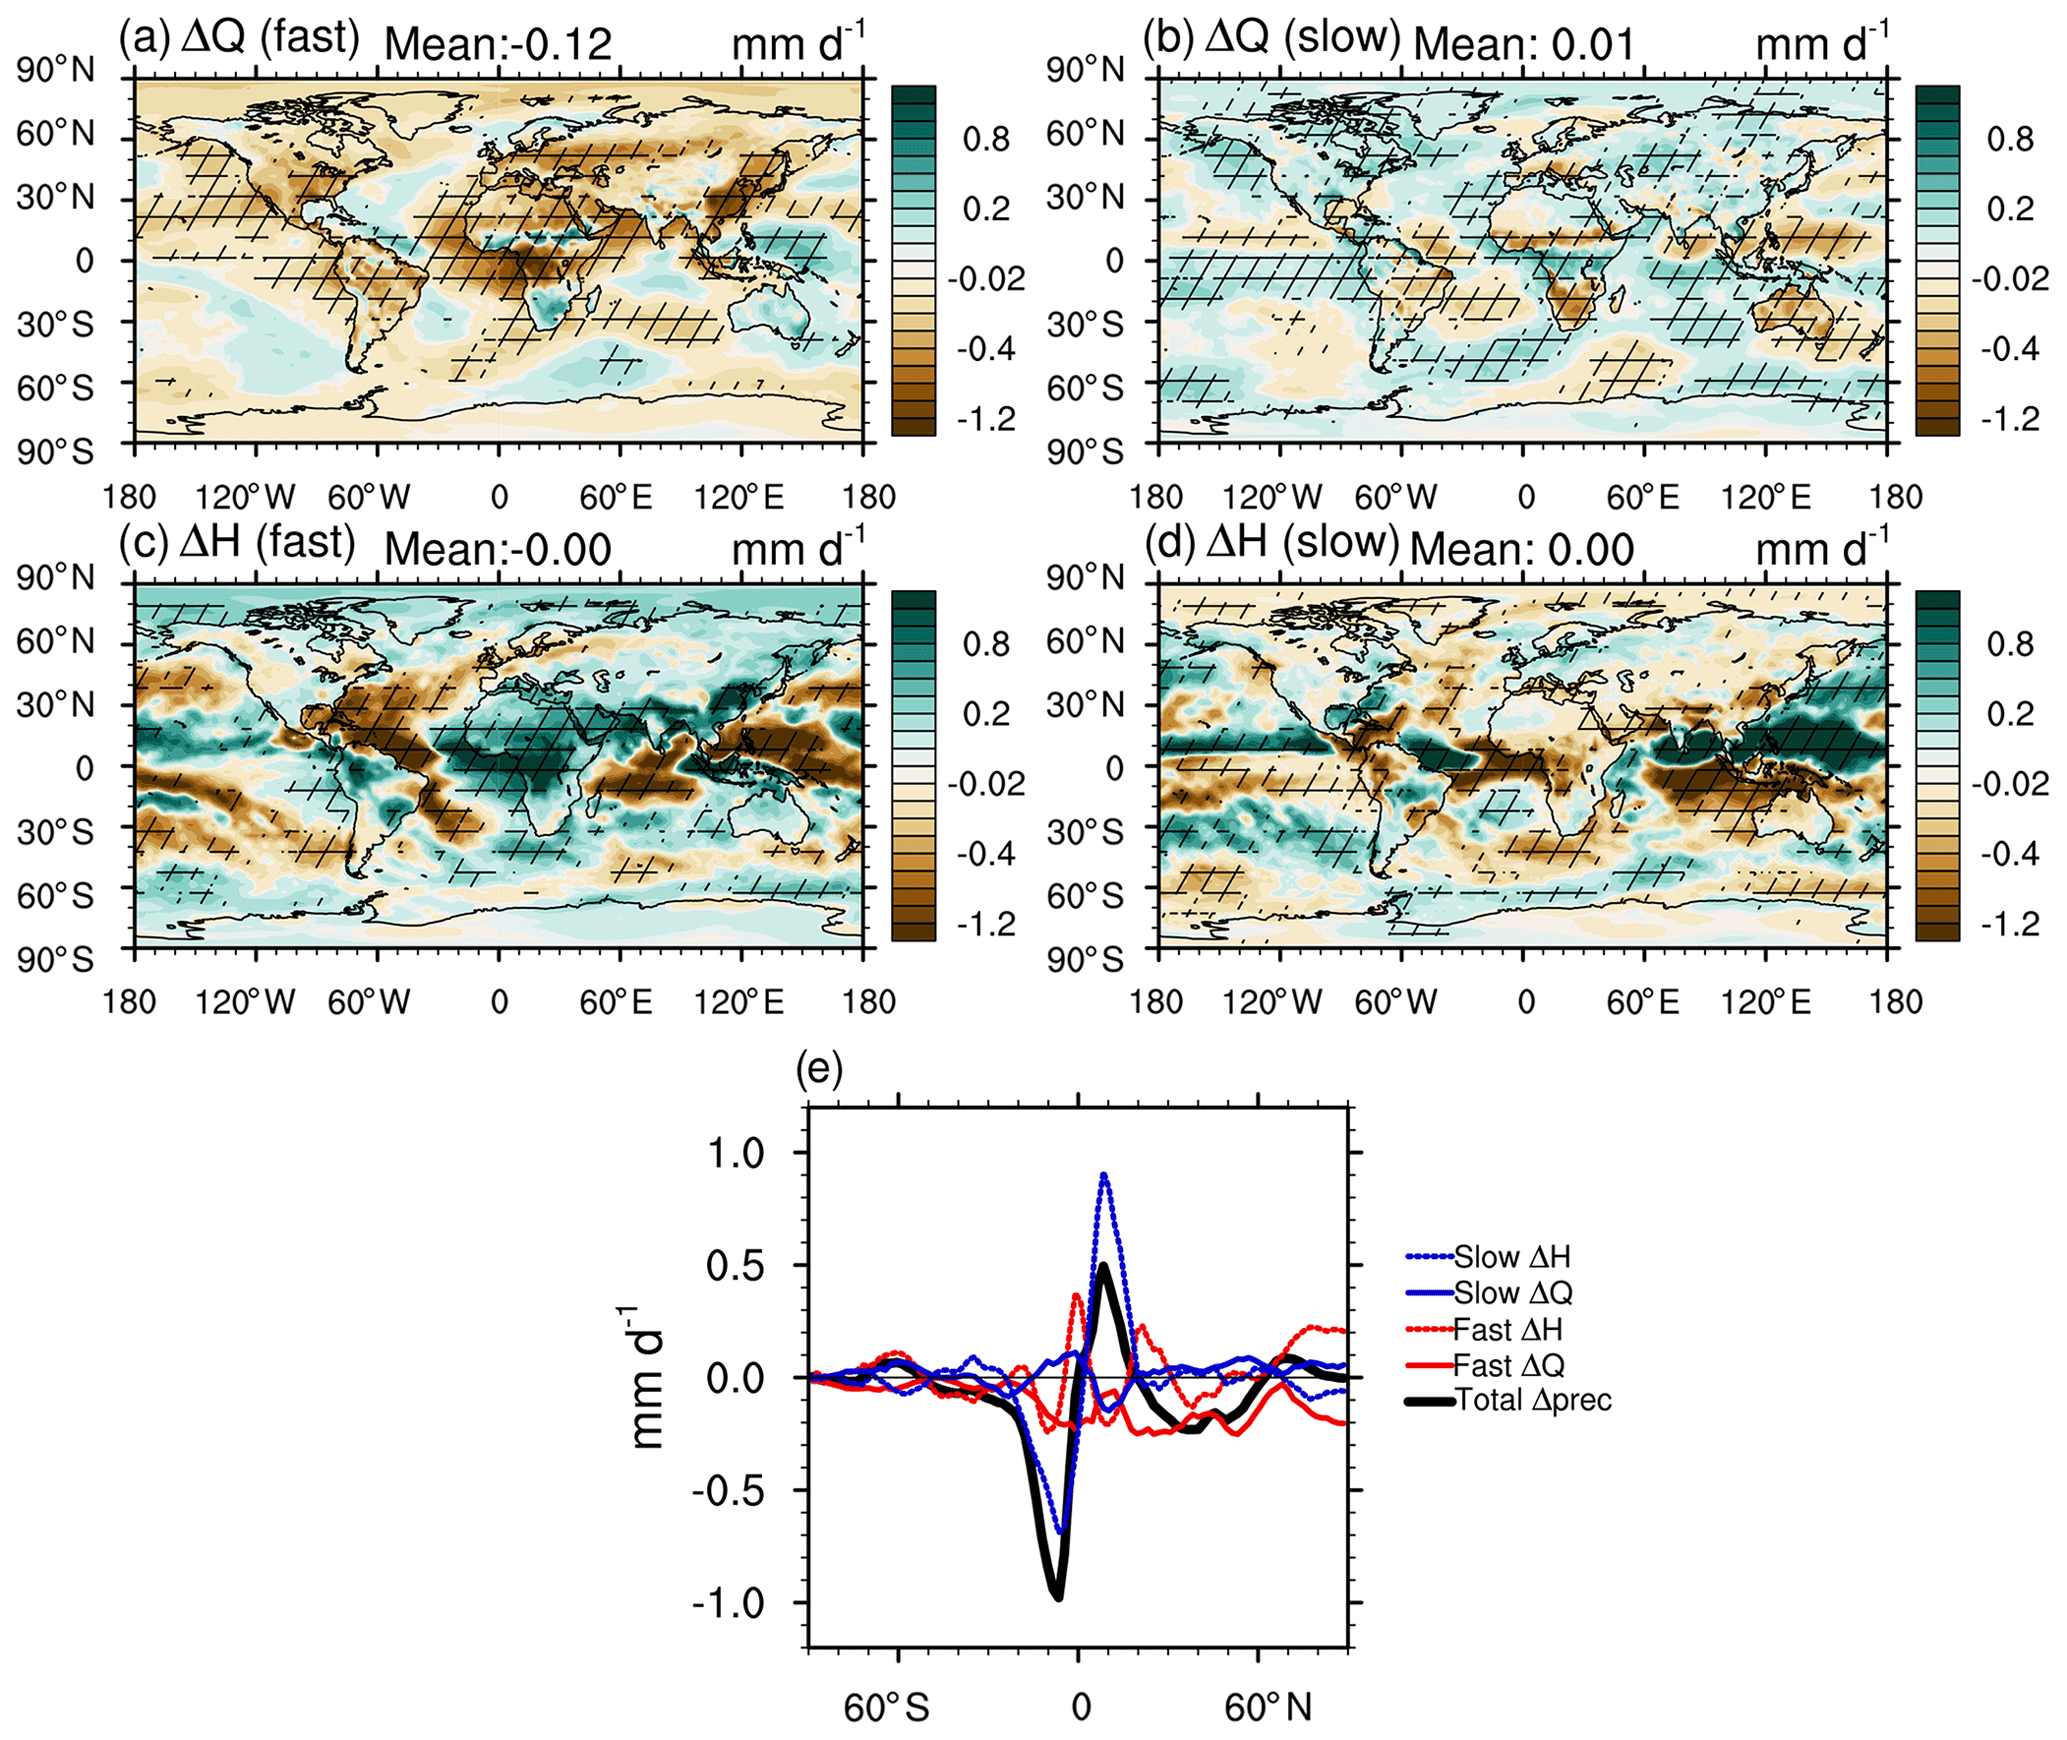
Figure 3ECHAM6–HAM2 simulated geographical patterns of multi-annual mean changes in (a, b) atmospheric diabatic cooling (ΔQ) and (c, d) dry static energy flux divergence (ΔH) for (a, c) fast responses and (b, d) slow responses to 10-fold increased BC emission. Hatching indicates where the changes are significant (90 % confidence interval through bootstrapping methods). (e) The zonal mean of total precipitation response and its decompositions, including fast and slow responses of diabatic cooling and dry static energy flux divergence. All of them are shown in equivalent precipitation units of mm d−1.

Figure 4ECHAM6–HAM2 simulated geographical patterns of multi-annual mean changes in (a, b) atmospheric diabatic cooling and (c, d) dry static energy flux divergence for (a, c) fast responses and (b, d) slow responses to 5-fold increased SUL emission. Hatching indicates where the changes are significant (90 % confidence interval through bootstrapping methods). (e) The zonal mean of total precipitation response and its decompositions, including fast and slow responses of diabatic cooling and dry static energy flux divergence. All of them are shown in equivalent precipitation units of mm d−1.
3.3 Changes in energy budget terms
To explain the different mechanisms between BC and SUL in terms of the contribution from fast and slow responses in more detail, we examine the changes in each energy budget term from Eq. (1).
For the BC case, in fast responses, most decreases in Q are located over the main BC source regions such as central Africa and northeast China (Figs. 3a and S1). For zonal-mean results, after decomposing δQ into different terms based on Eqs. (3) and (5), it shows aerosol SW absorption is the major contributor to changes in Q (Fig. 5a). Since BC is a strongly absorbing aerosol, and the effect is near instantaneous, the changes of Q lead to decreased precipitation on global- and zonal-mean scales and happen through fast responses (Table 1 and Fig. 5a). The zonal-mean plot (Fig. 3e) shows that fast responses of δQ caused by aerosol absorption (Fig. 5a) lead to reduced rainfall, especially over northern hemispheric mid-latitudes (red solid line in Fig. 3e).
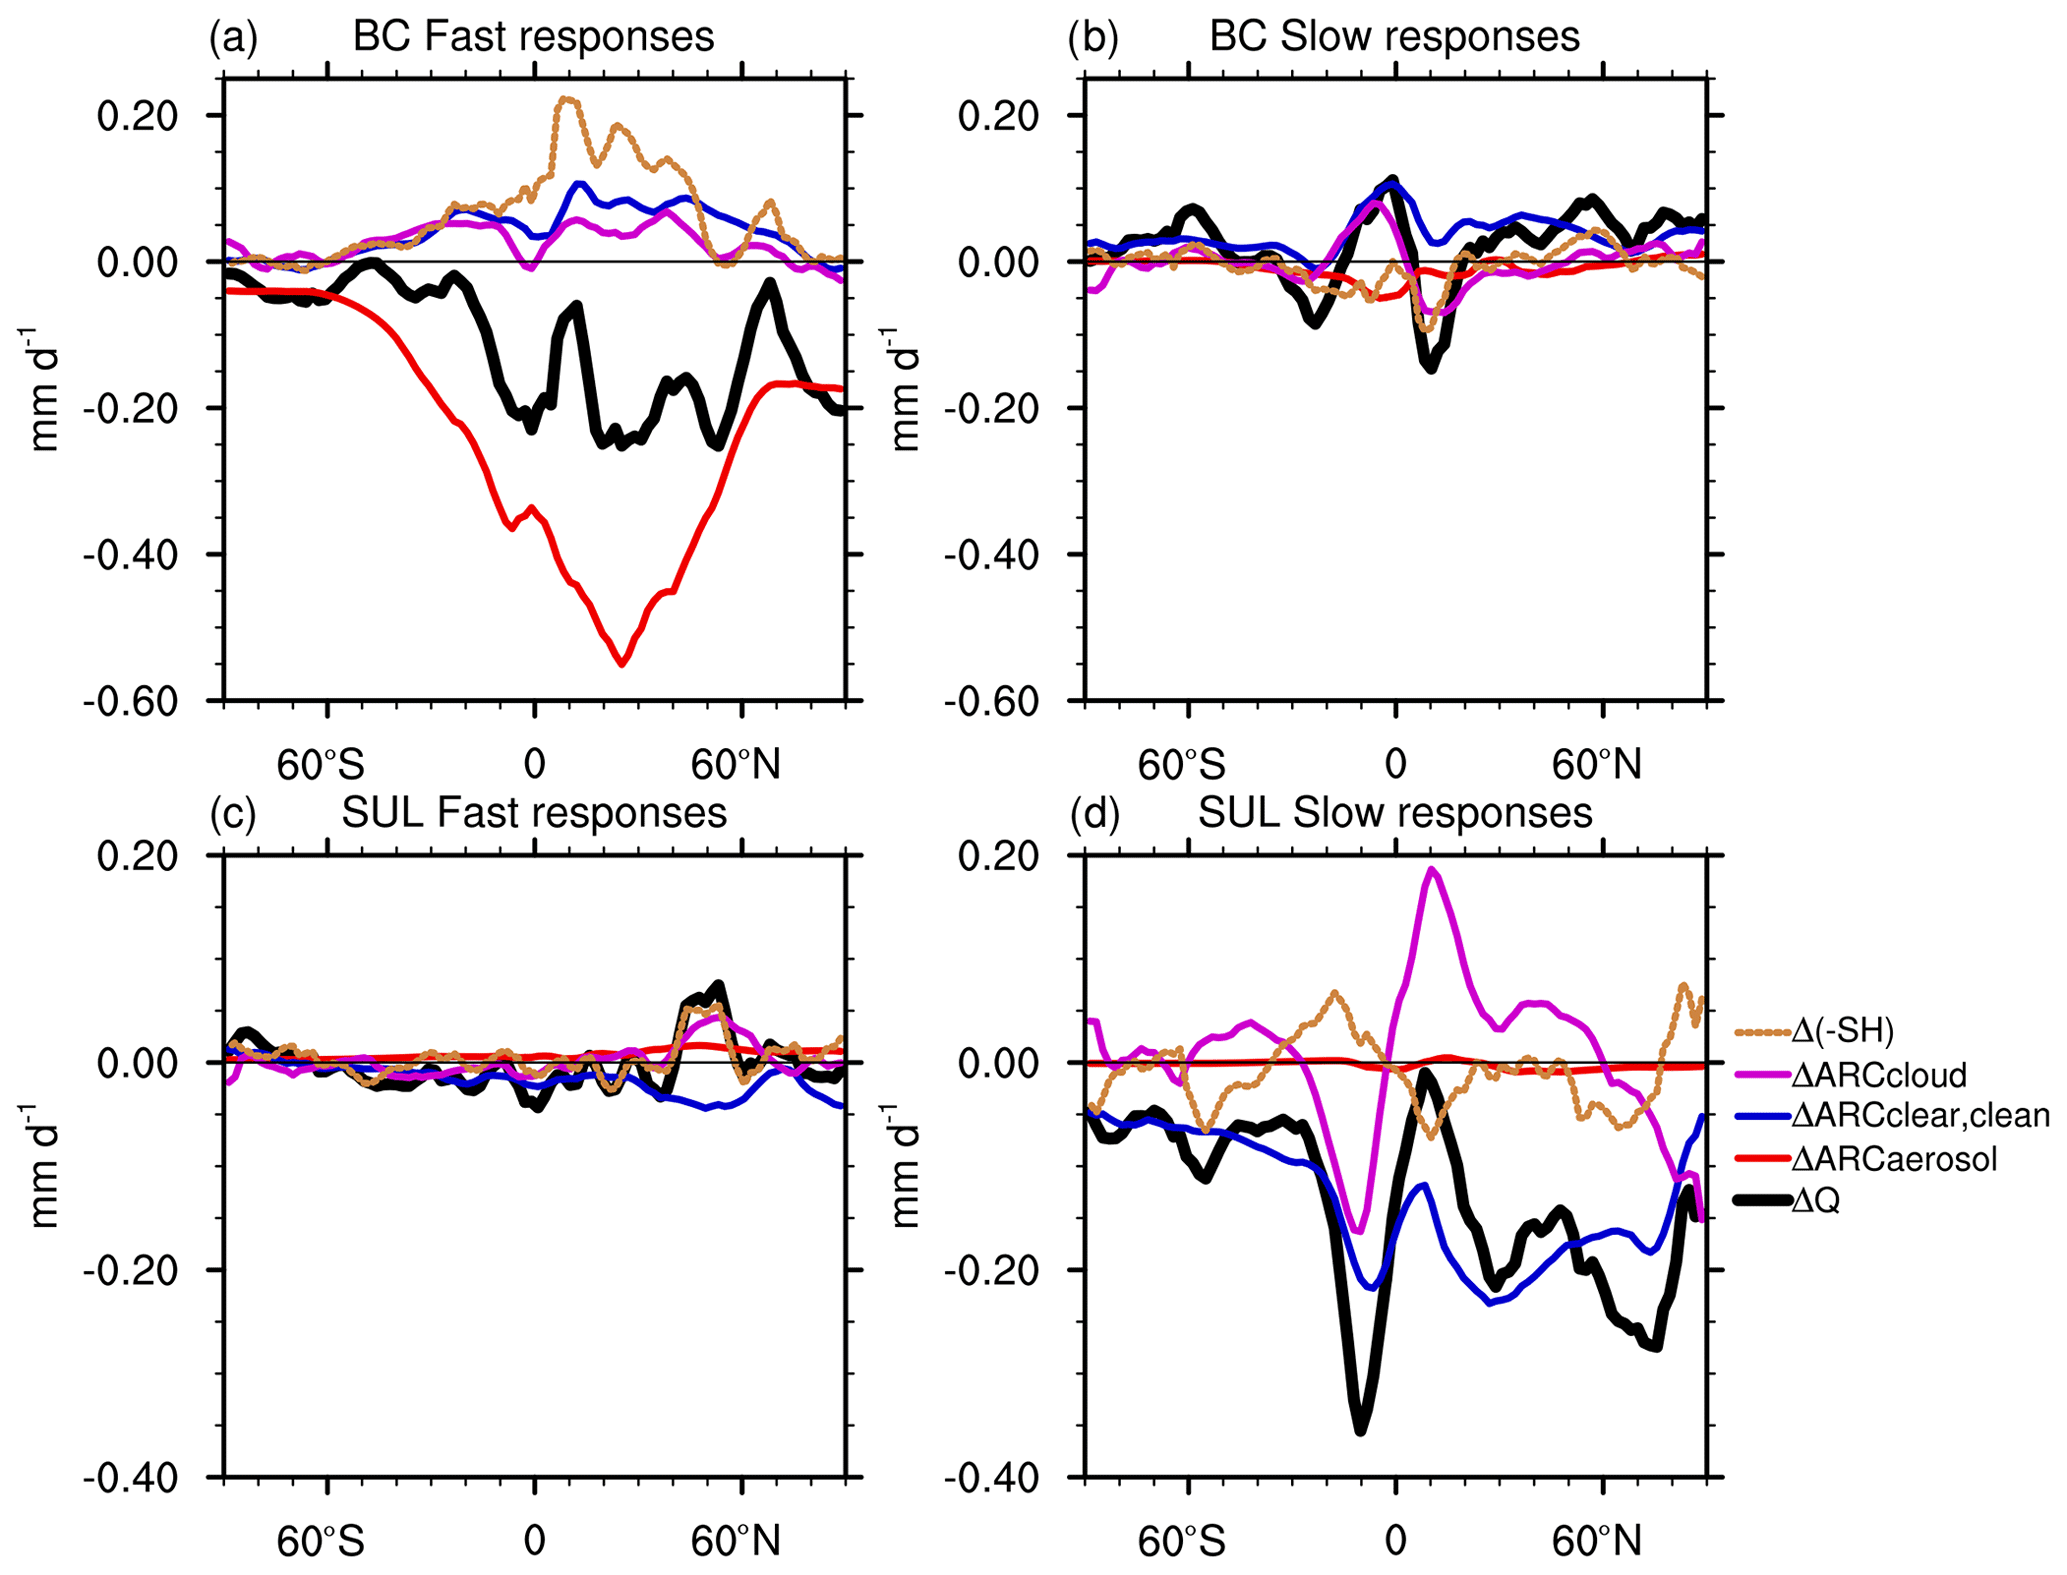
Figure 5ECHAM6–HAM2 simulated multi-annual zonal mean of decomposed changes in atmospheric diabatic cooling (ΔQ), including ARC changes from aerosols (ΔARCaerosol), clouds (ΔARCcloud), clear–clean sky (ΔARCclear,clean), and downward sensible heat flux (Δ(−SH)) for (a) fast responses in the BC case, (b) slow responses in the BC case, (c) fast responses in the SUL case, and (d) slow responses in the SUL case. All items are shown in equivalent precipitation units of mm d−1.
However, on regional scales, the energy transport term plays an important role. The geographical pattern of fast precipitation changes (Fig. 1c) is more similar to the fast response of δH (Fig. 3c) (spatial correlation ∼0.9) than δQ (spatial correlation ). The spatial pattern of fast δH (Fig. 3c) also shows a land–sea contrast in the tropics as in the precipitation change distribution (Fig. 1c), and this is most prominent in central Africa and the middle Atlantic Ocean. There is a significant increase in rainfall over central Africa and decrease over the middle Atlantic Ocean (Fig. 1a). This is mostly contributed by fast responses (Figs. 1c and 2a). As mentioned, this pattern is similar to the case of CO2 shown in Richardson et al. (2016). Although BC decreased surface temperature in central Africa through fast responses (Fig. S2), BC can still warm up the lower troposphere in central Africa, which results in a thermally driven circulation which favours more convections there. This is evidenced by Fig. 3c, which shows the dry static energy flux flow from central Africa to the middle Atlantic Ocean (Fig. 3c). Dagan et al. (2019) performed an idealised experiment by adding an absorbing plume in the tropics, and they found a very similar standing wave pattern of precipitation as a response. Examining δH shows that this is caused by a thermally driven circulation, which favours more convections over central Africa. Positive δH is consistent with more ascending motions in central Africa (Fig. S3). BC warms up the lower troposphere in central Africa, which results in more ascending motions (Fig. S3) and the dry static energy flux flow from central Africa to the middle Atlantic Ocean (Fig. 3c).
The slow response of δQ leads to a global increase in precipitation (Fig. 3b), but the magnitude is an order of magnitude less than the fast response in δQ. This increased precipitation in the slow response is caused by the associated increase in global temperature (Fig. 6c) (Table 1). From an energetic perspective, it is mainly associated with the clear–clean-sky LW cooling (ARCclear,clean) (Table 1 and Fig. 5b) as a result of increased atmospheric column temperature (Planck feedback). As precipitation responses in the extra-tropics are more correlated with δQ , larger fast responses of Q explain why rainfall responses in extra-tropics are dominated by the fast response in the BC case (Fig. 2a). Figure 3e shows that the ITCZ shift seen in total responses is strongly correlated with slow responses of δH. The warmer Northern Hemisphere caused by an increase in BC leads to a southward cross-equatorial energy flux, which is accompanied by a northward shift of the Hadley cell (Bischoff and Schneider, 2016). Changes in vertical pressure velocity can be found in Fig. 6, which also indicates a northward shift of the ascending branch of the Hadley cell. From an energetic view, the changes in vertical pressure velocity drive the dynamic effect on advection of dry static energy, which is a strong component in the changes of divergence of dry static energy fluxes (δH) in the tropics (Richardson et al., 2016).
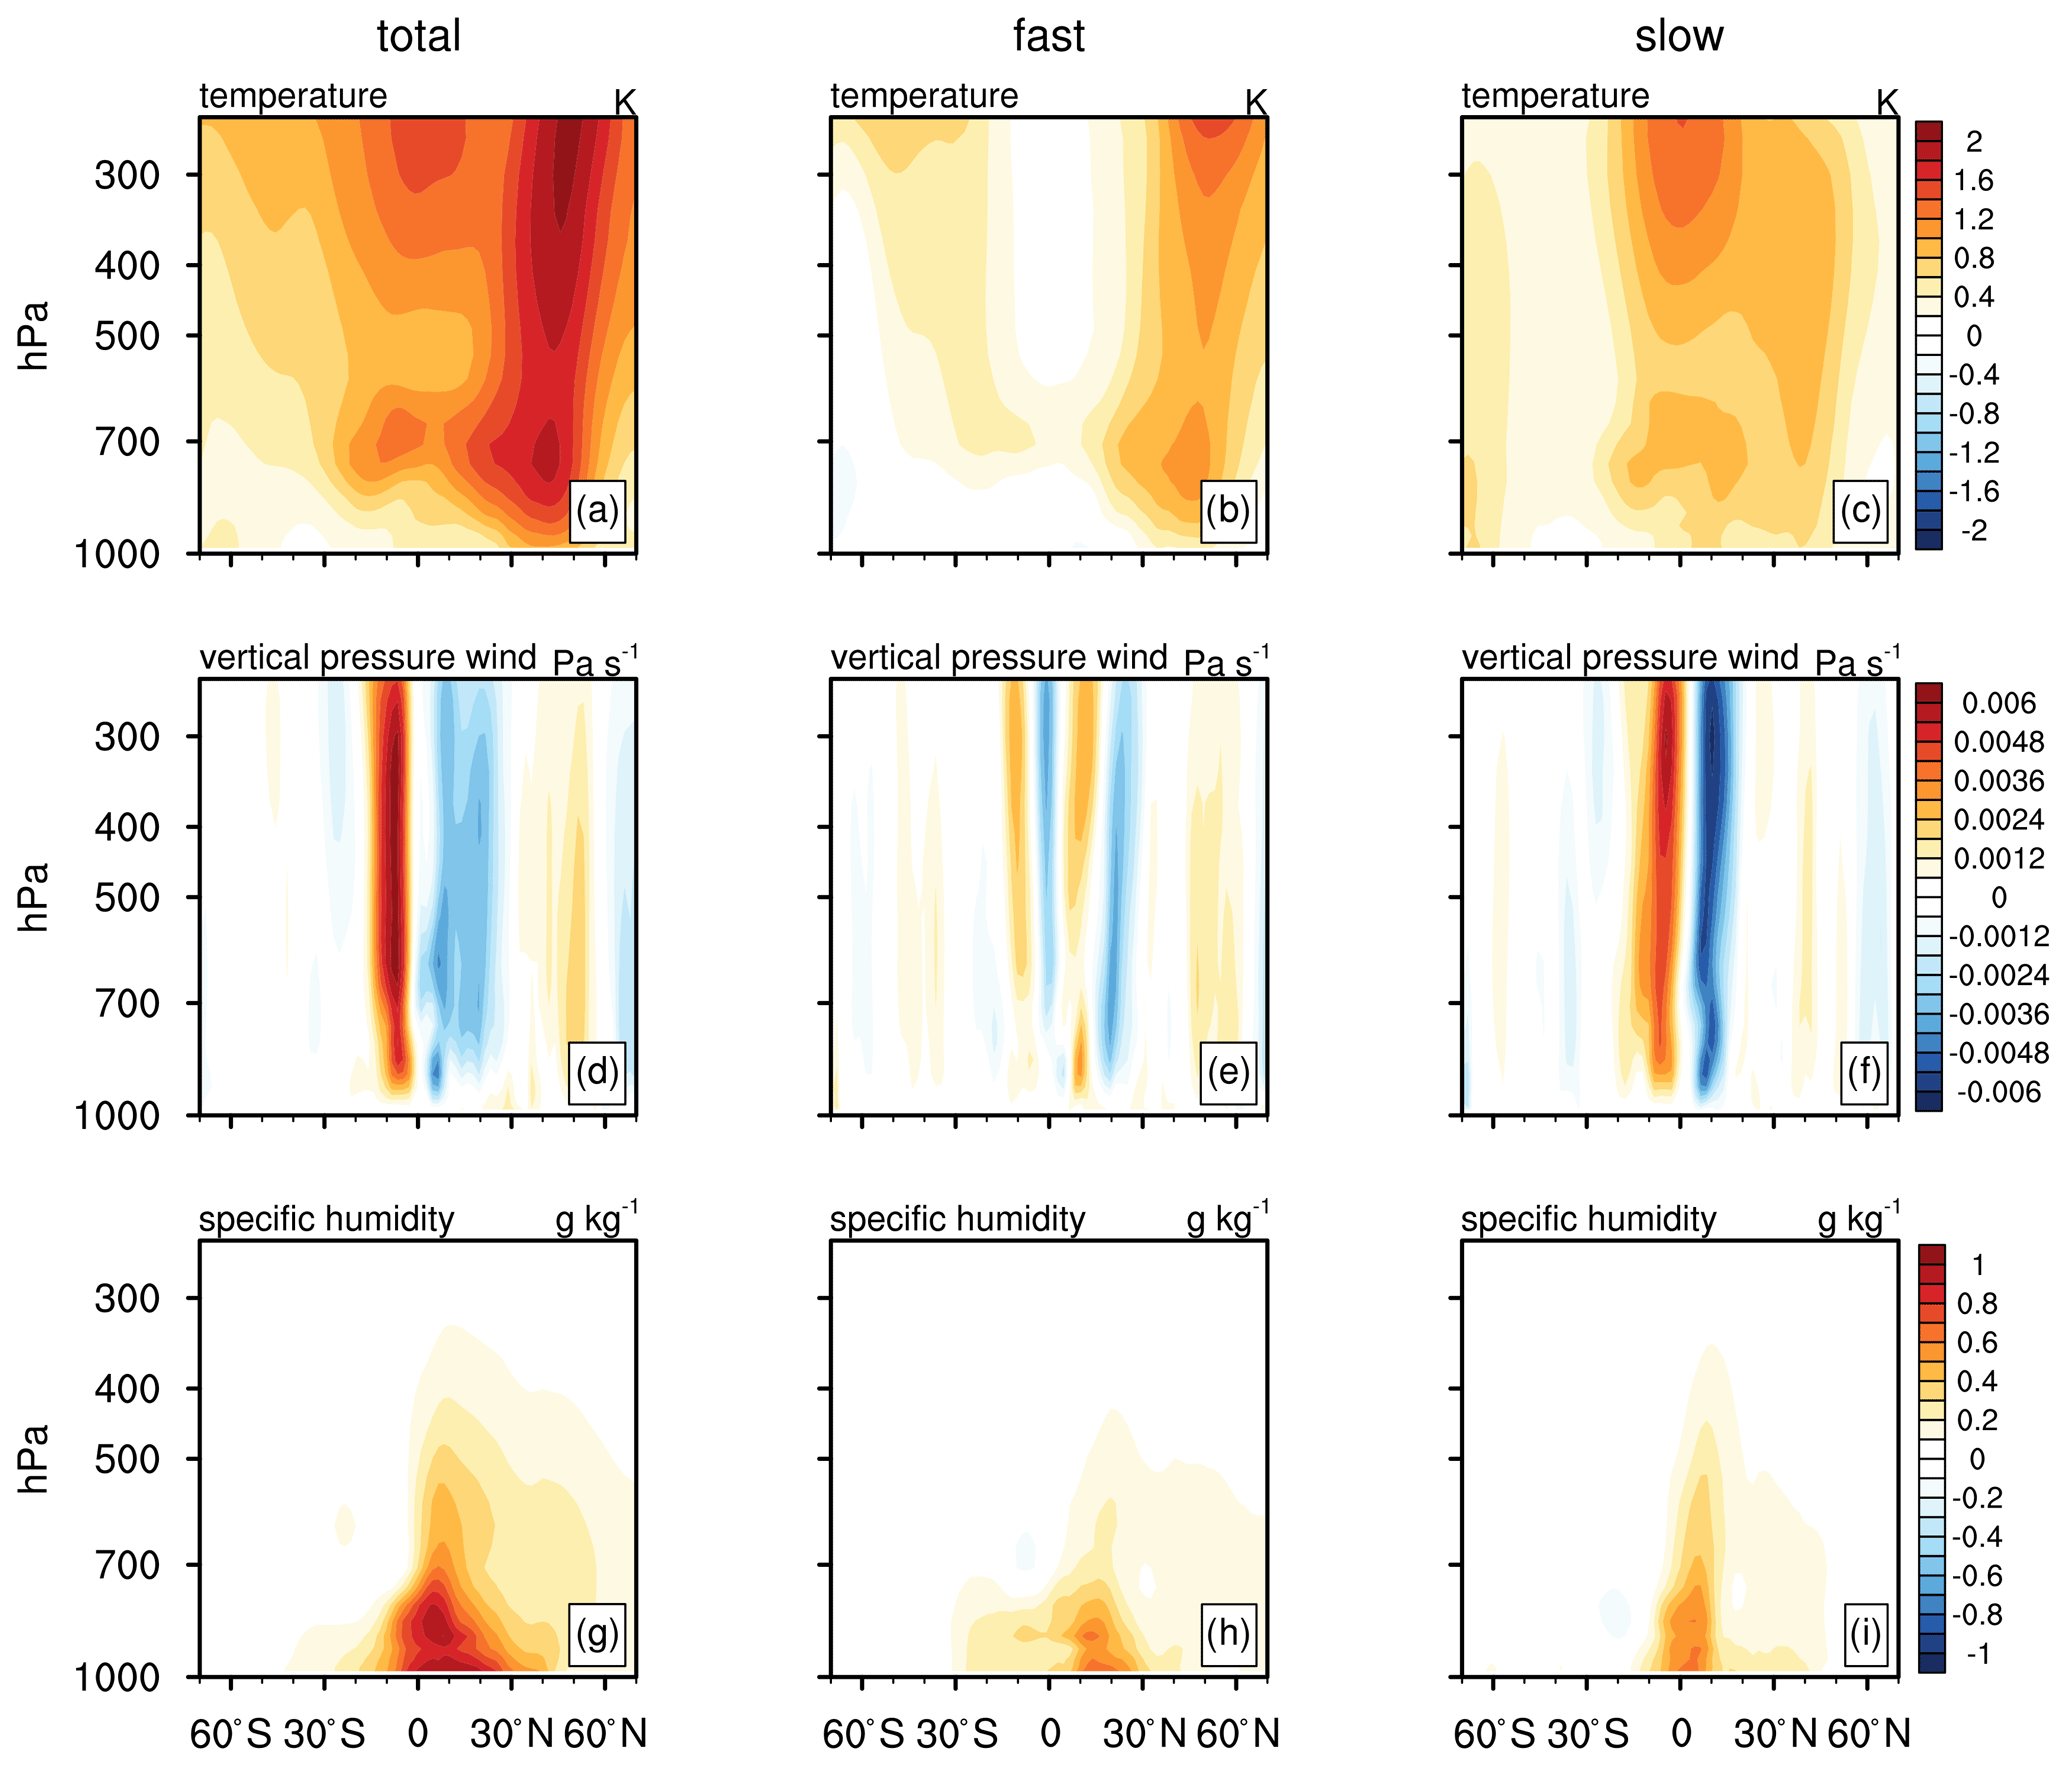
Figure 6ECHAM6–HAM2 simulated multi-annual (a, d, g) total, (b, e, h) fast, and (c, f, i) slow responses of zonally averaged (a–c) temperature, (d–f) vertical pressure velocity, and (g–i) specific humidity in response to 10-fold increased BC emission. Blue colours indicate large-scale ascent, and red colours indicate large-scale descent in (d–f).
For the SUL case, most of the fast responses are not statistically significant (Fig. 4a and c), and total responses are dominated by the slow response. For changes in extra-tropics, changes in Q are correlated with changes in precipitation. SUL decreases the mean-state temperature of the troposphere through slow responses, which leads to a reduction of specific humidity (Fig. 7). From an energetic view, it leads to a decreased clear–clean-sky radiative cooling (ARCclear,clean) (Fig. 5d), which contributes to most of the reduced slow responses of δQ. For changes in the tropics, like the BC case, slow responses of δH are consistent with the southward ITCZ shift in the total response (Fig. 4d). In the extra-tropics, for the SUL case, there is also an interesting land–sea contrast in both fast and slow δH, with dry static energy fluxes generally diverging from oceans to lands in fast δH (Fig. 4c) and converging in slow δH (Fig. 4d). This is because in the fixed SST simulations, land surface temperature is still allowed to decrease in response to increased SUL emission (Fig. S5b in the Supplement) as a result of reduced downward SW radiation. The land–sea contrast of temperature (colder land) results in more downward large-scale motions and divergence of moisture (see Fig. S6 in the Supplement for changes in vertical pressure velocity and column-integrated water vapour) over most land regions, particular Southeast Asia and South America, in fast responses. Since fast responses have already accounted for part of land temperature reduction, ocean surface temperature decreases more than land surface in slow responses (Fig. S2d). The colder ocean temperature therefore leads to an opposite land–sea pattern compared to fast responses (Fig. 4d).
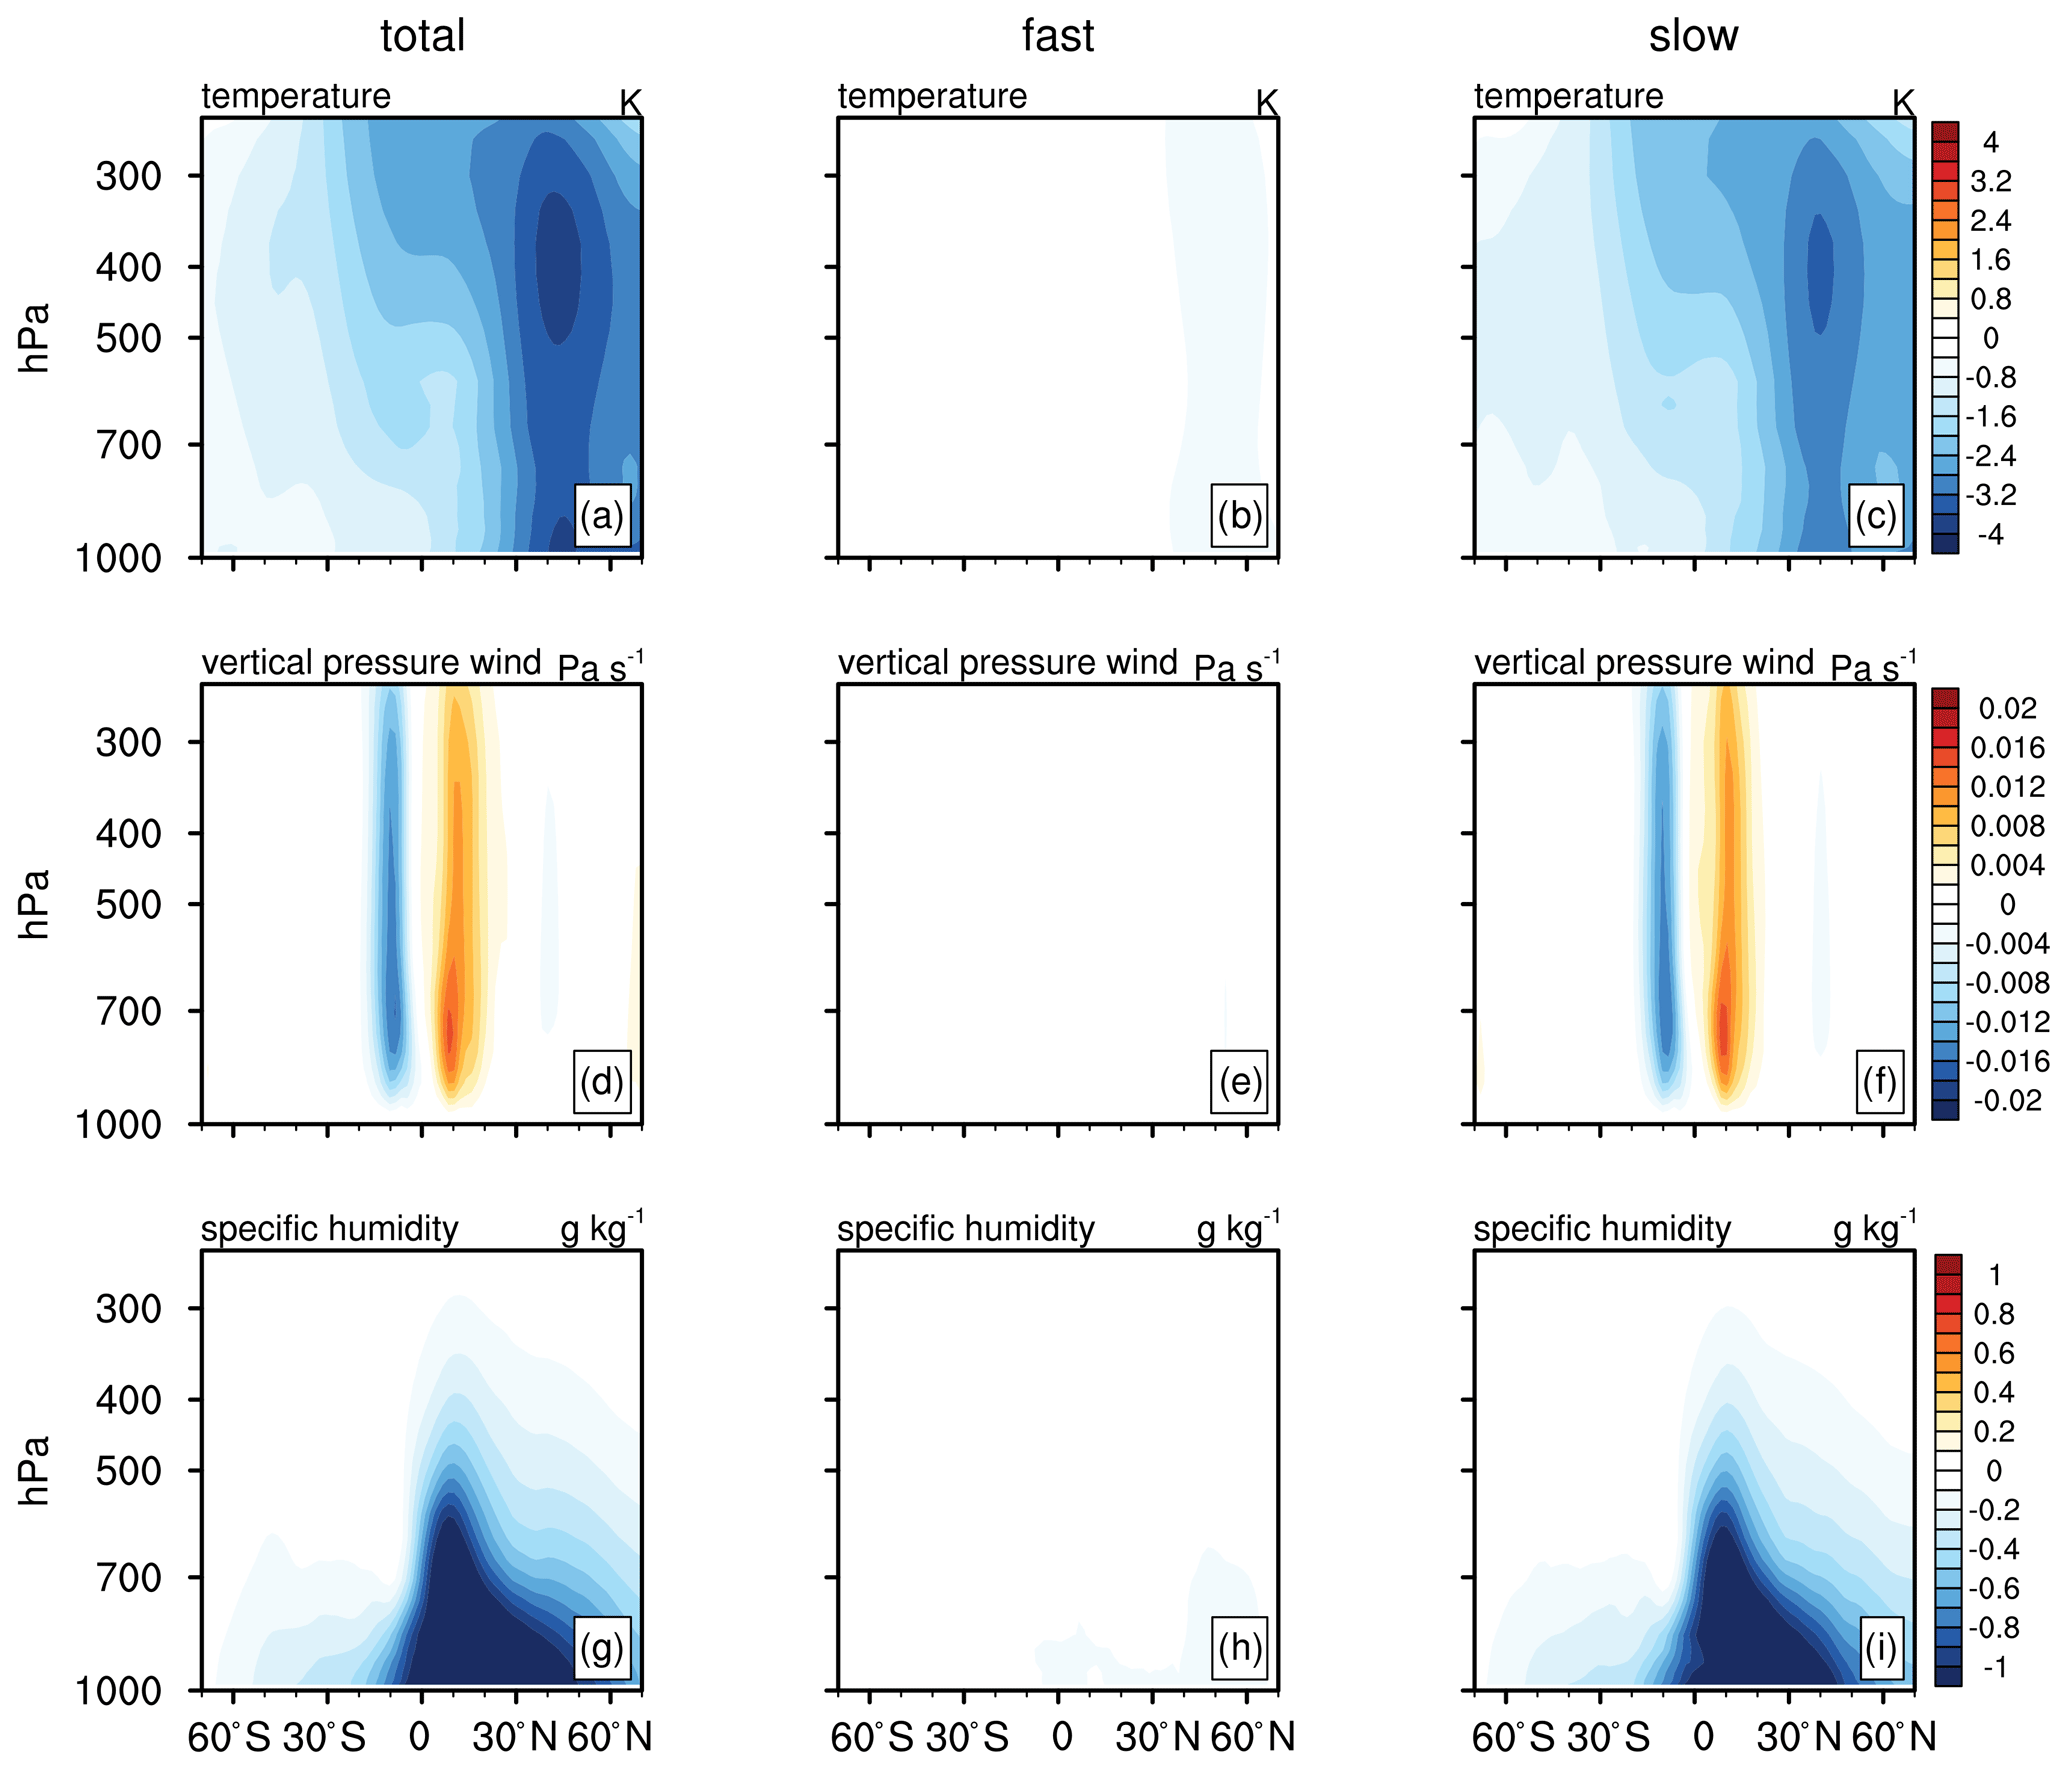
Figure 7ECHAM6–HAM2 simulated multi-annual (a, d, g) total, (b, e, h) fast, and (c, f, i) slow responses of zonally averaged (a–c) temperature, (d–f) vertical pressure velocity, and (g–i) specific humidity in response to 5-fold increased SUL precursor emission. The blue colour indicates large-scale ascent, and the red colour indicates large-scale descent in (d–f).
Changes of Q are more robust in the fast response for the BC case, and the slow response of Q is more robust for the SUL case. Decomposition of diabatic cooling shows its global-mean decrease is dominated by an increase in atmospheric aerosol absorption for fast responses in the BC case (Fig. 5a) and decreased radiative cooling from the clear–clean sky for slow responses in the SUL case (Fig. 5d). The decreased ARCclear,clean values are mainly caused by the decreased atmospheric column temperature (Planck feedback) and associated reduced water vapour content (controlled by the Clausius–Clapeyron relationship). Sensible heat flux (upward) is also reduced due to the warmer atmosphere caused by absorption from BC (Fig. 5a).
It should also be noted that changes in diabatic cooling counteract the latent heat released from precipitation associated with the ITCZ shift in both cases (Figs. 3b and 4b). This is mainly caused by ARCclouds, as it contributes a large part of diabatic cooling over tropical regions (Fig. 5b and d). This counteraction with the ITCZ shift is caused by the associated change of deep convective clouds (see Supplement for changes in cloud properties). This is consistent with the results shown in Naegele and Randall (2019). They found a negative correlation between tropical rainfall and diabatic cooling and demonstrated this is caused by feedbacks from deep convective clouds. More high clouds lead to a decrease in atmospheric LW radiative cooling but an increase in precipitation, and the negative correlation is robust over tropical regions where deep convective clouds prevail (Naegele and Randall, 2019). The spatial patterns of fast, slow, and total responses to ΔARCaerosol, ΔARCcloud, and ΔARCclear,clean can be found in the Supplement.
3.4 Responses of large-scale circulation and local thermodynamic conditions
Figures 3e and 4e show that changes in tropical rainfall are strongly associated with slow responses of the energy transport term, independent of aerosol types (absorbing or non-absorbing), whereas changes in mid-latitude precipitation are dependent on aerosol types, which are dominated by fast responses of aerosol SW absorption in the BC case and slow responses of clear–clean-sky radiative cooling in the SUL case. To help understand the mechanisms of the tropospheric response in different regions, we study the response of the large-scale circulation and thermodynamic conditions, by examining the changes in vertical pressure velocity (ω), temperature T, and specific humidity q (Figs. 6 and 7). The vertical pressure velocity (ω) at 500 hPa is a useful method to distinguish different cloud dynamic regimes and a metric to quantify the strength of large-scale circulation (Bony and Dufresne, 2005; Zhang et al., 2016). Here we only show zonal-mean analysis.
As shown in Fig. 6, BC warms up the atmosphere through SW absorption, and the warming is confined mainly in the Northern Hemisphere (NH) where the BC emissions prevail. This leads to southward cross-equatorial energy fluxes and a northward shift of the Hadley cell (Wang, 2009; Bischoff and Schneider, 2016; Zhao and Suzuki, 2019). The changes in ω demonstrate the northward shift of the ascending branch of the Hadley cell, which show an increased upward motion in NH tropics and decreased ascending motion in SH tropics (Fig. 6d). Therefore, the tropical rainfall associated with ITCZ changes in response to the changes of large circulation. Figure 6f further demonstrates that slow responses contribute to most of the changes in tropical large-scale circulations in Fig. 6d. It is consistent with Fig. 3 that changes in tropical latent heat released from precipitation are mostly contributed by δHslow, because the dynamic component associated with changes in vertical velocity dominates the energy transport term over the tropics (Richardson et al., 2016). Outside the tropics, changes in ω are not as significant as in the tropics (Fig. 6d), and zonal-mean rainfall is more related to local changes in thermodynamic conditions. Absorbing aerosols directly heat the mid-troposphere through fast processes (Fig. 6b). Heating the mid-troposphere will stabilise the column and suppress precipitation. This is consistent with the energetic perspective shown in Figs. 3 and 5a that fast responses of radiative cooling caused by BC SW absorption (reduced ARCaerosol) account for the decreased latent heat in extra-tropics. An interesting aspect here is that while BC induces the ITCZ shift, the fast response (Fig. 6e) seems to counteract the stronger slow response shown in Fig. 6f. This is because of the strong non-zonal effect from central Africa (see geographical pattern of vertical pressure velocity changes in the Supplement), where BC warms up the lower troposphere, resulting in more ascending motions in fast responses (Fig. S6). It is also consistent with Fig. 1g that fast responses of rainfall in the southern tropical branch act to enhance ITCZ while only the northern branch acts to decrease ITCZ.
For the SUL case, the tropical rainfall response is opposite to that in the BC case, but the mechanism is similar. Increasing sulfate aerosols induces a dimming effect and causes a negative radiative forcing at the surface, which is a fast process. Subsequently, global surface temperatures are decreased, a slow process controlled by ocean heat capacity, and this cooling is more significant in the NH (Fig. 7a and c). As a result, the northward cross-equatorial energy fluxes lead to a southward shift of the Hadley cell (Fig. 7d). The slow responses of the large-scale circulation (caused by SST difference between hemispheres) contribute most of the shift of Hadley cell (Fig. 7e). In the extra-tropics, a decrease in precipitation is also found in response to changes in thermodynamics. However, unlike black carbon, SUL decreases surface temperature through slow processes and leads to a cooling of the whole column in the extra-tropics (Fig. 7a and c). As a result, the specific humidity shows a large reduction (Fig. 7i), which is associated with a reduction of rainfall in the extra-tropics. This is consistent with the energetic perspective shown in Figs. 4 and 5d that reduced clear–clean-sky radiative cooling (ARCclear,clean) accounts for the decreased latent heat in extra-tropics.
It is worth mentioning that Figs. 6 and 7, as a bottom-up method, qualitatively show how the changes in large-scale circulation and local thermodynamics affect rainfall in terms of total, fast, and slow responses, whereas the energy budget view (Figs. 3, 4, and 5), as a top-down method, more easily quantifies these contributions through energetic terms (e.g. the energy transport term, ARCaerosol, and ARCclear,clean). Combining these two methods makes the link between precipitation and aerosols explicit.
We have examined the response of precipitation to absorbing and non-absorbing aerosol perturbations by separately increasing BC emission and SUL emission in ECHAM6–HAM2 by 10 times and 5 times their baseline emission, following the PDRMIP protocol (Myhre et al., 2017; Samset et al., 2016). The precipitation response is separated into fast (mediated by near-instantaneous changes in atmospheric radiative cooling) and slow responses (mediated by changes in SST) on both global and regional scales. An energetic perspective has been adopted to study precipitation changes. Global-averaged energetics have previously been used to study precipitation responses (e.g. Ming et al., 2010; some PDRMIP work); here, we further decompose atmospheric heating rates into individual terms separately for fast and slow responses. Changes in atmospheric latent heat release from precipitation are balanced by changes in atmospheric radiative cooling (ARC), surface sensible heat flux, and local energy transport. We introduce a method, based on Ghan (2013), to further decompose ARC into contributions from aerosols (through aerosol direct SW absorption), clouds (through cloud LW absorption/cooling), and clear–clean sky (without aerosols or clouds; mainly though LW radiative absorption/cooling from GHGs, water vapour, i.e. Planck feedback).
While it has long been appreciated that changes in ARC are essential in balancing latent heat released from precipitation on global scales, their relationship on zonal-mean or regional scales has not been fully explored. For global means, although SUL and BC have a different sign of radiative forcing at TOA (Boucher et al., 2013), we found that precipitation is decreased for both cases, which is energetically balanced by reduced atmospheric diabatic cooling δQ (Table 1). This response occurs at different timescales, dominated by fast responses for BC and by slow responses for SUL. For BC, on the global scale, the most significant effect is that absorbing aerosols directly heat the mid-troposphere, stabilise the column, and suppress precipitation. Therefore, most of the changes are due to aerosol absorption (ARCaerosol) from fast responses. Meanwhile BC warms up the lower troposphere and decrease the temperature differences between the surface and near-surface temperature, which results in a decreased upward sensible heat. Investigating the energy balance, we found this decreased upward surface heat flux from the fSST experiment acts to cancel almost one-third of the decreasing effect caused by increased aerosol SW absorption. For SUL, although non-absorbing aerosol does not directly affect ARC through aerosol absorption, the net negative radiative forcing at TOA in fSST experiments and associated surface forcing leads to a decrease in global surface temperature through slow responses. As a result, it cools the whole atmospheric column, accompanied by reduced specific humidity, which leads to reduced precipitation. This can also be seen from the decreased radiative cooling from the clear–clean-sky ARCclear,clean in slow responses.
Zonally averaged patterns of precipitation changes for the BC and SUL cases are different (Fig. 1). Tropical rainfall is primarily associated with ITCZ, which shifts northward for BC and southward for SUL. Extra-tropical rainfall is reduced in both cases. For BC, slow responses account for most of the changes in tropical rainfall, while fast responses dominate changes in other regions (Fig. 2a). BC warms the Northern Hemisphere through slow responses, which leads to a southward energy flux (Bischoff and Schneider, 2016; Rotstayn and Lohmann, 2002). From an energetic perspective, in the tropics where intense convections and large-scale thermally driven circulations prevail, slow responses of the energy transport term dominate the changes in tropical rainfall (Fig. 3e), which is associated with the northward shift of Hadley cells (Fig. 6). Outside the tropics, BC warms up the mid-troposphere, stabilises the atmosphere (Fig. 6), and suppresses precipitation, which is a fast response. Energetically, different from the tropics, BC-induced increased diabatic heating is locally confined due to a stronger Coriolis force. This geostrophic confinement of the diabatic heating associated with increased aerosol shortwave absorption has to be balanced by reduced latent heat from precipitation (a fast response) (Fig. 5a). For the SUL case, the slow response dominates in nearly all regions (Fig. 2b), which is not surprising given that sulfate aerosol does not directly affect the column diabatic cooling. In the extra-tropics, SUL decreases surface temperatures, primarily through slow processes; cools the whole column; and reduces specific humidity (Fig. 7). From an energetic perspective, this can also be seen from the decreased radiative cooling from the clear–clean sky (without clouds and aerosols) (Fig. 5d) due to the reduced water vapour content and decreased atmospheric column temperature (Planck feedback).
There exist some interesting regions where the responses are distinct from globally or zonally averaged results. Rainfall is significantly increased over central Africa, in the BC case, together with reduced precipitation over the middle Atlantic Ocean, and this pattern is most prominent in fast responses. This pattern shows clear similarities with the standing wave pattern response of precipitation to an idealised plume of absorbing aerosols in the tropics (Dagan et al., 2019). Examining δH shows that this is caused by a thermally driven circulation, which favours more convections over central Africa. BC warms up the lower troposphere in central Africa, which results in more ascending motions (Fig. S3). The low latitude (thus weak Coriolis force) allows for the dry static energy to be efficiently diverged from central Africa to the middle Atlantic Ocean (Fig. 3c). In the SUL case, while most regions are dominated by slow responses, in some regions, such as most parts of China and South America, rainfall changes are still dominated by fast responses (Fig. 2b), where the surface temperature is significantly decreased (Fig. S2). This is due to the dimming effect from SUL and associated surface flux changes, and because changes of land surface temperature are not constrained in fSST experiments. Reduced surface fluxes and temperatures therefore lead to a decrease in precipitation over most land regions as well as an increase in surrounding oceans (e.g. southeast Pacific Ocean).
Changes in zonally averaged vertical pressure velocity, temperature profile, and specific humidity (Figs. 6 and 7) show consistency with zonally averaged energetics. Changes in vertical pressure velocity indicate a northward shift of the ascending branch of the Hadley cell in the BC case and SUL case. It is consistent with the changes in the divergence of dry static energy fluxes, which is dominated by the changes in vertical velocity (the dynamic component) in the tropics (Richardson et al., 2016). In the extra-tropics, stabilisation induced by BC through fast response is consistent with increased atmospheric radiative heating from aerosol SW absorption. Reduced specific humidity as well as decreased atmospheric column temperature in the SUL case is consistent with decreased radiative cooling from the clear–clean sky. The changes in large-scale circulations and local thermodynamics qualitatively explain the responses of precipitation, whereas the energetic perspective provides a method to quantify and make their contributions explicit.
In summary, we examined the relationship between aerosol-induced changes in atmospheric energetics and precipitation changes across different scales. Generally, changes in ARC and latent heat from precipitation are largely balanced globally and in the extra-tropics (Dagan et al., 2019). However, these two terms are less balanced in the tropics due to efficient local energy transport. We introduced a new decomposition method, derived from Ghan (2013), to examine aerosol effects on precipitation. For absorbing aerosols, decreased global-mean and extra-tropical precipitation is associated with increased atmospheric aerosol SW absorption from fast responses, while for non-absorbing aerosols, reduced rainfall is more correlated with decreased clear–clean-sky atmospheric radiative cooling from slow responses. This top-down method, together with the traditional bottom-up method, can make the link between precipitation and aerosols explicit and quantify contributions to global and regional rainfall changes.
We acknowledge that high resolution is desirable for the analysis of regional precipitation changes. However, climate models in such configurations (with resolutions around 2∘) have been widely used (e.g. most CMIP and PDRMIP exercises rely on this) and been shown to have skills in examining regional rainfalls as well as their responses (e.g. Liu et al., 2018; Myhre et al., 2017; Samset et al., 2016). It might also be worth noting that increasing resolution while retaining parameterised convection, as done in many regional climate modelling studies, raises other concerns as many assumptions underlying these parameterisations are no longer valid (Prein et al., 2015). In the context of the focus of this work, with focus on constraints from the energy budget and the underlying physical constraints in general, GCMs are in fact a useful tool (and ECHAM6–HAM is, unlike some GCMs or many cloud resolving models, fully energy conserving). We therefore believe our approach to be useful, in line with previous studies on this very topic (e.g. Jordan et al., 2018; Myhre et al., 2017; Roeckner et al., 2006; Samset et al., 2016; Shawki et al., 2018). We also note that internal variability on regional scales is significant, in particular in coupled simulations. However, since we are examining the mean state of the last 50 years instead of the transient evolution, the impacts from internal variability should play a much smaller role in this case. Therefore, this does not take away from our analysis of physical constraints on precipitation changes.
This metric provides further insights into the model variability in simulating rainfall and their responses to different climate forcers, as shown by some PDRMIP research (e.g. Richardson et al., 2018; Stjern et al., 2018). For example, it has been demonstrated that the response from BC perturbation contributes to a large part of the substantial uncertainties among GCMs in simulating the changes in surface temperature and therefore precipitation (Stjern et al., 2017). Distinguishing contributions from individual energetic terms is helpful to assess uncertainties from aerosol absorption, or feedbacks from clouds, water vapour, and surface sensible heat flux. This will improve our understanding of GCMs and the climate system, which will be the focus of our follow-up work.
There exist some caveats when considering real-world implications of our results. The aerosol perturbation follows the PDRMIP protocol designed to reveal the fundamental mechanisms and to make the aerosol effect strong enough to be distinguishable from natural variability. However, these perturbations are too large to be representative for real-world situations, in particular considering anthropogenic SO2 (the precursor of SUL) emissions that are starting to decrease in Southeast Asia (Zheng et al., 2018). As for northern hemispheric mid-latitudes, where the population is concentrated, results here show that increased BC or SUL will lead to decreased precipitation, but this happens at different timescales. Increased BC may lead to a near-instantaneous decreased precipitation over China or America, while increased SUL will reduce precipitation via the slow response, modulated by SSTs, at a much longer timescale. In the real world, it should be mentioned that the anthropogenic emissions create a mixture of absorbing and non-absorbing aerosols, so the changes in rainfall strongly depend on the timescale and the real-world emission scenario. It should also be noted that the total responses of precipitation in this work are derived from mixed-layer ocean experiments and therefore differ from real-world changes involving changes in the ocean circulation. There are several studies that have addressed the importance of using ocean-coupled models to accurately simulates regional and global precipitation responses (e.g. Wang et al., 2017; Zhao and Suzuki, 2019).
The datasets of original simulations are from the ARCHER facility upon request. The data used in this paper can be found at https://doi.org/10.17632/8n2vj578r2.1 (Zhang, 2021).
The supplement related to this article is available online at: https://doi.org/10.5194/acp-21-10179-2021-supplement.
SZ carried out the simulations and analyses. DWP and PS assisted with the simulations. SZ prepared the paper with contributions from all co-authors.
The authors declare that they have no conflict of interest.
Publisher’s note: Copernicus Publications remains neutral with regard to jurisdictional claims in published maps and institutional affiliations.
The simulations were performed on the ARCHER UK National Supercomputing Service. Shipeng Zhang and Philip Stier acknowledge funding from the European Research Council (ERC) project constraining the EffeCts of Aerosols on Precipitation (RECAP) under the European Union's Horizon 2020 research and innovation programme with grant agreement no. 724602. Philip Stier also acknowledges funding from the FORCeS project under the European Union's Horizon 2020 research programme with grant agreement 821205. Duncan Watson-Parris and Philip Stier also acknowledge funding from the European Union's Horizon 2020 research and innovation programme iMIRACLI under Marie Skłodowska-Curie grant agreement no. 860100. Duncan Watson-Parris also gratefully acknowledges funding from the NERC ACRUISE project NE/S005390/1. Many thanks to Guy Dagan, Andrew Williams, Duo Chan, and Xianglin Dai for helpful discussions.
This research has been supported by the European Research Council (grant nos. 724602, 860100, 821205) and the Natural Environment Research Council (grant no. NE/S005390/1).
This paper was edited by Corinna Hoose and reviewed by three anonymous referees.
Abdul-Razzak, H. and Ghan, S. J.: A parameterization of aerosol activation: 2. Multiple aerosol types, J. Geophys. Res.-Atmos., 105, 6837–6844, https://doi.org/10.1029/1999JD901161, 2000.
Ackerman, A. S., Kirkpatrick, M. P., Stevens, D. E., and Toon, O. B.: The impact of humidity above stratiform clouds on indirect aerosol climate forcing, Nature, 432, 1014–1017, https://doi.org/10.1038/nature03174, 2004.
Alizadeh-Choobari, O.: Impact of aerosol number concentration on precipitation under different precipitation rates, Meteorol. Appl., 25, 596–605, https://doi.org/10.1002/met.1724, 2018.
Allen, M. R. and Ingram, W. J.: Constraints on future changes in climate and the hydrologic cycle, Nature, 419, 228–232, https://doi.org/10.1038/nature01092, 2002.
Andrews, T., Forster, P. M., and Gregory, J. M.: A surface energy perspective on climate change, J. Climate, 22, 2557–2570, https://doi.org/10.1175/2008JCLI2759.1, 2009.
Andrews, T., Forster, P. M., Boucher, O., Bellouin, N., and Jones, A.: Precipitation, radiative forcing and global temperature change, Geophys. Res. Lett., 37, L14701, https://doi.org/10.1029/2010GL043991, 2010.
Bai, H., Gong, C., Wang, M., Zhang, Z., and L'Ecuyer, T.: Estimating precipitation susceptibility in warm marine clouds using multi-sensor aerosol and cloud products from A-Train satellites, Atmos. Chem. Phys., 18, 1763–1783, https://doi.org/10.5194/acp-18-1763-2018, 2018.
Bala, G., Caldeira, K., and Nemani, R.: Fast versus slow response in climate change: Implications for the global hydrological cycle, Clim. Dynam., 35, 423–434, https://doi.org/10.1007/s00382-009-0583-y, 2010.
Bischoff, T. and Schneider, T.: The equatorial energy balance, ITCZ position, and double-ITCZ bifurcations, J. Climate, 29, 2997–3013, https://doi.org/10.1175/JCLI-D-15-0328.1, 2016.
Bony, S. and Dufresne, J. L.: Marine boundary layer clouds at the heart of tropical cloud feedback uncertainties in climate models, Geophys. Res. Lett., 32, 1–4, https://doi.org/10.1029/2005GL023851, 2005.
Bony, S., Bellon, G., Klocke, D., Sherwood, S., and Fermepin, S.: Robust direct effect of carbon dioxide on tropical circulation and regional precipitation, Nat. Geosci., 6, 447–451, https://doi.org/10.1038/ngeo1799, 2013.
Boucher, O., Randall, D., Artaxo, P., Bretherton, C., Feingold, G., Forster, P., Kerminen, V.-M., Kondo, Y., Liao, H., Lohmann, U., Rasch, P., Satheesh, S., Sherwood, S., Stevens, B., and Zhang, X.: Clouds and Aerosols, in: Climate Change 2013: The Physical Science Basis. Contribution of Working Group I to the Fifth Assessment Report of the Intergovernmental Panel on Climate Change, edited by: Stocker, T., Qin, D., Plattner, G.-K., Tignor, M., Allen, S., Boschung, J., Nauels, A., Xia, Y., Bex, V., and Midgley, P., Cambridge University Press, Cambridge, United Kingdom and New York, NY, USA, 571–658, 2013.
Chemke, R. and Dagan, G.: The effects of the spatial distribution of direct anthropogenic aerosols radiative forcing on atmospheric circulation, J. Climate, 31, 7129–7145, https://doi.org/10.1175/JCLI-D-17-0694.1, 2018.
Dagan, G., Stier, P., and Watson-Parris, D.: Contrasting Response of Precipitation to Aerosol Perturbation in the Tropics and Extratropics Explained by Energy Budget Considerations, Geophys. Res. Lett., 46, 7828–7837, https://doi.org/10.1029/2019GL083479, 2019.
Dallafior, T. N., Folini, D., Knutti, R., and Wild, M.: Mixed-layer ocean responses to anthropogenic aerosol dimming from 1870 to 2000, J. Geophys. Res.-Atmos., 121, 49–66, https://doi.org/10.1002/2015JD024070, 2016.
DeAngelis, A. M., Qu, X., Zelinka, M. D., and Hall, A.: An observational radiative constraint on hydrologic cycle intensification, Nature, 528, 249–253, https://doi.org/10.1038/nature15770, 2015.
Dentener, F., Kinne, S., Bond, T., Boucher, O., Cofala, J., Generoso, S., Ginoux, P., Gong, S., Hoelzemann, J. J., Ito, A., Marelli, L., Penner, J. E., Putaud, J.-P., Textor, C., Schulz, M., van der Werf, G. R., and Wilson, J.: Emissions of primary aerosol and precursor gases in the years 2000 and 1750 prescribed data-sets for AeroCom, Atmos. Chem. Phys., 6, 4321–4344, https://doi.org/10.5194/acp-6-4321-2006, 2006.
Forster, P., Ramaswamy, V., Artaxo, P., Berntsen, T., Betta, R., Fahey, D. W., Haywood, J., Lean, J., Lowe, D. C., Myhre, G., Nganga, J., Prinn, R., Raga, G., Schulz, M., and Van Dorland, R.: Changes in atmospheric constituents and in radiative forcing, in: Climate Change 2007: The Physical Science Basis. Contribution of Working Group I to the Fourth Assessment Report of the Intergovernmental Panel on Climate Change, edited by: Solomon, S., Qin, D., Manning, M., Chen, Z., Marquis, M., Averyt, K. B., Tignor, M., and Miller, H. L., Cambridge University Press, New York, NY, 2007.
Gettelman, A., Morrison, H., Terai, C. R., and Wood, R.: Microphysical process rates and global aerosol–cloud interactions, Atmos. Chem. Phys., 13, 9855–9867, https://doi.org/10.5194/acp-13-9855-2013, 2013.
Ghan, S., Wang, M., Zhang, S., Ferrachat, S., Gettelman, A., Griesfeller, J., Kipling, Z., Lohmann, U., Morrison, H., Neubauer, D., Partridge, D. G., Stier, P., Takemura, T., Wang, H., and Zhang, K.: Challenges in constraining anthropogenic aerosol effects on cloud radiative forcing using present-day spatiotemporal variability, P. Natl. Acad. Sci. USA, 113, 5804–5811, https://doi.org/10.1073/pnas.1514036113, 2016.
Ghan, S. J.: Technical Note: Estimating aerosol effects on cloud radiative forcing, Atmos. Chem. Phys., 13, 9971–9974, https://doi.org/10.5194/acp-13-9971-2013, 2013.
Ghan, S. J., Liu, X., Easter, R. C., Zaveri, R., Rasch, P. J., Yoon, J. H., and Eaton, B.: Toward a minimal representation of aerosols in climate models: Comparative decomposition of aerosol direct, semidirect, and indirect radiative forcing, J. Climate, 25, 6461–6476, https://doi.org/10.1175/JCLI-D-11-00650.1, 2012.
Gregory, J. and Webb, M.: Tropospheric Adjustment Induces a Cloud Component in CO2 Forcing, J. Climate, 21, 58–71, https://doi.org/10.1175/2007JCLI1834.1, 2008.
Gryspeerdt, E., Stier, P., and Partridge, D. G.: Links between satellite-retrieved aerosol and precipitation, Atmos. Chem. Phys., 14, 9677–9694, https://doi.org/10.5194/acp-14-9677-2014, 2014.
Haynes, J. M., L'Ecuyer, T. S., Stephens, G. L., Miller, S. D., Mitrescu, C., Wood, N. B., and Tanelli, S.: Rainfall retrieval over the ocean with spaceborne W-band radar, J. Geophys. Res.-Atmos., 114, 1–18, https://doi.org/10.1029/2008JD009973, 2009.
Johnson, B. T., Haywood, J. M., and Hawcroft, M. K.: Are Changes in Atmospheric Circulation Important for Black Carbon Aerosol Impacts on Clouds, Precipitation, and Radiation?, J. Geophys. Res.-Atmos., 124, 7930–7950, https://doi.org/10.1029/2019jd030568, 2019.
Jordan, A. K., Gnanadesikan, A., and Zaitchik, B.: Simulated Dust Aerosol Impacts on Western Sahelian Rainfall: Importance of Ocean Coupling, J. Climate, 31, 9107–9124, https://doi.org/10.1175/JCLI-D-17-0819.1, 2018.
Kasoar, M., Shawki, D., and Voulgarakis, A.: Similar spatial patterns of global climate response to aerosols from different regions, npj Climate and Atmospheric Science, 1, 12, https://doi.org/10.1038/s41612-018-0022-z, 2018.
Keshtgar, B., Alizadeh-Choobari, O., and Irannejad, P.: Seasonal and interannual variations of the intertropical convergence zone over the Indian Ocean based on an energetic perspective, Clim. Dynam., 54, 3627–3639, https://doi.org/10.1007/s00382-020-05195-5, 2020.
Khain, A. P.: Notes on state-of-the-art investigations of aerosol effects on precipitation: a critical review, Environ. Res. Lett., 4, 015004, https://doi.org/10.1088/1748-9326/4/1/015004, 2009.
Khain, A. P., BenMoshe, N., and Pokrovsky, A.: Factors Determining the Impact of Aerosols on Surface Precipitation from Clouds: An Attempt at Classification, J. Atmos. Sci., 65, 1721–1748, https://doi.org/10.1175/2007JAS2515.1, 2008.
Khairoutdinov, M. and Kogan, Y.: A New Cloud Physics Parameterization in a Large-Eddy Simulation Model of Marine Stratocumulus, Mon. Weather Rev., 128, 229–243, https://doi.org/10.1175/1520-0493(2000)128<0229:ANCPPI>2.0.CO;2, 2000.
Köhler, H.: The nucleus in and the growth of hygroscopic droplets, T. Faraday Soc., 32, 1152–1161, https://doi.org/10.1039/TF9363201152, 1936.
Kvalevåg, M. M., Samset, B. H., and Myhre, G.: Hydrological sensitivity to greenhouse gases and aerosols in a global climate model, Geophys. Res. Lett., 40, 1432–1438, https://doi.org/10.1002/grl.50318, 2013.
Lamarque, J.-F., Bond, T. C., Eyring, V., Granier, C., Heil, A., Klimont, Z., Lee, D., Liousse, C., Mieville, A., Owen, B., Schultz, M. G., Shindell, D., Smith, S. J., Stehfest, E., Van Aardenne, J., Cooper, O. R., Kainuma, M., Mahowald, N., McConnell, J. R., Naik, V., Riahi, K., and van Vuuren, D. P.: Historical (1850–2000) gridded anthropogenic and biomass burning emissions of reactive gases and aerosols: methodology and application, Atmos. Chem. Phys., 10, 7017–7039, https://doi.org/10.5194/acp-10-7017-2010, 2010.
Lambert, F. H. and Webb, M. J.: Dependency of global mean precipitation on surface temperature, Geophys. Res. Lett., 35, 1–5, https://doi.org/10.1029/2008GL034838, 2008.
Liu, L., Shawki, D., Voulgarakis, A., Kasoar, M., Samset, B. H., Myhre, G., Forster, P. M., Hodnebrog, Sillmann, J., Aalbergsjø, S. G., Boucher, O., Faluvegi, G., Iversen, T., Kirkevåg, A., Lamarque, J. F., Olivié, D., Richardson, T., Shindell, D., and Takemura, T.: A PDRMIP Multimodel study on the impacts of regional aerosol forcings on global and regional precipitation, J. Climate, 31, 4429–4447, https://doi.org/10.1175/JCLI-D-17-0439.1, 2018.
Liu, Z., Wang, M., Rosenfeld, D., Zhu, Y., Bai, H., Cao, Y., and Liang, Y.: Evaluation of Cloud and Precipitation Response to Aerosols in WRF-Chem With Satellite Observations, J. Geophys. Res.-Atmos., 125, 1–25, https://doi.org/10.1029/2020JD033108, 2020.
Lohmann, U. and Hoose, C.: Sensitivity studies of different aerosol indirect effects in mixed-phase clouds, Atmos. Chem. Phys., 9, 8917–8934, https://doi.org/10.5194/acp-9-8917-2009, 2009.
Lohmann, U., Stier, P., Hoose, C., Ferrachat, S., Kloster, S., Roeckner, E., and Zhang, J.: Cloud microphysics and aerosol indirect effects in the global climate model ECHAM5-HAM, Atmos. Chem. Phys., 7, 3425–3446, https://doi.org/10.5194/acp-7-3425-2007, 2007.
Lubin, D. and Vogelmann, A. M.: A climatologically significant aerosol longwave indirect effect in the Arctic, Nature, 439, 453–456, https://doi.org/10.1038/nature04449, 2006.
Michibata, T., Suzuki, K., Sato, Y., and Takemura, T.: The source of discrepancies in aerosol–cloud–precipitation interactions between GCM and A-Train retrievals, Atmos. Chem. Phys., 16, 15413–15424, https://doi.org/10.5194/acp-16-15413-2016, 2016.
Ming, Y., Ramaswamy, V., and Persad, G.: Two opposing effects of absorbing aerosols on global-mean precipitation, Geophys. Res. Lett., 37, 1–4, https://doi.org/10.1029/2010GL042895, 2010.
Muller, C. J. and O'Gorman, P. A.: An energetic perspective on the regional response of precipitation to climate change, Nat. Clim. Change, 1, 266–271, https://doi.org/10.1038/nclimate1169, 2011.
Myhre, G., Forster, P. M., Samsmset, B. H., Odnebrog, Sillmann, J., Aalbergsjø, S. G., Andrews, T., Boucher, O., Faluvegi, G., Fläschner, D., Iversen, T., Kasoar, M., Kharin, V., Kirkevag, A., Lamarque, J. F., Olivié, D., Richardson, T. B., Shindell, D., Shine, K. P., Stjern, C. W., Takemura, T., Voulgarakis, A., and Zwiers, F.: PDRMIP: A precipitation driver and response model intercomparison project-protocol and preliminary results, B. Am. Meteorol. Soc., 98, 1185–1198, https://doi.org/10.1175/BAMS-D-16-0019.1, 2017.
Naegele, A. C. and Randall, D. A.: Geographical and Seasonal Variability of Cloud-Radiative Feedbacks on Precipitation, J. Geophys. Res.-Atmos., 124, 684–699, https://doi.org/10.1029/2018JD029186, 2019.
Neubauer, D., Ferrachat, S., Siegenthaler-Le Drian, C., Stier, P., Partridge, D. G., Tegen, I., Bey, I., Stanelle, T., Kokkola, H., and Lohmann, U.: The global aerosol–climate model ECHAM6.3–HAM2.3 – Part 2: Cloud evaluation, aerosol radiative forcing, and climate sensitivity, Geosci. Model Dev., 12, 3609–3639, https://doi.org/10.5194/gmd-12-3609-2019, 2019.
Nordeng, T. E.: Extended versions of the convective parametrization scheme at ECMWF and their impact on the mean and transient activity of the model in the tropics, ECMWF Research Department, Technical Momorandum 206, European Centre for Medium-range Weather Forecast, Reading, UK, 1994.
O'Gorman, P. A., Allan, R. P., Byrne, M. P., and Previdi, M.: Energetic Constraints on Precipitation Under Climate Change, Surv. Geophys., 33, 585–608, https://doi.org/10.1007/s10712-011-9159-6, 2012.
Pendergrass, A. G. and Hartmann, D. L.: Global-mean precipitation and black carbon in AR4 simulations, Geophys. Res. Lett., 39, 1–6, https://doi.org/10.1029/2011GL050067, 2012.
Pincus, R. and Stevens, B.: Paths to accuracy for radiation parameterizations in atmospheric models, J. Adv. Model. Earth Sy., 5, 225–233, https://doi.org/10.1002/jame.20027, 2013.
Prein, A. F., Langhans, W., Fosser, G., Ferrone, A., Ban, N., Goergen, K., Keller, M., Tölle, M., Gutjahr, O., Feser, F., Brisson, E., Kollet, S., Schmidli, J., Lipzig, N. P. M., and Leung, R.: A review on regional convection-permitting climate modeling: Demonstrations, prospects, and challenges, Rev. Geophys., 53, 323–361, https://doi.org/10.1002/2014RG000475, 2015.
Ramanathan, V., Crutzen, P. J., Kiehl, J. T., and Rosenfeld, D: Aerosols, Climate, and the Hydrological Cycle, Science, 294, 2119–2124, https://doi.org/10.1126/science.1064034, 2001.
Richardson, T. B., Forster, P. M., Andrews, T., and Parker, D. J.: Understanding the rapid precipitation response to CO2 and aerosol forcing on a regional scale, J. Climate, 29, 583–594, https://doi.org/10.1175/JCLI-D-15-0174.1, 2016.
Richardson, T. B., Forster, P. M., Andrews, T., Boucher, O., Faluvegi, G., Fläschner, D., Hodnebrog, Ø., Kasoar, M., Kirkevåg, A., Lamarque, J.-F., Myhre, G., Olivié, D., Samset, B. H., Shawki, D., Shindell, D., Takemura, T., and Voulgarakis, A.: Drivers of Precipitation Change: An Energetic Understanding, J. Climate, 31, 9641–9657, https://doi.org/10.1175/JCLI-D-17-0240.1, 2018.
Roeckner, E., Stier, P., Feichter, J., Kloster, S., Esch, M., and Fischer-Bruns, I.: Impact of carbonaceous aerosol emissions on regional climate change, Clim. Dynam., 27, 553–571, https://doi.org/10.1007/s00382-006-0147-3, 2006.
Rosenfeld, D., Zhu, Y., Wang, M., Zheng, Y., Goren, T., and Yu, S.: Aerosol-driven droplet concentrations dominate coverage and water of oceanic low-level clouds, Science, 363, eaav0566, https://doi.org/10.1126/science.aav0566, 2019.
Rotstayn, L. D. and Lohmann, U.: Tropical rainfall trends and the indirect aerosol effect, J. Climate, 15, 2103–2116, https://doi.org/10.1175/1520-0442(2002)015<2103:TRTATI>2.0.CO;2, 2002.
Samset, B. H., Myhre, G., Forster, P. M., Hodnebrog, Andrews, T., Faluvegi, G., Fläschner, D., Kasoar, M., Kharin, V., Kirkevåg, A., Lamarque, J. F., Olivié, D., Richardson, T., Shindell, D., Shine, K. P., Takemura, T., and Voulgarakis, A.: Fast and slow precipitation responses to individual climate forcers: A PDRMIP multimodel study, Geophys. Res. Lett., 43, 2782–2791, https://doi.org/10.1002/2016GL068064, 2016.
Samset, B. H., Myhre, G., Forster, P. M., Hodnebrog, Ø., Andrews, T., Boucher, O., Faluvegi, G., Fläschner, D., Kasoar, M., Kharin, V., Kirkevåg, A., Lamarque, J.-F., Olivié, D., Richardson, T. B., Shindell, D., Takemura, T., and Voulgarakis, A.: Weak hydrological sensitivity to temperature change over land, independent of climate forcing, npj Climate and Atmospheric Science, 1, 3, https://doi.org/10.1038/s41612-017-0005-5, 2017.
Shaw, T. A. and Voigt, A.: Tug of war on summertime circulation between radiative forcing and sea surface warming, Nat. Geosci., 8, 560–566, https://doi.org/10.1038/ngeo2449, 2015.
Shawki, D., Voulgarakis, A., Chakraborty, A., Kasoar, M., and Srinivasan, J.: The South Asian Monsoon Response to Remote Aerosols: Global and Regional Mechanisms, J. Geophys. Res.-Atmos., 123, 11585–11601, https://doi.org/10.1029/2018JD028623, 2018.
Stephens, G. L. and Hu, Y.: Are climate-related changes to the character of global-mean precipitation predictable?, Environ. Res. Lett., 5, 025209, https://doi.org/10.1088/1748-9326/5/2/025209, 2010.
Stevens, B., Giorgetta, M., Esch, M., Mauritsen, T., Crueger, T., Rast, S., Salzmann, M., Schmidt, H., Bader, J., Block, K., Brokopf, R., Fast, I., Kinne, S., Kornblueh, L., Lohmann, U., Pincus, R., Reichler, T., and Roeckner, E.: Atmospheric component of the MPI-M Earth System Model: ECHAM6, J. Adv. Model. Earth Sy., 5, 146–172, https://doi.org/10.1002/jame.20015, 2013.
Stier, P., Feichter, J., Kinne, S., Kloster, S., Vignati, E., Wilson, J., Ganzeveld, L., Tegen, I., Werner, M., Balkanski, Y., Schulz, M., Boucher, O., Minikin, A., and Petzold, A.: The aerosol-climate model ECHAM5-HAM, Atmos. Chem. Phys., 5, 1125–1156, https://doi.org/10.5194/acp-5-1125-2005, 2005.
Stier, P., Seinfeld, J. H., Kinne, S., Feichter, J., and Boucher, O.: Impact of nonabsorbing anthropogenic aerosols on clear-sky atmospheric absorption, J. Geophys. Res.-Atmos., 111, 1–11, https://doi.org/10.1029/2006JD007147, 2006.
Stjern, C. W., Samset, B. H., Myhre, G., Forster, P. M., Hodnebrog, Ø., Andrews, T., Boucher, O., Faluvegi, G., Iversen, T., Kasoar, M., Kharin, V., Kirkevåg, A., Lamarque, J.-F., Olivié, D., Richardson, T., Shawki, D., Shindell, D., Smith, C. J., Takemura, T., and Voulgarakis, A.: Rapid Adjustments Cause Weak Surface Temperature Response to Increased Black Carbon Concentrations, J. Geophys. Res.-Atmos., 122, 11462–11481, https://doi.org/10.1002/2017JD027326, 2017.
Stjern, C. W., Richardson, T., Myhre, G., Faluvegi, G., Olivié, D., Stier, P., Samset, B. H., Fläschner, D., Takemura, T., Lamarque, J.-F., Smith, C. J., Forster, P., Kirkevåg, A., Boucher, O., Soden, B. J., Voulgarakis, A., Shindell, D., Kasoar, M., Hodnebrog, Ø., Kramer, R. J., Andrews, T., and Watson-Parris, D.: Quantifying the Importance of Rapid Adjustments for Global Precipitation Changes, Geophys. Res. Lett., 45, 11399–11405, https://doi.org/10.1029/2018gl079474, 2018.
Suzuki, K. and Takemura, T.: Perturbations to Global Energy Budget Due to Absorbing and Scattering Aerosols, J. Geophys. Res.-Atmos., 124, 2194–2209, https://doi.org/10.1029/2018JD029808, 2019.
Suzuki, K., Stephens, G. L., and Golaz, J.-C.: Significance of aerosol radiative effect in energy balance control on global precipitation change, Atmos. Sci. Lett., 18, 389–395, https://doi.org/10.1002/asl.780, 2017.
Tegen, I., Neubauer, D., Ferrachat, S., Siegenthaler-Le Drian, C., Bey, I., Schutgens, N., Stier, P., Watson-Parris, D., Stanelle, T., Schmidt, H., Rast, S., Kokkola, H., Schultz, M., Schroeder, S., Daskalakis, N., Barthel, S., Heinold, B., and Lohmann, U.: The global aerosol–climate model ECHAM6.3–HAM2.3 – Part 1: Aerosol evaluation, Geosci. Model Dev., 12, 1643–1677, https://doi.org/10.5194/gmd-12-1643-2019, 2019.
Tiedtke, M.: A Comprehensive Mass Flux Scheme for Cumulus Parameterization in Large-Scale Models, Mon. Weather Rev., 117, 1779–1800, https://doi.org/10.1175/1520-0493(1989)117<1779:ACMFSF>2.0.CO;2, 1989.
van Marle, M. J. E., Kloster, S., Magi, B. I., Marlon, J. R., Daniau, A.-L., Field, R. D., Arneth, A., Forrest, M., Hantson, S., Kehrwald, N. M., Knorr, W., Lasslop, G., Li, F., Mangeon, S., Yue, C., Kaiser, J. W., and van der Werf, G. R.: Historic global biomass burning emissions for CMIP6 (BB4CMIP) based on merging satellite observations with proxies and fire models (1750–2015), Geosci. Model Dev., 10, 3329–3357, https://doi.org/10.5194/gmd-10-3329-2017, 2017.
Wang, C.: The sensitivity of tropical convective precipitation to the direct radiative forcings of black carbon aerosols emitted from major regions, Ann. Geophys., 27, 3705–3711, https://doi.org/10.5194/angeo-27-3705-2009, 2009.
Wang, H., Xie, S. P., Kosaka, Y., Liu, Q., and Du, Y.: Dynamics of Asian summer monsoon response to anthropogenic aerosol forcing, J. Climate, 32, 843–858, https://doi.org/10.1175/JCLI-D-18-0386.1, 2019.
Wang, M., Ghan, S., Liu, X., L'Ecuyer, T. S., Zhang, K., Morrison, H., Ovchinnikov, M., Easter, R., Marchand, R., Chand, D., Qian, Y., and Penner, J. E.: Constraining cloud lifetime effects of aerosols using A-Train satellite observations, Geophys. Res. Lett., 39, 3–9, https://doi.org/10.1029/2012GL052204, 2012.
Wang, Z., Lin, L., Yang, M., Xu, Y., and Li, J.: Disentangling fast and slow responses of the East Asian summer monsoon to reflecting and absorbing aerosol forcings, Atmos. Chem. Phys., 17, 11075–11088, https://doi.org/10.5194/acp-17-11075-2017, 2017.
White, B., Gryspeerdt, E., Stier, P., Morrison, H., Thompson, G., and Kipling, Z.: Uncertainty from the choice of microphysics scheme in convection-permitting models significantly exceeds aerosol effects, Atmos. Chem. Phys., 17, 12145–12175, https://doi.org/10.5194/acp-17-12145-2017, 2017.
Zanis, P., Akritidis, D., Georgoulias, A. K., Allen, R. J., Bauer, S. E., Boucher, O., Cole, J., Johnson, B., Deushi, M., Michou, M.a, Mulcahy, J., Nabat, P., Olivié, D., Oshima, N., Sima, A., Schulz, M., Takemura, T., and Tsigaridis, K.: Fast responses on pre-industrial climate from present-day aerosols in a CMIP6 multi-model study, Atmos. Chem. Phys., 20, 8381–8404, https://doi.org/10.5194/acp-20-8381-2020, 2020.
Zelinka, M. D., Myers, T. A., McCoy, D. T., Po-Chedley, S., Caldwell, P. M., Ceppi, P., Klein, S. A., and Taylor, K. E.: Causes of Higher Climate Sensitivity in CMIP6 Models, Geophys. Res. Lett., 47, 1–12, https://doi.org/10.1029/2019GL085782, 2020.
Zhang, K., O'Donnell, D., Kazil, J., Stier, P., Kinne, S., Lohmann, U., Ferrachat, S., Croft, B., Quaas, J., Wan, H., Rast, S., and Feichter, J.: The global aerosol-climate model ECHAM-HAM, version 2: sensitivity to improvements in process representations, Atmos. Chem. Phys., 12, 8911–8949, https://doi.org/10.5194/acp-12-8911-2012, 2012.
Zhang, S: On the Contribution of Fast and Slow Responses to Precipitation Changes Caused by Aerosol Perturbations, Mendeley Data [data set], V1, https://doi.org/10.17632/8n2vj578r2.1, 2021.
Zhang, S., Wang, M., Ghan, S. J., Ding, A., Wang, H., Zhang, K., Neubauer, D., Lohmann, U., Ferrachat, S., Takeamura, T., Gettelman, A., Morrison, H., Lee, Y., Shindell, D. T., Partridge, D. G., Stier, P., Kipling, Z., and Fu, C.: On the characteristics of aerosol indirect effect based on dynamic regimes in global climate models, Atmos. Chem. Phys., 16, 2765–2783, https://doi.org/10.5194/acp-16-2765-2016, 2016.
Zhao, S. and Suzuki, K.: Differing Impacts of Black Carbon and Sulfate Aerosols on Global Precipitation and the ITCZ Location via Atmosphere and Ocean Energy Perturbations, J. Climate, 32, 5567–5582, https://doi.org/10.1175/jcli-d-18-0616.1, 2019.
Zheng, B., Tong, D., Li, M., Liu, F., Hong, C., Geng, G., Li, H., Li, X., Peng, L., Qi, J., Yan, L., Zhang, Y., Zhao, H., Zheng, Y., He, K., and Zhang, Q.: Trends in China's anthropogenic emissions since 2010 as the consequence of clean air actions, Atmos. Chem. Phys., 18, 14095–14111, https://doi.org/10.5194/acp-18-14095-2018, 2018.