the Creative Commons Attribution 4.0 License.
the Creative Commons Attribution 4.0 License.
 | 04 Jan 2021
Rapid increase in summer surface ozone over the North China Plain during 2013–2019: a side effect of particulate matter reduction control?
Xiaodan Ma
Jianping Huang
Tianliang Zhao
Cheng Liu
Kaihui Zhao
Jia Xing
While the elevated ambient levels of particulate matters with aerodynamic diameter of 2.5 µm or less (PM2.5) are alleviated largely with the implementation of effective emission control measures, an opposite trend with a rapid increase has been seen in surface ozone (O3) in the North China Plain (NCP) region over the past several years. It is critical to determine the real culprit causing such a large increase in surface O3. In this study, 7-year surface observations and satellite retrieval data are analyzed to determine the long-term change in surface O3 as well as driving factors. Results indicate that anthropogenic emission control strategies and changes in aerosol concentrations as well as aerosol optical properties such as single-scattering albedo (SSA) are the most important factors driving such a large increase in surface O3. Numerical simulations with the National Center for Atmospheric Research (NCAR) Master Mechanism (MM) model suggest that reduction of O3 precursor emissions and aerosol radiative effect accounted for 45 % and 23 % of the total change in surface O3 in summertime during 2013–2019, respectively. Planetary boundary layer (PBL) height with an increase of 0.21 km and surface air temperature with an increase of 2.1 ∘C contributed 18 % and 12 % to the total change in surface O3, respectively. The combined effect of these factors was responsible for the rest of the change. Decrease in SSA or strengthened absorption property of aerosols may offset the impact of aerosol optical depth (AOD) reduction on surface O3 substantially. While the MM model enables quantification of an individual factor's percentage contributions, it requires further refinement with aerosol chemistry included in the future investigation. The study indicates an important role of aerosol radiative effect in development of more effective emission control strategies on reduction of ambient levels of O3 as well as alleviation of national air quality standard exceedance events.
- Article
(6290 KB) - Full-text XML
-
Supplement
(1178 KB) - BibTeX
- EndNote


Elevated ambient levels of ozone (O3) are of great concern due to their important impact on human health, ecosystem productivity, atmospheric chemistry and climate change (Monks et al., 2015; Tai et al., 2014; Tan et al., 2019). O3 is produced by a series of photochemical reactions involving nitrogen oxides (NOx= NO + NO2) and volatile organic compounds (VOCs) in the presence of solar radiation. Ambient levels of O3 are highly dependent on emissions of O3 precursors, solar radiation and other physical processes such as regional and vertical transport (Sun et al., 2019; Ni et al., 2018; Liu et al., 2019; Wang et al., 2016b). While O3 concentrations show a steady decreasing trend in Europe and North America, an opposite trend with an accelerating increase rate is observed in China (Lu et al., 2018; Li et al., 2019a). Due to high nonlinearity of the O3–NOx–VOC relationship and complexity of processes governing ambient levels of O3, a large uncertainty remains in the determination of the impact of different driving factors on changes in surface O3 concentrations under the polluted atmospheric conditions. Thus, accurate quantification of relative contributions of individual factors to the large increase in surface O3 concentrations over the heavily polluted regions such as China continues to represent one of the major challenges to research communities and government policy makers.
Anthropogenic emissions are the key in driving change in surface O3. With rapid development of industrialization and urbanization, anthropogenic emissions of NOx and VOCs, two major precursors of O3 formation, have been increasing significantly in China over the past several decades (Zeng et al., 2019). For instance, tropospheric columns of NO2 (TCNO2), an indicator of anthropogenic emission intensity of NOx were increased by 307 % in Beijing from 1996–2011 (Huang et al., 2013), which caused a strong increasing trend of O3 in the lower troposphere. Meanwhile, an increase in surface O3 at a rate of 2 % a−1 was observed in Beijing from 1995–2005 (Ding et al., 2008), and a similar increase with 1–2 ppb a−1 was monitored at urban and remote sites in eastern China (Sun et al., 2016; Gao et al., 2017; Ma et al., 2016; Tang et al., 2009). However, little light was shed on change in surface O3 compared to its counterpart PM2.5 which was elevated to the severe pollution level in eastern China, especially over the North China Plain (NCP) region (Zeng et al., 2019; Zhai et al., 2019). The severity of PM2.5 pollution has been largely alleviated after the stringent emission control strategies were implemented by the Chinese government at a national level in 2013 (Zeng et al., 2019). According to the estimate by Multi-resolution Emission Inventory in China (MEIC), anthropogenic emissions of PM2.5 decreased by approximately 60 % and NOx emissions decreased by 21 %. Significant reductions were also seen in other air pollutants such as SO2 but not for VOCs, which showed an increase of 2 % instead over the period of 2013–2017 (Zheng et al., 2018). As a result, monthly mean PM2.5 concentrations decreased by 41 % for the Beijing–Tianjin–Hebei (BTH) region, which is similar to the NCP region presented in this study, and aerosol optical depth (AOD) was reduced by 20 % in eastern China (Li et al., 2019a). However, an opposite trend with an accelerating increase rate of O3 was observed in the NCP region during this period (Lu et al., 2018; Cooper et al., 2014). The fact that O3 formation was dominated by a VOC-sensitive regime may partly account for such an increase in the NCP region, but it is not clear how much the change of surface O3 is attributed to anthropogenic emission control efforts.
Aerosol radiative effect is another factor imposing a large constraint on change in surface O3. Aerosols attenuate surface-reaching solar near-ultraviolet (UV) radiation effectively and reduce photolysis rate of NO2, a key parameter in determining O3 formation. The impact of aerosol radiative effect on photolysis rate of NO2 or O3 photochemical production is highly dependent on aerosol optical properties as described by AOD, single-scattering albedo (SSA) and asymmetry factor. AOD is a measure of extinction of solar beam by aerosols (e.g., dust and haze), used as a proxy of representing severity of fine particulate matter pollution or aerosol mass concentrations. SSA denotes the relative contributions of scattering versus absorption effect to total aerosol extinction efficiency with “0” for pure absorption and “1” for pure scattering effect. Both numerical simulations and observations showed that aerosols with UV-scattering effect may accelerate photochemical production of O3 but aerosols with a strong absorption property (e.g., mineral dust and soot) may inhibit O3 production in the atmospheric boundary layer (Dickerson et al., 1997; Mok et al., 2016). The lowest photolysis rate coefficient was closely linked with the highest AOD (Liu et al., 2019; Dickerson et al., 1997). It was observed that surface PM2.5 concentrations decreased by 41 % whereas surface O3 increased at a rate of 3.1 ppb a−1 over the BTH region from 2013–2017 (Li et al., 2019a). Decrease in PM2.5 was considered to be one of the important causes leading to such an increase in surface O3 due to additional O3 production associated with reduced sink of hydroperoxy radicals (HO2) (Li et al., 2019a). They pointed out that increase in surface O3 associated with decrease in PM2.5 was more prominent than that with reduction of NOx emissions over the NCP region where O3 formation was dominated by a VOC-limited regime. Liu and Wang (2020a, b) found the reduction of PM emissions increased the O3 levels by enhancing the photolysis rates and reducing heterogeneous uptake of reactive gases (mainly HO2 and O3), of which the latter is more important than the former. A similar impact associated with aerosol radiative properties on O3 production was observed in other regions over the world. For instance, the combined effect associated with optical properties of BrC and black carbon (BC) reduced the net change in O3 production by up to 18 % compared to BC alone in the Amazon Basin (Mok et al., 2016). Thus, surface O3 changes are dependent on not only aerosol concentrations (AOD used as a proxy) but also aerosol optical properties such as SSA. Relative importance of different aerosol optical property parameters to change in surface O3 needs to be addressed.

Figure 1(a) Locations of North China Plain (NCP, 32–40∘ N, 114–121∘ E) and three other major air pollution regions, Beijing–Tianjin–Hebei (BTH, 37–41∘ N, 114–118∘ E), Yangtze River Delta (YRD, 30–33∘ N, 118–122∘ E) and Pearl River Delta (PRD, 21.5–24∘ N, 112–115.5∘ E) in China with terrain heights included and (b) the location of an ultraviolet (UV) radiation observational site, YCA (Yucheng site), areas covered by the NCP region and surrounded by mountains.
NCP, the largest alluvial plain of China, is surrounded by the Yan Mountains with a main peak of 2116 m in the north, the Taihang Mountains with the highest elevation of 2882 m in the west, and the Dabie and Tianmu mountains in the south, bordered by the Yellow Sea in the east (see Fig. 1). Such a complex terrain is not conducive to dispersion and dilution of air pollutants and makes them easily trapped. Meanwhile, the total energy consumption was increased by more than a factor of 5 from 1985–2016 (Zeng et al., 2019). The NCP has become one of the most polluted regions in China. The highest PM2.5 concentration reached 900 µg m−3 during winter, and heavy PM2.5 pollution events were the major concern to air quality during that period (Gu, 2013; An et al., 2019), but surface PM2.5 concentrations have reduced substantially. Meanwhile, O3 exceedance events became more frequent and more serious in the NCP region (Zhang et al., 2015; Lang et al., 2017; Zhai et al., 2019). Hourly surface O3 concentrations went up to 150.0 ppb and the increase rate reached 3.1 ppb a−1, much higher than those observed in other polluted regions such as the Yangtze River Delta (YRD) and Pearl River Delta (PRD) in China (Li et al., 2019a; Lyu et al., 2019). The elevated surface O3 has become an emerging critical air quality issue in this region (Wang et al., 2006; Shi et al., 2015). Understanding of the driving factors such as a rise in surface O3 has become a very hot topic (e.g., Li et al., 2019a, b). However, most of the related studies are limited to the contributions of atmospheric chemistry and changes in O3 precursors' emissions. Relative importance of aerosol radiative effect associated with a substantial decrease in aerosols or PM2.5 and meteorological variability to the enhancement of surface O3 is not well qualified.
In this study, seven-year air quality observational data provided by the China National Environmental Monitoring Center (CNEMC) network are examined to determine the temporal and spatial variations in surface O3 over the NCP region over the period of 2013–2019. A series of analyses are presented to investigate the long-term change trend of surface O3 and the statistical relationships with NOx and VOC emissions, meteorological variables, and aerosol radiative optical property parameters. A box model with Master Mechanism (MM) is then utilized to determine the response of surface O3 to the key driving factors. The specific objectives include (1) to identify the key factors driving the increase in surface O3 over the NCP, the most polluted region in China, and (2) to quantify the relative contributions of anthropogenic emissions (e.g., NOx and VOCs), aerosol concentrations, aerosol optical properties and meteorological variability to the increase in surface O3 in summertime during 2013–2019.
2.1 Observational data
Data used in this study include hourly-averaged surface observations of O3 and PM2.5 from 2013 to 2019 provided by the CNEMC (http://106.37.208.233:20035/, last access: 20 December 2020). UV data measured at the Yucheng site (i.e., YCA, 36.87∘ N, 116.57∘ E) in the NCP region are obtained from the Chinese Ecosystem Research Network (http://www.cern.ac.cn/, last access: 20 December 2020) from the years 2013–2016. AOD is derived from the monthly level 3 product of the Moderate Resolution Imaging Spectroradiometer (MODIS) instrument aboard the Aqua satellite, reported at the 550 nm wavelength with a resolution of 1∘ × 1∘ (Platnick, 2015). TCNO2 data are retrieved from the daily level 3 products of the Ozone Monitoring Instrument (OMI) aboard the Aura satellite with a resolution of 0.25∘ × 0.25∘ (Krotkov, 2019). Shortwave radiation data are provided by the Land Data Assimilation System (FLDAS) (NASA, 2018) at a resolution of 0.1∘ × 0.1∘. SSA retrieved from OMI/Aura Near UV Aerosol Optical Depth and Single Scattering Albedo V003 (OMAERUV) (Torres, 2006) at 388 nm are used to evaluate the impact of aerosol scatting/absorption properties on change in surface O3. Daily max temperature at 2 m (T2 max), 10 m wind speed and the planetary boundary layer height (PBLH) are derived from the Modern-Era Retrospective Analysis for Research and Applications version 2 (MERRA-2) reanalysis data at a horizontal resolution of 0.5∘ × 0.625∘ (Global Modeling and Assimilation Office, 2015).
2.2 Model description and configurations
The MM model is utilized to quantify the relative contributions of anthropogenic emissions and aerosol optical and radiative properties to the change in surface O3. The MM is a chemistry box model, originally developed and updated by the scientists at the National Center for Atmospheric Research (NCAR). It includes a detailed and flexible gas phase chemical mechanism consisting of approximately 5000 reactions for simulating temporal variations in chemical species of interest. The hydrocarbon chemistry in the MM is treated explicitly with photo-oxidation of partly oxygenated organic species included. Alkanes, alkenes and aromatics are considered to be initial hydrocarbon reagents in the gas-phase mechanism. The Gear-type solver is used in the MM model to handle large numbers of chemical reactions and species and the integration time steps varied during the simulations (Madronich and Calvert, 1989, 1990). The TUV (Tropospheric Ultraviolet and Visible radiation) model is called by the MM model for update of chemical reaction rates every 15 min. This model computes time-dependent chemical evolution of an air parcel initialized with a known composition and additional emissions. It is assumed that no dilution is included in the simulations given the difficulty of getting inputs to calculate the dilution rate. The transport in and out of air pollutants reached a quasi-equilibrium state over the study domain, and no heterogeneous processes were included in the MM model. The MM model has been widely used to investigate the impact of different factors such as emissions, chemistry and meteorological conditions on simulations of O3 and other chemical species (e.g., Liu et al., 2019; Geng et al., 2007).
Photolysis rate j(NO2) is calculated by using the Tropospheric Ultraviolet and Visible (TUV) radiation model which is embedded into the NCAR MM (Madronich and Flocke, 1999). In the fully coupled system, the TUV is called by the MM model for update of photolysis rates of NO2 and other chemical species (e.g., H2O2, O3, NO3, N2O5) every 15 min dynamically. The TUV model is initialized with the monthly means of AOD, SSA and total columns of O3 retrieved from satellite measurements as well as other meteorological parameters such as cloud fractions at the central point of the NCP (36∘ N, 117.5∘ E) in June.
HO2 radicals are important to O3 formation. HONO photolysis as the primary production of OH radicals and formaldehyde (HCHO) photolysis as the net radical source of HO2 can lead to major changes in the HOx and NOx budget that may have an important effect on O3 production and loss (e.g., Aumont et al., 2003; Brasseur and Solomon, 2006; Lin et al., 2012). The role of HO2 radicals can be determined by the following reactions.
where hv represents ultraviolet radiation at the wavelengths of 200–400 nm. The MM model has a capability of quantifying the role of radicals in O3 formations under different pollution conditions.
The MM simulations are conducted for the predefined box as shown in Fig. 1 to represent ensemble mean behaviors and responses of the model to changes of different model inputs over the NCP region. The 24 h simulations are conducted with the initial hour at 00:00 local time (LT). The inputs of the simulations include meteorological data (e.g., air temperature, cloud and PBLH), aerosol radiative properties (i.e., AOD and SSA) and emissions. While all the meteorological inputs are generated from observational data, the initial values of chemical species such as VOC species (e.g., acrylic, 2-methylbutane, toluene, p-xylene, isoprene), N2, O2, H2O, NO2, O3, etc., are obtained from climatology or background values.
Emissions (NOx and VOCs) are calculated from the MEIC emission inventory. Aerosol radiative property parameters from MODIS and OMAERUV are assumed as constants for all the simulations. All the simulations are driven by the monthly means averaged over the entire NCP region. The temporal variations at an interval of 4 h are included in the model inputs to represent the diurnal variations in different meteorological variables such as T2 max and PBLH from MERRA-2 reanalysis.
Six groups with a total of 16 numerical experiments with the MM model are designed to quantify the roles of different factors in driving change in O3 concentrations (Table 1). Case A stands for the base case in which the emissions were generated from MEIC in the base year 2012 (http://www.meicmodel.org/, last access: 20 December 2020) with an adjustment for 2013 use, and the spatial distributions of NOx and VOCs are presented in Fig. S1. Case B represents a scenario for the year 2019 with NOx and VOC emission changes by −35 % and +10 % with respect to the case in the year 2013, respectively. The changes in NOx emissions (−35 %) and VOC emissions (+10 %) in 2019 were obtained by extrapolating their respective changes during the period from 2013 to 2017 (Li et al., 2019a). Case C1 denotes a scenario with a decrease in AOD from 1.0 (i.e., the case for the year 2013) to 0.75 (i.e., for the year 2019) according to MODIS measurements, and six other members in group C are used to examine the impact of varying AOD on the change in surface O3. Case D1 is the one with a change of SSA from 0.95 (2013) to 0.93 (2019). Case E is a scenario with T2 max increase from 29.9 ∘C in 2013 to 32.0 ∘C in 2019 based on the regional average calculated with the MERRA-2 reanalysis in the NCP region. Case F is designed to assess the impact of the increased PBLH (i.e., increase from 0.76 km in 2013 to 0.97 km in 2019) on surface O3 change in the NCP region. Case G mimics the year 2019 representing the combined effect of changes in emissions, AOD, SSA, T2 max and PBLH. The 24 h simulations are completed for each case to quantify the contributions of individual factors to the changes in surface O3 from 2013 to 2019. More details of the numerical experiments are presented in Table 1.
Table 1A summary of numerical experiments with the NCAR MM model.

a The year 2013: NOx emission is 2.0×10¹² mol cm−2 s−1, and VOC emission is 7.3×10⁹ mol cm−2 s−1. b The year 2019: NOx emission is 1.3×10¹² mol cm−2 s−1, and VOC emission is 8.0×10⁹ mol cm−2 s−1.
3.1 Spatiotemporal variations in surface O3, PM2.5, AOD and TCNO2
Figure 2 shows a comparison of spatially distributed monthly means of the maximum daily hour average (MDA8) O3, 24 h average PM2.5, AOD and TCNO2 over eastern China in June between 2013 and 2019 derived from in situ and satellite observations. It is clear that NCP was the most polluted region with the highest values of MDA8 O3, PM2.5, AOD and TCNO2 over the past decade. The 24 h average PM2.5 concentrations were higher than 75.0 µg m−3 (the Grade II National Ambient Air Quality Standard, NAAQS defined for residential areas) at most of the monitoring stations across the NCP region in June 2013. The highest 24 h average PM2.5 reached to 766.0 µg m−3 and the corresponding AOD was 1.0. Compared to the well-established monitoring network of PM2.5, observational sites for O3 were pretty sparse except for the BTH, YRD and PRD across eastern China in 2013. While the TCNO2 was 2 times higher than that observed in North America (Stavrakou et al., 2008), exceedance events of the MDA8 O3 were not frequently observed across eastern China in 2013. PM2.5 was the major air pollutant in the NCP region during that time period.
PM2.5 concentrations, AOD and TCNO2 have been reduced substantially as a result of the implementation of a strict anthropogenic emission reduction policy in 2013. For instance, the monthly mean of PM2.5 concentrations decreased from 95.5 to 33.2 µg m−3 with a percentage reduction of 65 %. Monthly mean AOD was reduced from 1.0 in 2013 to 0.75 in 2019, indicating that PM2.5 continued to decrease at a rate of −10 % a−1 to −11 % a−1 which was similar to that during 2013–2017 (Li et al., 2019a). A similar decrease trend was seen in both TNO2 (Fig. 2g, h) and in situ NO2 measurements (Fig. S2). On the other hand, a rapid increase in surface O3 concentrations was observed in the NCP region over the past several years. The hot spots with MDA8 O3 higher than 75.0 ppb were extended to the entire NCP as well as the neighboring regions in 2019 (Fig. 2b). The highest MDA8 O3 reached 112.8 ppb in 2018, which was even higher than the level (110.0 ppb) observed in Los Angeles (Lin et al., 2017). Compared to the cases observed in 2017 (Li et al., 2019a, b), air pollution events with higher surface O3 became more severe and more frequent. The frequency of NAAQS exceedance events for surface MDA8 O3 (i.e., greater than 160 µg m−3) in June increased from 30 % in 2013 to 63 % in 2019. Here percentage represents the proportion of MDA8 exceedance days to a total of 30 d (i.e., June).
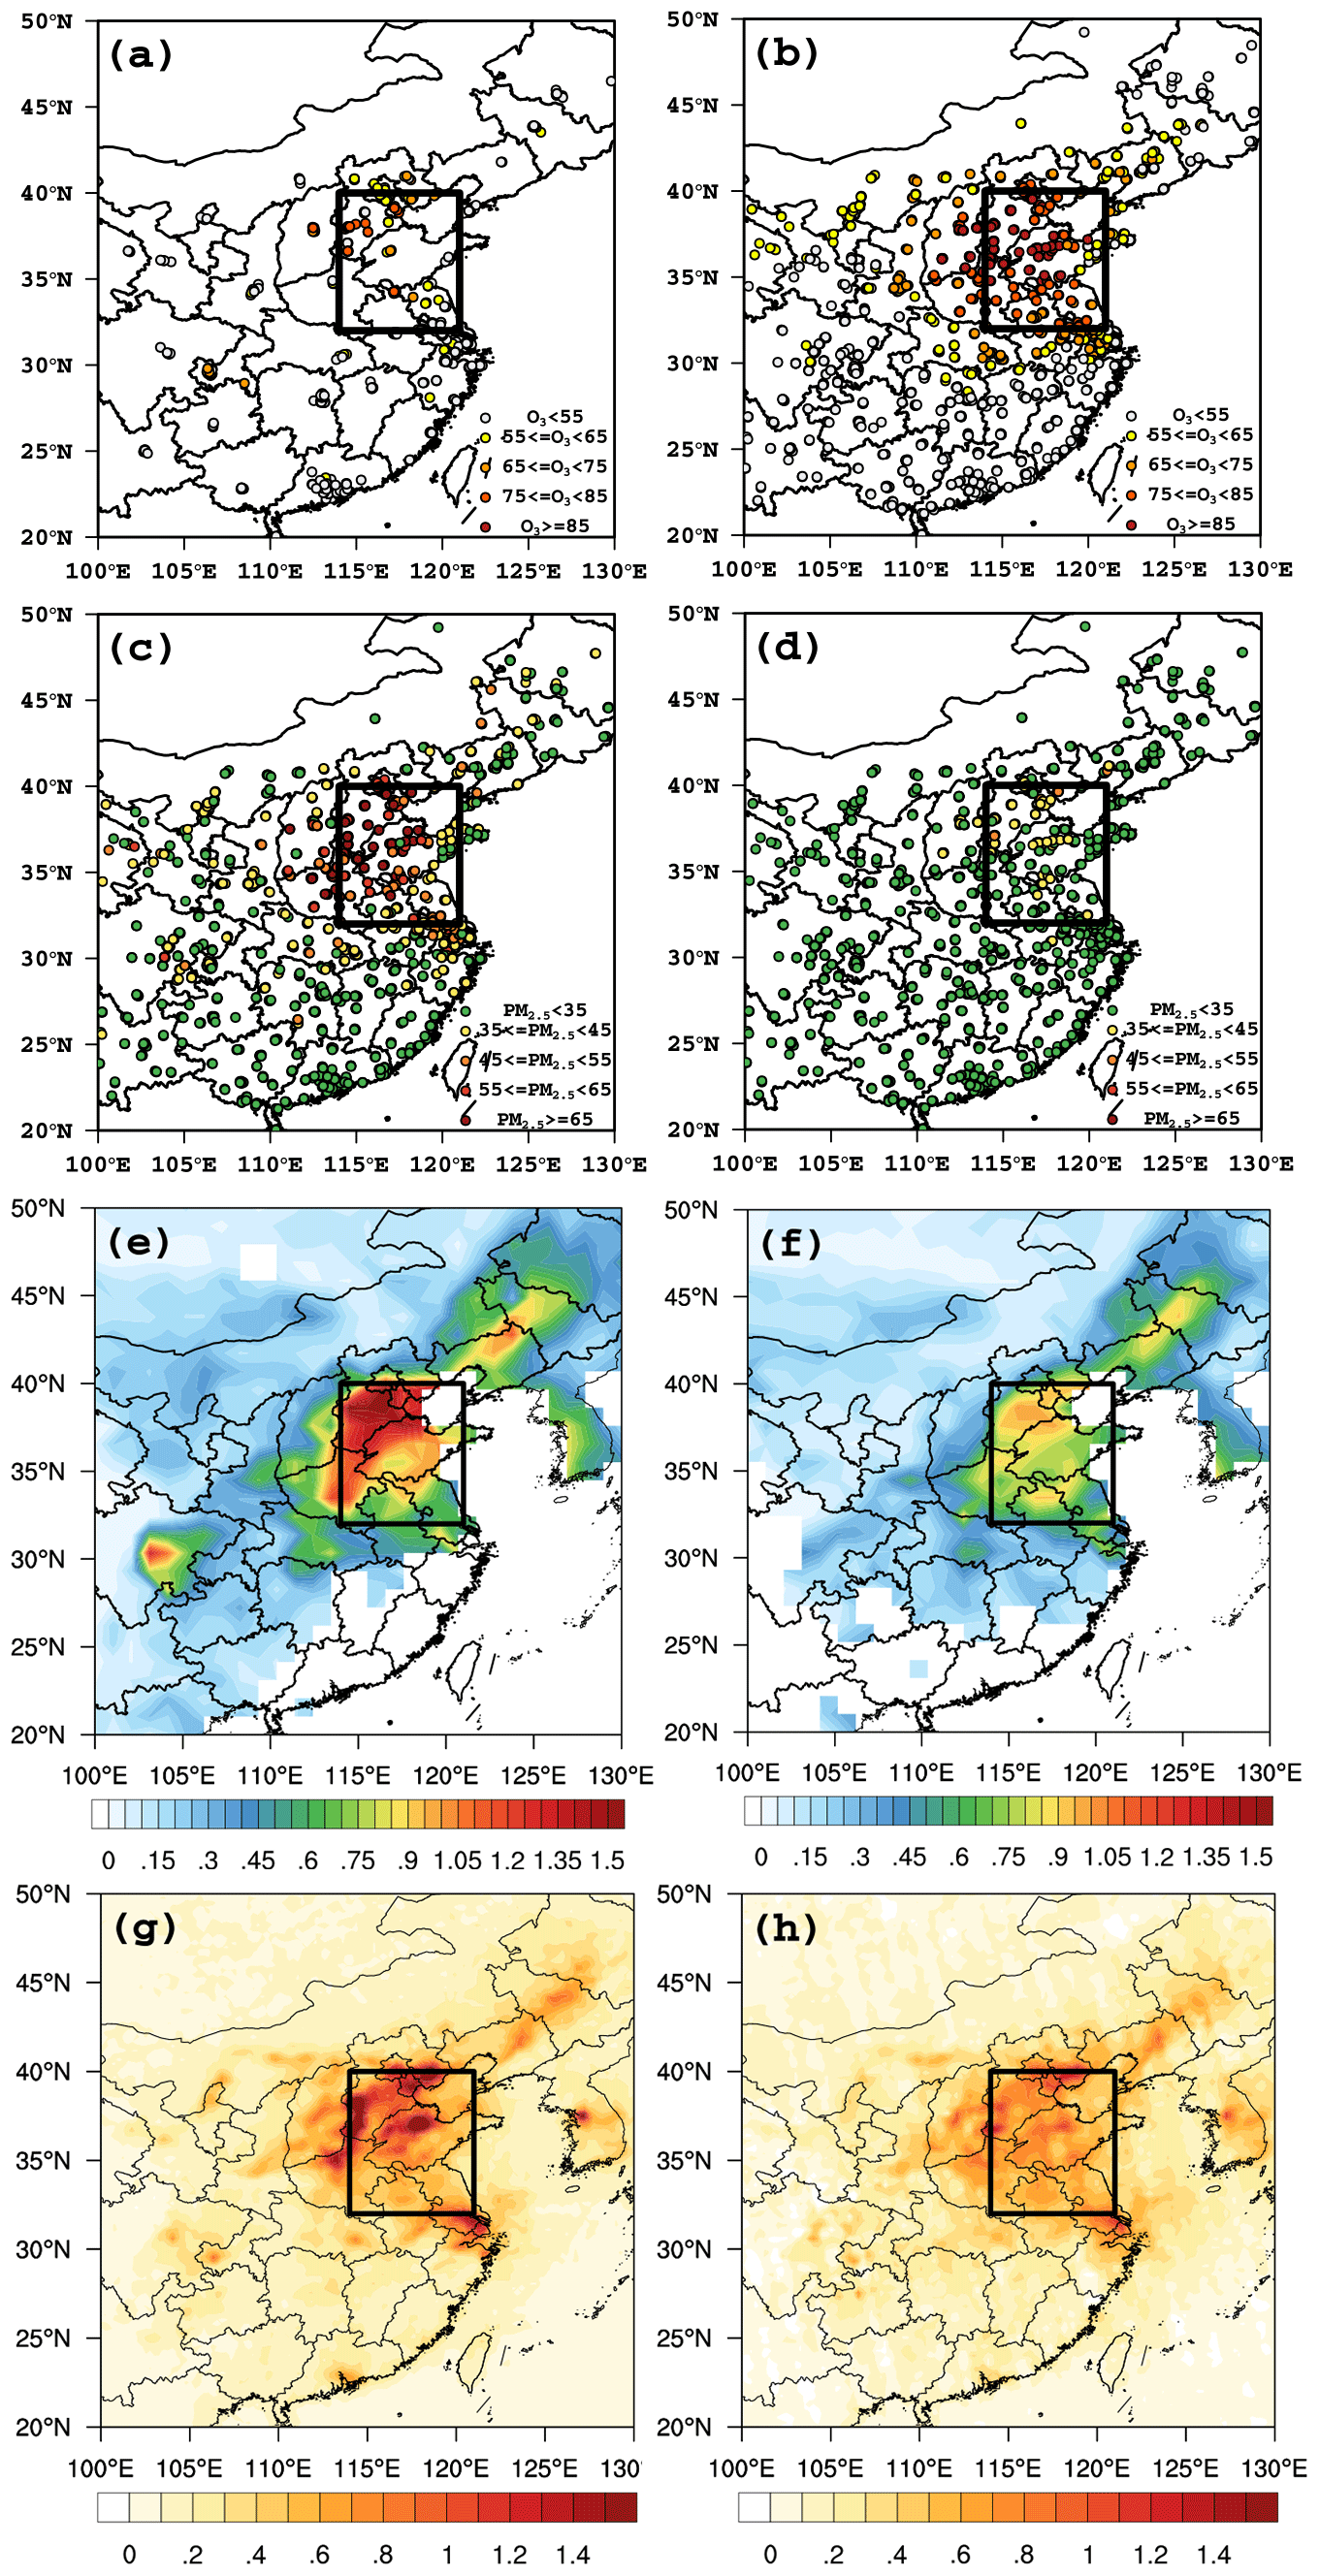
Figure 2A comparison of spatial distributions of monthly mean of MDA8 O3 (ppb) (a, b) and PM2.5 (µg m−3) (c, d) obtained from in situ observations, AOD (e, f) and tropospheric column of NO2 (TCNO2, 1016 cm−2) (g, h) derived from satellite observations between 2013 (in left column) and 2019 (in right column) in eastern China (NCP indicated by the box).
Reduction in NOx emissions and a slight increase in VOC emissions could be part of the reasons causing such an increase over the NCP region where O3 formation was dominated by a VOC-limited regime. To better understand the relationship of increase in surface O3 with the decrease in NO2, the change in monthly mean Ox (a sum of O3 and NO2) was plotted in Fig. S3. It is clear that Ox showed an increasing trend over the past 7 years during daytime and nighttime in both urban Beijing and the NCP region. Meanwhile, Li et al. (2019a) attributed the increase to the fact that removal of HO2 radicals was reduced and more O3 production was promoted. On the other hand, attenuation of UV radiation became less evident as PM2.5 or AOD continually decreased. Strengthening UV radiation may accelerate photolysis of NO2 and eventually lead to more O3 production. Importance of aerosol radiative effect in the increase in surface O3 via acceleration of photolysis of NO2 can be further evaluated through numerical experiments.
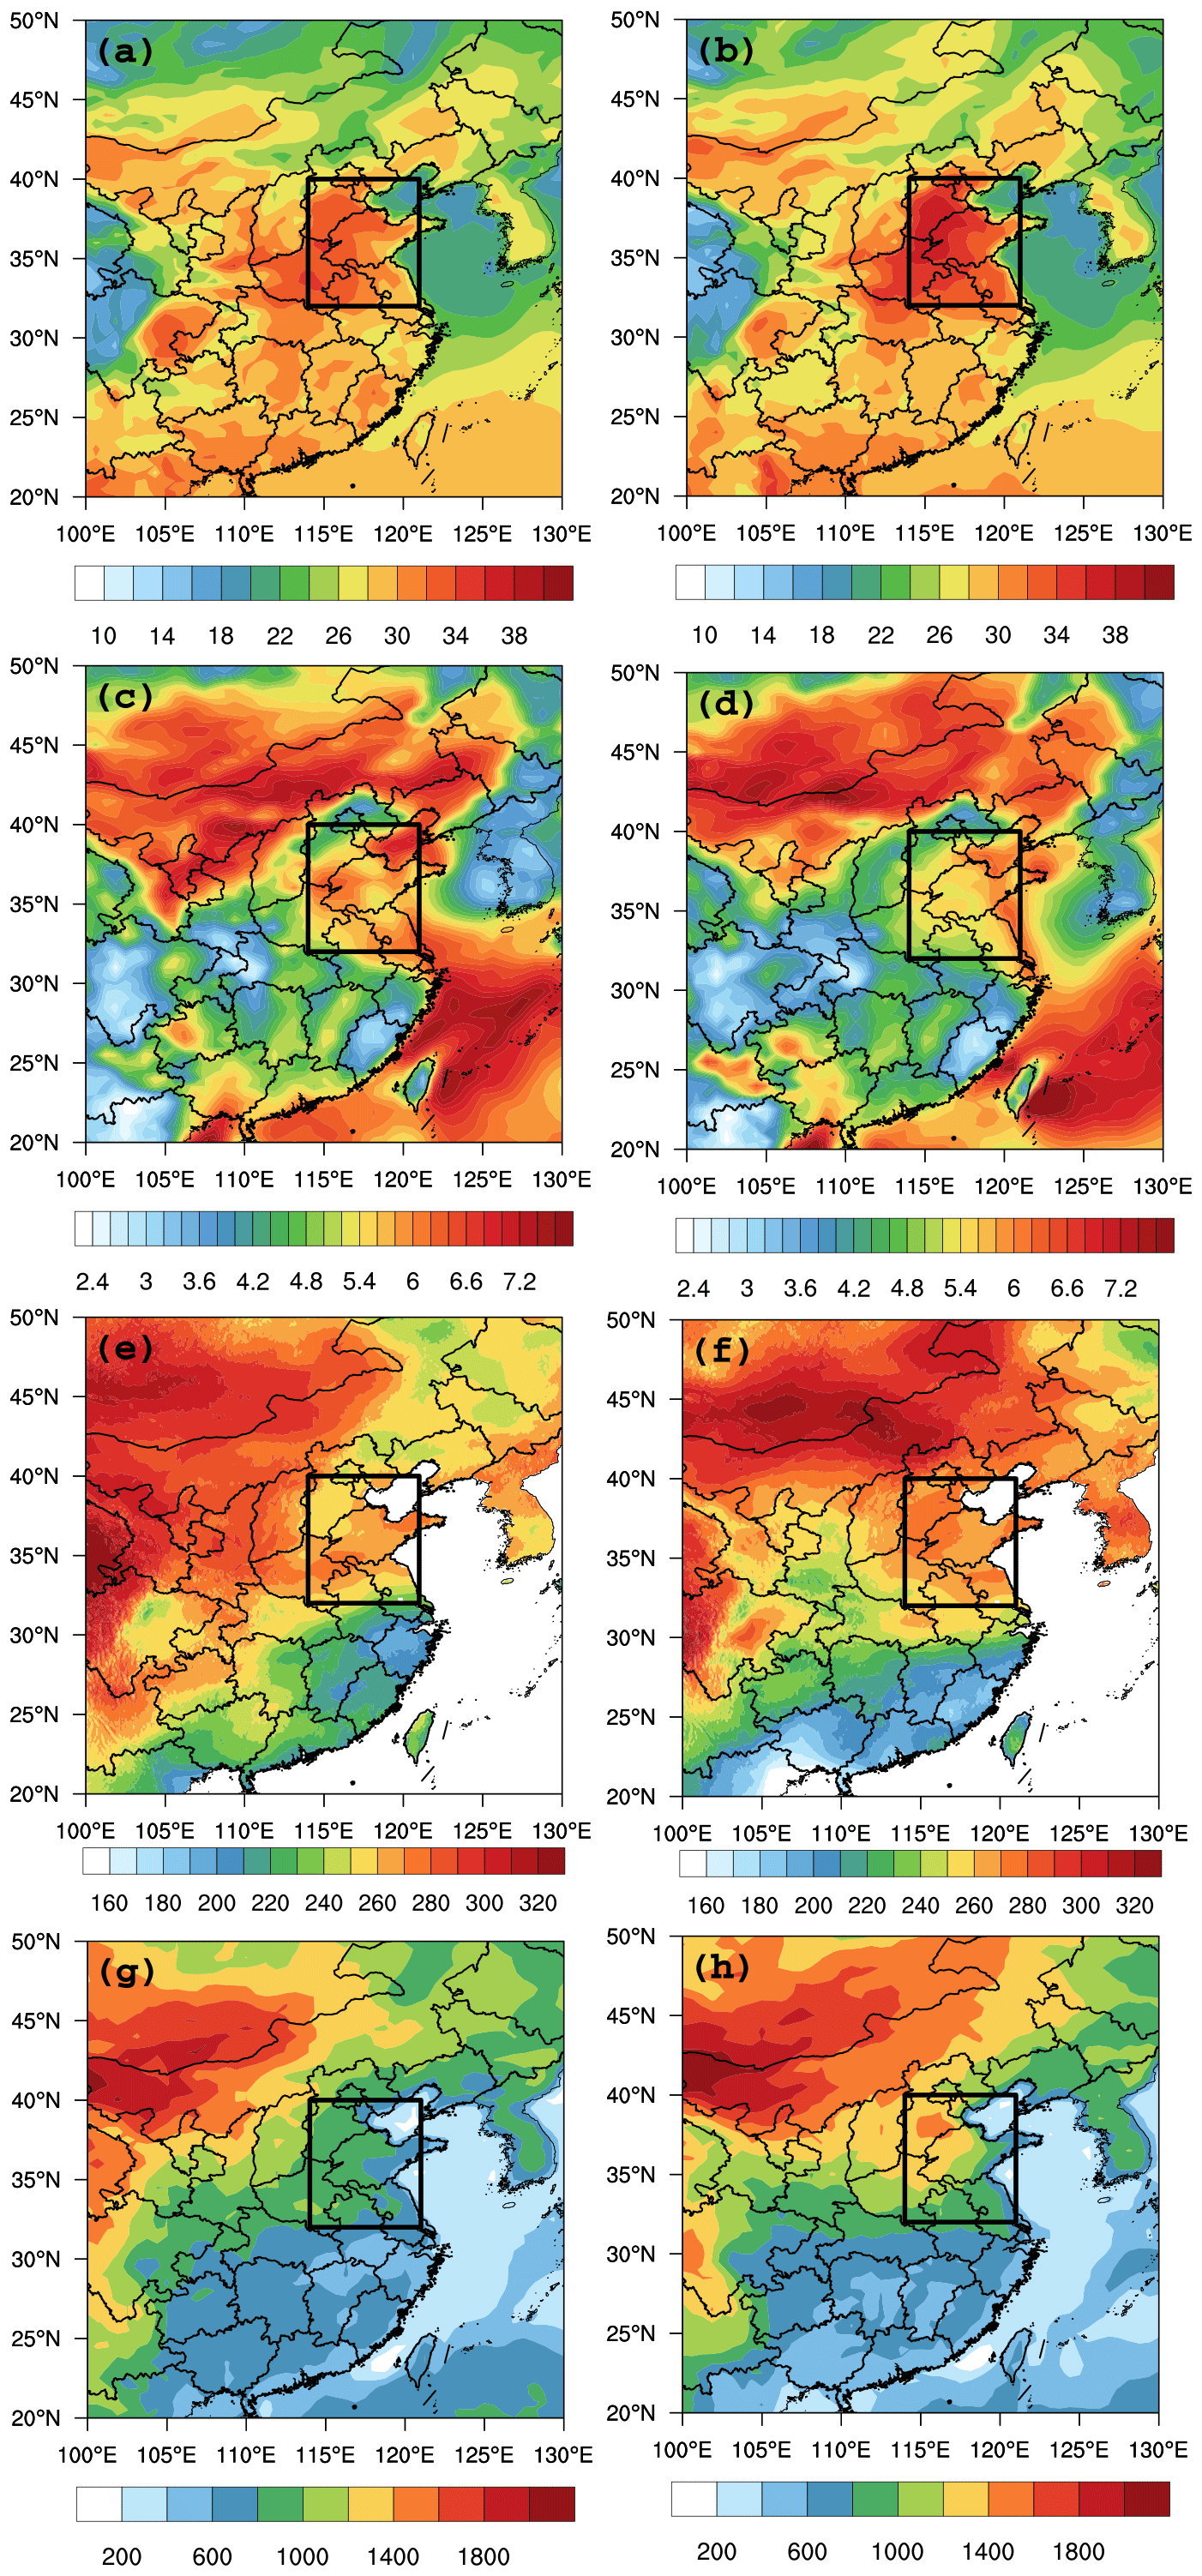
Figure 3A comparison of spatial distributions of monthly mean of T2 max (∘, a, b), wind speed (m s−1, c, d), surface-reaching shortwave radiation (W m−2, e, f) and PBLH (m, g, h) between 2013 (in left column) and 2019 (in right column) in eastern China (the NCP indicated by the box).
Meteorological conditions are another critical factor affecting O3 production. Typically, higher air temperature is responsible for higher photochemical reaction rates and more O3 photochemical production (Porter and Heald, 2019). As shown in Fig. 3, the NCP was the hottest spot region with T2 max which was about 4.0 ∘C higher than that in the neighboring regions. In addition, the increase rate of T2 max in the NCP was larger than that observed in other regions in eastern China. T2 max and surface-reaching shortwave radiation increased by 3 % and 7 %, respectively, over the past several years. In addition to human factors such as urbanization and industrialization, the decrease in aerosols (e.g., PM2.5 and AOD) could be an important factor driving such a rise in air temperature due to weakening aerosol radiative effect.
3.2 Yearly changes in surface O3 during 2013–2019 and driving factors
As presented above, NCP was the most polluted region with extremely high ambient levels of air pollutants. Surface O3 showed a rapid increase over the period from 2013–2019 while PM2.5 and other pollutants such as NOx experienced a significant reduction. O3 has become a major air quality concern in summer. June was the month with the highest monthly mean MDA8 O3 concentrations (Fig. S4). In this section, we attempt to investigate the yearly change rate and to identify the factors that drove such a large increase in surface O3 over the NCP region throughout the period of 2013–2019.
Figure 4 shows the yearly changes in monthly means of MDA8 O3, PM2.5, AOD, SSA, TCNO2, T2 max and PBLH over the NCP region in June from 2013–2019. The change in monthly mean of surface MDA8 O3 showed an opposite trend to that of PM2.5 concentrations and other air pollutants. A similar large change trend was seen in diurnal variation patterns (Fig. S5). The increase rate of monthly mean MDA8 O3 (4.6 ppb a−1) during 2013–2019 was much higher than that observed in the same region during the period of 2005–2015 (1.1 ppb a−1) (Ma et al., 2016) and other regions such as Mount Tai, the YRD, Hong Kong and North America where the changes were less than 2.1 ppb a−1 during the same time period (e.g., Sun et al., 2016; Gao et al., 2017; Wang et al., 2017; Xu et al., 2019). At the same time, a large decrease can be found from the time series of PM2.5, AOD, TCNO2 (Fig. 4b–d) and in situ NO2 measurements (Fig. S6). It is noted that SSA also showed a decreasing trend (Fig. 4e). Decrease in SSA was likely due to the fact that reduction of inorganic aerosols (e.g., sulfate and nitrate) was larger than that of carbonaceous ones (Zhang et al., 2020). Another noticed feature is that MDA8 O3 showed a decreasing trend in 2019 relative to 2018, which was opposite to that during 2013–2018 (Fig. 4a). It is worth paying attention to the change trend in the coming years.

Figure 4Long-term changes in monthly mean of (a) MDA8 O3, (b) PM2.5, (c) AOD, (d) TCNO2, (e) SSA, (f) T2 max and (g) PBLH averaged over the North China Plain in June over the period of 2013–2019.
To understand the factors driving the change in surface O3, a series of scatter plots are presented to examine the relationships between the surface MAD8 O3 and individual factors such as aerosol optical properties (i.e., AOD and SSA), TCNO2, T2 max and surface-reaching shortwave radiation over the past 7 years in June (Fig. 5). The values discussed here represent the monthly means. MAD8 O3 showed two different regimes with an opposite dependence of O3 formation on PM2.5 concentrations. The first regime showed a decrease trend with increasing surface PM2.5 when PM2.5 concentrations were less than approximately 140.0 µg m−3 whereas the second one showed no trend with increasing PM2.5 when PM2.5 concentrations were higher than 140.0 µg m−3. The first regime was highly related to aerosol radiative effect, which has been discussed above. For the second regime, the impact of aerosol radiative effect on surface O3 photochemical production seemed very minor or even negligible. Instead, O3 production was suppressed significantly and MAD8 O3 concentrations were less than 20.0 ppb. In this case, removal of surface O3 through titration of NO was not effective and surface O3 showed an increase rather than a decrease trend with increasing NOx concentrations under the strong NOx conditions as indicated by TCNO2 higher than 40–45×1015 (cm−2) in the troposphere. Here the threshold value of 140.0 µg m−3 represents an observed reality in this region but it needs to investigate whether such a threshold value exists in other regions.
Figure 5d–e further demonstrate the critical role of meteorological factors in change of surface O3. MDA8 O3 showed a near-linear increasing trend with increasing T2 max and surface-reaching shortwave radiation with respective linear regression correlation coefficients of 0.88 and 0.93. Increase in T2 max and strengthening shortwave radiation caused by decrease in PM2.5 (a proxy of aerosols) played a positive role in driving the increase in surface O3 in the NCP region. On the other hand, MDA8 O3 showed a decreasing trend with 10 m wind speed (Fig. 5f). That may explain why improvement of stagnation atmospheric conditions may alleviate severity of surface O3 pollution to some extent. The positive correlation between the PBLH and O3 shown in Fig. 5g represents one case when radiation is stronger and temperature is higher, which is favorable for O3 formation. Meanwhile, higher PBLH could enhance the transport down of O3-enriched air aloft, resulting in an increase in surface O3 (Reddy et al., 2012). On the other hand, some studies found a negative correlation between the PBLH and O3. They claimed that a shallower PBL may suppress the dispersion of pollutants and lead to higher O3 (Yan et al., 2018; Jiang et al., 2015; Wei et al., 2016; Huang et al., 2005)
Enhancement of UV radiation resulting from reduction in surface PM2.5 represents an important mechanism in driving the increase in surface O3 concentrations. It can be further illustrated by Fig. 6. While UV radiation displays a nonlinear decreasing trend with surface PM2.5 concentrations, surface O3 (hourly) shows a near-linear increasing trend with surface-reaching UV radiation. UV radiation attenuation approaches a constant with a value of 0.1–0.3 MJ m−2 when surface PM2.5 concentrations reach around 300 µg m−3 or above.
Analyses presented above demonstrate that all the exceedance events of MDA8 are observed under conditions with PM2.5 less than 60 µg m−3, TCNO2 of equal to or less than 5.0×10¹⁵ (cm−2), T2 max higher than 28.0 ∘C and surface-reaching shortwave radiation stronger than 250.0 W m−2. Reduction in aerosols (e.g., surface PM2.5 as a proxy) concentrations may strengthen UV radiation, increase T2 max and eventually promote more surface O3 production.
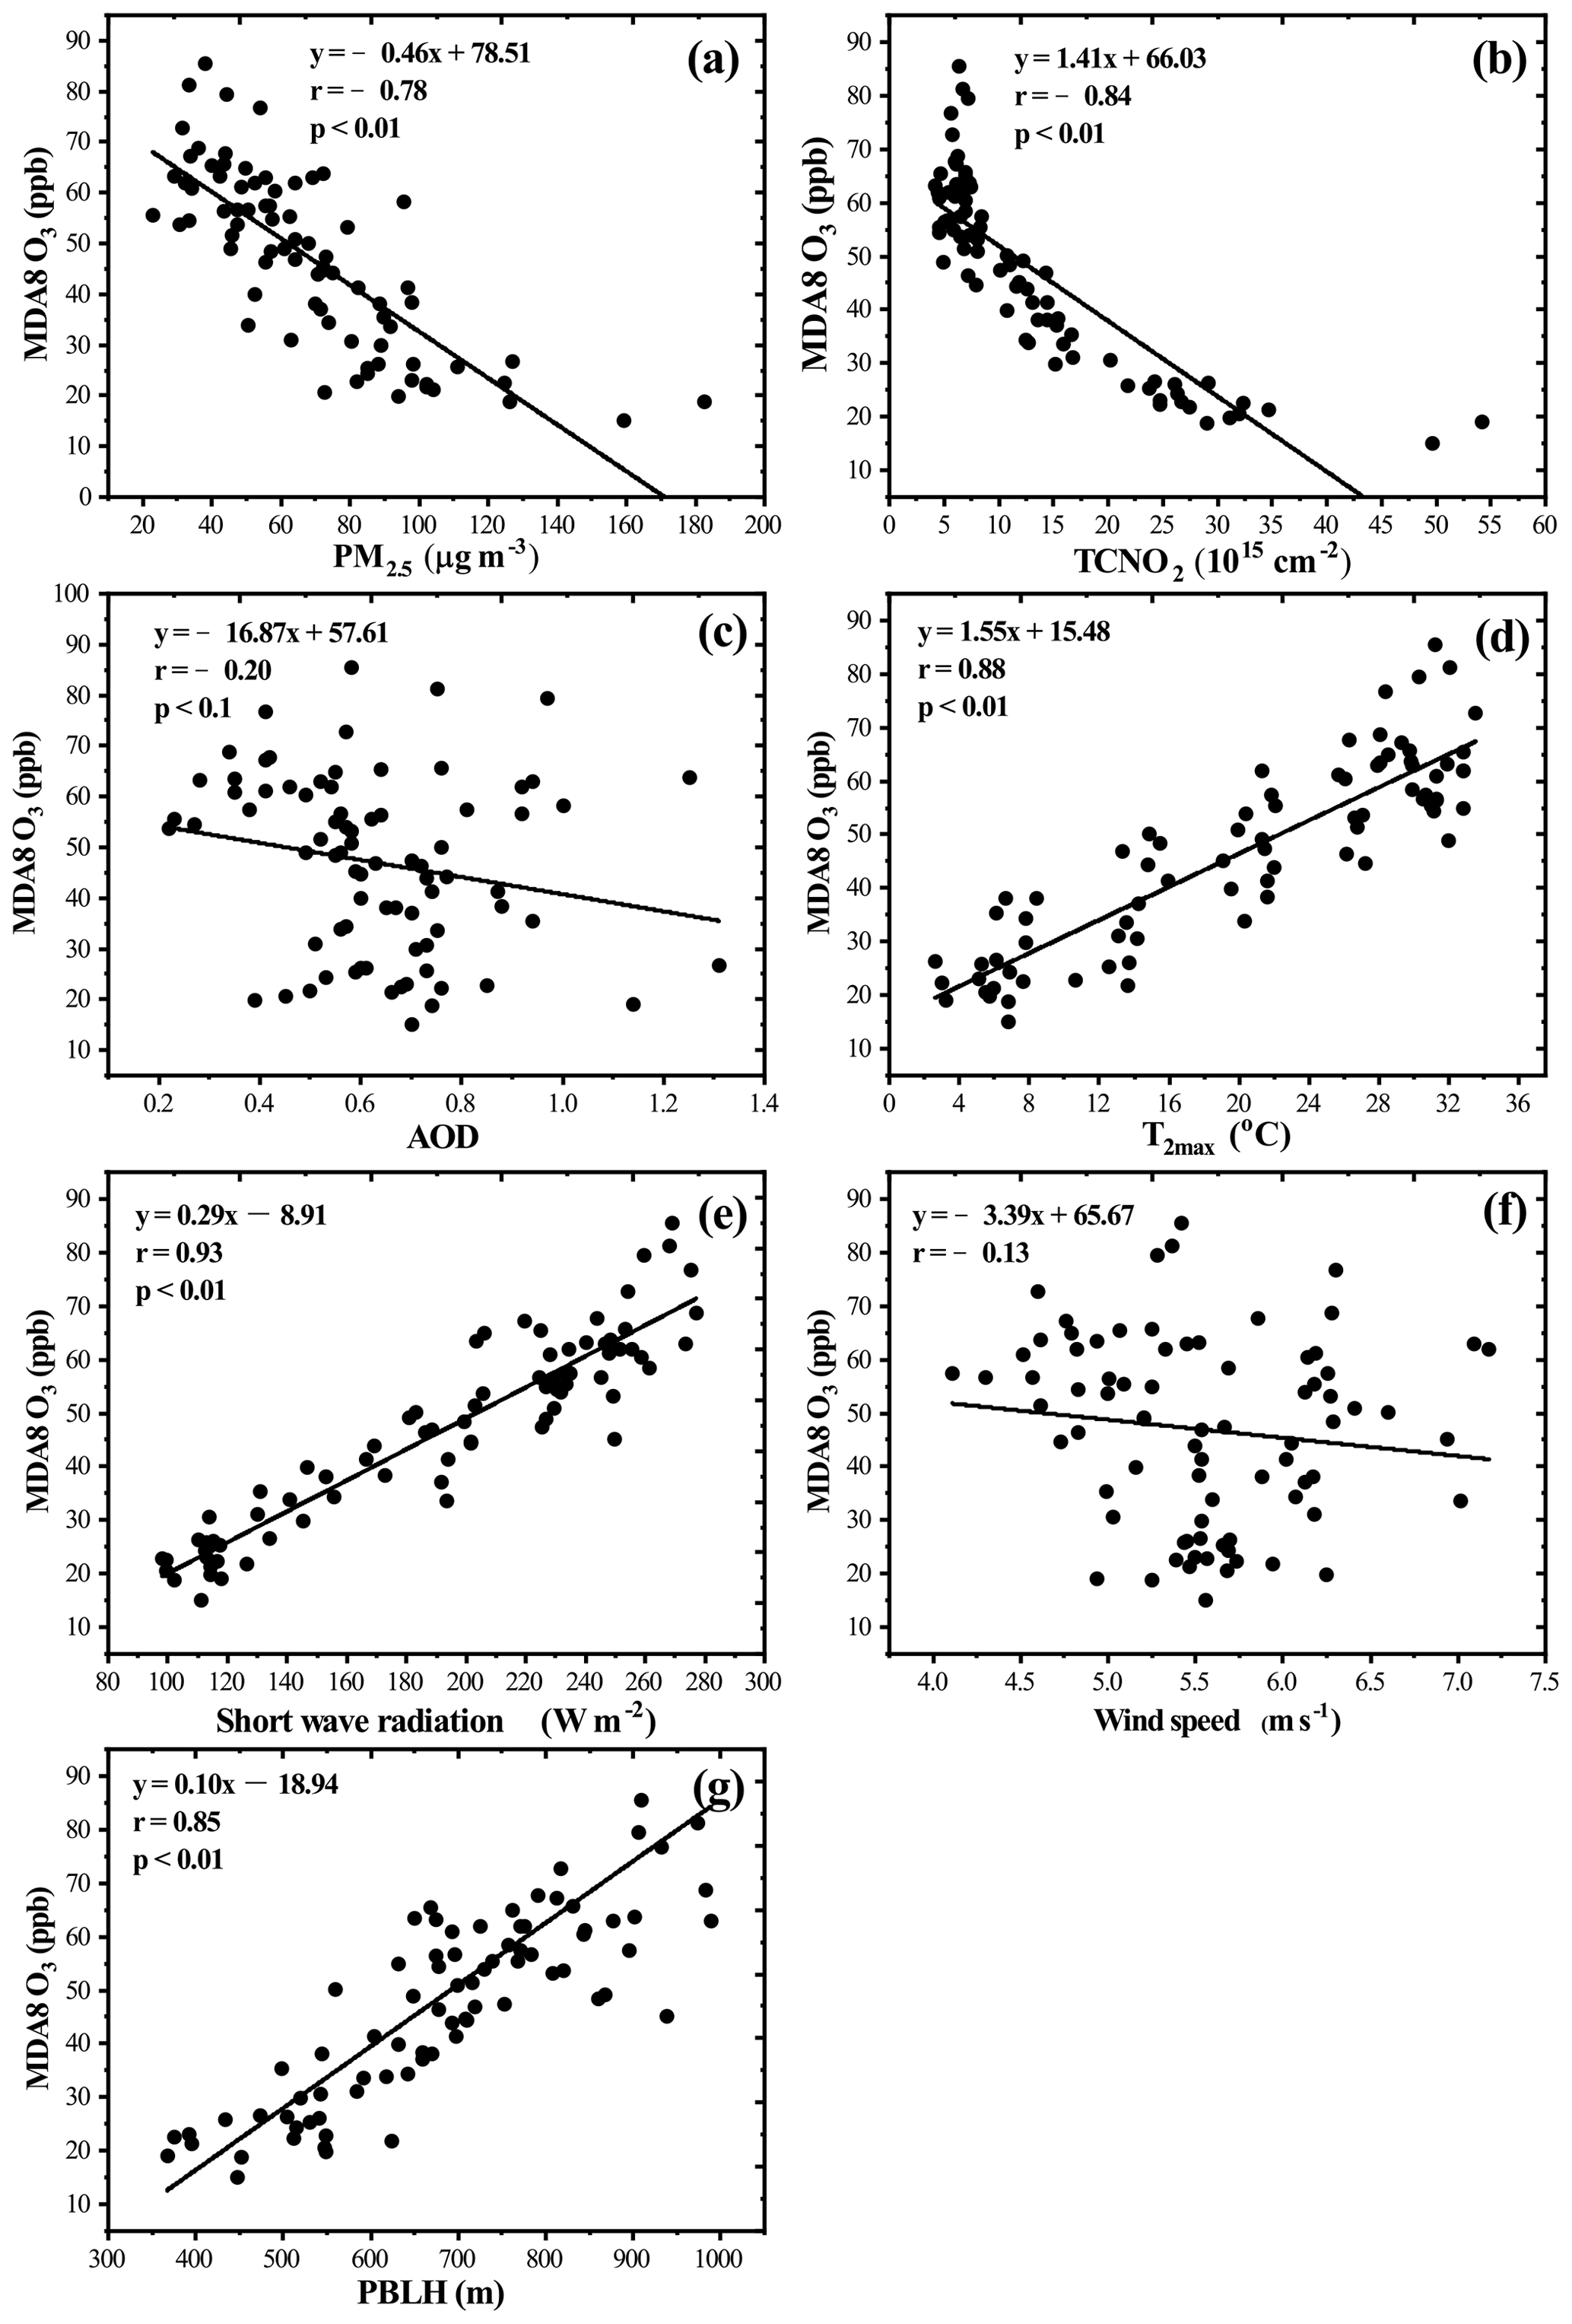
Figure 5Response of MDA8 O3 to (a) PM2.5, (b) TCNO2, (c) AOD, (d) T2 max, (e) shortwave radiation, (f) wind speed and (g) PBLH observed in the NCP region, China, during 2013–2019.
3.3 Relative contributions of different driving factors to increase in surface O3
In this section, the box model MM is utilized to quantify the relative contributions of individual driving factors to the increase in surface O3 over the NCP region during 2013–2019. A simulation–observation comparison is presented to evaluate the performance of the MM model on simulations of surface O3 (Fig. 7), of which the O3 observations averaged over all the stations in NCP are considered to be the standard observed concentrations. The simulated O3 peak was about 1 h later than the observation, which was likely due to uncertainty of emission inventory and other meteorological factors. Overall, the MM model was able to mimic the observed variation pattern and peak value as indicated by the correlation coefficient of 0.95 between simulated and observed O3.
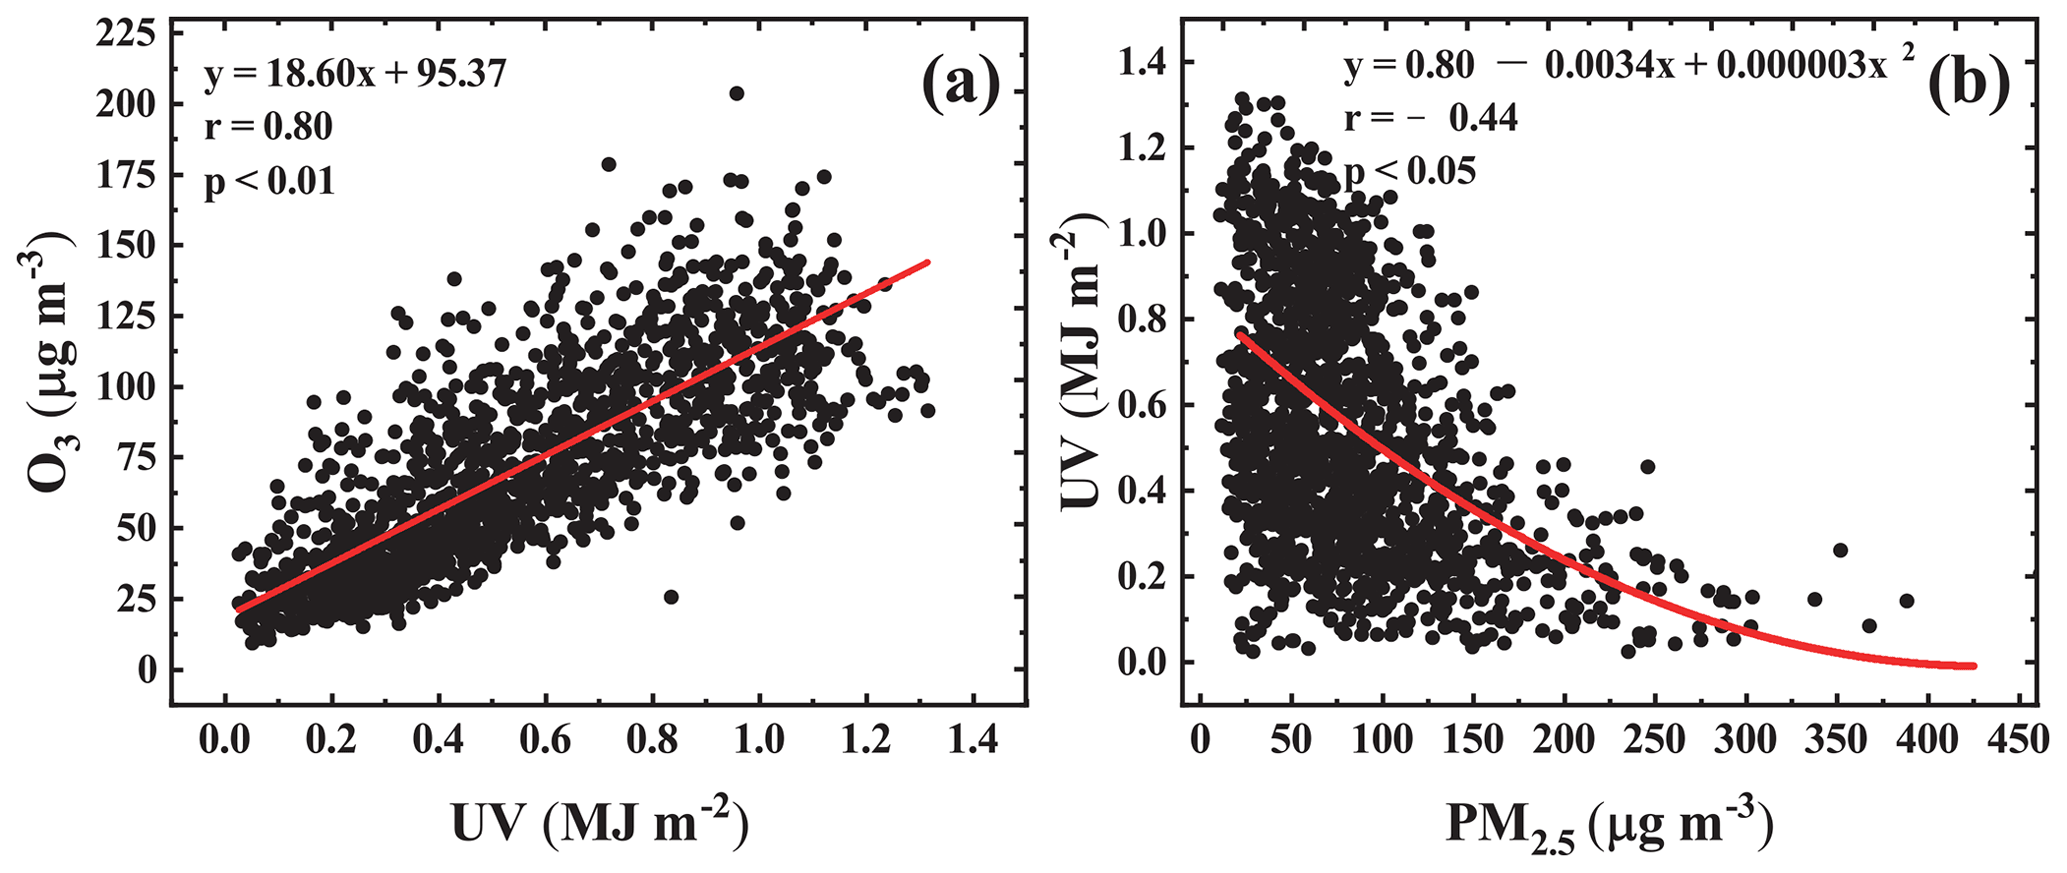
Figure 6(a) The relationships of surface O3 concentrations (hourly) with (a) UV radiation and (b) UV radiation with PM2.5 concentrations based on the observations at the Yucheng site during the time period of 08:00–17:00 LT in June 2013–2016.
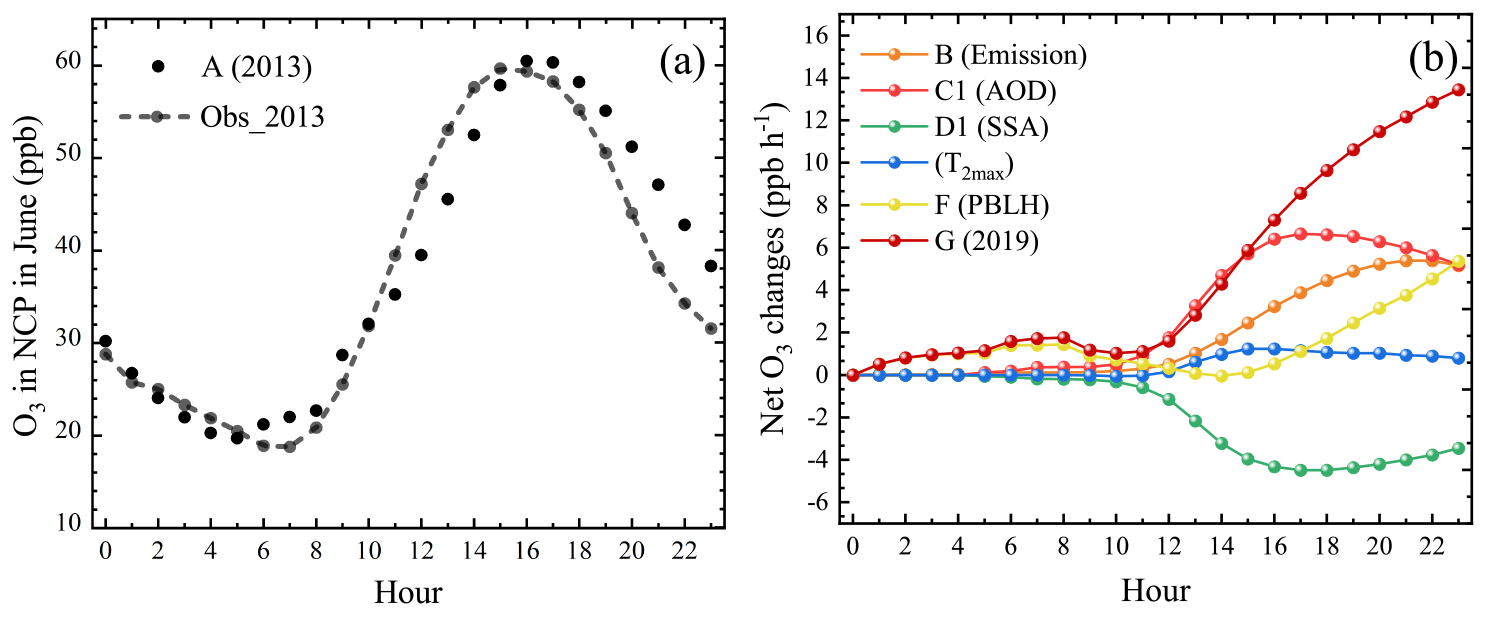
Figure 7Comparisons of (a) regional averaged surface O3 observations in the NCP and simulated surface O3 (A, control case) and (b) simulated net changes in O3 among different driving-factor conditions.
A series of numerical experiments were then completed with the MM model to quantify the relative contributions of anthropogenic emissions (i.e., NOx and VOCs), AOD, SSA, air temperature and PBLH to the change in surface O3 over the NCP region during 2013–2019. The results are presented in Table 2. The changes in emissions of O3 precursors (i.e., NOx and VOCs) (i.e., Case B) and decrease in AOD (i.e., Case C1) were the two major contributors with their respective positive contributions of 45 % and 70 % to the increment in surface O3. But increase in surface O3 associated with AOD reduction was largely offset by the reduction in SSA. Moreover, air temperature played a non-negligible role, and the increase in T2 max accounted for 12 % of surface O3 enhancement (Case E). Meanwhile, the increase in PBLHs also contributed about 18 % to the increment in surface O3 (Case F). As indicated by Case G, the combined effect by multiple factors was larger than the simple summation of individual factors' contributions, or the total percentage of contribution by an individual factor was less than 100 %. This is likely due to the fact that O3 production is not the linear function of an individual factor's contribution. Complex interplay among different factors may account for the rest of the increase (i.e., 2 %).
It is not surprising that reduction in NOx emissions brought about an increase in surface O3 since O3 formation was dominated by a VOC-limited regime in most parts of the NCP region. Several numerical experiments were conducted to understand the mechanism of reduced PM2.5 or AOD facilitating the increase in surface O3. It is known that photolysis rate of NO2, j(NO2), plays a critical role in O3 formation. The parameter j(NO2) was highly dependent on aerosol optical properties such as AOD and SSA, as well as solar zenith angle (θ) (Dickerson et al., 1997). As shown in Fig. 8a, decreasing AOD was conducive to photolysis of NO2 due to reduction of attenuated UV radiation entering the PBL. However, weakened scattering or strengthened absorption property of aerosols (i.e., reduced SSA) may attenuate the UV entering the PBL, deaccelerating photolysis of NO2. Thus, decrease in SSA may counteract the impact associated with decrease in AOD, which may slow down the increase in surface O3 to some extent. In addition, j(NO2) showed the highest value at noontime ( or sec (θ)=1) and tended to decrease when θ became larger (i.e., early morning or late afternoon). Figure 8b further demonstrates that O3 formation or MDA8 O3 showed a near-linear increasing trend with j(NO2). While decrease in PM2.5 concentrations or AOD strengthened the UV amount entering the PBL, reduction in SSA may counteract the impact of decreased AOD partially. But impact of AOD outpaced that of SSA. Thus, surface O3 (e.g., MDA8 O3) still showed a large increase with the combined effect of AOD and SSA over the past several years.
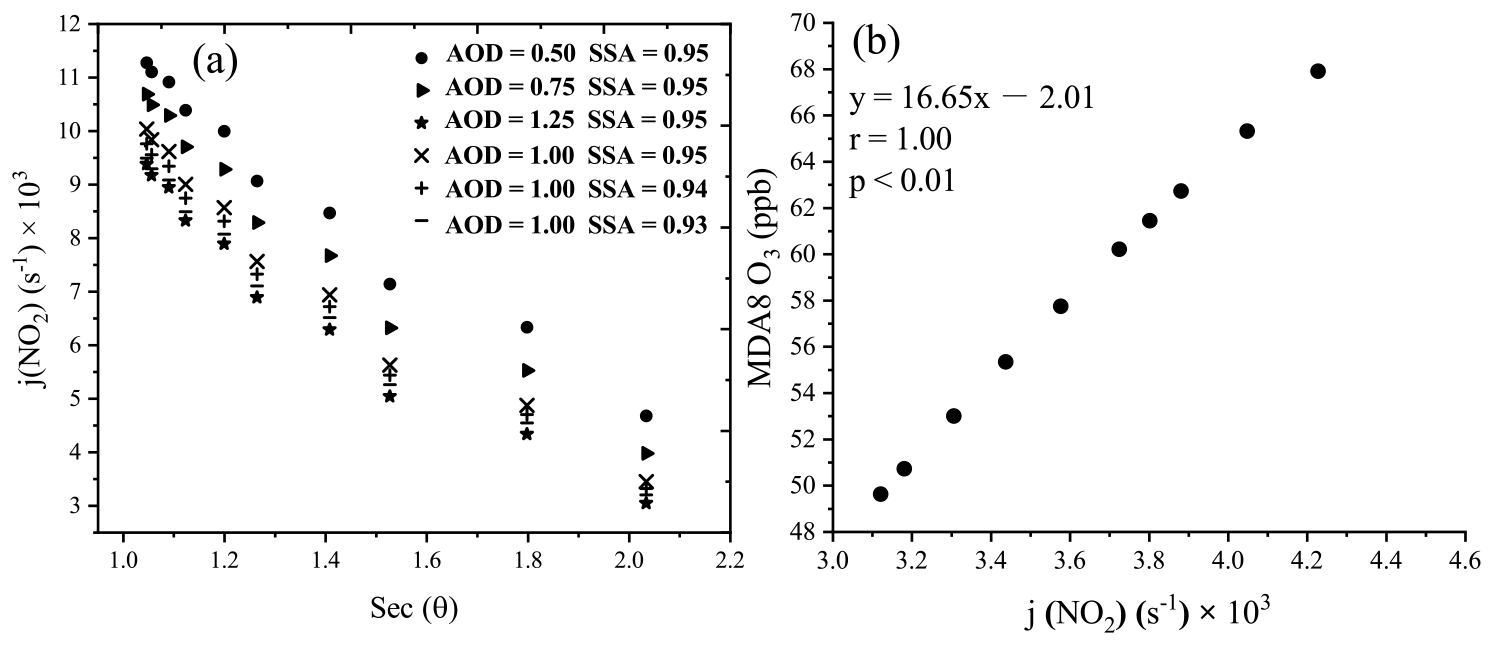
Figure 8(a) Response of photolysis rate of NO2, j(NO2), to different values of aerosol optical depth (AOD) and single-scatter factor (SSA) and (b) change in MDA8 O3 with j(NO2) simulated by the MM model for the cases with SSA = 0.95 and AOD varying from 0.5 to 1.25.
Now let us turn our attention to O3 chemistry in the varying polluted regions. As illustrated in Fig. 9, HO2 radicals were sensitive to aerosol properties (i.e., AOD and SSA) but the sensitivity was highly reliant on the solar zenith angle (θ). The HO2 radical was more sensitive to AOD or SSA in the afternoon than in the morning while photolysis rate of HO2 is more sensitive to AOD or SSA. It is noted that higher net O3 production is highly associated with the faster decrease in j(O3) than j(NO2) in the afternoon (Gerasopoulos et al., 2006). HO2 radical abundance reduced as aerosol optical property became more absorptive. This indicates that decrease in SSA may cause reduction of HO2, less NO2 and then less O3 production. The HO2 peak hour was matched well with that of the O3 peak (around 15:00 LT), further confirming its important role in O3 formation. Decrease in AOD may accelerate production of HO2 radicals or slow down their sink, which was conducive to production of NO2 (Li et al., 2019a) but decrease in SSA may offset its impact if aerosols show strong absorption properties. Meanwhile, strengthened UV associated with weakened aerosol radiative effect was conducive to photolysis of NO2. As a result, more O3 is produced. This accounted for a substantial increase in surface O3 while PM2.5 decreased over the past several years (2013–2019). The results are consistent with the findings by Li et al. (2019a).
Table 2Relative percentage contributions of emissions (Case B), AOD (Case C1), SSA (Case D1), air temperature (Case E) and PBLH (Case F) to the change in MDA8 O3 over the NCP region during 2013–2019.
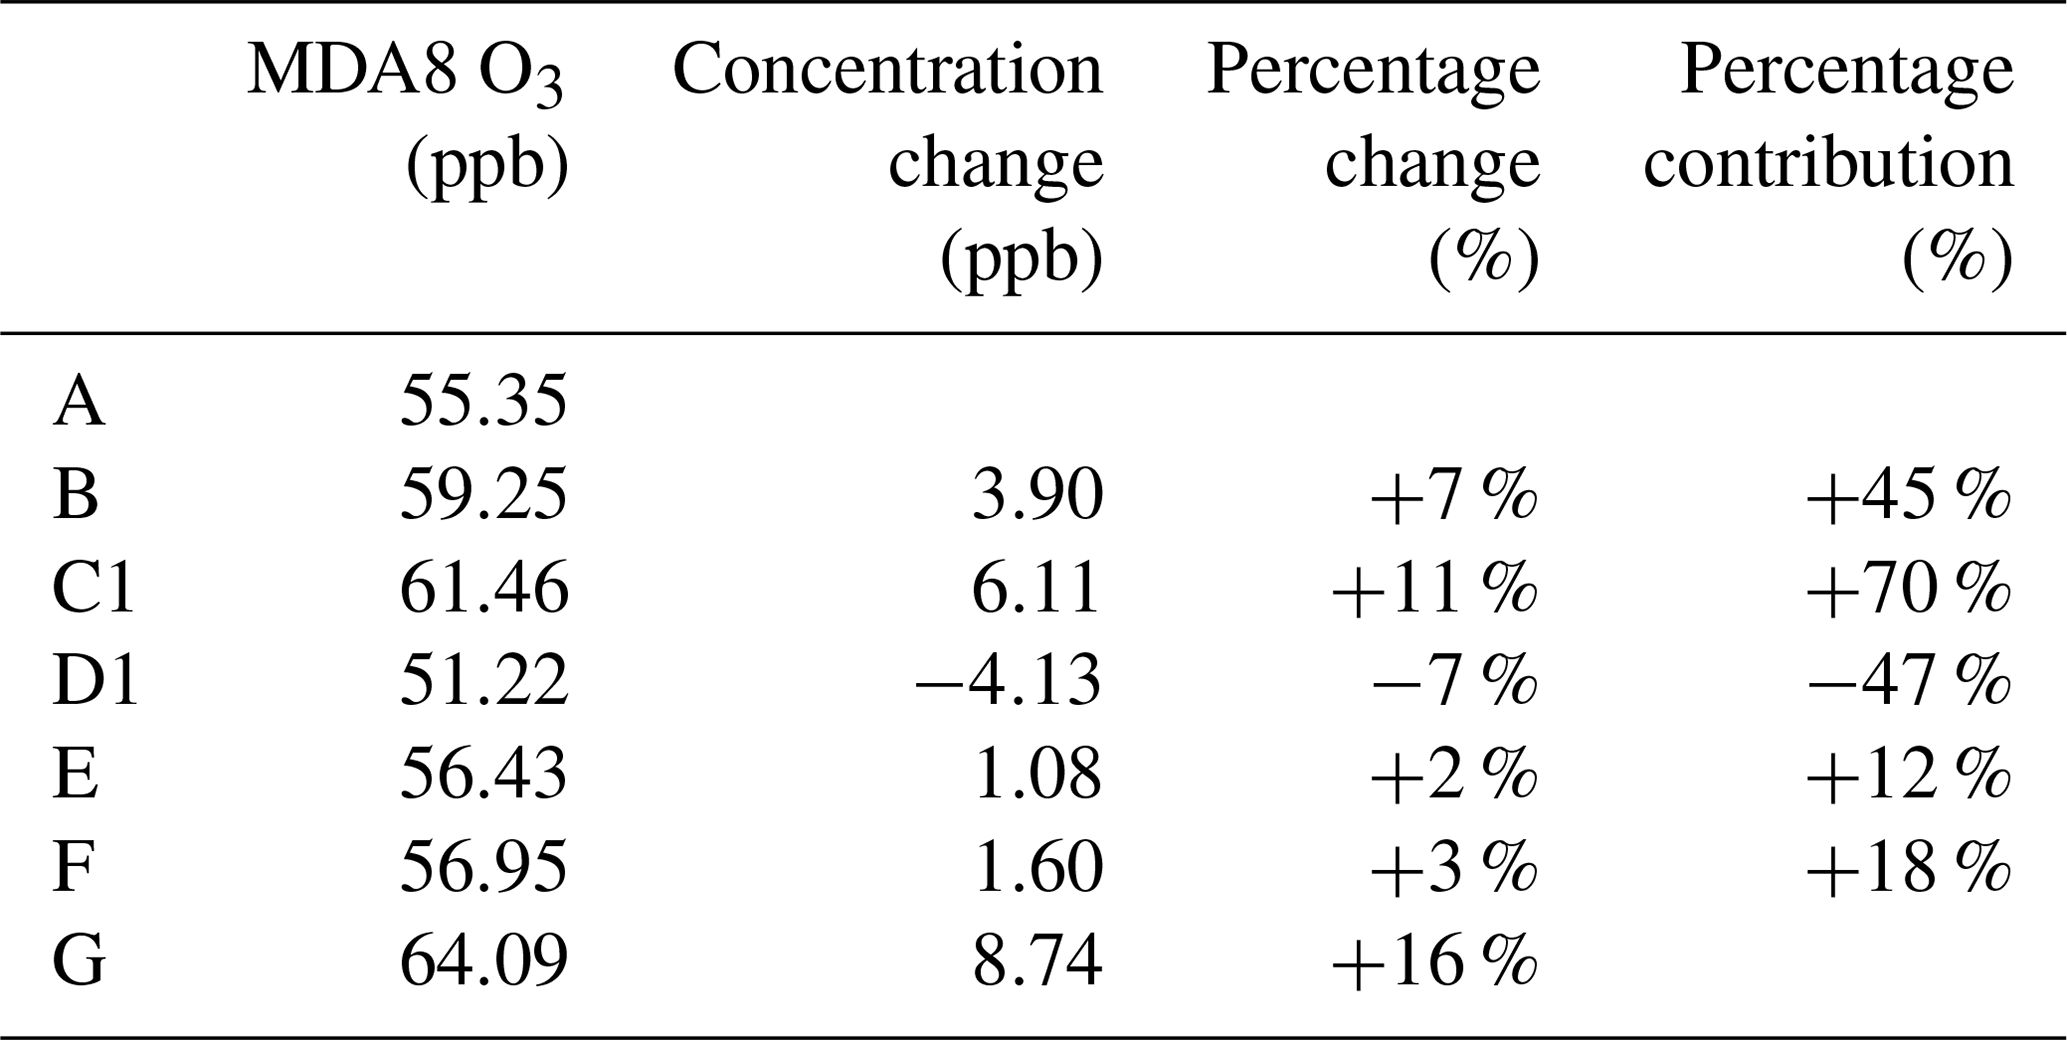

Figure 9Response of concentrations of HO2 to different values of aerosol optical depth (AOD) and single-scatter factor (SSA).
In this study, a box model NCAR MM with the detailed NOx–VOC–O3 chemistry included is utilized to quantify percentage contributions of emissions, aerosol optical properties and meteorological variabilities to increase in surface O3 over the NCP region during 2013–2019. The findings may provide more scientific evidence to policy makers on developing more effective control strategies on reduction in ambient levels of O3 as well as exceedance events. However, several points deserve further discussions.
First, the impact of aerosol radiative effect on surface O3 formation is dependent on not only aerosol abundance (i.e., AOD) but also aerosol scattering and absorption properties (i.e., SSA). Their impacts can be offset to some extent when AOD and SSA show the same change trend (either increase or decrease) or can be strengthened substantially when both AOD and SSA show an opposite change trend. Here the study on the NCP region represents the first case since both AOD and SSA showed a decrease trend over the past several years. Even so, the combined impact of aerosol radiative effect due to reductions in AOD and SSA still contributed 23 % of the total change in surface O3 in the NCP over the past several years. This reminds us that the impact of aerosol radiative effect could be more substantial if both AOD and SSA show an opposite change trend. Moreover, compared to impact of change in AOD on surface O3 formation (e.g., Dickerson et al., 1997; Wang et al., 2016a; Xing et al., 2015, 2017), studies on impact of change in SSA on surface O3 formation are fewer (Dickerson et al., 1997; Mok et al., 2016). Thus, changes of individual aerosol radiative property parameters must be addressed carefully in order to present more accurate quantification of impact of aerosol radiative effect on change in surface O3.
Second, the MM model does not include aerosol chemistry. As presented above, the MM model as a box model with the detailed O3–NOx–VOC relationship allows us to quantify relative contributions of individual factors to increase in surface O3. Overall, the model results are comparable to those using three-dimensional (3D) chemistry and transport models (CTMs) (e.g., Liu and Wang 2020a, b). For instance, the MM model result indicates that 45 % of increase in surface O3 was attributed to reduction of anthropogenic emissions of NOx in the NCP region during 2013–2019, which fell in the range of the results with 3D CTM. Among the 3D modeling studies, Li et al. (2019a) found that anthropogenic emissions contributed about 10 % of change in surface O3 in summertime from 2013–2017, and Sun et al. (2019) showed the percentage contribution of anthropogenic emissions was 63 % over eastern China. However, there is some substantial difference between the MM model result and that of 3D CTMs in terms of percentage contribution of aerosol radiative effect to changes in surface O3. The MM model showed that aerosol radiative effect was ranked as the second contributor to the change in surface O3 in this region. The percentage contribution was larger than that presented by other studies (Li et al., 2019a; Xing et al., 2015). This is partly because this study is focused on the impact on MDA8 O3 whereas their studies investigated the impact on diurnal variations in surface O3. In addition, Li et al. (2019a, b) and Liu and Wang (2020a, b) pointed out that aerosol chemistry played the most important role in the enhancement of surface O3 in this region through modification of HO2 radicals that produce additional O3 formation. However, the MM model does not include aqueous-phase chemistry that has been implemented in the 3D meteorology–chemistry models (e.g., Li et al., 2019a; Liu and Wang, 2020a, b), which could be another possible reason for the response to such a difference. Thus, inclusion of detailed aerosol chemistry and observation-based uptake coefficients in a box model like MM is necessary to provide more accurate assessment of the impact of aerosol radiative effect on surface O3 change.
Third, compared to 3D meteorology–chemistry coupling model(s), the box model does not include complex physical processes such as regional transport, vertical transport, cloud formation, etc. The influence of changing meteorological factors on the change trend in surface O3 may vary greatly with regions and time. In addition to air temperature and the boundary layer conditions, other meteorological factors such as cloud cover, precipitation, wind fields played an important role in driving the changes in surface O3 observed in many places in China (Liu and Wang, 2020a). Computational resource and workload that a box model requires are much less than those that a 3D chemical transport model needs. This may allow us to complete a series of designed numerical experiments to quantify the roles of individual factors easily with limited computational resources. It is acceptable to use a box model if terrains are relatively flat in the box, horizontal gradients of emissions and air pollutant concentrations are not strong, and transport in and out reaches a relative equilibrium state. As shown in Figs. S1 and 2, the NCP region defined in this study represents the most polluted part in eastern China; anthropogenic emissions appear to distribute relatively uniformly across the region. To this extent, it is appropriate to examine O3 formation and its response to changes of different factors such as emissions, meteorological conditions and aerosol radiative properties by using a box model in the NCP region. However, some other physical processes such as long-range transport may exert an important impact on change in surface O3 (e.g., Han et al., 2018; Gaudel et al., 2018). It is reiterated that the box model results present an ensemble-mean behavior for the given box but need further evaluations by using a complex meteorology–chemistry coupling model such as the Weather Research and Forecasting model with Chemistry (WRF-Chem).
Furthermore, some other important factors may exert an important impact on surface O3 concentrations, but they are not discussed in this study. Stratospheric intrusion and change in tropospheric O3 could exert an important impact on O3 in the atmospheric boundary layer (ABL) and near surface. For instance, Jiang et al. (2015) presented a factor analysis on an O3 episode observed in the southeast coastal area of China and found that the downward transport of O3 from the upper troposphere–lower stratosphere (UTLS) region driven by a typhoon was the key factor causing a large increase in surface O3 by 21–42 ppb. Thus, the impact of tropospheric O3 should be taken into account when the appropriate observational data are available in the NCP region. Another factor is synoptic patterns. As an example, high concentrations of surface O3 or O3 episodes that occurred in the western Mediterranean and central Europe were usually linked with an anticyclone synoptic pattern which led to large-scale subsidence, clear sky and high temperature (e.g., Kalabokas et al., 2013, 2017). In addition, Yin et al. (2019) found that synoptic patterns played a critical role in summer O3 pollution events in eastern China. Under the control of the zonally enhanced East Asian deep trough, the local hot, dry air and intense solar radiation enhanced the photochemical reactions and produced more O3. The inter-annual magnitude variations in the domain synoptic patterns may have an important impact on surface O3, and their impact on the long-term change in surface O3 needs further investigation.
In this study, 7-year-long surface observational air quality data are presented together with satellite retrieval measurements of TCNO2, AOD and SSA to investigate long-term change trends of surface O3 over the NCP region in summer from 2013–2019. A comprehensive statistical analysis is completed to explore the relationship of MDA8 O3 with PM2.5 concentrations, tropospheric columns of NO2, AOD and meteorological variables such as T2 max, surface-reaching shortwave radiation, wind speed and PBLH. A box model representing the O3–NOx–VOC relationship is then utilized to quantify the relative contributions of different driving factors to the increase in surface O3 in the NCP region over the period of 2013–2019.
The observational analysis indicates, while PM2.5 concentrations continued to decrease with a rate of 9.5 µg m−3 a−1, surface O3 showed an accelerated increase trend at a rate of 4.6 ppb a−1 over the NCP region during summertime from 2013–2019. Both decrease in PM2.5 and reduction in NO2 are the two key factors leading to such an increase in surface O3. The former is closely associated with the attenuation of UV entering the PBL whereas the latter is related to the fact that O3 photochemical production in the NCP region is dominated by a VOC-limited regime. The trend analysis of satellite retrieval measurements revealed an obvious increase in T2 max at the rate of 0.34 ∘C a−1, a rapid decrease in AOD from 1.0 in 2013 to 0.75 in 2019, and a reduction in SSA from 0.95 to 0.93. The changes of both T2 max and AOD were conducive to photochemical production of O3 whereas the variability of aerosol scattering–absorption properties (i.e., decrease in SSA) may largely offset the impact of AOD reduction.
The sensitivity studies with the box model MM indicate that reduction of emissions (i.e., NOx), meteorological conditions and aerosol radiative effect associated with decrease in aerosol concentrations were the three most important factors in driving such a large increase in surface O3. They accounted for 45 %, 30 % and 23 % of the total increase in surface O3, respectively, over the NCP region in summertime during 2013–2019. For the meteorological contribution, increases in the PBLH and air temperature (e.g., T2 max) were responsible for 18 % and 12 % of the total change of surface O3, respectively. The percentage contribution of aerosol radiative effect (23 %) represented the net changes caused by aerosol concentrations (i.e., AOD) and aerosol radiative properties (scattering–absorption, SSA) (70 % vs. −47 %). The model results further demonstrated that decrease in SSA (i.e., more absorptive) may lead to reduction in HO2 radicals and NO2 concentrations, and then less O3 production, which may largely counteract the impact of the aerosol radiative effect associated with a decrease in AOD.
This study has a strong implication that development of more effective control strategies on surface O3 reduction needs to consider the impact of aerosol radiative effect as well as the change of aerosol scattering–absorption properties (i.e., AOD and SSA).
Data used in this paper can be provided by Xiaodan Ma (xaiodanma_nuist@163.com) upon request.
The supplement related to this article is available online at: https://doi.org/10.5194/acp-21-1-2021-supplement.
JH came up with the original idea of this study. XM and JH designed the numerical simulations. XM conducted the data analysis and the first draft of the manuscript and JH edited it. TZ, CL, KZ, JX and WX were involved in the scientific interpretation and discussions. All the authors commented on the paper.
The authors declare that they have no conflict of interest.
We are grateful to the reviewers for their helpful suggestions and China National Environmental Monitoring Center for providing the air quality data used in this study.
This research has been supported by the National Key R&D Program Pilot Projects of China (2019YFC0214604), the National Natural Science Foundation of China (grant nos. 41575009, 41830965, 91544109), the Postgraduate Research and Practice Innovation Program of Jiangsu Province (KYCX20_0924) and the Jiangxi Provincial Natural Science Foundation (20202BAB213019).
This paper was edited by Maria Kanakidou and reviewed by Guy Brasseur and one anonymous referee.
An, Z., Huang, R., Zhang, R., Tie, X., Li, G., Cao, J., Zhou, W., Shi, Z., Han, Y., Gu, Z., and Ji, Y.: Severe haze in northern China: A synergy of anthropogenic emissions and atmospheric processes, National. Acad. Sci., 116, 8657–8666, https://doi.org/10.1073/pnas.1900125116, 2019.
Aumont, B., Chervier, F., and Laval, S.: Contribution of HONO sources to the NOx/HOx/O3 chemistry in the polluted boundary layer, Atmos. Environ., 37, 487–498, https://doi.org/10.1016/S1352-2310(02)00920-2, 2003.
Cooper, O., Parrish, D., Stohl, A., Trainer, M., Nédélec, P., Thouret, V., Cammas, J. P., Oltmans, S., Johnson, B., Tarasick, D., Leblanc, T., McDermid, I., Jaffe, D., Gao, R., Stith, J., Ryerson, T., Aikin, K., Campos, T., Weinheimer, A., and Avery, M.: Increasing springtime ozone mixing ratios in the free troposphere over western North America, Nature, 463, 344–348, https://doi.org/10.1038/nature08708, 2010.
Cooper, O. R., Parrish, D. D., Ziemke, J., Balashov, N. V., and Zbinden, R. M.: Global distribution and trends of tropospheric ozone: An observation-based review, Elem. Sci. Anth., 2, 000029, https://doi.org/10.12952/journal.elementa.000029, 2014.
Dickerson, R. R., Kondragunta, S., Stenchikov, G., Civerolo, K. L., Doddridge, B. G., and Holben, B. N.: The impact of aerosols on solar ultraviolet radiation and photochemical smog, Science, 278, 827–830, https://doi.org/10.1126/science.278.5339.827, 1997.
Ding, A. J., Wang, T., Thouret, V., Cammas, J.-P., and Nédélec, P.: Tropospheric ozone climatology over Beijing: analysis of aircraft data from the MOZAIC program, Atmos. Chem. Phys., 8, 1–13, https://doi.org/10.5194/acp-8-1-2008, 2008.
Gao, W., Tie, X., Xu, J., Huang, R., Mao, X., Zhou, G., and Chang, L.: Long-term trend of O3 in a mega City (Shanghai), China: Characteristics, causes, and interactions with precursors, Sci. Total. Environ., 603/604, 425–433, https://doi.org/10.1016/j.scitotenv.2017.06.099, 2017.
Gaudel, A., Cooper, O., Ancellet, G., Brice, B., Boynard, A., Burrows, J., Clerbaux, C., Coheur, P., Cuesta, J., Cuevas, E., Doniki, S., Dufour, G., Ebojie, F., Foret, G., García, O., Muños, M., Hannigan, J., Hase, F., Huang, G., and Ziemke, J.: Tropospheric Ozone Assessment Report: Present-day distribution and trends of tropospheric ozone relevant to climate and global atmospheric chemistry model evaluation, Elem. Sci. Anth., 6, 39, https://doi.org/10.1525/elementa.291, 2018.
Geng, F., Zhao, C., Tang, X., Lu, G., and Tie, X.: Analysis of ozone and VOCs measured in Shanghai: A case study, Atmos. Environ., 41, 989–1001, https://doi.org/10.1016/j.atmosenv.2006.09.023, 2007.
Gerasopoulos, E., Kouvarakis, G., Vrekoussis, M., Donoussis, C., Mihalopoulos, N., and Kanakidou, M.: Photochemical ozone production in the Eastern Mediterranean, Atmos. Environ., 40, 3057–3069, https://doi.org/10.1016/j.atmosenv.2005.12.061, 2006.
Global Modeling and Assimilation Office: MERRA-2 tavg1_2d_flx_Nx: 2d, 1-Hourly, Time-Averaged, Single-Level, Assimilation, Surface Flux Diagnostics V5.12.4, Goddard Earth Sciences Data and Information Services Center (GES DISC), Greenbelt, MD, USA, https://doi.org/10.5067/7MCPBJ41Y0K6, 2015.
Gu, L.: Half of Chinese live in haze, availabe at: http://www.ecns.cn/cns-wire/2013/07-12/72889.shtml(last access: 20 December 2020), 2013.
Han, H., Liu, J., Yuan, H., Zhuang, B., Zhu, Y., Wu, Y., Yan, Y., and Ding, A.: Characteristics of intercontinental transport of tropospheric ozone from Africa to Asia, Atmos. Chem. Phys., 18, 4251–4276, https://doi.org/10.5194/acp-18-4251-2018, 2018.
Huang, J., Fung, J. C. H., Lau, A. K. H., and Qin, Y.: Numerical simulation and process analysis of typhoon-related ozone episodes in Hong Kong, J. Geophys. Res.-Atmos., 110, D05301, https://doi.org/10.1029/2004JD004914, 2005.
Huang, J., Zhou, C., Lee, X., Bao, Y., Zhao, X., Fung, J., Richter, Andreas, Liu, X., and Zheng, Y.: The effects of rapid urbanization on the levels in tropospheric nitrogen dioxide and ozone over East China, Atmos. Environ., 77, 558–567, https://doi.org/10.1016/j.atmosenv.2013.05.030, 2013.
Jiang, Y. C., Zhao, T. L., Liu, J., Xu, X. D., Tan, C. H., Cheng, X. H., Bi, X. Y., Gan, J. B., You, J. F., and Zhao, S. Z.: Why does surface ozone peak before a typhoon landing in southeast China?, Atmos. Chem. Phys., 15, 13331–13338, https://doi.org/10.5194/acp-15-13331-2015, 2015.
Kalabokas, P., Hjorth, J., Foret, G., Dufour, G., Eremenko, M., Siour, G., Cuesta, J., and Beekmann, M.: An investigation on the origin of regional springtime ozone episodes in the western Mediterranean, Atmos. Chem. Phys., 17, 3905–3928, https://doi.org/10.5194/acp-17-3905-2017, 2017.
Kalabokas, P. D., Cammas, J.-P., Thouret, V., Volz-Thomas, A., Boulanger, D., and Repapis, C. C.: Examination of the atmospheric conditions associated with high and low summer ozone levels in the lower troposphere over the eastern Mediterranean, Atmos. Chem. Phys., 13, 10339–10352, https://doi.org/10.5194/acp-13-10339-2013, 2013.
Krotkov: OMI/Aura NO2 Cloud-Screened Total and Tropospheric Column L3 Global Gridded 0.25 degree x 0.25 degree V3, NASA Goddard Space Flight Center, Goddard Earth Sciences Data and Information Services Center (GES DISC), Greenbelt, MD, USA, https://doi.org/10.5067/Aura/OMI/DATA3007, 2019.
Lang, J., Zhang, Y., Zhou, Y., Cheng, S., Chen, D., Guo, X., Chen, S., Li, X., Xing, X., and Wang, H.: Trends of PM2.5 and chemical composition in Beijing, 2000–2015, Aerosol. Air. Qual., 17, 412–425, https://doi.org/10.4209/aaqr.2016.07.0307, 2017.
Li, K., Jacob, D. J., Liao, H., Shen, L., and Bates, K. H.: Anthropogenic drivers of 2013–2017 trends in summer surface ozone in China, National. Acad. Sci., 116, 422–427, https://doi.org/10.1073/pnas.1812168116, 2019a.
Li, K., Jacob, D. J., Liao, H., Zhu, J., Shah, V., Shen, L., Bates, K. H., Zhang, Q., and Zhai, S.: A two-pollutant strategy for improving ozone and particulate air quality in China, Nat. Geosci., 12, 906–910, https://doi.org/10.1038/s41561-019-0464-x, 2019b.
Lin, M., Horowitz, L. W., Payton, R., Fiore, A. M., and Tonnesen, G.: US surface ozone trends and extremes from 1980 to 2014: quantifying the roles of rising Asian emissions, domestic controls, wildfires, and climate, Atmos. Chem. Phys., 17, 2943–2970, https://doi.org/10.5194/acp-17-2943-2017, 2017.
Lin, Y. C., Schwab, J., Demerjian, K., Bae, M.-S., Chen, W.-N., Sun, Y., Zhang, Q., Hung, H.-M., and Perry, J.: Summertime formaldehyde observations in New York City: Ambient levels, sources and its contribution to HOx radicals, J. Geophys. Res., 117, D08305, https://doi.org/10.1029/2011JD016504, 2012.
Liu, Q., Liua, T., Chen, Y., Xu, J., Gao, W., Zhang, H., and Yao, Y.: Effects of aerosols on the surface ozone generation via a study of the interaction of ozone and its precursors during the summer in Shanghai, China, Sci. Total. Environ., 675, 235–246, https://doi.org/10.1016/j.scitotenv.2019.04.121, 2019.
Liu, Y. and Wang, T.: Worsening urban ozone pollution in China from 2013 to 2017 – Part 1: The complex and varying roles of meteorology, Atmos. Chem. Phys., 20, 6305–6321, https://doi.org/10.5194/acp-20-6305-2020, 2020a.
Liu, Y. and Wang, T.: Worsening urban ozone pollution in China from 2013 to 2017 – Part 2: The effects of emission changes and implications for multi-pollutant control, Atmos. Chem. Phys., 20, 6323–6337, https://doi.org/10.5194/acp-20-6323-2020, 2020b.
Lu, X., Hong, J., Zhang, L., Cooper, O. R., and Zhang, Y.: Severe Surface Ozone Pollution in China: A Global Perspective, Environ. Sci. Tech. Lett., 5, 8b00366, https://doi.org/10.1021/acs.estlett.8b00366, 2018.
Lyu, X., Wang, N., Guo, H., Xue, L., Jiang, F., Zeren, Y., Cheng, H., Cai, Z., Han, L., and Zhou, Y.: Causes of a continuous summertime O3 pollution event in Jinan, a central city in the North China Plain, Atmos. Chem. Phys., 19, 3025–3042, https://doi.org/10.5194/acp-19-3025-2019, 2019.
Ma, Z., Xu, J., Quan, W., Zhang, Z., Lin, W., and Xu, X.: Significant increase of surface ozone at a rural site, north of eastern China, Atmos. Chem. Phys., 16, 3969–3977, https://doi.org/10.5194/acp-16-3969-2016, 2016.
Madronich, S. and Calvert, J.: The NCAR Master Mechanism of the Gas Phase Chemistry, Version 2.0[J], Technical Note, National Center for Atmospheric Research, Boulder, CO, USA, 259 pp., 1989.
Madronich, S. and Calvert, J. G.: Permutation reactions of organic peroxy radicals in the atmosphere, J. Geophys. Res.-Atmos., 95, 5697–5715, https://doi.org/10.1029/JD095iD05p05697, 1990.
Madronich, S. and Flocke, S.: The Role of Solar Radiation in Atmospheric Chemistry, in: Handbook of Environmental Chemistry, edited by: Boule, P., Springer, Berlin and Heidelberg, Germany, 14–15, 1999.
Mok, J., Krotkov, N. A., Arola, A., Torres, O., Jethva, H., Andrade, M., Labow, G., Eck, T. F., Li, Z., and Dickerson, R. R.: Impacts of brown carbon from biomass burning on surface UV and ozone photochemistry in the Amazon Basin, Sci. Rep.-UK, 6, 36940, https://doi.org/10.1038/srep36940, 2016.
Monks, P. S., Archibald, A. T., Colette, A., Cooper, O., Coyle, M., Derwent, R., Fowler, D., Granier, C., Law, K. S., Mills, G. E., Stevenson, D. S., Tarasova, O., Thouret, V., von Schneidemesser, E., Sommariva, R., Wild, O., and Williams, M. L.: Tropospheric ozone and its precursors from the urban to the global scale from air quality to short-lived climate forcer, Atmos. Chem. Phys., 15, 8889–8973, https://doi.org/10.5194/acp-15-8889-2015, 2015.
NASA: FLDAS Noah Land Surface Model L4 Global Monthly 0.1 x 0.1 degree (MERRA-2 and CHIRPS), Goddard Earth Sciences Data and Information Services Center (GES DISC), Greenbelt, MD, USA, https://doi.org/10.5067/5NHC22T9375G, 2018.
Ni, R., Lin, J., Yan, Y., and Lin, W.: Foreign and domestic contributions to springtime ozone over China, Atmos. Chem. Phys., 18, 11447–11469, https://doi.org/10.5194/acp-18-11447-2018, 2018.
Platnick: MODIS Atmosphere L3 Monthly Product (08_L3), NASA MODIS Adaptive Processing System, NASA Goddard Space Flight Center, Goddard Earth Sciences Data and Information Services Center (GES DISC), Greenbelt, MD, USA, https://doi.org/10.5067/MODIS/MYD08_M3.006, 2015.
Porter, W. C. and Heald, C. L.: The mechanisms and meteorological drivers of the summertime ozone–temperature relationship, Atmos. Chem. Phys., 19, 13367–13381, https://doi.org/10.5194/acp-19-13367-2019, 2019.
Reddy, K., Naja, M., Ojha, N., Mahesh, P., and Lal, S.: Influences of the boundary layer evolution on surface ozone variations at a tropical rural site in India, J. Earth. Syst. Sci., 121, 911–922, https://doi.org/10.1007/s12040-012-0200-z, 2012.
Shi, C., Wang, S., Rui, L., Rui, Z., Li, D., Wang, W., Li, Z., Cheng, T., and Zhou, B.: A study of aerosol optical properties during ozone pollution episodes in 2013 over Shanghai, China, Atmos. Res. , 153, 235–249, https://doi.org/10.1016/j.atmosres.2014.09.002, 2015.
Stavrakou, T., Müller, J.-F., Boersma, K. F., De Smedt, I., and van der A, R. J.: Assessing the distribution and growth rates of NOx emission sources by inverting a 10-year record of NO2 satellite columns, Geophys. Res. Lett., 35, L10801, https://doi.org/10.1029/2008GL033521, 2008.
Sun, L., Xue, L., Wang, T., Gao, J., Ding, A., Cooper, O. R., Lin, M., Xu, P., Wang, Z., Wang, X., Wen, L., Zhu, Y., Chen, T., Yang, L., Wang, Y., Chen, J., and Wang, W.: Significant increase of summertime ozone at Mount Tai in Central Eastern China, Atmos. Chem. Phys., 16, 10637–10650, https://doi.org/10.5194/acp-16-10637-2016, 2016.
Sun, L., Xue, L., Wang, Y., Li, L., Lin, J., Ni, R., Yan, Y., Chen, L., Li, J., Zhang, Q., and Wang, W.: Impacts of meteorology and emissions on summertime surface ozone increases over central eastern China between 2003 and 2015, Atmos. Chem. Phys., 19, 1455–1469, https://doi.org/10.5194/acp-19-1455-2019, 2019.
Tai, A. P. K., Martin, M. V., and Heald, C. L.: Threat to future global food security from climate change and ozone air pollution, Nat. Clim. Change, 4, 817–821, https://doi.org/10.1038/nclimate2317, 2014.
Tan, Z., Lu, K., Jiang, M., Su, R., Wang, H., Lou, S., Fu, Q., Zhai, C., Tan, Q., Yue, D., Chen, D., Wang, Z., Xie, S., Zeng, L., and Zhang, Y.: Daytime atmospheric oxidation capacity in four Chinese megacities during the photochemically polluted season: a case study based on box model simulation, Atmos. Chem. Phys., 19, 3493–3513, https://doi.org/10.5194/acp-19-3493-2019, 2019.
Tang, G., Li, X., Wang, Y., Xin, J., and Ren, X.: Surface ozone trend details and interpretations in Beijing, 2001–2006, Atmos. Chem. Phys., 9, 8813–8823, https://doi.org/10.5194/acp-9-8813-2009, 2009.
Torres: OMI/Aura Near UV Aerosol Optical Depth and Single Scattering Albedo 1-orbit L2 Swath 13x24km V003, NASA Goddard Space Flight Center, Goddard Earth Sciences Data and Information Services Center (GES DISC), Greenbelt, MD, USA, https://doi.org/10.5067/Aura/OMI/DATA2004, 2006.
Wang, J., Allen, D. J., Pickering, K. E., Li, Z., and He, H.: Impact of aerosol direct effect on East Asian air quality during the EAST-AIRE campaign, J. Geophys. Res.-Atmos., 121, 6534–6554, https://doi.org/10.1002/2016JD025108, 2016a.
Wang, T., Ding, A., Gao, J., and Wu, W. S.: Strong ozone production in urban plumes from Beijing, China, Geophys. Res. Lett., 33, L21806, https://doi.org/10.1029/2006GL027689, 2006.
Wang, T., Xue, L., Brimblecombe, P., Yun, F. L., Li, L., and Zhang, L.: Ozone pollution in China: A review of concentrations, meteorological influences, chemical precursors, and effects, Sci. Total. Environ., 575, 1582–1596, https://doi.org/10.1016/j.scitotenv.2016.10.081, 2016b.
Wang, Y., Wang, H., Guo, H., Lyu, X., Cheng, H., Ling, Z., Louie, P. K. K., Simpson, I. J., Meinardi, S., and Blake, D. R.: Long-term O3–precursor relationships in Hong Kong: field observation and model simulation, Atmos. Chem. Phys., 17, 10919–10935, https://doi.org/10.5194/acp-17-10919-2017, 2017.
Wei, X., Lam, K.-S., Cao, C., Li, H., and He, J.: Dynamics of the Typhoon Haitang Related High Ozone Episode over Hong Kong, Adv. Meteorol., 2016, 1–12, https://doi.org/10.1155/2016/6089154, 2016.
Xing, J., Mathur, R., Pleim, J., Hogrefe, C., Gan, C. M., Wong, D. C., Wei, C., and Wang, J.: Air pollution and climate response to aerosol direct radiative effects: A modeling study of decadal trends across the northern hemisphere, J. Geophys. Res.-Atmos., 120, 12221–12236, https://doi.org/10.1002/2015JD023933, 2015.
Xing, J., Wang, J., Mathur, R., Wang, S., Sarwar, G., Pleim, J., Hogrefe, C., Zhang, Y., Jiang, J., Wong, D. C., and Hao, J.: Impacts of aerosol direct effects on tropospheric ozone through changes in atmospheric dynamics and photolysis rates, Atmos. Chem. Phys., 17, 9869–9883, https://doi.org/10.5194/acp-17-9869-2017, 2017.
Xu, X., Zhang, T., and Su, Y.: Temporal variations and trend of ground-level ozone based on long-term measurements in Windsor, Canada, Atmos. Chem. Phys., 19, 7335–7345, https://doi.org/10.5194/acp-19-7335-2019, 2019.
Yan, R., Ye, H., Lin, X., He, X., Chen, C., Shen, J., Xu, K., Zheng, X., and Wang, L.: Characteristics and influence factors of ozone pollution in Hangzhou, Acta Scientiae Circumstantiae, 38, 1128–1136, https://doi.org/10.13671/j.hjkxxb.2017.0430, 2018.
Yin, Z., Cao, B., and Wang, H.: Dominant patterns of summer ozone pollution in eastern China and associated atmospheric circulations, Atmos. Chem. Phys., 19, 13933–13943, https://doi.org/10.5194/acp-19-13933-2019, 2019.
Zeng, Y., Cao, Y., Qiao, X., Seyler, B. C., and Tang, Y.: Air pollution reduction in China: Recent success but great challenge for the future, Sci. Total. Environ., 663, 329–337, https://doi.org/10.1016/j.scitotenv.2019.01.262, 2019.
Zhai, S., Jacob, D. J., Wang, X., Shen, L., Li, K., Zhang, Y., Gui, K., Zhao, T., and Liao, H.: Fine particulate matter (PM2.5) trends in China, 2013–2018: separating contributions from anthropogenic emissions and meteorology, Atmos. Chem. Phys., 19, 11031–11041, https://doi.org/10.5194/acp-19-11031-2019, 2019.
Zhang, F., Wang, Y., Peng, J., Chen, L., Sun, Y., Duan, L., Ge, X., Li, Y., Zhao, J., Liu, C., Zhang, X., Zhang, G., Pan, Y., Wang, Y., Zhang, A. L., Ji, Y., Wang, G., Hu, M., Molina, M. J., and Zhang, R.: An unexpected catalyst dominates formation and radiative forcing of regional haze, P. Nat. Acad. Sci., 117, 3960–3966, https://doi.org/10.1073/pnas.1919343117, 2020.
Zhang, Z., Zhang, X., Gong, D., Quan, W., Zhao, X., Ma, Z., and Kim, S. J.: Evolution of surface O3 and PM|2.5 concentrations and their relationships with meteorological conditions over the last decade in Beijing, Atmos. Environ., 108, 67–75, https://doi.org/10.1016/j.atmosenv.2015.02.071, 2015.
Zheng, B., Tong, D., Li, M., Liu, F., Hong, C., Geng, G., Li, H., Li, X., Peng, L., Qi, J., Yan, L., Zhang, Y., Zhao, H., Zheng, Y., He, K., and Zhang, Q.: Trends in China's anthropogenic emissions since 2010 as the consequence of clean air actions, Atmos. Chem. Phys., 18, 14095–14111, https://doi.org/10.5194/acp-18-14095-2018, 2018.