the Creative Commons Attribution 4.0 License.
the Creative Commons Attribution 4.0 License.
 | 26 Aug 2020
Aerosol concentrations variability over China: two distinct leading modes
Juan Feng
Jianlei Zhu
Jianping Li
Hong Liao
Understanding the variability in aerosol concentrations (ACs) over China is a scientific challenge and is of practical importance. The present study explored the month-to-month variability in ACs over China based on simulations of an atmospheric chemical transport model with a fixed emissions level. The month-to-month variability in ACs over China is dominated by two principal modes: the first leading monopole mode and the second meridional dipole mode. The monopole mode mainly indicates enhanced ACs over eastern China, and the dipole mode displays a south–north out-of-phase pattern. The two leading modes are associated with different climatic systems. The monopole mode relates to the 3 months leading the El Niño–Southern Oscillation (ENSO), while the dipole mode connects with the simultaneous variation in the North Atlantic Oscillation (NAO) or the Northern Hemisphere Annular Mode (NAM). The associated anomalous dynamic and thermal impacts of the two climatic variabilities are examined to explain their contributions to the formation of the two modes. For the monopole mode, the preceding ENSO is associated with anomalous convergence, decreased planetary boundary layer height (PBLH), and negative temperature anomalies over eastern China, which are unfavorable for emissions. For the dipole mode, the positive NAO is accompanied by opposite anomalies in the convergence, PBLH, and temperature over southern and northern China, paralleling the spatial formation of the mode. This result suggests that the variations originating from the tropical Pacific and extratropical atmospheric systems contribute to the dominant variabilities of ACs over China.
- Article
(11880 KB) - Full-text XML
- BibTeX
- EndNote


Aerosol particles are the primary pollutants in the atmosphere and play significant roles in influencing human health, environmental pollution, and regional and global climate (IPCC, 2013). The variation in aerosols shows considerable impacts on the climate via its direct and indirect effects by altering the radiation forcing and microphysical effects (e.g., Thompson, 1995; Zhang et al., 2011; Huang et al., 2006), indicating the important influences on the regional and global climate. For instance, it is noted that the “cooling pool” in eastern-central China during the period 1960–1990 is partially attributed to increased aerosol concentrations (ACs; Li et al., 2016), and that aerosols may exert influences on precipitation changes on both global and regional scales, as well as on monsoon systems (Rosenfeld et al., 2007; Cowan and Cai, 2011; Huang et al., 2014; Jiang et al., 2016; Lou et al., 2018). Thus, a better understanding of the AC variation is of significance for both scientific and practical efforts.
Meanwhile, the distribution and accumulation of aerosols are sensitive to meteorological conditions. The variations in the meteorological factors, e.g., precipitation, wind, temperature, planetary boundary layer height (PBLH), atmospheric stability, and humidity, could impact the ACs by modulating the aerosol transport, deposition, and dilution processes (Aw and Kleeman, 2003; Lin and McElroy, 2010; Liao et al., 2015; Yang et al., 2017). The anomalies in meteorological conditions are attributed to the synoptic weather and climate systems. For the synoptic weather scale, Guo et al. (2014) indicated that stagnating weather conditions contribute to the periodic cycle of particulate matter events during boreal winter in Beijing. And the increase in relative humidity (Han et al., 2014) and decrease in the PBLH (Quan et al., 2014; Yang et al., 2015) would lead to an increase in the aerosols, thus contributing to the haze events during winter 2012 in northern China. The variations in the large-scale climatic systems – such as Pacific Decadal Oscillation (PDO), El Niño–Southern Oscillation (ENSO), East Asian summer and winter monsoons (EASM and EAWM), and North Atlantic Oscillation (NAO) – show considerable effects that are impacting the regional ACs on both seasonal and interannual timescales. For example, researchers found that low values of ACs are observed in Taiwan when accompanied with the onset of the EASM (Chen and Yang, 2008). During the mature phase of the moderate La Niña event 2000/01, an anomalous south–north (negative–positive) AC dipole pattern was seen over eastern China (Feng et al., 2017). The interannual variations in the EASM exhibit significant effects that are impacting the summertime ACs over China, i.e., a high-level ACs would be observed over eastern China along with a weaker EASM (Zhu et al., 2012; Lou et al., 2016; Mao et al., 2017). A similar situation is observed between the EAWM and ACs over eastern China but during boreal winter, showing that a weaker EAWM relates to a high level of ACs over China (Jeong et al., 2017). Zhao et al. (2016) have indicated that the decadal regime shift of the PDO showed a significant role in impacting the decadal variations of boreal winter aerosols over eastern China. Feng et al. (2019a) have reported the important influences of simultaneous ENSO and preceding autumn NAO signals on the winter ACs over China by a case study.
The above discussions highlight the effect of climate background on impacting the ACs over China across different seasons, including signals from both the tropical and the extratropical regions and originating from both the atmosphere and the ocean. However, the relative roles of climate systems are still unknown, because there are strong interactions among the systems. For example, during the decaying summer of a warm ENSO event, a weaker EASM is expected to be observed (Wu et al., 2002), and the occurrence of a cold ENSO event during its mature phase is favorable for a stronger EAWM (Wang et al., 2008). The preceding spring (March to April) NAO indicates significant impacts on the following summer EASM on the interannual timescale (Wu et al., 2009). Moreover, the signals originating from the atmosphere (e.g., NAO, EASM, EAWM) and ocean (e.g., ENSO, PDO) present strong seasonality, prevailing in different seasons. As shown by the fact that ACs over China are impacted by various climate systems, the relative importance of individual signals on their possible impacts on modulating the variability in ACs remains unknown. In addition, most of the previous studies regarding the influence of climate systems on ACs focused on a certain season with little attention paid to spatiotemporal variability. These questions are important for improving the recognition of the modulation of climate systems on AC.
Consequently, one of the crucial motivations of the current work is to investigate the spatiotemporal variability in the monthly ACs over China, highlighting the potential effects of climatic variabilities in modulating the spatial and temporal variations in ACs and understanding the possible physical processes involved. The rest of the study is arranged as follows. The model, datasets, and methods are presented in Sect. 2. The properties of the leading modes of AC variability are described in Sect. 3. Sect. 4 discusses the contribution of climatic modes on aerosol variabilities, and Sect. 5 provides the conclusions and discussions.
2.1 Model
The GEOS-Chem (version 8.02.01, http://acmg.seas.harvard.edu/geos, last access: 24 August 2020) model is employed to detect the variability in ACs over China. This model is a three-dimensional tropospheric chemistry model with a horizontal resolution and 30 vertical levels. The model is widely applied to investigate the potential modulation of climatic variabilities on the anomalous distributions of pollutants on various timescales, e.g., on the seasonal (Generoso et al., 2008; Jeong et al., 2011; Feng et al., 2016, 2019a), interannual (Jeong et al., 2017; Li et al., 2019), and interdecadal (Zhu et al., 2012) timescales. The high consistency in both the temporal and spatial distributions between the simulations and observations provides confidence for the feasibility of the present study.
As reported, the significant upward trend in anthropogenic emissions over China accounts for a large variance in pollutants, and the first dominant mode of boreal winter aerosols over eastern China represents anthropogenic emissions (Zhao et al., 2016). To highlight the modulation of the climatic variabilities on the variation in the aerosols, the anthropogenic and biomass burning emissions have been fixed at the year 2005 levels. Thus, the variations in the aerosols in this context are attributed to the internal climatic variability.
The definition of particulate matter smaller than 2.5 µm in diameter (PM2.5) is followed as given by Liao et al. (2007),
where , , SOA, POA, and BC are the aerosol particles of nitrate, sulfate, secondary organic aerosol, primary organic aerosol, and black carbon, respectively. Mineral dust and sea salt are excluded, because these species are not major components over China.
2.2 Datasets and methodology
The input meteorological variables of the model highly agree with the widely used atmospheric and oceanic datasets, i.e., the National Centers for Environmental Prediction/National Center for Atmospheric Research (NCEP/NCAR) reanalysis (Kalnay et al., 1996) and the UK Meteorological Office Hadley Centre's sea ice and sea surface temperature (SST) datasets (HadISST; Rayner et al., 2003). These two datasets are employed to verify the climatic indices calculated based on the model input meteorological datasets. ENSO was characterized by the Niño 3.4 index, which is defined as the areally averaged SST over 120–170∘ W and 5∘ N–5∘ S. The monthly Niño 3.4 indices based on the HadISST and model input data are highly related to each other with a correlation coefficient of 0.99, confirming the reliability of the model data. The North Atlantic Oscillation index (NAOI) and Northern Hemisphere Annular Mode index (NAMI) are used to present the sea level pressure (SLP) oscillation between the midlatitudes and high latitudes in the extratropical Northern Hemisphere. Following Li and Wang (2003), the NAMI is defined as the difference in the normalized global zonal-mean SLP between 35 and 65∘ N, in which 35 and 65∘ N refer to the midlatitudes and high latitudes, respectively. The definition of the NAOI resembles that of the NAMI but within the North Atlantic sector from 80∘ W to 30∘ E. Because the NAOI and NAMI are highly correlated with each other in both spatial distribution and temporal variation (Thompson and Wallace, 1998; Gong et al., 2001), the NAOI is utilized in the current context; similar results are obtained based on the NAMI.
Empirical orthogonal function (EOF) analysis was employed to obtain the spatiotemporal variability in monthly PM2.5 over China. Correlation and regression statistics are used to display the linkages between the variability in the PM2.5 and the climatic modes. Here, the period 1986–2006 was taken as the climatological mean, and the annual cycle was removed before the analyses. The statistical significance of the correlation and regression values was evaluated by a two-sided Student's t test.
3.1 Two leading modes
Figure 1 presents the spatial distribution of the first (EOF1) and second (EOF2) leading modes based on the monthly surface layer and column AC anomalies. A similar spatial distribution is observed in both the surface and column AC. The EOF1 and EOF2 modes explain 31.4 % (37.0 %) and 16.3 % (14.1 %) of the total variances for the surface layer (column) ACs, respectively. Based on North's rule (North et al., 1982), the two dominant modes could be significantly separated from each other and from the rest of the eigenvectors based on the analysis of the eigenvalues in light of the sampling error above the 0.05 significance level. The rest of the modes are not discussed because of their relatively less explained variance, or they could not be well separated. The EOF1 mode displays a monopole pattern, with the maximum located in central-eastern China (Fig. 1a and c). The EOF2 mode presents a meridional dipole pattern in eastern China, with opposite values to the south (positive values) and north (negative values) of the Yangtze river.

Figure 1Spatial pattern of the (a) first empirical orthogonal function (EOF1) mode of the monthly surface PM2.5 concentrations over China. (b) As in (a) but for the second mode (EOF2). (c, d) As in (a, b) but for the column concentrations. The numbers indicate fractional variance in the EOF modes.
The temporal behavior of the two modes, the first and second principal components, i.e., PC1 and PC2, is displayed in Fig. 2. Both PC1 and PC2 show strong interannual variations. The PCs based on the surface and column concentrations are closely correlated with each other, with coefficients of 0.80 and 0.79 for PC1 and PC2, respectively. The high consistency between the surface and column concentrations in both the spatial and temporal distributions implies that the factors governing their variations are the same. The maximum value of PC1 occurs in 1998, corresponding to the strongest El Niño event (1997/1998) in the 20th century. For PC2, negative values are observed during the winters of 1989 and 2002, and positive values are observed during the winters of 1995 and 1997. However, the winters of 1989 and 2002 correspond to the positive polarities of the NAM or NAO, and the winters of 1995 and 1997 are paralleling the negative polarities of the NAM or NAO. The potential linkage between the PCs and climatic variabilities is therefore analyzed. Here, the Niño 3.4 index is utilized to depict the variation of ENSO, and the NAOI (NAMI) is employed to reflect the variability in the NAO (NAM). Note that the indices based on the model input data are highly correlated with the observation datasets, and the monthly NAOI is closely related to the NAMI, exhibiting a significant correlation coefficient of 0.71 during the period 1986–2006. Therefore, the NAOI is employed to detect the linkage between PC2 and climate variability.
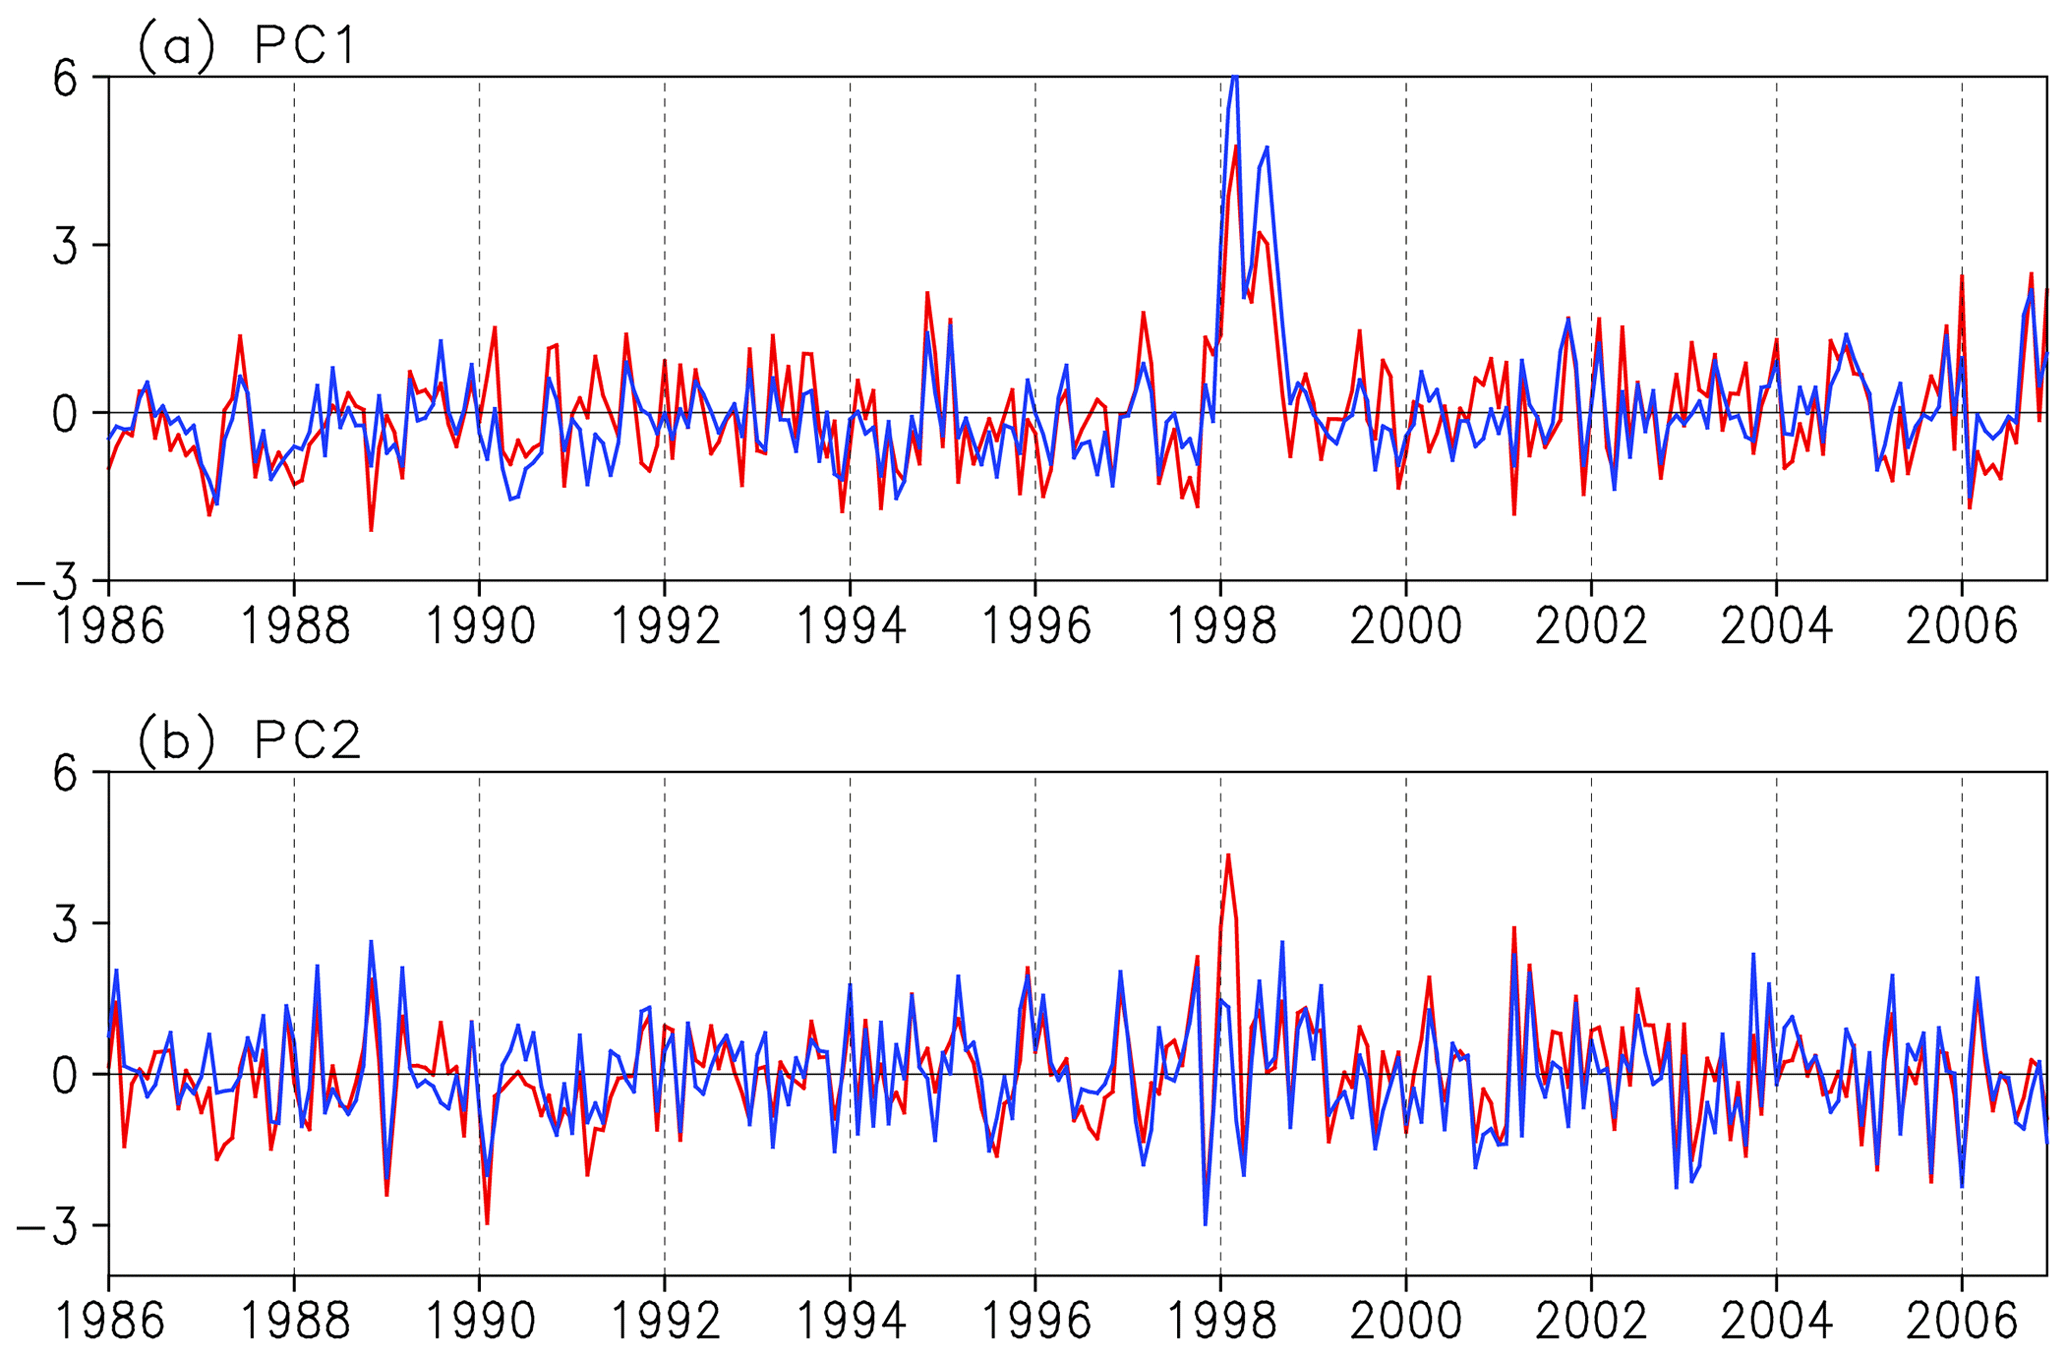
Figure 2(a) The first principal components (PC1) of the monthly PM2.5 concentrations where the red and blue lines are for the surface and column concentrations, respectively. (b) As in (a) but for PC2.
3.2 Linkage with the climate variabilities
Figure 3 displays the lead–lag correlations between PC1 and the Niño 3.4 index and between PC2 and NAOI to identify the linkage between the climatic variabilities and the two leading AC patterns. PC1 is significantly connected with the Niño 3.4 index, with the maximum occurring when the Niño 3.4 index is 3 months leading, implying a leading influence on PC1. The leading impacts of Niño 3.4 on the variation in PC1 are further seen from the seasonal evolution of the standard deviation in the corresponding indices (Fig. 4). The standard deviation of the monthly Niño 3.4 index shows that the maximum occurs during December, while the maximum occurs in March for that of PC1. The leading influences of Niño 3.4 on PC1 are further verified by the spatial distribution of correlations between PC1 and SST, as shown in Fig. 5. For the correlation with PC1 lagged for 3 months, significant positive correlations are observed over the tropical eastern Pacific Ocean and Indian Ocean, and negative correlations are observed over the tropical western Pacific. The correlation pattern is like a canonical El Niño pattern. Note that the significant positive correlations over the tropical eastern Pacific gradually decrease as the SST leading time is reduced; however, the correlations over the tropical Indian Ocean become stronger, implying the effects of the Indian Ocean capacitor along with the development of an ENSO event (Xie et al., 2009). The above result ascertains the preceding influence of ENSO on the variation in PC1, indicating a 3 month leading impact of ENSO on the following ACs over China.
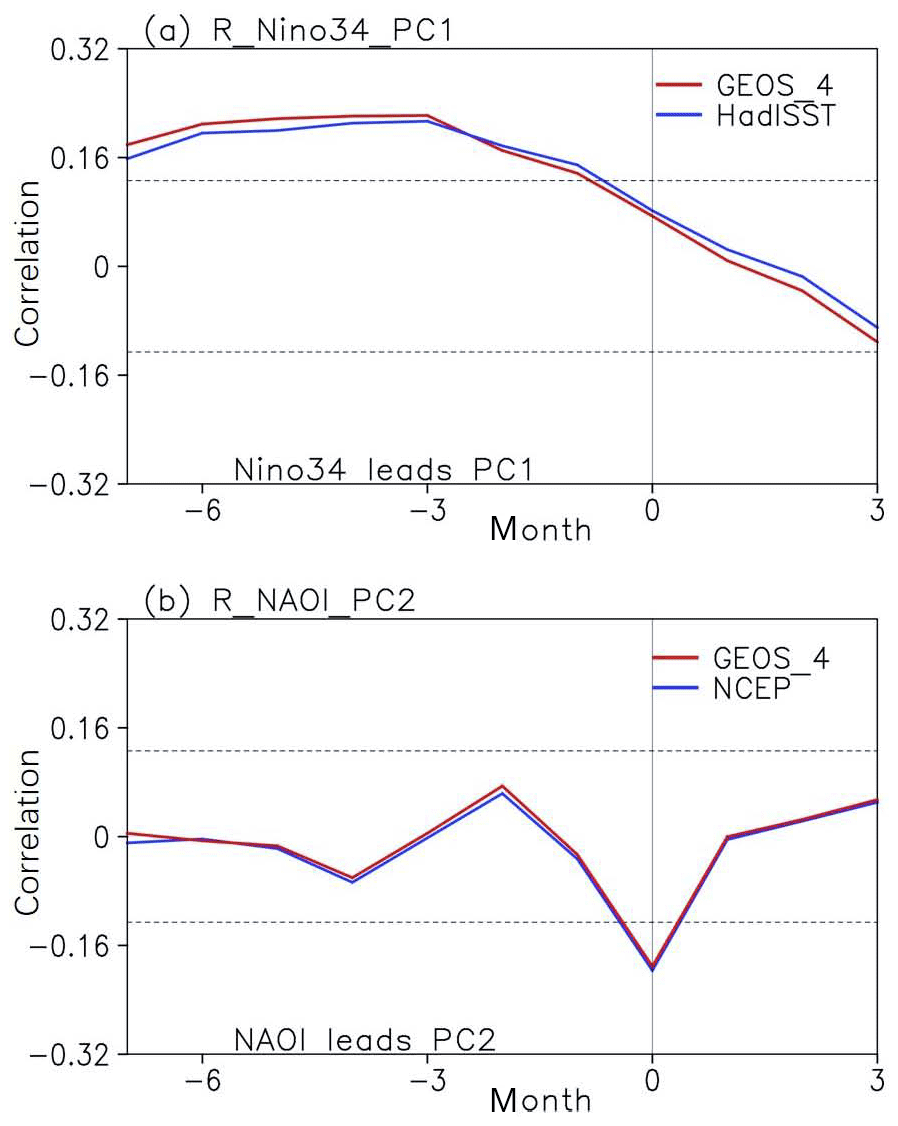
Figure 3(a) Lead–lag correlation between the Niño 3.4 index and PC1. Negative (positive) lags indicate that the Niño 3.4 index is leading (lagging), and the dashed lines are the 0.05 significance levels. (b) As in (a) but for the correlation between the NAOI and PC2. The red lines are based on the GEOS-4 meteorological fields, and the blue lines are based on the observations.

Figure 4Seasonal variations in the standard deviation of (a) PC1, (b) PC2, (c) Niño 3.4 index, and (d) NAOI.
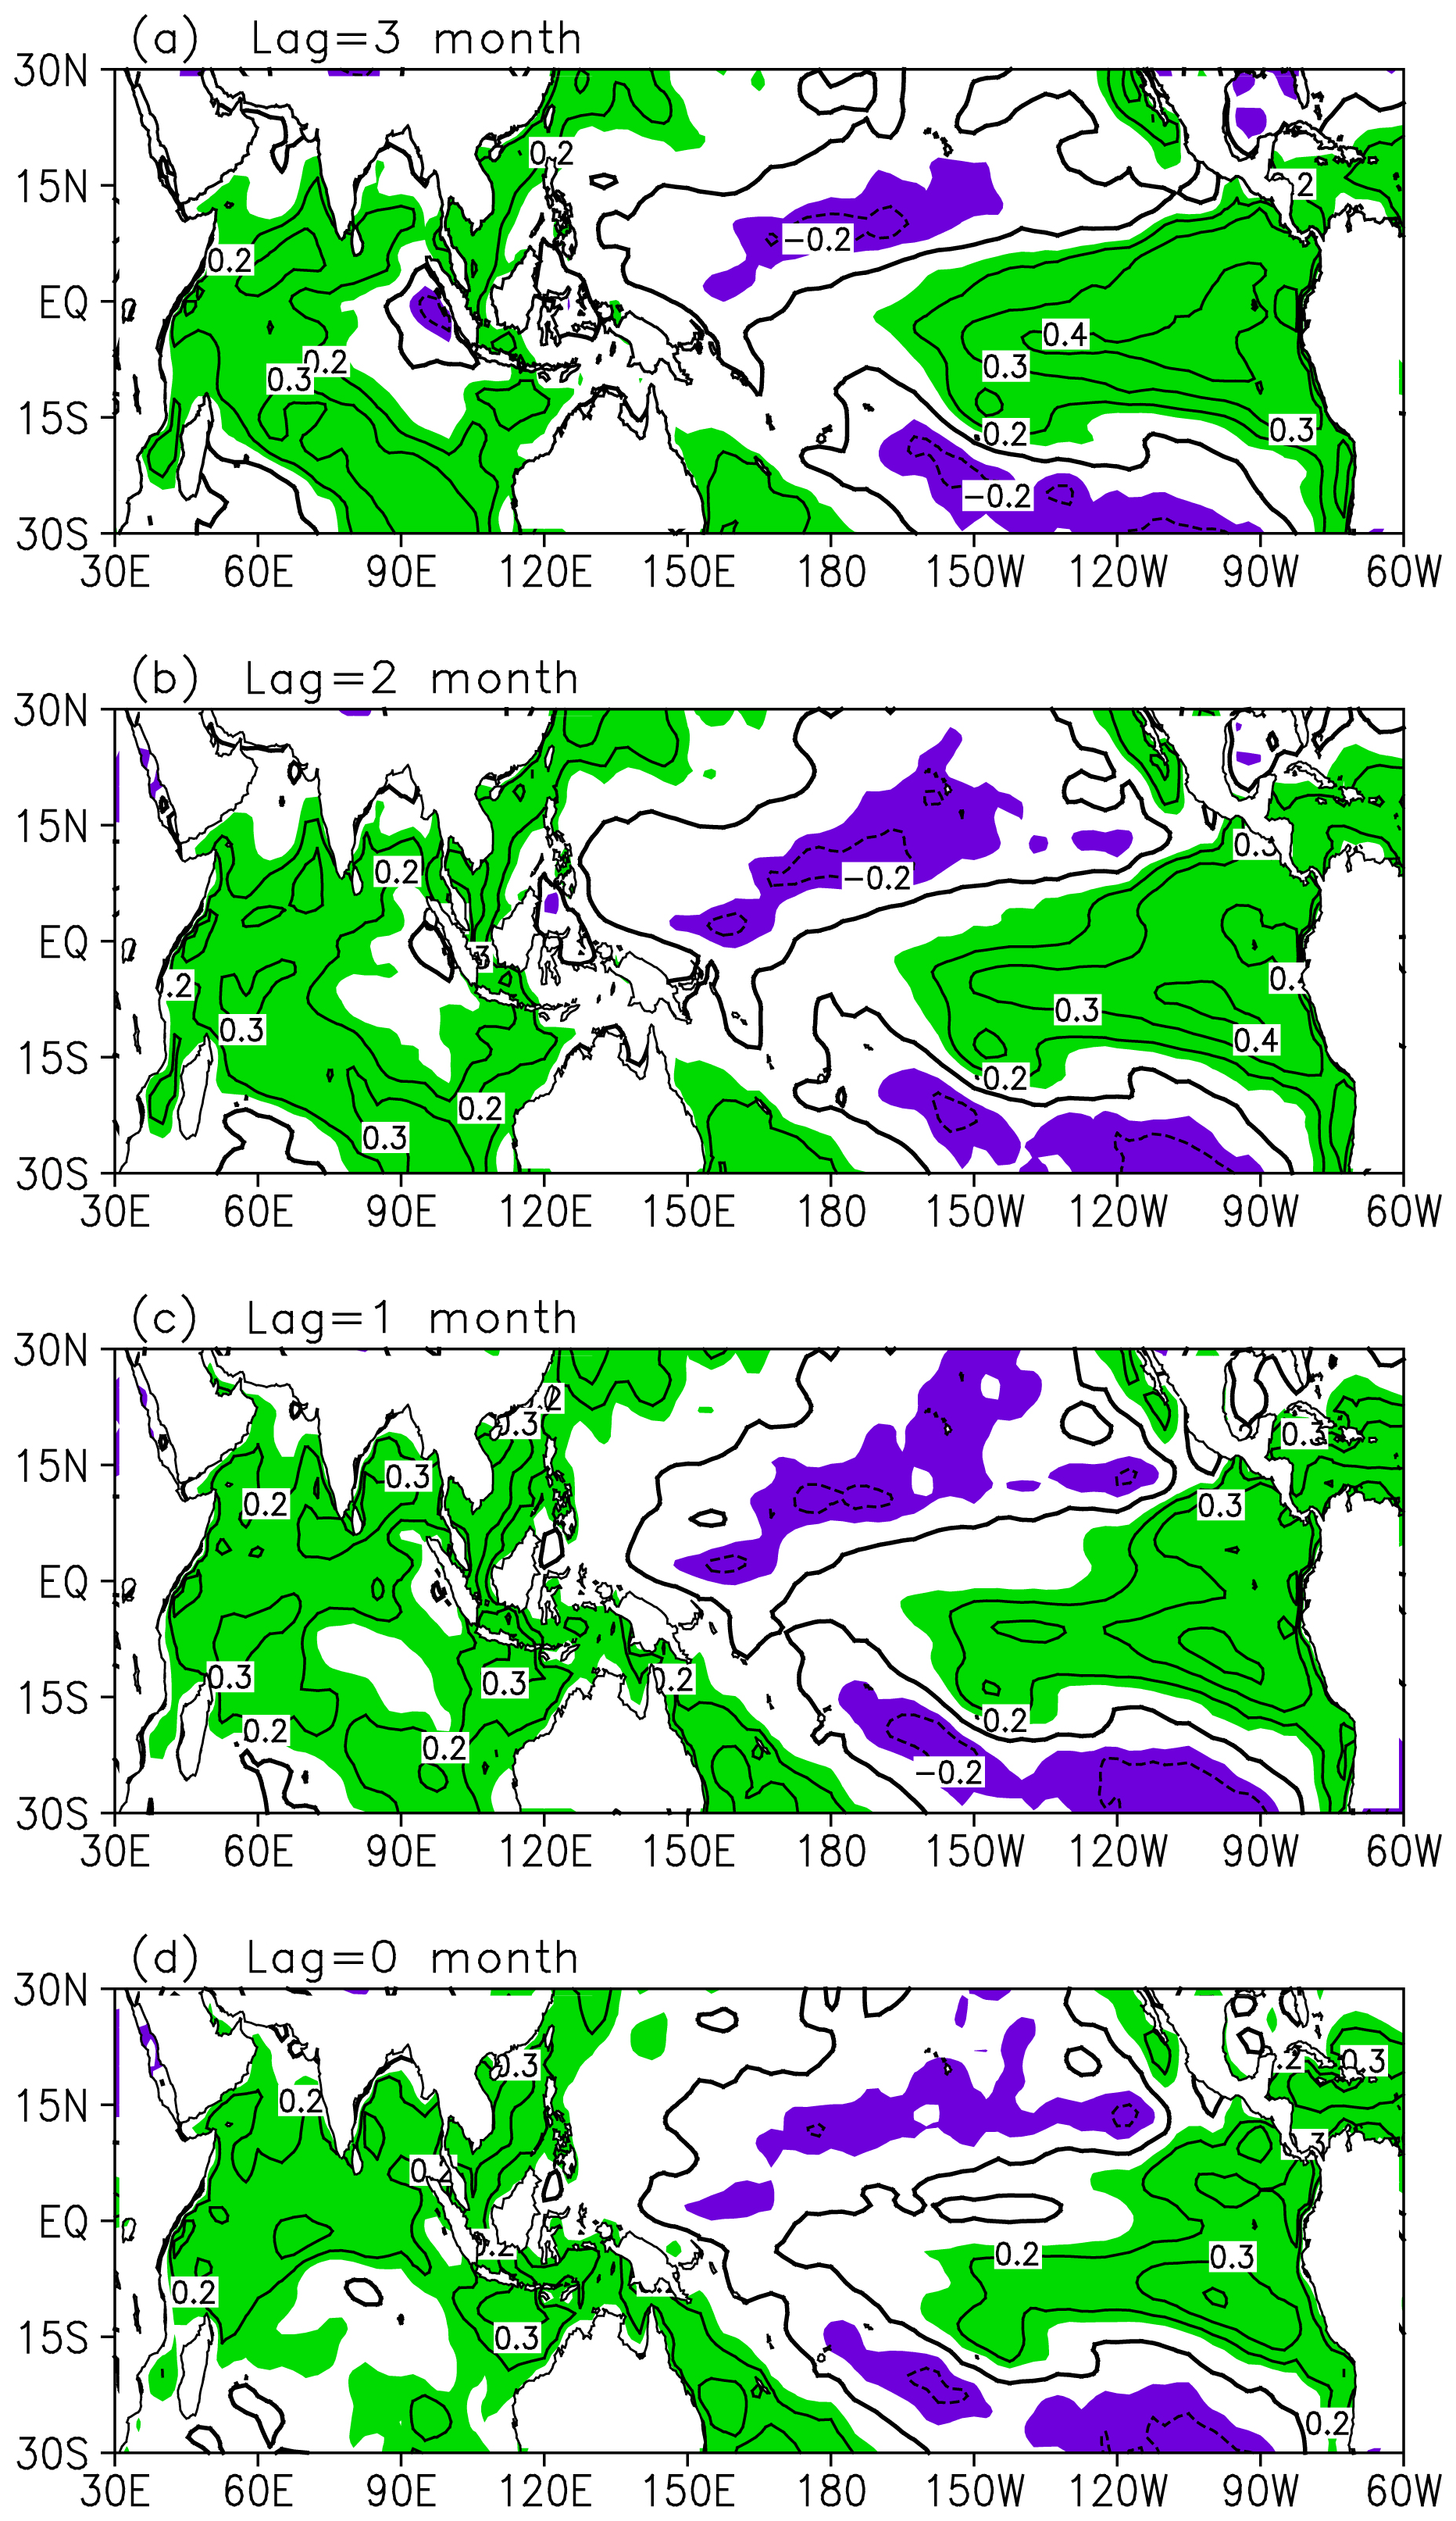
Figure 5Spatial distribution of the correlation coefficients between the monthly sea surface temperature and PC1 for PC1 lagging for (a) 3 months, (b) 2 months, (c) 1 month, and (d) simultaneous. Color shading indicates significance at the 0.05 level.
Meanwhile, the maximum negative correlation between PC2 and the NAO is simultaneous (Fig. 3b), implying a simultaneous impact of the NAO on the ACs over China. A similar result is seen in the correlation between NAMI and PC2. The simultaneous relationship between PC2 and NAO is further estimated in their corresponding seasonal variation in the standard deviation (Fig. 4b and d). The maximum standard deviations of the NAO and PC2 both occur during January–February–March. A similar result is obtained based on the NAMI, suggesting significant negative impacts of the extratropical atmosphere variation on the ACs over eastern China. Moreover, the correlations between the simultaneous PC2 and SLP display a negative NAO-like (NAM-like) structure (Fig. 6), with significant positive correlations over the polar regions and negative correlations over the midlatitudes. Note that this anomalous pattern is consistently observed in PC2 values based on both the surface layer (Fig. 6a) and the column concentrations (Fig. 6b).
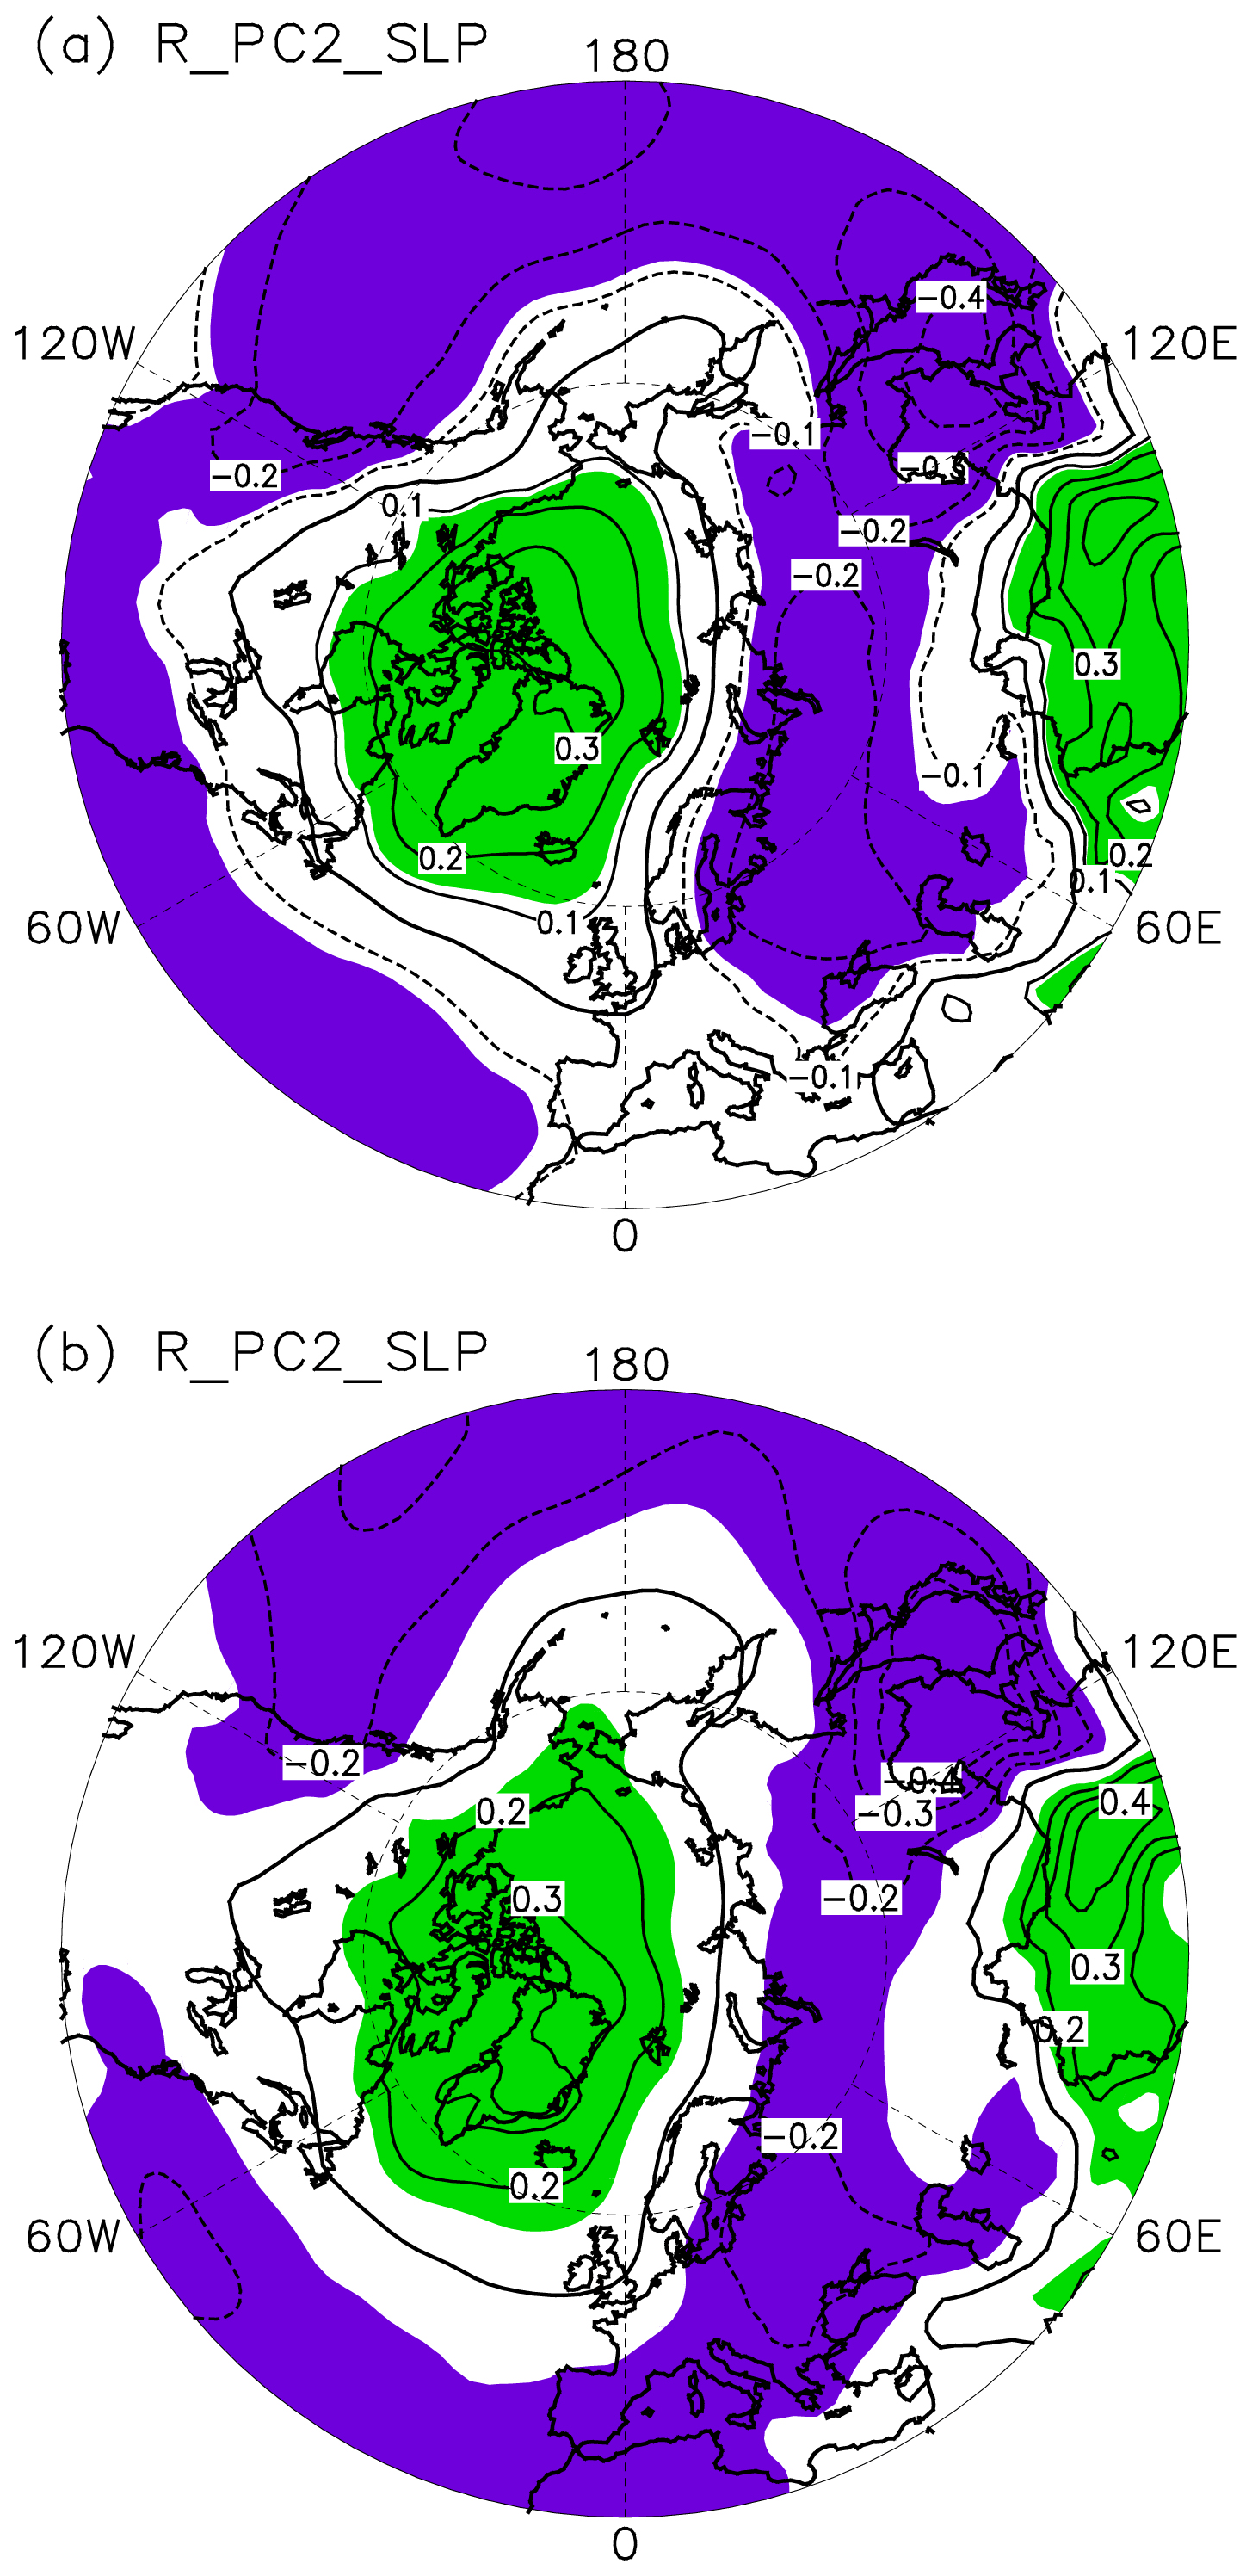
Figure 6Spatial distribution of the correlation coefficients between the monthly sea level pressure and PC2 of the (a) surface and (b) column PM2.5 concentrations. Color shading indicates significance at the 0.05 level.
The result above suggests that the variability in AC can be measured by climatic variabilities, of which the variation in EOF1 is linked to the 3 month leading SST variation over the tropical eastern Pacific, and that of EOF2 is related to the extratropical atmospheric variability in NAO. The possible physical process involved in their relationship is discussed in the following section.
4.1 Circulation anomalies associated with ENSO
Figure 7 shows the anomalous circulations associated with ENSO to identify the atmospheric circulation process impacting the EOF1 patterns with the Niño 3.4 index leading by 3 months. It is seen that the tropical eastern Pacific and southern China are controlled by significant positive correlations with the convergence in the lower troposphere. That is, southern China and the tropical eastern Pacific are influenced by anomalous convergence circulation under the influence of a 3-month leading ENSO signal. Meanwhile, the tropical western Pacific is impacted by significant negative correlations, indicating that this region is impacted by anomalous divergence. The anomalous convergence circulation over southern China is not favorable for the transmission of ACs. That is, the anomalous circulation associated with a 3-month leading ENSO signal would connect with enhanced ACs over eastern China (Feng et al., 2019a), which agrees with the spatial distribution of EOF1. Moreover, the impacts of ENSO on the circulation is further seen by impacting the PBLH (Fig. 8a). Significant negative anomalies are found over eastern China, indicating that the occurrence of a warm ENSO event would decrease the PBLH. The decreased PBLH relates to enhanced ACs over eastern China. The above result suggests that the leading ENSO signal plays a significant role in affecting the circulation anomalies over China. Under the influence of warm ENSO events, the following anomalous convergence and decreased PBLH over eastern China are both unfavorable for the emission of ACs, contributing to the formation of the EOF1 pattern.
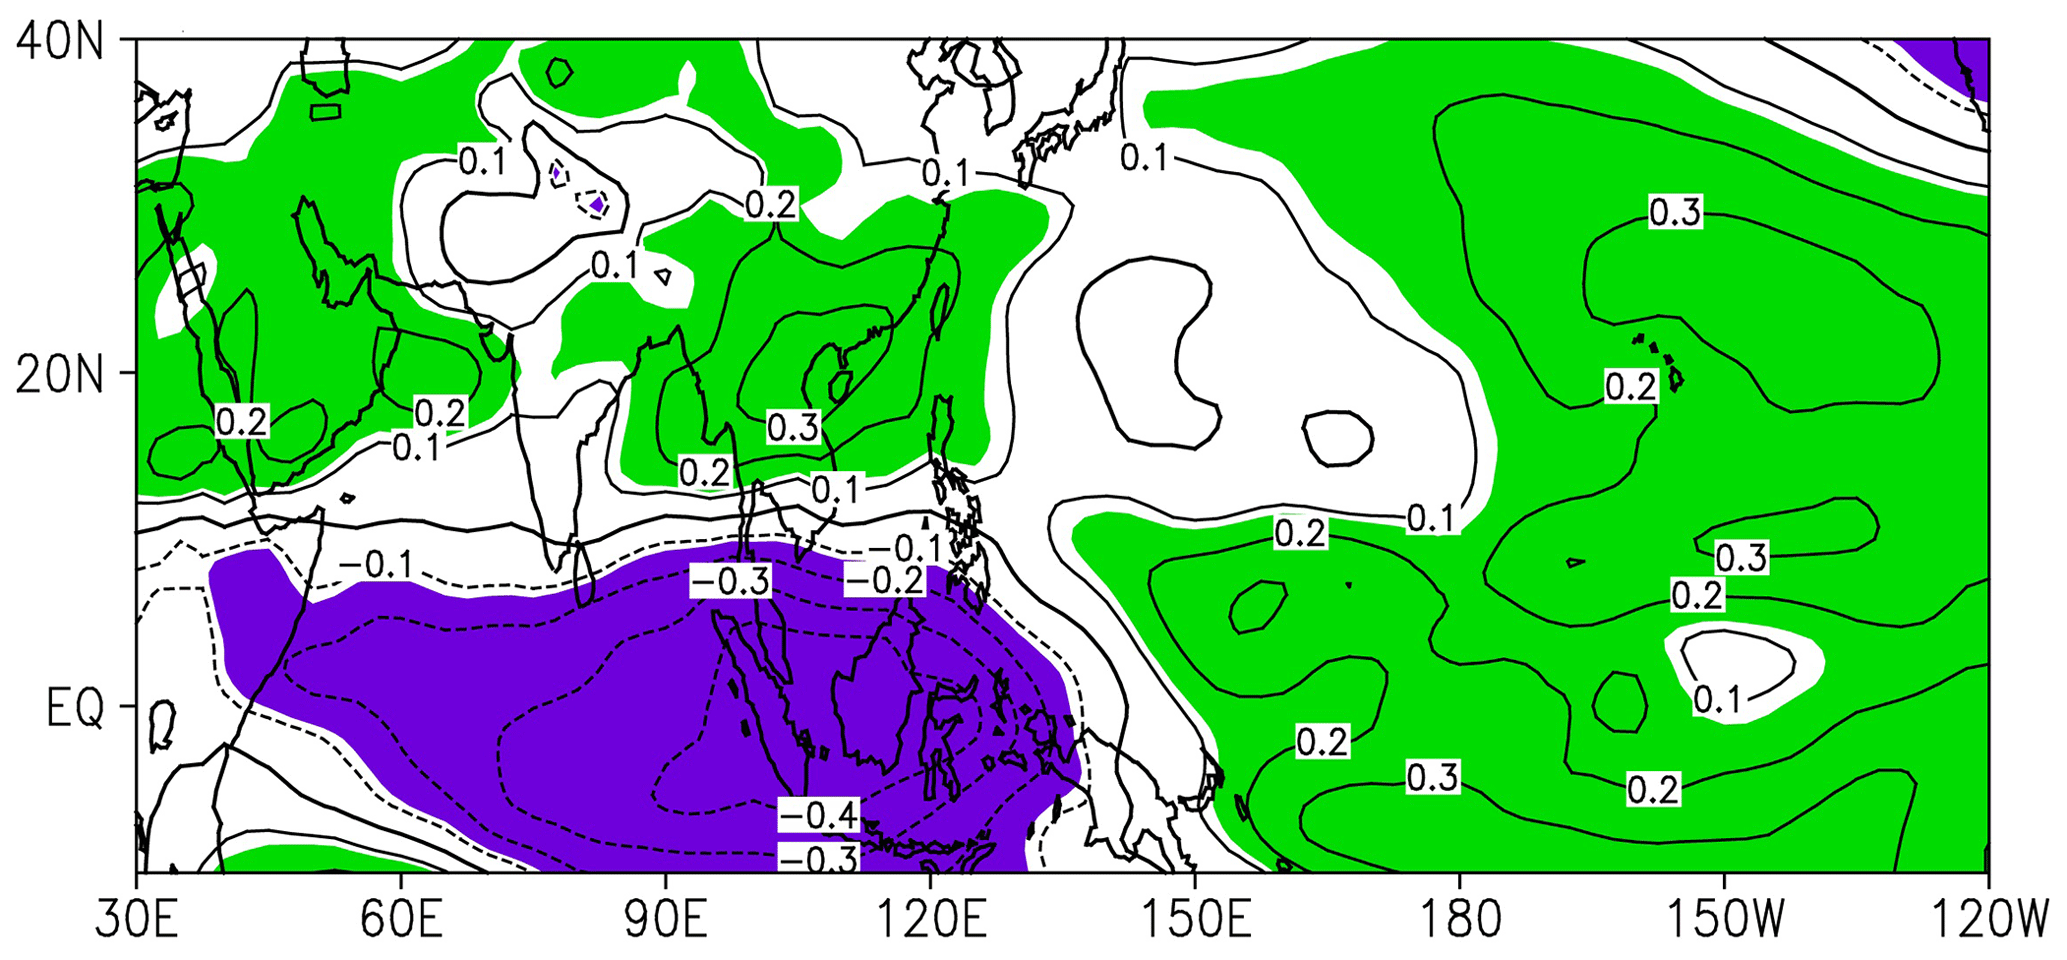
Figure 7Spatial distribution of the correlation coefficients between the Niño 3.4 index and convergence at 700 hPa for the Niño 3.4 index leading for 3 months. Color shading indicates significance at the 0.05 level.
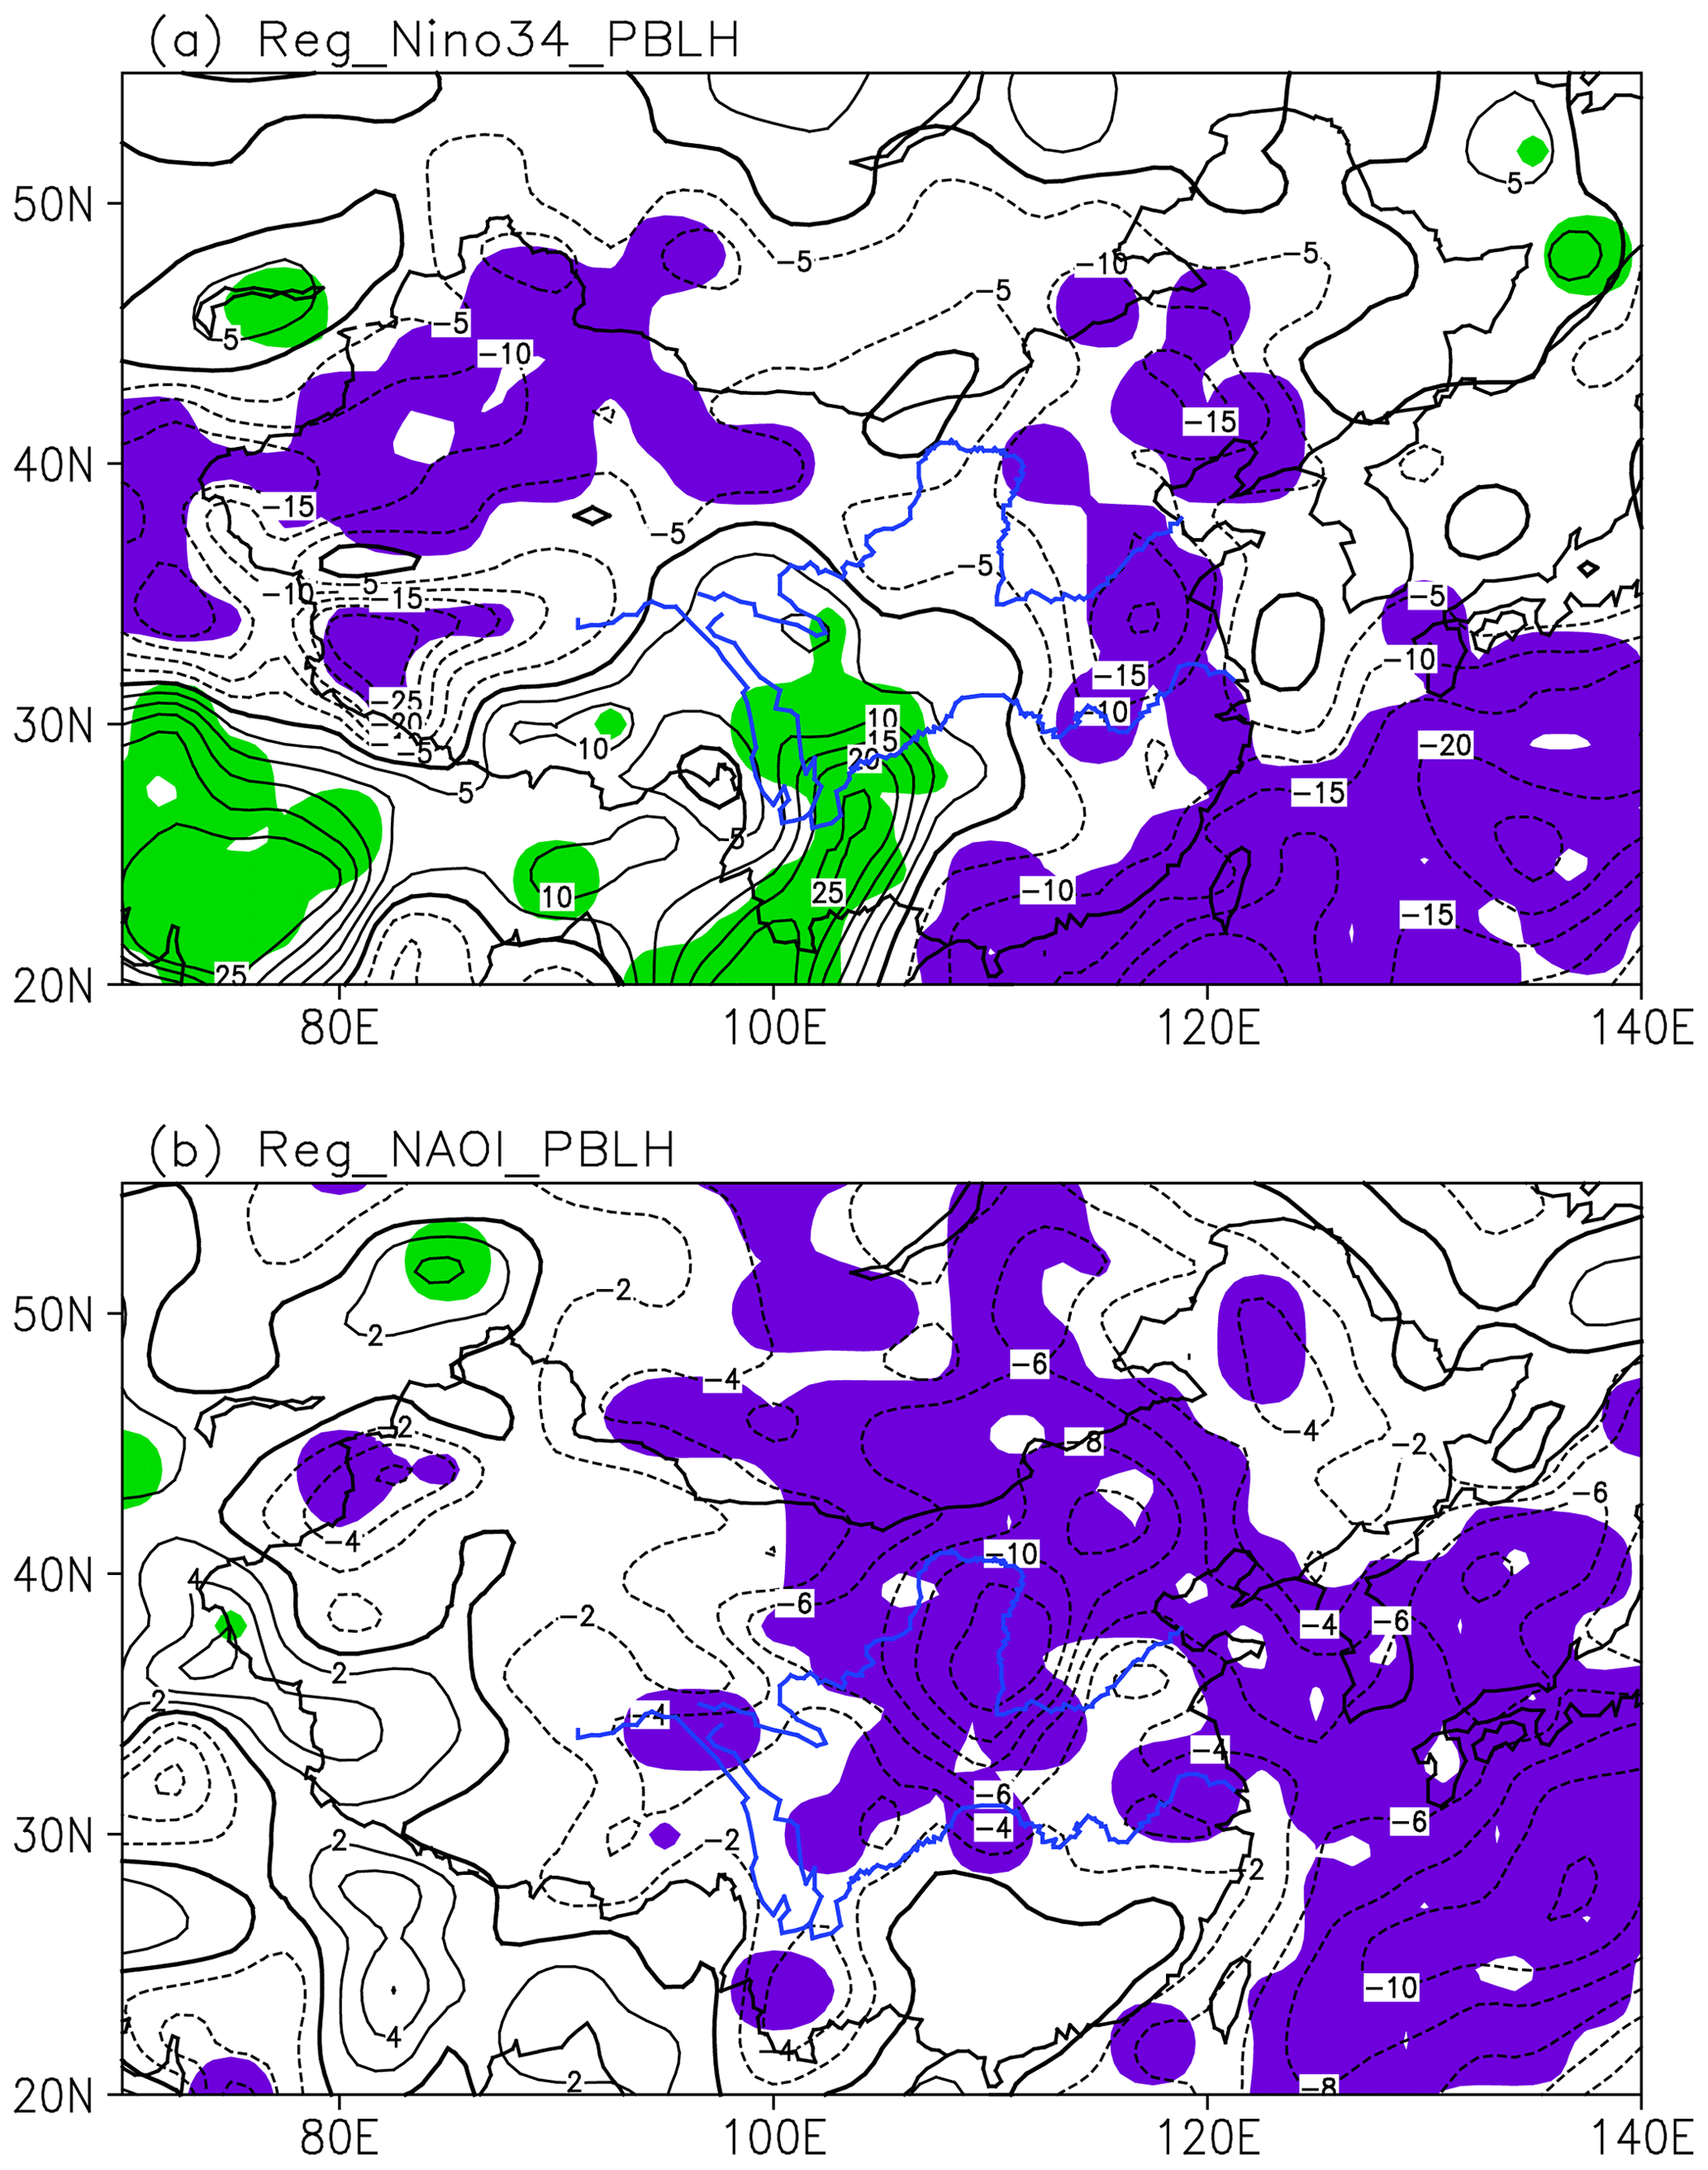
Figure 8Regressions of the planetary boundary layer height (PBLH) onto the (a) 3 month leading Niño 3.4 index and (b) simultaneous NAOI. Color shading indicates significance at the 0.05 level.
4.2 Circulation anomalies associated with NAO
The anomalous divergence accompanied by the simultaneous NAO is presented in Fig. 9. The northern Atlantic Ocean is influenced by an anomalous tripole structure, showing convergence–divergence–convergence anomalies from the polar region to the tropical regions. The occurrence of the anomalous circulation structure in the northern Atlantic Ocean is due to the fact that the variation in NAO would induce an anomalous tripole SST pattern within the northern Atlantic Ocean (e.g., Wu et al., 2009; Zheng et al., 2016) by which a downstream wave train is expected to be observed (Ruan et al., 2015; Li and Ruan, 2018). The downstream wave train is seen with significant positive anomalies over southern China in the regression of NAOI to the divergence, while negative anomalies occur over northern China. That is, a positive NAO is accompanied with anomalous divergence (convergence) over southern (northern) China. The anomalous convergence over northern China is unfavorable for the emission of AC, corresponding to enhanced AC. However, the opposite situation is observed over southern China. The anomalous circulation connected with NAO further estimates the negative impacts of NAO on the EOF2 mode.

Figure 9Regressions of the convergence at 300 hPa onto the simultaneous NAOI. Color shading indicates significance at the 0.05 level.
In addition, the potential impacts of NAO on PBLH over China are further examined. Figure 8b shows the anomalous PBLH regressed with reference to the NAOI to identify the role of NAO in determining the EOF2 mode. For a positive NAO phase, negative PBLH anomalies occupy northern China, suggesting a favorable condition for enhanced ACs. In contrast, southern China is controlled by positive PBLH anomalies, paralleling the situation for decreased ACs. The circulation anomalies connected with NAO in both the divergence and PBLH suggest that the impacts of NAO on the ACs over northern and southern China are opposite, consistent with the spatial distribution of the EOF2 mode.
4.3 Role of temperature
Meanwhile, it has been reported that temperature shows an effect on impacting the distribution of aerosols. For example, it is reported that an increase in temperature is associated with a decrease in PM2.5 over southern California (Aw and Kleeman, 2003), because enhanced temperature leads to decreases in organics and nitrate (Dawson et al., 2007). Accordingly, the associated impacts of the ENSO and NAO on the temperature over China are detected. Figure 10 displays the anomalous temperature regressed against the 3 months preceding the Niño 3.4 index and simultaneous NAOI to detect the temperature anomalies connected with the two climate systems. For a warm event of ENSO, large areas of negative temperature anomalies occupy eastern China, with the maximum lying within the Yellow River and Yangtze river (Fig. 10a). The negative temperature anomalies imply a lower temperature condition, which would induce enhanced ACs.
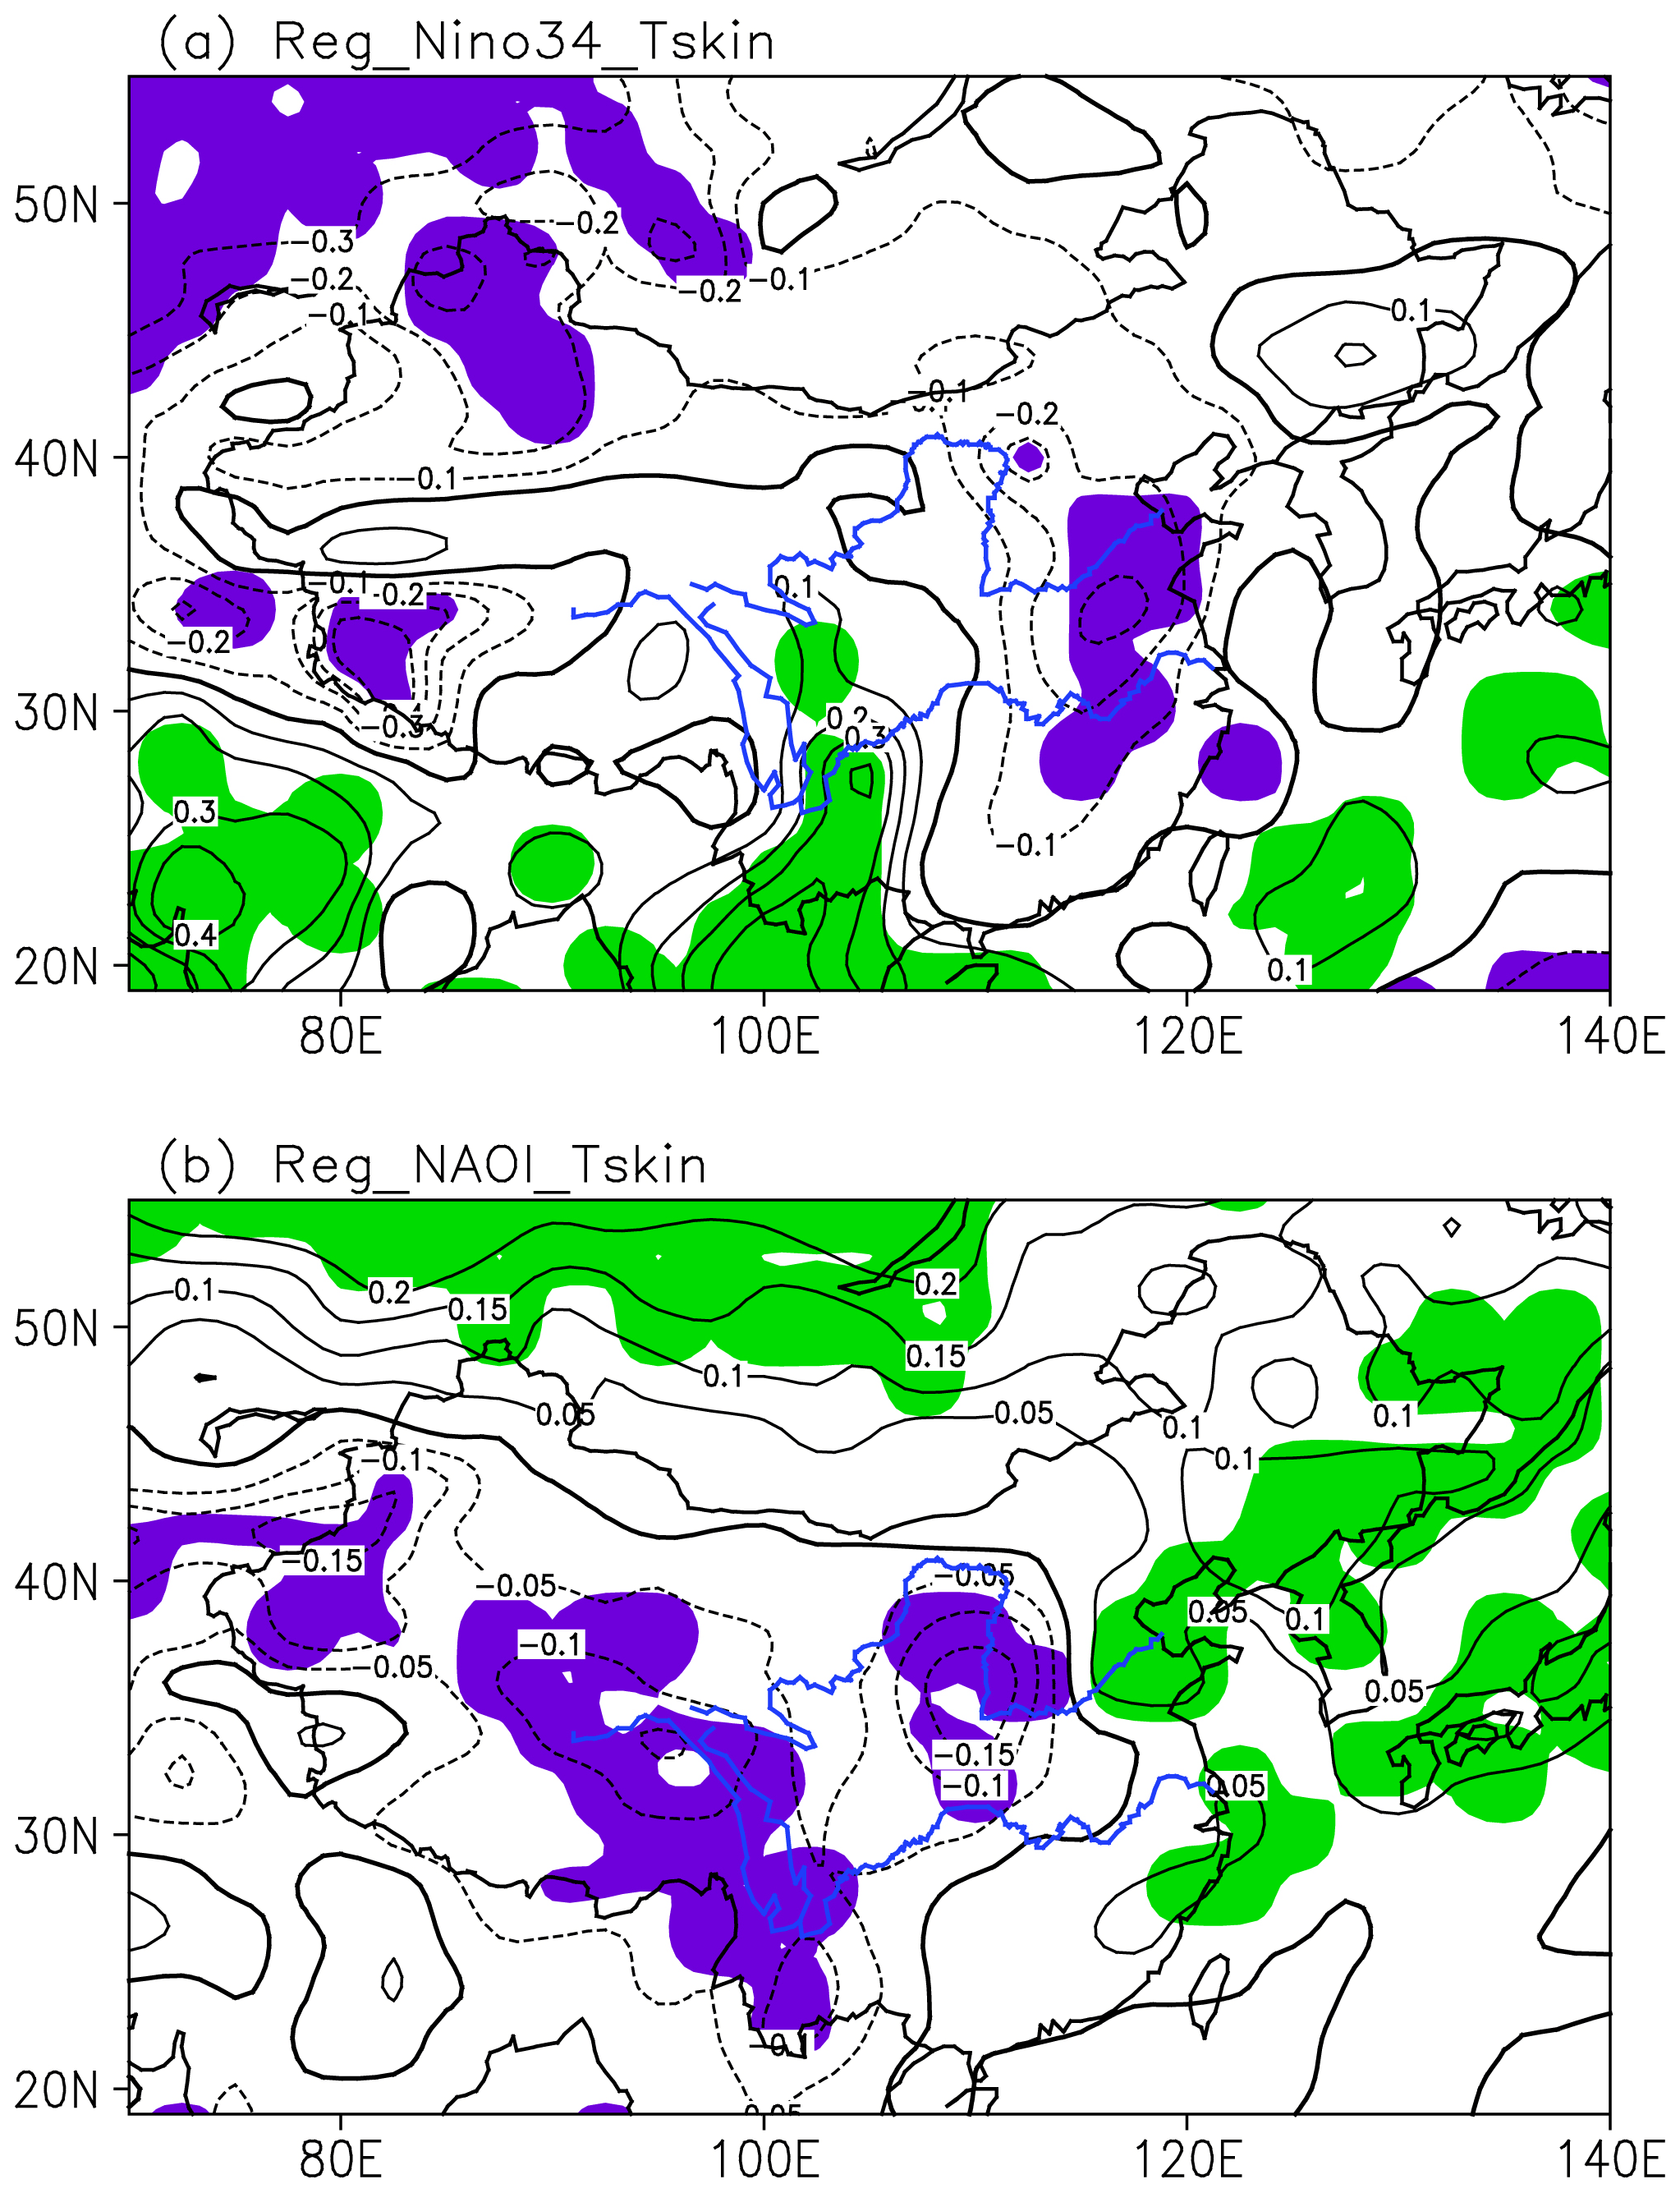
Figure 10Regressions of the skin temperature onto the (a) 3 month leading Niño 3.4 index and (b) simultaneous NAOI. Color shading indicates significance at the 0.05 level.
For the NAO, its positive phase corresponds to opposite temperature anomalies over southern and northern China, being positive (negative) over southern (northern) China (Fig. 10b). Positive temperature anomalies over southern China parallels a warmer situation and reduced ACs in this region. Negative temperature anomalies over northern China set up a background of colder situations, which would increase ACs. The anomalous variation in the temperature agrees with the negative impact of NAO on the ACs over eastern China. In addition, the temperature anomalies accompanied with the preceding ENSO are greater than those associated with the simultaneous NAO, highlighting the dominant role of ENSO in impacting the ACs over eastern China.
China has a high loading of aerosols and understanding the variability in AC is important not only for recognizing the interactions between aerosols and climate but also for scientifically understanding the current pollutant status. In the present work, it is shown that the month-to-month variability of ACs over China is dominated by two principal modes: the monopole mode and the meridional dipole mode. The first monopole mode mainly exhibits the enhanced AC pattern over eastern China. The dipole mode shows two centers over northern and southern China, with positive (negative) values over southern (northern) China. The potential linkages between the two modes and climatic sources are further described. The first monopole mode is linked with the 3 months preceding ENSO, and the second dipole mode is connected with the simultaneous NAO.
The possible physical mechanism is also investigated by examining the dynamic and thermal processes involved. For the monopole mode, the preceding ENSO can induce anomalous convergence and decrease PBLH over eastern China, which are not favorable for the emission of aerosols. Meanwhile, it is seen that anomalous negative temperature over eastern China is accompanied with the preceding ENSO events, paralleling conditions favorable for enhanced ACs. For the meridional dipole mode, anomalous convergence (divergence) and decreased (increased) PBLH are found over northern (southern) China, paralleling the conditions for increased (decreased) ACs under the positive phase of NAO. Moreover, the temperature anomalies associated with the NAO over southern and northern China are opposite, agreeing well with the spatial distribution of the dipole mode. That is, both the dynamic and thermal anomalies associated with climate systems are contributed to by the formation of the leading variabilities of ACs over China.
On the other hand, as reported, wet deposition shows important effects that are influencing the anomalous distribution of ACs (Wu, 2014). However, the role of wet deposition is not discussed in the present work. This is because the influences of ENSO on the seasonal rainfall over China are complex and vary along with the phases of ENSO events. During the decaying summer of a warm ENSO event, above-average rainfall is expected to be observed over southern China (e.g., Huang and Wu, 1989; Feng et al., 2016); however, this is not the case for the developing summer (Feng et al., 2016). Moreover, when the intensities of the ENSO events are different, i.e., moderate events vs. strong events, their impacts on the seasonal rainfall over China may vary differently (Xue and Liu, 2008). In addition, it has been indicated that the influence of rainfall on the aerosols exhibits a seasonal and regional dependence (Wu, 2014; Feng et al., 2016), and it is found that the role of rainfall is limited in affecting the winter aerosols over southern China (Wu, 2014). However, the month-to-month variability of ACs is considered in this study, whereas for a specific season the potential impacts of wet deposits in determining the distribution of aerosols is complex and uncertainties exist.
In addition, as it is reported that aerosols have profound effects on climate through aerosol–cloud–radiation interactions, we have further examined the potential impacts of different emissions levels on the distributions of ACs. Sensitivity experiments are designed by fixing the emissions at the level of the year 1986 (low emission) with meteorology fields at 1986 and 2006; emissions at the level of the year 2006 (high emission) are fixed with meteorology fields at 1986 and 2006. It is found that even if the emission level is the same, the simulated ACs are different under different meteorology conditions, suggesting the role of meteorological conditions in impacting the aerosol concentrations (figure not shown). However, when the anthropogenic emissions have times increased, the variation of aerosol concentrations is mainly attributed to the emissions. Due to the limitation of the present study, the relative role of emissions and meteorological conditions on the ACs will be discussed in our future work.
Furthermore, the characteristics of the month-to-month variability of aerosols over China are explored; the result highlights the impacts of tropical SST (i.e., ENSO) and the atmospheric system (i.e., NAO or NAM) originating from the Northern Hemisphere on the variability in ACs over China. As reported, both ENSO and NAO display considerable influences on the climate anomalies over China (e.g., Huang and Wu, 1989; Zhang et al., 1996; Gong and Wang, 2003; Li and Wang, 2003), and the result here expands their influences beyond climate. Climate systems, e.g., originating from the Southern Hemisphere, display essential influences in affecting seasonal rainfall and temperature anomalies via atmospheric bridges and oceanic bridges (Zheng et al., 2015, 2018). Future work will further examine the potential impacts of the Southern Hemisphere climate systems on the variation in ACs over China to comprehensively assess the modulations of climate systems on the ACs over China.
The HadISST dataset can be downloaded from http://www.metoffice.gov.uk/hadobs/hadisst/data/download.html (last access: 24 August 2020) (Rayner et al., 2003). The NCEP/NCAR reanalyses can be downloaded from http://www.esrl.noaa.gov/psd/data/gridded/ (last access: 24 August 2020) (Kalnay et al., 1996). Simulation results and codes to generate figures in this paper have been archived by corresponding authors and are available at https://doi.org/10.5281/zenodo.3247326 (Feng et al., 2019b).
JLZ and JF conducted the study design. JLZ performed the simulations. JF and JLZ carried out the data analysis. JPL and HL were involved in the scientific interpretation. JF prepared the article with contributions from all coauthors.
The authors declare that they have no conflict of interest.
This research has been supported by the National Natural Science Foundation of China (grant nos. 41790474, 41705131, and 41975079) and the National Key R & D Program of China (2016YFA0601801).
This research has been supported by the National Natural Science Foundation of China (grant nos. 41790474, 41705131, and 41975079) and the National Key R&D Program of China (grant no. 2016YFA0601801).
This paper was edited by Holger Tost and reviewed by two anonymous referees.
Aw, J. and Kleeman, M. J.: Evaluating the first-order effect of intra-annual temperature variability on urban air pollution, J. Geophys. Res.-Atmos., 108, 4365, https://doi.org/10.1029/2002JD002688, 2003.
Chen, B. Q. and Yang, Y. M.: Remote sensing of the spatio-temporal pattern of aerosol over Taiwan Strait and its adjacent sea areas, Acta Scient. Circumstant., 28, 2597–2604, 2008.
Cowan, T. and Cai, W. J.: The impact of Asian and non-Asian anthropogenic aerosols on 20th century Asian summer monsoon, Geophys. Res. Lett., 38, L11703, https://doi.org/10.1029/2011GL047268, 2011.
Dawson, J. P., Adams, P. J., and Pandis, S. N.: Sensitivity of PM2.5 to climate in the Eastern US: a modeling case study, Atmos. Chem. Phys., 7, 4295–4309, https://doi.org/10.5194/acp-7-4295-2007, 2007.
Feng, J., Li, J. P., Zheng, F., Xie, F., and Sun, C.: Contrasting impacts of developing phases of two types of El Niño on southern China rainfall, J. Meteorol. Soc. Jpn., 94, 359–370, https://doi.org/10.2151/jmsj.2016-019, 2016.
Feng, J., Li, J. P., Zhu, J. L., Liao, H., and Yang, Y.: Simulated contrasting influences of two La Niña Modoki events on aerosol concentrations over eastern China, J. Geophys. Res.-Atmos., 122, 2734–2749, https://doi.org/10.1002/2016JD026175, 2017.
Feng, J., Li, J., Liao, H., and Zhu, J.: Simulated coordinated impacts of the previous autumn North Atlantic Oscillation (NAO) and winter El Niño on winter aerosol concentrations over eastern China, Atmos. Chem. Phys., 19, 10787–10800, https://doi.org/10.5194/acp-19-10787-2019, 2019a.
Feng, J., Li, J., Liao, H., and Zhu, J.: Simulated coordinated impacts of the previous autumn NAO and winter El Niño on the winter aerosol concentrations over eastern China [Data set], Zenodo, https://doi.org/10.5281/zenodo.3247326, 2019b.
Generoso, S., Bey, I., Labonne, M., and Breon, F. M.: Aerosol vertical distribution in dust outflow over the Atlantic: Comparisons between GEOS© Chem and Cloud© Aerosol Lidar and Infrared Pathfinder Satellite Observation (CALIPSO), J. Geophys. Lett. Atmos., 113, D24209, https://doi.org/10.1029/2008JD010154, 2008.
Gong, D. Y. and Wang, S. W.: Influence of Arctic Oscillation on winter climate over China, J. Geogr. Sci., 13, 208–216, https://doi.org/10.1007/BF02837460, 2003.
Gong, D. Y., Wang, S. W., and Zhu, J. H.: East Asian Winter Monsoon and Arctic Oscillation, Geophys. Res. Lett., 28, 2073–2076, https://doi.org/10.1029/2000GL012311, 2001.
Guo, S., Hu, M., Zamora, M. L., Peng, J. F., Shang, D. J., Zheng, J., Du, Z. F., Wu, Z. J., Shao, M., Zeng, L. M., Molina, M. J., and Zhang, R. Y.: Elucidating severe urban haze formation in China, P. Natl. Acad. Sci. USA, 111, 17373–17378, https://doi.org/10.1073/pnas.1419604111, 2014.
Han, S. Q., Wu, J. H., Zhang, Y. F., Cai, Z. Y., Feng, Y. C., Yao, Q., Li, X. J., Liu, Y. W., and Zhang, M.: Characteristics and formation mechanism of a winter haze–fog episode in Tianjin, China, Atmos. Environ., 98, 323–330, https://doi.org/10.1016/j.atmosenv.2014.08.078, 2014.
Huang, J. P., Lin, B., Minnis, P., Wang, T., Wang, X., Hu, Y., Yi, Y., and Ayers, J. R.: Satellite-based assessment of possible dust aerosols semi-direct effect on cloud water path over East Asia, Geophys. Res. Lett., 33, L19802, https://doi.org/10.1029/2006GL026561, 2006.
Huang, J. P., Wang, T., Wang, W., Li, Z., and Yan, H.: Climate effects of dust aerosols over East Asian arid and semiarid regions, J. Geophys. Res.-Atmos., 119398–11416, https://doi.org/10.1002/2014JD021796, 2014.
Huang, R. H. and Wu, Y. F.: The influence of ENSO on the summer climate change in China and its mechanism, Adv. Atmos. Sci., 6, 21–32, https://doi.org/10.1007/BF02656915, 1989.
IPCC: Climate change: The physical science basis, Cambridge University Press, Cambridge, UK, 2013.
Jeong, J. I. and Park, R. J.: Winter monsoon variability and its impacts on aerosol concentrations in East Asia, Environ. Poll., 221, 285–292, https://doi.org/10.1016/j.envpol.2016.11.075, 2017.
Jeong, J. I., Park, R. J., Woo, J. H., Han, Y. J., and Yi, S. M.: Source contributions to carbonaceous aerosol concentrations in Korea, Atmos. Environ., 45, 1116–1125, https://doi.org/10.1016/j.atmosenv.2010.11.031, 2011.
Jiang, Z. H., Huo, F., and Ma, H. Y., Impact of Chinese Urbanization and Aerosol Emissions on the East Asian Summer Monsoon, J. Climate, 30, 1019–1039, https://doi.org/10.1175/JCLI-D-15-0593.1, 2016.
Kalnay, E., Kanamitsu, M., Kistler, R., Colliins, W., Deaven, D., Gandin, L., Iredell, M., Saha, S., White, G., Woollen, J., Zhu, Y., Chelliah, M., Ebisuzaki, W., Higgins, W., Janowiak, J., Mo, K. C., Ropelewski, C., Wang, J., Leetmaa, A., Reynolds, R., Jenne, R., and Joseph, D.: The NCEP/NCAR 40-Year Reanalysis Project, B. Am. Meteorol. Soc., 77, 437–472, https://doi.org/10.1175/1520-0477(1996)077<0437:TNYRP>2.0.CO;2, 1996.
Li, J. P. and Ruan, C. Q.: The North Atlantic–Eurasian teleconnection in summer and its effects on Eurasian climates, Environ. Res. Lett., 13, 024007, https://doi.org/10.1088/1748-9326/aa9d33, 2018.
Li, J. P. and Wang, J. X. L.: A new North Atlantic Oscillation index and its variability, Adv. Atmos. Sci., 20, 661–676, https://doi.org/10.1007/BF02915394, 2003.
Li, K., Jacob, D. J., Hong, L., Zhu, J., Shah, V., Shen, L., Bates, K. H., Zhang, Q., and Zhai, S. X.: A two-pollutant strategy for improving ozone and particulate matter air quality in China, Nat. Geosci., 12, 906–910, https://doi.org/10.1038/s41561-019-0464-x, 2019.
Li, Z. Q., Lau, W. K., Ramanathan, V., Wu, G., Ding, Y., Manoj, M. G., Liu, J., Qian, Y., Li, J., Zhou, T., Fan, J., Risenfeld, D., Ming, Y., Wang, Y., Huang, J., Wang, B., Xu, X., Lee, S.-S., Cribb, M., Zhang, F., Yang, X., Takemura, T., Wang, K., Xia, X., Yin, Y., Zhang, H., Guo, J., Zhai, P. M., Sugimoto, N., Babu, S. S., and Brasseur, G. P.: Aerosol and monsoon climate interactions over Asia, Rev. Geophys., 54, 866–929, https://doi.org/10.1002/2015RG000500, 2016.
Liao, H., Henze, D. K., Seinfeld, J. H., Wu, S. L., and Mickley, L. J.: Biogenic secondary organic aerosol over the United States: Comparison of climatological simulations with observations, J. Geophys. Res., 112, D06201, https://doi.org/10.1029/2006JD007813, 2007.
Liao, H., Chang, W., and Yang, Y.: Climatic effects of air pollutants over China: A review, Adv. Atmos. Sci., 32, 115–139, https://doi.org/10.1007/s00376-014-0013-x, 2015.
Lin, J. T. and McElroy, M. B.: Impacts of boundary layer mixing on pollutant vertical profiles in the lower troposphere: Implications to satellite remote sensing, Atmos. Environ., 44, 1726–1739, https://doi.org/10.1016/j.atmosenv.2010.02.009, 2010.
Lou, S. J., Russell, L. M., Yang, Y., Xu, L., Lamjiri, M. A., DeFlorio, M. J., Miller, A. J., Ghan, S. J., Liu, Y., and Singh, B.: Impacts of the East Asian Monsoon on springtime dust concentrations over China, J. Geophys. Res.-Atmos., 121, 8137–8152, https://doi.org/10.1002/2016JD024758, 2016.
Lou, S. J., Yang, Y., Wang, H. L., Smith, S. J., Qian, Y., Rasch, P. J.: Black carbon amplifies haze over the North China Plain by weakening the East Asian winter monsoon, Geophys. Res. Lett., 45, 452–460, https://doi.org/10.1029/2018GL080941, 2018.
Mao, Y.-H., Liao, H., and Chen, H.-S.: Impacts of East Asian summer and winter monsoons on interannual variations of mass concentrations and direct radiative forcing of black carbon over eastern China, Atmos. Chem. Phys., 17, 4799–4816, https://doi.org/10.5194/acp-17-4799-2017, 2017.
North, G. R., Bell, T. L., Cahalan, R. F., and Moeng, F. J.: Sampling errors in the estimation of empirical orthogonal functions, Mon. Weather Rev., 110, 699–706, https://doi.org/10.1175/1520-0493(1982)110<0699:SEITEO>2.0.CO;2, 1982.
Quan, J. N., Tie, X. X., Zhang, Q., Liu, Q., Li, X., Gao, Y., Zhao, D. L.: Characteristics of heavy aerosol pollution during the 2012-2013 winter in Beijing, China, Atmos. Environ., 88, 83–89, https://doi.org/10.1016/j.atmosenv.2014.01.058, 2014.
Rayner, N. A., Parker, D. E., Horton, E. B., Folland, C. K., Alexander, L. V., and Rowell, D. P.: Global analyses of sea surface temperature, sea ice, and night marine air temperature since the late nineteenth century, J. Geophys. Res., 108, 4407, https://doi.org/10.1029/2002JD002670, 2003.
Rosenfeld, D., Dai, J., Yu, X., Yao, Z. Y., Xu, X. H., Yang, X., and Du, C. L.: Inverse relations between amounts of air pollution and orographic precipitation, Science, 315, 1396–13398, https://doi.org/10.1126/science.1137949, 2007.
Ruan, C. Q., Li, J. P., and Feng, J.: Statistical downscaling model for late-winter rainfall over southwest China, Sci. China Earth Sci., 58, 1827–1839, https://doi.org/10.1007/s11430-015-5104-8, 2015.
Thompson, D. W. J. and Wallace, J. M.: The Arctic oscillation signature in the wintertime geopotential height and temperature fields, Geophys. Res. Lett., 25, 1297–1300, https://doi.org/10.1029/98GL00950, 1998.
Thompson, R. D.: The impact of atmospheric aerosols on global climate: a review, Prog. Phys. Geogr., 19, 336–350, https://doi.org/10.1177/030913339501900303, 1995.
Wang, L., Chen, W., and Huang, R. H.: Interdecadal modulation of PDO on the impact of ENSO on the east Asian winter monsoon, Geophys. Res. Lett., 35, L20702, https://doi.org/10.1029/2008GL035287, 2008.
Wu, R. G.: Seasonal dependence of factors for year-to-year variations of South China aerosol optical depth and Hong Kong air quality, Int. J. Climatol., 34, 3204–3220, https://doi.org/10.1002/joc.3905, 2014.
Wu, R. G. and Wang, B.: A Contrast of the East Asian Summer Monsoon–ENSO Relationship between 1962–77 and 1978–93, J. Climate, 15, 3266–3279, https://doi.org/10.1175/1520-0442(2002)015<3266:ACOTEA>2.0.CO;2, 2002.
Wu, Z. W., Wang, B., Li, J. P., and Jin, F.-F.: An empirical seasonal prediction model of the east Asian summer monsoon using ENSO and NAO, J. Geophys. Res., 114, D18120, https://doi.org/10.1029/2009JD011733, 2009.
Xie, S. P., Hu, K. M., Hafner, J., Tokinaga, H., Du, Y., Huang, G., and Sampe, T.: Indian Ocean capacitor effect on Indo–Western Pacific climate during the summer following El Niño, J. Climate, 22, 730–747, https://doi.org/10.1175/2008JCLI2544.1, 2009.
Xue, F. and Liu, C. Z.: The influence of moderate ENSO on summer rainfall in eastern China and its comparison with strong ENSO, Chin. Sci. Bull., 53, 791–800, https://doi.org/10.1007/s11434-008-0002-5, 2008.
Yang, Y., Liao, H., and Lou, S. J.: Decadal trend and interannual variation of outflow of aerosols from East Asia: roles of variations in meteorological parameters and emissions, Atmos. Environ., 100, 141–153, https://doi.org/10.1016/j.atmosenv.2014.11.004, 2015.
Yang, Y., Russell. L. M., Lou, S., Liao, H., Guo, J., Liu, Y., Singh, B., and Ghan, J.: Dust-wind interactions can intensify aerosol pollution over eastern China, Nat. Commun., 8, 15333, https://doi.org/10.1038/ncomms15333, 2017.
Zhang, Q., Quan, J. N., Tie, X. X., Huang, M. Y., and Ma, X. C.: Impact of aerosol particles on cloud formation: aircraft measurements in China, Atmos. Environ., 45, 665–672, https://doi.org/10.1016/j.atmosenv.2010.10.025, 2011.
Zhang, R. H., Sumi, A., Kimoto, M.: Impact of El Niño on the East Asian Monsoon, J. Meteorol. Soc. Jpn., 74, 49–62, https://doi.org/10.2151/jmsj1965.74.1_49, 1996.
Zhao, S., Li, J., and Sun, C.: Decadal variability in the occurrence of wintertime haze in central eastern China tied to the Pacific Decadal Oscillation, Scient. Rep., 6, 27424, https://doi.org/10.1038/srep27424, 2016.
Zheng, F., Li, J., Wang, L., Xie, F., and Li, X. F.: Cross-seasonal influence of the December–February Southern Hemisphere Annular Mode on March–May meridional circulation and precipitation, J. Climate, 28, 6859–6881, https://doi.org/10.1175/JCLI-D-14-00515.1, 2015.
Zheng, F., Li, J., Li, Y. J., Zhao, S., and Deng, D. F.: Influence of the summer NAO on the spring-NAO-based predictability of the East Asian summer monsoon, J. Appl. Meteorol. Clim., 55, 1459–1476, https://doi.org/10.1175/JAMC-D-15-0199.1, 2016.
Zheng, F., Li, J. P., Kucharski, F., Ding, R. Q., and Liu, T.: Dominant SST Mode in the Southern Hemisphere extratropics and its influence on atmospheric circulation, Adv. Atmos. Sci., 35, 881–895, https://doi.org/10.1007/s00376-017-7162-7, 2018.
Zhou, W., Wang, X., Zhou, T. J., Li, C., Chan, J. C. L.: Interdecadal variability of the relationship between the East Asian winter monsoon and ENSO, Meteorol. Atmos. Phys., 98, 283–293, https://doi.org/10.1007/s00703-007-0263-6, 2007.
Zhu, J. L., Liao, H., and Li, J. P.: Increases in aerosol concentrations over eastern China due to the decadal-scale weakening of the East Asian summer monsoon, Geophys. Res. Lett., 39, L09809, https://doi.org/10.1029/2012GL051428, 2012.
- Abstract
- Introduction
- Datasets, model, and methodology
- Distinct leading modes of the variability in aerosol concentrations
- Physical processes impacting on the leading modes
- Conclusions and discussions
- Data availability
- Author contributions
- Competing interests
- Acknowledgements
- Financial support
- Review statement
- References