the Creative Commons Attribution 4.0 License.
the Creative Commons Attribution 4.0 License.
 | 18 Aug 2020
Variations in Ncn and Nccn over marginal seas in China related to marine traffic emissions, new particle formation and aerosol aging
Deqiang Zhang
Juntao Wang
Huiwang Gao
Xiaohong Yao
In this study, a cruise campaign was conducted over marginal seas in China to measure the concentrations of condensation nuclei (Ncn), cloud condensation nuclei (Nccn) and other pollutants from day of year (DOY) 110 to DOY 135 of 2018. The ship self-emission signals were exhaustively excluded, and the mean values of Nccn during the cruise campaign were found to slightly increase from cm−3 (mean ± standard deviation) at supersaturation (SS) of 0.2 % to cm−3 at SS of 1.0 %, and the mean value for Ncn was cm−3. Data analysis showed that marine traffic emissions apparently largely contributed to the increase in Ncn in the daytime, especially in the marine atmospheres over heavily traveled sea zones; however, the fresh sources made no clear contribution to the increase in Nccn. This finding was supported by the quantitative relations between Ncn and Nccn at SS = 0.2 %–1.0 % against the mixing ratios of SO2 in the ship self-emission plumes – i.e., a 1 ppb increase in SO2 corresponded to a 1.4×104 cm−3 increase in Ncn but only a 30–170 cm−3 increase in Nccn, possibly because of abundant organics in the aerosols. Smooth growth can be observed in the marine-traffic-derived particles, reflecting aerosol aging. The estimated hygroscopicity parameter (κ) values were generally as high as 0.46–0.55 under the dominant onshore winds, suggesting that inorganic ammonium aerosols likely acted as the major contributor to Nccn largely through aerosol aging processes of decomposing organics. Moreover, the influences of the new transported particles from the continent on the Ncn and Nccn in the marine atmosphere were investigated.
- Article
(3213 KB) - Full-text XML
-
Supplement
(1075 KB) - BibTeX
- EndNote


Oceans occupy approximately 2∕3 of the Earth's surface, and water evaporation from oceans is a major source of moisture in the atmosphere. Aerosol–cloud interactions in marine atmospheres, ranging from tropical to polar regions, have attracted great attention in the past few decades due to their impact on climate change (Huebert et al., 2003; Yu and Luo, 2009; Quinn and Bates, 2011; Wang et al., 2014; Brooks and Thornton, 2018; Rosenfeld et al., 2019). However, large uncertainties still exist in various marine atmospheres, e.g., the sources of aerosols, the concentrations of bulk cloud condensation nuclei (CCN) and aerosol CCN activation under various supersaturations. (Clarke et al., 2006; Decesari et al., 2011; Quinn and Bates, 2011; Saliba et al., 2019; Rosenfeld et al., 2019). These uncertainties are mainly determined by limited observations in marine atmospheres, although a few additional observations of the number concentrations of aerosols (Ncn) and CCN (Nccn) were recently reported in different marine atmospheres, e.g., over the Mediterranean (Bougiatioti et al., 2009), Sea of Japan (Yamashita et al., 2011), Bay of Bengal (Ramana and Devi, 2016), coast of California (Ruehl et al., 2009) and northwest Pacific Ocean (Wang et al., 2019).
In addition to sea-spray aerosols and secondarily formed aerosols from sea-derived gaseous precursors (O'Dowd et al., 1997; Clarke et al., 2006; Quinn and Bates, 2011; Blot et al., 2013; Fossum et al., 2018), marine traffic emits large amounts of aerosols and reactive gases (Chen et al., 2017). These pollutants may directly or indirectly contribute to CCN to some extent (Langley et al., 2010). In addition, the long-range transport of continental aerosols has been widely reported to act as an important source of CCN in marine atmospheres (Charlson et al., 1987; Huebert et al., 2003; Fu et al., 2017; Royalty et al., 2017; Sato and Suzuki, 2019; Wang et al., 2019). The continent-derived aerosol particles observed in marine atmospheres usually mix with different sources, such as biomass burning, dust and anthropogenic emissions (Feng et al., 2017; Lin et al., 2015; Guo et al., 2014, 2016). An appreciable fraction of organics reportedly exists in marine aerosols and continental aerosols upwind of oceans (O'Dowd et al., 2004; Feng et al., 2012, 2016; Quinn et al., 2015; Song et al., 2018; Ding et al., 2019). However, ammonium sulfate aerosols have been frequently reported to dominantly contribute to CCN-related aerosols in many marine atmospheres and lead to hygroscopicity parameters (κ) larger than 0.5 (Mochida et al., 2010; Cai et al., 2017; Fu et al., 2017; Royalty et al., 2017; Phillips et al., 2018). A question is naturally raised, i.e., where do particulate organics go in the marine aerosols enriched in ammonium sulfate? Anthropogenic emissions in China such as SO2 and NOx have generally increased since the 1980s and recently started to decrease, i.e., SO2 started to decrease in 2006 (Li et al., 2017), whereas NOx started to decrease in 2011 (Li et al., 2017; Liu et al., 2016). Together with the influence of the Asian monsoon, the marginal seas near China are inevitably affected by the outflow of continental aerosols (Guo et al., 2016; Feng et al., 2017). Observations of Ncn and Nccn in marine atmospheres over marginal seas near China help to address the data scarcity, understand the sources and dynamic changes in these parameters, and study their potential climate impacts.
In this study, cruise campaigns were conducted to measure the Nccn, Ncn, particle number size distributions, gaseous pollutants and aerosol composition of water-soluble ionic species over the marginal seas from 20 April 2018 (day of year – DOY 110) to 15 May 2018 (DOY 135), traveling from the East China Sea to the South China Sea and returning to the Yellow Sea. Spatiotemporal variations in the Ncn, Nccn and CCN activities of the aerosol particles were studied. The Kappa values of the aerosol particles from DOY 110 to DOY 118 over the marine environments were calculated and analyzed. Finally, we tried to establish relationship of Ncn and Nccn with the mixing ratios of SO2 in ship self-plumes and ambient marine air. The regression equations are valuable for the estimation of Ncn and Nccn from SO2 when the direct observations of Ncn and Nccn are not available.
2.1 Instruments and data sources
A cruise campaign was conducted across marginal seas in China from DOY 110 to DOY 135 of 2018 (Fig. 1a, b). A suite of instruments including a fast mobility particle sizer (FMPS; TSI Model 3091), CCN counter (CCNC; DMT Model 100), condensation particle counter (CPC; TSI Model 3775), gas analyzers, ambient ion monitor-ion chromatography (AIM-IC), etc., were onboard the commercial cargo ship Anqiang 87 for measurements. The FMPS was used to measure the particle number size distributions with mobility diameters from 5.6 to 560 nm in 32 channels at 1 s temporal resolution with an inlet flow of 10 L min−1. The CPC was used to report the Ncn ranging from 4 nm (50 % efficiency) to 3000 nm (Ncn) in 2 s time resolution with an inlet flow of 1.5 L min−1. The Ncn was then used to calibrate the particle number size distributions simultaneously measured by the FMPS on the basis of the procedure proposed by Zimmerman et al. (2015). Due to the severe oceanic conditions and humid weather conditions, the FMPS and CPC were out of service after DOY 118 and DOY 122, respectively. Prior to the campaign, the CCNC was calibrated with ammonium sulfate particles based on the standard procedure detailed by Rose et al. (2008). The calibration curve is shown in Fig. S1 in the Supplement. The total flow rate of CCNC was 0.45 L min−1, with a ratio of sample to sheath at 1∕10, and five supersaturations (SS) conditions were selected, including 0.2 %, 0.4 %, 0.6 %, 0.8 % and 1.0 %. More detailed information about the measurement of Nccn can be found in Wang et al. (2019).
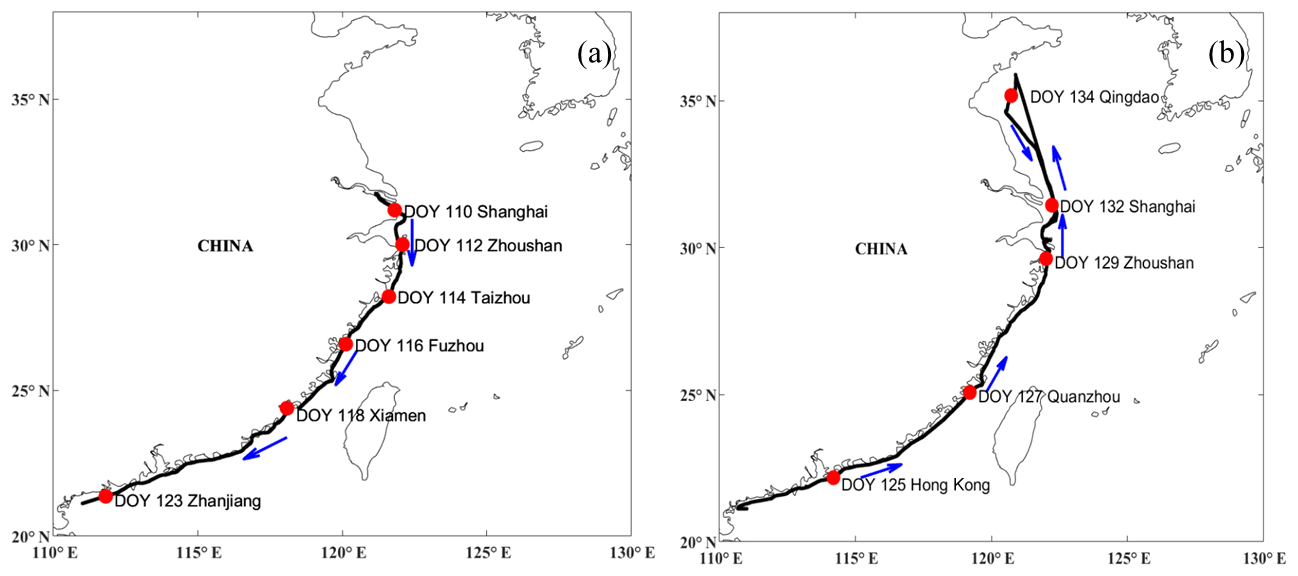
Figure 1The ship track during the campaign of 2018, where the blue arrows represent the sailing direction, with the (a) southward track and (b) northward track.
During the experiment, ambient particles were first sampled through a conductive tube (TSI, US) and a diffusion dryer filled with silica gel (TSI, US) and then split for analysis by means of different instruments with a splitter. All instruments were placed in an air-conditioned container on the deck of the ship, with an inlet height of approximately 6 m above sea level. Regarding the gas analyzers, the ambient O3 (Model 49i, Thermo Environmental Instruments Inc., USA C-series), SO2 (Model 43i, Thermo Environmental Instruments Inc., USA C-series) and NOx values (Model 42i, Thermo Environmental Instruments Inc., USA C-series) were measured in mixing ratios with a temporal resolution of 1 min. The CCNC and gas analyzers were operated properly throughout the entire campaign. The same was true for the AIM-IC, which was used to measure the water-soluble ionic species in the ambient particles sized smaller than 2.5 µm.
In this study, the Hybrid Single-Particle Lagrangian Integrated Trajectory (HYSPLIT) model from the NOAA Air Resources Laboratory was used to track the particle sources. The input of HYSPLIT, such as wind speed and wind direction, was obtained from the National Center for Environmental Prediction (NCEP) Global Data Assimilation System (GDAS) with a spatial resolution of 0.5∘.
The hygroscopicity parameter (κ) was calculated according to the method proposed by Petters and Kreidenweis (2007).
where Dd is the dry diameter, SC is the supersaturation, Mw is the molecular weight of water, σs∕a represents the surface tension over the interface of the solution and air with the value of 0.072 J m−2 applied in this study, R is the universal gas constant, T is the ambient temperature and ρw is the water density. Dd was not measured directly and was assumed to be equal to the critical diameter for CCN activation (Dcrit).Dcrit was defined as the particle diameter which is considered as the lower limit of the integral on particle number, together with the upper limit setting as the largest particle diameter, yielding the total integrated particle number concentration equal to the CCN concentration (Hung et al., 2014; Cheung et al., 2020). The FMPS had a low size resolution, particularly at sizes greater than 90 nm, which did not allow accurate calculation of the Kappa values at SS = 0.2 %. At SS = 0.6 % and 0.8 %, the Kappa value was not calculated considering the complication in the explanation of the value, possibly reflecting the combined effects of particle size, mixing state and chemical composition.
2.2 Separating ambient signals of Ncn and Nccn from ship self-emissions
The data measured during the cruise campaign were frequently subject to interference from self-emission signals from the ship. The Ncn and Nccn over the marginal seas were first distinguished based on the source of the ambient environment or the ship self-emissions. The data measured at 18:00–24:00 LT on DOY 115 are used to illustrate the separation in Fig. 2, and the size distribution of the particle number concentration during DOYs 110–118 is shown in Figs. S2–S10 in the Supplement. At 18:00–21:11 LT (local time), a low Ncn of cm−3 was observed. The accumulation mode dominated the particle number concentration with a median mobility mode diameter of 105±4 nm (Fig. 2a). Afterwards, the Ncn rapidly increased by over 1 order of magnitude (Fig. 2b). The dominant particle number concentration mode changed from accumulation mode to Aitken mode, with the median mobility diameter of the Aitken mode stabilized at 47±4 nm for approximately 90 % of the time. The rapid increase in Ncn and the change in the mode size indicated the signal of the emissions of the ship itself. The ship self-emission interference after 21:11 was supported by additional evidence, e.g., a large decrease in the activation ratio (AR), defined as the quotient of Nccn and Ncn, from >0.5 to <0.2 at SS = 0.4 % (Fig. 2c) due to a large increase in Ncn but a much smaller magnitude enhancement of Nccn (Fig. 2b) and a rapid increase in NOx from <10 ppb to 192±99 ppb, NO∕NO2 from <0.1 to 0.7±0.3, and SO2 from <2 ppb to 6.2±2.4 ppb. Large changes were expected because the ship smoke stack was only approximately 10 m away from these detectors. Thus, based upon the features described above, certain criteria were designed in this study to identify ship self-emission signals to separate them from ambient signals, i.e., a net increase in Ncn beyond 5×104 cm−3 in 5 min, a median mobility mode diameter of approximately 50 nm, NO2 > 30 ppb and NO∕NO2 > 0.5.

Figure 2(a) Contour plot of particle number size distribution with the median mobility mode diameter shown in black hollow circles; (b) time series of per minute Ncn and half-hourly Nccn at SS = 0.4 %; (c) half-hourly AR values at SS = 0.4 %, (d) SO2 and NOx at nighttime on DOY 115.
3.1 Spatiotemporal variations in ambient Ncn during the cruise period
Figure 3 shows the time series of minutely averaged distributions of Ncn, Nccn and AR at SSs of 0.4 % and 1.0 % from DOY 110 to DOY 135, 2018, after the ship self-emission signals were exhaustively removed.
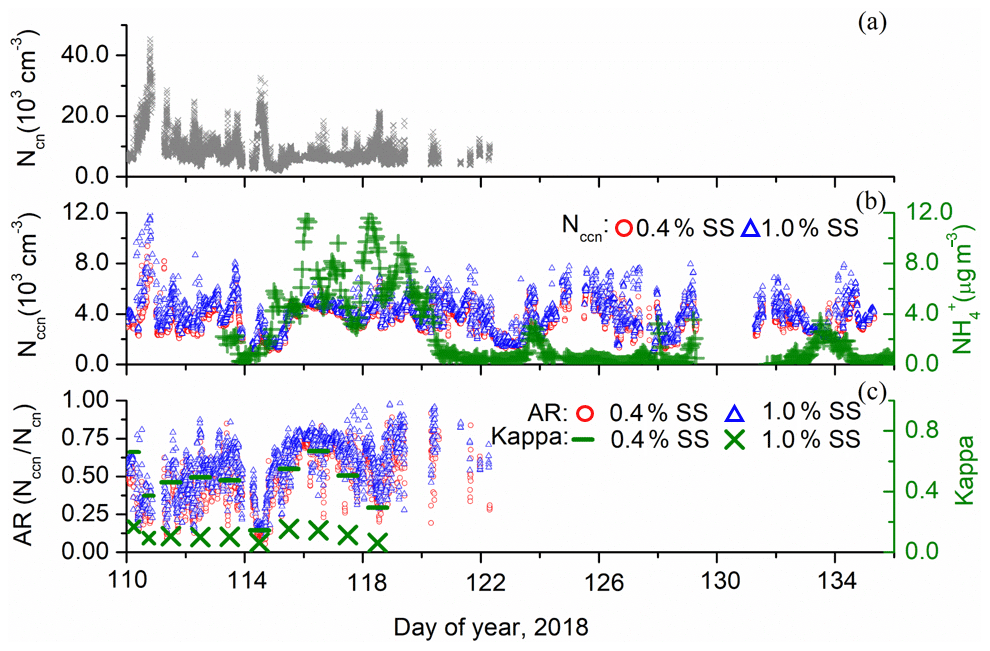
Figure 3Time series of (a) per minute Ncn from DOY 110 to 122; (b) per minute Nccn at SS of 0.4 % and 1.0 % during DOYs 110–135 and hourly during DOYs 113–135; (c) per minute AR at SS of 0.4 % and 1.0 % during DOYs 110–122 and daily Kappa values at SS of 0.4 % and 1.0 % from DOYs 110 to 118 due to data availability. Please note that for (c), most Kappa values were based on a daily scale, except on DOY 110, during which two Kappa values were calculated from 00:00–06:00 and 08:00–21:00.
When the spatiotemporal variations in Ncn were examined during the first half of the cruise period (Fig. 3a), it was found that Ncn spanned a broad range of 0.2–4.5×104 cm−3 with an average value of cm−3. Specifically, Ncn was only cm−3 at 00:00–06:00 LT on DOY 110 when the ship anchored at the Yangtze River estuary near Shanghai (Fig. 1). The low Ncn values were comparable to the mean value of Ncn (5.4×103 cm−3) in the marine-air cases during January–December 2010 in Shanghai reported by Leng et al. (2013). The Ncn greatly increased to cm−3 at 08:00–21:00 LT on DOY 110 when the ship cruised across the Yangtze River estuary. The measured particles in the number concentration were dominantly distributed in the Aitken mode on that day, while the median Aitken mode diameter shifted from 49±5 nm at 00:00–06:00 to 40±5 nm at 08:00–21:00 (Fig. S2). The Yangtze River estuary contains several world-class ports and is heavily traveled by marine traffic in the daytime (Chen et al., 2017). Since the onshore wind dominated on that day (not shown), the increase in Ncn and the decrease in the median Aitken mode diameter at 08:00–21:00 LT possibly reflected the increased contribution from marine traffic emissions. The marine traffic visibly decreased when the ship left the Yangtze River estuary toward the south. The Ncn value then significantly decreased, i.e., to cm−3 in the marine atmosphere over the sea zone in Zhejiang Province (from 07:00 LT on DOY 111 to 17:00 LT on DOY 114), with P<0.01. The Ncn further decreased to cm−3 in the marine atmosphere over the sea zone in Fujian Province (from 18:00 LT on DOY 114 to 14:00 LT on DOY 117). All these values were, however, 1–2 orders of magnitude greater than the background values in remote clear marine atmospheres, e.g., <300 particle cm−3 without the influence of industrial activities in the western Pacific and the tropical Pacific (Ueda et al., 2016) and those reported by Quinn and Bates (2011) and Saliba et al. (2019), indicating overwhelming contributions from non-sea-spray aerosols including marine traffic emissions, long-range continental transport, newly formed particles in marine atmospheres, etc. As reported, the atmospheric particles over marginal seas in China can be further transported to the remote northwest Pacific Ocean (NWPO) in spring under westerly winds – e.g., the Ncn observed over the NWPO in March–April 2014 was as high as cm−3 and approximately half of that over marginal seas in China observed in March 2014 (Wang et al., 2019).
The mean value of Ncn () observed in this study was close to that of cm−3 (the number concentrations of particles larger than 10 nm) observed over the eastern part of the Yellow Sea in spring 2017 according by Park et al. (2018). The authors attributed the high number concentrations of particles within nucleation and Aitken modes to the long-range transport of air pollutants over eastern China under the influence of westerly winds. Consistently, larger values of Ncn were frequently observed in the continental atmospheres upwind of the Yellow Sea, e.g., mean values of cm−3 in May 2013 in Qingdao, a coastal city in proximity to the Yellow Sea (Li et al., 2015), 3.18×104 cm−3 in February–August 2014 in Beijing (Dal Maso et al., 2016) and 1.0×104 cm−3 in continental-air cases during January–December 2010 in Shanghai (Leng et al., 2013).
3.2 Spatiotemporal variations in ambient Nccn during the cruise period
Nccn data were generally available during the entire campaign (Fig. 3b). The mean values of Nccn over marginal seas in China during DOY 110 to DOY 135, 2018, ranged from to cm−3 under SSs ranging from 0.2 % to 1.0 % (Table 1), which is 2 to 4 times larger than the Nccn at the same SS over the NWPO in March–April 2014 (Wang et al., 2019) and much higher, i.e., 1–2 orders of magnitude, than the pristine marine background values (Quinn and Bates, 2011). As discussed in the previous section, the mean Ncn in this study ( cm−3) was comparable to that of Ncn ( cm−3) over the Yellow Sea in spring 2017 in Park et al. (2018); however, the comparison of the mean Nccn reveals that the mean value ( cm−3) at SS of 0.6 % in this study was approximately 25 % smaller than that (4.8×103 cm−3 at a similar SS of 0.65 %) in Park et al. (2018), which was likely a result of long-range transport, considering the observations made a relatively long distance (i.e., 500–600 km) from the land depicted in Fig. 1 of Park et al. (2018) and the subsequently higher extent of aerosol aging. The Nccn under SS of 0.2 % in this study () is comparable to that () of Li et al. (2015) in the continental atmosphere of Qingdao in May 2013; however, the increment of Nccn with increasing SS was much weaker in our study, resulting in an average of 36 % smaller for Nccn under SSs of 0.4 % to 1.0 % compared to that of Li et al. (2015). The sensitivity differences in Nccn to SS between the relatively clean (i.e., Ncn of in this study) and polluted (with Ncn of cm−3) environments in Li et al. (2015) were also reported by Nair et al. (2020), which found little sensitivity in Nccn to changes in SS over the equatorial Indian Ocean (<6∘ N) with relatively clean air and much larger enhancement of Nccn with increasing SS in polluted marine atmospheres (>6∘ N).
Table 1Ncn and Nccn, AR and SO2 mixing ratios on DOYs 110–135, 2018, over marginal seas in China. Please note that Ncn and AR are from DOYs 110–122, 2018.
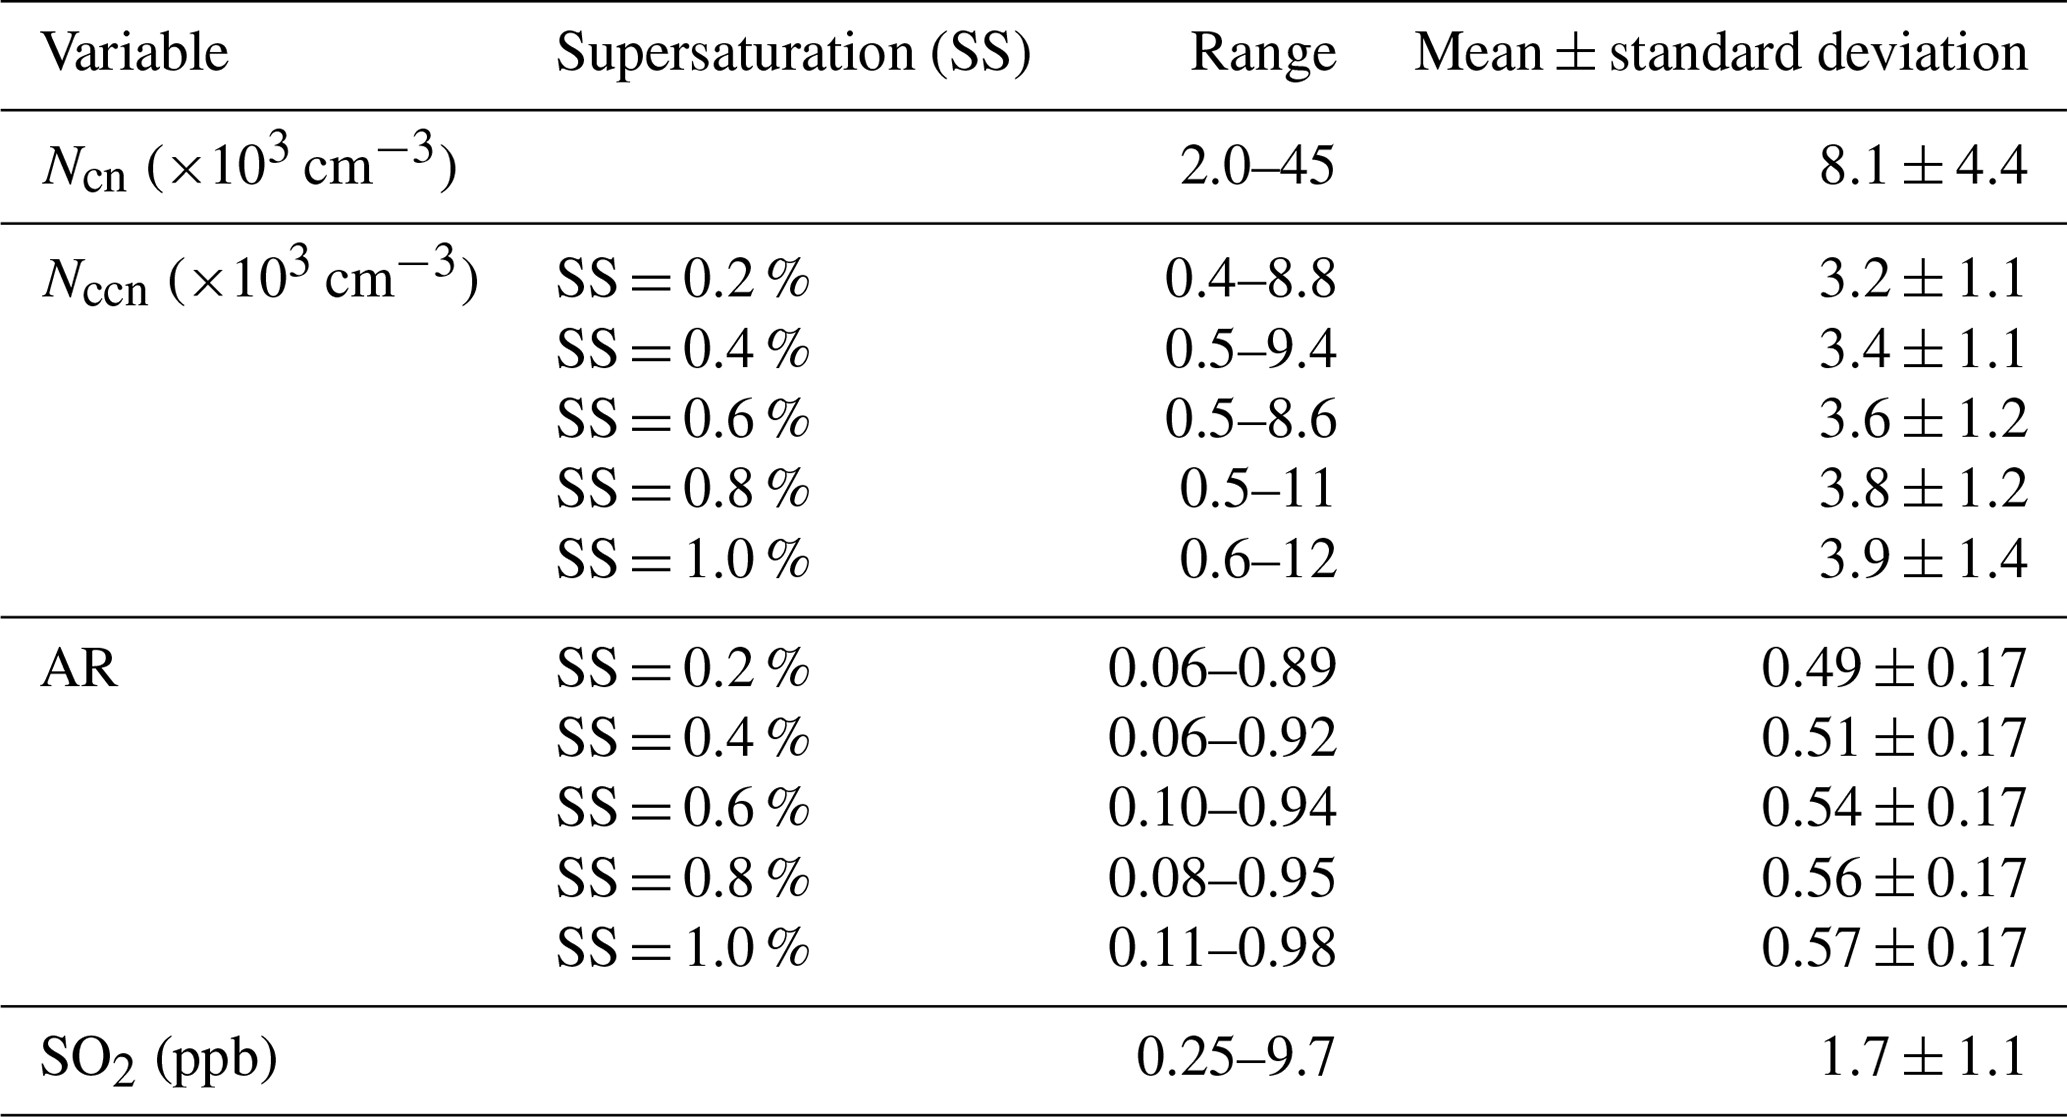
In addition, the Nccn at SSs from 0.1 % to 1.0 % during the period with high (17:00 LT on DOY 114 to 10:00 LT on DOY 120) is statistically significantly higher (P<0.01) than that during the low- period (11:00 LT on DOY 120 to 07:00 LT on DOY 136; Fig. 3b). More specifically, a large increase in concentration, with a mean concentration of 6.3±2.5 µg m−3, can be observed during the period from 17:00 LT on DOY 114 to 10:00 LT on DOY 120 (Fig. 3b). The mean Nccn during this period varied from to cm−3 at SSs ranging from 0.2 % to 1.0 %. In contrast, after DOY 120, the concentration of (0.67±0.70 µg m−3) substantially decreased by almost 90 %, during which the mean Nccn at each SS showed statistically significant decreases of 8 % to 15 %, implicative of the vital contribution of secondary ammonium salt aerosols to CCN.
Another feature depicted in Fig. 3b is that the Nccn during the low- period may even exceed the maximal value of Nccn during the high- period. To elucidate the underlying mechanism, the Nccn values under each SS were composited and compared for the days with concentrations higher than the upper quartile and the days in the lower quartile, yielding some interesting findings. At SS = 0.2 %, the composited Nccn under the high- period was higher than that during the low- period with a statistical significance level of 0.01. There was no significant difference between the Nccn values of the two composite periods at SS values of 0.4 % and 0.6 %. However, the composited Nccn (i.e., only selection of the upper quartile) during the high- period was significantly lower than the composited value during the low- period for P<0.01, e.g., cm−3 versus cm−3 at SS = 0.8 % and cm−3 versus cm−3 at SS = 1.0 %. During the low- period, the marine atmospheres over the observational zones may sometimes receive strong continental inputs and/or marine traffic emissions, leading to the larger Nccn. The enhanced formation of ammonium salt aerosols during the high- period likely canceled out or even overwhelmed the effects of the continental inputs and/or marine traffic emissions on Nccn at SS = 0.2 %.
In addition, fresh marine traffic emissions likely made a negligible contribution to Nccn in the marine atmosphere because of the large amounts of aged aerosols from various sources therein. For example, the mean values of Nccn were 3.2×10³ and 4.5×103 cm−3 at SS = 0.4 % and 1.0 % at 08:30–11:30 on DOY 110, respectively. These values were almost the same as the 3.2×103 cm−3 at SS = 0.4 % and 3.8×103 cm−3 at SS = 1.0 % before 06:00 on that day. The mean values of Ncn, however, greatly increased from cm−3 before 06:00 to cm−3 at 08:30–11:30 when the ship cruised across the Yangtze River estuary (Fig. 3b).
3.3 Spatiotemporal variations in CCN activation and Kappa values
The AR values at SSs of 0.4 % and 1.0 % are examined in this section, as shown in Fig. 3c. At SS = 0.4 %, the AR values largely varied from 0.06 to 0.92 with a median value of 0.51. Specifically, the AR values narrowly varied around 0.51±0.04 at 00:00–06:00 LT on DOY 110. At 08:00–21:00 LT on that day, when the ship cruised across the Yangtze River estuary, the AR values substantially decreased to 0.26±0.06 concurrently with an approximate 200 % increase in the Ncn values, i.e., Ncn values of cm−3 at 00:00–06:00 LT and cm−3 at 08:00–21:00 LT on DOY 110 (Fig. 3a). The AR values then exhibited an oscillating increase from DOY 111 to DOY 113. A low AR value of 0.12±0.04 was suddenly observed at 10:00–18:00 LT on DOY 114 in the presence of strong new particle signals transported from the upwind continental atmosphere, as discussed later. The AR values, however, reached 0.34±0.04 at 06:00–08:00 LT and 0.39±0.08 at 19:00–24:00 LT on DOY 114, with the new particle signals largely decreased. Even excluding the AR values on DOY 114, a significant difference was still obtained between the AR values of 0.61±0.12 during the high- period and those of 0.55±0.17 during the low- period. The enhanced formation of ammonium salts seemingly increased the CCN activity to some extent. At SS = 1.0 %, the AR values showed large fluctuations with a median value of 0.57±0.17 (Fig. 3c), and the temporal trend was similar to that at SS = 0.4 %.
To minimize the impact from the particle sizes, the Kappa values were further investigated. As reported by Phillips et al. (2018), Kappa values at a high time resolution usually exhibit a broad distribution, reflecting the complexity due to various factors. To reveal the key factors in determining the Kappa values on a large spatiotemporal scale, the daily Kappa values of atmospheric aerosols were estimated on the basis of the daily mean Nccn and the size distributions of the particle number concentration from DOYs 110–118 (Fig. 3c). Please note that for DOY 110, considering the large differences in the particle number concentration between 00:00–06:00 and 08:00–21:00 (Fig. S2), the Kappa values were calculated separately for these two periods. At SS = 0.4 % (green dashed line in Fig. 3c), the estimated Kappa values were as high as 0.66 at 00:00–06:00 LT, while they decreased to 0.37 at 08:00–21:00 LT on DOY 110. The Kappa value varied narrowly from 0.46 to 0.55 on DOYs 111–113, 115 and 117, implying that inorganic aerosols such as completely and incompletely neutralized ammonium salts may make large contributions to the Nccn. These values were generally consistent with the reported observations in most marine atmospheres. For example, Cai et al. (2017) reported a Kappa value of approximately 0.5 for particles with sizes of 40–200 nm at a marine site in Okinawa and that sulfate was the dominant component of aerosol particles on 1–9 November 2015, and a similar Kappa value in spring 2008 was reported by Mochida et al. (2010) over this site. Royalty et al. (2017) reported Kappa values for 48, 96 and 144 nm dry particles of 0.57±0.12, 0.51±0.09 and 0.52±0.08 in the subtropical North Pacific Ocean and sulfate-like particles contributing at most 77 %–88 % to the total aerosol number concentration. Over the Atlantic Ocean, Kappa values of approximately 0.54±0.03 were observed for 284 nm particles (Phillips et al., 2018).
The estimated Kappa values sometimes reached 0.66–0.67 (i.e., on DOY 116), which may be related to unidentified factors. For example, O'Dowd et al. (2014) proposed that some organics derived from sea-spray aerosols may also increase the Nccn to some extent by reducing the surface tension, leading to an increase in the Kappa values. A small fraction of sea-salt aerosols in submicron particles may also increase the Kappa values since its Kappa value was as high as 1.3 (O'Dowd et al., 1997, 2004). A Kappa value of 0.29 was obtained on DOY 118, which is close to the Kappa values widely observed for continental atmospheric aerosols (∼0.3) (Andreae and Rosenfeld, 2008; Pöschl et al., 2009; Rose et al., 2010). The estimated Kappa value largely decreased to 0.15 on DOY 114 when new particle formation (NPF) occurred; see Sect. 3.5 for detailed discussion. Moreover, at an SS of 1.0 %, the estimated Kappa value was always smaller than 0.2. The Kappa values of organics were commonly assumed to be 0.1 (Rose et al., 2011; Cai et al., 2017; Singla et al., 2017). In general, the fraction of organics in the nanometer particles increases with decreasing particle size from ∼100 to ∼50 nm (Rose et al., 2010, 2011; Crippa et al., 2014; Cai et al., 2017). A combination of the two factors likely led the overall Kappa values estimated at SS = 1.0 % to be much lower. However, direct measurements of the chemical composition of nanometer particles are needed to confirm these arguments.
3.4 Particle number size distributions and CCN activation associated with marine traffic emissions and aerosol aging
The particle number size distributions during DOYs 110–118, shown in Fig. 4, can be generally classified into two categories. Category 1 occurred on DOYs 110–114, when particle number concentrations were mainly distributed in Aitken mode, whereas the accumulation mode was generally undetectable. Category 2 occurred on DOYs 115–118, when the accumulation mode could be clearly identified and generally dominated over the Aitken mode. Hoppel (1986) proposed that cloud-modified aerosols are mainly distributed at 80–150 nm in the remote tropical Atlantic and Pacific oceans. Cloud-modified aerosols are quite common in remote marine atmospheres, likely leading to the dominant accumulation mode particles being observed on DOYs 115–118. Occasionally, the Aitken mode dominated over the accumulation mode, such as on DOY 118. To further investigate the sources of different modes of particles, the days DOY 112, DOY 116 and DOY 118 were selected.
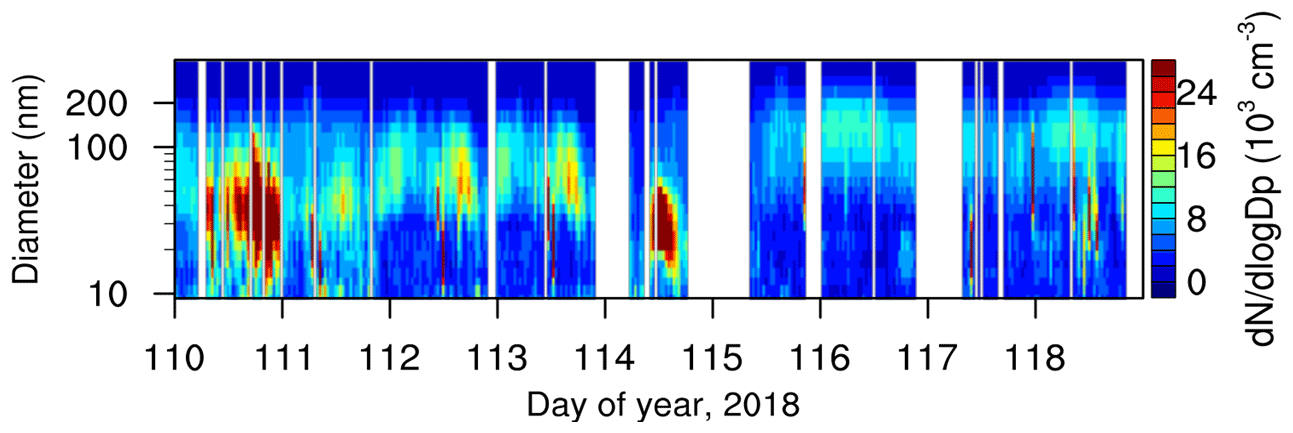
Figure 4Contour plot of particle number size distribution on DOYs 110–118 with ship self-emission signals removed.
On DOY 112, the Aitken mode particles accounted for approximately 60 % of the total particle number concentration (Fig. 5a), with median Aitken mode diameters of approximately 54±8 nm. Similar to the observations over the Yangtze River estuary, the mean value of Ncn increased by approximately 50 % concurrently with a decrease in the median Aitken mode diameters by ∼9 nm at 05:30–11:40 LT compared to those in the early morning before 05:30 LT (Fig. 5b). Concomitantly, the AR values decreased to 0.31±0.09 at SS of 0.4 %, with similar AR decreases at SS of 1.0 %, and the lowest AR and Kappa values occurred at 06:00–07:00 LT at SSs of both 0.4 % and 1.0 %. All these results indicated that the increase in Aitken mode particles at 05:30–11:40 LT was likely derived from enhanced marine traffic contributions carried by the onshore wind from the south (Fig. S11). During other times on DOY 112, the onshore wind may also carry marine-traffic-derived particles to the observational sea zones. However, the marine-traffic-derived particles likely aged to some extent, e.g., the median Aitken mode diameters exhibited an oscillating increase from approximately 50 nm at 19:00 to approximately 70 nm at 24:00 LT with a particle growth rate of ∼4 nm h−1. The AR values, however, narrowly varied around 0.47±0.03 at SS = 0.4 % and 0.52±0.05 at SS = 1.0 % during the particle growth period. The Kappa values at SS = 0.4 % gradually decreased from 0.56 at 19:00 to 0.41 at 23:00 LT, reflecting more aged marine-traffic-derived particles growing into CCN sizes.
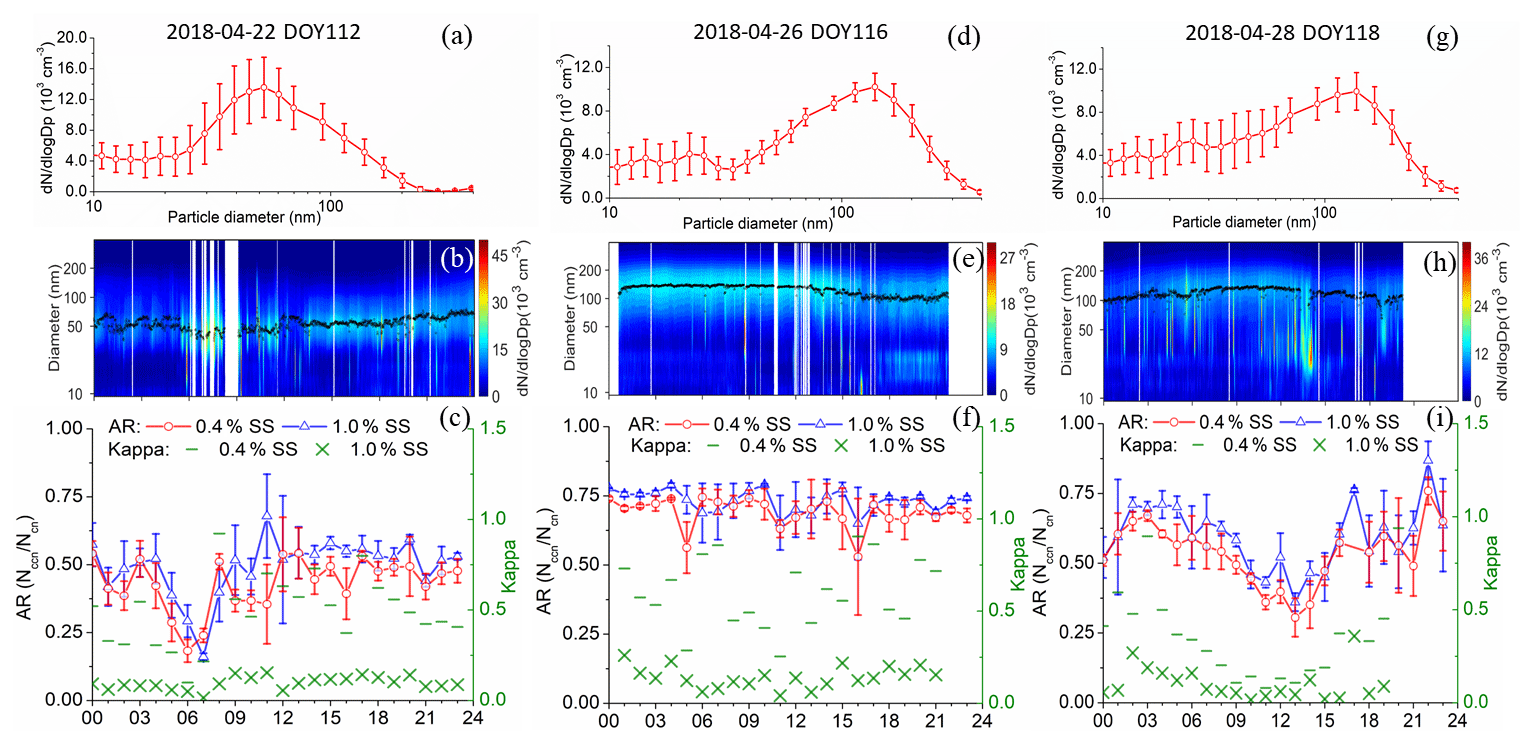
Figure 5(a, d, g) Daily average and (b, e, h)contour plot of particle number size distributions and (c, f, i) time series of hourly averaged AR at SS of 0.4 % and 1.0 % and Kappa value on DOY 112, DOY 116 and DOY 118. The bars represent the standard deviation, with the mean indicated by the hollow circles.
On DOY 116, the accumulation mode particles dominantly contributed to Ncn rather than Aitken mode particles (Fig. 5d) under the marine air influence from the northeast (Fig. S13). The median accumulation mode diameters narrowly varied around 135±5 nm at 01:00–13:00 LT and 102±5 nm at 16:20–24:00 LT with a transition period in between (Fig. 5e). The AR and Kappa values, however, showed no statistically significant differences during the two periods at SSs of 0.4 % and 1.0 %, implying that the size change in the accumulation mode particles had a negligible influence on CCN activation. The hourly variations in the AR and Kappa values may be associated with other factors, e.g., chemical composition and mixing state (Gunthe et al., 2011; Rose et al., 2011).
On DOY 118, under the influence of mixtures from marine and coastal areas from the northeast (Fig. S14), the accumulation mode particles generally dominated the contribution to Ncn, while the reverse was true on some occasions (Fig. 5g, h). The median accumulation mode diameters exhibited an oscillating increase from approximately 100 to 130 nm at 00:00–08:00 LT, narrowly varied around 133±5 nm at 08:00–13:00 LT and then exhibited an oscillating decrease down to approximately 100 nm at 20:00 LT. The AR values and Kappa values at SS = 0.4 %, however, exhibited an inverted bell shape with the lowest values at 0.31 and 0.11 at 13:00. The decreases in the AR values and Kappa may be related to organic condensation on the accumulation mode particles since the median accumulation mode diameters were almost the largest at 13:00. The number concentration of Aitken mode particles was evidently enhanced at 14:00–15:00, but the influence on the AR values and Kappa values at SS = 0.4 % was undetectable (Fig. 5i).
3.5 The long-range transport of newly grown particles on DOY 114
No hour-long sharp increases were observed in the number concentration of the nucleation mode particles (<20 nm) during the period from DOY 110 to DOY 118, except on DOY 114 (Fig. 4). According to the conventional definition of NPF events (Kulmala et al., 2004; Dal Maso et al., 2005), the occurrence frequency of NPF events was low in this study. Unlike continental atmospheres where a high occurrence frequency of NPF events has been observed globally in spring (Kulmala et al., 2004; Kerminen et al., 2018), a low occurrence frequency reportedly occurred over the seas during the “Meiyu (plum-rain) season” in spring because of frequent rainy, foggy or cloudy weather conditions (Zhu et al., 2019). The lack of NPF events in the marine atmospheres implied that the contributions to Ncn and Nccn were mainly from primary emitted aerosols and their aged products.
During the period of 10:00–18:00 LT on DOY 114, the large increase in the number concentrations of Aitken mode particles (Fig. 6a) likely reflected the long-range transport of newly grown particles from upwind continental atmospheres (Fig. S12). The size distributions of the particle number concentration showed a dominant Aitken mode at 10:00–18:00 LT, when the spatiotemporal variations in Ncn and median Aitken mode diameters exhibited bell-shaped patterns (Fig. 6b). The median Aitken mode diameters increased from 26 nm at 10:00 LT to 33 nm at 12:00–13:00 LT and then decreased to 20 nm prior to the signal disappearance, likely reflecting the growth and shrinkage of the Aitken mode particles (Yao et al., 2010; Zhu et al., 2019). The median Aitken mode diameters were evidently smaller than the values, i.e., 40–50 nm for the Aitken mode particles, observed over the Yangtze River estuary on DOY 112 (Fig. 5a). Moreover, the number concentrations of the 20–40 nm particles increased by 5.8 times at 12:00–13:00 LT compared to the mean value at 06:00–09:00 LT, while the total number concentrations of particles greater than 90 nm increased by only 67 %. These results implied that the large increases in the number concentrations of Aitken mode particles with a dynamic change in the mode diameter observed at 10:00–18:00 LT were not likely caused by primary emitted and aged particles from marine traffic emissions or other combustion sources. The observations of the gaseous and particulate species during the same period implied that the air masses were well aged and less polluted. For instance, the measured hourly average mixing ratios of SO2 were no larger than 1.2 ppb (Fig. 6c), and the hourly average concentrations of in PM2.5 were smaller than 2 µg m−3 (Fig. 3b). In addition, the concentrations of K+ were below 0.3 µg m−3, suggesting negligible contributions from biomass burning (Fig. 6e).
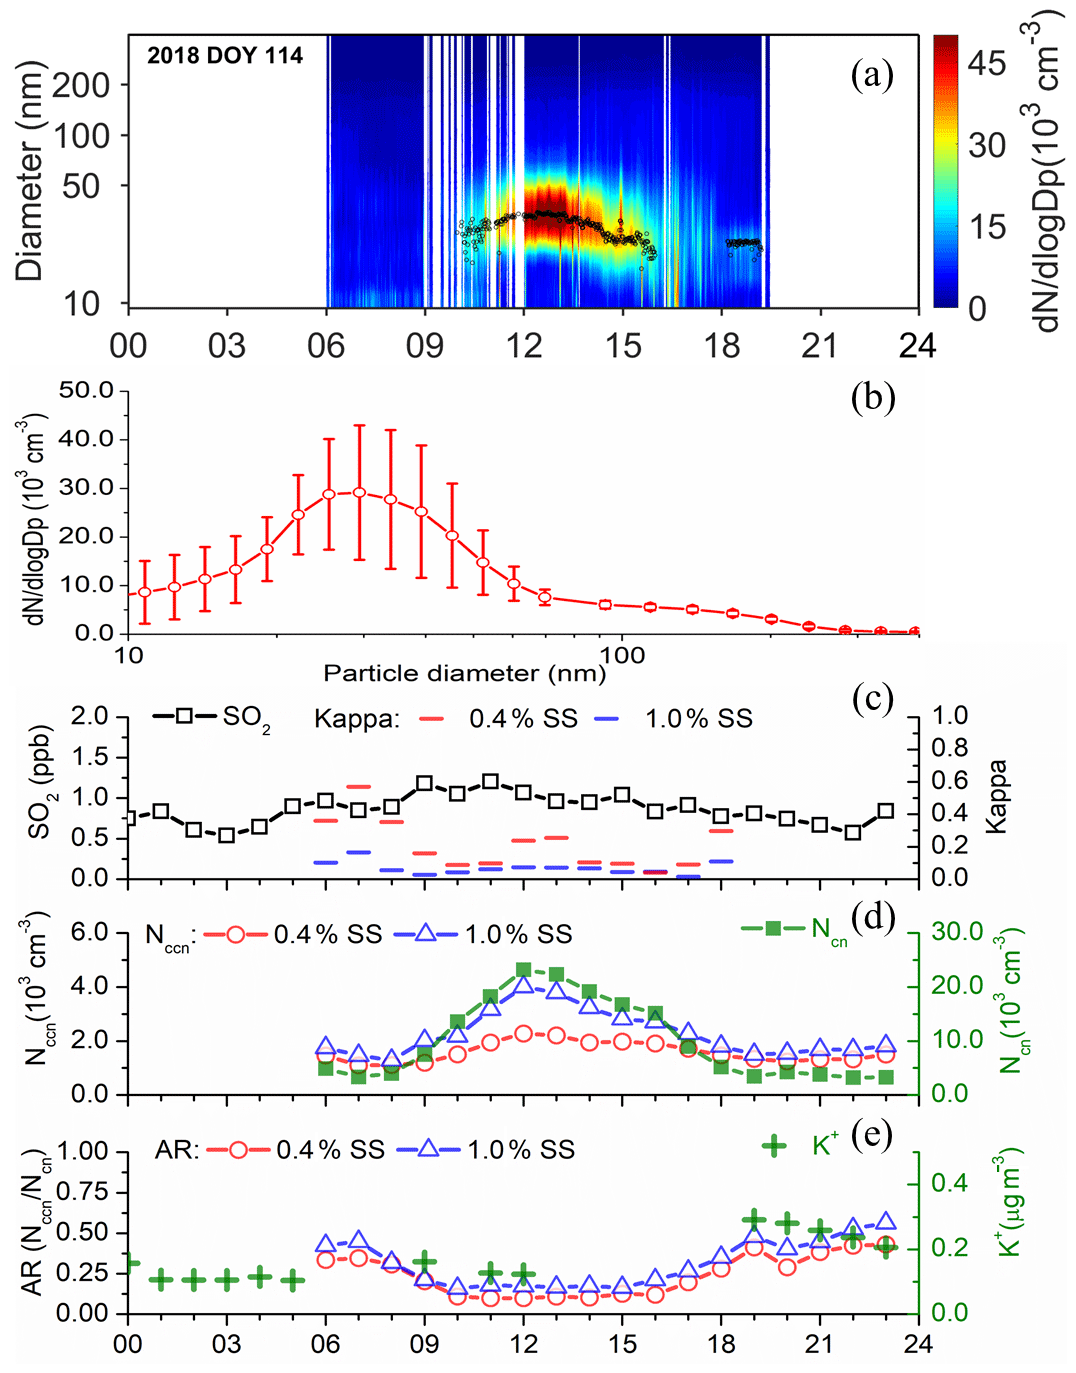
Figure 6(a) Contour plot of particle number size distributions for the DOY 114 2018; (b) the size distributions of the particle number concentration during 10:00–18:00 LT DOY 114, 2018; (c) time series of hourly averaged SO2 and Kappa values at SS of 0.4 % and 1.0 %; (d) Nccn at SS of 0.4 % and 1.0 %; and (e) AR values at SS of 0.4 % and 1.0 % and K+ for DOY 114, 2018.
Before 09:00 LT, a much weaker spike of nucleation mode particles was intermittently observed (Fig. 6a). The weak and intermittent NPF seemed to occur in the marine atmospheres before 09:00 LT when no apparent growth of new particles was observed. Possibly due to transport from the continent (Fig. S12) and an increase in the condensational sink at approximately 10:00 a.m. (Fig. 6a), the weak NPF signal gradually dropped to a negligible level 0.5 h later, concomitant with a large increase in the number concentrations of Aitken mode particles at 10:00–18:00 LT.
Nccn at SS = 0.4 % increased from 1.2×103 cm−3 at 06:00–09:00 LT to the peak value of 2.3×103 cm−3 at 12:00 LT, with an increase of 92 %, and Nccn at SS = 1.0 % increased from 1.6×10³ to 4.0×103 cm−3, with an increase of 150 % (Fig. 6d). The net increase in Nccn at SS = 0.4 % likely reflected the contribution from pre-existing particles since new particles with diameters less than 50 nm were unlikely to be activated as CCN at such low SS (Li et al., 2015; Wu et al., 2016; Ma et al., 2016). The larger net increase in Nccn at SS = 1.0 % may reflect the contributions from pre-existing particles and newly grown particles. The high SS can activate particles as CCN with diameters down to 40 nm (Dusek et al., 2006; Li et al., 2015). The invasion of newly grown particles also led to the large decreases in the AR values from 0.3 to 0.1 at SS = 0.4 % and from 0.4 to 0.2 at SS = 1.0 % (Fig. 6e). After 18:00 LT, the AR values retuned to 0.3–0.4 at SS = 0.4 % and 0.4–0.6 at SS = 1.0 %. The calculated Kappa values were examined (Fig. 6c) and were found to decrease from 0.4 to 0.1–0.2 at SS = 0.4 %. This value returned to 0.3 at 18:00–19:00 LT (FMPS temporarily malfunctioned after 19:20 LT). The Kappa values were below 0.2 at SS = 1.0 % on that day. The decreases in the AR values and Kappa values at the two SS were likely caused by organic vapor condensed on pre-existing particles and new particles (Wu et al., 2016; Zhu et al., 2019).
3.6 Relationship of Ncn and Nccn with SO2 in ship self-plumes and ambient air
When ship self-emission signals were detected, the observational values included a combination of contributions from ship self-emissions and ambient concentrations. Although the ambient Ncn was negligible in comparison with the Ncn derived from the ship self-emissions, this was not the case for Nccn and SO2. Based on the per minute data, the signal was considered to be vessel self-emissions when both Ncn was greater than 50 000 cm−3 and SO2 was greater than 5 ppb. The composited data were then used to derive the hourly average Ncn, Nccn and SO2, which were then subtracted by the ambient hourly mean values during the preceding hour with relatively clean conditions (i.e., concentrations of Ncn lower than 10 000 cm−3 and SO2 lower than 2.5 ppb). Please note that uncertainties exist in terms of the criteria and separation between the ship self-signals and ambient signals; however, minimal impact is expected in the relationship examined below.
Figure 7a shows the relationship of Ncn and Nccn with the mixing ratio of SO2 in the ship self-plumes, prefixed by Δ for Ncn, Nccn and SO2 to implicate the removal of ambient signals. A good correlation of 0.66 for R2 (P<0.01) is obtained, and the slope indicates that the increase in Ncn by 1.4×104 cm−3 for each 1 ppb increase in SO2 resulted from ship emissions (Fig. 7a). High emissions of Ncn were generally reported in engine exhausts where high-sulfur-content diesel was used (Yao et al., 2005, 2007). The Nccn at SS of 0.2 % to 1.0 % (Fig. 7b) increased from 30 to 170 cm−3 per 1 ppb increase in SO2, showing a statistically significant correlation at the 99th confidence level. The contribution ratios of SO2 to Nccn were 0.002 (SS of 0.2 %), 0.004 (SS of 0.4 %) and 0.012 (SS of 1.0 %) to that of Ncn, which is in general consistent with a previous study by Ramana and Devi (2016), in which a range of 0.0012–0.57 was observed for CCN at 0.4 % in Bay of Bengal during 13–16 August 2012.
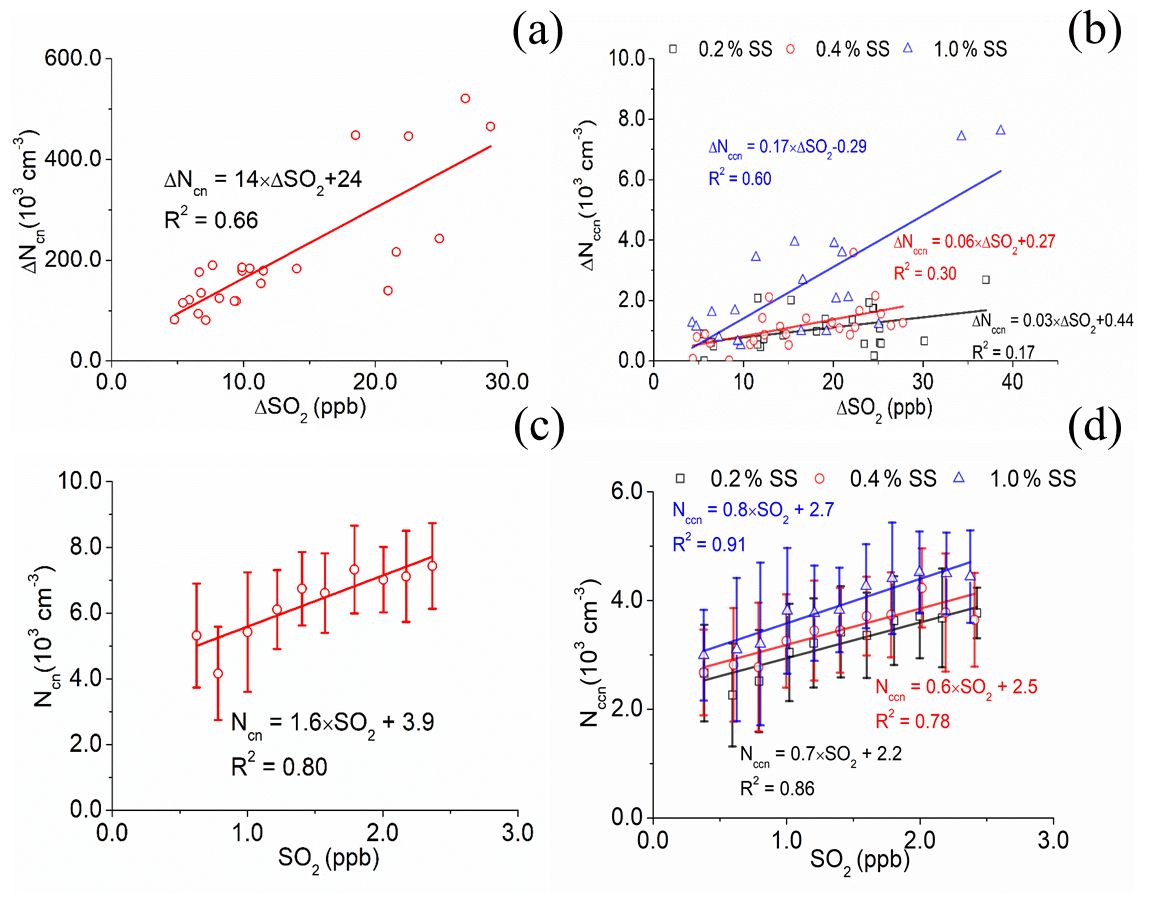
Figure 7Relationship of hourly averaged Ncn and Nccn with SO2 at SS of 0.2 %, 0.4 % and 1.0 %. For (a) and (b), Ncn, Nccn and SO2 reflect the impact of the ship self-emission after the removal of the ambient concentration. For (c) and (d), each bar indicates the standard deviation with the mean value marked as hollow circles (or triangles, squares), and the interval of SO2 is 0.2 ppb for each bar.
The relationship of hourly averaged Ncn and Nccn with SO2 in ambient air were examined and are shown in Fig. 7c, d. The data were segmented into pieces based on SO2 with an interval of 0.2 ppb. A good correlation was obtained between the averaged Ncn and SO2 with an R2 of 0.80 (P<0.01), and a 1 ppb increase in SO2 likely increased Ncn by 1.6×103 cm−3 (Fig. 7c). The increase in Ncn with SO2 may reflect the contribution from primary emissions. The intercept was, however, as large as 3.9×103 cm−3, likely representing the contribution from well-aged aerosols.
The hourly averaged Nccn at different SSs generally increased with increasing ambient SO2 (Fig. 7d). A good correlation was obtained between the averaged Nccn and SO2, with R2 = 0.78–0.91 (P<0.01). A 1 ppb increase in SO2 likely increased Nccn by 0.6×10³ to 0.8×103 cm−3 at SSs from 0.2 % to 1.0 %. The increase in Nccn with SO2 may also reflect the contribution from primary emissions. The intercepts of 2.2×10³–2.7×103 cm−3 at different SSs were likely contributed by well-aged aerosols. This relationship may be used as an estimation of the Nccn in marine atmospheres over marginal seas in China when no measurements of CCN are available, whereas the ambient SO2 can be estimated from web-based satellite data.
The spatiotemporal variations in ambient Ncn and Nccn were studied during a cruise campaign on DOYs 110–135 over marginal seas in China. The mean values of Ncn (8.1×103 cm−3) and Nccn (3.2–3.9×103 cm−3) at SSs of 0.2 %–1.0 % were approximately 1 order of magnitude larger than those in remote clear marine atmospheres, indicating overwhelming contributions from non-sea-spray aerosols such as marine traffic emissions, long-range continental transport and others.
The observed ship self-emission signals showed that fresh marine traffic emissions can be important sources of Ncn but minor sources of Nccn in the marine atmosphere. The signals showed that a 1 ppb increase in SO2 corresponded to a 1.4×104 cm−3 increase in Ncn and a 30–170 cm−3 increase in Nccn at SS = 0.2 %–1.0 %. Data analysis showed that marine traffic emissions largely increased Ncn over heavily traveled sea zones in the daytime.
In ambient marine air, the growth of marine-traffic-derived particles led to a decrease in the estimated bulk Kappa values at 0.4 %, possibly because some of these particles enriched in organics grew into CCN size. However, strong formation of ammonium salts led to aerosol aging and significantly increased Nccn at SS of 0.2 %–1.0 % in comparison with those observed during the period poor in ammonium salt aerosols in PM2.5 with P<0.01. The estimated bulk Kappa values from the daily average values varied from 0.46 to 0.55 at SS = 0.4 % in most marine atmospheres, indicating that inorganic ammonium aerosols may dominantly contribute to the Nccn at SS of 0.4 %. The particle number size distributions showed that the high bulk Kappa values could be related to cloud-modified aerosols, which likely led to a large extent of degradation of organics and subsequent loss from the particle phase.
NPF events rarely occurred in the humid ambient marine air. The dominant onshore winds occurred during most of the measurement periods and likely carried primary aerosols and their aged products rather than secondarily formed aerosols to the observational zone. During an occasion when offshore winds blew from the northwest (Fig. S12), new particle signals transported from the continent can be clearly observed. However, the NPF in the marine atmosphere was too weak to be important. The new transported particles from the continent yielded the maximal increases in Nccn of 92 % at SS of 0.4 % and 150 % at SS of 1.0 %. However, consistent with those reported in the literature, the estimated Kappa values largely decreased from 0.4 to 0.1–0.2 at SS of 0.4 % during most of the continent-transporting NPF event because the Kappa value of the organic condensation vapor was as low as 0.1.
The data is available upon request to the corresponding authors.
The supplement related to this article is available online at: https://doi.org/10.5194/acp-20-9665-2020-supplement.
YG and XY designed the research; YG, DZ and XY performed the analysis; JW and HG helped on the interpretation of the results, and all co-authors contributed to the writing of the paper.
The authors declare that they have no conflict of interest.
This research is supported by the National Key Research and Development Program in China (grant no. 2016YFC0200504) and the Natural Science Foundation of China (grant no. 41576118).
This research has been supported by the National Key Research and Development Program in China (grant no. 2016YFC0200504) and the National Natural Science Foundation of China (grant no. 41576118).
This paper was edited by Veli-Matti Kerminen and reviewed by three anonymous referees.
Andreae, M. O. and Rosenfeld, D.: Aerosol-cloud-precipitation interactions. Part 1. The nature and sources of cloud-active aerosols, Earth-Sci. Rev., 89, 13–41, https://doi.org/10.1016/j.earscirev.2008.03.001, 2008.
Blot, R., Clarke, A. D., Freitag, S., Kapustin, V., Howell, S. G., Jensen, J. B., Shank, L. M., McNaughton, C. S., and Brekhovskikh, V.: Ultrafine sea spray aerosol over the southeastern Pacific: open-ocean contributions to marine boundary layer CCN, Atmos. Chem. Phys., 13, 7263–7278, https://doi.org/10.5194/acp-13-7263-2013, 2013.
Bougiatioti, A., Fountoukis, C., Kalivitis, N., Pandis, S. N., Nenes, A., and Mihalopoulos, N.: Cloud condensation nuclei measurements in the marine boundary layer of the Eastern Mediterranean: CCN closure and droplet growth kinetics, Atmos. Chem. Phys., 9, 7053–7066, https://doi.org/10.5194/acp-9-7053-2009, 2009.
Brooks, S. D. and Thornton, D. C. O.: Marine Aerosols and Clouds, Annu. Rev. Mar. Sci., 10, 289–313, https://doi.org/10.1146/annurev-marine-121916-063148, 2018.
Cai, M. F., Tan, H. B., Chan, C. K., Mochida, M., Hatakeyama, S., Kondo, Y., Schurman, M. I., Xu, H. B., Li, F., Shimada, K., Li, L., Deng, Y. G., Yai, H., Matsuki, A., Qin, Y. M., and Zhao, J.: Comparison of Aerosol Hygroscopcity, Volatility, and Chemical Composition between a Suburban Site in the Pearl River Delta Region and a Marine Site in Okinawa, Aerosol. Air. Qual. Res., 17, 3194–3208, https://doi.org/10.4209/aaqr.2017.01.0020, 2017.
Charlson, R. J., Lovelock, J. E., Andreae, M. O., and Warren, S. G.: Oceanic phytoplankton atmospheric sulpher cloud albedo and climate, Nature, 326, 655–661, 1987.
Chen, D. S., Wang, X. T., Li, Y., Lang, J. L., Zhou, Y., Guo, X. R., and Zhao, Y. H.: High-spatiotemporal-resolution ship emission inventory of China based on AIS data in 2014, Sci. Total Environ., 609, 776–787, https://doi.org/10.1016/j.scitotenv.2017.07.051, 2017.
Cheung, H. C., Chou, C. C.-K., Lee, C. S. L., Kuo, W.-C., and Chang, S.-C.: Hygroscopic properties and cloud condensation nuclei activity of atmospheric aerosols under the influences of Asian continental outflow and new particle formation at a coastal site in eastern Asia, Atmos. Chem. Phys., 20, 5911–5922, https://doi.org/10.5194/acp-20-5911-2020, 2020.
Clarke, A. D., Owens, S. R., and Zhou, J. C.: An ultrafine sea-salt flux from breaking waves: Implications for cloud condensation nuclei in the remote marine atmosphere, J. Geophys. Res.-Atmos., 111, D06202, https://doi.org/10.1029/2005jd006565, 2006.
Crippa, M., Canonaco, F., Lanz, V. A., Äijälä, M., Allan, J. D., Carbone, S., Capes, G., Ceburnis, D., Dall'Osto, M., Day, D. A., DeCarlo, P. F., Ehn, M., Eriksson, A., Freney, E., Hildebrandt Ruiz, L., Hillamo, R., Jimenez, J. L., Junninen, H., Kiendler-Scharr, A., Kortelainen, A.-M., Kulmala, M., Laaksonen, A., Mensah, A. A., Mohr, C., Nemitz, E., O'Dowd, C., Ovadnevaite, J., Pandis, S. N., Petäjä, T., Poulain, L., Saarikoski, S., Sellegri, K., Swietlicki, E., Tiitta, P., Worsnop, D. R., Baltensperger, U., and Prévôt, A. S. H.: Organic aerosol components derived from 25 AMS data sets across Europe using a consistent ME-2 based source apportionment approach, Atmos. Chem. Phys., 14, 6159–6176, https://doi.org/10.5194/acp-14-6159-2014, 2014.
Dal Maso, M., Kulmala, M., Riipinen, I., Wagner, R., Hussein, T., Aalto, P. P., and Lehtinen, K. E. J.: Formation and growth of fresh atmospheric aerosols: eight years of aerosol size distribution data from SMEAR II, Hyytiala, Finland, Boreal Environ. Res., 10, 323–336, 2005.
Dal Maso, M., Gao, J., Jarvinen, A., Li, H., Luo, D. T., Janka, K., and Ronkko, T.: Improving Urban Air Quality Measurements by a Diffusion Charger Based Electrical Particle Sensors – A Field Study in Beijing, China, Aerosol. Air. Qual. Res., 16, 3001–3011, https://doi.org/10.4209/aaqr.2015.09.0546, 2016.
Decesari, S., Finessi, E., Rinaldi, M., Paglione, M., Fuzzi, S., Stephanou, E. G., Tziaras, T., Spyros, A., Ceburnis, D., O'Dowd, C., Dall'Osto, M., Harrison, R. M., Allan, J., Coe, H., and Facchini, M. C.: Primary and secondary marine organic aerosols over the North Atlantic Ocean during the MAP experiment, J. Geophys. Res.-Atmos., 116, D22210, https://doi.org/10.1029/2011jd016204, 2011.
Ding, X., Qi, J. H., and Meng, X. B.: Characteristics and sources of organic carbon in coastal and marine atmospheric particulates over East China, Atmos. Res., 228, 281–291, https://doi.org/10.1016/j.atmosres.2019.06.015, 2019.
Dusek, U., Frank, G. P., Hildebrandt, L., Curtius, J., Schneider, J., Walter, S., Chand, D., Drewnick, F., Hings, S., Jung, D., Borrmann, S., and Andreae, M. O.: Size matters more than chemistry for cloud-nucleating ability of aerosol particles, Science, 312, 1375–1378, https://doi.org/10.1126/science.1125261, 2006.
Feng, J. L., Guo, Z. G., Zhang, T. R., Yao, X. H., Chan, C. K., and Fang, M.: Source and formation of secondary particulate matter in PM2.5 in Asian continental outflow, J. Geophys. Res.-Atmos., 117, D03302, https://doi.org/10.1029/2011jd016400, 2012.
Feng, L., Shen, H., Zhu, Y., Gao, H., and Yao, X.: Insight into Generation and Evolution of Sea-Salt Aerosols from Field Measurements in Diversified Marine and Coastal Atmospheres, Sci. Rep.-UK, 7, 41260, https://doi.org/10.1038/srep41260, 2017.
Feng, T., Li, G., Cao, J., Bei, N., Shen, Z., Zhou, W., Liu, S., Zhang, T., Wang, Y., Huang, R.-J., Tie, X., and Molina, L. T.: Simulations of organic aerosol concentrations during springtime in the Guanzhong Basin, China, Atmos. Chem. Phys., 16, 10045–10061, https://doi.org/10.5194/acp-16-10045-2016, 2016.
Fossum, K. N., Ovadnevaite, J., Ceburnis, D., Dall'Osto, M., Marullo, S., Bellacicco, M., Simo, R., Liu, D. T., Flynn, M., Zuend, A., and O'Dowd, C.: Summertime Primary and Secondary Contributions to Southern Ocean Cloud Condensation Nuclei, Sci. Rep.-UK, 8, 13844, https://doi.org/10.1038/S41598-018-32047-4, 2018.
Fu, X. G., Wang, M., Zeng, S. Q., Feng, X. L., Wang, D., and Song, C. Y.: Continental weathering and palaeoclimatic changes through the onset of the Early Toarcian oceanic anoxic event in the Qiangtang Basin, eastern Tethys, Palaeogeogr. Palaeocl., 487, 241–250, https://doi.org/10.1016/j.palaeo.2017.09.005, 2017.
Gunthe, S. S., Rose, D., Su, H., Garland, R. M., Achtert, P., Nowak, A., Wiedensohler, A., Kuwata, M., Takegawa, N., Kondo, Y., Hu, M., Shao, M., Zhu, T., Andreae, M. O., and Pöschl, U.: Cloud condensation nuclei (CCN) from fresh and aged air pollution in the megacity region of Beijing, Atmos. Chem. Phys., 11, 11023–11039, https://doi.org/10.5194/acp-11-11023-2011, 2011.
Guo, L., Chen, Y., Wang, F., Meng, X., Xu, Z., and Zhuang, G.: Effects of Asian dust on the atmospheric input of trace elements to the East China Sea, Mar. Chem., 163, 19–27, https://doi.org/10.1016/j.marchem.2014.04.003, 2014.
Guo, T., Li, K., Zhu, Y., Gao, H., and Yao, X.: Concentration and size distribution of particulate oxalate in marine and coastal atmospheres – Implication for the increased importance of oxalate in nanometer atmospheric particles, Atmos. Environ., 142, 19–31, https://doi.org/10.1016/j.atmosenv.2016.07.026, 2016.
Hoppel W. A., F. G. M., and Larson R. E.: Effect of non-precipitating clouds on the aerosol size distribution, Geophys. Res. Lett., 13, 125–128, 1986.
Huebert, B. J., Bates, T., Russell, P. B., Shi, G. Y., Kim, Y. J., Kawamura, K., Carmichael, G., and Nakajima, T.: An overview of ACE-Asia: Strategies for quantifying the relationships between Asian aerosols and their climatic impacts, J. Geophys. Res.-Atmos., 108, 8633, https://doi.org/10.1029/2003jd003550, 2003.
Hung, H. M., Lu, W. J., Chen, W. N., Chang, C. C., Chou, C. C. K., and Lin, P. H.: Enhancement of the hygroscopicity parameter kappa of rural aerosols in northern Taiwan by anthropogenic emissions, Atmos. Environ., 84, 78–87, https://doi.org/10.1016/j.atmosenv.2013.11.032, 2014.
Kerminen, V. M., Chen, X. M., Vakkari, V., Petaja, T., Kulmala, M., and Bianchi, F.: Atmospheric new particle formation and growth: review of field observations, Environ. Res. Lett., 13, 103003, https://doi.org/10.1088/1748-9326/Aadf3c, 2018.
Kulmala, M., Vehkamaki, H., Petaja, T., Dal Maso, M., Lauri, A., Kerminen, V. M., Birmili, W., and McMurry, P. H.: Formation and growth rates of ultrafine atmospheric particles: a review of observations, J. Aerosol Sci., 35, 143–176, https://doi.org/10.1016/j.jaerosci.2003.10.003, 2004.
Langley, L., Leaitch, W. R., Lohmann, U., Shantz, N. C., and Worsnop, D. R.: Contributions from DMS and ship emissions to CCN observed over the summertime North Pacific, Atmos. Chem. Phys., 10, 1287–1314, https://doi.org/10.5194/acp-10-1287-2010, 2010.
Leng, C., Cheng, T., Chen, J., Zhang, R., Tao, J., Huang, G., Zha, S., Zhang, M., Fang, W., Li, X., and Li, L.: Measurements of surface cloud condensation nuclei and aerosol activity in downtown Shanghai, Atmos. Environ., 69, 354–361, https://doi.org/10.1016/j.atmosenv.2012.12.021, 2013.
Li, K., Zhu, Y., Gao, H., and Yao, X.: A comparative study of cloud condensation nuclei measured between non-heating and heating periods at a suburb site of Qingdao in the North China, Atmos. Environ., 112, 40–53, https://doi.org/10.1016/j.atmosenv.2015.04.024, 2015.
Li, M., Liu, H., Geng, G., Hong, C., Liu, F., Song, Y., Tong, D., Zheng, B., Cui, H., Man, H., Zhang, Q., and He, K.: Anthropogenic emission inventories in China: a review, Natl. Sci. Rev., 4, 834–866, https://doi.org/10.1093/nsr/nwx150, 2017.
Lin, Y. C., Chen, J. P., Ho, T. Y., and Tsai, I. C.: Atmospheric iron deposition in the northwestern Pacific Ocean and its adjacent marginal seas: The importance of coal burning, Global Biogeochem. Cy., 29, 138–159, https://doi.org/10.1002/2013GB004795, 2015.
Liu, F., Zhang, Q., A., R. J. v. d., Zheng, B., Tong, D., Yan, L., Zheng, Y., and He, K.: Recent reduction in NOx emissions over China: synthesis of satellite observations and emission inventories, Environ. Res. Lett., 11, 114002, https://doi.org/10.1088/1748-9326/11/11/114002, 2016.
Ma, N., Zhao, C., Tao, J., Wu, Z., Kecorius, S., Wang, Z., Größ, J., Liu, H., Bian, Y., Kuang, Y., Teich, M., Spindler, G., Müller, K., van Pinxteren, D., Herrmann, H., Hu, M., and Wiedensohler, A.: Variation of CCN activity during new particle formation events in the North China Plain, Atmos. Chem. Phys., 16, 8593–8607, https://doi.org/10.5194/acp-16-8593-2016, 2016.
Mochida, M., Nishita-Hara, C., Kitamori, Y., Aggarwal, S. G., Kawamura, K., Miura, K., and Takami, A.: Size-segregated measurements of cloud condensation nucleus activity and hygroscopic growth for aerosols at Cape Hedo, Japan, in spring 2008, J. Geophys. Res., 115, D21207, https://doi.org/10.1029/2009jd013216, 2010.
Nair, V. S., Jayachandran, V. N., Kompalli, S. K., Gogoi, M. M., and Babu, S. S.: Cloud condensation nuclei properties of South Asian outflow over the northern Indian Ocean during winter, Atmos. Chem. Phys., 20, 3135–3149, https://doi.org/10.5194/acp-20-3135-2020, 2020.
O'Dowd, C., Ceburnis, D., Ovadnevaite, J., Vaishya, A., Rinaldi, M., and Facchini, M. C.: Do anthropogenic, continental or coastal aerosol sources impact on a marine aerosol signature at Mace Head?, Atmos. Chem. Phys., 14, 10687–10704, https://doi.org/10.5194/acp-14-10687-2014, 2014.
O'Dowd, C. D., Smith, M. H., Consterdine, I. E., and Lowe, J. A.: Marine aerosol, sea-salt, and the marine sulphur cycle: A short review, Atmos. Environ., 31, 73–80, https://doi.org/10.1016/S1352-2310(96)00106-9, 1997.
O'Dowd, C. D., Facchini, M. C., Cavalli, F., Ceburnis, D., Mircea, M., Decesari, S., Fuzzi, S., Yoon, Y. J., and Putaud, J. P.: Biogenically driven organic contribution to marine aerosol, Nature, 431, 676–680, https://doi.org/10.1038/nature02959, 2004.
Park, M., Yum, S. S., Kim, N., Cha, J. W., Shin, B., and Ryoo, S.-B.: Characterization of submicron aerosols and CCN over the Yellow Sea measured onboard the Gisang 1 research vessel using the positive matrix factorization analysis method, Atmos. Res., 214, 430–441, https://doi.org/10.1016/j.atmosres.2018.08.015, 2018.
Petters, M. D. and Kreidenweis, S. M.: A single parameter representation of hygroscopic growth and cloud condensation nucleus activity, Atmos. Chem. Phys., 7, 1961–1971, https://doi.org/10.5194/acp-7-1961-2007, 2007.
Phillips, B. N., Royalty, T. M., Dawson, K. W., Reed, R., Petters, M. D., and Meskhidze, N.: Hygroscopicity- and Size-Resolved Measurements of Submicron Aerosol on the East Coast of the United States, J. Geophys. Res.-Atmos., 123, 1826–1839, https://doi.org/10.1002/2017JD027702, 2018.
Pöschl, U., Rose, D., & Andreae, M. O.: Climatologies of Cloud-related Aerosols. Part 2: Particle Hygroscopicity and Cloud Condensation Nucleus Activity, in: Clouds in the Perturbed Climate System: Their Relationship to Energy Balance, Atmospheric Dynamics, and Precipitation, edited by: Heintzenberg, J. and Charlson, R. J., MIT Press, Cambridge, 58–72, 2009.
Quinn, P. K. and Bates, T. S.: The case against climate regulation via oceanic phytoplankton sulphur emissions, Nature, 480, 51–56, https://doi.org/10.1038/nature10580, 2011.
Quinn, P. K., Collins, D. B., Grassian, V. H., Prather, K. A., and Bates, T. S.: Chemistry and Related Properties of Freshly Emitted Sea Spray Aerosol, Chem. Rev., 115, 4383–4399, https://doi.org/10.1021/cr500713g, 2015.
Ramana, M. V. and Devi, A.: CCN concentrations and BC warming influenced by maritime ship emitted aerosol plumes over southern Bay of Bengal, Sci. Rep.-UK, 6, 30416, https://doi.org/10.1038/srep30416, 2016.
Rose, D., Gunthe, S. S., Mikhailov, E., Frank, G. P., Dusek, U., Andreae, M. O., and Pöschl, U.: Calibration and measurement uncertainties of a continuous-flow cloud condensation nuclei counter (DMT-CCNC): CCN activation of ammonium sulfate and sodium chloride aerosol particles in theory and experiment, Atmos. Chem. Phys., 8, 1153–1179, https://doi.org/10.5194/acp-8-1153-2008, 2008.
Rose, D., Nowak, A., Achtert, P., Wiedensohler, A., Hu, M., Shao, M., Zhang, Y., Andreae, M. O., and Pöschl, U.: Cloud condensation nuclei in polluted air and biomass burning smoke near the mega-city Guangzhou, China – Part 1: Size-resolved measurements and implications for the modeling of aerosol particle hygroscopicity and CCN activity, Atmos. Chem. Phys., 10, 3365–3383, https://doi.org/10.5194/acp-10-3365-2010, 2010.
Rose, D., Gunthe, S. S., Su, H., Garland, R. M., Yang, H., Berghof, M., Cheng, Y. F., Wehner, B., Achtert, P., Nowak, A., Wiedensohler, A., Takegawa, N., Kondo, Y., Hu, M., Zhang, Y., Andreae, M. O., and Pöschl, U.: Cloud condensation nuclei in polluted air and biomass burning smoke near the mega-city Guangzhou, China – Part 2: Size-resolved aerosol chemical composition, diurnal cycles, and externally mixed weakly CCN-active soot particles, Atmos. Chem. Phys., 11, 2817–2836, https://doi.org/10.5194/acp-11-2817-2011, 2011.
Rosenfeld, D., Zhu, Y. N., Wang, M. H., Zheng, Y. T., Goren, T., and Yu, S. C.: Aerosol-driven droplet concentrations dominate coverage and water of oceanic low-level clouds, Science, 363, eaav0566, https://doi.org/10.1126/science.aav0566, 2019.
Royalty, T. M., Phillips, B. N., Dawson, K. W., Reed, R., Meskhidze, N., and Petters, M. D.: Aerosol Properties Observed in the Subtropical North Pacific Boundary Layer, J. Geophys. Res.-Atmos., 122, 9990–10012, https://doi.org/10.1002/2017JD026897, 2017.
Ruehl, C. R., Chuang, P. Y., and Nenes, A.: Distinct CCN activation kinetics above the marine boundary layer along the California coast, Geophys. Res. Lett., 36, L15814, https://doi.org/10.1029/2009gl038839, 2009.
Saliba, G., Chen, C. L., Lewis, S., Russell, L. M., Rivellini, L. H., Lee, A. K. Y., Quinn, P. K., Bates, T. S., Haentjens, N., Boss, E. S., Karp-Boss, L., Baetge, N., Carlson, C. A., and Behrenfeld, M. J.: Factors driving the seasonal and hourly variability of sea-spray aerosol number in the North Atlantic, P. Natl. Acad. Sci. USA, 116, 20309–20314, https://doi.org/10.1073/pnas.1907574116, 2019.
Sato, Y. and Suzuki, K.: How do aerosols affect cloudiness? Science, 363, 580–581, https://doi.org/10.1126/science.aaw3720, 2019.
Singla, V., Mukherjee, S., Safai, P. D., Meena, G. S., Dani, K. K., and Pandithurai, G.: Role of organic aerosols in CCN activation and closure over a rural background site in Western Ghats, India, Atmos. Environ., 158, 148–159, https://doi.org/10.1016/j.atmosenv.2017.03.037, 2017.
Song, J. W., Zhao, Y., Zhang, Y. Y., Fu, P. Q., Zheng, L. S., Yuan, Q., Wang, S., Huang, X. F., Xu, W. H., Cao, Z. X., Gromov, S., and Lai, S. C.: Influence of biomass burning on atmospheric aerosols over the western South China Sea: Insights from ions, carbonaceous fractions and stable carbon isotope ratios, Environ. Pollut., 242, 1800–1809, https://doi.org/10.1016/j.envpol.2018.07.088, 2018.
Ueda, S., Miura, K., Kawata, R., Furutani, H., Uematsu, M., Omori, Y., and Tanimoto, H.: Number-size distribution of aerosol particles and new particle formation events in tropical and subtropical Pacific Oceans, Atmos. Environ., 142, 324–339, https://doi.org/10.1016/j.atmosenv.2016.07.055, 2016.
Wang, J., Shen, Y., Li, K., Gao, Y., Gao, H., and Yao, X.: Nucleation-mode particle pool and large increases in Ncn and Nccn observed over the northwestern Pacific Ocean in the spring of 2014, Atmos. Chem. Phys., 19, 8845–8861, https://doi.org/10.5194/acp-19-8845-2019, 2019.
Wang, Z. J., Du, L. B., Li, X. X., Meng, X. Q., Chen, C., Qu, J. L., Wang, X. F., Liu, X. T., and Kabanov, V. V.: Observations of marine aerosol by a shipborne multiwavelength lidar over the Yellow Sea of China, in: Proceedings of SPIE 9262, Lidar Remote Sensing for Environmental Monitoring XIV, Beijing, China, 13–16 October 2014, 926218, https://doi.org/10.1117/12.2070297, 2014.
Wu, Z. J., Zheng, J., Shang, D. J., Du, Z. F., Wu, Y. S., Zeng, L. M., Wiedensohler, A., and Hu, M.: Particle hygroscopicity and its link to chemical composition in the urban atmosphere of Beijing, China, during summertime, Atmos. Chem. Phys., 16, 1123–1138, https://doi.org/10.5194/acp-16-1123-2016, 2016.
Yamashita, K., Murakami, M., Hashimoto, A., and Tajiri, T.: CCN Ability of Asian Mineral Dust Particles and Their Effects on Cloud Droplet Formation, J. Meteor. Soc. Japan, 89, 581–587, https://doi.org/10.2151/jmsj.2011-512, 2011.
Yao, X. H., Lau, N. T., Fang, M., and Chan, C. K.: Real-time observation of the transformation of ultrafine atmospheric particle modes, Aerosol. Sci. Tech., 39, 831–841, https://doi.org/10.1080/02786820500295248, 2005.
Yao, X. H., Lau, N. T., Chan, C. K., and Fang, M.: Size distributions and condensation growth of submicron particles in on-road vehicle plumes in Hong Kong, Atmos. Environ., 41, 3328–3338, https://doi.org/10.1016/j.atmosenv.2006.12.044, 2007.
Yao, X. H., Choi, M. Y., Lau, N. T., Lau, A. P. S., Chan, C. K., and Fang, M.: Growth and Shrinkage of New Particles in the Atmosphere in Hong Kong, Aerosol. Sci. Tech., 44, 639–650, https://doi.org/10.1080/02786826.2010.482576, 2010.
Yu, F. and Luo, G.: Simulation of particle size distribution with a global aerosol model: contribution of nucleation to aerosol and CCN number concentrations, Atmos. Chem. Phys., 9, 7691–7710, https://doi.org/10.5194/acp-9-7691-2009, 2009.
Zhu, Y., Li, K., Shen, Y., Gao, Y., Liu, X., Yu, Y., Gao, H., and Yao, X.: New particle formation in the marine atmosphere during seven cruise campaigns, Atmos. Chem. Phys., 19, 89–113, https://doi.org/10.5194/acp-19-89-2019, 2019.
Zimmerman, N., Jeong, C.-H., Wang, J. M., Ramos, M., Wallace, J. S., and Evans, G. J.: A source-independent empirical correction procedure for the fast mobility and engine exhaust particle sizers, Atmos. Environ., 100, 178–184, https://doi.org/10.1016/j.atmosenv.2014.10.054, 2015.