the Creative Commons Attribution 4.0 License.
the Creative Commons Attribution 4.0 License.
 | 13 Aug 2020
Shipping emissions in the Iberian Peninsula and the impacts on air quality
Rafael A. O. Nunes
Maria C. M. Alvim-Ferraz
Fernando G. Martins
Fátima Calderay-Cayetano
Vanessa Durán-Grados
Juan Moreno-Gutiérrez
Jukka-Pekka Jalkanen
Hanna Hannuniemi
Marine traffic has been identified as a relevant source of pollutants, which cause known negative effects on air quality. The Iberian Peninsula is a central point in the connection of shipping traffic between the Americas, Africa, and the rest of Europe. To estimate the effects of shipping emissions inland and around the Iberian Peninsula, the EMEP/MSC-W model was run considering and not considering shipping emissions (obtained with STEAM3). Total estimated emissions of CO, CO2, SOx, NOx, and particulate matter (subdivided into elementary carbon – EC, organic carbon – OC, sulfate, and ash) for the study domain in 2015 were respectively 49, 30 000, 360, 710, 4.5, 11, 32, and 3.3 kt yr−1. Shipping emissions increased SO2 and NO2 concentrations, especially near port areas, and also increased the O3, sulfate, and particulate matter (PM2.5 and PM10) concentrations over the entire Iberian Peninsula coastline (especially in the south coastal region). Shipping emissions were responsible for exceedances of WHO air quality guidelines for PM2.5 in areas far from the coastline, which confirms that shipping emissions can contribute negatively to air quality, both in coastal and inland areas.
- Article
(3242 KB) - Full-text XML
- BibTeX
- EndNote


Marine traffic has been identified as a relevant source of pollutants, especially nitrogen oxides (NOx), sulfur oxides (SOx), and particulate matter (PM), which may lead to known negative effects on air quality and health, with its contributions to human health degradation still not well documented (Brandt et al., 2013; Corbett et al., 2007; Nunes et al., 2017b; Sofiev et al., 2018).
Studies have been reporting that shipping contributions to ambient PM in port areas are mainly secondary particles (around 60 % to 70 % of PM10 and PM2.5 mass concentrations). Despite this, studies have been suggesting that it could be more advantageous to reduce shipping-related primary particle emissions than precursors of secondary particles (NOx and SOx), which are the target of current international regulations (Viana et al., 2014). In fact, international shipping represents around 13 % and 12 % of total global anthropogenic emissions of NOx and SOx, respectively (Smith et al., 2014). Moreover, according to Klimont et al. (2017), PM emissions from international shipping contribute about 3 %–4 % to global emissions, which is comparable to the contribution of road transport. As far is as known, it is up to 400 km from the coast that 70 % of ship emissions are detected (Eyring et al., 2009). As pollutants can be transported hundreds of kilometres towards the mainland, ships may contribute to air quality degradation in coastal areas, as well as inland areas (Corbett et al., 2007; Eyring et al., 2009). Over the past 10 years, interest has been growing in studying the impact on air quality of maritime emissions in cities and ports using experimental measures (Contini et al., 2011; Merico et al., 2016, 2017; Pandolfi et al., 2011; Viana et al., 2015; Wang et al., 2019) and applying air quality models (AQMs) at local, regional, and global levels (Abrutytė et al., 2014; Aksoyoglu et al., 2016; Aulinger et al., 2016; Barregard et al., 2019; Chen et al., 2017, 2018; EEA, 2013; Eyring et al., 2007; Lauer et al., 2007; Liu et al., 2017; Marelle et al., 2016; Marmer and Langmann, 2005; Matthias et al., 2016; Monteiro et al., 2018; Sotiropoulou and Tagaris, 2017). Nevertheless, the use of AQMs, such as CMAQ, WRF, CAMx, EMEP/MSC-W, and others, entails inevitable sources of uncertainties and some limitations, mostly conditioned by the resolution of the models, the methodological limitations as a result of the complexity of air quality assessment, the quality of the meteorological, data and the reliability of emissions inventories (Karl et al., 2019). In the last years, the activity-based method using the Automatic Identification System (AIS) has been commonly accepted as the most accurate way to estimate shipping emissions based on detailed information of ship specifications and operational data. Several authors have applied this methodology, although estimations with the Ship Traffic Emission Assessment Model (STEAM) have been recognised as the best way of conducting a reliable ship emissions inventory based on ship activity (Aulinger et al., 2016; Marmer and Langmann, 2005; Nunes et al., 2017b; Russo et al., 2018). Aulinger et al. (2016) recognised in their study that STEAM could be more reliable than other methods using AIS to describe ship movements. Marelle et al. (2016) evaluated emissions estimated with STEAM2 and compared them with airborne measurements from the ACCESS (Arctic Climate Change, Economy and Society) aircraft campaign. They concluded that the use of STEAM2 led to reasonable predictions of NOx, SO2, and O3 in comparison with ACCESS profiles. In addition, in a study performed by Nunes et al. (2017a) that reviewed studies from 2010 on activity-based methodology to estimate shipping emissions, STEAM was indicated as the best procedure to predict ship power, leading to better predictions of ship movements and more reliable emission calculations. Additionally, Russo et al. (2018) reviewed and compared five different European inventories (EMEP, TNO-MACC_III, E-PRTR, EDGAR, and STEAM) including or calculating emissions from shipping; this study concluded that the STEAM inventory should be used for studies requiring high-resolution shipping emissions data. STEAM allows for the assessment of emissions from each individual ship, combining highly detailed AIS data and technical knowledge of the ships (characteristics and operative mode). STEAM is currently on its third version. From the first to the second version, carbon monoxide (CO) and particulate matter (PM) emissions were included. The method of analysing ship resistance on the water was revised, and the modelling of the power consumption of auxiliary engines was improved. In the third version, improvements include methods to compensate for the lack of technical information on some ships and satellite data in some regions, as well as some refinements allowing users to take into account legislative regulations (emission control areas, on-board emission abatement equipment, and fuel sulfur content) (Jalkanen et al., 2012; Johansson et al., 2017). The majority of the studies on the impact of shipping emissions on air quality were performed for global scales (Dalsøren et al., 2009; Eyring et al., 2007; Lauer et al., 2007) using the OsloCTM2, CMAQ, and ECHAM5/MESSy1-MADE models; continental scales were also addressed (Aksoyoglu et al., 2016; Marelle et al., 2016; Ramacher et al., 2019; Sotiropoulou and Tagaris, 2017), especially in the Asian region (Chen et al., 2018; Liu et al., 2017; Zhang et al., 2017), using models with coarser resolutions (CAMx, WRF/Chem, CMAQ, and GISS-E2 global models). There are only a few studies based on modelling results that considered the impacts of shipping emissions at a local scale (Abrutytė et al., 2014; Aulinger et al., 2016; Matthias et al., 2016; Monteiro et al., 2018; Vutukuru and Dabdub, 2008). Moreover, only a few have used STEAM to estimate shipping emissions, namely for the North Sea (Aulinger et al., 2016; Jonson et al., 2015), Baltic Sea (Barregard et al., 2019; Jonson et al., 2015), and northern Norway region (Marelle et al., 2016). As far as is known, there is only one local study that specifically considered the Iberian Peninsula domain, evaluating the impact of maritime emissions on air quality at European and national scales using the WRF-CHIMERE modelling system for 2016 (Monteiro et al., 2018) but not using STEAM. Shipping emissions in that study were extracted from the TNO-MACC_III inventory, a high spatially resolved anthropogenic emissions data source available for Europe. This inventory has high-spatial-resolution data, and the MACC-III version is an updated version with a new trend analysis for emissions from international shipping, but STEAM exhibits the highest spatial resolution in emissions and a large number of secondary routes that do not appear in the former inventory, making emissions predicted with STEAM more precise. It also includes the disruptive changes in environmental regulations (emission control areas, EU sulfur directive) concerning sulfur in marine fuels. Moreover, the MACC-III project team highlighted a clear necessity for more research to obtain data on shipping emissions (Denier van der Gon et al., 2017; Russo et al., 2018).
The Iberian Peninsula is the most western point of the European continent and the only natural opening by sea between the Mediterranean and the Atlantic Ocean. Considering the strategic position of the Iberian Peninsula regarding international maritime transport and the need for reducing the above scientific gaps, this study aimed to (i) estimate shipping emissions based on STEAM3 for 2015, (ii) quantify the impacts of shipping emissions on the ambient air quality of the Iberian Peninsula using the EMEP/MSC-W model, and (iii) investigate the inland regions where the European Commission air quality standards and WHO air quality guidelines were exceeded due to shipping.
2.1 Study area
The Iberian Peninsula is located in the southwest of Europe, mainly constituted by Portugal and Spain (it also includes Andorra and Gibraltar). It is bordered on the southeast by the Mediterranean Sea (coastline with ≈1600 km), and on the north, west, and southwest by the Atlantic Ocean (coastline with ≈1650 km), being a central point in the connection of shipping traffic between the Americas, Africa, and the rest of Europe (Global Ocean Associates, 2004a, b, c). In fact, the Iberian Peninsula has a central position between the English Channel and the Strait of Gibraltar, which are two of the busiest maritime routes in the world (Campbell, 2001a, b). Figure A1 shows shipping traffic lines for 2015 demonstrating the relevance of the Iberian Peninsula in the international shipping traffic context.
2.2 Shipping emissions inventory
The shipping emissions inventory for the Iberian Peninsula in 2015 was obtained from a full bottom-up approach using STEAM. This model combines the following to calculate emissions from each ship: (i) shipping activity information from the terrestrial and satellite-based Automatic Identification System (AIS), along with the technical characteristics of each ship (from IHS Markit); (ii) the engine type for over 90 000 ships; and (iii) the emission factors for each type of ship and size, engine type, and mode of operation. According to the above information, STEAM allows for the calculation of the power consumptions and loads of each engine, as well as the quantity of fuel consumed to overcome a specific speed based on the resistance of each ship (Jalkanen et al., 2009). The model also permits the calculation of shipping emissions as a function of time and location (Jalkanen et al., 2012; Johansson et al., 2013, 2017). Emissions of CO, CO2, SOx, NOx, and particulate matter (subdivided into EC, OC, sulfates, and ash) were estimated for the Iberian Peninsula from ships with an IMO number (ships for which it is mandatory using AIS equipment) and some small vessels for which the IMO number is not mandatory but with a Mobile Maritime Service Identity (MMSI) that produced a valid response during 2015. To compare shipping emissions with land-based emissions, the sum of the annual mean emissions of NOx and SOx from the other 11 SNAP sectors for the domain of this study were calculated. Shipping emissions were analysed for monthly and seasonal patterns. Seasonal patterns were based on data from (i) January, February, and March called “winter”; (ii) April, May, and June called “spring”; (iii) July, August, and September called “summer”; and (iv) October, November, and December called “autumn”. The non-parametric Kruskal–Wallis test for multiple samples (the four seasons) and the non-parametric Wilcoxon signed-rank test for two samples performed at the 95 % confidence level were used to detect statistically significant variations for all pollutants in the seasonal concentration data.
2.3 EMEP modelling system – configuration and evaluation
The open-source EMEP/MSC-W chemistry transport model version rv4.15 was used to evaluate the contribution of shipping emissions to NO2, SO2, PM2.5, PM10, sulfate, and O3 concentrations in the Iberian Peninsula. The model was run on a subdomain that extends from −14.25 to 9.05∘ E and 32.15 to 47.35∘ N, and concentrations were simulated up to approximately 400 km from the Iberian Peninsula coast. The initial and the lateral boundary conditions for most of the chemical compounds were defined by functions defining concentrations in terms of latitude and time based on measurements and/or model calculations, providing robustness which chemical transport model results sometimes lack. More information about the EMEP/MSC-W configuration for initial and boundary concentrations used in this study can be found in Simpson et al. (2012). The model was designed for two scenarios: (i) a shipping scenario (S-SCN) considering shipping emissions and (ii) a baseline scenario (B-SCN) not considering shipping emissions. Runs were made for 2015 with a horizontal resolution of (long–lat) and an hourly data output. Emissions (for the same year as the shipping emissions inventory) from other sources, such as industry, road traffic, public power, and other sectors split into 11 SNAPs, were obtained from the European emission inventories that are reported under the Convention on Long-Rage Transboundary Air Pollution (LRTAP) and the National Emission Ceilings (NEC) Directive (EMEP/CEIP, 2018). Emissions from the shipping sector considered in the inventory were excluded to avoid double counting of emissions. Moreover, emissions of dust from the Sahara as well as NOx from lightning and forest fires were also considered (Simpson et al., 2012; Wiedinmyer et al., 2011). The model is divided into 34 vertical layers, with the lowest layer having a thickness of 50 m, assuming that the plume rise issue in ship exhaust dispersion is more relevant for local-scale air quality assessments and less for regional-scale work. For this reason, the ship emissions from STEAM were allocated to the first model layer of the EMEP runs. PM concentrations were modelled considering primary particulate matter originating directly from anthropogenic emissions, as well as secondary organic and inorganic aerosols and sea salt. Other details about the model can be found in Simpson et al. (2012) and in a study by the Norwegian Meteorological Institute (2017a). The meteorological data for 2015 were generated by the European Centre for Medium-Range Weather Forecasts with the Integrated Forecast System model. According to EMEP Status Report 1/2017, 2015 was among the warmest years in Europe, with temperatures reported above normal in winter and extremely high during summer in southern Europe. Despite this, Iberian Peninsula temperatures below average were registered due to a persistent southwesterly flow (Norwegian Meteorological Institute, 2017b). In spring, prolonged high pressure was established over the Iberian Peninsula, leading to above-average temperatures in Portugal and Spain. In July, Spain was affected by an extraordinary and long-lasting heatwave (Norwegian Meteorological Institute, 2017b). Regarding the performance of the model, simulations from EMEP/MSC-W are regularly evaluated against measurements in the EMEP annual reports (Norwegian Meteorological Institute, 2018). Moreover, there are several studies that compare model results with measurements and calculations with other models (Angelbratt et al., 2011; Bessagnet et al., 2016; Colette et al., 2011, 2012; Jonson et al., 2010; Karl et al., 2017; Prank et al., 2016; Soares et al., 2016) and recent studies that used the model to assess the effects of shipping emissions (Jonson et al., 2015, 2017; Turner et al., 2017). To support the results of the present study, model output PM2.5, PM10, and NO2 concentrations for the S-SCN scenario were compared with data from the monitoring stations of EU Member States reported by the European Environmental Agency for 2015 (EEA, 2020). Moreover, the modelling reference results reported by the EMEP for the year 2015 (Norwegian Meteorological Institute, 2019) were also compared with data from monitoring stations. Annual mean concentrations observed at 139 stations for PM2.5, 337 stations for PM10, and 446 stations for NO2 were compared with the model results in time and space. Table 1 summarises the model quality indicators (Pearson correlation coefficient – Pearson's r; mean bias error – MBE; mean absolute error – MAE; and root mean square error – RMSE) for the present study and for the reference results reported by the EMEP. Similar results were obtained for the comparison with the present study and with the reference results of EMEP, which indicates that the model simulations were well executed. Correlations obtained were moderately positive (Pearson's r>0.5) for all pollutants, with errors smaller than those reported in the literature (Monteiro et al., 2018). The annual mean concentrations for each inland grid cell were compared with reference standards and guidelines (WHO and EU), aiming to evaluate exceedances and/or non-compliances of NO2, SO2, PM2.5, and PM10 due to shipping emissions. Comparisons were performed considering the international reference values for pollutants in ambient air, namely (i) EU air quality standards for NO2 (40 µg m−3 for annual mean), SO2 (125 µg m−3 for daily mean), PM2.5 (25 µg m−3 for annual mean), and PM10 (40 µg m−3 for annual mean); and (ii) WHO air quality guidelines for NO2 (40 µg m−3 for annual mean), SO2 (20 µg m−3 for daily mean), O3 (SOMO35 – yearly sum of the daily maximum of 8 h running average over 35 ppb in parts per billion per day), PM2.5 (10 µg m−3 for annual mean), and PM10 (20 µg m−3 for annual mean) (European Commission, 2018; WHO, 2018). To support the results of the present study, the annual exceedances of PM2.5, PM10, and NO2 found simultaneously with the modelled S-SCN scenario and with data from the monitoring stations of the EU Member States were compared (EEA, 2020). For PM2.5, the exceedances of the WHO guidelines found with the modelled data represented more than 60 % of the exceedances calculated with the data from the stations. Regarding PM10, slight agreement was found, with only 11 % of the exceedances found for the modelled data. However, for NO2 all the exceedances were estimated with the modelled data. According to these results, the model seems to predict with good reliability the exceedances of PM2.5 and NO2. For PM10 the results need to be used with caution.
Table 1Model quality indicators for estimations from the present study and for the reference results reported by the EMEP.
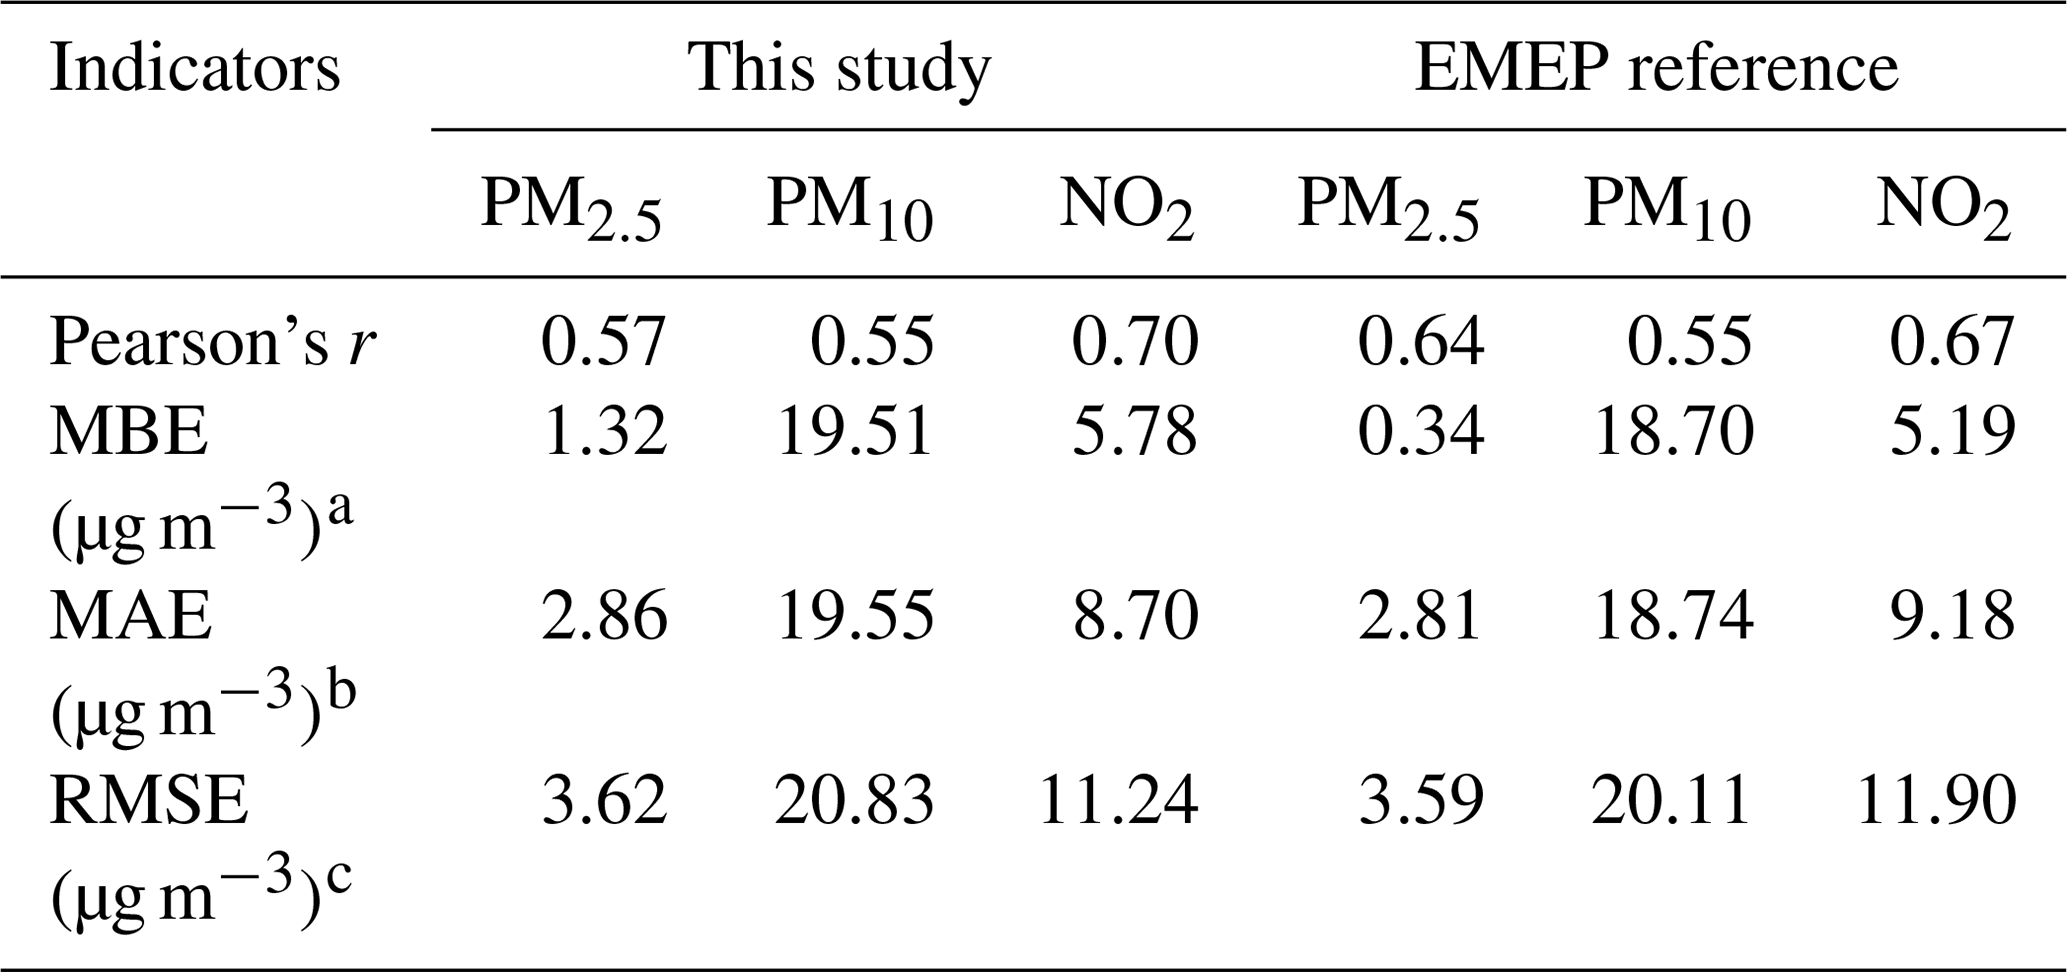
a mean bias error; b mean absolute error; c root mean square error.
3.1 Shipping emissions – spatial and seasonal variation
Table 2 summarises the amount of emitted air pollutants from shipping and from land-based anthropogenic sources. Comparing NOx and SOx shipping emissions with land-based emissions, on average the former were lower than the latter. Despite this, if NOx and SOx shipping emissions were added to the land-based emissions, the total would increase by 45 % and 62 %, respectively. Moreover, compared with emissions from the SNAP of road transport (660 kt yr−1 of NOx and 7.1 kt yr−1 of SOx), the emitted amounts of NOx and SOx from shipping were 1.1 and 51.3 times higher, respectively. These results show the importance of shipping emissions for these two pollutants.
Table 2Annual mean amounts of emitted air pollutants from shipping and from land-based anthropogenic sources during 2015 (t yr−1).
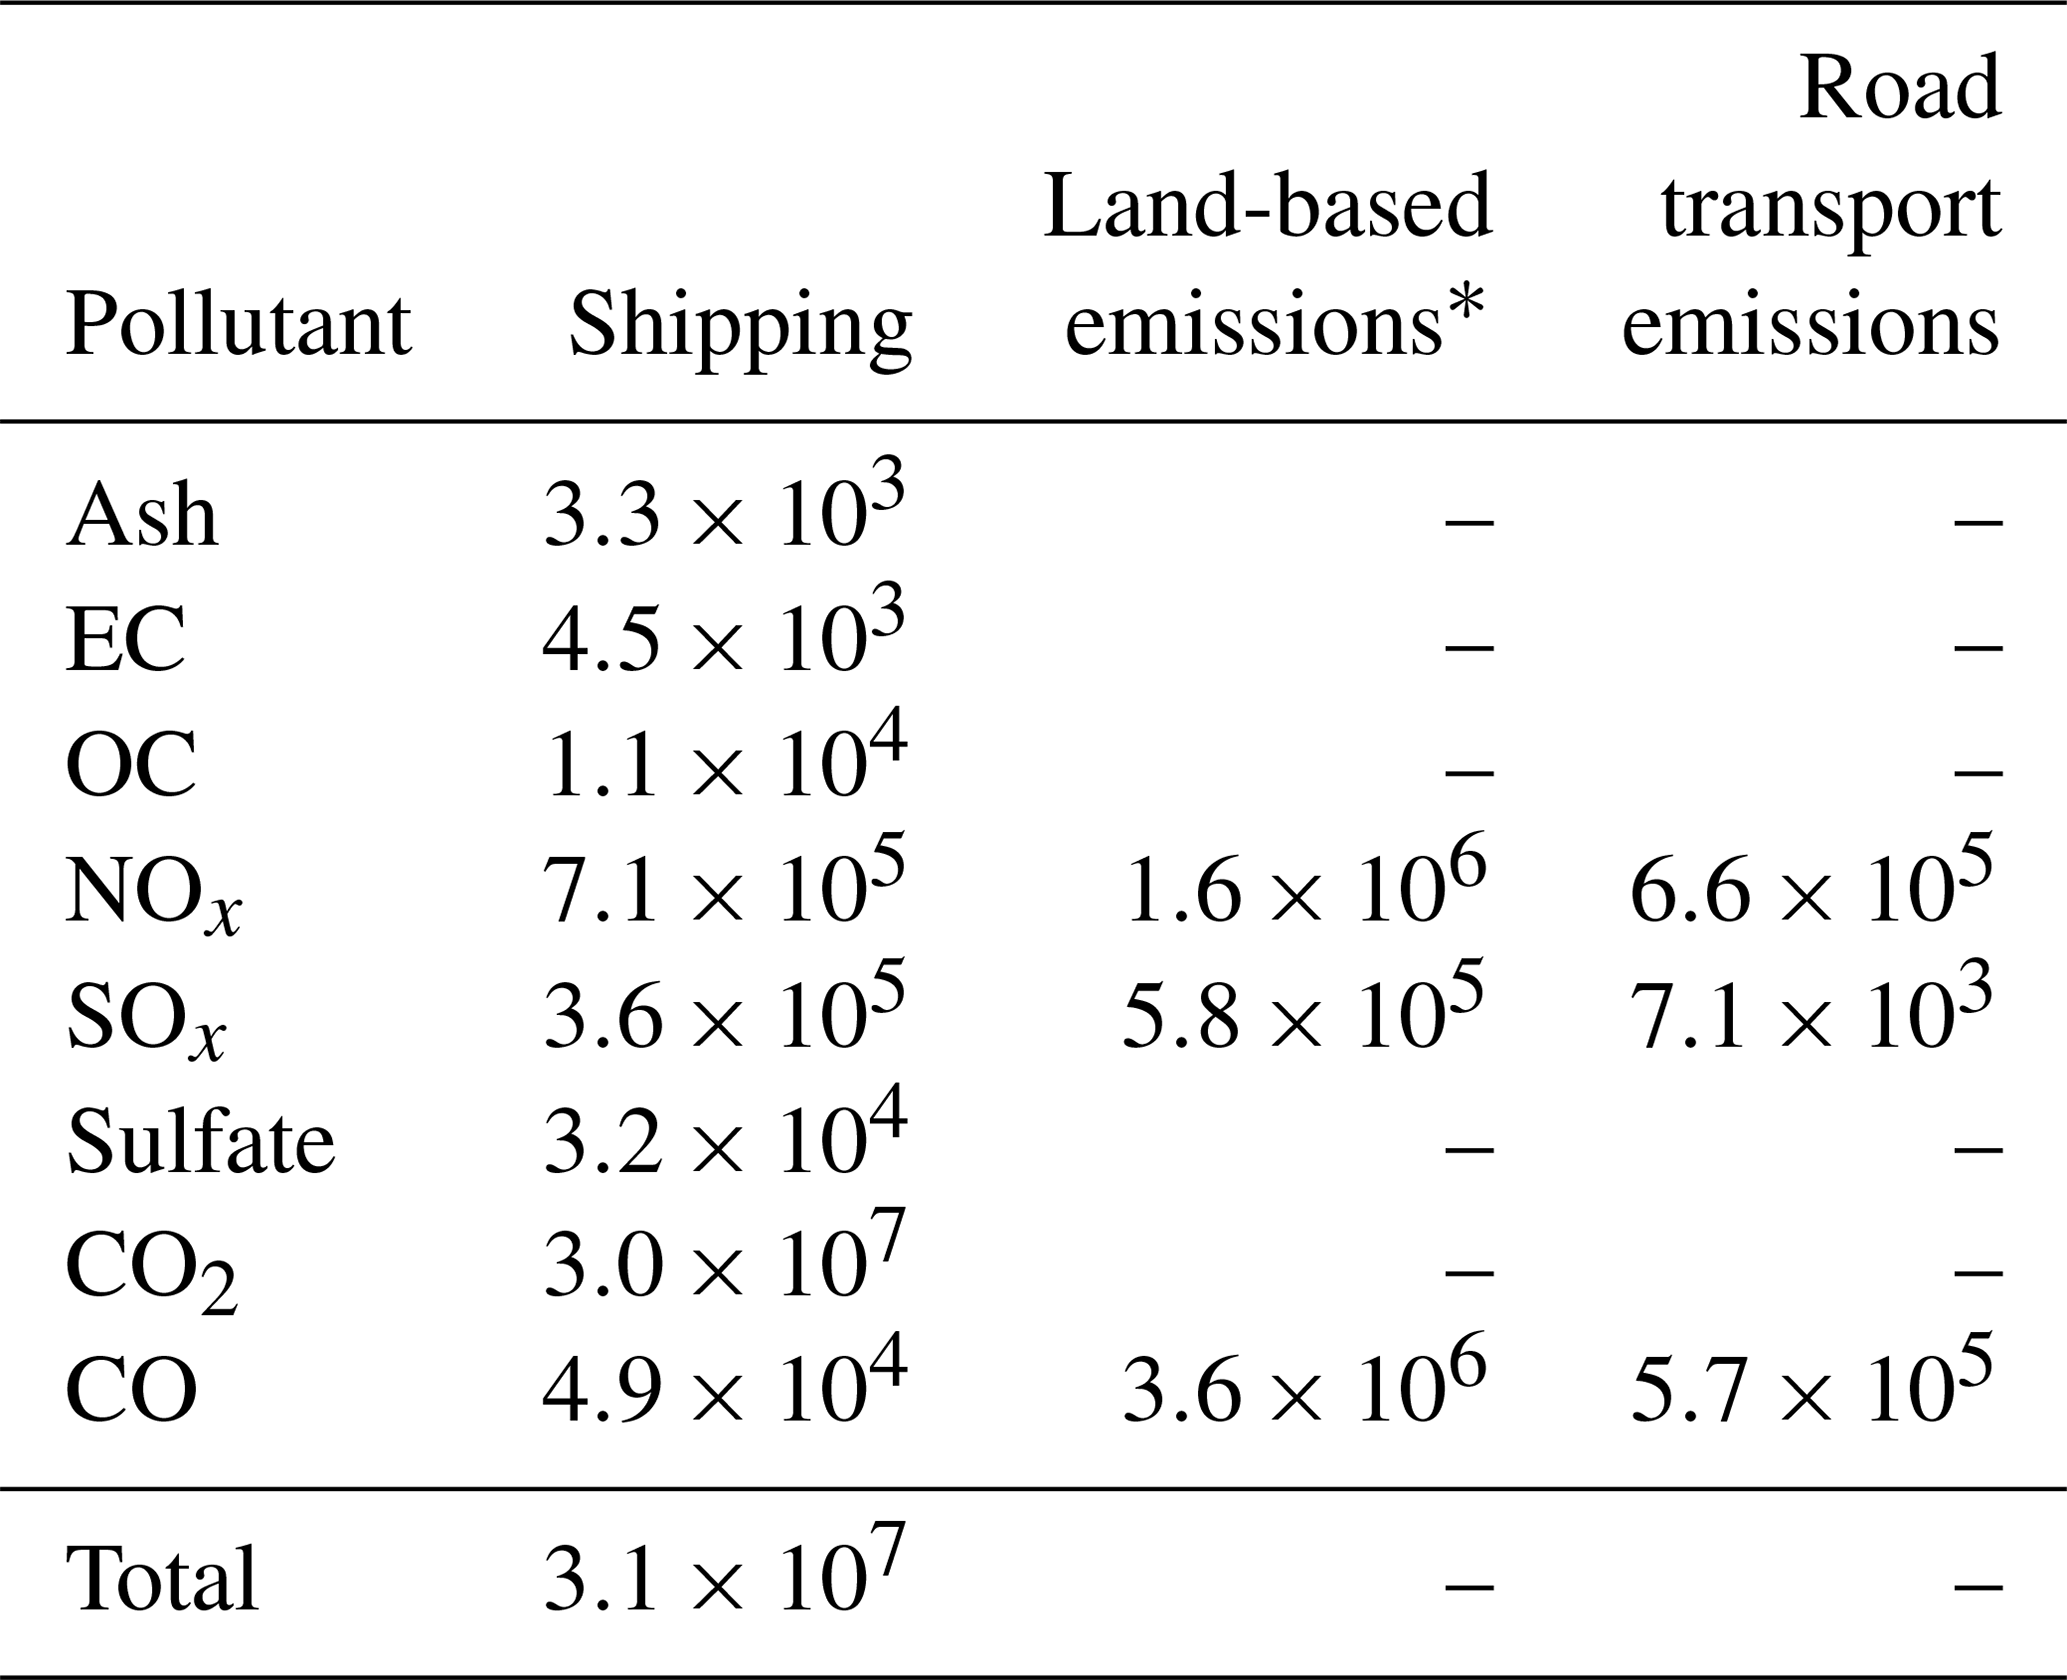
* Emissions from 11 SNAP sectors, namely public electricity and heat production, industry, other stationary combustion sources, fugitive emissions, solvents, road transport, aviation, off-road sources, waste, agriculture and livestock, agricultural sources, and other sources.
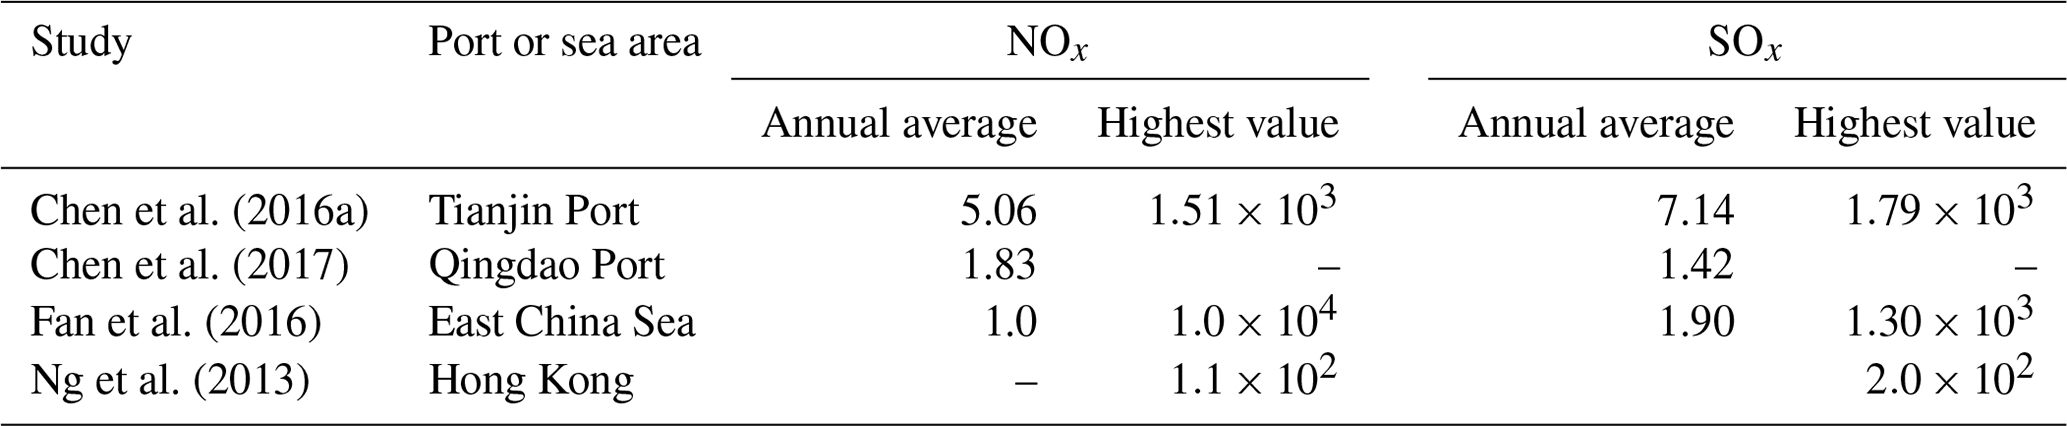
Figure 1 shows the annual mean shipping emissions of CO, CO2, SOx, NOx, EC, OC, sulfates, and ash (a component of the PM emitted by ships that depends on the content of marine fuels) for the Iberian Peninsula in 2015 in grid cells (approximately 10×10 km2). Details about emission factors used in STEAM can be found in Jalkanen et al. (2009, 2012) and Jonson et al. (2015). As can be seen, the spatial distribution was similar for all pollutants. In general, the highest emissions were established along the west coast of the Iberian Peninsula (including all if the Portuguese coast), in the Strait of Gibraltar, and in the Mediterranean Sea, especially close to the African coast, which is consistent with world shipping traffic density (Fig. A1). It is important to emphasise that the grid cells along the coast where ports are located also had higher emissions due to hotelling activities. Although emissions during hotelling only represent a slight part of the total shipping emissions, port areas are significant receptors of these emissions due to the concentration of ships for long periods of time in some cases (Nunes et al., 2017a). The annual average and highest intensities for NOx and SOx reported from research in the Asian region are presented in Table 3 (Chen et al., 2016a, 2017; Fan et al., 2016). In general, the average intensities that were reported for Asia were considerably higher than those found in this study. It was possible to identify in the present study two main hubs given the high emission intensity: Valencia Port and the Strait of Gibraltar. At Valencia Port, ash, CO, EC, and OC had the highest values of , 1.85, , and t yr−1 km−2, respectively. At the Strait of Gibraltar, CO2, NOx, sulfate, and SOx had the highest values of 1330, 24, 1.03, and 11.6 t yr−1 km−2, respectively. In accordance with what was referred to above, in the Asian region maximum intensities were also higher than those estimated here (Chen et al., 2016b; Fan et al., 2016; Ng et al., 2013). The big differences between the average and highest emission intensities of the present study and those of Asian studies appear to be related to the high intensity and type of maritime traffic and to the restricted fuel regulations in Europe. In fact, 7 of the 10 largest container ports in the world are located in China, and Asia is the region with the highest world seaborne trade, characterised by high traffic of container ships that have already been documented as one of the most polluting categories of ships (Chen et al., 2018; Ng et al., 2013; Nunes et al., 2017b; Song and Shon, 2014; UNCTAD, 2017). Moreover, in 2010, a 0.1 % maximum sulfur requirement for fuels was established for ships at berth in EU ports; however, in China, there are only some domestic emission control areas with a 0.5 % maximum (Reuters, 2018). Nevertheless, in the Health Effects Institute (HEI) report the authors described lower emission intensities for the Yangtze River Delta and Shanghai areas at 12 NM from the coast. According to these results, comparisons should be made carefully as emission intensities seem strongly dependent on the location for which they are calculated (inside the port area, at a certain distance from the coast, or on the high seas) and also on the methodology used to calculate shipping emissions (Zhang et al., 2019).
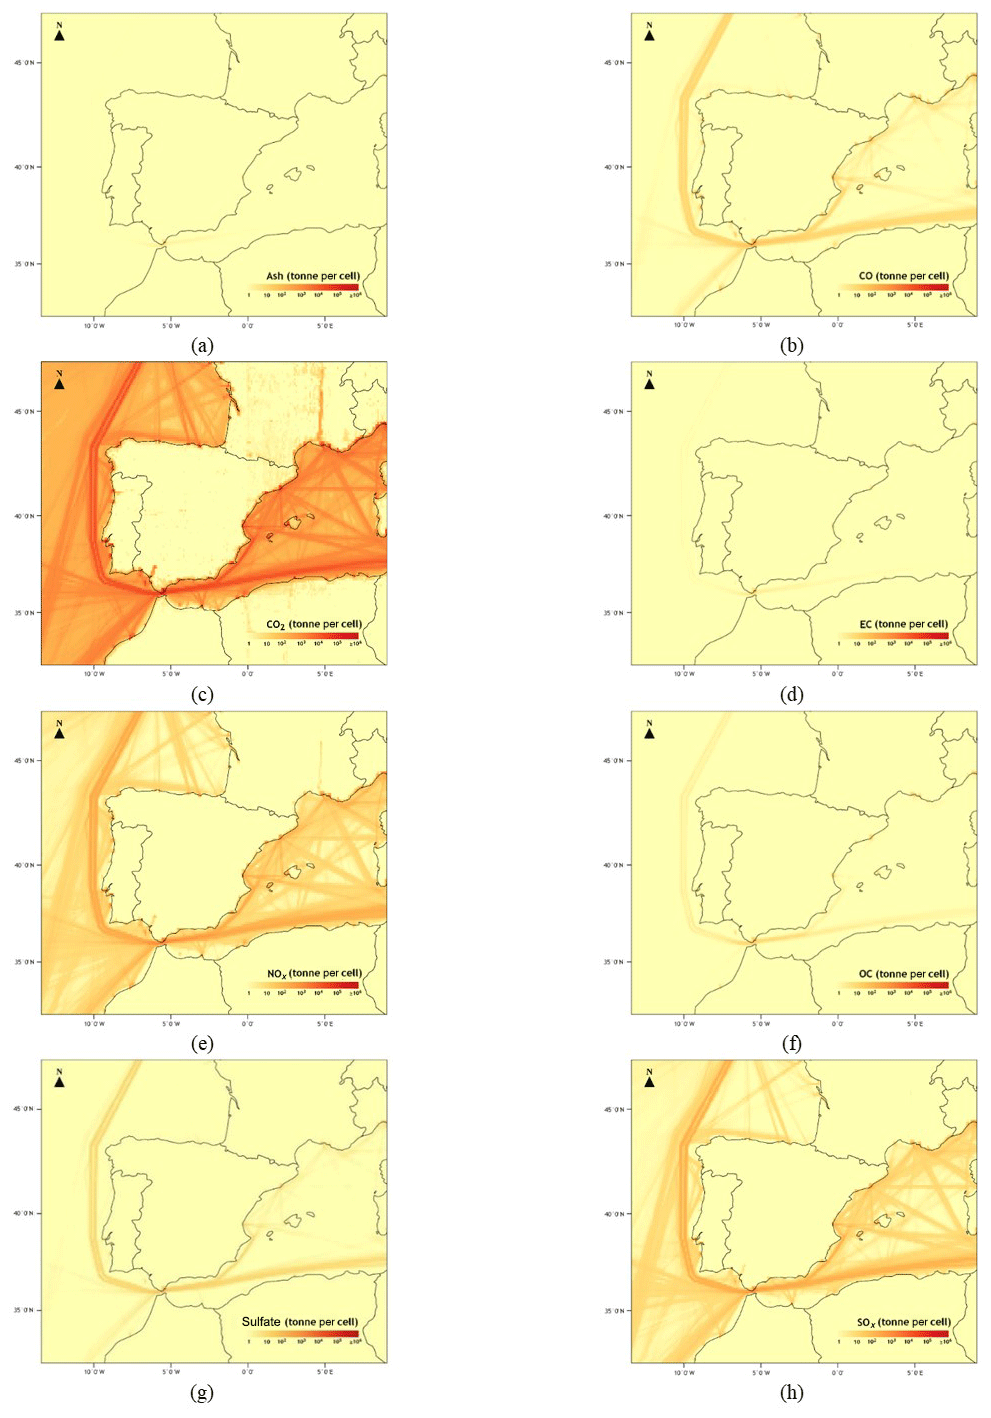
Figure 1Shipping emissions of (a) ash, (b) CO, (c) CO2, (d) EC, (e) NOx, (f) OC, (g) sulfate, and (h) SOx in the study domain for 2015.
Table 3Annual average and highest intensities of NOx and SOx (t yr−1 km−2) reported from research in the Asian region.
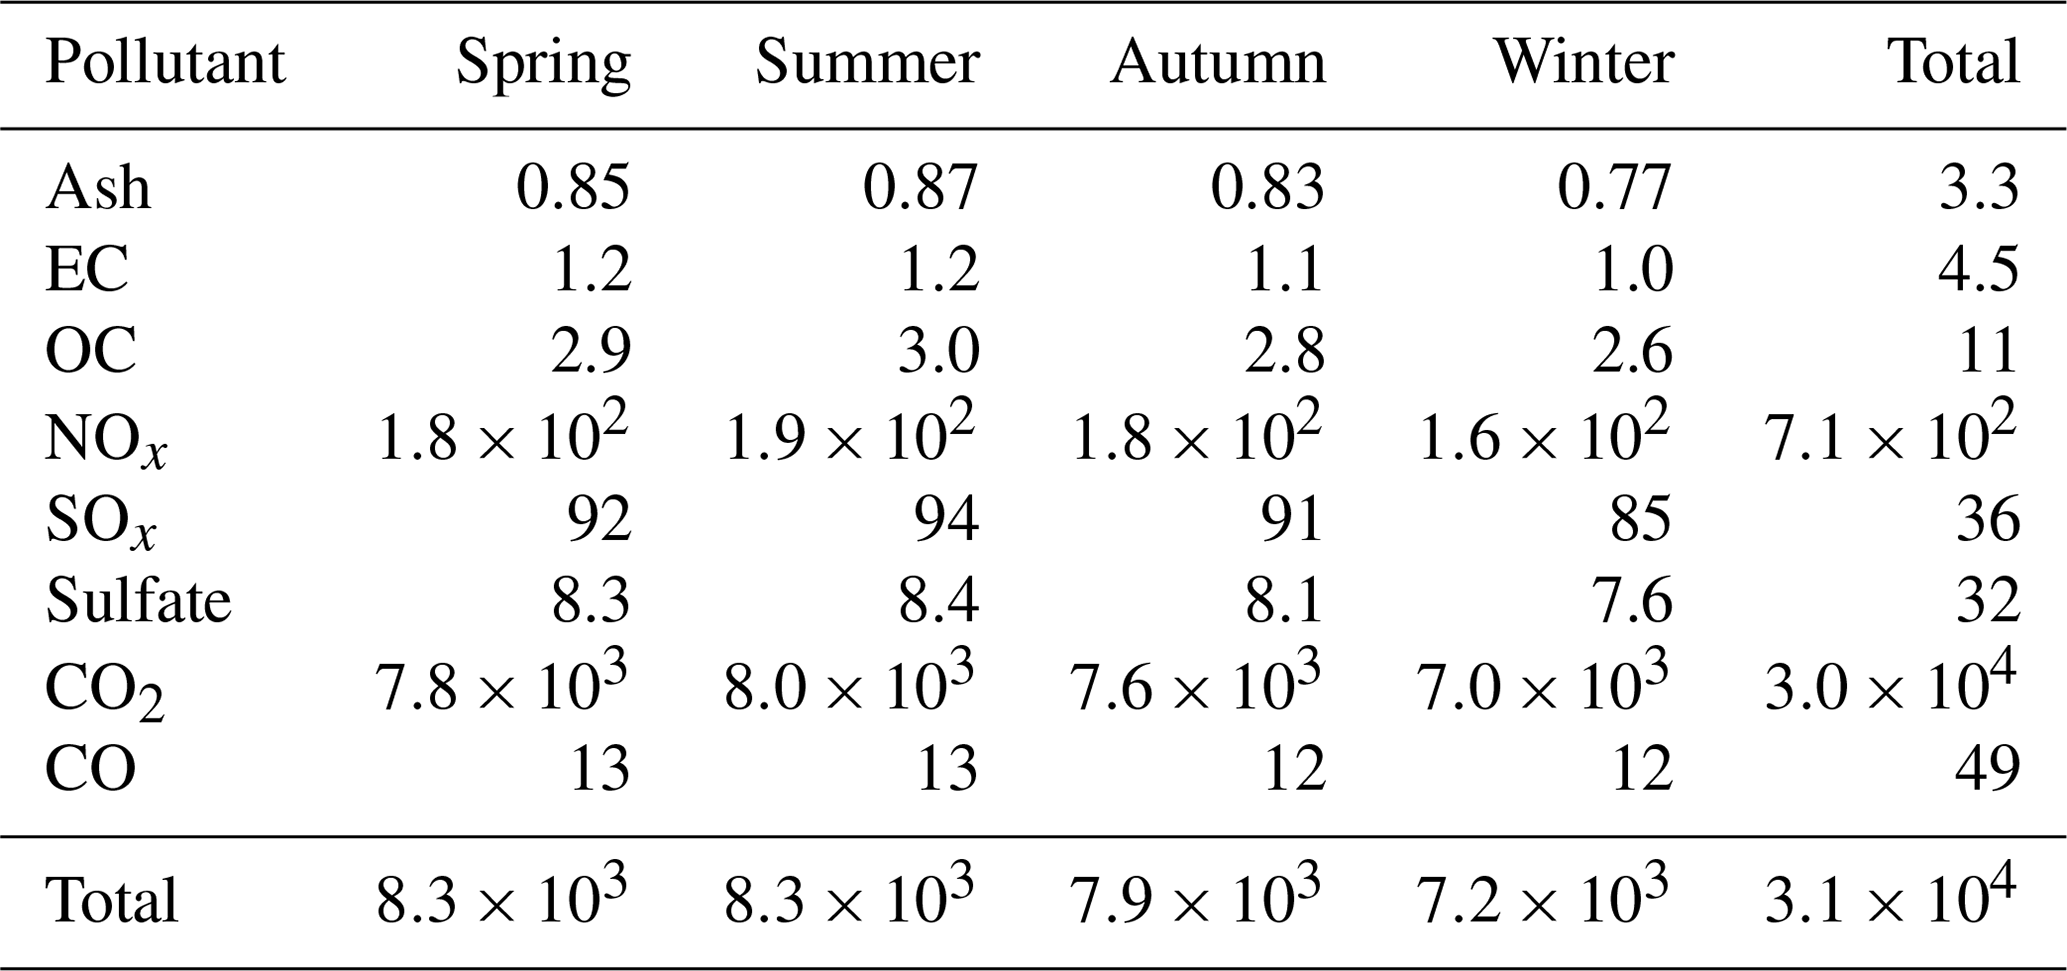
Shipping emissions were also analysed for monthly and seasonal patterns. Seasonal amounts of shipping emissions for the pollutants analysed are shown in Table 4. According to 2015 data, the largest amounts of pollutants were emitted in summer and spring, accounting for approximately 26 % of the annual total in both cases and being similar for the other seasons (23 % and 25 % for winter and autumn, respectively). Figure 2 shows the monthly amounts of CO2, NOx, SOx (t yr−1), ash, CO, EC, OC, and sulfate (kg yr−1) for shipping emissions in the study domain during 2015. It can be observed that emissions increased progressively from February to July, when they reached the maximum annual value. After that, a decrease during August and September was observed, followed by a stabilisation during October (for some pollutants there was a slight increase) and a decrease until December. Although emissions varied throughout the year, variations were about 1 %–2 % between months, and each month represented 7.1 %–9.1 % of the annual total emissions. In fact, according to the statistical trend analysis using the Mann–Kendall trend test performed at the 95 % confidence level, no statistically significant variations were achieved in the monthly emissions data for all pollutants (p values >0.05). These slight variations seem to be related to the navigation conditions (better during the spring and summer), which consequently increases the number of ships that sail in this zone (during May, June, July, and August). Fan et al. (2016) also reported slight seasonal variations similar to this study, although for the East China Sea higher emissions were verified during spring. Jalkanen et al. (2009) reported higher shipping emissions during summer (highest emissions during July) for the Baltic Sea in 2007 and a similar seasonal variation pattern, although the variation was higher (20 % between the months with the highest and lowest NOx emissions).
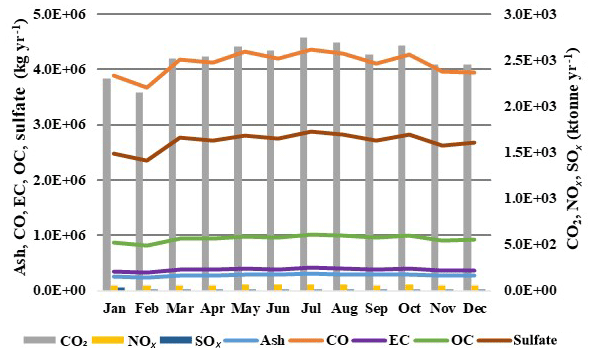
Figure 2Monthly amounts of CO2, NOx, SOx (kt yr−1; bars, right axis), ash, CO, EC, OC, and sulfate (kg yr−1; lines, left axis) shipping emissions in the study domain during 2015.
Table 4Seasonal amounts of emitted air pollutants from shipping in the Iberian Peninsula in 2015 (t yr−1).
3.2 Impact on air quality
3.2.1 Annual average concentrations
To understand the shipping emission impact on air quality over the Iberian Peninsula in 2015, the EMEP model was configured considering and not considering shipping emissions. Figure 3 shows the contribution of shipping emissions to the annual average NO2, SO2, sulfate, O3, PM2.5, and PM10 surface concentrations in the Iberian Peninsula. Results show that when shipping emissions were considered, the concentrations of NO2, SO2, sulfate, PM2.5, and PM10 increased, especially in the Strait of Gibraltar and close to the coastal areas (mainly in port areas) as well as along the west coast of the Iberian Peninsula (along main shipping routes). O3 concentrations also increased due to shipping emissions, especially in the Mediterranean Sea close to the African coast. An opposite behaviour was verified with a decrease in concentrations around the major shipping routes on the west coast of the Iberian Peninsula, close to the southern coastal area of Spain, and in some port areas as a result of NOx titration caused by increased NOx shipping emissions. Aksoyoglu et al. (2016) also reported an increase in the mean O3 concentrations of 5 %–10 % in the Mediterranean Sea and a decrease in the levels around some major ship lanes (English Channel and North Sea). Moreover, Merico et al. (2016) performed experimental measurements in a port city in Italy and found correspondence between NO peaks and O3 titration. Thus, shipping emissions have the potential to decrease O3 concentrations close to the main ship lanes and ports and increase them at larger distances from the emissions source, which seems to be a local-scale effect. Annual mean concentrations when shipping emissions were included (considering all grid cells of the domain) of NO2, SO2, sulfate, O3, PM2.5, and PM10 were respectively 1.8, 0.5, 0.8 (mean increase 67 %), 80, 8.2, and 22 µg m−3.
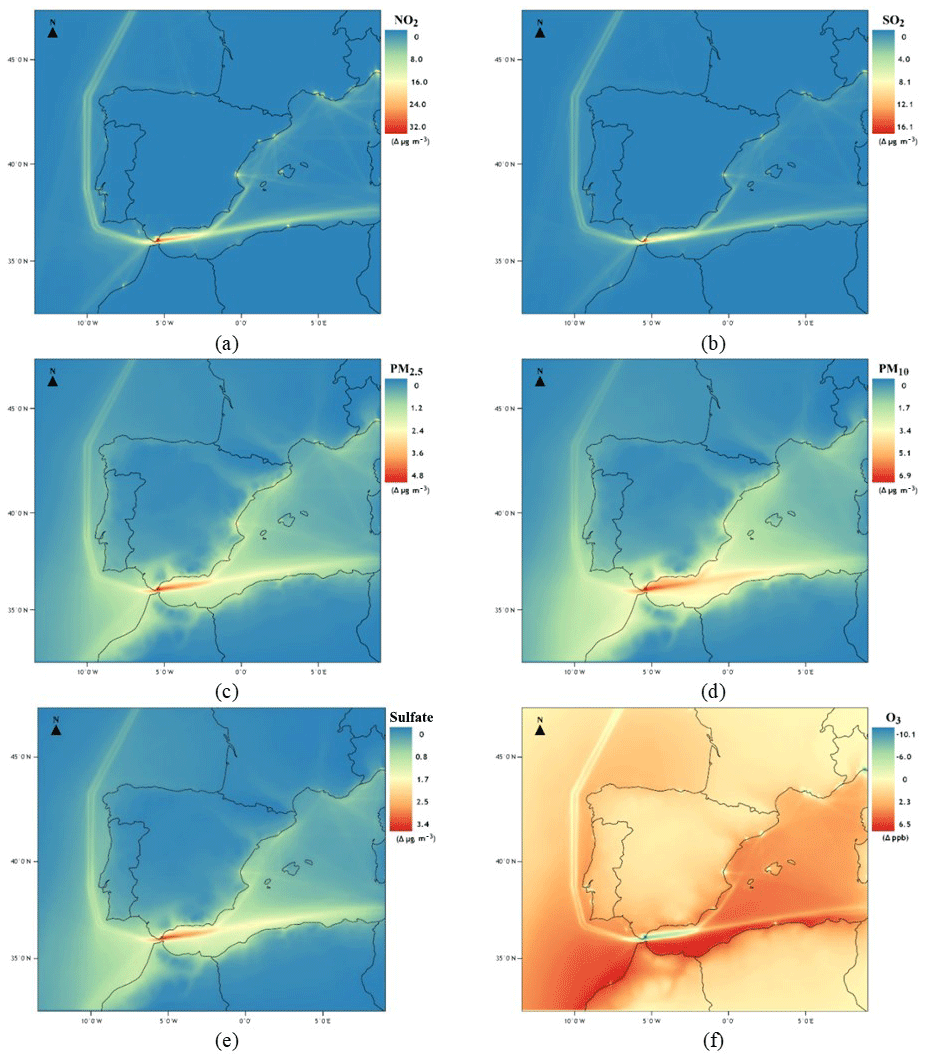
Figure 3Contribution of shipping emissions to annual mean surface concentrations of (a) NO2, (b) SO2, (c) PM2.5, (d) PM10, (e) sulfate, and (f) O3 in the study domain in 2015 (Δ = S-SCN – B-SCN).
3.2.2 Comparison with previous studies in the region
The highest differences in the annual mean concentrations of NO2, SO2, sulfate, O3, PM2.5, and PM10 for cases considering and not considering shipping emissions were 31.7, 16.1, 3.4, 13, 4.8, and 6.9 µg m−3, respectively. For Europe, Monteiro et al. (2018) reported similar differences in PM10 (7 µg m−3) and O3 (14 µg m−3) as well as lower NO2 (18 µg m−3) evidenced in the main shipping routes in the straits of La Mancha and Gibraltar. The higher NO2 concentrations reported in this study compared with Monteiro et al. (2018) seem to be related to the shipping emissions inventory that was used. As already mentioned the shipping emissions used by Monteiro et al. (2018) were extracted from the TNO-MACC_III inventory, which seems to underestimate the NOx emissions of this sector compared with STEAM (more precise). Aksoyoglu et al. (2016) reported lower differences for PM2.5 (3.5 µg m−3) and O3 (12 µg m−3) for Europe. Figure 4 shows the relative impact of shipping emissions on pollutant concentrations for the Iberian Peninsula. Locally, the effects were more evident in the sea areas along main shipping routes, especially in the Strait of Gibraltar and in the Mediterranean Sea, with contributions of more than 90 % for NO2 and SO2, 80 % for sulfate, 25 %–50 % for PM2.5, and 20 %–35 % for PM10. Regarding O3, shipping emissions contributed to an increase of around 15 % over the entire Iberian Peninsula coastline and in the Mediterranean Sea close to the African coastline. Nevertheless, shipping emissions also contributed to decreasing O3 concentrations around 15 %–40 % in the Strait of Gibraltar and close to Valencia Port. It is also important to emphasise that along main shipping routes and close to the Iberian Peninsula port areas (except Valencia), O3 concentrations considering and not considering shipping emissions remained the same. Aksoyoglu et al. (2016) found higher contributions (45 %) for PM2.5 and lower positive contributions (5 %–10 %) for O3 in the Mediterranean Sea. Sotiropoulou and Tagaris (2017) also reported contributions higher than 90 % for NO2 and SO2, with 40 % during winter and 50 % during summer for PM2.5 over the Mediterranean Sea. Viana et al. (2014) reviewed studies concerning the impact of shipping emissions on air quality in European coastal areas and reported lower contributions than those estimated in this study for the Strait of Gibraltar (2 %–4 % for mean annual PM10 and 14 % for mean annual PM2.5) and southern Spain close to the Bay of Algeciras (3 %–7 % for mean annual PM10 and 5 %–10 % for mean annual PM2.5). The differences between the contributions reported by Viana et al. (2014) seem to be related to the methodology used in the reviewed studies (source apportionment of PM10 and PM2.5 by positive matrix factorisation). Although the impact of shipping emissions on pollutant concentrations has been the most evident in sea areas, they also contributed to increasing inland concentrations. As shown in Fig. 4, shipping emissions generally contributed about 50 % of inland NO2 concentrations near port areas of Portugal and Spain, reaching more than 75 % in the province of Cádiz. Similar behaviour was observed for SO2 concentrations; however, in this case, contributions of more than 75 % were also noticed in the province of Málaga. As already mentioned, for O3, contributions of around 5 %–15 % were calculated for the entire Iberian Peninsula coastline, especially in the south coastal region. Regarding sulfate, contributions of around 60 % were calculated for the entire Iberian Peninsula south coastal region, with contributions of 20 %–40 % when the entire Iberian Peninsula was considered. For PM2.5 and PM10, the highest contributions (around 20 %–30 %) were also verified in the Iberian Peninsula south coastal region. When the entire Iberian Peninsula was considered, PM2.5 and PM10 contributions were 10 % and 15 %, respectively. For the west coast of Portugal (also the west coast of Iberian Peninsula), Monteiro et al. (2018) reported lower contributions for NO2 and PM10 (higher than 20 % and less than 5 %, respectively) than those reported in this study, probably due to the different methodology applied. Moreover, according to the model validation made by Monteiro et al. (2018), their model underestimated PM10 and NO2 concentrations (negative MBE), while the model used in the present study overestimates the concentrations (positive MBE).
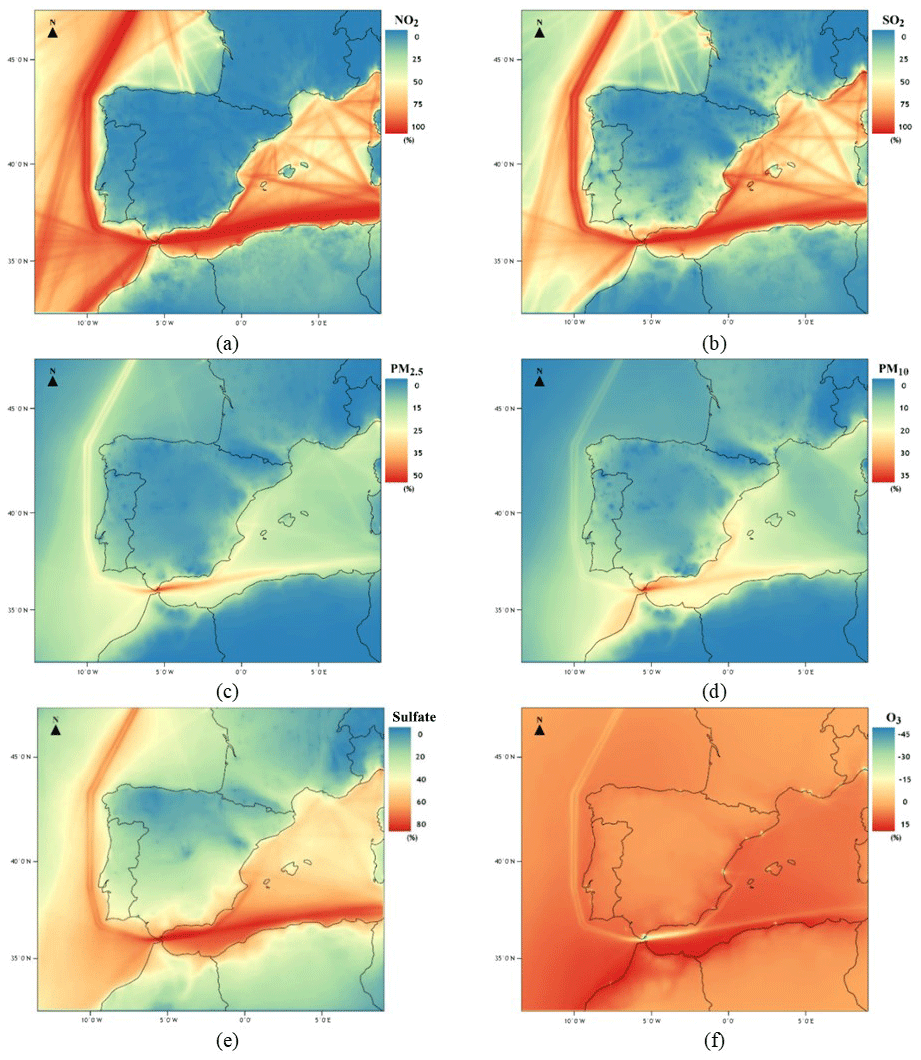
Figure 4Contribution of shipping emissions (%) to annual mean concentrations of (a) NO2, (b) SO2, (c) PM2.5, (d) PM10, (e) sulfate, and (f) O3 for 2015.
3.2.3 Seasonal variation
The higher contributions of shipping emissions for pollutant concentrations in coastal regions (mainly to NO2 and SO2 concentrations) as well as inland regions (sulfate, O3, PM2.5, and PM10 concentrations) indicate that ships are a non-negligible source. Regarding the seasonal concentration data, statistically significant variations were found for all pollutants across all seasons (p values >0.05). In fact, according to the model results, the higher contributions of shipping emissions to the concentration levels were registered during spring and summer periods (warm season). This pattern seems to be related to the increase in ship traffic during summer due to better meteorological conditions that allow better navigation conditions, which increases the traffic and subsequently the emissions and atmospheric pollution. Moreover, during summer months, the number of passenger ships tends to increase (due to recreational travel), especially in the Mediterranean Sea, which led to an increase in shipping emissions and their contributions to the pollutant concentration levels. Results were consistent with those achieved by Aksoyoglu et al. (2016), Chen et al. (2017, 2018), and Sotiropoulou and Tagaris (2017), who also reported the largest contributions of shipping emissions to PM2.5, O3, NO2, and SO2 concentrations during summer.
3.2.4 Ship impact on exceedances of regulatory air quality limits
Figure 5 shows NO2, SO2, O3, PM2.5, and PM10 exceedances of EU air quality standards and WHO air quality guidelines in the inland regions due to shipping, as well as the differences between SOMO35 levels (ppb d−1) considering and not considering shipping emissions. Results showed no exceedances of the EU annual limit standard for SO2, PM2.5, and PM10. Regarding NO2, as the annual limit for the EU air quality standards and the WHO air quality guidelines is the same (40 µg m−3), the analyses were joined. As can be seen from Fig. 5a, exceedances due to shipping emissions were verified in the Valencia area close to Valencia Port and in the Barcelona area close to the Port of Barcelona. When shipping emissions were considered PM2.5 WHO air quality guideline (10 µg m−3) exceedances increased 7 %. As can be seen from Fig. 5b, exceedances were verified in Portugal (close to the areas of the ports of Viana do Castelo, Leixões, Lisboa, and Setúbal), across the Spanish coastline, in the north (in Pontevedra Province close to the Port of Vigo and in Asturias Province close to the ports of Aviles and Gijón), and in the south (in the region of Andalusia close to the areas of Algeciras, Málaga, and Adra ports, in Valencia close to Valencia Port, and in Catalonia close to the Port of Barcelona) where the contribution of shipping emissions to the increase in concentrations was even more pronounced. It should be noted that shipping emissions were still responsible for exceedances in areas far from the coastline, as was verified in Viana do Castelo and more pronounced in the region of Andalusia. These results confirm that shipping emissions can contribute negatively to air quality, both in coastal and inland areas. The PM10 WHO air quality guideline of 20 µg m−3 was exceeded 8 % more when shipping emissions were considered. As can be seen from Fig. 5c, exceedances were verified mainly across the southern Spanish coastline in the regions of Andalusia and Catalonia. The contribution of shipping emissions to the increment of exceedances (in terms of concentrations Δµg m−3) of NO2, PM2.5, and PM10 was also determined. This information can be found in Fig. A2a, b, and c, respectively. Regarding the WHO air quality guideline for SO2, as the value refers to the average daily concentrations, the results are presented as the number of days per year that the threshold value was exceeded in a given grid cell when shipping emissions were considered but were not exceeded without shipping emissions. Figure 5d shows that exceedances were verified in the Setúbal District (Portugal) close to the Port of Sines, across the Spanish coastline, in the north (in Coruña Province close to the Port of Coruña, in Asturias Province close to the ports of Aviles and Gijón, and close to the Port of Bilbao), and in the south (in Huelva close to the Port of Huelva, in Cádiz Province close to the Strait of Gibraltar, in Valencia close to Valencia Port, in Castellón close to the Port of El Grao, in Tarragona close to the Port of Tarragona, and in Barcelona close to the Port of Barcelona). The Strait of Gibraltar is where the highest number of days per year was calculated for exceeded WHO reference values for SO2 (maximum increment of 96 d). The spatial distribution of the number of days per year on which the WHO reference value for SO2 was exceeded can be found in Fig. A2d. According to the above results, mitigation measures should be studied and implemented to reduce shipping emissions mainly close to port areas, in the south of the Iberia Peninsula close to the Strait of Gibraltar, and in the Mediterranean Sea. Implementing an ECA in the Mediterranean Sea can contribute to reduce shipping emissions and help these regions to attain WHO and EU standards. As SOMO35 is an indicator of the health impact assessment recommended by the WHO, differences between the levels considering and not considering shipping emissions were calculated to evaluate the contribution of these emissions to the O3 inland concentrations. As can be seen from Fig. 5e, SOMO35 levels were negative close to the Portuguese ports of Lisboa and Setúbal and close to the Spanish ports of Algeciras (Strait of Gibraltar), Valencia, and Barcelona. The major contributions were calculated for the southwest coastline of the Iberian Peninsula, with levels of 500–1000 ppb d−1 up to 200 km from the coastline (over the entire south region of Portugal), which might be explained by the highest solar radiation intensity that is felt in the southern regions of the Iberian Peninsula.
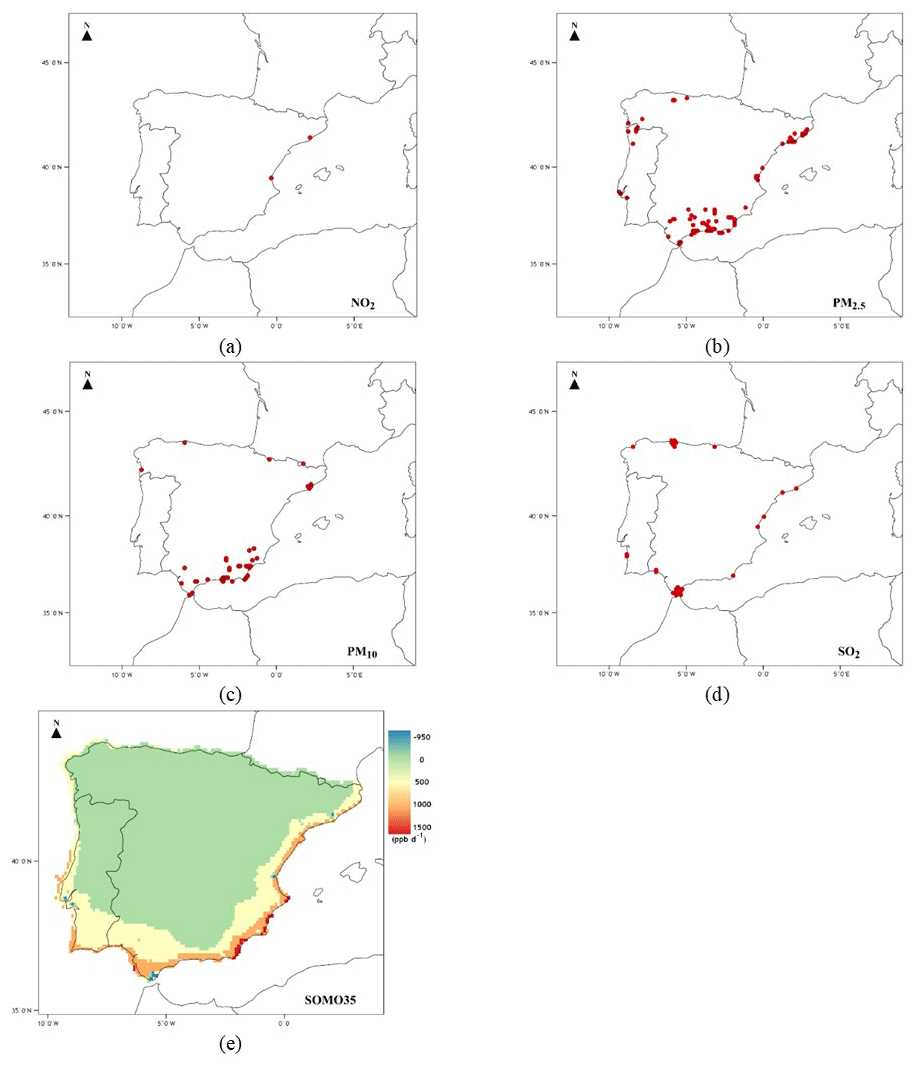
Figure 5Spatial distribution of inland exceedances of EU air quality standards and WHO air quality guidelines (same value) for (a) NO2, (b) PM2.5, (c) PM10, (d) SO2, and (e) SOMO35 levels due to shipping emissions contributions.
3.3 Uncertainties and limitations
Given the complexity of any chemical transport model, it is difficult to specify the source of uncertainties; these are inherent to the uncertainties of the meteorological data, emission inventory, and the imperfections of chemical mechanisms and physical processes in the modelling system. Nevertheless, it is known that the reliability of the emissions inventory is a major cause of uncertainty. In STEAM3, there are several sources of uncertainty that can have an impact on the accuracy of the results. There are three main categories: (i) gaps in input data (incomplete AIS coverage, missing IHS Markit data), (ii) power prediction (weather contributions, Hollenbach resistance inaccuracy, fouling, squat, sea currents, auxiliary engine power profiles, engine load estimation, power transmission, propeller properties), and (iii) emission factors (specific fuel oil consumption, fuel type, fuel sulfur content allocation, engine generation). Uncertainties concerning emission factors may be larger for products of incomplete combustion, like CO, non-methane volatile organic compounds (NMVOCs), OC, and EC, than for CO2 or NOx because these are strongly related to engine load, engine generation, and service history. The emission factors may also depend on the fuel type assignment and fuel sulfur content, which are estimated based on engine properties and the maximum sulfur content allowed in each region at the time period of the study. However, the emission factors for incomplete combustion products may be affected by engine service history and are thus notoriously difficult to estimate. VOC emissions from ships were not included in this study. Uncertainties concerning the SOMO35 indicator (for ozone) were expected since the chemical regime in the atmosphere along the ship tracks in the Mediterranean is known to be VOC sensitive (Beekmann and Vautard, 2010). STEAM, which has mechanisms to mitigate most of the uncertainties listed above, and an improved version of STEAM (STEAM3), which has the highest spatially detailed shipping emissions inventory, have been recognised as the best to estimate emissions from maritime traffic and have been used to provide shipping emissions input data that are as accurate as possible (Nunes et al., 2017b; Russo et al., 2018). Keeping the uncertainties of the atmospheric dispersion simulations in mind, efforts were made to run the EMEP/MSC-W model as accurately and detailed as possible (horizontal resolution of , 34 vertical levels, and data output time steps of 1 h). Furthermore, the EMEP/MSC-W model has recently been compared with the CMAQ and SILAM models and showed the best spatial correlation of annual mean concentrations for NO2, SO2, and PM2.5 resulting from shipping emissions, although it seems to be underestimating PM2.5 concentrations and overestimating O3 concentrations. Moreover, although it has been possible to identify variations in emissions and concentrations near port areas, the resolution that was used was too coarse to make a detailed analysis of emissions and concentrations inside port areas. The EMEP/MSC-W model considers the O3 loss by NOx titration, the sunlight effects, and the NOx-to-VOC ratio that promotes O3 production, which is an approximation allowing for the minimisation of the effects of the non-linear O3 chemistry. Moreover, estimations were performed using meteorological data from the European Centre for Medium-Range Weather Forecasts (ECMWF) for 2015.
In this study, the Ship Traffic Emission Assessment Model (STEAM3) was used to estimate shipping emissions in the Iberian Peninsula region in 2015. According to the results, total estimated emissions for CO, CO2, SOx, NOx, and particulate matter (subdivided into elementary carbon – EC, organic carbon – OC, sulfates, and ash) were 49, 30 000, 360, 710, 4.5, 11, 32, and 3.3 kt yr−1, respectively. The highest emissions were estimated along the west coast of the Iberian Peninsula, in the Strait of Gibraltar, and in the Mediterranean Sea. The largest amount of emissions for all pollutants was emitted during summer and spring (reaching the maximum during July), which seemed to be related to the navigation conditions. The estimated shipping emissions were equivalent to 45 % and 62 % NOx and SOx in the total land-based emissions, respectively, which shows that shipping emissions cannot be neglected. Running the EMEP/MSC-W model it was possible to observe that the effects of shipping emissions on air quality were more evident in the sea areas along the main shipping routes, especially in the Strait of Gibraltar and the Mediterranean Sea. Although the contribution of shipping emissions to pollutant concentrations has been more evident in sea areas, they also contributed to increasing the inland concentrations. It was observed that shipping emissions increased SO2 and NO2 concentrations around 50 % near port areas in Portugal and Spain, reaching more than 75 % in the provinces of Cádiz and Málaga. O3 concentrations reached around 5 %–15 % for the entire Iberian Peninsula coastline, especially in the south coastal region, and sulfate and particulate matter (PM2.5 and PM10) concentrations were around 60 % and 20 %–30 %, respectively, over the entire Iberian Peninsula south coastal region. NO2 exceedances due to ship emissions were detected in Valencia and Barcelona. WHO air quality guidelines for PM2.5 and PM10 were respectively exceeded by 7 % and 8 % more when shipping emissions were considered. In the regions close to the Strait of Gibraltar the highest exceedances of WHO air quality guidelines for SO2 were observed (maximum increment of 96 d). The major contributions of shipping emissions to inland SOMO35 levels were for the southwest coastline of the Iberian Peninsula, with levels of 500–1000 ppb d−1 up to 200 km from the coastline (the south region of Portugal). These results confirm that shipping emissions can contribute negatively to air quality, both in coastal and inland areas, and mitigation measures should be studied and implemented to reduce shipping emissions close to port areas and in the south of the Iberia Peninsula (close to the Strait of Gibraltar and in the Mediterranean Sea). In the future, it is important to study the impacts of shipping emissions on health, which are still underestimated and rarely studied.
This Appendix contains the spatial distribution of world shipping traffic density and a zoom of the study area for 2015, as well as the spatial distribution of the contribution of shipping emissions in terms of concentration increment to the inland exceedances.
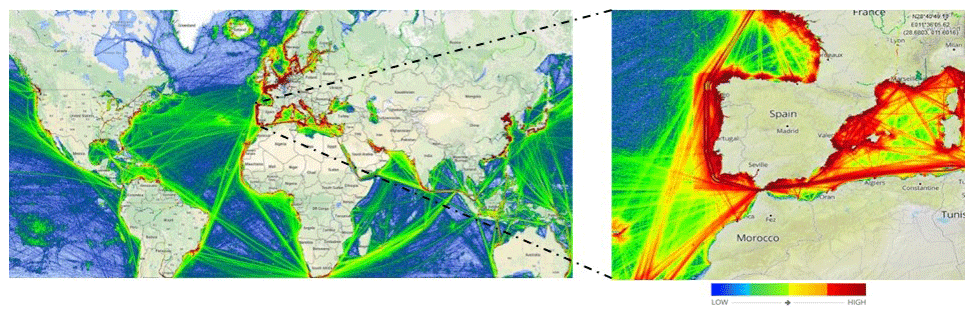
Figure A1World shipping traffic density map and a zoom of the study area for 2015 (source: Marine Traffic, 2016).
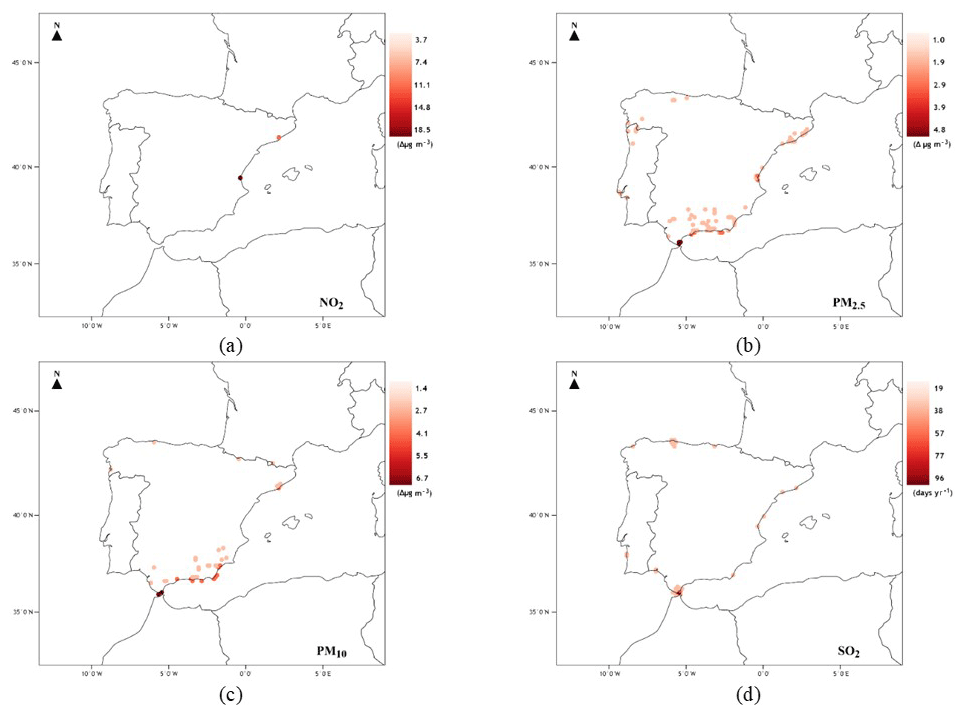
Figure A2Spatial distribution of the contribution of shipping emissions (concentration increment) to the inland exceedances for (a) NO2, (b) PM2.5, and (c) PM10 as well as the number of days per year that the threshold value was exceeded in a given grid cell for (d) SO2.
The EMEP model is available as open-source (see https://github.com/metno/emep-ctm, last access: 20 August 2019, Norwegian Meteorological Institute, 2019) code version rv4.17 (201802) (EMEP MSC-W, 2018, https://doi.org/10.5281/zenodo.3355023). STEAM is the intellectual property of the Finnish Meteorological Institute and is not publicly available.
RAON performed EMEP/MSC-W simulations and the analysis, interpreted the results, and wrote the paper. J-PJ and HH provided the ship emission data. MCMA-F, FGM, JM-G, and J-PJ reviewed the paper and helped in the interpretation of the results. FC-C, VD-G, and JM-G provided support in the interpretation of the results for Spain and reviewed the paper. SIVS designed the study and assisted in modelling scenarios and in writing the paper.
The authors declare that they have no conflict of interest.
This research has been supported by the Laboratory for Process Engineering, Environment, Biotechnology and Energy (LEPABE) (grant no. UIDB/00511/2020) through national funds from the FCT/MCTES (PIDDAC) (EMISSHIP (project no. POCI-01-0145-FEDER-032201)), FEDER funds through COMPETE2020 – Programa Operacional Competitividade e Internacionalização (POCI), and national funds (PIDDAC) through FCT/MCTES. Sofia I. V. Sousa received financial support from the Portuguese Foundation for Science and Technology (FCT) through the Scientific Employment Stimulus (Individual Call (grant no. CEECIND/02477/2017)), and Rafael A. O. Nunes received an individual research (grant no. SFRH/BD/146159/2019). Jukka-Pekka Jalkanen received support from the Nordic Council of Ministers project EPITOME (Emissions from shiP and the Impacts on human healTh and envirOnMEnt – now and in the future) under project no. KOL-1601.
This paper was edited by Jayanarayanan Kuttippurath and reviewed by three anonymous referees.
Abrutytė, E., Žukauskaitė, A., Mickevičienė, R., Zabukas, V., and Paulauskienė, T.: Evaluation of NOx emission and dispersion from marine ships in Klaipeda sea port, J. Environ. Eng. Landsc. Manag., 22, 264–273, https://doi.org/10.3846/16486897.2014.892009, 2014.
Aksoyoglu, S., Baltensperger, U., and Prévôt, A. S. H.: Contribution of ship emissions to the concentration and deposition of air pollutants in Europe, Atmos. Chem. Phys., 16, 1895–1906, https://doi.org/10.5194/acp-16-1895-2016, 2016.
Angelbratt, J., Mellqvist, J., Simpson, D., Jonson, J. E., Blumenstock, T., Borsdorff, T., Duchatelet, P., Forster, F., Hase, F., Mahieu, E., De Mazière, M., Notholt, J., Petersen, A. K., Raffalski, U., Servais, C., Sussmann, R., Warneke, T., and Vigouroux, C.: Carbon monoxide (CO) and ethane (C2H6) trends from ground-based solar FTIR measurements at six European stations, comparison and sensitivity analysis with the EMEP model, Atmos. Chem. Phys., 11, 9253–9269, https://doi.org/10.5194/acp-11-9253-2011, 2011.
Aulinger, A., Matthias, V., Zeretzke, M., Bieser, J., Quante, M., and Backes, A.: The impact of shipping emissions on air pollution in the greater North Sea region – Part 1: Current emissions and concentrations, Atmos. Chem. Phys., 16, 739–758, https://doi.org/10.5194/acp-16-739-2016, 2016.
Barregard, L., Molnàr, P., Jonson, E. J., and Stockfelt, L.: Impact on Population Health of Baltic Shipping Emissions, Int. J. Environ. Res. Public Heal., 16, 1954, https://doi.org/10.3390/ijerph16111954, 2019.
Beekmann, M. and Vautard, R.: A modelling study of photochemical regimes over Europe: robustness and variability, Atmos. Chem. Phys., 10, 10067–10084, https://doi.org/10.5194/acp-10-10067-2010, 2010.
Bessagnet, B., Pirovano, G., Mircea, M., Cuvelier, C., Aulinger, A., Calori, G., Ciarelli, G., Manders, A., Stern, R., Tsyro, S., García Vivanco, M., Thunis, P., Pay, M.-T., Colette, A., Couvidat, F., Meleux, F., Rouïl, L., Ung, A., Aksoyoglu, S., Baldasano, J. M., Bieser, J., Briganti, G., Cappelletti, A., D'Isidoro, M., Finardi, S., Kranenburg, R., Silibello, C., Carnevale, C., Aas, W., Dupont, J.-C., Fagerli, H., Gonzalez, L., Menut, L., Prévôt, A. S. H., Roberts, P., and White, L.: Presentation of the EURODELTA III intercomparison exercise – evaluation of the chemistry transport models' performance on criteria pollutants and joint analysis with meteorology, Atmos. Chem. Phys., 16, 12667–12701, https://doi.org/10.5194/acp-16-12667-2016, 2016.
Brandt, J., Silver, J. D., Christensen, J. H., Andersen, M. S., Bønløkke, J. H., Sigsgaard, T., Geels, C., Gross, A., Hansen, A. B., Hansen, K. M., Hedegaard, G. B., Kaas, E., and Frohn, L. M.: Assessment of past, present and future health-cost externalities of air pollution in Europe and the contribution from international ship traffic using the EVA model system, Atmos. Chem. Phys., 13, 7747–7764, https://doi.org/10.5194/acp-13-7747-2013, 2013.
Campbell, N.: English Channel, Columbia Encyclopedia 6th edition, Ref. Rev., 15, p. 6, https://doi.org/10.1108/rr.2001.15.7.6.357, 2001a.
Campbell, N.: Strait of Gibraltar, Columbia Encyclopedia 6th edition, Ref. Rev., 15, p. 6, https://doi.org/10.1108/rr.2001.15.7.6.357, 2001b.
Chen, D., Zhao, Y., Nelson, P., Li, Y., Wang, X., Zhou, Y., Lang, J., and Guo, X.: Estimating ship emissions based on AIS data for port of Tianjin, China, Atmos. Environ., 145, 10–18, https://doi.org/10.1016/j.atmosenv.2016.08.086, 2016a.
Chen, D., Zhao, Y., Nelson, P., Li, Y., Wang, X., Zhou, Y., Lang, J., and Guo, X.: Estimating ship emissions based on AIS data for port of Tianjin, China, Atmos. Environ., 145, 10–18, https://doi.org/10.1016/J.ATMOSENV.2016.08.086, 2016b.
Chen, D., Wang, X., Nelson, P., Li, Y., Zhao, N., Zhao, Y., Lang, J., Zhou, Y., and Guo, X.: Ship emission inventory and its impact on the PM2.5 air pollution in Qingdao Port, North China, Atmos. Environ., 166, 351–361, https://doi.org/10.1016/j.atmosenv.2017.07.021, 2017.
Chen, D., Zhao, N., Lang, J., Zhou, Y., Wang, X., Li, Y., Zhao, Y., and Guo, X.: Contribution of ship emissions to the concentration of PM2.5: A comprehensive study using AIS data and WRF/Chem model in Bohai Rim Region, China, Sci. Total Environ., 610–611, 1476–1486, https://doi.org/10.1016/j.scitotenv.2017.07.255, 2018.
Colette, A., Granier, C., Hodnebrog, Ø., Jakobs, H., Maurizi, A., Nyiri, A., Bessagnet, B., D'Angiola, A., D'Isidoro, M., Gauss, M., Meleux, F., Memmesheimer, M., Mieville, A., Rouïl, L., Russo, F., Solberg, S., Stordal, F., and Tampieri, F.: Air quality trends in Europe over the past decade: a first multi-model assessment, Atmos. Chem. Phys., 11, 11657–11678, https://doi.org/10.5194/acp-11-11657-2011, 2011.
Colette, A., Granier, C., Hodnebrog, Ø., Jakobs, H., Maurizi, A., Nyiri, A., Rao, S., Amann, M., Bessagnet, B., D'Angiola, A., Gauss, M., Heyes, C., Klimont, Z., Meleux, F., Memmesheimer, M., Mieville, A., Rouïl, L., Russo, F., Schucht, S., Simpson, D., Stordal, F., Tampieri, F., and Vrac, M.: Future air quality in Europe: a multi-model assessment of projected exposure to ozone, Atmos. Chem. Phys., 12, 10613–10630, https://doi.org/10.5194/acp-12-10613-2012, 2012.
Contini, D., Gambaro, A., Belosi, F., De Pieri, S., Cairns, W. R. L., Donateo, A., Zanotto, E., and Citron, M.: The direct influence of ship traffic on atmospheric PM2.5, PM10 and PAH in Venice, J. Environ. Manage., 92, 2119–2129, https://doi.org/10.1016/j.jenvman.2011.01.016, 2011.
Corbett, J. J., Winebrake, J. J., Green, E. H., Kasibhatla, P., Eyring, V., and Lauer, A.: Mortality from ship emissions: A global assessment, Environ. Sci. Technol., 41, 8512–8518, https://doi.org/10.1021/es071686z, 2007.
Dalsøren, S. B., Eide, M. S., Endresen, Ø., Mjelde, A., Gravir, G., and Isaksen, I. S. A.: Update on emissions and environmental impacts from the international fleet of ships: the contribution from major ship types and ports, Atmos. Chem. Phys., 9, 2171–2194, https://doi.org/10.5194/acp-9-2171-2009, 2009.
Denier van der Gon, H. A. C., Kuenen, J. J. P., Janssens-Maenhout, G., Döring, U., Jonkers, S., and Visschedijk, A.: TNO_CAMS high resolution European emission inventory 2000–2014 for anthropogenic CO2 and future years following two different pathways, Earth Syst. Sci. Data Discuss., https://doi.org/10.5194/essd-2017-124, in review, 2017.
EEA: The Impact of International Shipping on European Air Quality and Climate Forcing, Copenhagen, 2013.
EEA: Global search on data, maps and indicators, available at: https://www.eea.europa.eu/data-and-maps/find/global?c12=station&search=Search#c0=12&c6=air&c1=Data&c1=Graph&c1=Indicator&c1=Infographic&c1=Interactivedata&c1=Interactive map&c1=Map&b_start=0&c12=Annual mean concentrations 2015, last access: 15 June 2020.
EMEP MSC-W: metno/emep-ctm: OpenSource rv4.17 (201802), Version rv4_17, Zenodo, https://doi.org/10.5281/zenodo.3355023, 2018.
European Commission: Air Quality Standards, available at: http://ec.europa.eu/environment/air/quality/standards.htm (last access: 2 August 2019), 2018.
Eyring, V., Stevenson, D. S., Lauer, A., Dentener, F. J., Butler, T., Collins, W. J., Ellingsen, K., Gauss, M., Hauglustaine, D. A., Isaksen, I. S. A., Lawrence, M. G., Richter, A., Rodriguez, J. M., Sanderson, M., Strahan, S. E., Sudo, K., Szopa, S., van Noije, T. P. C., and Wild, O.: Multi-model simulations of the impact of international shipping on Atmospheric Chemistry and Climate in 2000 and 2030, Atmos. Chem. Phys., 7, 757–780, https://doi.org/10.5194/acp-7-757-2007, 2007.
Eyring, V., Isaksen, I., Berntsen, T., Collins, W., Corbett, J., Endresen, O., Grainger, R., Moldanova, J., Schlager, H., and Stevenson, D.: Transport impacts on atmosphere and climate: Shipping, Atmos. Environ., 44, 4735–4771, https://doi.org/10.1016/j.atmosenv.2009.04.059, 2009.
Fan, Q., Zhang, Y., Ma, W., Ma, H., Feng, J., Yu, Q., Yang, X., Ng, S. K. W., Fu, Q., and Chen, L.: Spatial and Seasonal Dynamics of Ship Emissions over the Yangtze River Delta and East China Sea and Their Potential Environmental Influence, Environ. Sci. Technol., 50, 1322–1329, https://doi.org/10.1021/acs.est.5b03965, 2016.
Global Ocean Associates: Iberian Peninsula – Atlantic Coast, An Atlas Intern. Solitary-like Waves Their Prop, available at: http://www.internalwaveatlas.com/Atlas2_PDF/IWAtlas2_Pg087_IberianPeninsula.pdf (last access: 24 July 2018), 2004a.
Global Ocean Associates: Mediterranean Sea, An Atlas Ocean. Intern. Solitary Waves, available at: http://www.internalwaveatlas.com/Atlas2_PDF/IWAtlas2_Pg105_MediterraneanSea.pdf (last access: 24 July 2018), 2004b.
Global Ocean Associates: Strait of Gibraltar, An Atlas Ocean. Intern. Solitary Waves, available at: http://www.internalwaveatlas.com/Atlas2_PDF/IWAtlas2_Pg179_StraitofGibraltar.pdf (last access: 24 July 2018), 2004c.
Jalkanen, J.-P., Brink, A., Kalli, J., Pettersson, H., Kukkonen, J., and Stipa, T.: A modelling system for the exhaust emissions of marine traffic and its application in the Baltic Sea area, Atmos. Chem. Phys., 9, 9209–9223, https://doi.org/10.5194/acp-9-9209-2009, 2009.
Jalkanen, J.-P., Johansson, L., Kukkonen, J., Brink, A., Kalli, J., and Stipa, T.: Extension of an assessment model of ship traffic exhaust emissions for particulate matter and carbon monoxide, Atmos. Chem. Phys., 12, 2641–2659, https://doi.org/10.5194/acp-12-2641-2012, 2012.
Johansson, L., Jalkanen, J.-P., Kalli, J., and Kukkonen, J.: The evolution of shipping emissions and the costs of regulation changes in the northern EU area, Atmos. Chem. Phys., 13, 11375–11389, https://doi.org/10.5194/acp-13-11375-2013, 2013.
Johansson, L., Jalkanen, J. P., and Kukkonen, J.: Global assessment of shipping emissions in 2015 on a high spatial and temporal resolution, Atmos. Environ., 167, 403–415, https://doi.org/10.1016/j.atmosenv.2017.08.042, 2017.
Jonson, J. E., Stohl, A., Fiore, A. M., Hess, P., Szopa, S., Wild, O., Zeng, G., Dentener, F. J., Lupu, A., Schultz, M. G., Duncan, B. N., Sudo, K., Wind, P., Schulz, M., Marmer, E., Cuvelier, C., Keating, T., Zuber, A., Valdebenito, A., Dorokhov, V., De Backer, H., Davies, J., Chen, G. H., Johnson, B., Tarasick, D. W., Stübi, R., Newchurch, M. J., von der Gathen, P., Steinbrecht, W., and Claude, H.: A multi-model analysis of vertical ozone profiles, Atmos. Chem. Phys., 10, 5759–5783, https://doi.org/10.5194/acp-10-5759-2010, 2010.
Jonson, J. E., Jalkanen, J. P., Johansson, L., Gauss, M., and Denier van der Gon, H. A. C.: Model calculations of the effects of present and future emissions of air pollutants from shipping in the Baltic Sea and the North Sea, Atmos. Chem. Phys., 15, 783–798, https://doi.org/10.5194/acp-15-783-2015, 2015.
Jonson, J. E., Jalkanen, J.-P., Schulz, M., Johansson, L., and Fagerli, H.: Effects of international shipping on European pollution levels, in SHIPPING AND THE ENVIRONMENT – From Regional to Global Perspectives, p. 13, Gothenburg, 2017.
Karl, M., Jonson, J. E., Uppstu, A., Prank, M., Jalkanen, J.-P., Johansson, L., Quante, M., and Matthias, V.: Effects of ship emissions in the Baltic Sea region simulated with three different chemistry transport models, in SHIPPING AND THE ENVIRONMENT – From Regional to Global Perspectives, p. 7, Gothenburg, 2017.
Karl, M., Jonson, J. E., Uppstu, A., Aulinger, A., Prank, M., Sofiev, M., Jalkanen, J.-P., Johansson, L., Quante, M., and Matthias, V.: Effects of ship emissions on air quality in the Baltic Sea region simulated with three different chemistry transport models, Atmos. Chem. Phys., 19, 7019–7053, https://doi.org/10.5194/acp-19-7019-2019, 2019.
Klimont, Z., Kupiainen, K., Heyes, C., Purohit, P., Cofala, J., Rafaj, P., Borken-Kleefeld, J., and Schöpp, W.: Global anthropogenic emissions of particulate matter including black carbon, Atmos. Chem. Phys., 17, 8681–8723, https://doi.org/10.5194/acp-17-8681-2017, 2017.
Lauer, A., Eyring, V., Hendricks, J., Jöckel, P., and Lohmann, U.: Global model simulations of the impact of ocean-going ships on aerosols, clouds, and the radiation budget, Atmos. Chem. Phys., 7, 5061005079, https://doi.org/10.5194/acp-7-5061-2007, 2007.
Liu, Z., Lu, X., Feng, J., Fan, Q., Zhang, Y., and Yang, X.: Influence of Ship Emissions on Urban Air Quality: A Comprehensive Study Using Highly Time-Resolved Online Measurements and Numerical Simulation in Shanghai, Environ. Sci. Technol., 51, 202–211, https://doi.org/10.1021/acs.est.6b03834, 2017.
Marelle, L., Thomas, J. L., Raut, J.-C., Law, K. S., Jalkanen, J.-P., Johansson, L., Roiger, A., Schlager, H., Kim, J., Reiter, A., and Weinzierl, B.: Air quality and radiative impacts of Arctic shipping emissions in the summertime in northern Norway: from the local to the regional scale, Atmos. Chem. Phys., 16, 2359–2379, https://doi.org/10.5194/acp-16-2359-2016, 2016.
Marmer, E. and Langmann, B.: Impact of ship emissions on the Mediterranean summertime pollution and climate: A regional model study, Atmos. Environ., 39, 4659–4669, https://doi.org/10.1016/j.atmosenv.2005.04.014, 2005.
Matthias, V., Aulinger, A., Backes, A., Bieser, J., Geyer, B., Quante, M., and Zeretzke, M.: The impact of shipping emissions on air pollution in the greater North Sea region – Part 2: Scenarios for 2030, Atmos. Chem. Phys., 16, 759–776, https://doi.org/10.5194/acp-16-759-2016, 2016.
Merico, E., Donateo, A., Gambaro, A., Cesari, D., Gregoris, E., Barbaro, E., Dinoi, A., Giovanelli, G., Masieri, S., and Contini, D.: Influence of in-port ships emissions to gaseous atmospheric pollutants and to particulate matter of different sizes in a Mediterranean harbour in Italy, Atmos. Environ., 139, 1–10, https://doi.org/10.1016/j.atmosenv.2016.05.024, 2016.
Merico, E., Gambaro, A., Argiriou, A., Alebic-Juretic, A., Barbaro, E., Cesari, D., Chasapidis, L., Dimopoulos, S., Dinoi, A., Donateo, A., Giannaros, C., Gregoris, E., Karagiannidis, A., Konstandopoulos, A. G., Ivošević, T., Liora, N., Melas, D., Mifka, B., Orlić, I., Poupkou, A., Sarovic, K., Tsakis, A., Giua, R., Pastore, T., Nocioni, A., and Contini, D.: Atmospheric impact of ship traffic in four Adriatic-Ionian port-cities: Comparison and harmonization of different approaches, Transp. Res. Part D Transp. Environ., 50, 431–445, https://doi.org/10.1016/j.trd.2016.11.016, 2017.
Monteiro, A., Russo, M., Gama, C., and Borrego, C.: How important are maritime emissions for the air quality: At European and national scale, Environ. Pollut., 242, 565–575, https://doi.org/10.1016/J.ENVPOL.2018.07.011, 2018.
Ng, S. K. W., Loh, C., Lin, C., Booth, V., Chan, J. W. M., Yip, A. C. K., Li, Y., and Lau, A. K. H.: Policy change driven by an AIS-assisted marine emission inventory in Hong Kong and the Pearl River Delta, Atmos. Environ., 76, 102–112, https://doi.org/10.1016/j.atmosenv.2012.07.070, 2013.
Norwegian Meteorological Institute: EMEP/MSC-W Model Unofficial User's Guide, Release rv4_17, Oslo, Norway, https://github.com/metno/emep-ctm (last access: 20 August 2019), 2017a.
Norwegian Meteorological Institute: EMEP Status Report 1/2017 “Transboundary particulate matter, photo-oxidants, acidifying and eutrophying components.”, 2017b.
Norwegian Meteorological Institute: MET Norway Thredds Service, available at: https://thredds.met.no/thredds/catalog/data/EMEP/2017_Reporting/catalog.html, last access: 19 August 2019.
Nunes, R. A. O., Alvim-Ferraz, M. C. M., Martins, F. G., and Sousa, S. I. V.: Assessment of shipping emissions on four ports of Portugal, Environ. Pollut., 231, 1370–1379, https://doi.org/10.1016/j.envpol.2017.08.112, 2017a.
Nunes, R. A. O., Alvim-Ferraz, M. C. M., Martins, F. G., and Sousa, S. I. V.: The activity-based methodology to assess ship emissions – A review, Environ. Pollut., 231, https://doi.org/10.1016/j.envpol.2017.07.099, 2017b.
Pandolfi, M., Gonzalez-Castanedo, Y., Alastuey, A., de la Rosa, J. D., Mantilla, E., de la Campa, A. S., Querol, X., Pey, J., Amato, F., and Moreno, T.: Source apportionment of PM10 and PM2.5 at multiple sites in the strait of Gibraltar by PMF: impact of shipping emissions, Environ. Sci. Pollut. Res., 18, 260–269, https://doi.org/10.1007/s11356-010-0373-4, 2011.
Prank, M., Sofiev, M., Tsyro, S., Hendriks, C., Semeena, V., Vazhappilly Francis, X., Butler, T., Denier van der Gon, H., Friedrich, R., Hendricks, J., Kong, X., Lawrence, M., Righi, M., Samaras, Z., Sausen, R., Kukkonen, J., and Sokhi, R.: Evaluation of the performance of four chemical transport models in predicting the aerosol chemical composition in Europe in 2005, Atmos. Chem. Phys., 16, 6041–6070, https://doi.org/10.5194/acp-16-6041-2016, 2016.
Ramacher, M. O. P., Karl, M., Bieser, J., Jalkanen, J.-P., and Johansson, L.: Urban population exposure to NOx emissions from local shipping in three Baltic Sea harbour cities – a generic approach, Atmos. Chem. Phys., 19, 9153–9179, https://doi.org/10.5194/acp-19-9153-2019, 2019.
Reuters: China's stricter rules on shipping emissions a boon for IMO 2020 compliance – Woodmac, available at: https://af.reuters.com/article/commoditiesNews/idAFL4N1UK3QP (last access: 13 July 2019), 2018.
Russo, M. A., Leitão, J., Gama, C., Ferreira, J., and Monteiro, A.: Shipping emissions over Europe: A state-of-the-art and comparative analysis, Atmos. Environ., 177, 187–194, https://doi.org/10.1016/j.atmosenv.2018.01.025, 2018.
Simpson, D., Benedictow, A., Berge, H., Bergström, R., Emberson, L. D., Fagerli, H., Flechard, C. R., Hayman, G. D., Gauss, M., Jonson, J. E., Jenkin, M. E., Nyíri, A., Richter, C., Semeena, V. S., Tsyro, S., Tuovinen, J.-P., Valdebenito, Á., and Wind, P.: The EMEP MSC-W chemical transport model – technical description, Atmos. Chem. Phys., 12, 7825–7865, https://doi.org/10.5194/acp-12-7825-2012, 2012.
Smith, T. W. P., Jalkanen, J. P., Anderson, B. A., Corbett, J. J., Faber, J., Hanayama, S., O'Keeffe, E., Parker, S., Johansson, L., Aldous, L., Raucci, C., Traut, M., Ettinger, S., Nelissen, D., Lee, D. S., Ng, S., Agrawal, A., Winebrake, J. J., Hoen, M., Chesworth, S., and Pandey, A.: Third IMO GHG Study 2014, Tech. rep., Inter-national Maritime Organization (IMO), London, UK, 2014.
Soares, J., Sofiev, M., Geels, C., Christensen, J. H., Andersson, C., Tsyro, S., and Langner, J.: Impact of climate change on the production and transport of sea salt aerosol on European seas, Atmos. Chem. Phys., 16, 13081–13104, https://doi.org/10.5194/acp-16-13081-2016, 2016.
Sofiev, M., Winebrake, J. J., Johansson, L., Carr, E. W., Prank, M., Soares, J., Vira, J., Kouznetsov, R., Jalkanen, J. P., and Corbett, J. J.: Cleaner fuels for ships provide public health benefits with climate tradeoffs, Nat. Commun., 9, 406, https://doi.org/10.1038/s41467-017-02774-9, 2018.
Song, S. K. and Shon, Z. H.: Current and future emission estimates of exhaust gases and particles from shipping at the largest port in Korea, Environ. Sci. Pollut. Res., 21, 6612–6622, https://doi.org/10.1007/s11356-014-2569-5, 2014.
Sotiropoulou, R. E. P. and Tagaris, E.: Impact of Shipping Emissions on European Air Quality, in: Perspectives on Atmospheric Sciences, Springer Atmospheric Sciences, Springer, Cham, https://doi.org/10.1007/978-3-319-35095-0_149, 2017.
Turner, D. R., Edman, M., Gallego-Urrea, J. A., Claremar, B., Hassellöv, I.-M., Omstedt, A., and Rutgersson, A.: The potential future contribution of shipping to acidification of the Baltic Sea, in: SHIPPING AND THE ENVIRONMENT – From Regional to Global Perspectives, p. 51, Gothenburg, 2017.
UNCTAD: Review of Maritime Transport, ISBN 978-92-1-112922-9, available at: https://unctad.org/en/PublicationsLibrary/rmt2017_en.pdf (last acsess: 10 July 2019), 2017.
Viana, M., Hammingh, P., Colette, A., Querol, X., Degraeuwe, B., de Vlieger, I., and van Aardenne, J.: Impact of maritime transport emissions on coastal air quality in Europe, Atmos. Environ., 90, 96–105, https://doi.org/10.1016/j.atmosenv.2014.03.046, 2014.
Viana, M., Fann, N., Tobías, A., Querol, X., Rojas-Rueda, D., Plaza, A., Aynos, G., Conde, J. A., Fernández, L., and Fernández, C.: Environmental and Health Benefits from Designating the Marmara Sea and the Turkish Straits as an Emission Control Area (ECA), Environ. Sci. Technol., 49, 3304–3313, https://doi.org/10.1021/es5049946, 2015.
Vutukuru, S. and Dabdub, D.: Modeling the effects of ship emissions on coastal air quality?: A case study of southern California, Atmos. Environ., 42, 3751–3764, https://doi.org/10.1016/j.atmosenv.2007.12.073, 2008.
Wang, X., Shen, Y., Lin, Y., Pan, J., Zhang, Y., Louie, P. K. K., Li, M., and Fu, Q.: Atmospheric pollution from ships and its impact on local air quality at a port site in Shanghai, Atmos. Chem. Phys., 19, 6315–6330, https://doi.org/10.5194/acp-19-6315-2019, 2019.
WHO: Ambient (outdoor) air quality and health, WHO Air Qual. Guidel. values, available at: http://www.who.int/news-room/fact-sheets/detail/ambient-(outdoor)-air-quality-and-health (last access: 2 August 2019), 2018.
Wiedinmyer, C., Akagi, S. K., Yokelson, R. J., Emmons, L. K., Al-Saadi, J. A., Orlando, J. J., and Soja, A. J.: The Fire INventory from NCAR (FINN): a high resolution global model to estimate the emissions from open burning, Geosci. Model Dev., 4, 625–641, https://doi.org/10.5194/gmd-4-625-2011, 2011.
Zhang, Y., Yang, X., Brown, R., Yang, L., Morawska, L., Ristovski, Z., Fu, Q., and Huang, C.: Shipping emissions and their impacts on air quality in China, Sci. Total Environ., 581–582, 186–198, https://doi.org/10.1016/j.scitotenv.2016.12.098, 2017.
Zhang, Y., Feng, J., Liu, C., Zhao, J., Ma, W., Huang, C., An, J., Shen, Y., Fu, Q., Wang, S., Ding, D., Ge, W., Fung, F., Manokaran, K., Patton, A. P., Walker, K. D., and Kan, H.: Impacts of Shipping on Air Pollutant Emissions, Air Quality, and Health in the Yangtze River Delta and Shanghai, China Special Report 22, Boston, MA, 2019.