the Creative Commons Attribution 4.0 License.
the Creative Commons Attribution 4.0 License.
 | 06 Aug 2020
Assessment of natural and anthropogenic aerosol air pollution in the Middle East using MERRA-2, CAMS data assimilation products, and high-resolution WRF-Chem model simulations
Alexander Ukhov
Suleiman Mostamandi
Arlindo da Silva
Johannes Flemming
Yasser Alshehri
Illia Shevchenko
Georgiy Stenchikov
Modern-Era Retrospective analysis for Research and Applications v.2 (MERRA-2), Copernicus Atmosphere Monitoring Service Operational Analysis (CAMS-OA), and a high-resolution regional Weather Research and Forecasting model coupled with chemistry (WRF-Chem) were used to evaluate natural and anthropogenic particulate matter (PM) air pollution in the Middle East (ME) during 2015–2016. Two Moderate Resolution Imaging Spectrometer (MODIS) retrievals – combined product Deep Blue and Deep Target (MODIS-DB&DT) and Multi-Angle Implementation of Atmospheric Correction (MAIAC) – and Aerosol Robotic Network (AERONET) aerosol optical depth (AOD) observations as well as in situ PM measurements for 2016 were used for validation of the WRF-Chem output and both assimilation products.
MERRA-2 and CAMS-OA assimilate AOD observations. WRF-Chem is a free-running model, but dust emission in WRF-Chem is tuned to fit AOD and aerosol volume size distributions obtained from AERONET. MERRA-2 was used to construct WRF-Chem initial and boundary conditions both for meteorology and chemical and aerosol species. SO2 emissions in WRF-Chem are based on the novel OMI-HTAP SO2 emission dataset.
The correlation with the AERONET AOD is highest for MERRA-2 (0.72–0.91), MAIAC (0.63–0.96), and CAMS-OA (0.65–0.87), followed by MODIS-DB&DT (0.56–0.84) and WRF-Chem (0.43–0.85). However, CAMS-OA has a relatively high positive mean bias with respect to AERONET AOD. The spatial distributions of seasonally averaged AODs from WRF-Chem, assimilation products, and MAIAC are well correlated with MODIS-DB&DT AOD product. MAIAC has the highest correlation (R=0.8), followed by MERRA-2 (R=0.66), CAMS-OA (R=0.65), and WRF-Chem (R=0.61). WRF-Chem, MERRA-2, and MAIAC underestimate and CAMS-OA overestimates MODIS-DB&DT AOD.
The simulated and observed PM concentrations might differ by a factor of 2 because it is more challenging for the model and the assimilation products to reproduce PM concentration measured within the city. Although aerosol fields in WRF-Chem and assimilation products are entirely consistent, WRF-Chem is preferable for analysis of regional air quality over the ME due to its higher spatial resolution and better SO2 emissions. The WRF-Chem’s PM background concentrations exceed the World Health Organization (WHO) guidelines over the entire ME. Mineral dust is the major contributor to PM (≈75 %–95 %) compared to other aerosol types. Near and downwind from the SO2 emission sources, nondust aerosols (primarily sulfate) contribute up to 30 % to PM2.5. The contribution of sea salt to PM in coastal regions can reach 5 %. The contributions of organic matter, black carbon and organic carbon to PM over the Middle East are insignificant. In the major cities over the Arabian Peninsula, the 90th percentile of PM10 and PM2.5 (particles with diameters less than 10 and 2.5 µm, respectively) daily mean surface concentrations exceed the corresponding Kingdom of Saudi Arabia air quality limits. The contribution of the nondust component to PM2.5 is <25 %, which limits the emission control effect on air quality. The mitigation of the dust effect on air quality requires the development of environment-based approaches like growing tree belts around the cities and enhancing in-city vegetation cover. The WRF-Chem configuration presented in this study could be a prototype of a future air quality forecast system that warns the population against air pollution hazards.
- Article
(16587 KB) - Full-text XML
- BibTeX
- EndNote


Particulate matter (PM) is a complex mixture of sea salt, sulfate, black carbon, organic matter, and mineral dust, suspended in the air. The dramatic increase in the level of air pollution in developing countries over the last decades is forced by rapid economic and population growth, burning of fossil fuels, construction, and agricultural activities (Janssens-Maenhout et al., 2015). However, the primary cause of air pollution in the Middle East (ME) is mineral dust, and it is on the rise (Klingmüller et al., 2016). Along with Asia and Africa, the ME significantly contributes to global dust emissions, which are in the range of 1000–2000 Tg yr−1 (Zender et al., 2004). According to Prospero et al. (2002), the Middle East and North Africa (MENA) regions account for about half of global dust emissions. By integrating surface emissions in MERRA-2 reanalysis, we found that the total global dust emission averaged over the 2015–2016 period is about 1600 Tg yr−1, right in the middle of the Zender et al. (2004) estimate. The dust emission from our simulation domain (see Fig. 1) that covers the ME and nearby areas is about 500 Tg yr−1, contributing ≈30 % to the global dust emission budget. Furthermore, frequent inflows of pollutants from Europe, Africa, and India worsen the air quality over the Arabian Peninsula (Jish Prakash et al., 2015; Kalenderski et al., 2013; Notaro et al., 2013; Reid et al., 2008; Mohalfi et al., 1998; Kalenderski and Stenchikov, 2016; Parajuli et al., 2019). Because of the large amount of dust, the ME is one of the most polluted areas in the world. Located in the center of the northern subtropical dust belt, the Arabian Desert is the third-largest (after the Sahara and the East Asian deserts) region of dust generation, where dust plays a significant role in controlling regional climate (Cahill et al., 2017; Banks et al., 2017; Jish Prakash et al., 2016; Farahat, 2016; Kalenderski and Stenchikov, 2016; Munir et al., 2013; Alghamdi et al., 2015; Lihavainen et al., 2016; Anisimov et al., 2017; Osipov and Stenchikov, 2018).

Figure 1Simulation domain with marked locations of the air quality monitoring stations (AQMSs) and Aerosol Robotic Network (AERONET) sites.
In addition to natural dust aerosols, the ME receives high concentrations of anthropogenic PM (Karagulian et al., 2015; Al-Taani et al., 2019; Alharbi et al., 2015; Khodeir et al., 2012). The most important anthropogenic aerosol in ME is sulfate, with SO2 as a precursor; the contributions of other types of aerosols in PM – sea salt, organic matter, and black carbon – are of lesser importance in the ME (Randles et al., 2017). The ME emits about 10 % of the total global anthropogenic SO2 (Klimont et al., 2013). SO2 produced in the course of power generation, water desalination, and oil recovery operations (Al-Jahdali and Bisher, 2008) is converted photochemically into sulfate aerosol, which contributes to PM and has significant adverse effects on human health (Lelieveld et al., 2015). Ukhov et al. (2020b) simulated SO2 transport and distribution over the Middle East using the high-resolution WRF-Chem (Weather Research and Forecasting model coupled with chemistry) model and demonstrated high surface concentrations of SO2 along the west and east coasts of the Arabian Peninsula.
The impact of aerosols on air quality is characterized by near-surface concentrations of PM, which comprise both PM10 and PM2.5 (particles with diameters less than 10 and 2.5 µm, respectively). Extended exposure to PM may cause cardiovascular and respiratory disease, lung cancer, and premature mortality on a global scale (Lelieveld et al., 2015). According to the WHO, outdoor air pollution caused 4.2 million premature deaths worldwide in 2016 (WHO, 2018). To protect human health and the environment, the WHO (WHO, 2006) and the National Agencies, e.g., the United States Environmental Protection Agency (US EPA; USEPA, 2010), European Commission (EC; EUEA, 2008), and Kingdom of Saudi Arabia Presidency of Meteorology and Environment (KSA-PME; PME, 2012), issued the air quality regulations for PM that are presented in Table 1. The WHO regulations are the strictest, while the KSA-PME regulations are the softest.
Table 1Air quality regulations for PM2.5 and PM10 prescribed by the WHO, US EPA, EC, and KSA-PME (µg m−3).
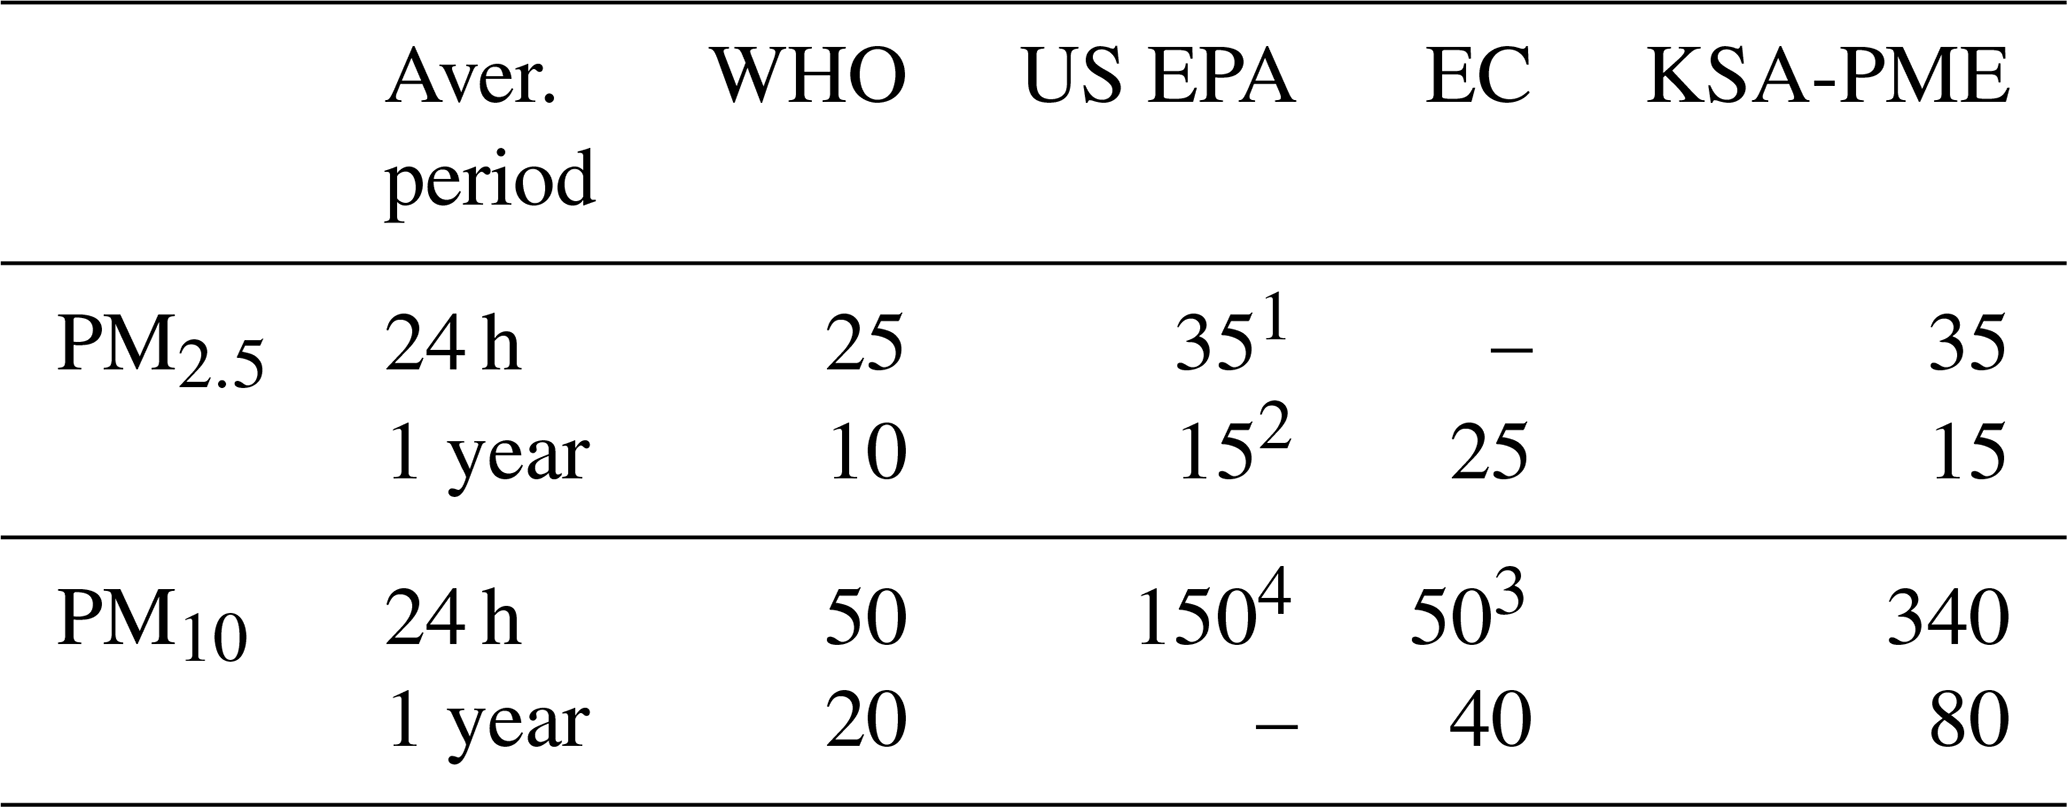
1 98th percentile, averaged over 3 years. 2 Annual mean, averaged over 3 years. 3 35 permitted exceedances per year. 4 Not to be exceeded more than once per year on average over 3 years.
Global satellite observations of aerosol optical depth (AOD) inform about vertically integrated aerosol loading in an entire atmospheric column. But the near-surface PM concentration cannot be observed from space. These measurements could be conducted only in situ in a limited number of locations. Along with instrumental observations, modern data assimilation products provide valuable information about AOD and near-surface PM concentration even in areas where satellite sensors are unreliable due to factors such as the high reflectivity of land surfaces (Shi et al., 2011). Assimilation products improve the aerosol total column loadings through the assimilation of observed AOD but are not capable of assimilating the aerosol vertical structure and chemical composition. There are two well-known data assimilation products that assimilate atmospheric constituents: MERRA-2 (Randles et al., 2017; Buchard et al., 2017) from the National Aeronautics and Space Administration (NASA) Goddard Space Flight Center (GSFC), and the Copernicus Atmosphere Monitoring Service Operational Analysis (CAMS-OA; Inness et al., 2019a; Flemming et al., 2015; Inness et al., 2015), from the European Centre for Medium-Range Weather Forecasts (ECMWF). These data assimilation products adequately reproduce AOD and PM concentrations in different regions of the world (Provençal et al., 2017; Buchard et al., 2017; Cesnulyte et al., 2014; Cuevas et al., 2015). Provençal et al. (2017), for example, tested PM surface concentrations from the MERRA Aerosol Reanalysis (predecessor of MERRA-2) against observations over Europe. Buchard et al. (2017) evaluated MERRA-2 surface PM2.5 on the global scale and over the continental United States. Excessive validation of the Monitoring Atmospheric Composition and Climate (MACC) reanalysis (predecessor of CAMS) has been conducted by Cesnulyte et al. (2014), who compared the model AOD with the Aerosol Robotic Network (AERONET) observations. Cuevas et al. (2015) evaluated atmospheric mineral dust from the MACC reanalysis over the MENA region for 2007–2008 using satellite and ground-based observations. MERRA-2 and CAMS-OA are global and have a relatively low spatial resolution (in comparison with the regional models), which diminishes their ability to resolve fine-scale regional spatial features. Like any other model, MERRA-2 and CAMS-OA use emission inventories of anthropogenic pollutants that may be outdated and incomplete, especially in rapidly developing parts of the world, like the ME region (McLinden et al., 2016). SO2 emissions used in MERRA-2 and CAMS-OA, for example, differ by 45 %–50 % in some ME regions (Ukhov et al., 2020b).
In this study, we evaluate aerosol outputs from MERRA-2, CAMS-OA, and WRF-Chem over the ME against satellite and ground-based AOD observations as well as in situ PM2.5 and PM10 measurements during the 2015–2016 period, and we assess air pollution over the ME focusing on the following science questions:
-
How accurately do WRF-Chem, MERRA-2, and CAMS-OA capture the abundance of dust aerosol, its volume size, and its spatial distributions over the ME in comparison with AERONET and satellite observations?
-
How accurately do WRF-Chem, MERRA-2, and CAMS-OA capture PM surface concentrations compared with in situ measurements?
-
What are the contributions of dust, sea salt, sulfate, black carbon, and organic matter in PM surface concentrations?
-
What is the overall impact of PM pollution on air quality over the ME region and in the major ME cities?
The paper is organized as follows: Sect. 2 describes the observational datasets used in this study. Section 3 characterizes data assimilation products. In Sect. 4, the WRF-Chem model setup is described. In Sect. 5, the capabilities of WRF-Chem, MERRA-2, and CAMS-OA to simulate dust aerosol abundance over the ME are compared; the PM spatial distributions and PM air pollution in the major ME cities obtained from the WRF-Chem simulations are also discussed. Conclusions are presented in Sect. 6.
To evaluate the data assimilation products and WRF-Chem output, we use Moderate Resolution Imaging Spectrometer (MODIS) AOD retrievals, ground-based AERONET AOD observations, and aerosol volume size distribution retrievals as well as in situ measurements of PM surface concentrations.
2.1 AERONET
AERONET comprises more than 1000 observation sites equipped with CIMEL sunphotometers and PREDE skyradiometers manufactured in France by CIMEL and in Japan by PREDE. They measure direct sun and sky radiances at eight wavelengths (340, 380, 440, 500, 670, 870, 940, and 1020 nm) every 15 min during daylight (Holben et al., 1998). In 2012 we established the KAUST Campus site, which is currently the only permanently operational AERONET site in Saudi Arabia. For this study we have chosen three AERONET sites (KAUST Campus, Mezaira, and Sede Boker; see Fig. 1) that routinely collected data in 2015–2016 and are located within our domain. We utilized level 2.0 (cloud-screened and quality-assured) AERONET AOD data. To facilitate comparison with the model output, the 550 nm AOD is calculated using the following relation:
where α is the Ångström exponent for the 440–675 nm wavelength range provided by AERONET, τλ is the optical thickness at wavelength λ, and is the optical thickness at the reference wavelength λ0. From here forward, we presume that AOD is given or calculated at 550 nm.
In addition to direct observations of AOD, the AERONET retrieval algorithm provides column-integrated aerosol volume size distribution (AVSD) dV∕dln r (µm3 µm−2) on 22 logarithmically equidistant discrete points in the range of radii between 0.05 and 15 µm (Dubovik and King, 2000). We use these retrievals to evaluate the AVSDs calculated by WRF-Chem, CAMS-OA, and MERRA-2.
2.2 MODIS
MODIS instruments on-board the NASA TERRA and AQUA satellites provide aerosol properties over both land and ocean with near-daily global coverage. The standard MODIS AOD aerosol product combines two retrieval algorithms: (1) the MODIS Dark Target (DT) algorithm (Kaufman et al., 1997) is used over the ocean and dark areas with sufficient vegetation; (2) the Deep Blue (DB) algorithm is used over bright desert surfaces of the Sahara and the ME. From this combined product (MODIS-DB&DT v6.1), we use level 2 data for AOD at 550 nm from the daily dataset at 10 km spatial resolution, downloaded from https://ladsweb.modaps.eosdis.nasa.gov/about/purpose (last access: 5 January 2020) (Levy and Hsu, 2015).
Recently, a new MODIS AOD product became available that was obtained using the Multi-Angle Implementation of Atmospheric Correction (MAIAC) algorithm (Lyapustin et al., 2018). This algorithm uses time series analysis and image processing to derive the surface bidirectional reflectance function at fine spatial resolution. MAIAC uses empirically tuned, spatially varying aerosol properties derived from the AERONET climatology and provides AOD at 470 and 550 nm with 1 km spatial resolution over land globally. We include the new MAIAC product (version 6, level 2) in the comparison between simulated and retrieved AODs.
2.3 Surface in situ PM observations
To test the model-produced PM concentrations, we use observations conducted by the air quality monitoring stations (AQMSs) that measure surface concentrations of PM2.5 and PM10 in Riyadh, Jeddah, and Dammam (megacities of Saudi Arabia; see Fig. 1). Observations are available starting from 2016. The measurements were conducted by the Saudi Authority for Industrial Cities and Technology Zones (MODON). MODON uses an MP101M analyzer to continuously detect PM2.5 and PM10 concentrations by measuring the absorption of low-energy β radiation that is proportional to the mass of aerosol particles independently of their physicochemical nature (measurement method ISO 10473). The PM2.5 and PM10 measurement error is ±5 %. The system satisfies the European Standard EN 12341 and US EPA 40CFR part 53 for the continuous monitoring of PM10 and EN 14907 for the continuous monitoring of PM2.5. The PM measurements are conducted every 15 min, and collected data are transmitted in real-time to servers at MODON for processing and storage. To provide confidence in the operational status of each AQMS, a comprehensive physical audit is conducted quarterly by Ricardo-AEA Ltd, (https://www.ctc-n.org/network/network-members/ricardo-aea-ltd, last access: 5 January 2020).
MERRA-2 and CAMS-OA assimilate satellite observations to provide aerosol abundance and air quality data globally. MERRA-2 also assimilates AERONET AODs. In contrast, WRF-Chem is a free-running model and does not assimilate observations.
3.1 MERRA-2
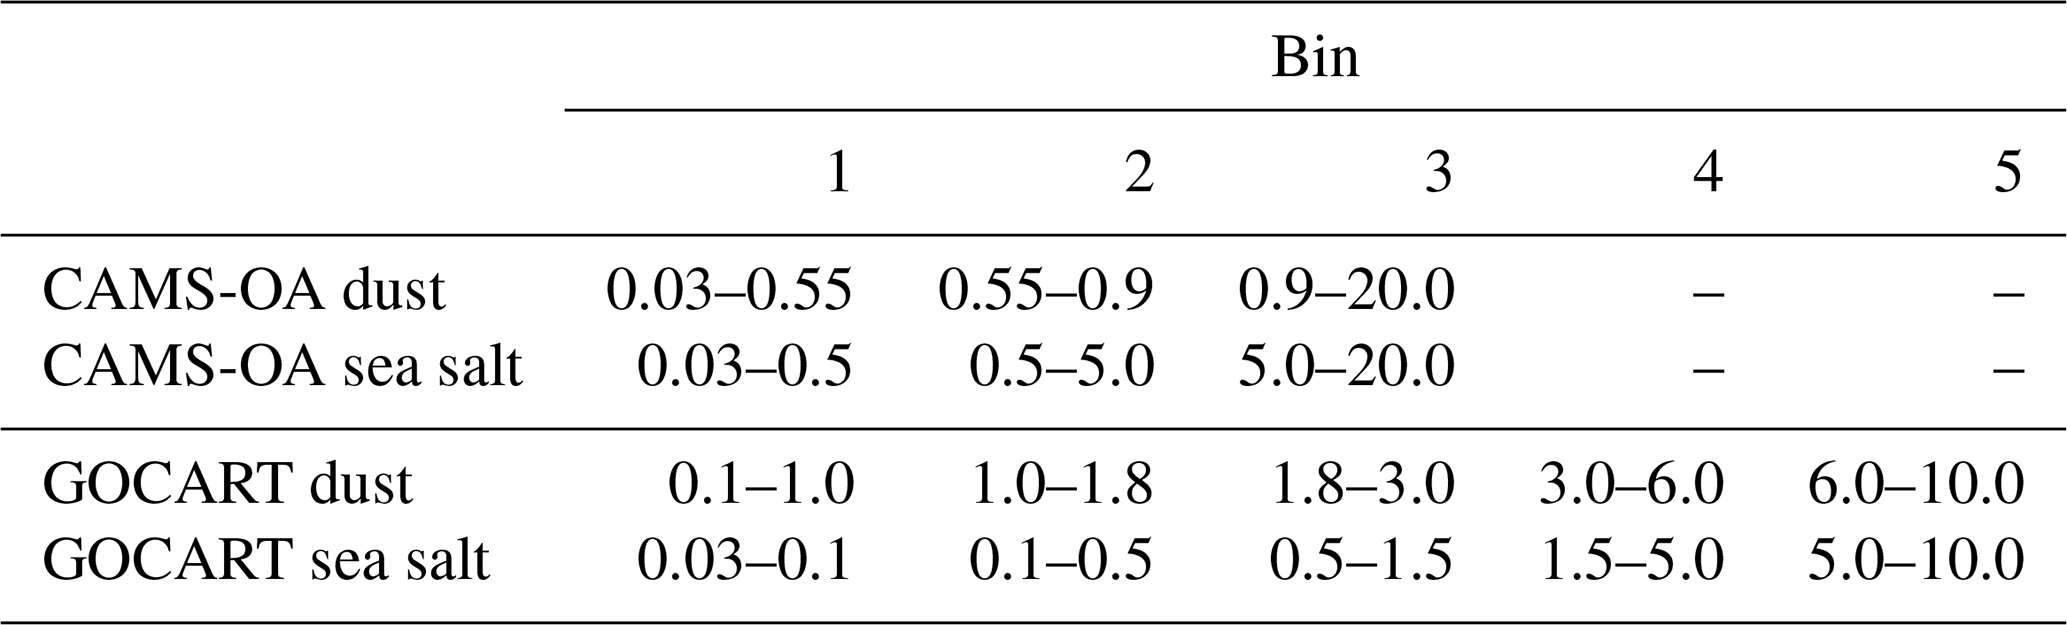
MERRA-2 (https://gmao.gsfc.nasa.gov/reanalysis/MERRA-2, last access: 5 January 2020) provides meteorological and atmospheric composition fields on latitude–longitude grids and 72 terrain-following hybrid σ–p model layers (Randles et al., 2017; Buchard et al., 2017). The pressure at the model top equals 0.01 hPa. MERRA-2 uses the Goddard Earth Observing System version 5 (GEOS-5) atmospheric model (Rienecker et al., 2008), which is interactively coupled to the Goddard Global Ozone Chemistry Aerosol Radiation and Transport (GOCART) model Chin et al., 2002, 2014; i.e., it takes into account the effects of aerosols on radiation and model dynamics. This model simulates dust and sea salt in five size bins (see Table 2), SO2, sulfate, organic and black carbon (hydrophobic and hydrophilic), O3, CO, dimethyl sulfide (DMS), and methane sulfonic acid (MSA). The dust density is 2600 kg m−3 for all sizes. Dust and sea salt emissions are calculated in the model depending on the near-surface wind. The dust source function is taken from Ginoux et al. (2001). For anthropogenic emissions, MERRA-2 employs the EDGAR-4.2 (Janssens-Maenhout et al., 2013) emission inventory available on a grid. MERRA-2 assimilated AOD at 550 nm from the Advanced Very High-Resolution Radiometer (AVHRR; Heidinger et al., 2014) over the oceans until 2002. Since 2000 MERRA-2 has been assimilating MODIS and Multiangle Imaging Spectroradiometer (MISR; Kahn et al., 2005) data over land and ocean. Both instruments are on the TERRA satellite, which has an equatorial overpass at 10:30 UTC, while the AVHRR has mostly orbited with an afternoon equatorial crossing time. Therefore MERRA-2 continued using AVHRR data over the ocean until 2002, when the AQUA satellite was launched. Since AQUA has an orbit with the Equator overpass at 14:30 UTC, AVHRR data were no longer needed for coverage. We have to mention that MERRA-2 assimilates specially processed MODIS observations, not the standard MODIS-DB&DT aerosol product. It also assimilates AERONET AODs (Randles et al., 2017).
Table 2Radii ranges (µm) of dust and sea salt bins used in the GOCART model (WRF-Chem, MERRA-2) and in CAMS-OA.
3.2 CAMS-OA
CAMS-OA (https://atmosphere.copernicus.eu/, last access: 5 January 2020) has been conducted in almost real time since July 2012. The CAMS-OA product had a resolution of before 21 June 2016 and after that, with 60 vertical levels. It employs the ECMWF aerosol data assimilation system developed within the Integrated Forecast System (IFS; Morcrette et al., 2009; Benedetti et al., 2009). The extended version of the Carbon Bond chemical mechanism 5 (CB05; Yarwood et al., 2005) is implemented in the IFS (Flemming et al., 2015). CB05 describes tropospheric chemistry with 54 species and 126 reactions. The chemistry scheme is coupled with the aerosol module.
CAMS-OA simulates five aerosol species: dust, sea salt, sulfate, organic carbon, and black carbon. To calculate dust and sea salt, it uses three dust bins (see Table 2). The dust density is 2600 kg m−3 for all bins. Emissions of mineral dust and sea salt depend on simulated near-surface wind speed. Dust emission is parameterized following Marticorena and Bergametti (1995), with the source function adopted from Ginoux et al. (2001). SO2 oxidation into sulfate aerosol is parameterized using a prescribed latitude-dependent e-folding timescale ranging from 3 d at the Equator to 8 d at the poles. The anthropogenic emissions for the chemical species are taken from the MACCity inventory (Granier et al., 2011), which is available on a grid and covers the period 1960–2010. CAMS-OA assimilates MODIS AQUA and TERRA AODs. It has been using observations from Collection 5 since 2009 and Deep Blue since 2015.
To calculate fine-resolution PM and sulfate fields, we use the Weather Research and Forecasting (WRF) model (Skamarock et al., 2005) coupled with chemistry (WRF-Chem v3.7.1; Grell et al., 2005). The WRF-Chem is used for prediction and simulation of weather, air quality, and dust storms, accounting for the aerosol effect on radiation. WRF-Chem can be configured with one of the few gas-phase chemical mechanisms, photolysis, and aerosol parameterization models. WRF-Chem has been widely used for air quality simulations in different parts of the globe: East Asia (Wang et al., 2010), North America (Kim et al., 2006; Chuang et al., 2011), Europe (Forkel et al., 2012; Ritter et al., 2013), South America (Archer-Nicholls et al., 2015), and the Middle East (Parajuli et al., 2019). To reduce the clock time of our 2-year calculations, we simulated each month of the 2015–2016 period separately. Each simulation starts from the last week of the previous month. This time is considered a spin-up and is excluded from postprocessing. The simulation domain, shown in Fig. 1, is centered at 28∘ N, 42∘ E, and a 10 km×10 km horizontal grid (450×450 grid nodes) is employed. The vertical grid comprises 50 vertical levels with enhanced resolution closer to the ground, comprising 11 model levels within the near-surface 1 km layer. The model top boundary is set at 50 hPa.
To improve the representation of the meteorological fields, we apply spectral nudging (Miguez-Macho et al., 2004) above the planetary boundary layer (PBL; >5.0 km) to horizontal wind components (U and V) toward the MERRA-2 wind field. The nudging coefficient for U and V is set to be 0.0001 s−1. We only nudge waves with wavelengths longer than 450 km. This allows us to keep the large-scale motions close to reanalysis and leave the resolved small-scale, high-frequency features unaffected.
The aerosol and chemistry initial and boundary conditions (IC&BC) are calculated using MERRA-2 output using the newly developed Merra2BC interpolation utility (Ukhov and Stenchikov, 2020). To be consistent with aerosol and chemistry IC&BC, we also define the meteorological IC&BC using MERRA-2 output (see Appendix A1).
The following set of physical parameterizations was used in WRF-Chem runs. The Unified Noah land surface model (sf_surface_physics=2) and the Revised MM5 Monin-Obukhov scheme (sf_sfclay_physics=1) are chosen to represent land surface processes and surface layer physics. The Yonsei University scheme is chosen for PBL parameterization (bl_pbl_physics=1). The WRF single-moment microphysics scheme (mp_physics=4) is used for the treatment of cloud microphysics. The New Grell scheme (cu_physics=5) is used for cumulus parameterization. The Rapid Radiative Transfer Model (RRTMG) for both shortwave (ra_sw_physics=4) and longwave (ra_lw_physics=4) radiation is used for radiative transfer calculations. Only the aerosol direct radiative effect is accounted for. More details on the physical parameterizations used can be found at http://www2.mmm.ucar.edu/wrf/users/phys_references.html (last access: 5 January 2020).
4.1 Gas-phase chemistry and aerosols
To calculate the atmospheric chemistry within WRF-Chem, we employ the Regional Atmospheric Chemistry Mechanism (RACM; Stockwell et al., 1997), containing 77 species and 237 reactions, which include 23 photolysis reactions but no heterogeneous chemistry. The RACM chemical module is embedded into WRF-Chem using the Kinetic PreProcessor (KPP; Damian et al., 2002). The role of the KPP is to integrate the system of stiff, nonlinear ordinary differential equations, which represents the specified set of chemical reactions. The photolysis rates are calculated on-line according to Madronich (1987; phot_opt=1). Similar to MERRA-2, the GOCART chemistry module is used to calculate SO2 to sulfate oxidation (Chin et al., 2002, 2014) by the hydroxyl radical OH, whose abundance is interactively simulated by the RACM.
We use the novel OMI-HTAP SO2 emission dataset (Liu et al., 2018) based on the combination of distributed SO2 emissions from residential and transportation sectors, taken from the HTAP-2.2 inventory (Janssens-Maenhout et al., 2015) with the catalog of the strong (>30 kt yr−1) SO2 point emissions (Fioletov et al., 2016) built using satellite observations by the Ozone Monitoring Instrument (OMI; Levelt et al., 2006; Li et al., 2013). The catalog contains more than 500 point sources of industrial origin, some of which are not present in the widely used EDGAR-4.2 and HTAP-2.2 emission datasets. For example, 14 SO2 point emissions located in the ME that were previously unaccounted for (mostly in the Arabian Gulf) were detected, most of which are related to the oil and gas industry. OMI-HTAP divides SO2 emissions into surface and elevated ones. We distribute the surface SO2 emissions with a constant mixing ratio in the 0–1000 m layer and elevated emissions in the 120–1000 m layer. All other constituents (other PM from biogenic and fossil components, black and organic carbon, etc.), including SO2 shipping emissions, are taken from the HTAP-2.2 inventory and are treated as surface emissions. OMI-HTAP SO2 emissions are provided on a grid (Liu et al., 2018). We conservatively interpolated them on the WRF-Chem 10 km×10 km grid. See Ukhov et al. (2020b) for details.
To calculate aerosols we employ the GOCART (Chin et al., 2002) aerosol model (chem_opt=301). It is the same microphysical model as that used in MERRA-2 (see Sect. 3.1). Dust and sea salt size distributions in WRF-Chem are approximated by the same five dust and sea salt size bins as those in MERRA-2 (Table 2). However, only the last four “salt” bins in Table 2 are used in WRF-Chem as the first bin appears to be very poorly populated. Dust density is assumed to be 2500 kg m−3 for the first dust bin and 2650 kg m−3 for dust bins 2–5. Emission of sea salt is calculated according to Gong (2003). Dust emission from the surface is calculated using the GOCART emission scheme Ginoux et al. (2001; dust_opt=1). Dust emission mass flux, Fp (µg m−2 s−1), in each dust bin is defined by the relation
where C (µg s2 m−5) is a spatially uniform factor which controls the magnitude of dust emission flux; S is the spatially varying topographic source function (Ginoux et al., 2001) that characterizes the spatial distribution of dust emissions; u10 m is the horizontal wind speed at 10 m height; ut is the threshold velocity, which depends on particle size and surface wetness; and sp is a fraction of dust mass emitted into dust bin p, .
To avoid natural dust emission in urban areas, we use the built-in WRF-Chem of the U.S. Geological Survey (USGS) 24-category land use dataset (Anderson, 1976). We modify the source function S using the following expression:
where S′ is the modified topographic source function, and URBAN_MASK is the USGS “Urban and Built-up Land” mask field. It has the sense of a fraction of urban area in a grid cell and ranges from 0 to 1. Grid cells with URBAN_MASK=1 do not produce natural dust emissions. We do not account for anthropogenic dust emissions within cities, and we therefore potentially underestimate urban dust pollution.
As in our previous studies (Kalenderski et al., 2013; Jish Prakash et al., 2015; Anisimov et al., 2017), we tune dust emissions to fit the AOD from the AERONET stations located within the domain. For this purpose, the factor C from Eq. (2) has been adjusted to achieve the best agreement between simulated and observed AOD at the KAUST Campus, Mezaira, and Sede Boker AERONET sites (see Fig. 1). Assuming that factor C does not depend on time and geographical coordinates, we can only tune the annual average AOD bias. Both simulations and observations represent the total AOD with contributions from all types of aerosols. Because dust dominates all other aerosols in the ME, we choose to tune only the dust emissions. Obtained during test runs, a C value of 0.5 is kept constant in all subsequent production runs. We also tune sp from Eq. (2) to better reproduce the AVSDs provided by the AERONET inversion algorithm. This tuning and the comparisons of AOD and AVSDs from the assimilation products and WRF-Chem simulations are discussed in detail below.
In situ air quality observations in the Middle East are scarce. It is one of the known problems for air quality research in this area. Things are simplified a bit by the fact that in the ME, dust dominates aerosol pollution. Cloud-Aerosol Lidar and Infrared Pathfinder Satellite Observations (CALIPSO; Vaughan et al., 2004), for example, records dust in 95 % of the profiles (Osipov et al., 2015). The effect of nitrates, ammonia, and organics on AOD and PMs is insignificant; therefore, the employed aerosol–chemical scheme (GOCART-RACM) is adequate for the ME conditions. To support this conclusion, we have conducted laboratory analysis of the chemical composition of soil and dust deposition samples that show little presence of organics and ammonium (Jish Prakash et al., 2016; Engelbrecht et al., 2017). According to Engelbrecht et al. (2017), in 2015, the annual average weight percentages of soluble ions of ammonium (NH4) and sulfate in deposition samples taken at four sites at the KAUST Campus are 0.05 % and 2.513 %, respectively. This means that available ammonium may neutralize at a maximum of 5 % of sulfate mass. The actual contribution of ammonium sulfate should be lower as some ammonium may also be bound as ammonium nitrate, ammonium phosphate, or ammonium chloride.
4.2 WRF-Chem code modification
We have corrected the source code of the WRF-Chem v3.7.1 with the GOCART aerosol module in several places. These corrections were implemented in the WRF-Chem v4.1.3 official release. We evaluate how they change the results in Ukhov et al. (2020a). Here we only briefly discuss the introduced changes and their effects. Firstly, the diagnostic output of PM concentrations was corrected because contributions of the individual dust and sea salt bins were incorrectly calculated. Therefore, PM2.5 surface concentrations were erroneously underestimated by 7 %, while PM10 surface concentrations were overestimated by 5 %. Secondly, we found that the contribution of fine dust particles with radii <0.46 µm was omitted in the calculation of AOD; AOD was consequently underestimated by 25 %–30 %. This led to an overestimation of the dust emission flux because we force the simulated AOD to match the AERONET observations. Thirdly, we fixed the dust and sea salt gravitational settling subroutine since the calculations of mass fluxes of settling particles did not initially account for changes in air density. Due to this error, the total mass of dust and sea salt aerosols increased, violating mass conservation.
5.1 Regional climate and circulation
The ME is one of the hottest and driest regions on the Earth. Summer in the ME is long and hot with little precipitation. Precipitation mainly occurs in the southwest of the Arabian Peninsula. Winter is mild, with rainfall being mostly associated with cold fronts and cyclones propagating from the eastern Mediterranean (Climate.com, 2018). Emission and transport of dust are driven by winds. Emission and deposition of dust are also sensitive to soil moisture and precipitation (Furman, 2003; Shao, 2008; Yu et al., 2015). However, because the ME is an arid region, the soil moisture and precipitation effects are insignificant.
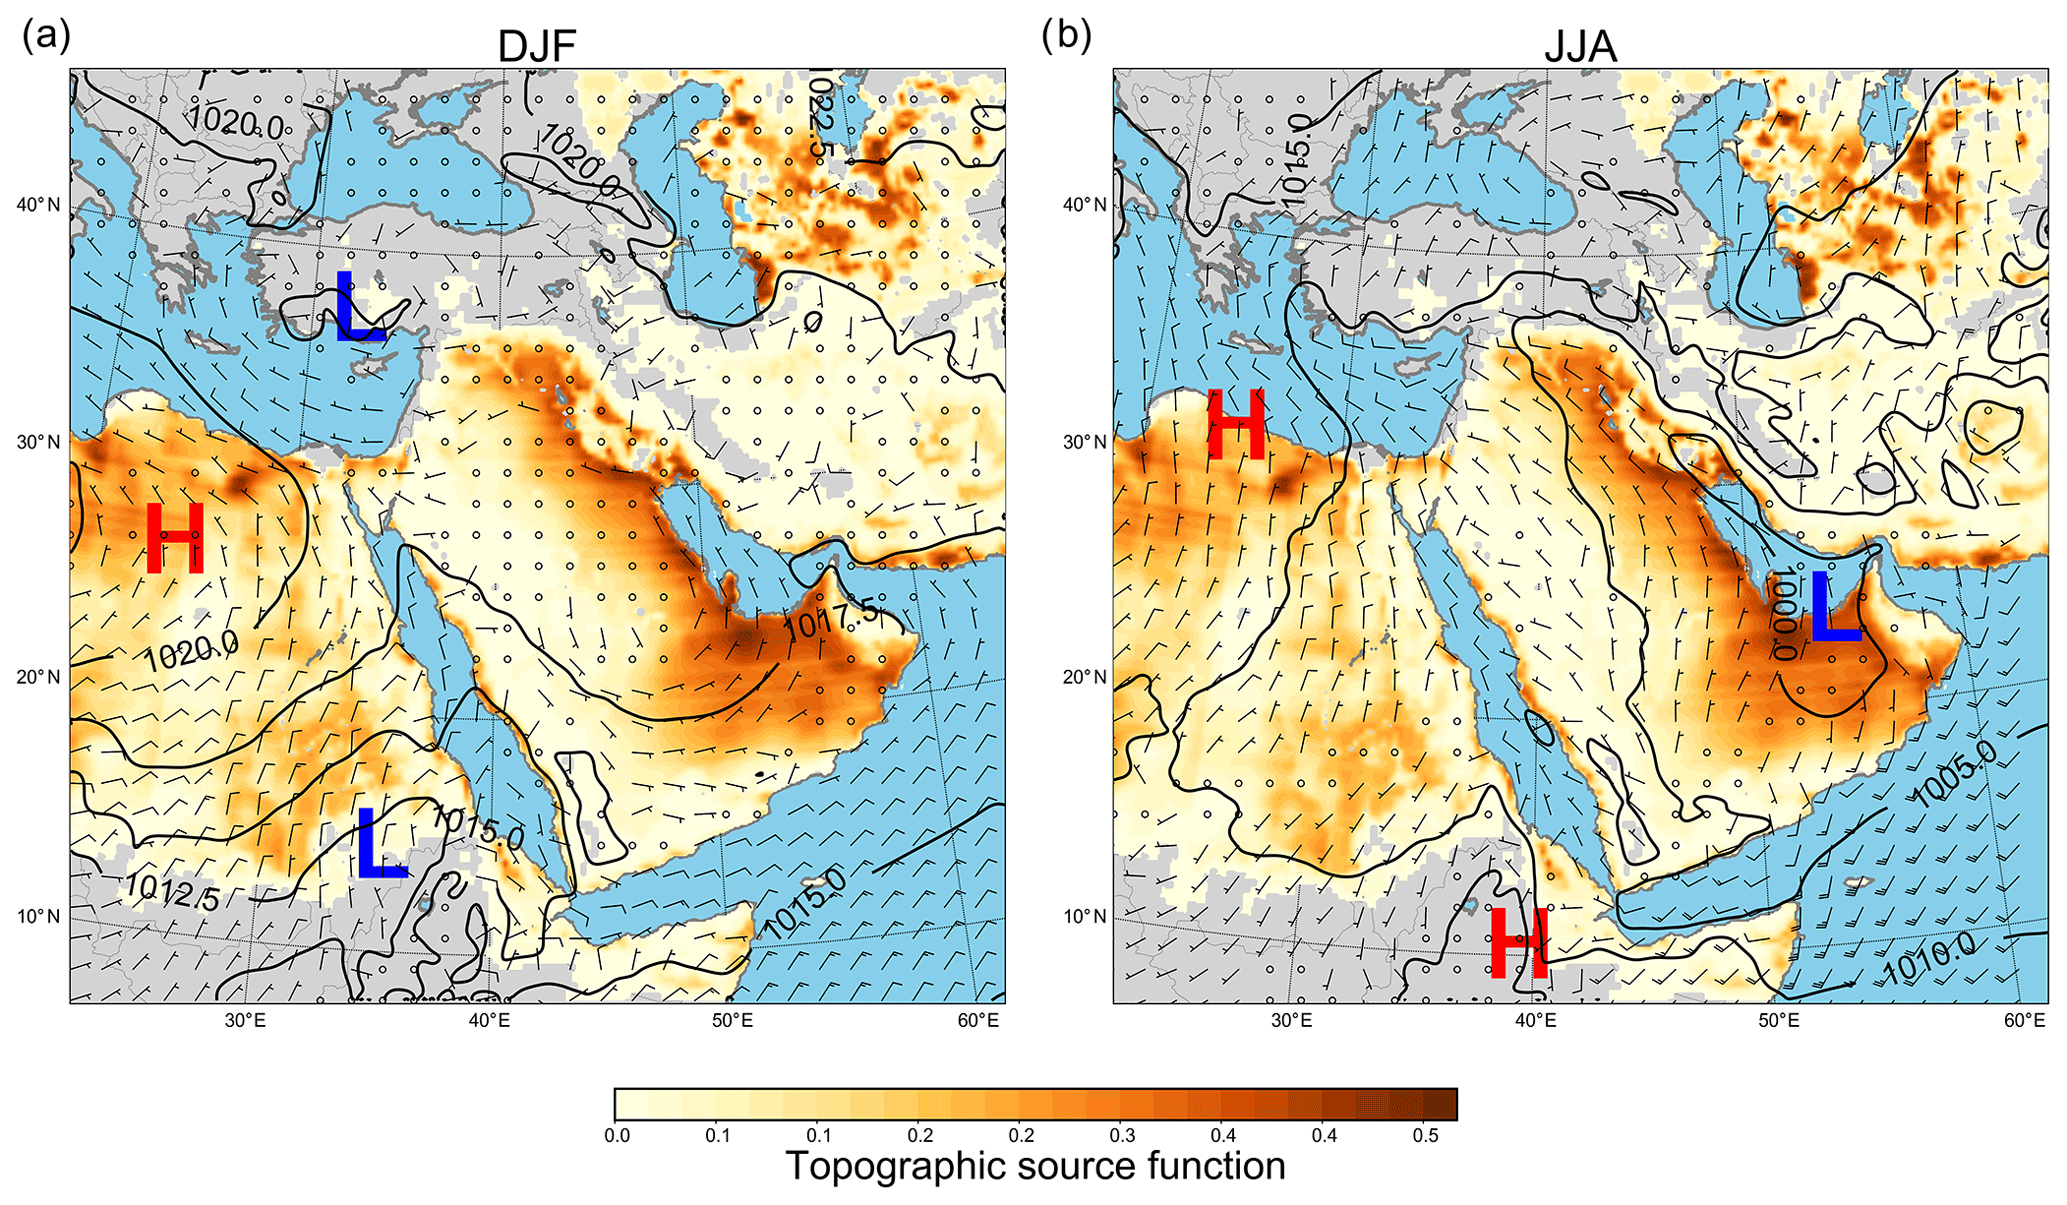
Figure 2Seasonally averaged (2015–2016) wind barbs (m s−1) at 10 m, sea level pressure (contours), and erodibility function (shading; Ginoux et al., 2001). (a) Winter (DJF), (b) Summer (JJA).
Figure 2 shows contours of sea level pressure, topographic source function S (Ginoux et al., 2001), and seasonally (2015–2016) averaged wind speed barbs at 10 m height over the ME during winter (DJF) and summer (JJA) from WRF-Chem simulations. Over northeast Africa in winter (see Fig. 2a), the strong pressure gradient between the Red Sea trough and the stationary high-pressure system over Egypt predominantly generates moderate northeasterly winds (up to 10 m s−1). Therefore in winter, dust storms occur more frequently in the west of the Arabian Peninsula. Over the central and eastern Arabian Peninsula and the eastern part of the ME, winds are relatively weak and do not have a clear direction. However, cold fronts generated by Mediterranean cyclones can cause dust storms and dust transport to central regions of the Arabian Peninsula.
In summer (see Fig. 2b) the high-pressure system over the eastern Mediterranean and low-pressure system over the Arabian Gulf promote moderate north-northwesterly winds known as shamals (Yu et al., 2016; Hamidi et al., 2013), which dominate over the central part of the Arabian Peninsula. Shamals are the primary drivers of dust storm events over this area (Yu et al., 2016; Shao, 2001; Middleton, 1986; Goudie and Middleton, 2006; Notaro et al., 2015). Shamals bring dust to the Arabian Gulf and the north and central part of Saudi Arabia from the Tigris–Euphrates basin of Syria and Iraq (Anisimov et al., 2018).
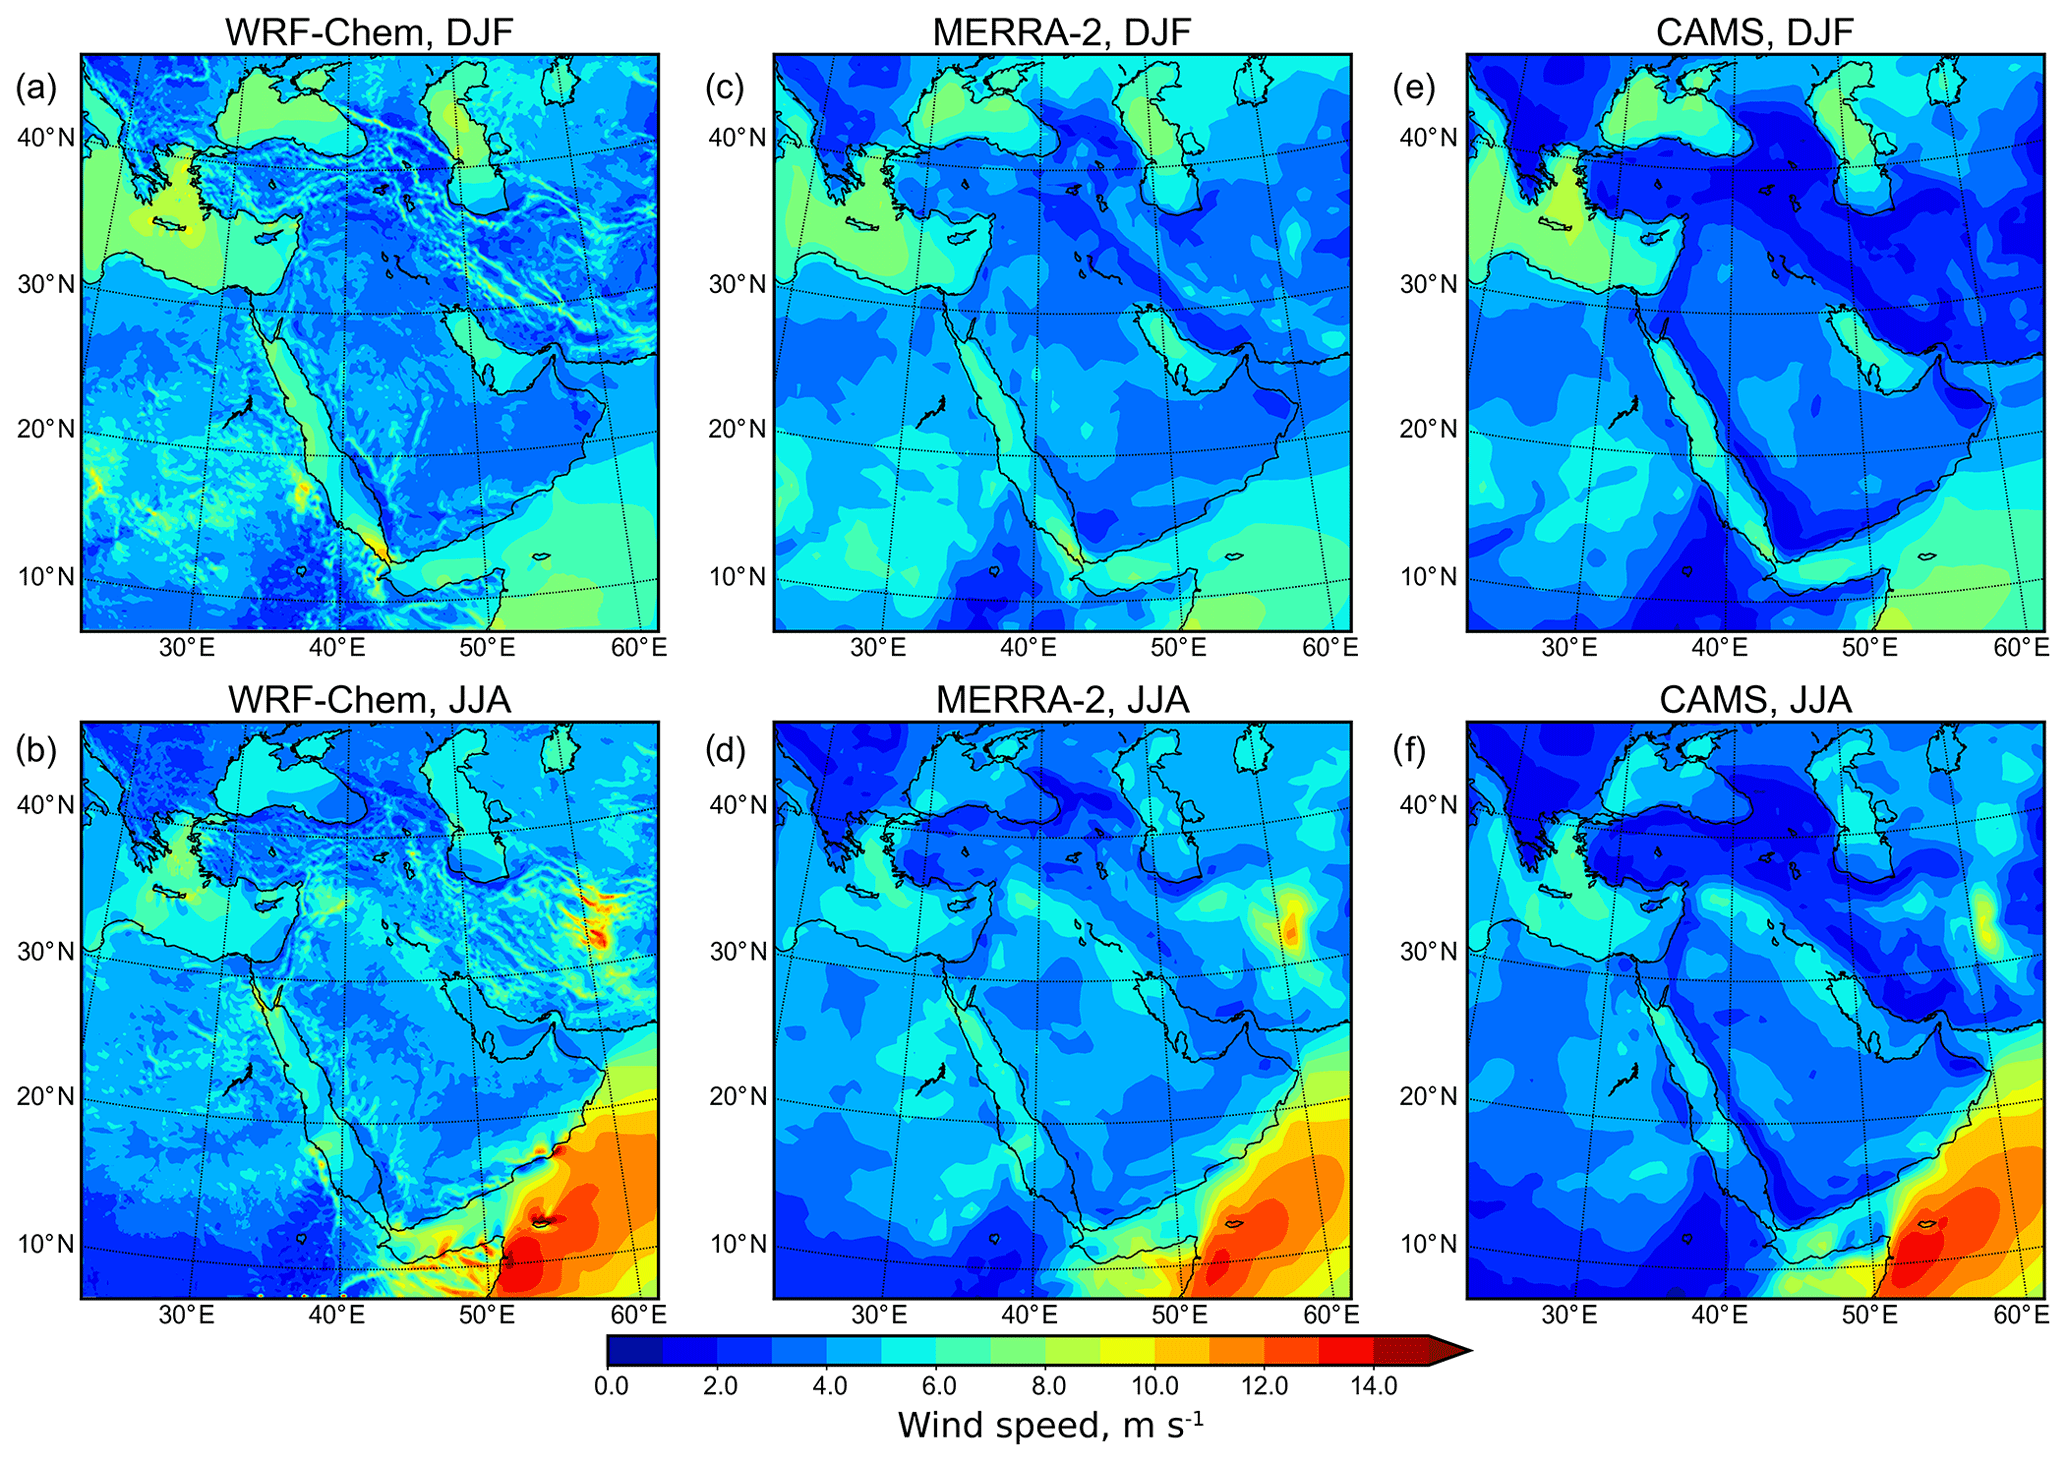
Figure 3Seasonally averaged (2015–2016) wind speed at 10 m from WRF-Chem, MERRA-2, and CAMS-OA during winter (DJF) and summer (JJA).
Figure 3 shows wind speed seasonally averaged for 2015–2016 at 10 m from MERRA-2, CAMS-OA, and WRF-Chem during winter (DJF) and summer (JJA). WRF-Chem spatial distributions of wind speed agree well with MERRA-2 and CAMS-OA, but due to the higher spatial resolution, WRF-Chem better resolves the fine-scale spatial structures of the 10 m wind field over complex terrain. All panels have similar seasonal variations of wind speed. In winter, maximum winds are stronger over the southeast of the domain. In the central and northern parts of the domain winds are weak. In summer, wind speed increases in the northern and central parts of the ME. Somali jets produce strong (10–15 m s−1) winds in the Arabian Sea along the coasts of Somalia and Oman.
Table 3Pearson correlation coefficient R and root mean square difference (RMSD; m s−1) for the seasonally averaged 2015–2016 wind components U and V at 10 m.
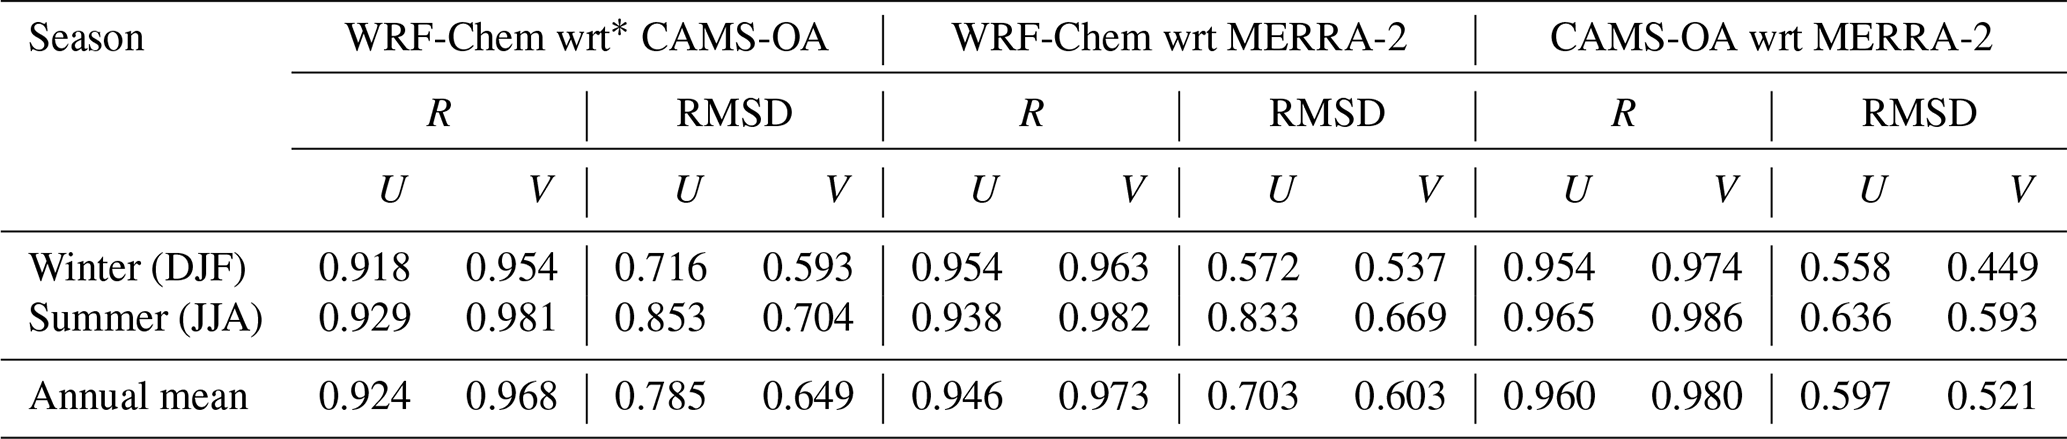
∗ wrt – with respect to.
To conduct the statistical analysis, we interpolated the seasonally averaged 2015–2016 zonal and meridional wind components (U and V) at 10 m from WRF-Chem and CAMS-OA on a MERRA-2 grid and calculated the Pearson correlation coefficient (R) and root mean square differences (RMSDs) between each pair (see Table 3), respectively. RMSD is calculated using the same formula as the root mean square error (RMSE). The procedure of calculation of these parameters is given in Appendix A2. Pearson correlation coefficients provided in Table 3 are close to 1. The highest correlation is achieved between MERRA-2 and CAMS-OA. WRF-Chem's correlation coefficient with respect to MERRA-2 is smaller but exceeds that of the WRF-Chem–CAMS-OA pair. The WRF-Chem and MERRA-2 wind fields are close partly because WRF-Chem boundary conditions are built using MERRA-2 reanalysis, and the large-scale winds are nudged (see Sect. 4) to the ones from MERRA-2 over the PBL.
The RMSDs (see Table 3) are lower in winter than in summer. All RMSDs are in the range of 0.45–0.85 m s−1. The lowest RMSDs are between MERRA-2 and CAMS-OA. Notably, the correlation coefficients for the meridional component V are higher, and the RMSDs are lower when compared with the zonal wind component U. This is because the northern winds are stable since they are maintained by the large-scale processes. In contrast, the zonal wind component, which is affected by small-scale processes like sea breezes, is variable. The results of the statistical analysis in Table 3 and the clear similarity of the spatial patterns (among all products) of the averaged 10 m wind fields presented in Fig. 3 suggest that WRF-Chem captures the magnitude and spatial distribution of the 10 m wind. Thus, we conclude that WRF-Chem with the selected set of physical parameterizations satisfactorily simulates both the large- and mesoscale atmospheric processes in the ME.
5.2 AOD
In this section, we evaluate the ability of WRF-Chem, CAMS-OA, and MERRA-2 to reproduce the aerosol content in the atmosphere accurately. This content is characterized by AOD. In the ME, mineral dust contribution to the total AOD is dominant (≈87 %; Kalenderski and Stenchikov, 2016; Osipov et al., 2015). The treatment of optically active dust within the model is therefore vitally important. AOD is calculated based on aerosol concentrations and aerosol optical properties, which depend upon aerosol size distribution. We therefore evaluate how well WRF-Chem and assimilation products reproduce aerosol volume size distribution.
5.2.1 Aerosol volume size distributions
Dust particles are emitted into the lower atmospheric layer with some predominant size distribution (Martin and Kok, 2017; Kok, 2011). Emitted dust is processed by the atmosphere to produce the atmospheric dust size distribution that is retrieved by the AERONET inversion algorithm (Dubovik and King, 2000) and reported as column-integrated AVSD. Strictly speaking, AERONET AVSD incorporates contributions from all types of aerosols. But the size distribution of emitted dust has the strongest effect on column-integrated AVSD because dust dominates all other aerosols in the ME. Therefore, we have to tune the dust emission parameters in the first place.
Equation (2) assumes that emission mass fluxes into five dust size bins are controlled by the sp fractions. In WRF-Chem the default values of sp fractions for the five dust bins (see Table 2) are 0.1, 0.25, 0.25, 0.25, and 0.25. We found that with these default sp fractions, WRF-Chem underestimated the volume of fine dust particles in the first bin, , compared with AERONET AVSD, whereas the volume of the second bin, , was overestimated. In combination with fitting the observed AOD by tuning of factor C, this led to an increase in the total emitted dust mass since fine particles are optically more efficient per unit mass than coarse particles. To achieve a better agreement between the simulated and AERONET AVSDs, we adjusted the fractions sp to be 0.15, 0.1, 0.25, 0.4, and 0.1. A similar approach was implemented in Khan et al. (2015) using the Modal Aerosol Dynamics Model for Europe (MADE) and Secondary Organic Aerosol Model (SORGAM) chemistry–aerosol scheme. This sp modification is in line with (Adebiyi and Kok, 2020) as it effectively decreased emission of dust particles with radii r<2.5 µm and increased emission of coarse particles with radii r>2.5 µm (see Appendix A3). We use the updated sp values in all our WRF-Chem simulations.
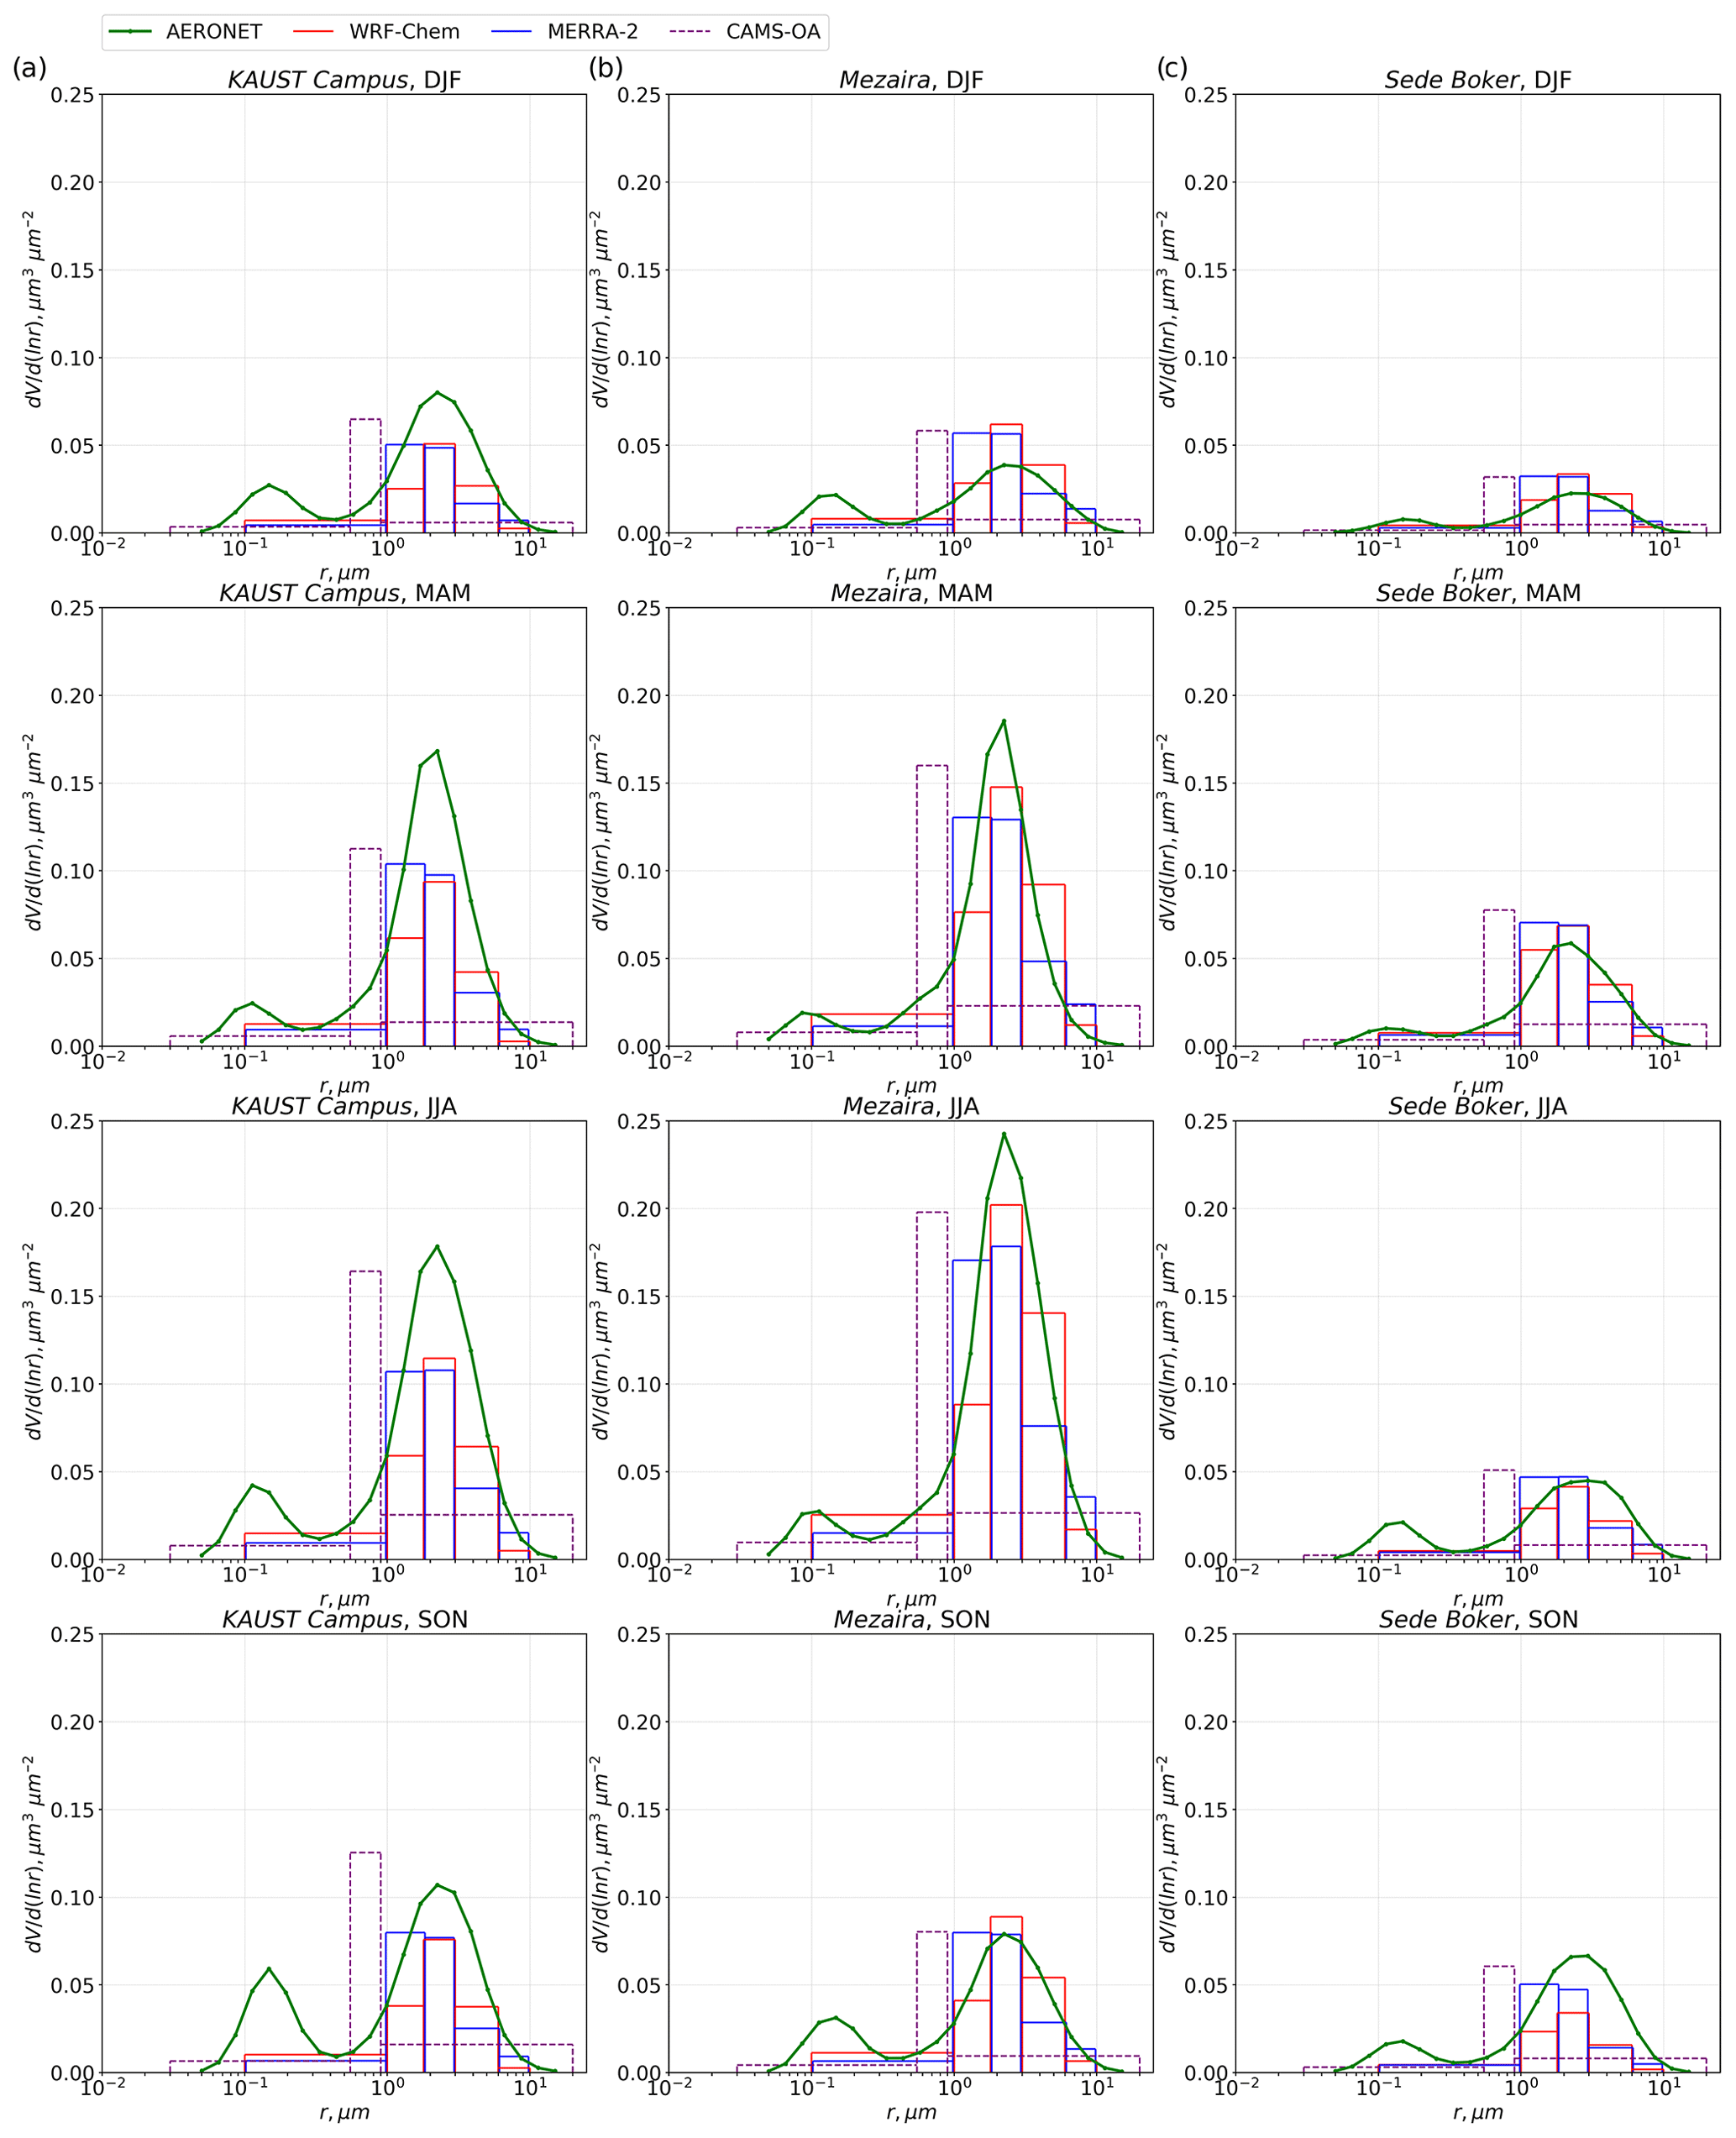
Figure 4Seasonally averaged 2015–2016 AVSDs (µm3 µm−2) obtained from MERRA-2, CAMS-OA, WRF-Chem, and the AERONET inversion algorithm at the (a) KAUST Campus, (b) Mezaira, and (c) Sede Boker AERONET sites. Winter (DJF), spring (MAM), summer (JJA), and autumn (SON).
Figure 4 shows seasonally averaged 2015–2016 volume size distributions obtained from MERRA-2, CAMS-OA, AERONET, and WRF-Chem with updated sp fractions. The comparison is conducted for the KAUST Campus, Mezaira, and Sede Boker AERONET sites (see Fig. 1) since only these sites have information on AVSDs during the 2015–2016 period. The effect of sp modification could be seen in Fig. 4 by comparing AVSDs from WRF-Chem with an updated set of sp and MERRA-2 that uses the default sp set. A direct comparison of AVSDs from the WRF-Chem runs with the updated and default sp sets is shown in Appendix A3.
Both MERRA-2 and WRF-Chem use the GOCART aerosol scheme with the same five dust bins, and they approximate the shape of the AERONET AVSD relatively well. CAMS-OA uses only three dust bins (see Table 2) and fails to reproduce the AERONET AVSD even qualitatively. It overestimates the volume of particles with radii of 0.55–0.9 µm and underestimates the volume of particles with radii of 0.9–20 µm. With the latest system upgrade in 2019, this weakness of CAMS-OA has been corrected by introducing a new dust scheme (Nabat et al., 2012).
The volume size distributions from the model and assimilation products demonstrate pronounced seasonal variability with the increased amount of dust in the atmosphere during spring and summer. Since the KAUST Campus and Mezaira sites are located in the vicinity of strong dust sources, the coarse mode at these sites is more pronounced than at the Sede Boker site, which is farther from the strong dust emission sources.
The fine mode in the AERONET AVSD is more pronounced at the KAUST Campus site in comparison with the other AERONET sites due to its proximity to strong SO2 sources located along the west coast of Saudi Arabia (Ukhov et al., 2020b). This proximity leads to a higher contribution of fine sulfate particles to the fine mode. The smaller volume of fine particles in the WRF-Chem and MERRA-2 simulated AVSD (see Fig. 4) is in part because the simulated AVSDs show only dust omitting the contributions of sulfate and sea salt. Sea salt particles and droplets are relatively large and mostly contribute to the coarse mode.
Figure 5 shows the contributions of dust, sea salt, and sulfate aerosols into the AVSD at the KAUST Campus AERONET site in the WRF-Chem simulation averaged for two summer seasons (JJA) in the 2015–2016 period. In WRF-Chem, sulfate aerosol is computed using a bulk approach. For calculating aerosol optical properties, it is assumed that sulfate aerosol comprises two log-normal modes: nuclei and accumulation. According to the WRF-Chem source code, the nuclei mode median radius μnuc is 0.005 µm, and the geometric width σnuc is 1.7; the accumulation mode median radius μacc is 0.035 µm, and the geometric width σacc is 2.0. The nuclei mode comprises 25 % of the sulfate aerosol mass and accumulation mode −75 %. It is assumed that sulfate aerosol density is 1800 kg m−3, and sea salt density is 2200 kg m−3. Figure 5 demonstrates that the contribution of the sulfate nuclei mode in the aerosol volume is almost negligible, while the sulfate accumulation mode adds in the volume of aerosol particles with radii <1 µm. The contribution of the sea salt aerosol into AVSD in WRF-Chem simulations is very little.
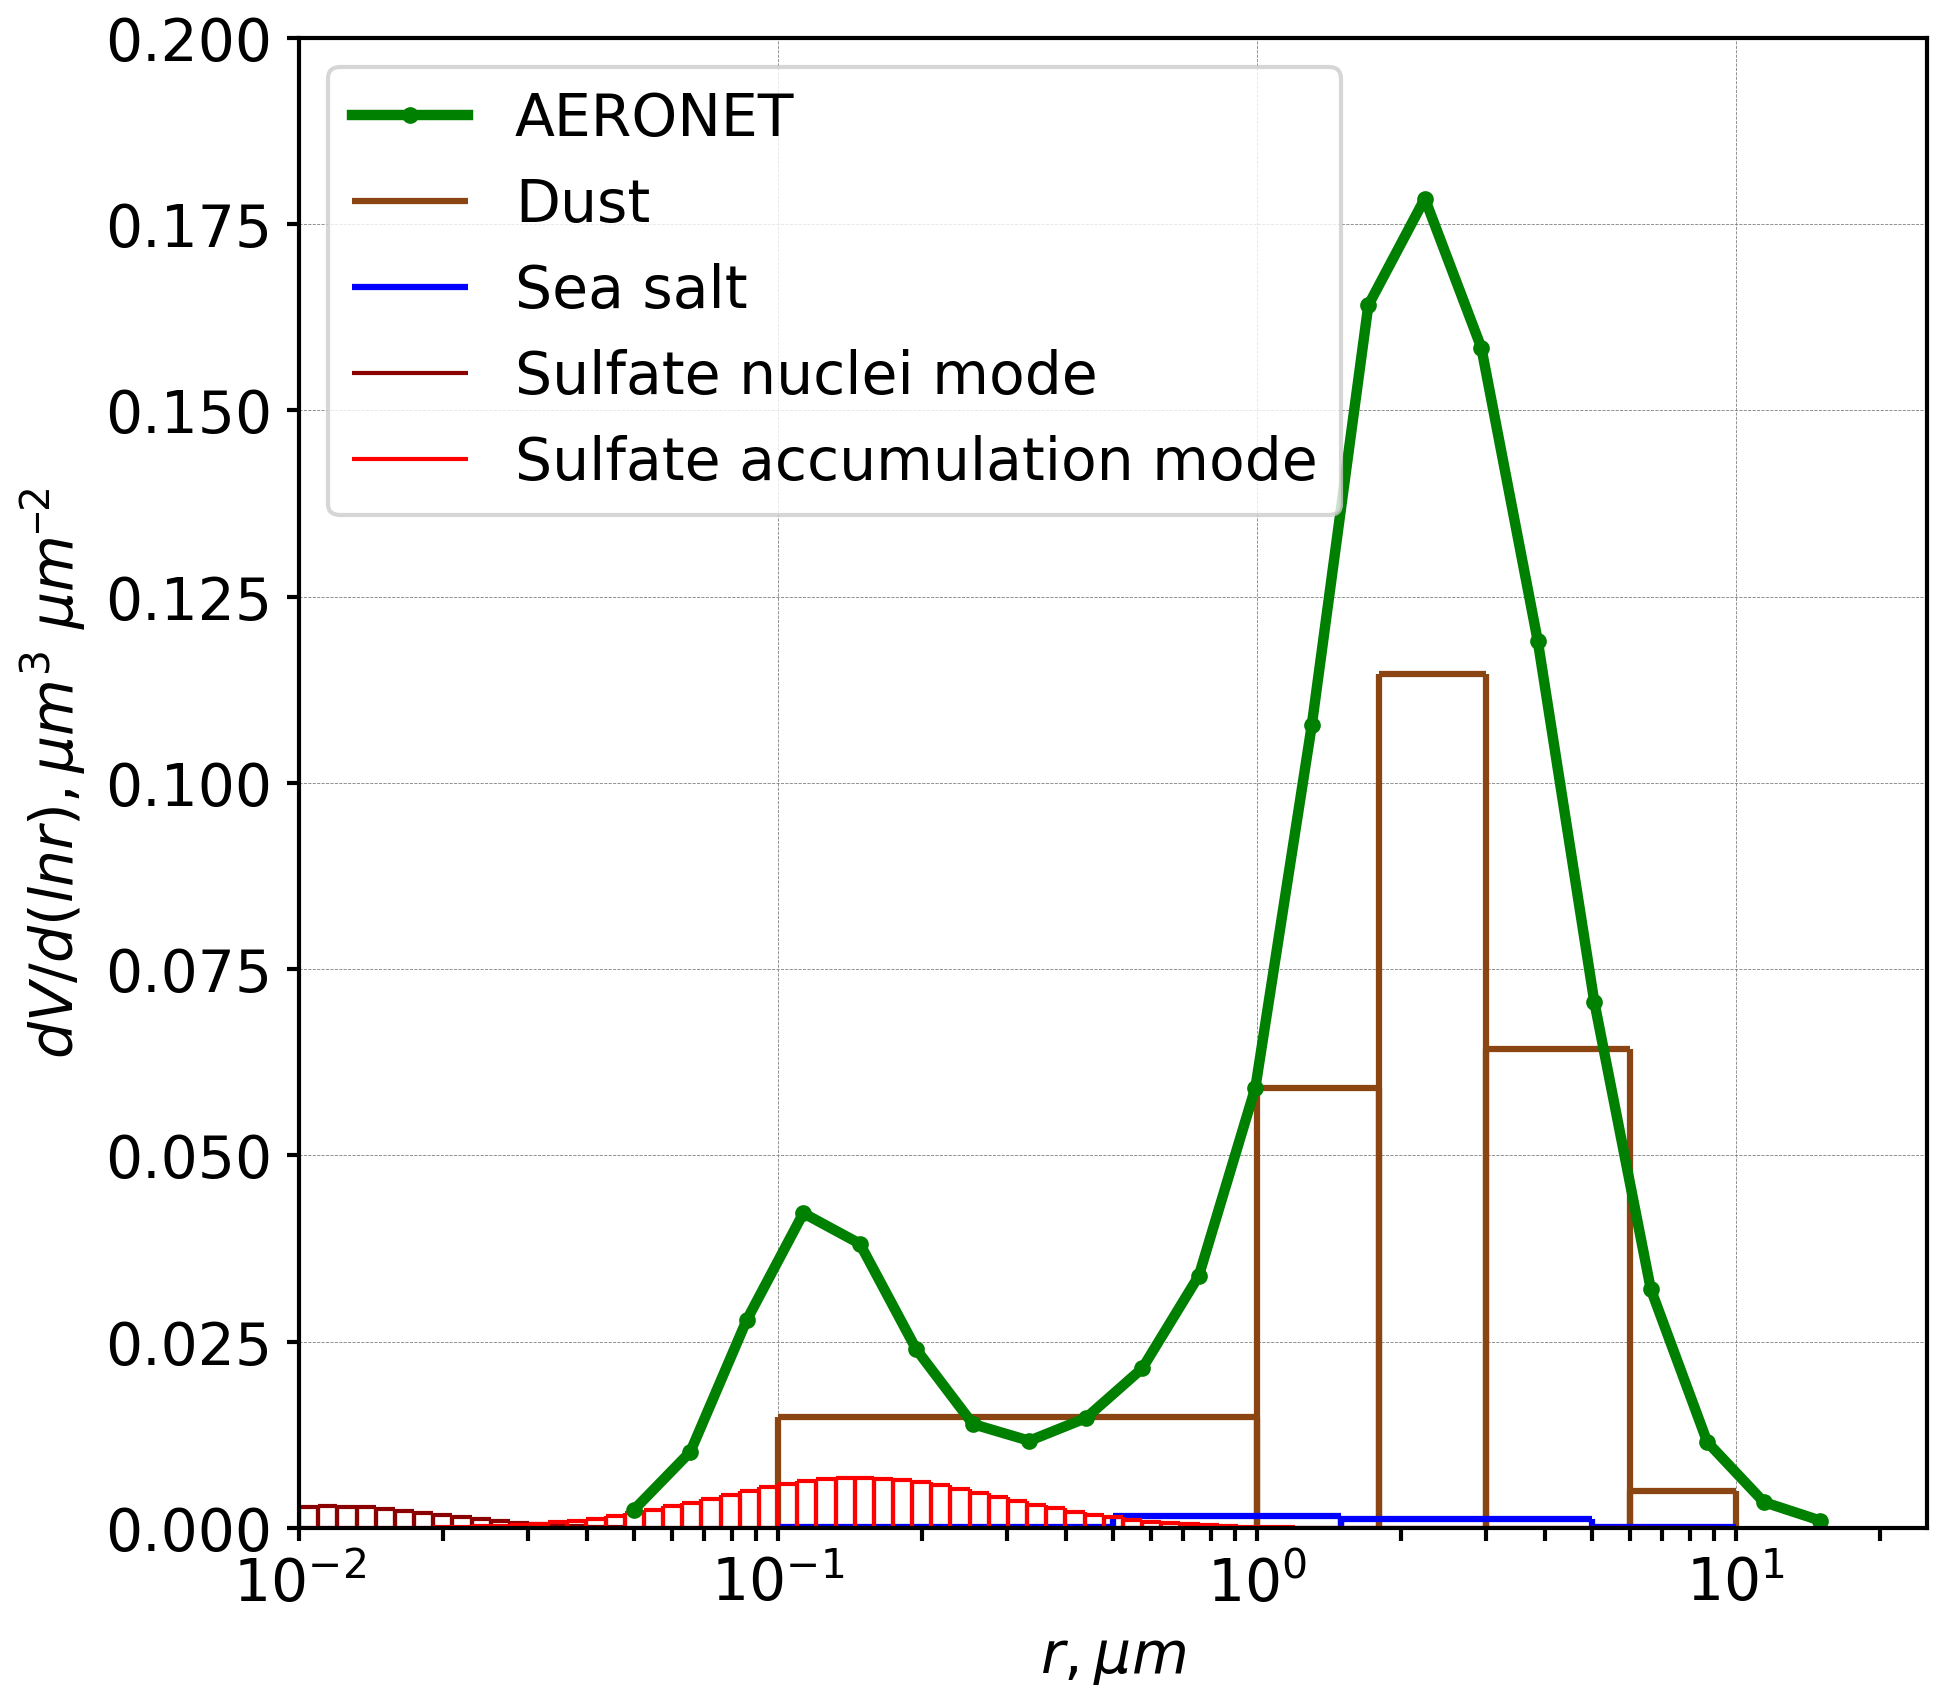
Figure 5Summer (JJA) averaged 2015–2016 AVSD (µm3 µm−2) at the KAUST Campus AERONET site obtained from the AERONET inversion algorithm and from WRF-Chem.
5.2.2 Comparison with AERONET AOD
The comparison of the daily averaged AOD time series and corresponding scatter plots calculated using WRF-Chem, MERRA-2, CAMS-OA, MODIS-DB&DT, and MAIAC data with AERONET AOD observations conducted at KAUST Campus, Mezaira and Sede Boker during the 2015–2016 period is presented in Fig. 6. Because AERONET conducts observations only during the daylight, we interpolated WRF-Chem, MERRA-2, and CAMS-OA AODs to the AERONET measurement times and then conducted time averaging to make simulated and observed AODs consistent. AODs from MODIS-DB&DT and MAIAC are provided as a daily average. Although MODIS routinely provides observations only twice a day during daylight, up to four observations might be collected on some days due to overlap of the TERRA and AQUA orbits at some locations.
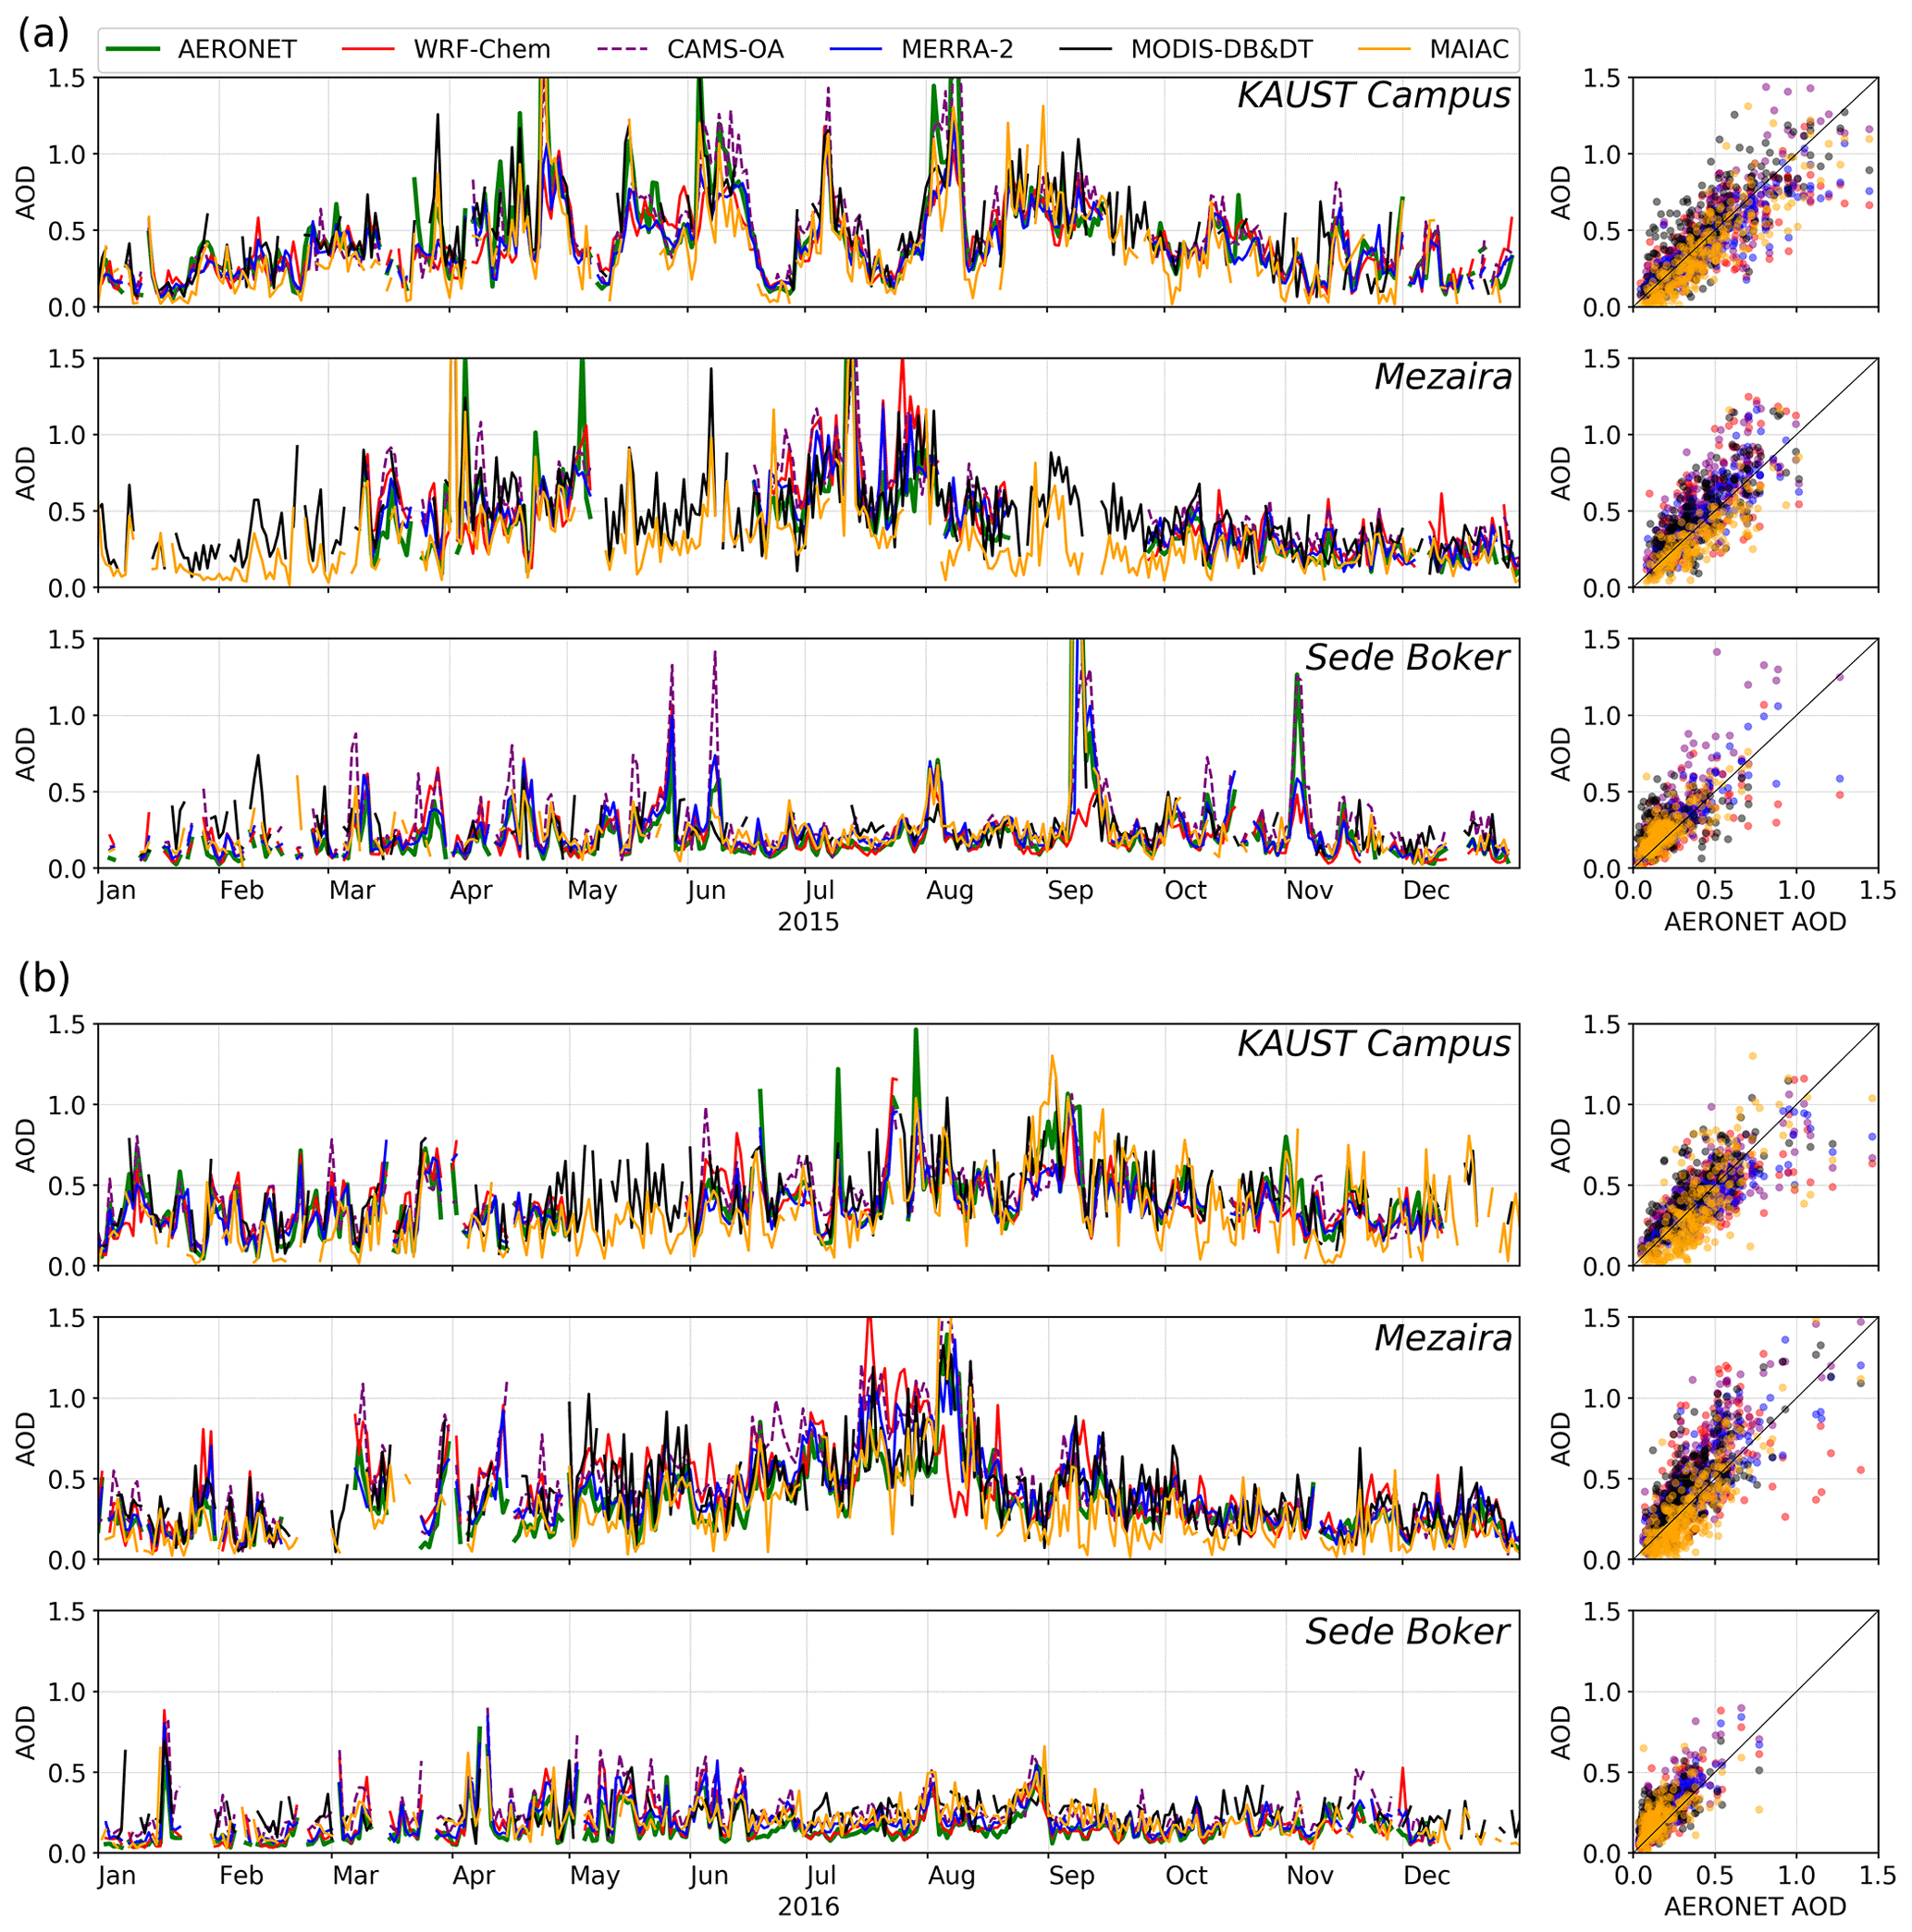
Figure 6Daily averaged AOD at three AERONET sites (KAUST Campus, Mezaira, Sede Boker) and corresponding scatter plots computed for WRF-Chem, AERONET, MERRA-2, CAMS-OA, MODIS-DB&DT, and MAIAC: (a) 2015, (b) 2016.
Table 4Pearson correlation coefficient R and mean bias calculated for daily averaged AOD time series from WRF-Chem, CAMS-OA, MERRA-2, MODIS-DB&DT, and MAIAC with respect to AERONET AOD observations.
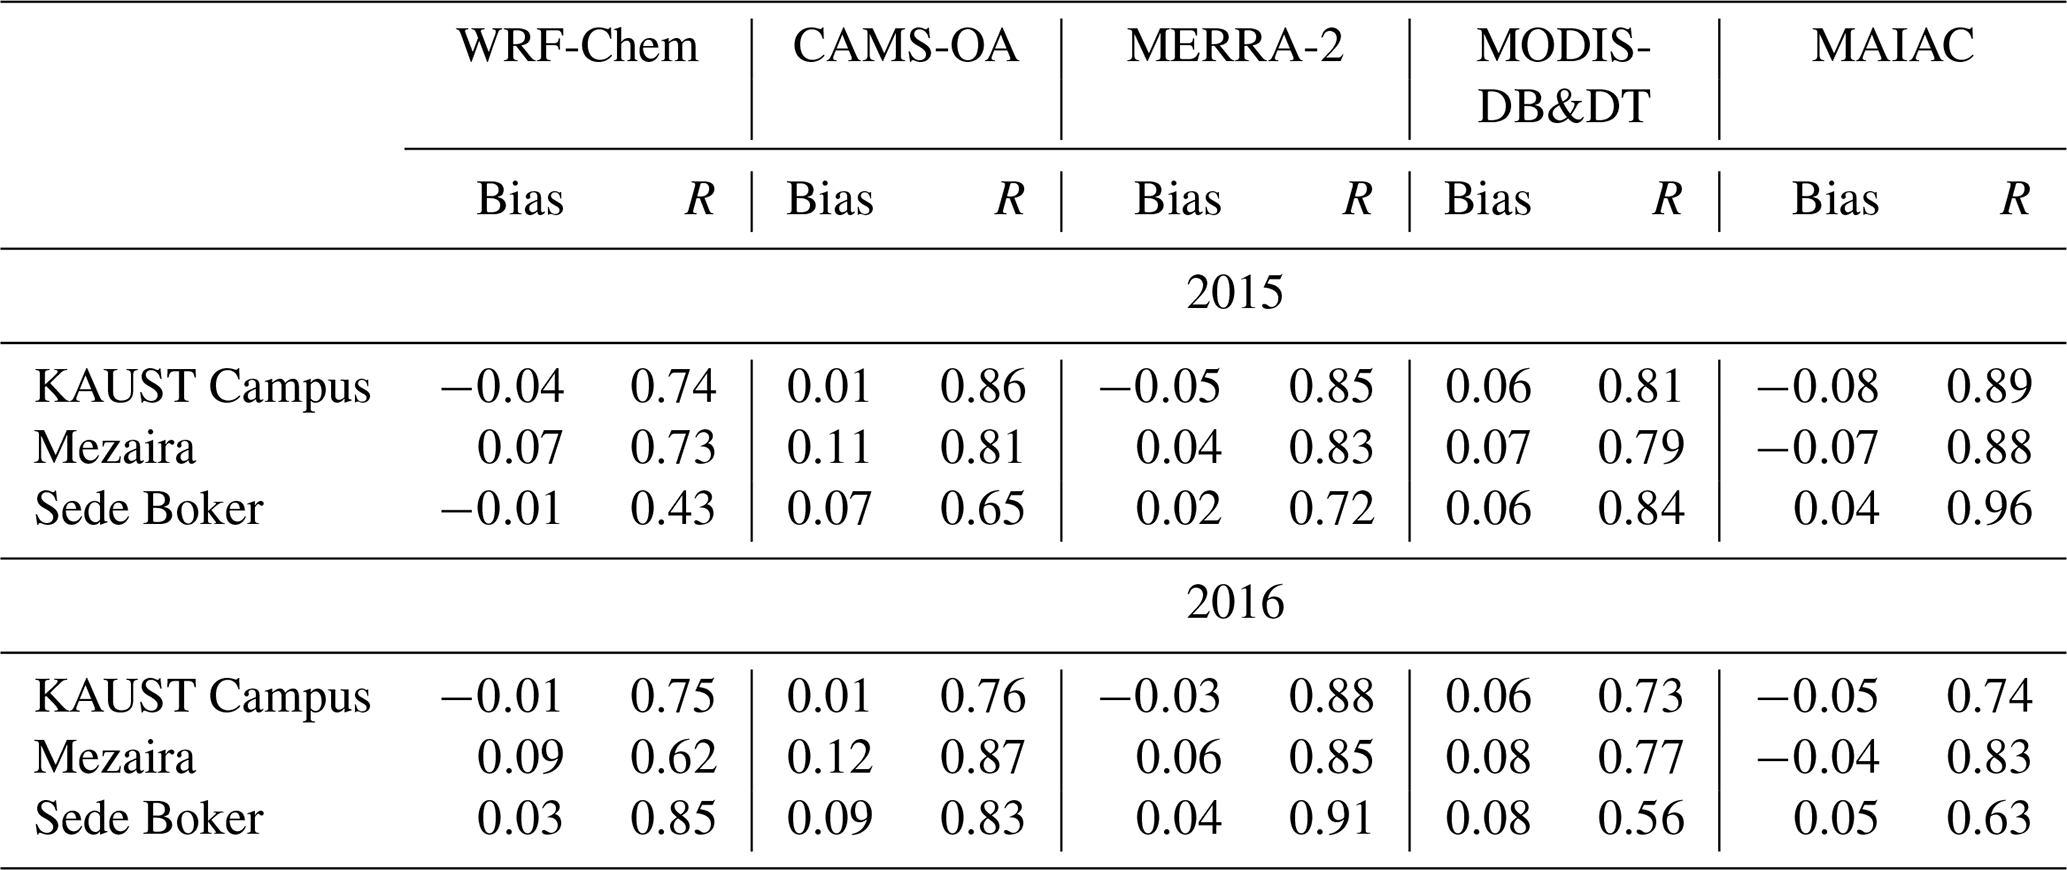
The scatter plots show that the model and assimilation products are capable of reproducing the magnitude and temporal evolution of the observed AERONET AOD at all sites. During both years, KAUST Campus and Mezaira sites show higher AOD in summer and lower AOD in winter. To quantify the capability of the WRF-Chem, MERRA-2, and CAMS-OA models as well as the MODIS-DB&DT and MAIAC products to reproduce the AERONET AOD, we calculate the Pearson correlation coefficient R and mean bias (see Appendix A2) with respect to the AERONET AOD observations for the 2015–2016 period (see Table 4). The correlation coefficients are the highest for MERRA-2 and MAIAC. MAIAC shows better correlation than MERRA-2 during 2015 (0.88–0.96), but MERRA-2 is better correlated with AERONET (0.85–0.91) than MAIAC in 2016. CAMS-OA, despite the fact that it does not assimilate AERONET, shows better correlations (0.65–0.87) than MODIS-DB&DT (0.56–0.84). However, CAMS-OA overestimates AOD, particularly during acute dust events, and has a relatively high positive mean bias. The R coefficient for the WRF-Chem AOD is 0.43–0.85. MERRA-2 and WRF-Chem have the lowest mean bias in comparison with the other models and products. MODIS-DB&DT mean bias is positive in 2015 and 2016, while MAIAC mean bias is negative for KAUST Campus and Mezaira and positive for Sede Boker during both years.
We have to mention here that the satellite retrievals and MERRA-2 use AERONET observations for calibration. WRF-Chem is tuned to reduce the annual mean bias with respect to AERONET observations. CAMS-OA does not assimilate AERONET AODs. In WRF-Chem, we did not tune the temporal correlation between the model and AERONET AOD. In this sense, the correlation coefficient between WRF-Chem and AERONET AOD provides an independent evaluation of the model performance (see Table 4). It is expected that the temporal correlation for the assimilation products and satellite retrievals will be higher than for the free-running WRF-Chem.
5.2.3 Comparison of spatial AOD distributions
We also examine how well MERRA-2, CAMS-OA, MAIAC, and WRF-Chem reproduce spatial patterns and seasonal variability of the AOD in comparison with the conventional MODIS-DB&DT retrievals. The seasonally and annually averaged 2015–2016 AOD fields from WRF-Chem, CAMS-OA, MERRA-2, and the two MODIS retrievals DB&DT and MAIAC are presented in Fig. 7. The seasonally averaged AODs from WRF-Chem, MERRA-2, and CAMS-OA are shown at their original spatial resolution and were calculated using only daytime (06:00–14:00 UTC or 09:00–17:00 LT) output. The AODs were sampled under all-sky conditions, which in the ME does not make much of a difference as cloud fraction is low. For statistical comparison, we interpolated AOD fields (preserving the area's average AODs) on the MERRA-2 grid and calculated the Pearson correlation coefficient R root mean square error RMSE and mean bias with respect to MODIS-DB&DT AOD (see Table 5). When conducting statistical analysis, the grid cells with undefined pixels in MODIS-DB&DT and MAIAC retrievals were excluded.
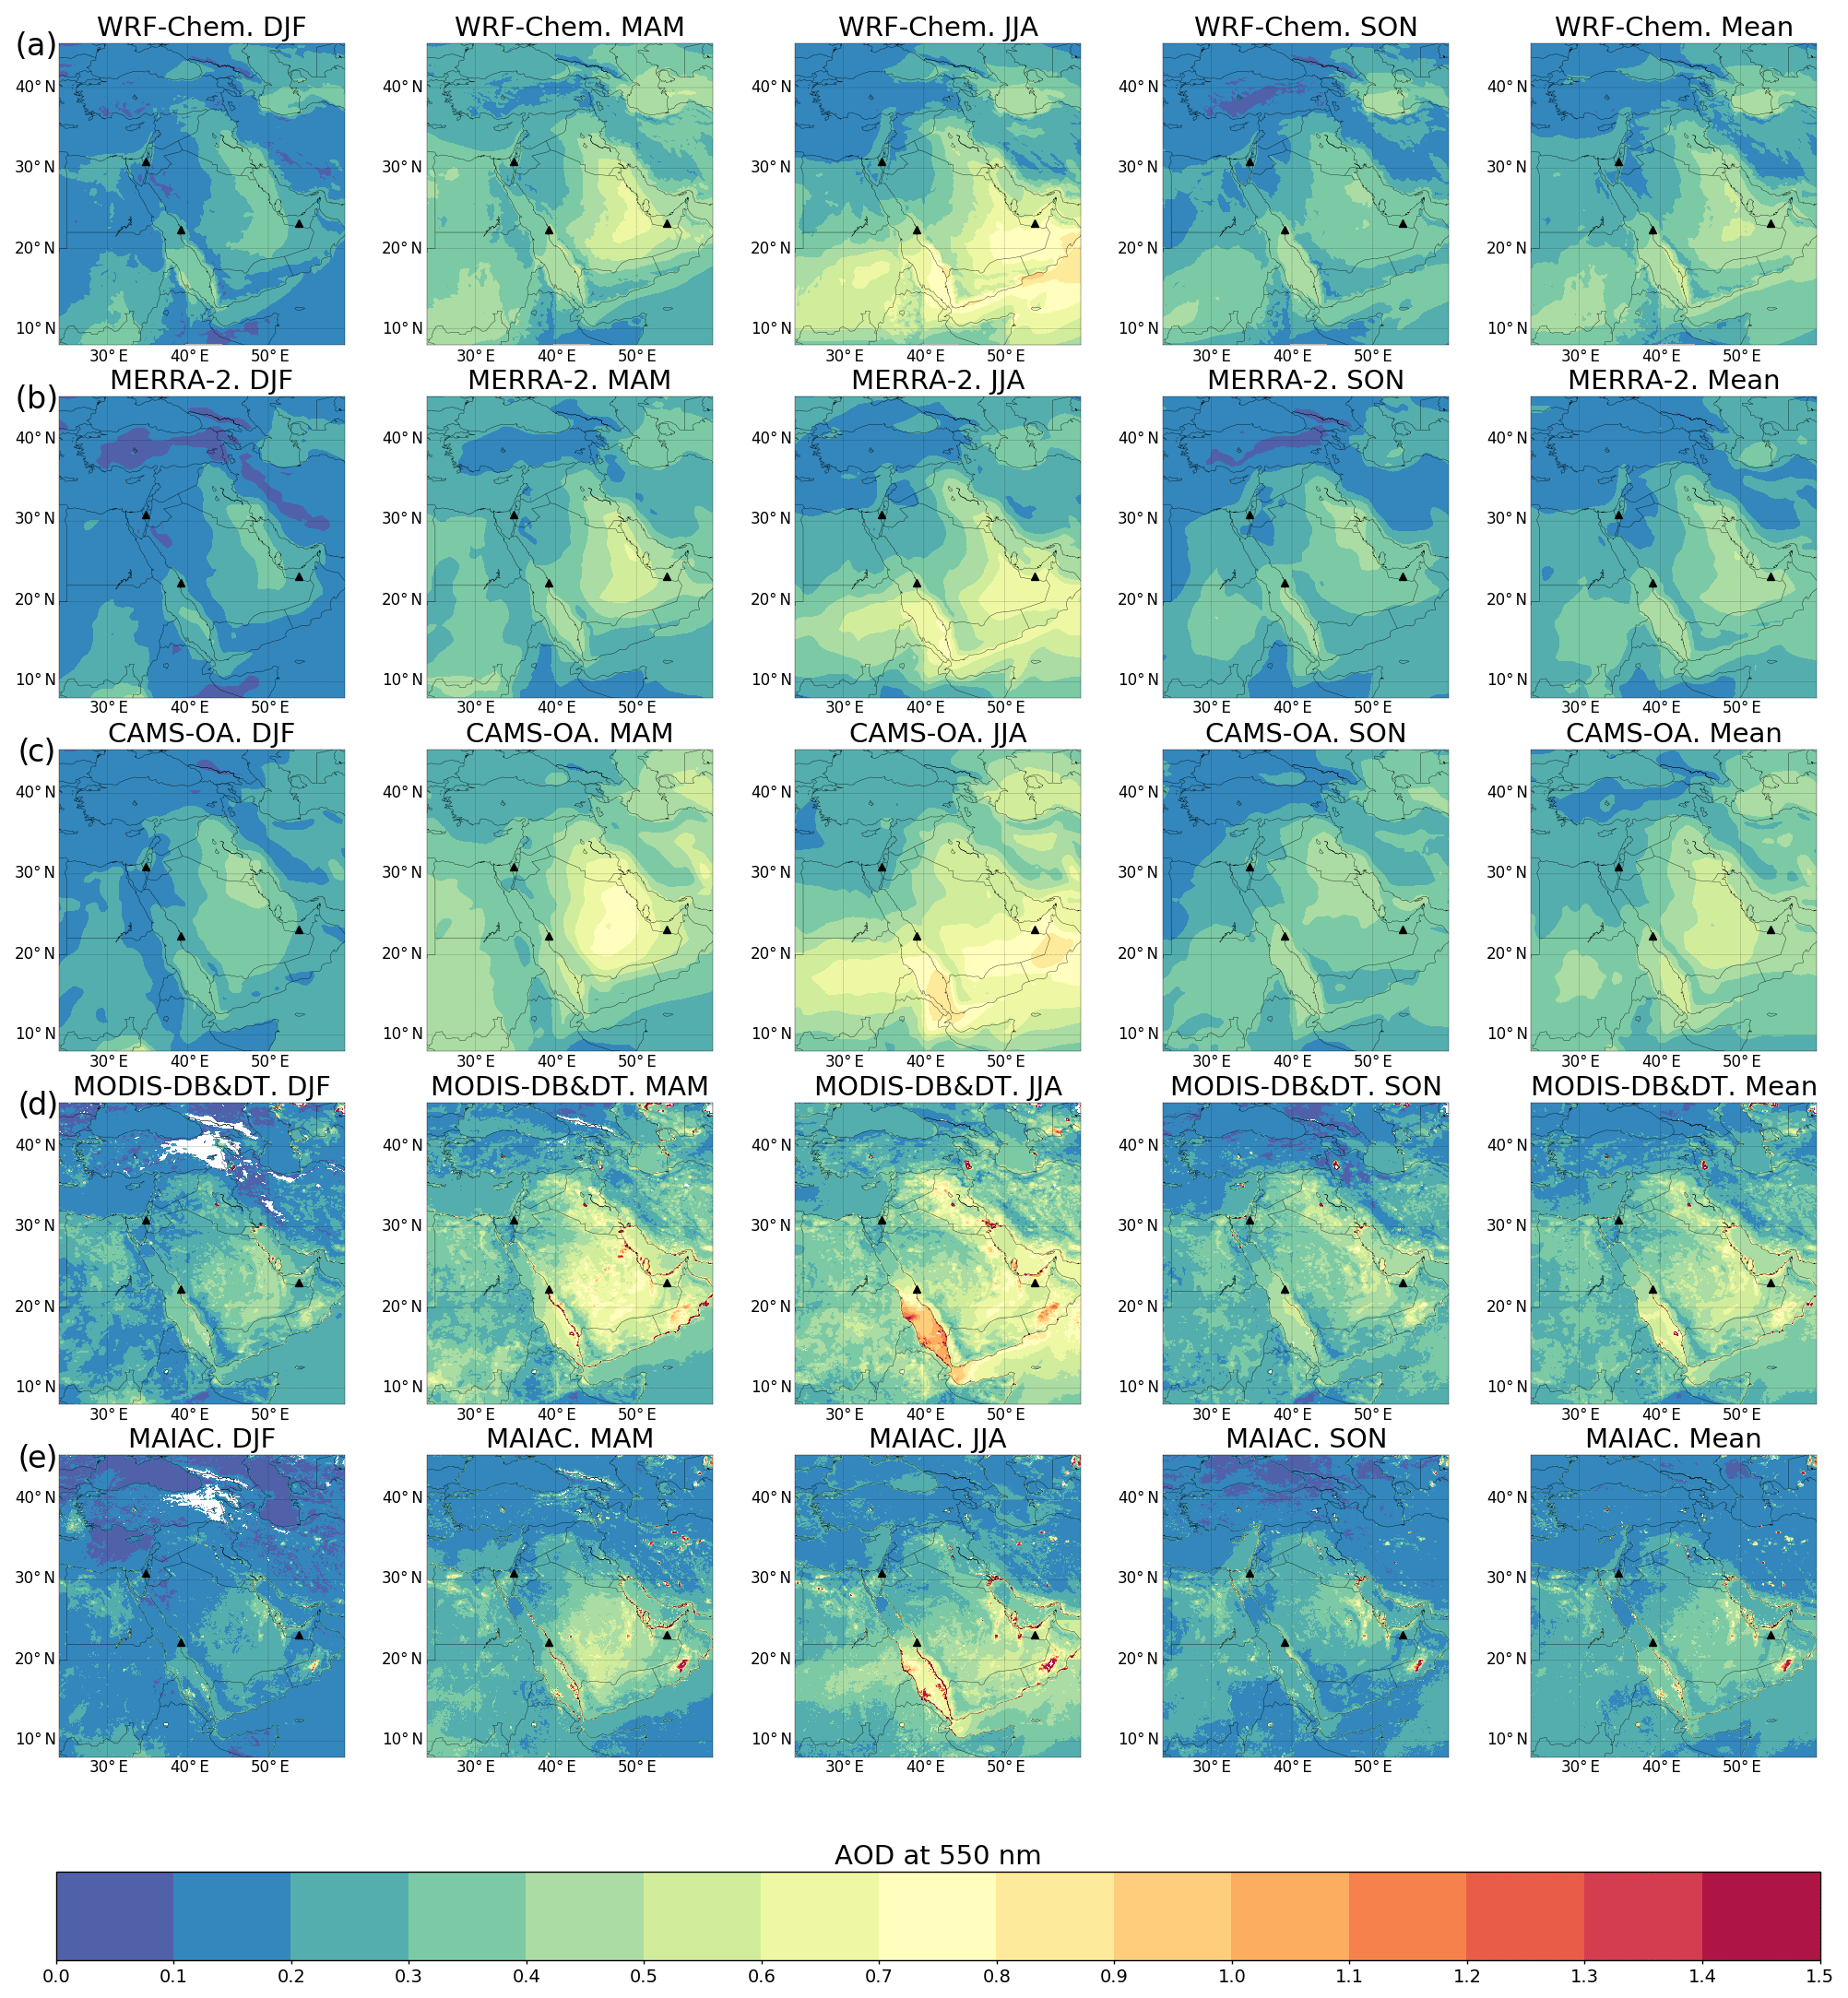
Figure 7Seasonally averaged 2015–2016 AOD. The right column is annual mean AOD. Rows: (a) WRF-Chem, (b) MERRA-2, (c) CAMS-OA, (d) MODIS-DB&DT, and (e) MAIAC. Winter (DJF), spring (MAM), summer (JJA), and autumn (SON). White dots are undefined pixels. Black triangles denote locations of the KAUST Campus, Mezaira, and Sede Boker AERONET stations.
Table 5Pearson correlation coefficient (R), root mean square error (RMSE), and mean bias calculated for seasonally and annually averaged 2015–2016 AOD geographic distributions from CAMS-OA, MAIAC, MERRA-2, and WRF-Chem with respect to MODIS-DB&DT AOD.
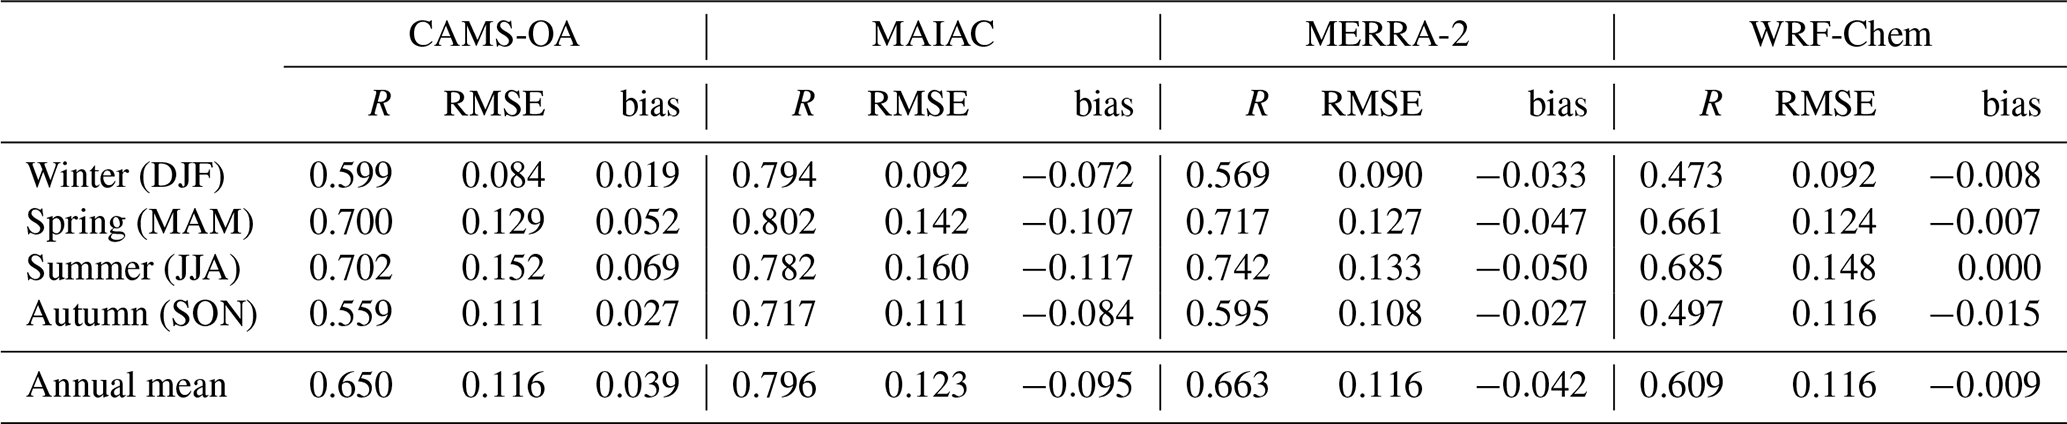
The statistical scores provided in Table 5 show that the annual mean AOD from MAIAC has the highest correlation (R=0.796) but also the highest RMSE (0.123) and the biggest bias (−0.095) with respect to MODIS-DB&DT AOD. MERRA-2 annual mean AOD has R=0.663 with respect to MODIS-DB&DT AOD, CAMS-OA has R=0.650), and WRF-Chem has R=0.609 with RMSEs of 0.116 for all of them. WRF-Chem, MERRA-2, and CAMS-OA demonstrate similar AOD patterns, but WRF-Chem and MERRA-2 underestimate and CAMS-OA overestimates MODIS-DB&DT AOD during all seasons, with annual mean biases of , −0.042, and 0.039, respectively. MAIAC underestimates AOD in comparison with MODIS-DB&DT, which is consistent with the MAIAC and MODIS-DB&DT AOD comparison with AERONET AOD (see Table 4 and Fig. 6).
Based on the comparison of WRF-Chem AOD with the AOD from MODIS and AERONET observations, we conclude that spatial and temporal WRF-Chem's AOD distribution is in good agreement with the available satellite and ground-based observations, i.e., annual mean correlation R exceeds 0.6 (see Table 5), and correlation with AERONET is 0.43–0.85 (see Table 4).
5.3 PM air pollution
To test the ability of the data assimilation products and models to characterize PM air pollution in the ME, we compare surface daily mean PM2.5 and PM10 concentrations from WRF-Chem, MERRA-2, and CAMS-OA with daily averaged measurements conducted by the three AQMSs (see Figs. 8 and 9). The AQMSs are installed in Jeddah, Riyadh, and Dammam (Fig. 1), the Saudi Arabian megacities. PM measurements conducted by MODON (see Sect. 2.3) are available starting from 2016. The modeled PM2.5 and PM10 concentrations were sampled from the model fields at the exact AQMS locations. The following formulas were used to calculate PM2.5 and PM10 surface concentrations using WRF-Chem and MERRA-2 output:
where , , OC1,2, BC1,2, and sulfate are respectively the concentrations of the dust and sea salt in the first four bins, organic and black carbon (hydrophobic and hydrophilic), and sulfate ion (). As was mentioned in Sect. 4.1, SEAS1 is not present in the WRF-Chem output. So for WRF-Chem we assume SEAS1=0. The factor OCmfac=1.8 accounts for the conversion of organic carbon into organic matter.
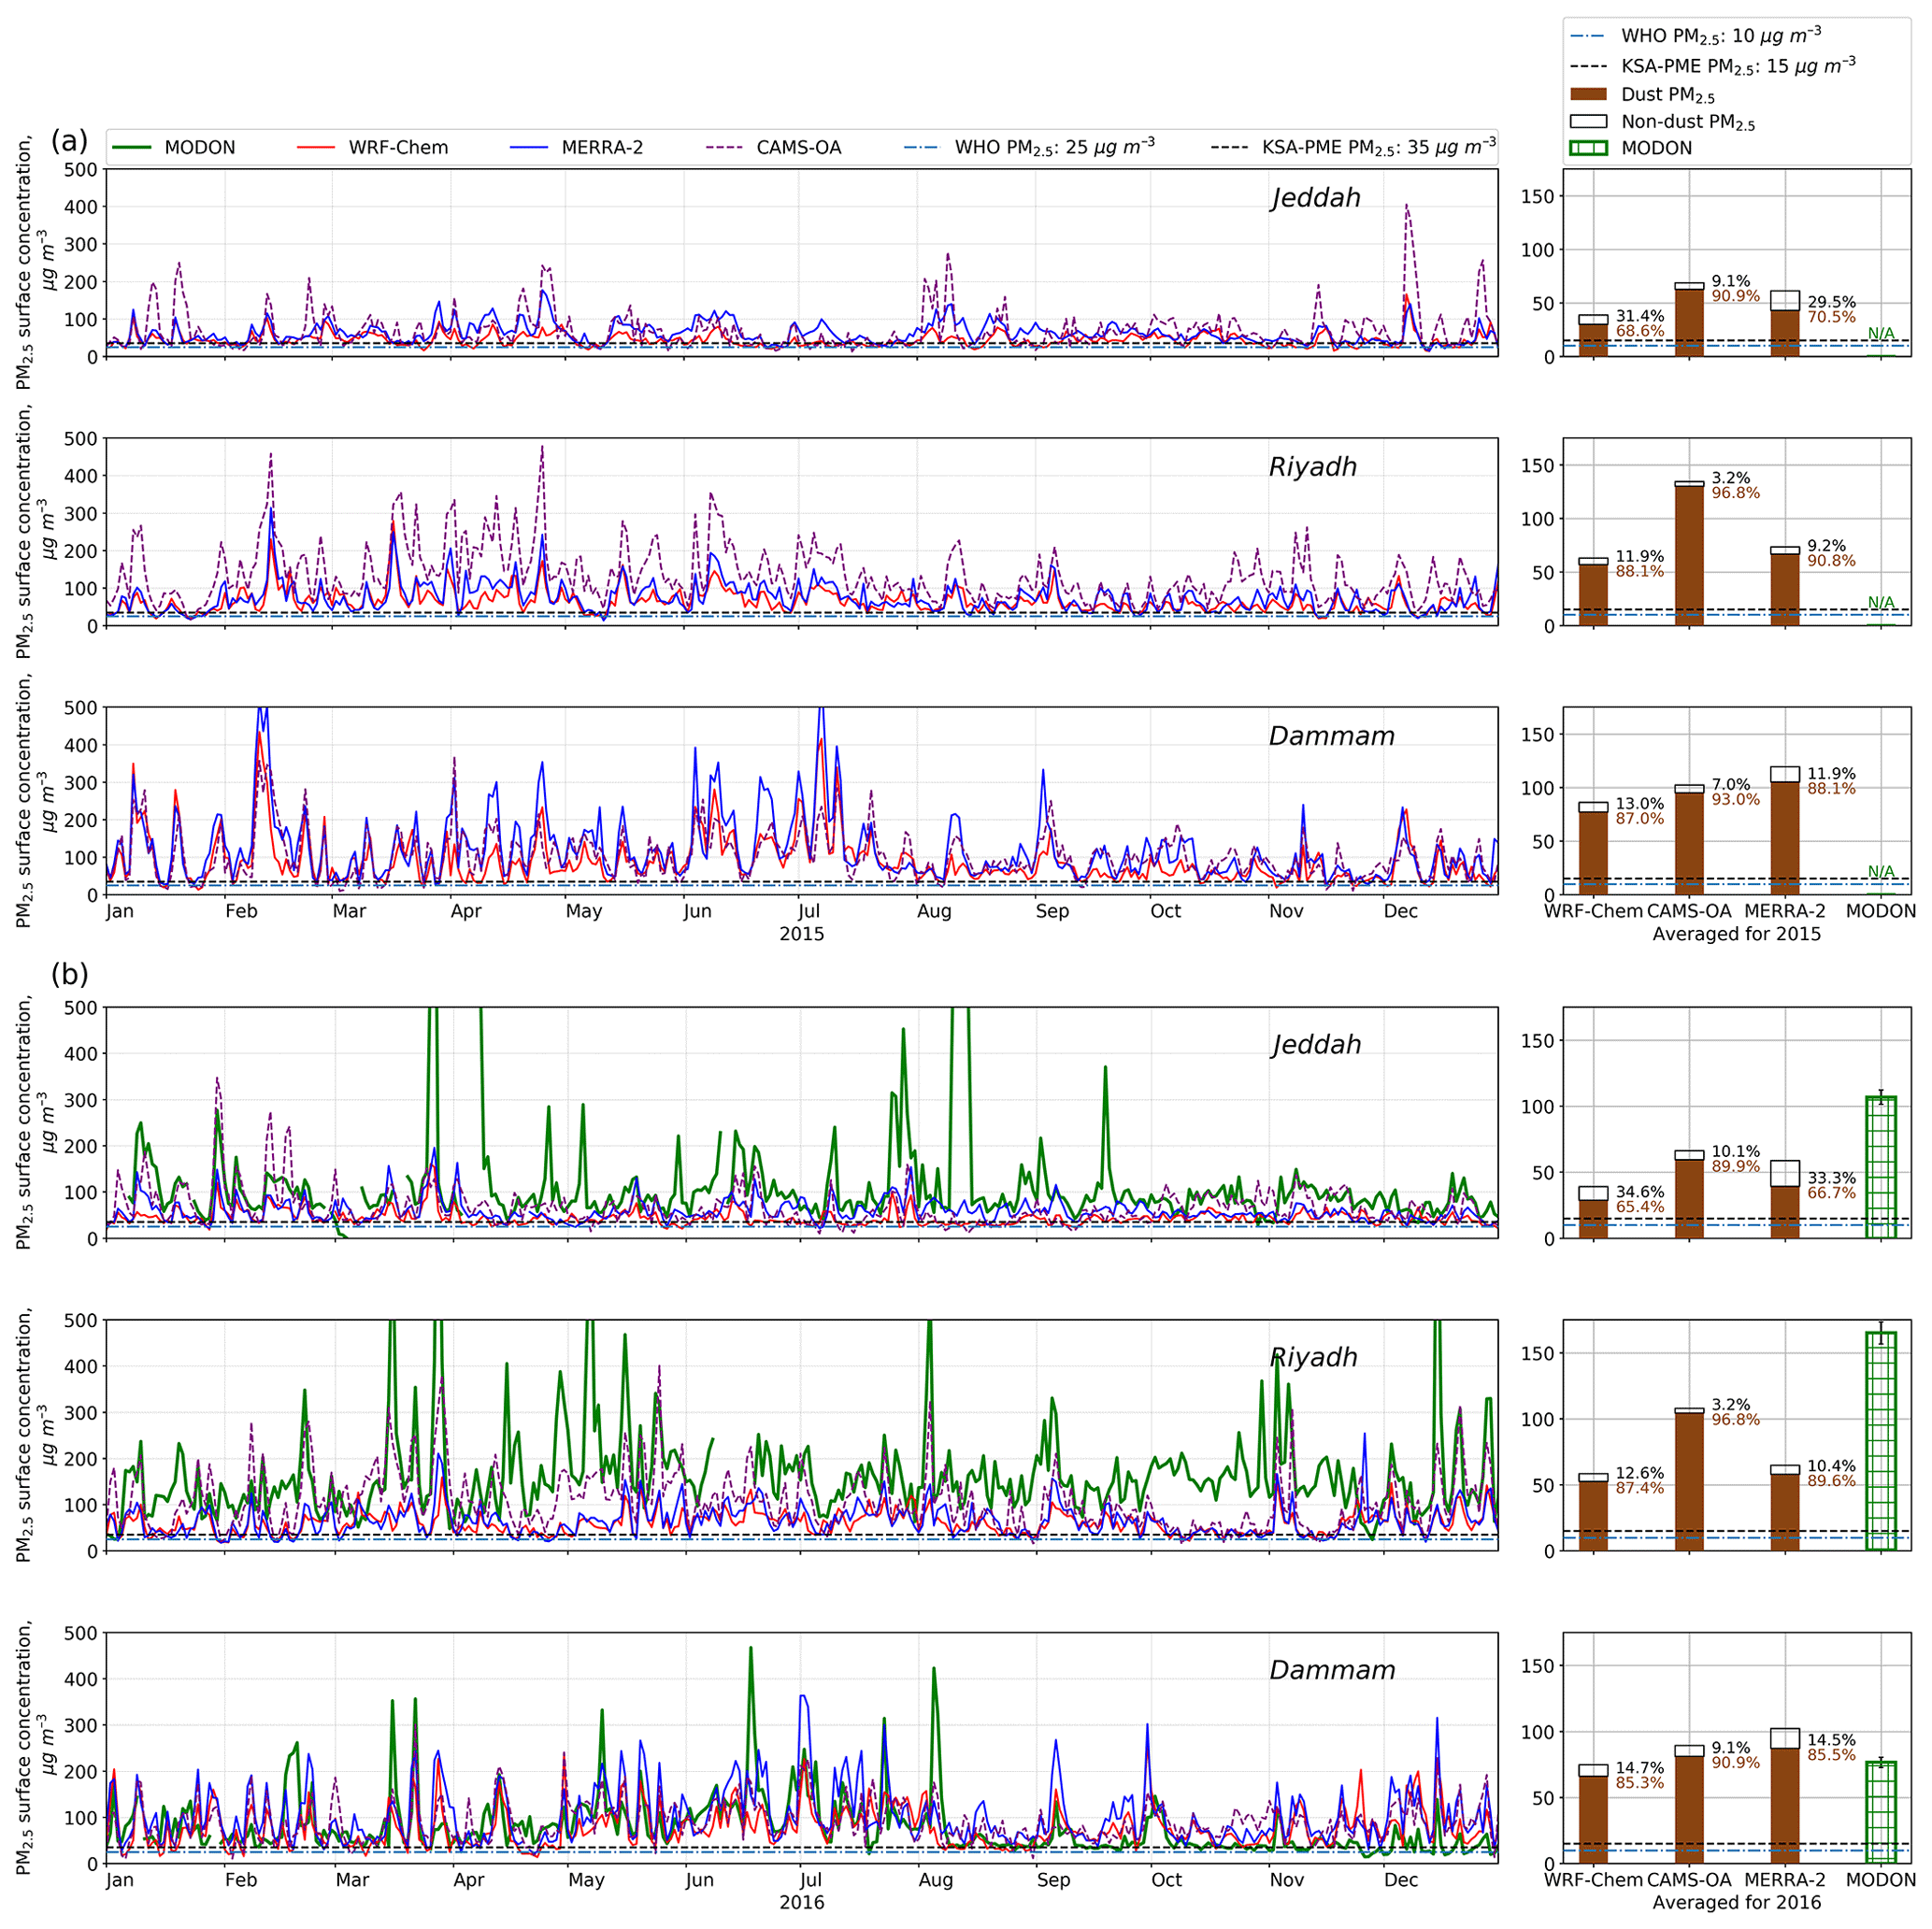
Figure 8Left: WRF-Chem daily averaged PM2.5 surface concentrations (µg m−3) with MODON observations, MERRA-2, and CAMS-OA at Jeddah, Riyadh, and Dammam. The dash-dotted line corresponds to the 25 µg m−3 WHO daily average guideline. Right: stacked bars show the decomposition of the PM2.5 annual mean surface concentrations into dust and nondust components. The dash-dotted line corresponds to the 10 µg m−3 WHO annual guideline. Numbers on the right-hand side of the WRF-Chem, CAMS-OA, and MERRA-2 bars show the contribution (%) of the dust and nondust components to the total PM2.5 concentration. (a) 2015, (b) 2016.
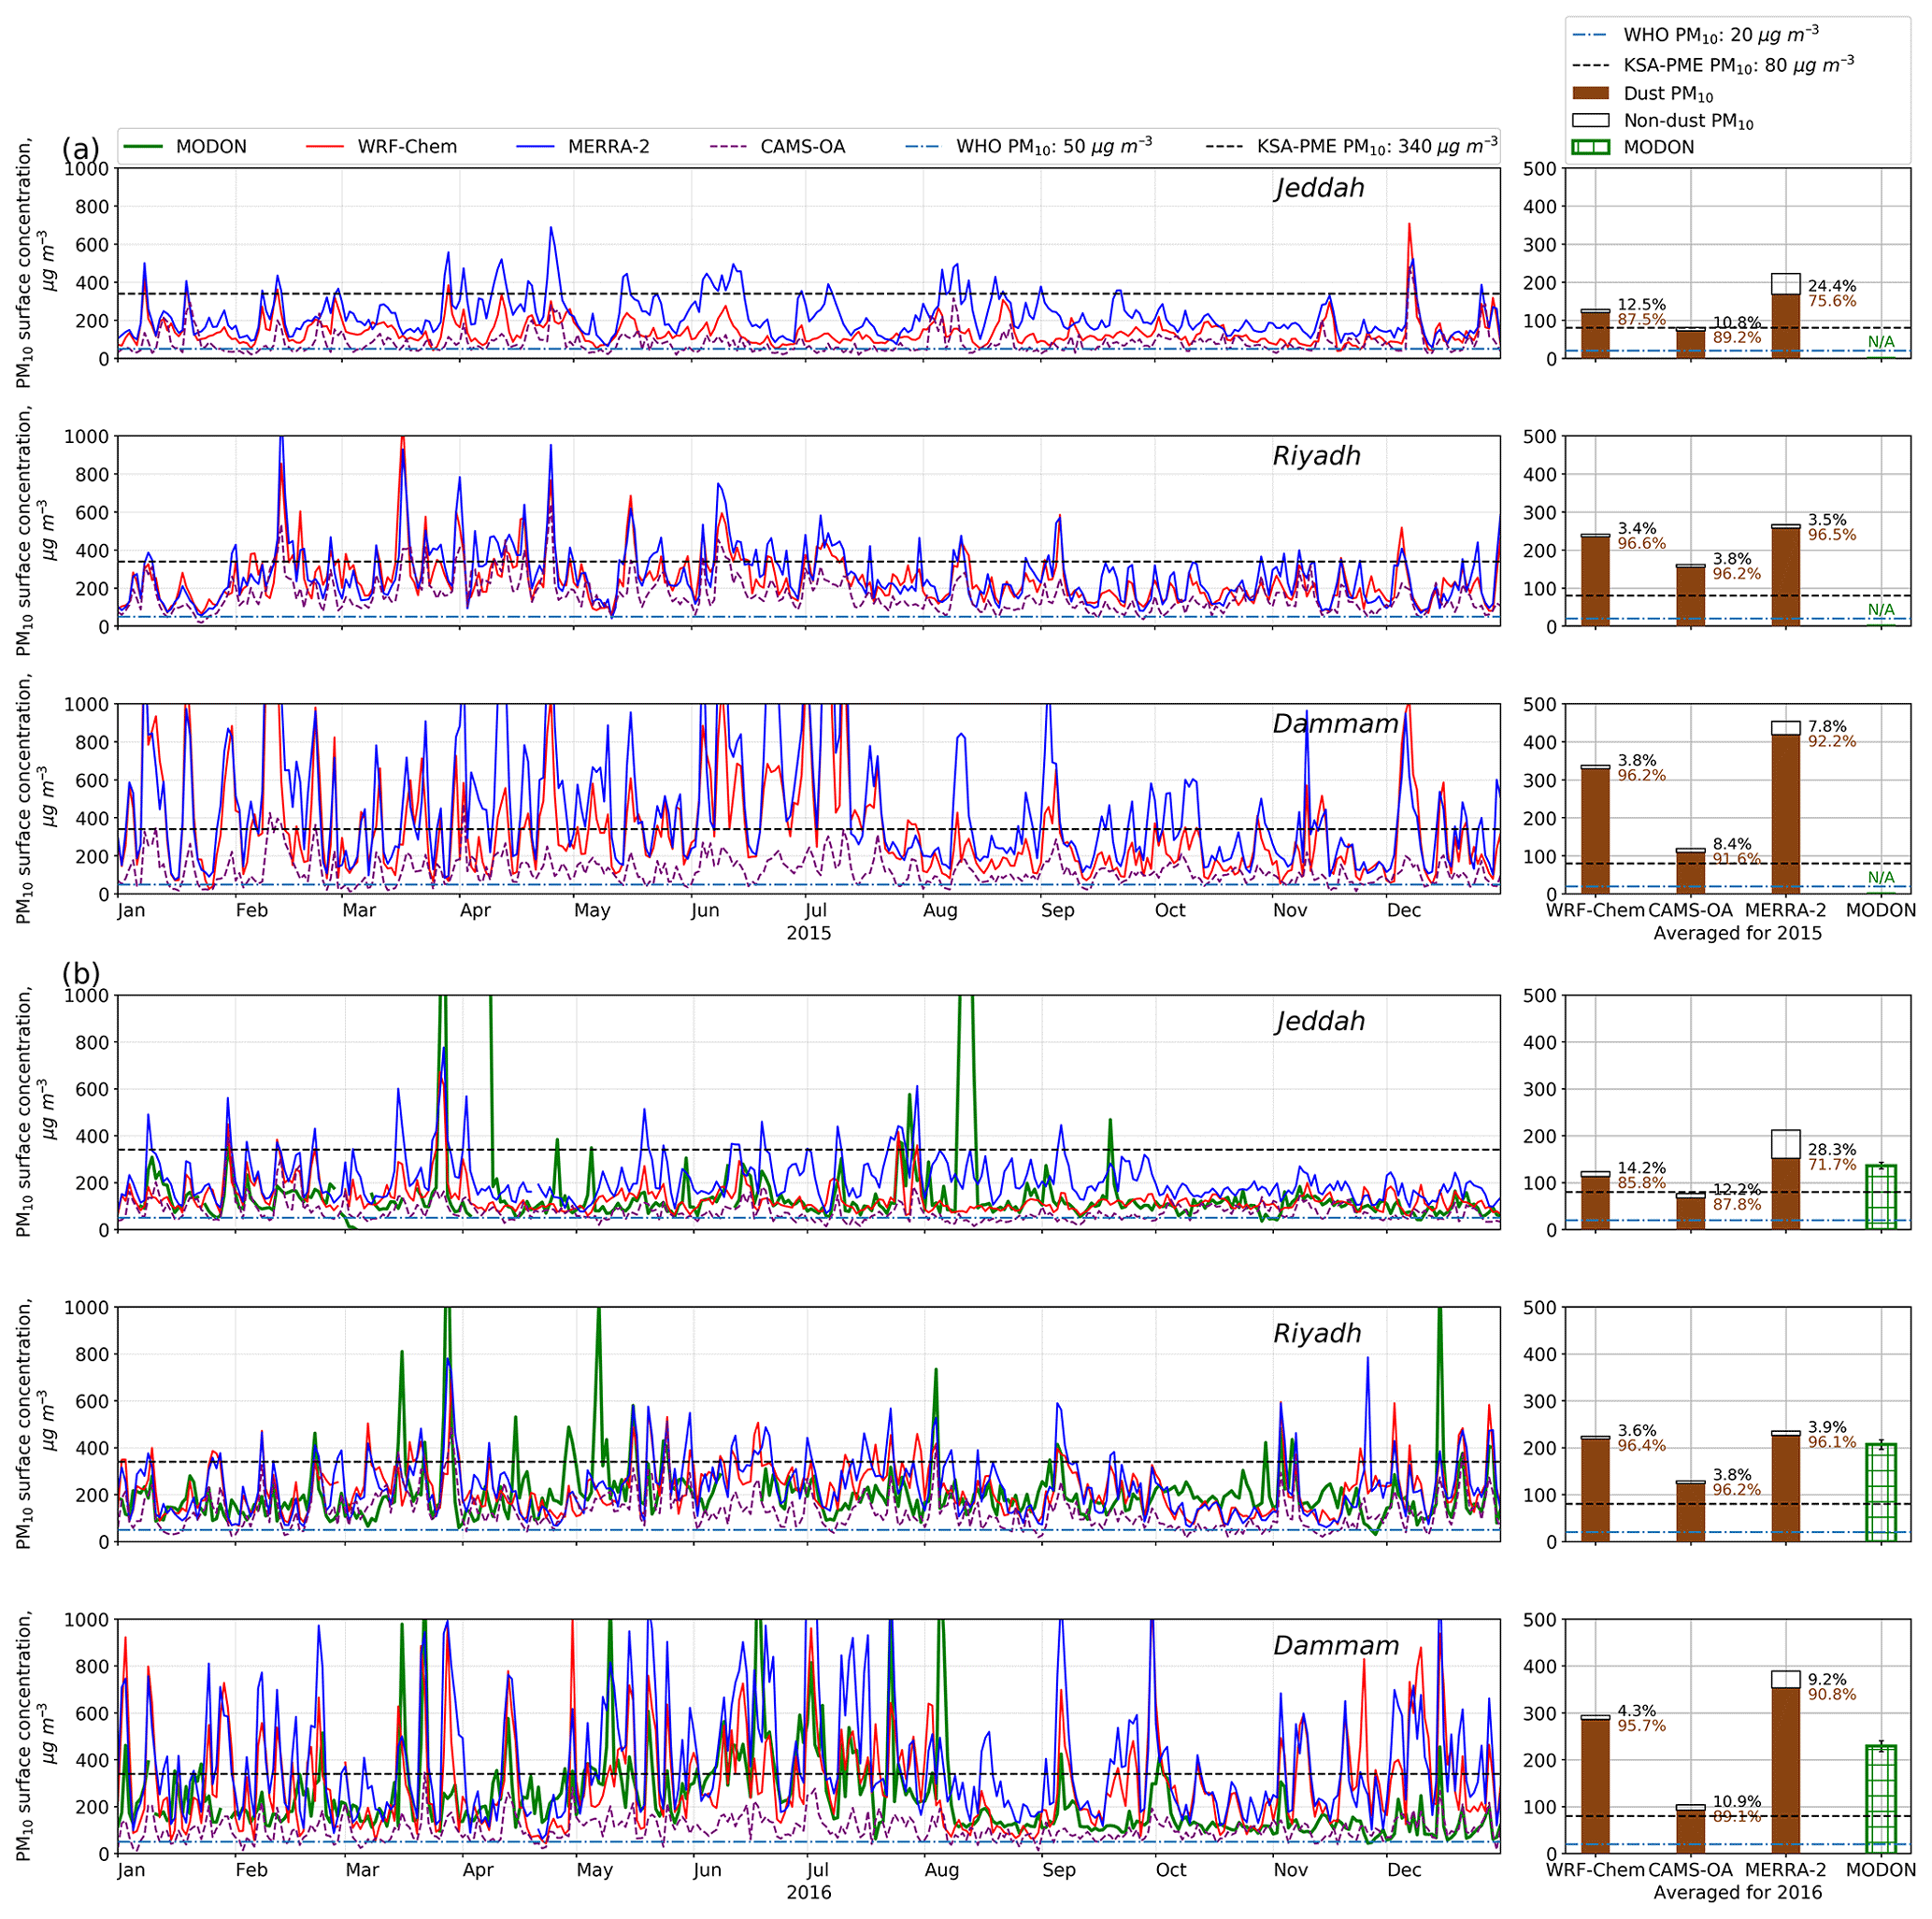
Figure 9Left: WRF-Chem daily averaged PM10 surface concentrations (µg m−3) with the MODON observations as well as MERRA-2 and CAMS-OA at Jeddah, Riyadh, and Dammam. The dash-dotted line corresponds to the 50 µg m−3 WHO daily guideline. Right: stacked bars show the decomposition of the PM10 annual mean surface concentrations into dust and nondust components. The dash-dotted line corresponds to the 20 µg m−3 WHO annual guideline. Numbers on the right-hand side of the WRF-Chem, CAMS-OA, and MERRA-2 bars show the contribution (%) of the dust and nondust components to the total PM10 concentration. (a) 2015, (b) 2016.
CAMS-OA PM2.5 and PM10 were calculated using the following relations (https://confluence.ecmwf.int/display/CUSF/PM10+and+PM25+global+products, last access: 5 January 2020):
where , SS1,2, sulfate, BC1,2, and OM1,2 are surface concentrations of dust in three bins, sea salt in two bins, sulfate, black carbon, and organic matter (hydrophobic and hydrophilic). The size ranges of dust and sea salt bins from CAMS-OA are presented in Table 2.
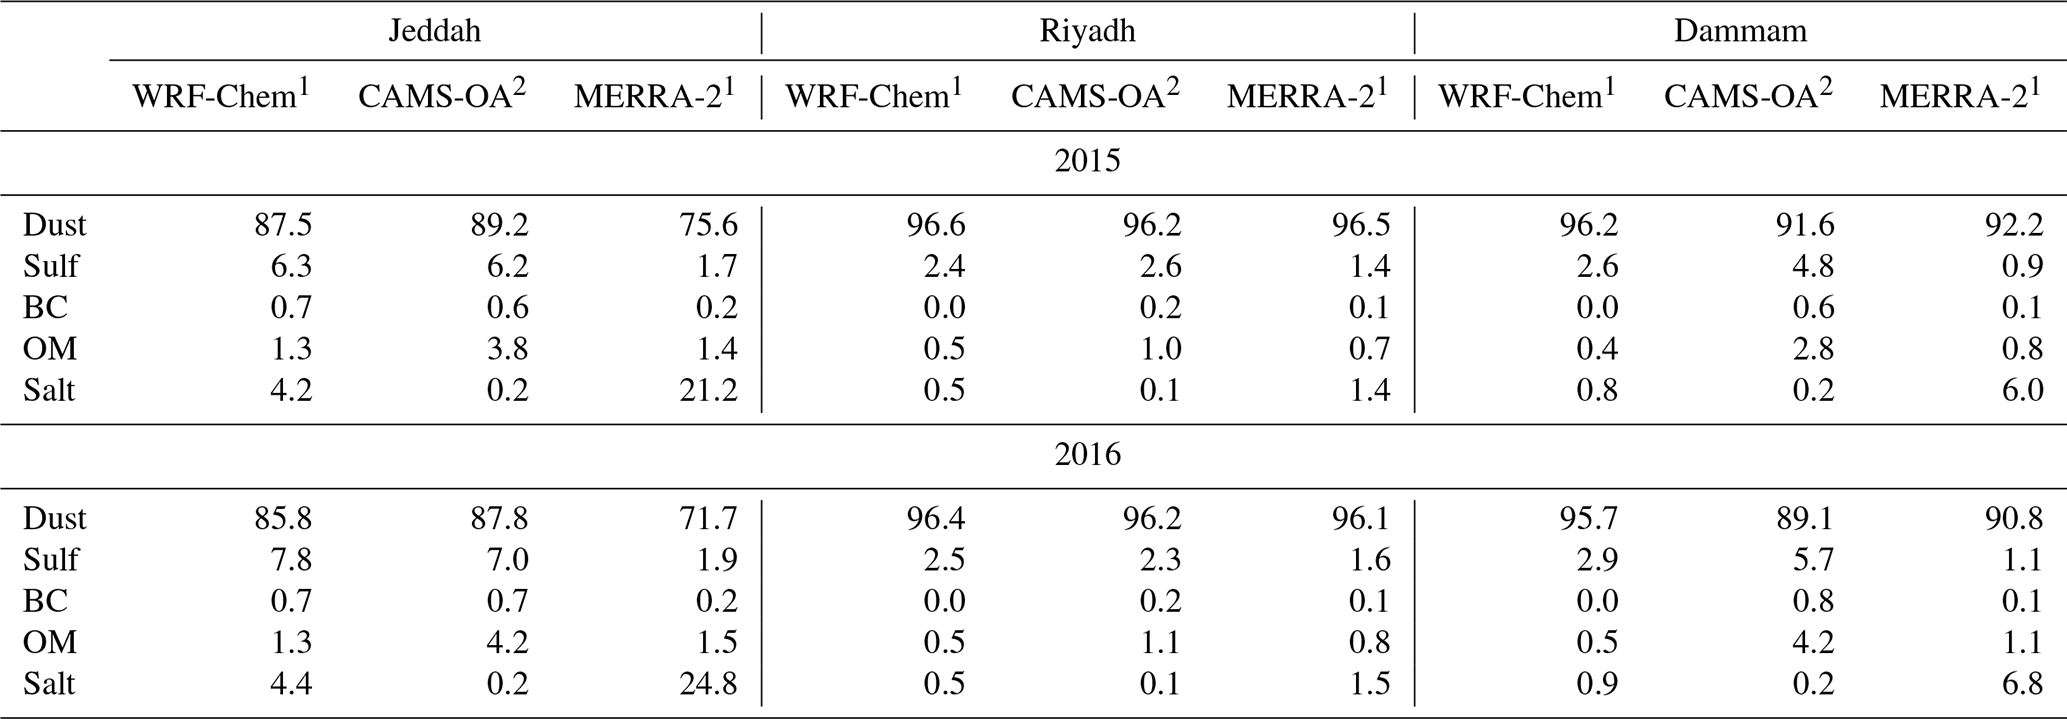
Table 6Contributions (%) of dust and nondust components to PM2.5 for Jeddah, Riyadh, and Dammam during 2015–2016.
1 For WRF-Chem and MERRA-2: , , sulf=sulfate, , .
2 For
CAMS-OA: , , , ), .
Abbreviations of the aerosols' names correspond to those given in Sect. 5.3.
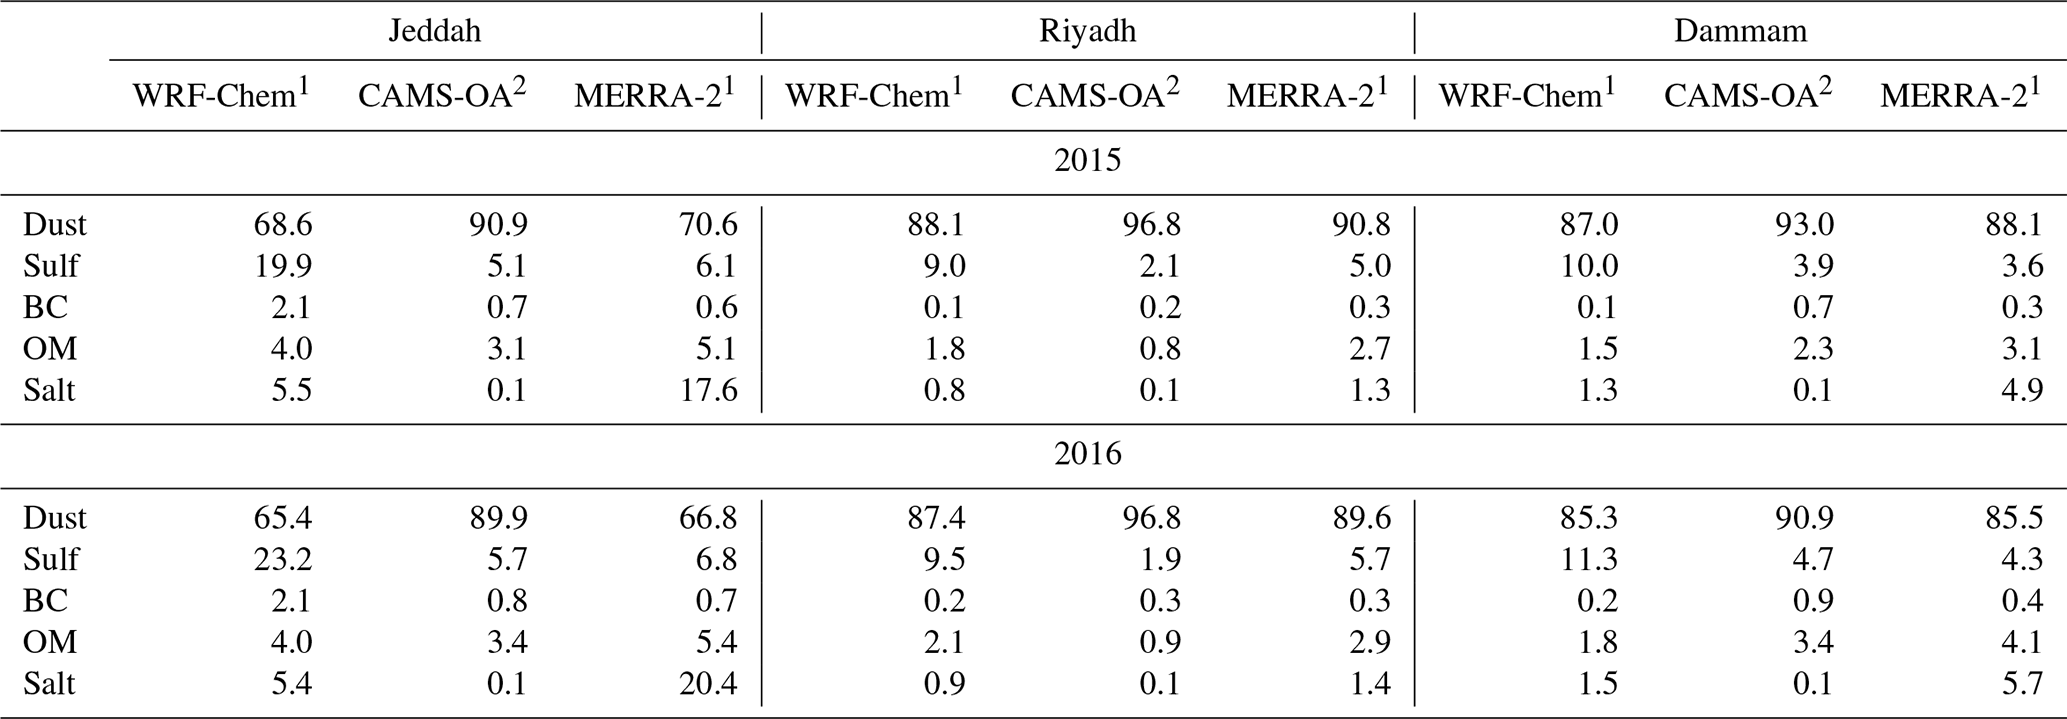
Table 7Contributions (%) of dust and nondust components to PM10 for Jeddah, Riyadh, and Dammam during 2015–2016.
1 For WRF-Chem and MERRA-2: , sulf=sulfate, , ,
+SS4.
2 For CAMS-OA: , Sulf=sulfate, , , .
Abbreviations of the aerosols' names correspond to those given in Sect. 5.3.
The histograms in the right-side panels in Figs. 8 and 9 show the annual mean PM concentrations from WRF-Chem, MERRA-2, and CAMS-OA split into the dust and nondust components. The dashed and dash-dotted horizontal lines correspond to KSA-PME limits and WHO air quality guidelines for daily (in the left-side panels) and annual mean (in the right-side panels) PM concentrations. We also calculated the separate contributions of sulfate, sea salt, organic matter, and black carbon to the nondust PM2.5 and PM10 (see Tables 6 and 7, respectively).
The sporadic peaks in the observations, which are not captured by the model and assimilation products, are due to unaccounted factors, such as nearby traffic, construction work, and local anthropogenic or natural emissions, which are not present in the emission inventories, or they are due to meteorological fluctuations that are not resolved in the models. Talking about extreme dust pollution cases, we analyzed dust surface concentrations using WRF-Chem output during the dust storm that took place in the Jeddah region on 8 July 2016. The calculated surface concentrations in all dust bins at the peak of the storm were 55, 58, 63, 111, and 11 µg m−3, respectively. The sum of all dust bins yields a total dust concentration of 298 µg m−3.
5.3.1 PM2.5
Figure 8 shows that the daily averaged PM2.5 concentrations observed by MODON AQMSs at all locations never drop below the WHO limit of 25 µg m−3. During the severe dust events, this limit is exceeded in 2016 by a factor of 10–15. The less restrictive KSA-PME limit of 35 µg m−3 is exceeded by a factor of 7–11 during the dust outbreaks. Annually averaged MODON measurements are 8–18 times higher than the 10 µg m−3 WHO limit and 5–12 times higher than the 15 µg m−3 KSA-PME limit for annual mean PM2.5 concentrations.
Both data assimilation products and WRF-Chem underestimate annual mean PM2.5 concentrations by a factor of ≈3 in Jeddah and Riyadh and slightly overestimate (though WRF-Chem slightly underestimates) PM2.5 in Dammam in comparison with observed concentrations during 2016. The CAMS-OA annual mean surface PM2.5 concentrations in Jeddah and Riyadh are higher than those from WRF-Chem and MERRA-2, providing the best fit for MODON observations, at least on an annual mean (during 2016) basis.
Annual mean PM2.5 concentrations from WRF-Chem and MERRA-2 exceed the WHO limit of 10 µg m−3 by a factor of ≈4–7 and ≈6–10, respectively, in all locations. The KSA-PME limit of 15 µg m−3 for annual average PM2.5 concentrations is exceeded by a factor of ≈2.5–4.5 and ≈4–6.5, respectively, for WRF-Chem and MERRA-2.
In Jeddah and Dammam, WRF-Chem and MERRA-2 show similar relative contributions of nondust components to PM2.5 (30 %–34 % in Jeddah and 12 %–14 % in Dammam), but in MERRA-2 sea salt is a major contributor to nondust PM2.5, while in WRF-Chem it is sulfate (see Table 6). This difference between WRF-Chem and MERRA-2 is mainly because MERRA-2 generates more sea salt but also because MERRA-2 underestimates SO2 emissions located in the Arabian Gulf and along the west coast of Saudi Arabia (Ukhov et al., 2020b) and hence underestimates sulfate concentrations, as discussed in Sect. 4.1. In Riyadh, the contribution of the nondust component to PM2.5 is ≈9 %–12 % for both MERRA-2 and WRF-Chem. In CAMS-OA, the contribution of nondust particulates to PM2.5 in Jeddah and Dammam is ≈7 %–10 %, and the contribution of sea salt is little. According to Table 6, in all considered cities, the contribution of black carbon (BC) to PM2.5 is not significant for all models. In MERRA-2, the contribution of organic matter (OM) to PM2.5 is more substantial (but still minor) in comparison with WRF-Chem and CAMS-OA. In general, among all models the contribution of dust to PM2.5 in Jeddah is 65 %–90 %, while in Riyadh and Dammam this contribution is 85 %–95 % (see Table 6).
5.3.2 PM10
Daily averaged MODON measurements almost continuously exceed the WHO guideline of 50 µg m−3 at all locations (see Fig. 9). In Riyadh and Dammam, PM10 concentration is higher than in Jeddah, where the KSA-PME limit of 340 µg m−3 for daily averaged PM10 is exceeded in 2016 by a factor of about a dozen. In Dammam, this limit is more frequently exceeded, especially during the summer period. During acute dust events in Dammam, daily averaged PM10 concentrations can exceed the WHO guideline limit by a factor of more than 10–20. Annually averaged MODON measurements are 7–11 times higher than the 20 µg m−3 WHO guideline and 2–3 times higher than the 80 µg m−3 KSA-PME limits for annual mean PM10 concentrations.
In contrast with MERRA-2 and CAMS-OA, WRF-Chem compares better with PM10 observations by MODON in all locations. MERRA-2 overestimates by a factor of ≈1.2–1.8 and CAMS-OA underestimates by a factor of ≈1.5–2 annual mean PM10 MODON observations in all locations. This is in agreement with Cuevas et al. (2015), who stated that MACC (the predecessor of CAMS-OA) underestimates PM10 daily and monthly means all year long, and with our findings in Sect. 5.2.1, where we have shown that CAMS-OA underestimates the volume of particles with radii of 0.9–20 µm. Annual mean PM10 concentrations from WRF-Chem and MERRA-2 exceed the WHO limit of 20 µg m−3 by factors of ≈6–15 and ≈10–20, respectively, in all locations. The KSA-PME limit of 80 µg m−3 for annual average PM10 concentrations is exceeded by factors of ≈1.5–4 and ≈1.5–5, respectively, for WRF-Chem and MERRA-2.
According to Table 7, MERRA-2 shows the highest contribution of sea salt to PM10 in the coastal cities of Jeddah (≈21 %–25 %) and Dammam (≈6 %–7 %). MERRA-2 demonstrates the lowest (≈1 %–2 %) contribution of sulfate to PM10, while WRF-Chem and CAMS-OA contribute a similar amount of sulfate to PM10 in Jeddah (≈7 %) and Riyadh (≈2.4 %). MERRA-2 also shows the lowest contribution (≈0.1 %–0.2 %) of black carbon (BC) to PM10 in all considered cities. The CAMS-OA organic matter (OM) contribution to PM10 is in 2–8 times greater than the WRF-Chem and MERRA-2 contributions. CAMS-OA demonstrates the lowest (0.1 %–0.2 %) contribution of sea salt to PM10. The contribution of dust to PM10 in Jeddah is 70 %–90 %, while in Riyadh and Dammam this contribution is 90 %–96 %. Minimal contribution (≈3.5 %–4 %) of nondust components to PM10 is observed among all models in Riyadh.
5.3.3 Spatial patterns of PM air pollution
In this section we use the WRF-Chem output averaged for 2015–2016 to discuss the spatial patterns of aerosol pollution and partial contributions from natural and anthropogenic aerosols to PM over the ME.
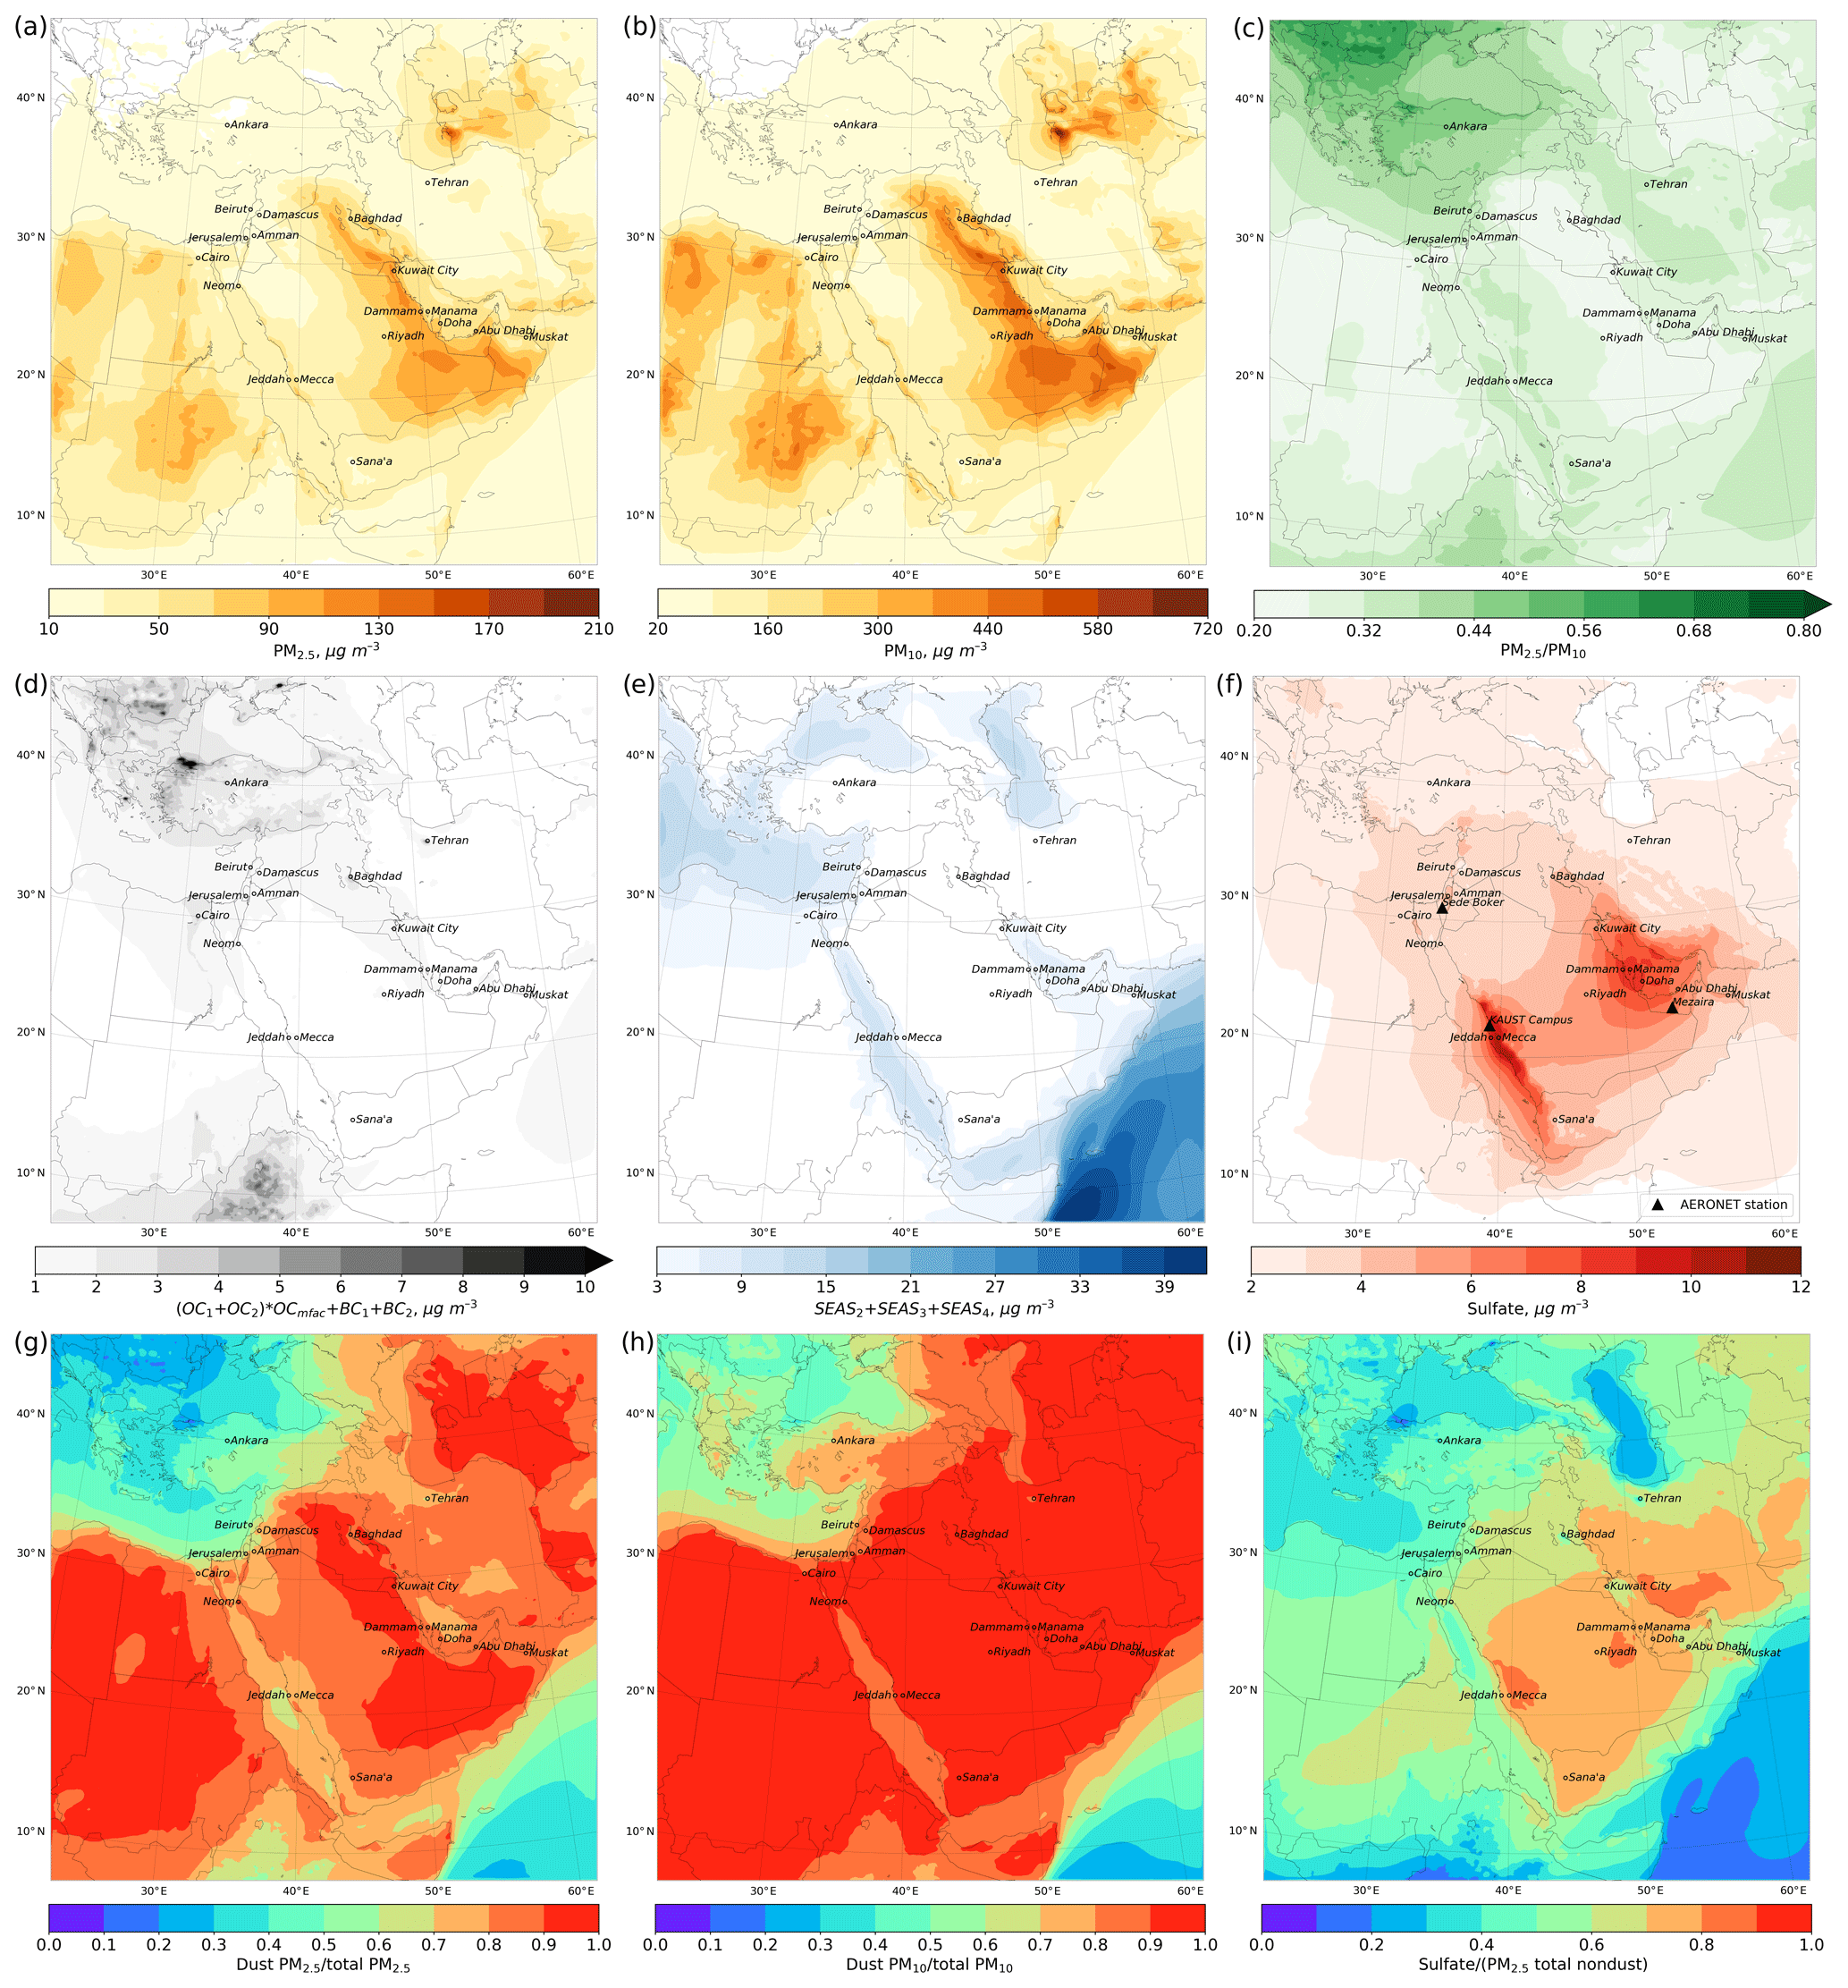
Figure 10WRF-Chem's average 2015–2016 surface concentrations (µg m−3): (a) PM2.5; (b) PM10; (c) PM2.5 ∕ PM10 ratio; (d) black carbon and organic matter, , (µg m−3); (e) sea salt, , (µg m−3); (f) sulfate (µg m−3) and locations of AERONET stations; (g) dust PM2.5 ∕ (total PM2.5) ratio; (h) dust PM10 ∕ (total PM10) ratio; (i) sulfate ∕ (PM2.5 total nondust) ratio. Abbreviations of the aerosols' names correspond to those given in Sect. 5.3.
Figure 10a, b, c show the spatial distributions of the PM2.5 and PM10 surface concentrations and the PM2.5 ∕ PM10 ratio. The left limits of the color bars for PM2.5 and PM10 are set to be equal to the corresponding WHO annual guideline concentrations. Over the whole domain, the annual mean surface concentrations of PM2.5 and PM10 exceed WHO guidelines of 10 and 20 µg m−3, respectively. The regions of high surface concentrations coincide with the main dust sources, which span from northern Iraq to Oman, and include Sudan, Egypt, Libya, and Turkmenistan. PM concentrations in these regions exceed even the less restrictive KSA-PME air quality limit for annual mean PM2.5 and PM10 concentrations by a factor of more than 5.
In the entire domain, the maximum, minimum, and mean values of the PM2.5 ∕ PM10 ratio (see Fig. 10c) are 0.73, 0.20, and 0.31, respectively. As expected, lower PM2.5 ∕ PM10 ratios (0.2–0.3) are observed over the dust source regions (i.e., along the eastern Arabian Peninsula, Iraq, and northern Africa), where both coarse and fine particles are generated. However, large particles cannot be transported as far from source regions as small particles due to the shorter lifetime of large particles compared with small particles with respect to deposition processes. The higher values (0.4–0.6) of the PM2.5 ∕ PM10 ratio are observed over southeastern Europe, Turkey, Ethiopia, and western parts of the Arabian Peninsula that are farther from the main dust sources.
Figure 10d shows the sum of surface concentrations of organic matter and black carbon, ). Their maximum, minimum, and mean concentration values are 31.8, 0.2, and 1.3 µg m−3, respectively. Their contribution to aerosol pollution over the Arabian Peninsula in WRF-Chem simulations is insignificant. Figure 10e shows the surface concentration of sea salt calculated as a sum of concentrations in each bin . Over the seas and coastal areas, the average concentration of sea salt is 3–12 µg m−3. In summer, strong winds in Somali jets (see Fig. 3b) intensify sea salt emission over the Arabian Sea, creating high surface concentrations of sea salt (27–42 µg m−3) along the coasts of Somalia and Oman. Due to prevailing northern winds, the transport of sea salt from the Mediterranean Sea to Egypt and Libya is observed.
The relatively high sulfate surface concentration (see Fig. 10f) is observed in the vicinity of the strong SO2 sources located along the west and east coast of Saudi Arabia and over the Arabian Gulf as well as downwind from those sources (see Ukhov et al., 2020b, for details). Figure 10f also denotes the locations of the AERONET stations, as in Fig. 1. The sulfate concentration at the KAUST Campus site is higher than at the Mezaira and Sede Boker AERONET sites (see Sect. 5.2.1), so it experiences a more pronounced contribution of sulfate particulates to the fine mode of the AVSD (see Figs. 4a and 5). Due to the prevailing northern winds along the Red Sea, sulfate aerosols originating from SO2 emissions along the Red Sea coast spread along the west coast of the Arabian Peninsula towards Yemen. The drift of sulfate from the Arabian Gulf into the interior of the eastern part of the Arabian Peninsula is also seen. The sulfate annual mean background surface concentration over the US for the period 2003–2012, obtained in Buchard et al. (2016), is 2–3 µg m−3, similar to the background concentrations we see in the ME. But downwind or in the vicinity of strong SO2 point emissions, sulfate concentrations are 3–4 times higher. Similar sulfate surface concentrations for the period 2000–2016 over the US were obtained in van Donkelaar et al. (2019), where the concentrations reach ≈10 µg m−3 over the eastern part of the US during summer. In Al-Taani et al. (2019) the average 1980–2016 sulfate concentration computed for the UAE is 2.5–3 times lower. This difference is caused by the fact that Al-Taani et al. (2019) took the sulfate fields from MERRA-2 reanalysis, which underestimates the SO2 emissions as shown in Ukhov et al. (2020b).
Contributions of dust to PM2.5 and PM10 calculated as ratios of dust PM2.5 to total PM2.5 and dust PM10 to total PM10 are shown in Fig. 10g and h, respectively. Due to relatively low dust surface concentrations over the eastern Mediterranean, Turkey, and southeastern Europe, the contribution of dust to PM2.5 and PM10 is 20 %–50 % and 50 %–80 %, respectively. In other areas that are closer to the dust source regions, the contribution of dust to PM is above 80 %.
Figure 10i shows the ratio between the concentration of sulfate aerosol with respect to the total concentration of PM2.5 nondust aerosols. The maximum, minimum, and mean values of this ratio are 0.84, 0.07, and 0.52, respectively. This ratio is low over the seas, where sea salt is prevalent but consistently exceeds 0.6 over land. Sulfate, therefore, is the primary anthropogenic pollutant over land. In the central and southern parts of Saudi Arabia and over Iran, sulfate contributes 60 %–90 % to the total PM2.5 nondust aerosol concentration. Over the other parts of the Arabian Peninsula, the northern part of Sudan, Libya, and Egypt, sulfate contributes approximately 40 %–60 % to the total PM2.5 nondust aerosol concentration.
5.3.4 PM air pollution in the major ME cities
To evaluate the air quality in the ME's major cities, we calculate for their locations the average 2015–2016 daily PM2.5 and PM10 surface concentrations, their 90th percentiles, and the contribution of the dust and nondust components to PM (see Fig. 11). We calculate the number of days during the 2015–2016 period when the daily PM2.5 and PM10 surface concentrations exceed the US EPA air quality limit of 35 and 150 µg m−3, respectively.

Figure 11Annual mean 2015–2016 PM surface concentrations (µg m−3) calculated for the major ME cities and PM decomposition into dust and nondust (sulfate, sea salt, black carbon, and organic matter) components (stacked bars). Abbreviations of the aerosols' names correspond to those given in Sect. 5.3. Hatched bars denote 90th percentiles (µg m−3) calculated using daily mean PM concentrations. WHO guidelines and KSA-PME air quality limits for annually averaged PM are shown by dash-dotted and dashed lines. Numbers over the stacked bars correspond to the number of days during 2015–2016 when daily averaged PM surface concentration exceeded the US EPA air quality limit. (a) PM2.5; the daily averaged US EPA air quality limit is 35 µg m−3, and the annual WHO guideline and KSA-PME limit are 10 and 15 µg m−3, respectively. (b) PM10; the daily averaged US EPA air quality limit is 150 µg m−3, and the annual WHO and KSA-PME limits are 20 and 80 µg m−3, respectively.
Figure 11 shows that the annually averaged PM2.5 and PM10 exceed the WHO air quality guidelines by factors of 2–9 and 3–20, respectively in all major cities of the ME except Ankara. The KSA-PME air quality limit for annual mean PM2.5 is exceeded by a factor of up to 6 and by a factor of up to 5 for PM10. Due to the lack of strong dust sources nearby, air quality conditions in the cities in the eastern Mediterranean are more favorable when compared with those in the Arabian Peninsula. In these cities, the air pollution shifts from natural to anthropogenic as the contribution of nondust aerosols to PM2.5 increases up to 30 %–45 %, in contrast with the cities located in the Arabian Peninsula, where this contribution is up to 8 %–25 %. Sulfate aerosol is the major contributor to nondust PM2.5.
The cities at the eastern coast of the Arabian Peninsula have the highest 90th percentiles of daily mean PM concentrations. For example, in Dammam, Abu Dhabi, Doha, and Kuwait City, the 90th percentiles of daily mean surface concentration of PM10 and PM2.5 are in the range of 400–740 and 130–180 µg m−3, respectively. This is above the KSA-PME air quality limits for daily mean PM10 and PM2.5.
In eastern Mediterranean cities, within the 2015–2016 period, the US EPA air quality daily mean limits are exceeded on 40–75 d for PM10 and 60–100 d for PM2.5. In the cities of the Arabian Peninsula, Iraq, and Iran, the US EPA PM daily mean limits are exceeded on 94–627 d for PM10 and 213–640 d for PM2.5 during the same period.
This study evaluates MERRA-2 and CAMS-OA data assimilation products and high-resolution WRF-Chem simulations aimed at assessing the impact of aerosols on PM air pollution over the Middle East for the 2015–2016 period. It also compares the new MODIS AOD retrieval, MAIAC, with the conventional MODIS-DB&DT and AERONET AOD over the Middle East's major dust source regions. MERRA-2 and WRF-Chem use the five-bin dust aerosol model and demonstrate a better agreement with the AERONET-retrieved size distribution than CAMS-OA, which uses a three-dust-bin microphysical model. CAMS-OA overestimates the volume of fine dust particles with radii of 0.55–0.9 µm and underestimates the volume of coarse dust particles with radii of 0.9–20 µm in comparison with the AERONET aerosol volume size distribution.
At all considered AERONET sites, WRF-Chem, CAMS-OA, MERRA-2, MODIS-DB&DT, and MAIAC are capable of reproducing the magnitude and temporal evolution of the AERONET AOD time series during the whole period. MAIAC and MERRA-2 have the highest correlation to AERONET AOD. CAMS-OA tends to overestimate AERONET AOD, especially during severe dust events. The MODIS-DB&DT and MAIAC AOD mean biases with respect to AERONET observations are of the same magnitude (slightly larger than that of MERRA-2), but the MODIS-DB&DT AOD is biased positively, and the MAIAC AOD is biased negatively except for Sede Boker for both years. The AOD fields from WRF-Chem and assimilation products exhibit similar spatial patterns, but WRF-Chem, MAIAC, and MERRA-2 underestimate and CAMS-OA overestimates MODIS-DB&DT AOD. MAIAC has the highest spatial correlation to the conventional MODIS-DB&DT AOD, followed by MERRA-2, CAMS-OA, and WRF-Chem.
The capability of WRF-Chem, MERRA-2, and CAMS-OA to reproduce PM air pollution over the Middle East was tested against in situ measurements. These PM measurements are conducted in the industrial regions of Jeddah, Riyadh, and Dammam, which complicates one-to-one comparison with the output from global and regional models. Annual mean PM concentrations from WRF-Chem and MERRA-2 exceed the WHO limit by a factor of almost 20. The KSA-PME limit for annual average concentrations is also exceeded by a factor of more than 6. MERRA-2 and WRF-Chem underestimate the observed annual mean PM2.5 concentrations during 2016 in Jeddah and Riyadh almost 3 times. CAMS-OA and MERRA-2 overestimate and WRF-Chem underestimates observed annual mean PM2.5 in Dammam. CAMS-OA underestimates (by a factor of 1.5–2) annual mean PM10 observations in all locations primarily due to its deficient dust size distribution. The CAMS-OA annual mean PM2.5 fits the PM observations better than other products.
The PM composition analysis over rural areas shows that in WRF-Chem, the annual average PM2.5/PM10 ratio over the ME is about 0.3. It decreases to 0.25 over the major dust source regions, i.e., in the eastern Arabian Peninsula, Iraq, and northern Africa. In most parts of the Middle East, dust is the major contributor to PM. The sulfate aerosol contribution to PM2.5 is essential in the areas where strong SO2 sources are present, i.e., on the west and east coasts of Saudi Arabia and over the Arabian Gulf. In these areas sulfate surface concentration reaches 8–11 µg m−3, while the “clean” background level is 2–4 µg m−3. High sulfate content along the west coast of Saudi Arabia is consistent with the increased volume of the fine mode at the KAUST Campus AERONET site in comparison with the Mezaira and Sede Boker sites. In WRF-Chem, sulfate is the major nondust pollutant over the Middle East. Sulfate aerosols contribute 60 %–90 % to the total PM2.5 nondust aerosols over the central and southern parts of Saudi Arabia and Iran. Over the other parts of the Arabian Peninsula, northern Sudan, Libya, and Egypt, sulfate contributes approximately 40 %–60 % to the total PM2.5 nondust aerosol concentration.
The analysis of the annually averaged PM2.5 and PM10 surface concentrations in the Middle East's major cities shows a very high PM pollution level. In Dammam, Abu Dhabi, Doha, and Kuwait City, the 90th percentile of PM10 and PM2.5 annual mean surface concentrations exceeds 400–740 and 130–180 µg m−3, respectively, which is above the KSA-PME air quality limit. In the eastern Mediterranean, dust concentration drops, and nondust aerosols' contribution to PM2.5 increases up to 30 %–45 %. In the cities located on the Arabian Peninsula, the contribution of the nondust component to PM2.5 is 8 %–25 %, which limits the effect of the emission control on air quality. In the eastern Mediterranean cities, the daily mean surface PM concentrations exceed the US EPA air quality daily mean limit on 40–75 d for PM10 and 60–100 d for PM2.5 during the 2015–2016 period. In the major cities over the Arabian Peninsula, Iraq, and Iran, the US EPA air quality daily mean limit is exceeded on 94–627 d for PM10 and 213–640 d for PM2.5. In Jeddah and Dammam, WRF-Chem and MERRA-2 show similar relative contributions of the nondust component to PM2.5 (30 %–34 % in Jeddah and 12 %–14 % in Dammam). But in MERRA-2, sea salt is a major contributor to nondust aerosol concentration, while in WRF-Chem, it is a sulfate. This difference is because MERRA-2 both generates more sea salt and underestimates SO2 emissions and, consequently, sulfate concentrations. In CAMS-OA, the contribution of nondust particulates to PM2.5 in Jeddah and Dammam is ≈7 %–10 %, and the contribution of sea salt is little. In Riyadh, the contribution of the nondust component to PM2.5 is ≈9 %–12 % for both MERRA-2 and WRF-Chem. In Jeddah, Dammam, and Riyadh, the contribution of black carbon to PM2.5 is insignificant for all products. MERRA-2 shows the highest contribution of sea salt and the lowest contribution of black carbon and sulfate to PM10 in all locations. CAMS-OA demonstrates the lowest contribution of sea salt to PM10. The minimum contribution of nondust components to PM10 is observed in Riyadh among all models.
Thus, in this study, we found that MERRA-2 and CAMS-OA assimilation products as well as WRF-Chem output, despite some intrinsic uncertainties, could be used for evaluation of the PM air pollution over the ME. All products show the dominant contribution of mineral dust to PM. However, in the Arabian coastal areas, where SO2 emissions are high, contributions of both sulfate and sea salt could be significant. The broad effect of natural aerosols on air quality in the ME puts stricter requirements on anthropogenic pollution control. The impact of dust could be alleviated by employing architectural solutions that are specific to desert areas, increasing in-city vegetation cover, and providing air quality forecasts to alarm the population of hazardous air quality. The developed WRF-Chem modeling framework can be used to simulate other pollutants like NOx and O3. The results of the current research could serve as a basis for an improved air quality forecast system that interactively calculates high-resolution, radiative, dynamical, atmospheric chemistry and aerosol processes, driven by natural and anthropogenic emissions. This system will be especially valuable for the prediction of extreme pollution events. It will also improve understanding of the impact of anthropogenic and natural pollution on air quality and human health in the ME region.
A1 Meteorological boundary and initial conditions
To be consistent with IC&BC for chemical species and aerosols, we developed a procedure to build meteorological IC&BC from MERRA-2 reanalysis for all required by WRF-Chem meteorological parameters. In particular, the following 3D parameters were processed: pressure (Pa), geopotential height (m), temperature (K), meridional and zonal wind components (m s−1), and relative humidity (%). The 2D parameters include the following: surface pressure (Pa); sea level pressure (Pa); meridional and zonal wind components at 10 m (m s−1); temperature at 2 m (K); relative humidity at 2 m (%); skin temperature (K); ice mask (0/1); terrain height (m); land/sea mask (1/0); soil temperature at 0–10 (cm), 10–40 (cm), 40–100 (cm), and 100–200 (cm); soil moisture at 0–10 (cm), 10–40 (cm), 40–100 (cm), and 100–200 (cm); snow depth (m); and snow water equivalent (kg m−2).
A2 Statistics
We calculated the following statistical parameters to quantify the level of agreement between estimations and observations.
Pearson correlation coefficient (R):
root mean square error (RMSE):
mean bias:
Fi is the estimated value, Oi is the observed value, and are their averages, and N is the number of data.
A3 Comparison of AERONET and WRF-Chem volume size distributions
The GOCART dust emission formula (2) calculates dust mass flux into the atmosphere within five dust bins. In this formula the factor C controls the total dust emission mass flux, and the sp fractions split this flux into five different dust bins. We assume that ∑sp is 1. To match the observed AERONET AVSD, we changed the default to . This means that 15 % of the total dust mass flux comes as clay and 85 % as silt.
In the original formulation the fractions sp are not normalized, and ∑sp is 1.1. This is not essential as the total flux is multiplied by the factor C that is tuned to fit the observed AOD. So we can normalize the original sp fractions by dividing them by 1.1 and multiplying factor C by 1.1. This will not change any results in Eq. (2) but gives the sp set of that is normalized to 1 consistently with our approach. Figure A1 compares the AVSDs calculated with the updated and default sp fractions for summer (JJA) of 2015.
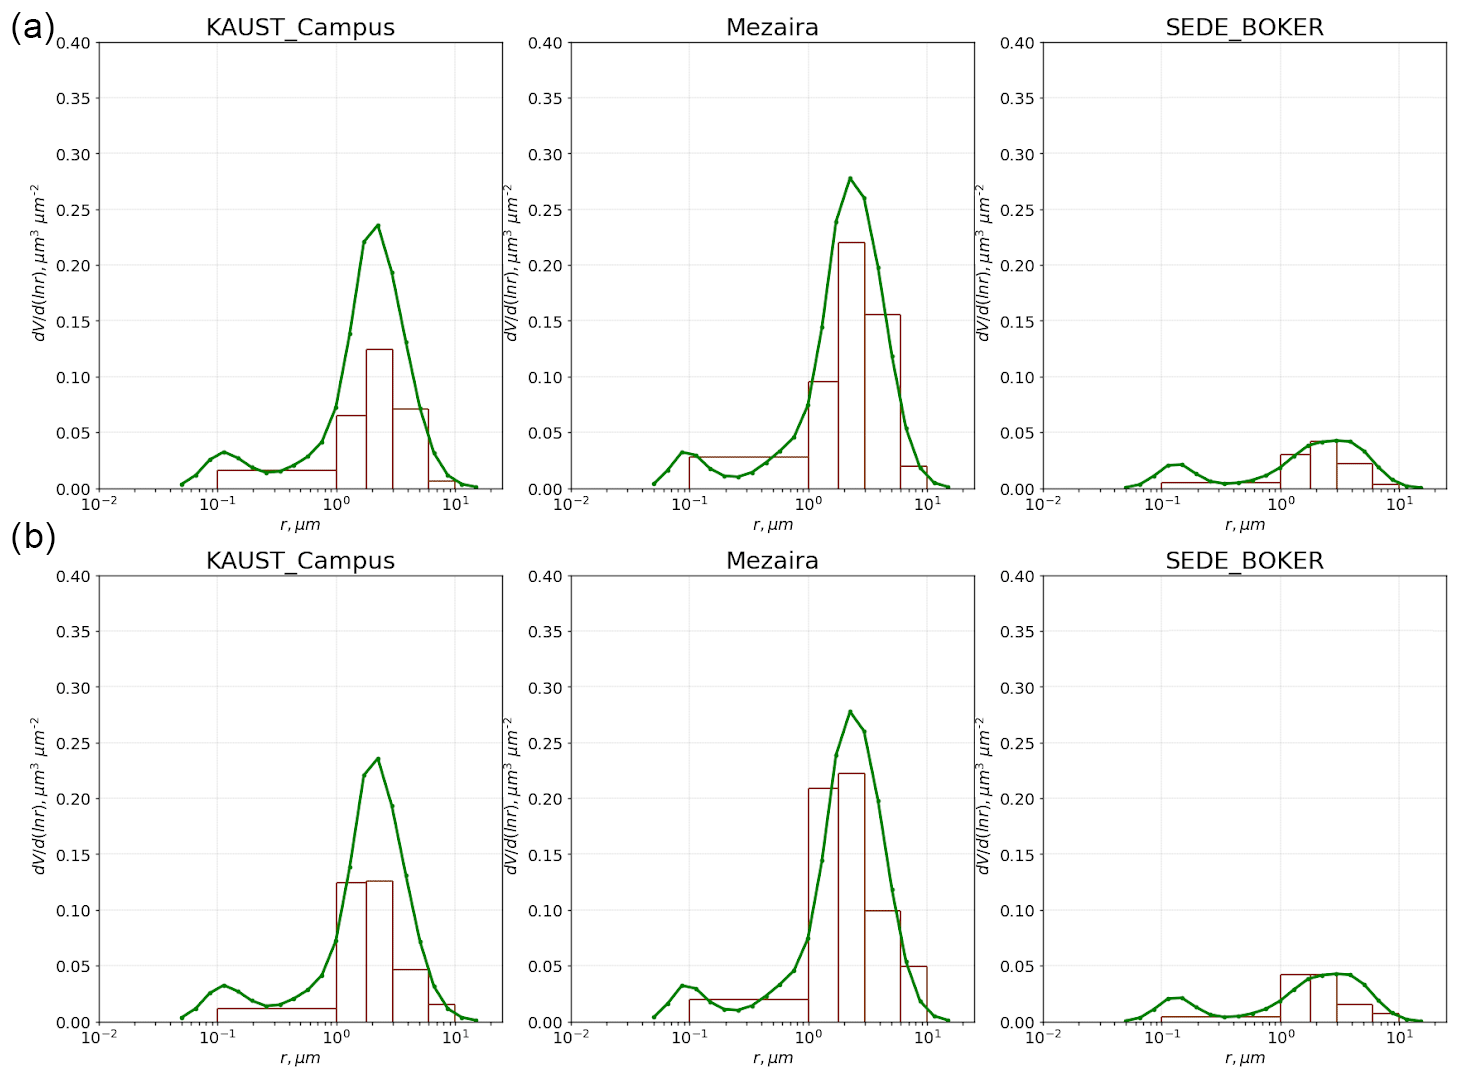
Figure A1Volume size distributions at KAUST Campus, Mezaira and Sede Boker AERONET sites averaged for JJA of 2015 from WRF-Chem (bars) and from AERONET (solid line): (a) updated sp fractions , (b) default sp fractions .
Merra2BC interpolation utility is available at https://doi.org/10.5281/zenodo.3695911 (Ukhov and Stenchikov, 2020).
MERRA-2 data are available at https://disc.gsfc.nasa.gov/daac-bin/FTPSubset2.pl (Bosilovich et al., 2015). CAMS-OA data are available at http://apps.ecmwf.int/datasets/data/cams-nrealtime (Inness et al., 2019b). MODIS-DB&DT AOD level 2 data are available at https://ladsweb.modaps.eosdis.nasa.gov/about/purpose (Levy and Hsu, 2015). AERONET data are available at https://aeronet.gsfc.nasa.gov/ (last access: 5 January 2020). MAIAC data are available at https://lpdaac.usgs.gov/products/mcd19a2v006/ (Lyapustin and Wang, 2018). The HTAP-2.2 emission inventory is available at http://edgar.jrc.ec.europa.eu/htap_v2/index.php?SECURE=123 (Janssens-Maenhout et al., 2015). The OMI-HTAP SO2 emission dataset is available at https://avdc.gsfc.nasa.gov/pub/data/project/OMI_HTAP_emis/ (Liu et al., 2018).
AU wrote the manuscript and took part in planning and performing the calculations. SM performed the calculations, constructed meteorological IC&BC based on MERRA-2 reanalysis, prepared MAIAC AOD fields, wrote the section on meteorological conditions, and took part in the discussions. GS planned the calculations, led the discussion, and reviewed and improved the manuscript. IS maintained the KAUST Campus AERONET station. YA collected, filtered, and validated PM observational data and wrote the section on the PM measurement procedures. JF and AdS participated in the discussion, helped to formulate the research program, and reviewed the manuscript.
The authors declare that they have no conflict of interest.
In this work we used AERONET data from the KAUST Campus site that was established and maintained by our group with the help of the NASA Goddard Space Flight Center AERONET team. We thank Brent Holben and Alexander Smirnov for the monitoring and regular calibrations of our instruments. We also used data from the Sede Boker and Mezaira sites and would like to thank their principal investigators Arnon Karnieli and Brent Holben.
We would like to thank Fei Liu for providing the OMI-HTAP dataset.
For computer time, this research used the resources of the Supercomputing Laboratory at KAUST. The authors would like to thank the Saudi Authority for Industrial Cities and Technology Zones (MODON) for sharing their air quality observational data.
We are thankful to Linda and Mark Everett for proofreading this manuscript.
This research has been supported by the KAUST Competitive Research Grant (URF/1/2180-01-01) “Combined Radiative and Air Quality Effects of Anthropogenic Air Pollution and Dust over the Arabian Peninsula”.
This paper was edited by Yves Balkanski and reviewed by two anonymous referees.
Adebiyi, A. A. and Kok, J. F.: Climate models miss most of the coarse dust in the atmosphere, Science Advances, 6, eaaz9507, https://doi.org/10.1126/sciadv.aaz9507, 2020. a
Alghamdi, M. A., Almazroui, M., Shamy, M., Redal, M. A., Alkhalaf, A. K., Hussein, M. A., and Khoder, M. I.: Characterization and elemental composition of atmospheric aerosol loads during springtime dust storm in western Saudi Arabia, Aerosol Air Qual. Res., 15, 440–453, 2015. a
Alharbi, B., Shareef, M. M., and Husain, T.: Study of chemical characteristics of particulate matter concentrations in Riyadh, Saudi Arabia, Atmos. Pollut. Res., 6, 88–98, 2015. a
Al-Jahdali, M. and Bisher, A. B.: Sulfur dioxide (SO2) accumulation in soil and plant's leaves around an oil refinery: A case study from Saudi Arabia, American Journal Of Environmental Sciences, 4, 84–88, 2008. a
Al-Taani, A. A., Nazzal, Y., Howari, F. M., and Yousef, A.: Long-term trends in ambient fine particulate matter from 1980 to 2016 in United Arab Emirates, Environ. Monit. Assess., 191, 143, https://doi.org/10.1007/s10661-019-7259-9, 2019. a, b, c
Anderson, J. R.: A land use and land cover classification system for use with remote sensor data, vol. 964, US Government Printing Office, Washington, USA, 1976. a
Anisimov, A., Tao, W., Stenchikov, G., Kalenderski, S., Prakash, P. J., Yang, Z.-L., and Shi, M.: Quantifying local-scale dust emission from the Arabian Red Sea coastal plain, Atmos. Chem. Phys., 17, 993–1015, https://doi.org/10.5194/acp-17-993-2017, 2017. a, b
Anisimov, A., Axisa, D., Kucera, P. A., Mostamandi, S., and Stenchikov, G.: Observations and Cloud-Resolving Modeling of Haboob Dust Storms Over the Arabian Peninsula, J. Geophys. Res.-Atmos., 123, 12–147, 2018. a
Archer-Nicholls, S., Lowe, D., Darbyshire, E., Morgan, W. T., Bela, M. M., Pereira, G., Trembath, J., Kaiser, J. W., Longo, K. M., Freitas, S. R., Coe, H., and McFiggans, G.: Characterising Brazilian biomass burning emissions using WRF-Chem with MOSAIC sectional aerosol, Geosci. Model Dev., 8, 549–577, https://doi.org/10.5194/gmd-8-549-2015, 2015. a
Banks, J. R., Brindley, H. E., Stenchikov, G., and Schepanski, K.: Satellite retrievals of dust aerosol over the Red Sea and the Persian Gulf (2005–2015), Atmos. Chem. Phys., 17, 3987–4003, https://doi.org/10.5194/acp-17-3987-2017, 2017. a
Benedetti, A., Morcrette, J.-J., Boucher, O., Dethof, A., Engelen, R., Fisher, M., Flentje, H., Huneeus, N., Jones, L., Kaiser, J., Kinne, S., Mangold, A., Razinger, M., Simmons, A. J., and Suttie, M.: Aerosol analysis and forecast in the European centre for medium-range weather forecasts integrated forecast system: 2. Data assimilation, J. Geophys. Res.-Atmos., 114, D13205, https://doi.org/10.1029/2008JD011235, 2009. a
Bosilovich, M. G., Akella, S., Coy, L., Cullather, R., Draper, C., Gelaro, R., Kovach, R., Liu, Q., Molod, A., Norris, P., Wargan, K., Chao, W., Reichle, R., Takacs, L., Vikhliaev, Y., Bloom, S., Collow, A., Firth, S., Labow, G., Partyka, G., Pawson, S., Reale, O., Schubert, S. D., Suarez, M., and Global Modeling and Assimilation Office (GMAO): MERRA-2, Greenbelt, MD, USA, Goddard Earth Sciences Data and Information Services Center (GES DISC), available at: https://disc.gsfc.nasa.gov/daac-bin/FTPSubset2.pl (last access: 5 January 2020), 2015. a
Buchard, V., da Silva, A., Randles, C., Colarco, P., Ferrare, R., Hair, J., Hostetler, C., Tackett, J., and Winker, D.: Evaluation of the surface PM2.5 in Version 1 of the NASA MERRA Aerosol Reanalysis over the United States, Atmos. Environ., 125, 100–111, 2016. a
Buchard, V., Randles, C., Da Silva, A., Darmenov, A., Colarco, P., Govindaraju, R., Ferrare, R., Hair, J., Beyersdorf, A., and Ziemba, L.: The MERRA-2 aerosol reanalysis, 1980 onward. Part II: Evaluation and case studies, J. Climate, 30, 6851–6872, 2017. a, b, c, d
Cahill, B., Toumi, R., Stenchikov, G., Osipov, S., and Brindley, H.: Evaluation of thermal and dynamic impacts of summer dust aerosols on the Red Sea, J. Geophys. Res.-Oceans, 122, 1325–1346, 2017. a
Cesnulyte, V., Lindfors, A. V., Pitkänen, M. R. A., Lehtinen, K. E. J., Morcrette, J.-J., and Arola, A.: Comparing ECMWF AOD with AERONET observations at visible and UV wavelengths, Atmos. Chem. Phys., 14, 593–608, https://doi.org/10.5194/acp-14-593-2014, 2014. a, b
Chin, M., Ginoux, P., Kinne, S., Torres, O., Holben, B. N., Duncan, B. N., Martin, R. V., Logan, J. A., Higurashi, A., and Nakajima, T.: Tropospheric aerosol optical thickness from the GOCART model and comparisons with satellite and Sun photometer measurements, J. Atmos. Sci., 59, 461–483, 2002. a, b, c
Chin, M., Diehl, T., Tan, Q., Prospero, J. M., Kahn, R. A., Remer, L. A., Yu, H., Sayer, A. M., Bian, H., Geogdzhayev, I. V., Holben, B. N., Howell, S. G., Huebert, B. J., Hsu, N. C., Kim, D., Kucsera, T. L., Levy, R. C., Mishchenko, M. I., Pan, X., Quinn, P. K., Schuster, G. L., Streets, D. G., Strode, S. A., Torres, O., and Zhao, X.-P.: Multi-decadal aerosol variations from 1980 to 2009: a perspective from observations and a global model, Atmos. Chem. Phys., 14, 3657–3690, https://doi.org/10.5194/acp-14-3657-2014, 2014. a, b
Chuang, M.-T., Zhang, Y., and Kang, D.: Application of WRF/Chem-MADRID for real-time air quality forecasting over the Southeastern United States, Atmos. Environ., 45, 6241–6250, 2011. a
Climate.com: Climate of Middle East, Climate.com, available at: http://climateof.com/middleeast/index.asp (last access: 5 January 2020), 2018. a
Cuevas, E., Camino, C., Benedetti, A., Basart, S., Terradellas, E., Baldasano, J. M., Morcrette, J. J., Marticorena, B., Goloub, P., Mortier, A., Berjón, A., Hernández, Y., Gil-Ojeda, M., and Schulz, M.: The MACC-II 2007–2008 reanalysis: atmospheric dust evaluation and characterization over northern Africa and the Middle East, Atmos. Chem. Phys., 15, 3991–4024, https://doi.org/10.5194/acp-15-3991-2015, 2015. a, b, c
Damian, V., Sandu, A., Damian, M., Potra, F., and Carmichael, G. R.: The kinetic preprocessor KPP-a software environment for solving chemical kinetics, Comput. Chem. Eng., 26, 1567–1579, 2002. a
Dubovik, O. and King, M. D.: A flexible inversion algorithm for retrieval of aerosol optical properties from Sun and sky radiance measurements, J. Geophys. Res.-Atmos., 105, 20673–20696, 2000. a, b
Engelbrecht, J. P., Stenchikov, G., Prakash, P. J., Lersch, T., Anisimov, A., and Shevchenko, I.: Physical and chemical properties of deposited airborne particulates over the Arabian Red Sea coastal plain, Atmos. Chem. Phys., 17, 11467–11490, https://doi.org/10.5194/acp-17-11467-2017, 2017. a, b
EUEA: Air Quality Standards, European Environment Agency, available at: http://ec.europa.eu/environment/air/quality/standards.htm (last access: 5 January 2020), 2008. a
Farahat, A.: Air pollution in the Arabian Peninsula (Saudi Arabia, the United Arab Emirates, Kuwait, Qatar, Bahrain, and Oman): causes, effects, and aerosol categorization, Arab. J. Geosci., 9, 196, https://doi.org/10.1007/s12517-015-2203-y, 2016. a
Fioletov, V. E., McLinden, C. A., Krotkov, N., Li, C., Joiner, J., Theys, N., Carn, S., and Moran, M. D.: A global catalogue of large SO2 sources and emissions derived from the Ozone Monitoring Instrument, Atmos. Chem. Phys., 16, 11497–11519, https://doi.org/10.5194/acp-16-11497-2016, 2016. a
Flemming, J., Huijnen, V., Arteta, J., Bechtold, P., Beljaars, A., Blechschmidt, A.-M., Diamantakis, M., Engelen, R. J., Gaudel, A., Inness, A., Jones, L., Josse, B., Katragkou, E., Marecal, V., Peuch, V.-H., Richter, A., Schultz, M. G., Stein, O., and Tsikerdekis, A.: Tropospheric chemistry in the Integrated Forecasting System of ECMWF, Geosci. Model Dev., 8, 975–1003, https://doi.org/10.5194/gmd-8-975-2015, 2015. a, b
Forkel, R., Werhahn, J., Hansen, A. B., McKeen, S., Peckham, S., Grell, G., and Suppan, P.: Effect of aerosol-radiation feedback on regional air quality – A case study with WRF/Chem, Atmos. Environ., 53, 202–211, 2012. a
Furman, H. K. H.: Dust storms in the Middle East: sources of origin and their temporal characteristics, Indoor Built Environ., 12, 419–426, 2003. a
Ginoux, P., Chin, M., Tegen, I., Prospero, J. M., Holben, B., Dubovik, O., and Lin, S.-J.: Sources and distributions of dust aerosols simulated with the GOCART model, J. Geophys. Res.-Atmos., 106, 20255–20273, 2001. a, b, c, d, e
Gong, S.: A parameterization of sea-salt aerosol source function for sub-and super-micron particles, Global Biogeochem. Cy., 17, 1097, https://doi.org/10.1029/2003GB002079, 2003. a
Goudie, A. S. and Middleton, N. J.: Desert dust in the global system, Springer-Verlag Berlin Heidelberg, Germany, 2006. a
Granier, C., Bessagnet, B., Bond, T., D’Angiola, A., van Der Gon, H. D., Frost, G. J., Heil, A., Kaiser, J. W., Kinne, S., Klimont, Z., Kloster, S., Lamarque, J.-F., Liousse, C., Masui, T., Meleux, F., Mieville, A., Ohara, T., Raut, J.-C., Riahi, K., Schultz, M. G., Smith, S. J., Thompson, A., Aardenne J., Werf G. R., and Vuuren, D. P.: Evolution of anthropogenic and biomass burning emissions of air pollutants at global and regional scales during the 1980–2010 period, Climatic Change, 109, 163, https://doi.org/10.1007/s10584-011-0154-1, 2011. a
Grell, G. A., Peckham, S. E., Schmitz, R., McKeen, S. A., Frost, G., Skamarock, W. C., and Eder, B.: Fully coupled “online” chemistry within the WRF model, Atmos. Environ., 39, 6957–6975, 2005. a
Hamidi, M., Kavianpour, M. R., and Shao, Y.: Synoptic analysis of dust storms in the Middle East, Asia-Pac. J. Atmos. Sci., 49, 279–286, 2013. a
Heidinger, A. K., Foster, M. J., Walther, A., and Zhao, X.: The pathfinder atmospheres–extended AVHRR climate dataset, B. Am. Meteorol. Soc., 95, 909–922, 2014. a
Holben, B. N., Eck, T. F., Slutsker, I., Tanre, D., Buis, J., Setzer, A., Vermote, E., Reagan, J., Kaufman, Y., Nakajima, T., Lavenu, F., Jankowiak, I., and Smirnov A: AERONET — A federated instrument network and data archive for aerosol characterization, Remote Sens. Environ., 66, 1–16, 1998. a
Inness, A., Blechschmidt, A.-M., Bouarar, I., Chabrillat, S., Crepulja, M., Engelen, R. J., Eskes, H., Flemming, J., Gaudel, A., Hendrick, F., Huijnen, V., Jones, L., Kapsomenakis, J., Katragkou, E., Keppens, A., Langerock, B., de Mazière, M., Melas, D., Parrington, M., Peuch, V. H., Razinger, M., Richter, A., Schultz, M. G., Suttie, M., Thouret, V., Vrekoussis, M., Wagner, A., and Zerefos, C.: Data assimilation of satellite-retrieved ozone, carbon monoxide and nitrogen dioxide with ECMWF's Composition-IFS, Atmos. Chem. Phys., 15, 5275–5303, https://doi.org/10.5194/acp-15-5275-2015, 2015. a
Inness, A., Ades, M., Agustí-Panareda, A., Barré, J., Benedictow, A., Blechschmidt, A.-M., Dominguez, J. J., Engelen, R., Eskes, H., Flemming, J., Huijnen, V., Jones, L., Kipling, Z., Massart, S., Parrington, M., Peuch, V.-H., Razinger, M., Remy, S., Schulz, M., and Suttie, M.: The CAMS reanalysis of atmospheric composition, Atmos. Chem. Phys., 19, 3515–3556, https://doi.org/10.5194/acp-19-3515-2019, 2019a. a
Inness, A., Ades, M., Agustí-Panareda, A., Barré, J., Benedictow, A., Blechschmidt, A.-M., Dominguez, J. J., Engelen, R., Eskes, H., Flemming, J., Huijnen, V., Jones, L., Kipling, Z., Massart, S., Parrington, M., Peuch, V.-H., Razinger, M., Remy, S., Schulz, M., and Suttie, M.: CAMS global reanalysis (EAC4), European Union, available at: http://apps.ecmwf.int/datasets/data/cams-nrealtime (last access: 5 January 2020), 2019b. a
Janssens-Maenhout, G., Pagliari, V., Guizzardi, D., and Muntean, M.: Global emission inventories in the Emission Database for Global Atmospheric Research (EDGAR) – Manual (I), Gridding: EDGAR emissions distribution on global gridmaps, Publications Office of the European Union, Luxembourg, 2013. a
Janssens-Maenhout, G., Crippa, M., Guizzardi, D., Dentener, F., Muntean, M., Pouliot, G., Keating, T., Zhang, Q., Kurokawa, J., Wankmüller, R., Denier van der Gon, H., Kuenen, J. J. P., Klimont, Z., Frost, G., Darras, S., Koffi, B., and Li, M.: HTAP_v2.2: a mosaic of regional and global emission grid maps for 2008 and 2010 to study hemispheric transport of air pollution, Atmos. Chem. Phys., 15, 11411–11432, https://doi.org/10.5194/acp-15-11411-2015, 2015 (data available at: http://edgar.jrc.ec.europa.eu/htap_v2/index.php?SECURE=123, last access: 5 January). a, b, c
Jish Prakash, P., Stenchikov, G., Kalenderski, S., Osipov, S., and Bangalath, H.: The impact of dust storms on the Arabian Peninsula and the Red Sea, Atmos. Chem. Phys., 15, 199–222, https://doi.org/10.5194/acp-15-199-2015, 2015. a, b
Jish Prakash, P., Stenchikov, G., Tao, W., Yapici, T., Warsama, B., and Engelbrecht, J. P.: Arabian Red Sea coastal soils as potential mineral dust sources, Atmos. Chem. Phys., 16, 11991–12004, https://doi.org/10.5194/acp-16-11991-2016, 2016. a, b
Kahn, R. A., Gaitley, B. J., Martonchik, J. V., Diner, D. J., Crean, K. A., and Holben, B.: Multiangle Imaging Spectroradiometer (MISR) global aerosol optical depth validation based on 2 years of coincident Aerosol Robotic Network (AERONET) observations, J. Geophys. Res.-Atmos., 110, D10S04, https://doi.org/10.1029/2004JD004706, 2005. a
Kalenderski, S. and Stenchikov, G.: High-resolution regional modeling of summertime transport and impact of African dust over the Red Sea and Arabian Peninsula, J. Geophys. Res.-Atmos., 121, 6435–6458, 2016. a, b, c
Kalenderski, S., Stenchikov, G., and Zhao, C.: Modeling a typical winter-time dust event over the Arabian Peninsula and the Red Sea, Atmos. Chem. Phys., 13, 1999–2014, https://doi.org/10.5194/acp-13-1999-2013, 2013. a, b
Karagulian, F., Belis, C. A., Dora, C. F. C., Prüss-Ustün, A. M., Bonjour, S., Adair-Rohani, H., and Amann, M.: Contributions to cities' ambient particulate matter (PM): A systematic review of local source contributions at global level, Atmos. Environ., 120, 475–483, 2015. a
Kaufman, Y. J., Tanré, D., Remer, L. A., Vermote, E., Chu, A., and Holben, B.: Operational remote sensing of tropospheric aerosol over land from EOS moderate resolution imaging spectroradiometer, J. Geophys. Res.-Atmos., 102, 17051–17067, 1997. a
Khan, B., Stenchikov, G., Weinzierl, B., Kalenderski, S., and Osipov, S.: Dust plume formation in the free troposphere and aerosol size distribution during the Saharan Mineral Dust Experiment in North Africa, Tellus B, 67, 27170, https://doi.org/10.3402/tellusb.v67.27170, 2015. a
Khodeir, M., Shamy, M., Alghamdi, M., Zhong, M., Sun, H., Costa, M., Chen, L.-C., and Maciejczyk, P.: Source apportionment and elemental composition of PM2.5 and PM10 in Jeddah City, Saudi Arabia, Atmos. Pollut. Res., 3, 331–340, 2012. a
Kim, S.-W., Heckel, A., McKeen, S., Frost, G., Hsie, E.-Y., Trainer, M., Richter, A., Burrows, J., Peckham, S., and Grell, G.: Satellite-observed US power plant NOx emission reductions and their impact on air quality, Geophys. Res. Lett., 33, L22812, https://doi.org/10.1029/2006GL027749, 2006. a
Klimont, Z., Smith, S. J., and Cofala, J.: The last decade of global anthropogenic sulfur dioxide: 2000–2011 emissions, Environ. Res. Lett., 8, 014003, https://doi.org/10.1088/1748-9326/8/1/014003, 2013. a
Klingmüller, K., Pozzer, A., Metzger, S., Stenchikov, G. L., and Lelieveld, J.: Aerosol optical depth trend over the Middle East, Atmos. Chem. Phys., 16, 5063–5073, https://doi.org/10.5194/acp-16-5063-2016, 2016. a
Kok, J. F.: Does the size distribution of mineral dust aerosols depend on the wind speed at emission?, Atmos. Chem. Phys., 11, 10149–10156, https://doi.org/10.5194/acp-11-10149-2011, 2011. a
Lelieveld, J., Evans, J. S., Fnais, M., Giannadaki, D., and Pozzer, A.: The contribution of outdoor air pollution sources to premature mortality on a global scale, Nature, 525, 367–371, https://doi.org/10.1038/nature15371, 2015. a, b
Levelt, P. F., van den Oord, G. H., Dobber, M. R., Malkki, A., Visser, H., de Vries, J., Stammes, P., Lundell, J. O., and Saari, H.: The ozone monitoring instrument, IEEE T. Geosci. Remote, 44, 1093–1101, 2006. a
Levy, R. and Hsu, C.: MODIS Atmosphere L2 Aerosol Product. NASA MODIS Adaptive Processing System, Goddard Space Flight Center, USA, available at: https://ladsweb.modaps.eosdis.nasa.gov/about/purpose (last access: 5 January 2020), 2015. a, b
Li, C., Joiner, J., Krotkov, N. A., and Bhartia, P. K.: A fast and sensitive new satellite SO2 retrieval algorithm based on principal component analysis: Application to the ozone monitoring instrument, Geophys. Res. Lett., 40, 6314–6318, 2013. a
Lihavainen, H., Alghamdi, M., Hyvärinen, A.-P., Hussein, T., Aaltonen, V., Abdelmaksoud, A., Al-Jeelani, H., Almazroui, M., Almehmadi, F., Al Zawad, F., Hakala, J., Khoder, M., Neitola, K., Petäjä, T., Shabbaj, I. I., and Hämeri, K.: Aerosols physical properties at Hada Al Sham, western Saudi Arabia, Atmos. Environ., 135, 109–117, 2016. a
Liu, F., Choi, S., Li, C., Fioletov, V. E., McLinden, C. A., Joiner, J., Krotkov, N. A., Bian, H., Janssens-Maenhout, G., Darmenov, A. S., and da Silva, A. M.: A new global anthropogenic SO2 emission inventory for the last decade: a mosaic of satellite-derived and bottom-up emissions, Atmos. Chem. Phys., 18, 16571–16586, https://doi.org/10.5194/acp-18-16571-2018, 2018 (data ailable at: https://avdc.gsfc.nasa.gov/pub/data/project/OMI_HTAP_emis/, last access: 5 January 2020). a, b, c
Lyapustin, A. and Wang, Y.: MCD19A2 MODIS/Terra+Aqua Land Aerosol Optical Depth Daily L2G Global 1km SIN Grid V006. 2018, distributed by NASA EOSDIS Land Processes DAAC, https://doi.org/10.5067/MODIS/MCD19A2.006, 2018. a
Lyapustin, A., Wang, Y., Korkin, S., and Huang, D.: MODIS Collection 6 MAIAC algorithm, Atmos. Meas. Tech., 11, 5741–5765, https://doi.org/10.5194/amt-11-5741-2018, 2018. a
Madronich, S.: Photodissociation in the atmosphere: 1. Actinic flux and the effects of ground reflections and clouds, J. Geophys. Res.-Atmos., 92, 9740–9752, 1987.
Marticorena, B. and Bergametti, G.: Modeling the atmospheric dust cycle: 1. Design of a soil-derived dust emission scheme, J. Geophys. Res.-Atmos., 100, 16415–16430, 1995. a
Martin, R. L. and Kok, J. F.: Wind-invariant saltation heights imply linear scaling of aeolian saltation flux with shear stress, Science Advances, 3, e1602569, https://doi.org/10.1126/sciadv.1602569, 2017. a
McLinden, C. A., Fioletov, V., Shephard, M. W., Krotkov, N., Li, C., Martin, R. V., Moran, M. D., and Joiner, J.: Space-based detection of missing sulfur dioxide sources of global air pollution, Nat. Geosci., 9, 496–500, 2016. a
Middleton, N.: A geography of dust storms in South-west Asia, J. Climatol., 6, 183–196, 1986. a
Miguez-Macho, G., Stenchikov, G. L., and Robock, A.: Spectral nudging to eliminate the effects of domain position and geometry in regional climate model simulations, J. Geophys. Res.-Atmos., 109, D13104, https://doi.org/10.1029/2003JD004495, 2004. a
Mohalfi, S., Bedi, H., Krishnamurti, T., and Cocke, S. D.: Impact of shortwave radiative effects of dust aerosols on the summer season heat low over Saudi Arabia, Mon. Weather Rev., 126, 3153–3168, 1998. a
Morcrette, J.-J., Boucher, O., Jones, L., Salmond, D., Bechtold, P., Beljaars, A., Benedetti, A., Bonet, A., Kaiser, J., Razinger, M., Schulz, M., Serrar, S., Simmons, A. J., Sofiev, M., Suttie, M., Tompkins, A. M., and Untch, A.: Aerosol analysis and forecast in the European Centre for medium-range weather forecasts integrated forecast system: Forward modeling, J. Geophys. Res.-Atmos., 114, D06206, https://doi.org/10.1029/2008JD011235, 2009. a
Munir, S., Habeebullah, T. M., Seroji, A. R., Morsy, E. A., Mohammed, A. M., Saud, W. A., Abdou, A. E., and Awad, A. H.: Modeling particulate matter concentrations in Makkah, applying a statistical modeling approach, Aerosol Air Qual. Res., 13, 901–910, 2013. a
Nabat, P., Solmon, F., Mallet, M., Kok, J. F., and Somot, S.: Dust emission size distribution impact on aerosol budget and radiative forcing over the Mediterranean region: a regional climate model approach, Atmos. Chem. Phys., 12, 10545–10567, https://doi.org/10.5194/acp-12-10545-2012, 2012. a
Notaro, M., Alkolibi, F., Fadda, E., and Bakhrjy, F.: Trajectory analysis of Saudi Arabian dust storms, J. Geophys. Res.-Atmos., 118, 6028–6043, 2013. a
Notaro, M., Yu, Y., and Kalashnikova, O. V.: Regime shift in Arabian dust activity, triggered by persistent Fertile Crescent drought, J. Geophys. Res.-Atmos., 120, 10229–10249, https://doi.org/10.1002/2015JD023855, 2015. a
Osipov, S. and Stenchikov, G.: Simulating the regional impact of dust on the Middle East climate and the Red Sea, J. Geophys. Res.-Oceans, 123, 1032–1047, 2018. a
Osipov, S., Stenchikov, G., Brindley, H., and Banks, J.: Diurnal cycle of the dust instantaneous direct radiative forcing over the Arabian Peninsula, Atmos. Chem. Phys., 15, 9537–9553, https://doi.org/10.5194/acp-15-9537-2015, 2015. a, b
Parajuli, S. P., Stenchikov, G. L., Ukhov, A., and Kim, H.: Dust emission modeling using a new high-resolution dust source function in WRF-Chem with implications for air quality, J. Geophys. Res.-Atmos., 124, 10109–10133, https://doi.org/10.1029/2019JD030248, 2019. a, b
PME: Ambient Air Quality Standard, The Presidency of Meteorology and Environment, Riyadh, Saudi Arabia, 2012. a
Prospero, J. M., Ginoux, P., Torres, O., Nicholson, S. E., and Gill, T. E.: Environmental characterization of global sources of atmospheric soil dust identified with the Nimbus 7 Total Ozone Mapping Spectrometer (TOMS) absorbing aerosol product, Rev. Geophys., 40, 2–1, 2002. a
Provençal, S., Buchard, V., da Silva, A. M., Leduc, R., and Barrette, N.: Evaluation of PM surface concentrations simulated by Version 1 of NASA's MERRA Aerosol Reanalysis over Europe, Atmos. Pollut. Res., 8, 374–382, 2017. a, b
Randles, C., da Silva, A. M., Buchard, V., Colarco, P., Darmenov, A., Govindaraju, R., Smirnov, A., Holben, B., Ferrare, R., Hair, J., Shinozuka, J. H. Y., and Flynn, C. J.: The MERRA-2 aerosol reanalysis, 1980 onward. Part I: System description and data assimilation evaluation, J. Climate, 30, 6823–6850, 2017. a, b, c, d
Reid, J. S., Piketh, S. J., Walker, A. L., Burger, R. P., Ross, K. E., Westphal, D. L., Bruintjes, R. T., Holben, B. N., Hsu, C., Jensen, T. L., Kahn, R. A., Kuciauskas, A. P., Mandoos, A., Mangoosh, A., Miller, S. D., Porter, J. N., Reid, E. A., and Tsay. S.: An overview of UAE2 flight operations: Observations of summertime atmospheric thermodynamic and aerosol profiles of the southern Arabian Gulf, J. Geophys. Res.-Atmos., 113, D14213, https://doi.org/10.1029/2007JD009435, 2008. a
Rienecker, M. M., Suarez, M., Todling, R., Bacmeister, J., Takacs, L., Liu, H., Gu, W., Sienkiewicz, M., Koster, R., Gelaro, R., Stajner, I., and Nielsen, J. E.: The GEOS-5 Data Assimilation System: Documentation of Versions 5.0. 1, 5.1. 0, and 5.2. 0, Tech. rep., NASA Goddard Space Flight Center, Greenbelt, Maryland, USA, 2008. a
Ritter, M., Müller, M. D., Tsai, M.-Y., and Parlow, E.: Air pollution modeling over very complex terrain: an evaluation of WRF-Chem over Switzerland for two 1-year periods, Atmos. Res., 132, 209–222, 2013. a
Shao, Y.: A model for mineral dust emission, J. Geophys. Res.-Atmos., 106, 20239–20254, 2001. a
Shao, Y.: Physics and modelling of wind erosion, vol. 37, Springer Netherlands, 2008. a
Shi, Y., Zhang, J., Reid, J. S., Holben, B., Hyer, E. J., and Curtis, C.: An analysis of the collection 5 MODIS over-ocean aerosol optical depth product for its implication in aerosol assimilation, Atmos. Chem. Phys., 11, 557–565, https://doi.org/10.5194/acp-11-557-2011, 2011. a
Skamarock, W. C., Klemp, J. B., Dudhia, J., Gill, D. O., Barker, D. M., Wang, W., and Powers, J. G.: A description of the advanced research WRF version 2, Tech. rep., National Center For Atmospheric Research, Boulder, Co, USA, Mesoscale and Microscale Meteorology Div, 2005. a
Stockwell, W. R., Kirchner, F., Kuhn, M., and Seefeld, S.: A new mechanism for regional atmospheric chemistry modeling, J. Geophys. Res.-Atmos., 102, 25847–25879, 1997. a
Ukhov, A. and Stenchikov, G.: Merra2BC. Interpolation utility for boundary and initial conditions used in WRF-Chem, Zenodo, https://doi.org/10.5281/zenodo.3695911, 2020. a, b
Ukhov, A., Ahmadov, R., Grell, G., and Stenchikov, G.: Improving dust simulations in WRF-Chem model v4.1.3 coupled with GOCART aerosol module, Geosci. Model Dev. Discuss., https://doi.org/10.5194/gmd-2020-92, in review, 2020a. a
Ukhov, A., Mostamandi, S., Krotkov, N., Flemming, J., da Silva, A., Li, C., Fioletov, V., McLinden, C., Anisimov, A., Alshehri, Y., and Stenchikov. G.: Study of SO2 pollution in the Middle East using MERRA-2, CAMS data assimilation products, and high-resolution WRF-Chem simulations, J. Geophys. Res.-Atmos., 125, e2019JD031993, https://doi.org/10.1029/2019JD031993, 2020b. a, b, c, d, e, f, g
USEPA: National Ambient Air Quality Standards, USEPA, available at: https://www.epa.gov/criteria-air-pollutants/naaqs-table (last access: 5 January 2020), 2010. a
van Donkelaar, A., Martin, R. V., Li, C., and Burnett, R. T.: Regional Estimates of Chemical Composition of Fine Particulate Matter using a Combined Geoscience-Statistical Method with Information from Satellites, Models, and Monitors, Environ. Sci. Technol., 5, 2595–2611, https://doi.org/10.1021/acs.est.8b06392, 2019. a
Vaughan, M. A., Young, S. A., Winker, D. M., Powell, K. A., Omar, A. H., Liu, Z., Hu, Y., and Hostetler, C. A.: Fully automated analysis of space-based lidar data: An overview of the CALIPSO retrieval algorithms and data products, in: Laser radar techniques for atmospheric sensing, International Society for Optics and Photonics, Maspalomas, Canary Islands, Spain, 5575, 16–30, 2004. a
Wang, X., Liang, X.-Z., Jiang, W., Tao, Z., Wang, J. X., Liu, H., Han, Z., Liu, S., Zhang, Y., Grell, G. A., and Peckham, S. E.: WRF-Chem simulation of East Asian air quality: Sensitivity to temporal and vertical emissions distributions, Atmos. Environ., 44, 660–669, 2010. a
WHO: Air quality guidelines: global update 2005, WHO, Copenhagen, Denmark, 2006. a
WHO: Ambient air quality and health, WHO, available at: http://www.who.int/en/news-room/fact-sheets/detail/ambient-(outdoor)-air-quality-and-health (last access: 5 January 2020), 2018. a
Yarwood, G., Rao, S., Yocke, M., and Whitten, G.: Updates to the carbon bond chemical mechanism: CB05, Final report to the US EPA, RT-0400675, 8, 9th Annual CMAS Conference, 8 December 2005, Chapel Hill, NC, USA, 2005. a
Yu, Y., Notaro, M., Liu, Z., Wang, F., Alkolibi, F., Fadda, E., and Bakhrjy, F.: Climatic controls on the interannual to decadal variability in Saudi Arabian dust activity: Toward the development of a seasonal dust prediction model, J. Geophys. Res.-Atmos., 120, 1739–1758, 2015. a
Yu, Y., Notaro, M., Kalashnikova, O. V., and Garay, M. J.: Climatology of summer Shamal wind in the Middle East, J. Geophys. Res.-Atmos., 121, 289–305, 2016. a, b
Zender, C. S., Miller, R., and Tegen, I.: Quantifying mineral dust mass budgets: Terminology, constraints, and current estimates, Eos, Transactions American Geophysical Union, 85, 509–512, 2004. a, b