the Creative Commons Attribution 4.0 License.
the Creative Commons Attribution 4.0 License.
 | 17 Jul 2020
Fast responses on pre-industrial climate from present-day aerosols in a CMIP6 multi-model study
Dimitris Akritidis
Aristeidis K. Georgoulias
Robert J. Allen
Susanne E. Bauer
Olivier Boucher
Jason Cole
Ben Johnson
Makoto Deushi
Martine Michou
Jane Mulcahy
Pierre Nabat
Dirk Olivié
Naga Oshima
Adriana Sima
Michael Schulz
Toshihiko Takemura
Konstantinos Tsigaridis
In this work, we use Coupled Model Intercomparison Project Phase 6 (CMIP6) simulations from 10 Earth system models (ESMs) and general circulation models (GCMs) to study the fast climate responses on pre-industrial climate, due to present-day aerosols. All models carried out two sets of simulations: a control experiment with all forcings set to the year 1850 and a perturbation experiment with all forcings identical to the control, except for aerosols with precursor emissions set to the year 2014. In response to the pattern of all aerosols effective radiative forcing (ERF), the fast temperature responses are characterized by cooling over the continental areas, especially in the Northern Hemisphere, with the largest cooling over East Asia and India, sulfate being the dominant aerosol surface temperature driver for present-day emissions. In the Arctic there is a warming signal for winter in the ensemble mean of fast temperature responses, but the model-to-model variability is large, and it is presumably linked to aerosol-induced circulation changes. The largest fast precipitation responses are seen in the tropical belt regions, generally characterized by a reduction over continental regions and presumably a southward shift of the tropical rain belt. This is a characteristic and robust feature among most models in this study, associated with weakening of the monsoon systems around the globe (Asia, Africa and America) in response to hemispherically asymmetric cooling from a Northern Hemisphere aerosol perturbation, forcing possibly the Intertropical Convergence Zone (ITCZ) and tropical precipitation to shift away from the cooled hemisphere despite that aerosols' effects on temperature and precipitation are only partly realized in these simulations as the sea surface temperatures are kept fixed. An interesting feature in aerosol-induced circulation changes is a characteristic dipole pattern with intensification of the Icelandic Low and an anticyclonic anomaly over southeastern Europe, inducing warm air advection towards the northern polar latitudes in winter.
- Article
(42242 KB) - Full-text XML
-
Supplement
(4332 KB) - BibTeX
- EndNote


Aerosols interact directly with radiation through scattering and absorption (Haywood and Boucher, 2000) as well as with clouds by acting as cloud condensation nuclei (CCN) and ice nuclei (IN), affecting the Earth's radiation budget and climate (Lohmann and Feichter, 2005), while this impact can be much stronger on a regional scale (Ramanathan and Feng, 2009). On a global scale, aerosols have an inhomogeneous spatial distribution, due to their relatively short lifetime, closely following the patterns of regional emission sources. As a consequence, aerosols have a larger geographical variation in radiative forcing than CO2, with the pattern and spatial gradients of their forcing affecting global and regional temperature responses as well as the hydrologic cycle and precipitation patterns (Myhre et al., 2013). In general, absorbing aerosols, like black carbon (BC), tend to warm the climate and stabilize the atmosphere, while sulfate aerosols tend to cool the climate (Bond et al., 2013), but the aerosol-induced circulation changes influence the spatial patterns of temperature and precipitation response to the regional aerosol forcing, while aerosol–cloud interactions complicate further these responses (Baker et al., 2015; Boucher et al., 2013; Rosenfeld et al., 2014b). While the local influence of aerosols close to their emission sources has been clearly seen in a number of studies (Bartlett et al., 2018; Ramanathan and Feng, 2009; Sarangi et al., 2018; Thornhill et al., 2018; Zhang et al., 2018), their impact can extend beyond their emission regions via fast and slow climate responses (Andrews et al., 2010; Boucher et al., 2013; Kvalevåg et al., 2013). Reduction in sulfur emissions in China was found to lead to increases in temperature in much of the US, northern Eurasia and the Arctic (Kasoar et al., 2016). Removal of US anthropogenic SO2 emissions showed robust patterns of temperature responses over land, with increases in temperature for most of the Northern Hemisphere land regions and the strongest response towards the Arctic (Conley et al., 2018; Shindell et al., 2015). Other recent model studies indicate an amplification of the temperature response towards the Arctic due to local and remote aerosol forcing (Stjern et al., 2017; Westervelt et al., 2018; Stjern et al., 2019). Furthermore, model perturbation simulations with increasing SO2 in Europe, North America, East Asia and South Asia showed a consistent cooling almost everywhere over the Northern Hemisphere with the Arctic revealing the largest temperature response in all experiments (Lewinschal et al., 2019). The investigation of temperature and precipitation responses to single-species forcings in different latitudinal bands showed that the influence of remote forcings on certain regions can often outweigh and even have an opposite sign to the influence of local forcings (Shindell et al., 2012).
The Intergovernmental Panel on Climate Change (IPCC) Fifth Assessment Report (AR5) has clarified the importance of distinguishing instantaneous radiative forcing and fast responses (through rapid atmospheric adjustments which modify the radiative budget indirectly) from slow responses through feedbacks (affecting climate variables that are mediated by a change in surface temperature and involve the response of the oceans to the forcing) (Boucher et al., 2013). The dual fast-response (or rapid adjustment) and slow-response framework has been investigated across a range of recent global model studies (Baker et al., 2015; Richardson et al., 2016; Samset et al., 2016, 2018; Liu et al., 2018). Rapid adjustments affect cloud cover and other components of the climate system and thereby alter the global radiation budget indirectly within a few weeks, much faster than responses of the ocean to forcing (Myhre et al., 2013). A nice schematic overview of fast- and slow-response concept in precipitation is presented in Fig. SB1 by Myhre et al. (2017), which breaks down the responses for three timescales: (a) an instantaneous radiative perturbation may initially alter precipitation as a result of changes in the atmospheric radiative heating or cooling; (b) the instantaneous change through radiation may further alter the atmospheric temperature, water vapor and clouds, through rapid adjustments, leading to precipitation change on a timescale from days to a few years (fast responses); (c) climate feedback processes through changes in the surface temperature may further alter the atmospheric absorption, which occurs on a long timescale of several decades (slow responses). Under the framework of the Precipitation Driver Response Model Intercomparison Project (PDRMIP), multiple model results indicate that the global fast precipitation response to regional aerosol forcing scales with global atmospheric absorption, and the slow precipitation response scales with global surface temperature response (Myhre et al., 2017; Liu et al., 2018).
Generally, the zonal means of slow precipitation and temperature responses are stronger than the fast responses (Samset et al., 2016; Lewinschal et al., 2019; Baker et al., 2015; Stjern et al., 2017; Voigt et al., 2017). Despite the fact that generally the slow climate responses of anthropogenic aerosols dominate over the fast responses in zonal means, the fast responses are important on a regional scale and global scale (for the case of BC aerosols) as has been noted in several previous single-model (e.g., Andrews et al., 2010; Ganguly et al., 2012; Kvalevåg et al., 2013; Li et al., 2018;) and multi-model studies (e.g., Samset et al., 2016; Stjern et al., 2017; Voigt et al., 2017; Liu et al., 2018). The role of fast and slow drivers of precipitation changes is species dependent; for BC, fast stabilization effects due to atmospheric absorption can be important even when averaging on long timescales, while for sulfate the slow response dominates in global and zonal means (Samset et al., 2016; Shawki et al., 2018) even though at the regional level the fast response can be also important (Ganguly et al., 2012). Ganguly et al. (2012) showed that the precipitation decreases over northeast India and Nepal region are due to the fast response to aerosol forcing based on aerosol emission changes from the pre-industrial era to present day. Previous studies indicated that the fast precipitation response of BC aerosols dominates over their slow response for global precipitation changes (Andrews et al., 2010; Kvalevåg et al., 2013). This “fast response” of precipitation to BC reductions tends to dominate the total response to BC, as also shown in recent PDRMIP results (Samset et al., 2016; Liu et al., 2018). Another recent PDRMIP multi-model study showed that unlike other drivers of climate change, the response of temperature and cloud profiles to the BC forcing is dominated by rapid adjustments causing weak surface temperature response to increased BC concentrations (Stjern et al., 2017). While some aspects of the regional variation in precipitation and temperature predicted by climate models appear robust, there is still a large degree of intermodel differences unaccounted for, because of uncertainties involved in the related modeling aspects, such as representation of aerosols, their vertical distribution, and radiative properties, parameterizations of aerosol removal processes including both wet and dry removal as well as aerosol–cloud interactions, and variable climate sensitivity per unit aerosol forcing in models (Kasoar et al., 2016; Rosenfeld et al., 2014a; Shindell et al., 2015; Wilcox et al., 2015). The models' uncertainty in the aerosol vertical distribution should be noted, particularly for BC aerosols, which likely leads to biases in their semidirect effects and much of the uncertainty in their fast responses (Baker et al., 2015).
Here, we present a first analysis of the fast responses on pre-industrial climate due to present-day aerosols in a multi-model study based on simulations with 10 CMIP6 models. Section 2 presents the data used and the methodology applied in this study. In Sect. 3 the key results of this study are presented and discussed, while, finally, in Sect. 4 the main conclusions are summarized.
Table 1Information on model resolution, vertical levels, type, simulations and references. Each experiment has a variant label that resembles the following: , where k is the realization_index, l is the initialization_index, m is the physics_index and n is the forcing_index.
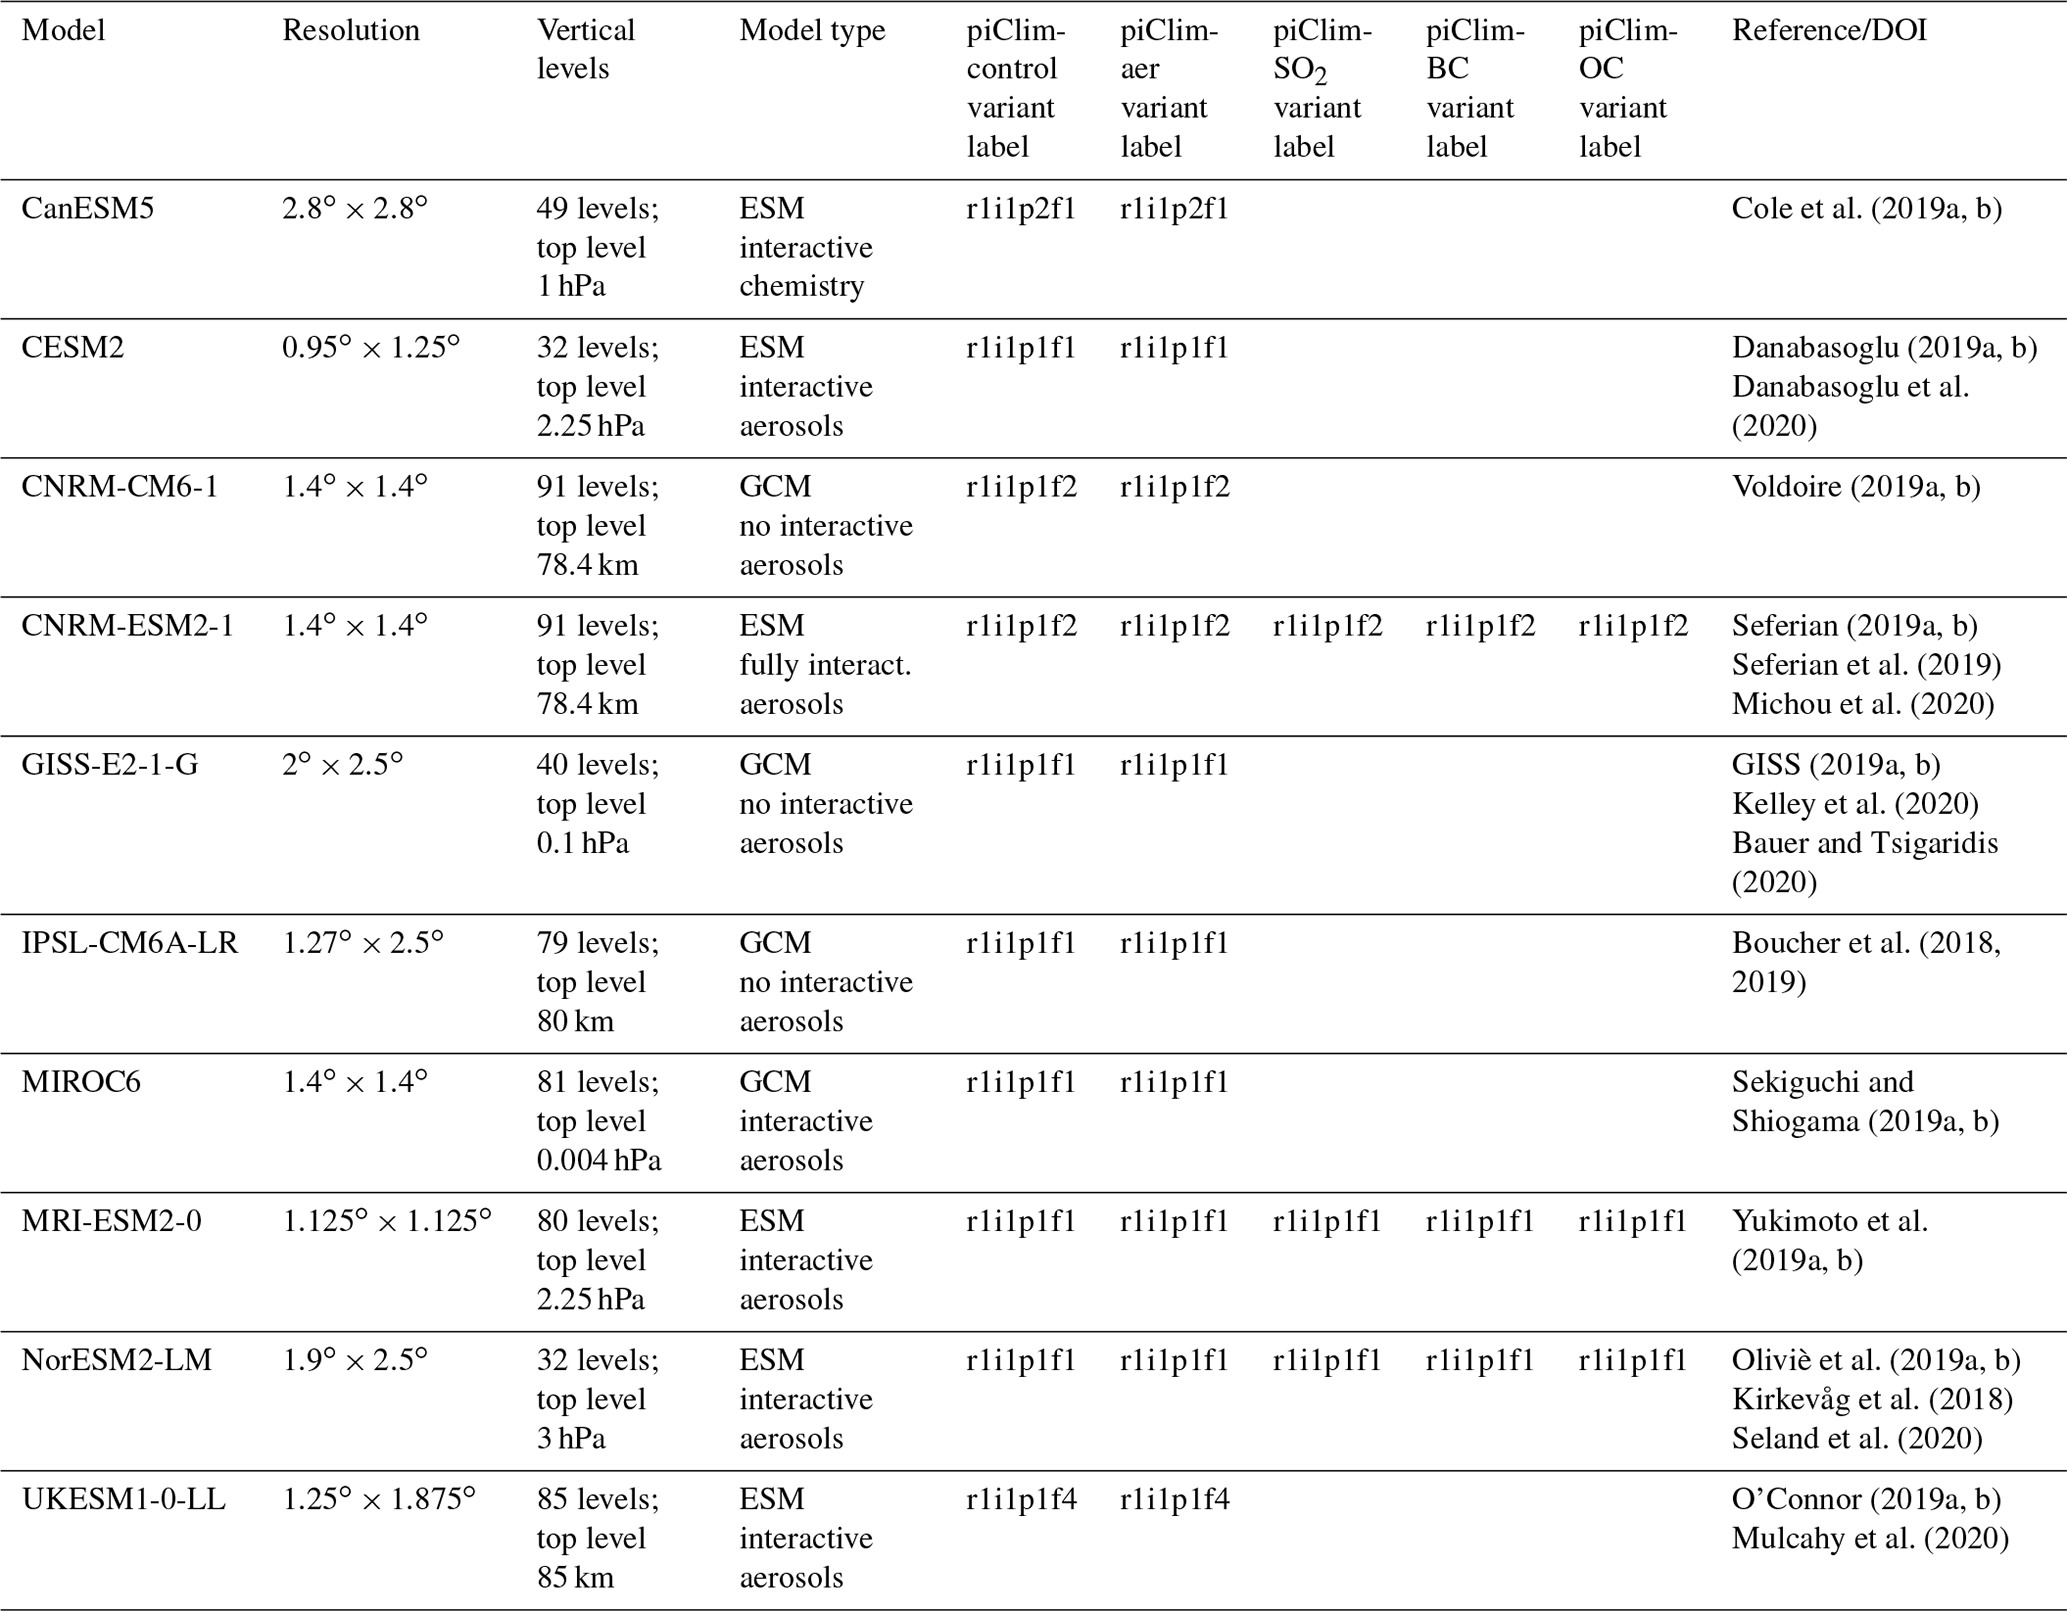
In this work, we use CMIP6 simulations from 10 different models, namely CanESM5, CESM2, CNRM-CM6-1, CNRM-ESM2-1, GISS-E2-1-G, IPSL-CM6A-LR, MIROC6, MRI-ESM2-0, NorESM2-LM and UKESM1-0-LL. The aforementioned simulations were implemented within the framework of the Aerosol Chemistry Model Intercomparison Project (AerChemMIP), which is endorsed by CMIP6 and aims at quantifying the impacts of aerosols and chemically reactive gases on climate and air quality (Collins et al., 2017). Recent work shows that the effective climate sensitivity has increased in CMIP6 models, which is primarily due to stronger positive cloud feedbacks from decreasing extratropical low cloud coverage and albedo (Zelinka et al, 2020). All models carried out two sets of simulations considering both aerosol–radiation and aerosol–cloud interactions: the piClim-control (with all forcings set to the year 1850 using aerosol precursors emission of 1850) and the piClim-aer (again with all forcings set to 1850 but using anthropogenic aerosol precursor emissions of the year 2014). All simulations cover at least a period of 30 years in total using fixed climatological average sea surface temperatures (SSTs) and sea ice distributions corresponding to the year 1850. Furthermore, concentrations of well-mixed greenhouse gases (WMGHGs), emissions of ozone precursors and ozone depleting halocarbons, solar irradiance forcing, and land use are also set to the year 1850. The year 1850 is considered here as a pre-industrial period, although it could be also assigned as an early industrial period. The perturbation experiments (e.g., piClim-aer) are run similarly for the 30-year period following the control experiments (piClim-control), using the same control SST and sea ice but with emissions for anthropogenic aerosol precursors of SO2, BC and organic carbon (OC) set to present-day (2014) levels. It has to be noted that only one realization is analyzed for each model (see Table 1). As far as it concerns aerosol–cloud interactions all models include parameterizations for the first and second indirect effects except CNRM-CM6-1, CNRM-ESM2-1, IPSL-CM6A-LR and GISS-E2-1-G, which have parameterizations only for the first indirect effect. The historical CMIP6 input data were used for the biomass burning emissions and anthropogenic emissions (van Marle et al., 2017; Hoesly et al., 2018), while natural emissions, including dust and sea salt, were calculated interactively following their own parameterizations or used prescribed fields based on consistent offline calculations. The model simulations, assigned in Table 1 with “no interactive aerosol”, use prescribed aerosol fields, which are consistent with the CMIP6 emissions used in the rest of the models.
A forcing that accounts for rapid adjustments is termed as the effective radiative forcing (ERF) and conceptually represents the change in the net top-of-the-atmosphere (TOA) radiative flux after allowing for atmospheric temperatures, water vapor and clouds to adjust but with global mean surface temperature or a portion of surface conditions unchanged. A standard method to investigate the fast responses in climate simulations to forcing from aerosols or other short-lived climate forcers (SLCFs) is by fixing SSTs and sea ice cover (SIC) at climatological values, allowing all other parts of the system to respond until reaching steady state (Hansen et al., 2005). In this way, the climate response to a forcing agent in the fixed SST simulations is without any ocean response to climate change and therefore only weakly coupled to feedback processes through land surface responses (Myhre et al., 2013, 2017).
By subtracting the piClim-control simulations from the piClim-aer simulations, the fast responses of pre-industrial climate to present-day aerosols are estimated since SST and sea ice distributions are fixed in the simulations. In this work, we examine the effect of aerosols on (1) net radiative flux (shortwave and longwave) at the top of the atmosphere, which manifests the ERF; (2) surface air temperature; (3) precipitation; and (4) atmospheric circulation (wind and geopotential height at 850 hPa). As the horizontal resolution ranges between the different models (from to ), all the data were brought to a common spatial grid using bilinear interpolation prior to processing. Moreover, as the minimum time period covered by the simulations is 30 years, for all simulations the first 30 years were selected for consistency. Results from the ensemble of all the models are presented within the paper on an annual and seasonal basis (winter vs. summer), while results for each model separately are given in the Supplement. The statistical significance of the results at the 95 % confidence level is checked using a paired sample two-sided t test.
To decompose the effect of different present-day aerosol types on early industrial climate, supplementary data from three additional experiments, namely piClim-SO2 (all forcings set to 1850 but using SO2 precursor emissions of the year 2014), piClim-BC (all forcings set to 1850 using BC precursor emissions of the year 2014) and piClim-OC (all forcings set to 1850 using OC precursor emissions of the year 2014), were used. At the time this paper was written, there were available data from three models only (CNRM-ESM2-1, MRI-ESM2-0 and NorESM2-LM). Similarly, by subtracting the piClim-control simulation from these three simulations, the fast responses of pre-industrial climate to present-day sulfates, BC and OC aerosols are calculated. Relevant information for each model, the corresponding experiments and the model basic references/DOIs are shown in Table 1.
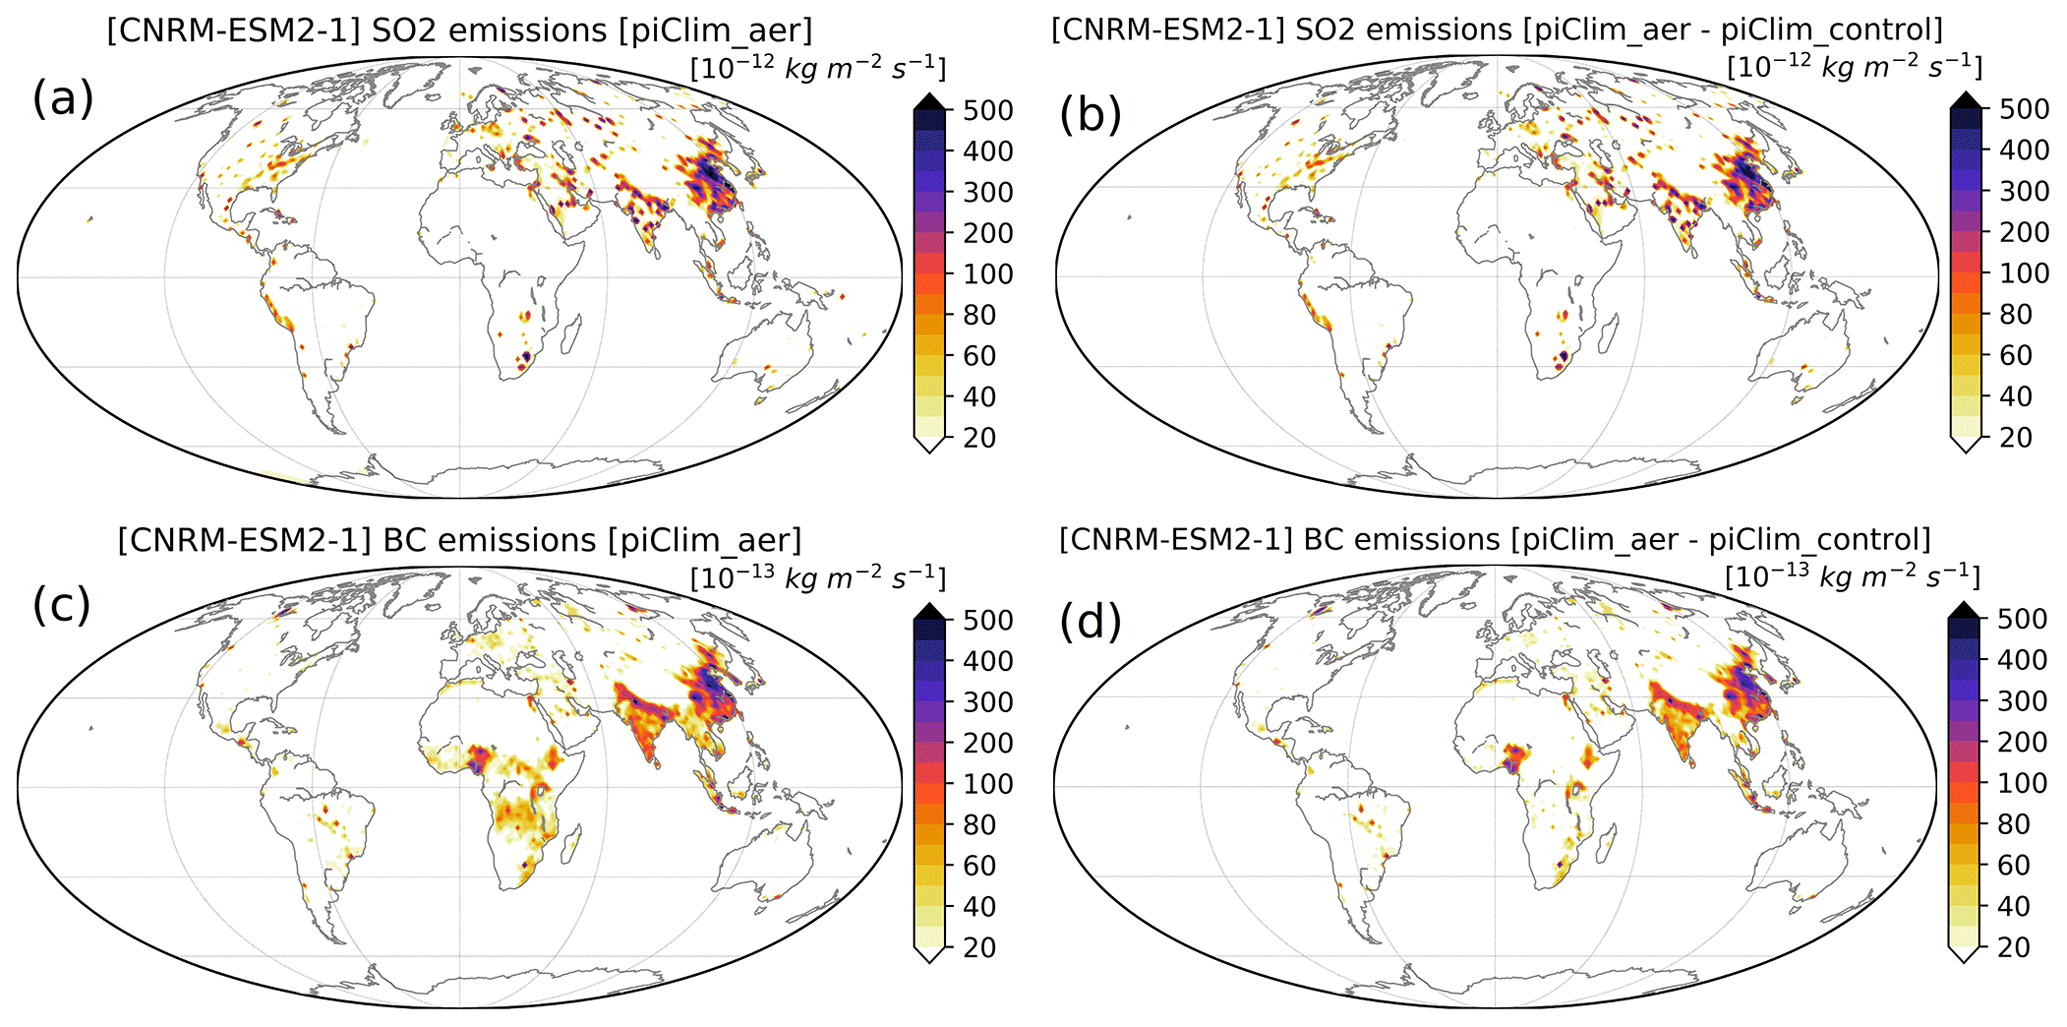
Figure 1SO2 (in 10−12 kg m−2 s−1) and BC emissions (in 10−13 kg m−2 s−1) for 2014 (a and c) used in CNRM-ESM2-1 piClim-aer simulation and differences in annual SO2 and BC emissions between year 2014 (in piClim-aer) and year 1850 (in piClim-control) (b and d). Mind that the scale for BC emissions is by a factor of 10 lower than for SO2 emissions.
Taking into consideration that the perturbation experiments to the control simulation are based on emissions for aerosol precursors set to present day (2014), Fig. 1 shows the annual SO2 and BC emissions for 2014 used in piClim-aer simulations as well as the differences from their respective emissions for year 1850 used in piClim-control simulations. Figure 1 is based on the emissions used in CNRM-ESM2-1, but the emissions are similar for the rest of the models used here, indicating that the largest present-day sources of SO2 are over East Asia, India, North America and Europe, while for BC over East Asia, India and Africa. The differences between piClim-aer and piClim-control in SO2 emissions are peaking over East Asia, India, North America, the Middle East and Europe, while for BC the emissions peak over East Asia, India and spot regions in Africa. The differences between piClim-aer and piClim-control in BC emissions are very low over Europe and North America. Based on the ensemble of the 10 models on an annual basis, Fig. 2 shows, in turn, the differences between piClim-aer and piClim-control for total aerosol optical depth (AOD) and absorbing aerosol optical depth (AAOD) at 550 nm. Their spatial distribution reflects the key emission regions of the anthropogenic scattering and absorbing aerosols. The mean annual AOD difference between piClim-aer and piClim-control simulations for the 10-models ensemble is 0.027±0.012 for the globe, 0.046±0.020 for the Northern Hemisphere (NH) and 0.011±0.003 for the Southern Hemisphere (SH).
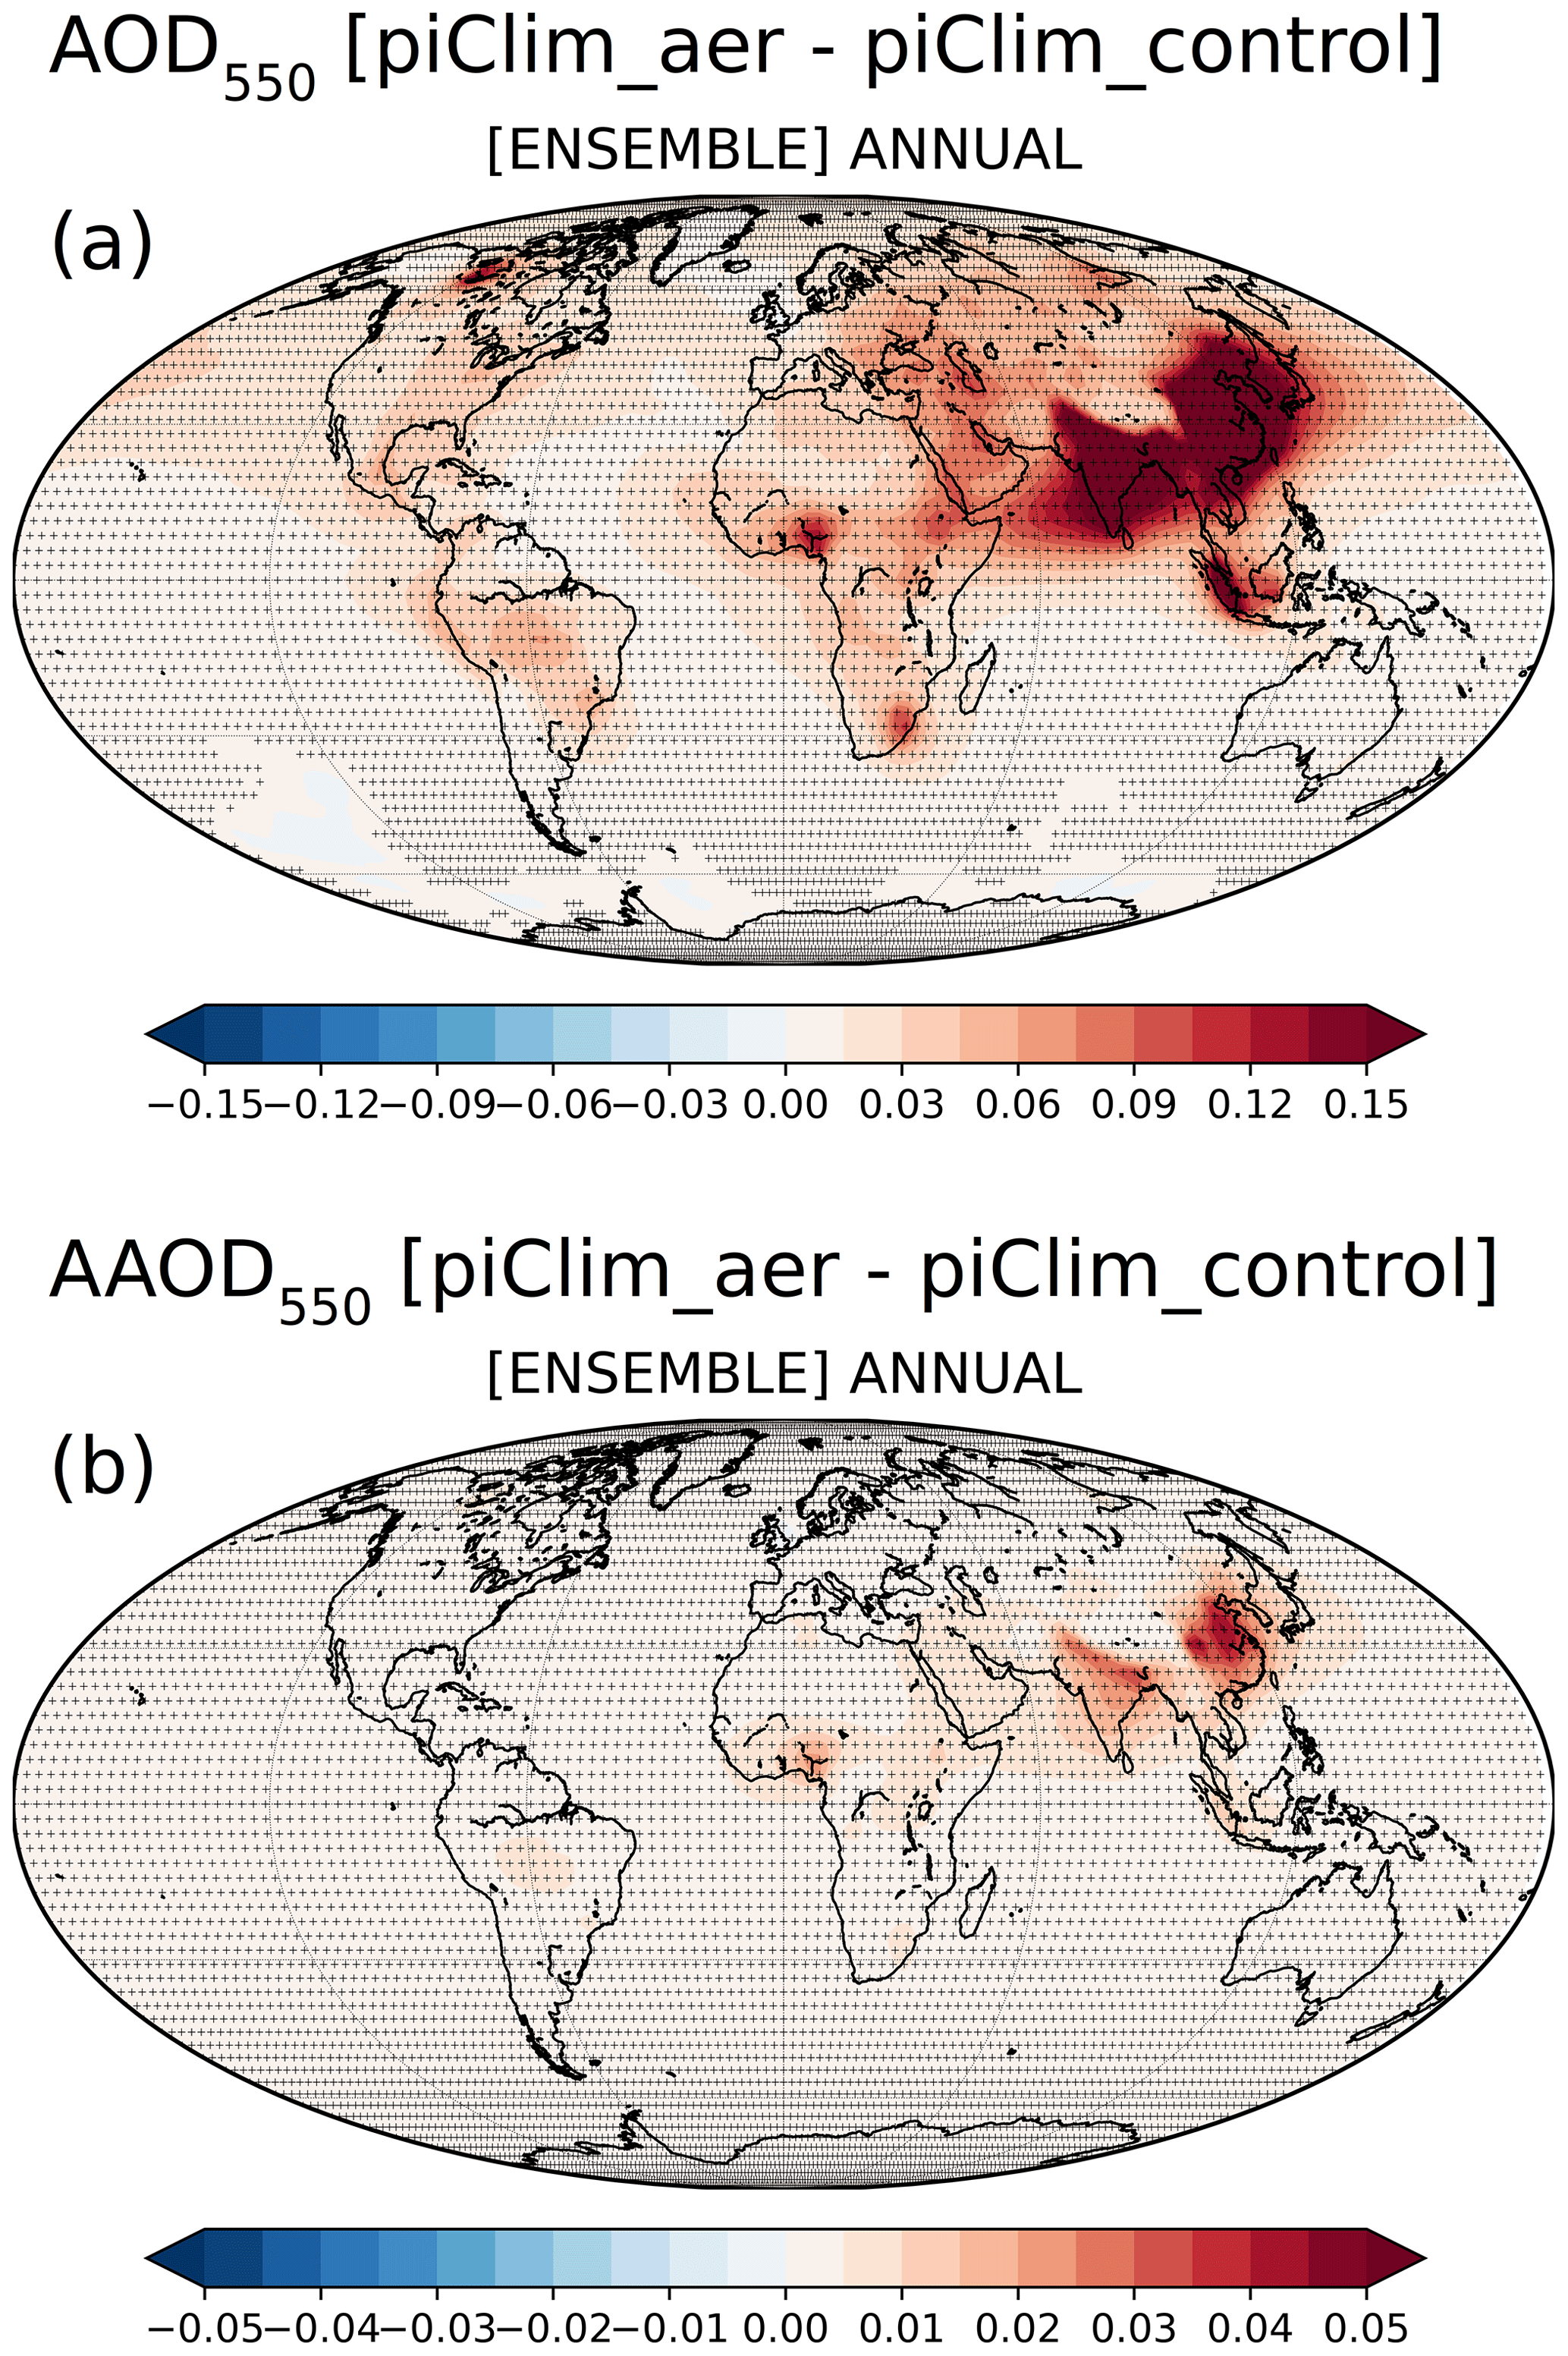
Figure 2Differences between piClim-aer and piClim-control in (a) AOD at 550 nm and (b) AAOD at 550 nm for the ensemble of 10 models on an annual basis. The dot shading indicates areas in which the differences are statistically significant at the 95 % confidence level.
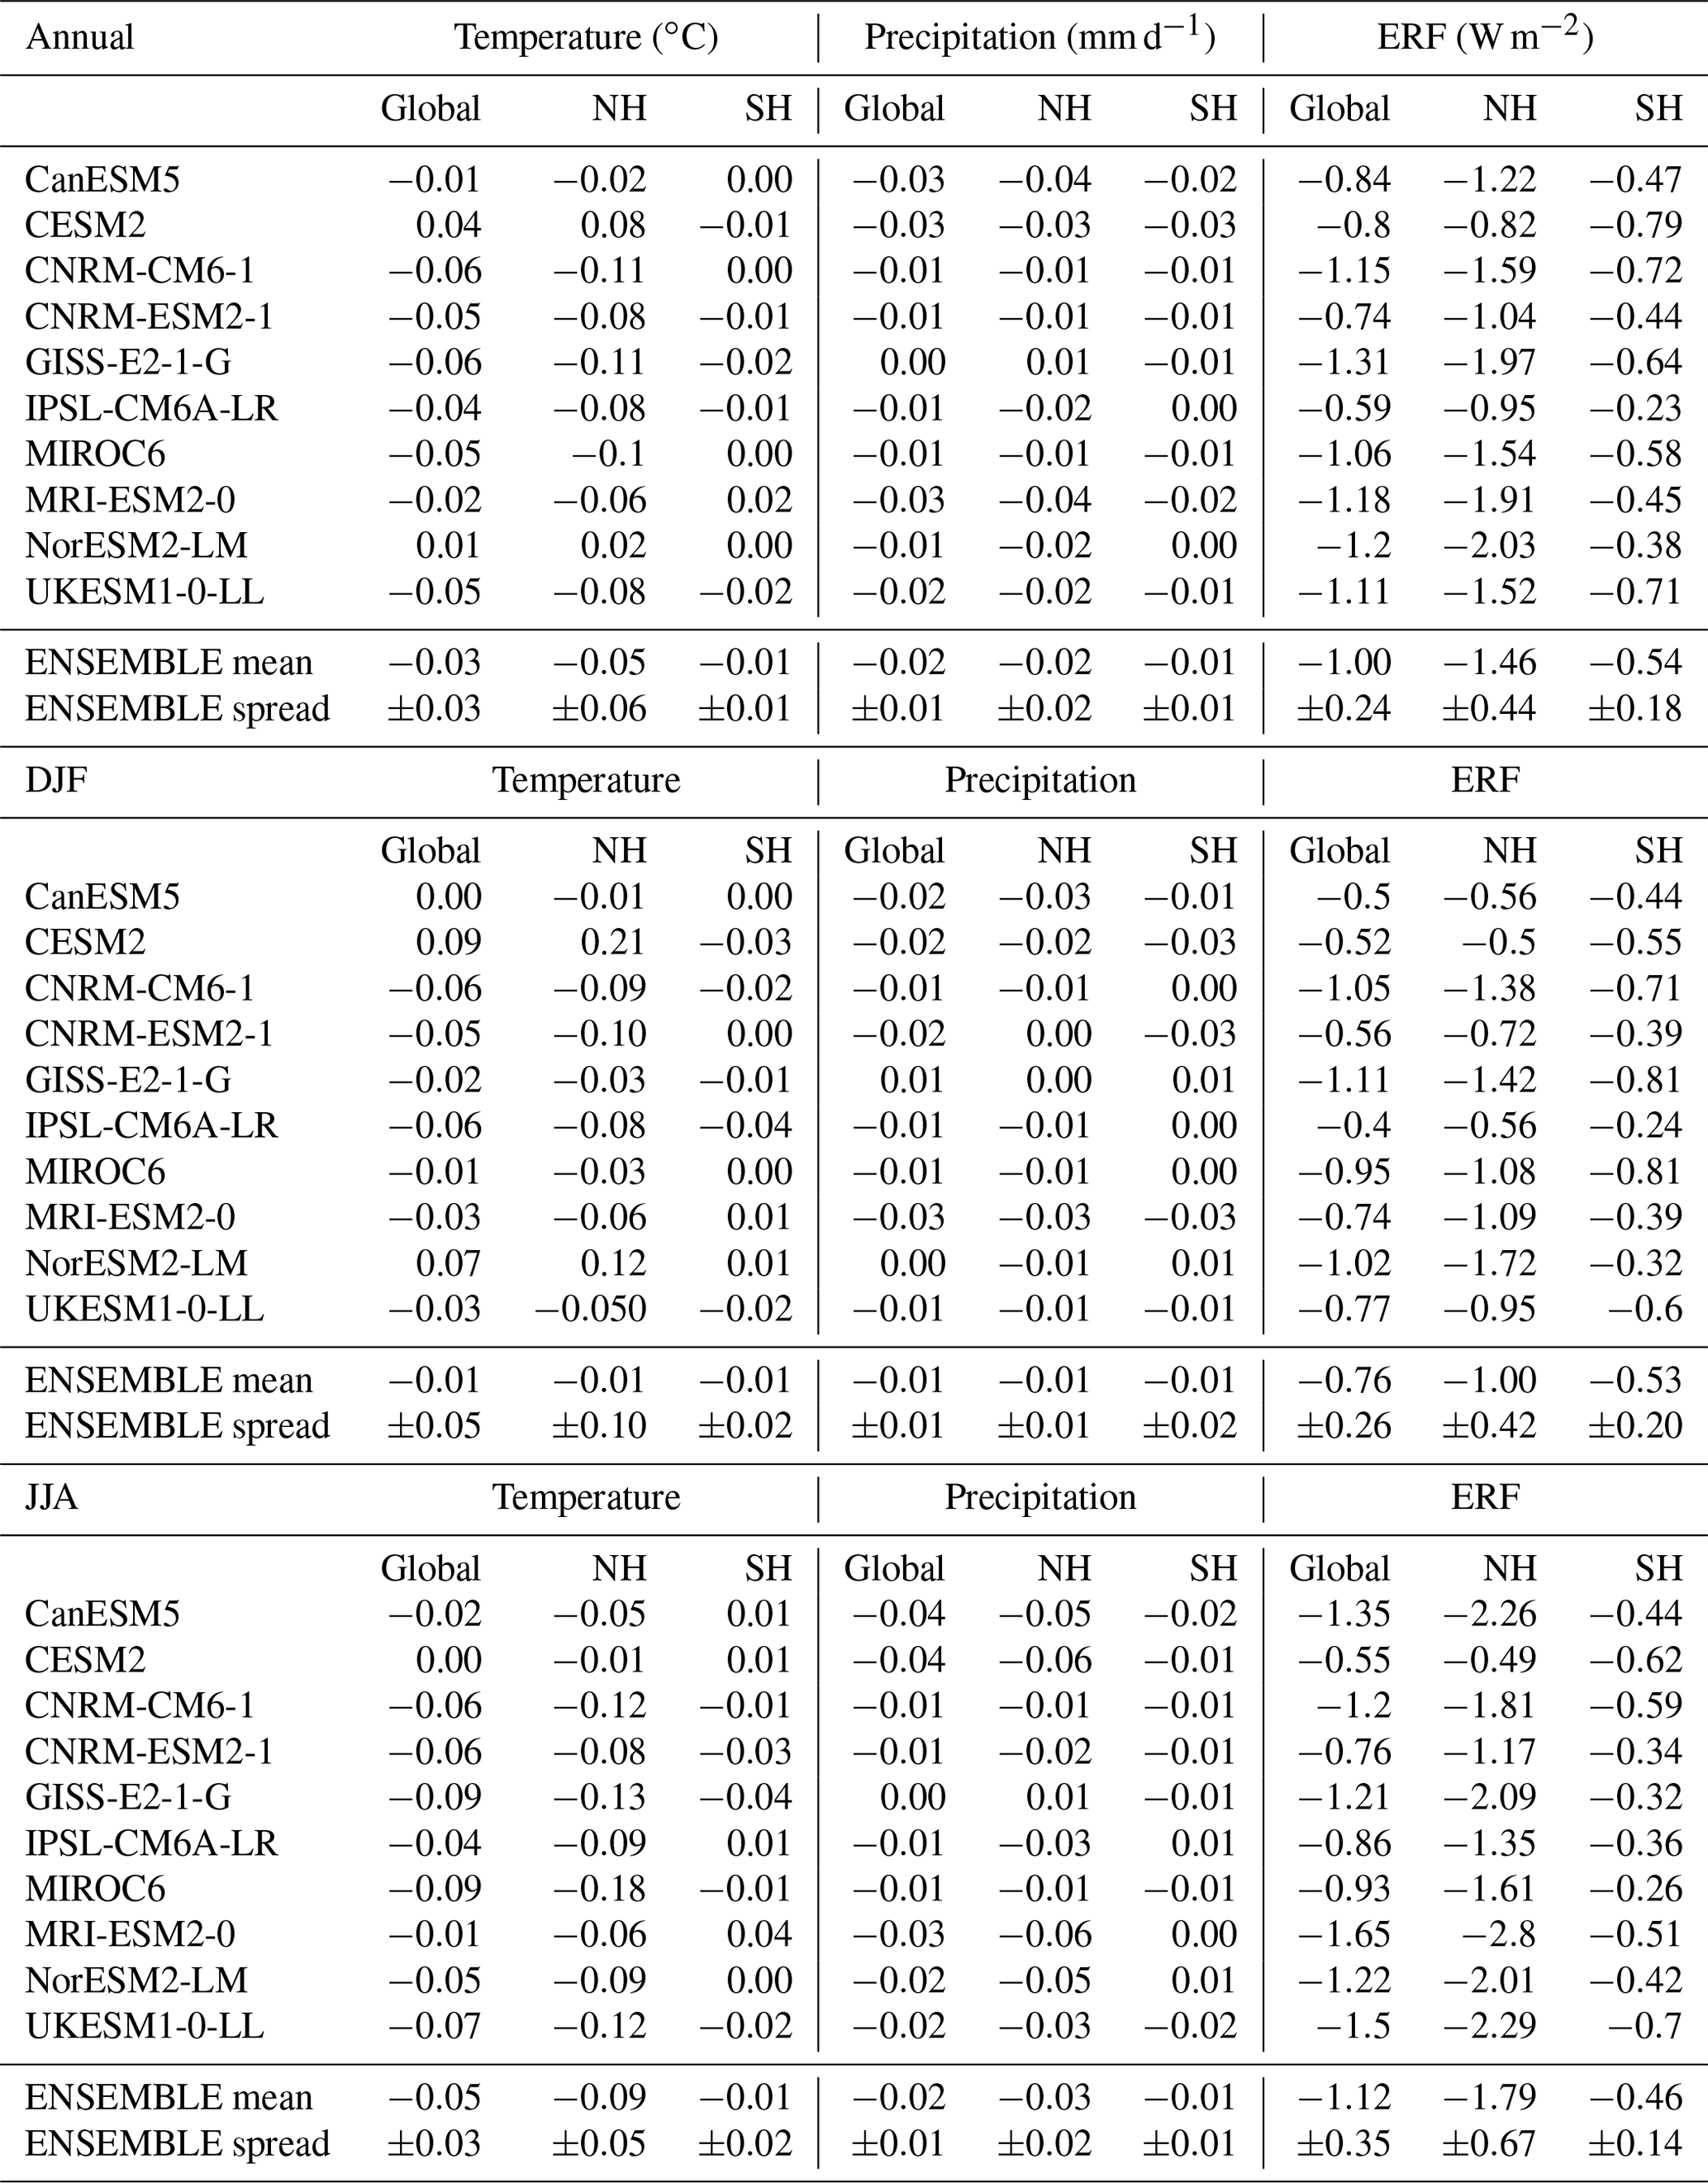
Table 2Differences between piClim-aer and piClim-control in temperature, precipitation and ERF for each model on an annual basis, as well as for DJF and JJA. The values are given as mean values for global, Northern Hemisphere (NH) and Southern Hemisphere (SH).
3.1 Changes in net radiative flux at TOA
The difference between piClim-aer and piClim-control simulations in the TOA radiative flux including both the shortwave (SW) and longwave (LW) was calculated for each one of the models to estimate the total aerosol ERF following Forster et al. (2016). The ensemble mean of the aerosol ERF from the 10 models is shown in Fig. 3 on an annual basis as well as for the boreal winter/austral summer period including the months December, January and February (DJF) and for the boreal summer/austral winter period including the months June, July and August (JJA). The mean ERF values (global, Northern Hemisphere and Southern Hemisphere) for each model on an annual basis, DJF and JJA are shown in Table 2. Overall, on an annual basis (Fig. 3a), we see a characteristic spatially extensive negative ERF at the TOA over the globe induced by the perturbation of the present-day aerosols (global annual average ERF of W m−2), especially over the Northern Hemisphere (NH annual average ERF of W m−2) with the largest negative ERF values over East Asia in response to the SO2 emissions. The global annual average of all-aerosols ERF is similar to the multi-model mean ERF value of W m−2 based on 13 CMIP5 models (see Table 1 in Allen et al., 2015) and the ERF value of W m−2 based on eight ACCMIP models in IPCC AR5 with the patterns being also similar (Shindell et al., 2013). The negative ERF values over the Northern Hemisphere generally become stronger during the boreal summer with regional maxima over East Asia and India (Fig. 3c). The negative values of ERF persist over East Asia during DJF (Fig. 3b). Figure 3a also shows a characteristic positive ERF over reflective continental surfaces such as the Sahara, Greenland and Alaska. This positive ERF over reflective continental surfaces of the NH becomes also stronger during JJA when the levels of radiation peak (Fig. 3c). The positive ERF values over the reflective continental surfaces can be explained by the fact that the very high surface albedo reduces the effect of scattering aerosols, while increasing the effect of absorbing aerosols, leading to a net positive forcing (Shindell et al., 2013; Myhre et al., 2013).
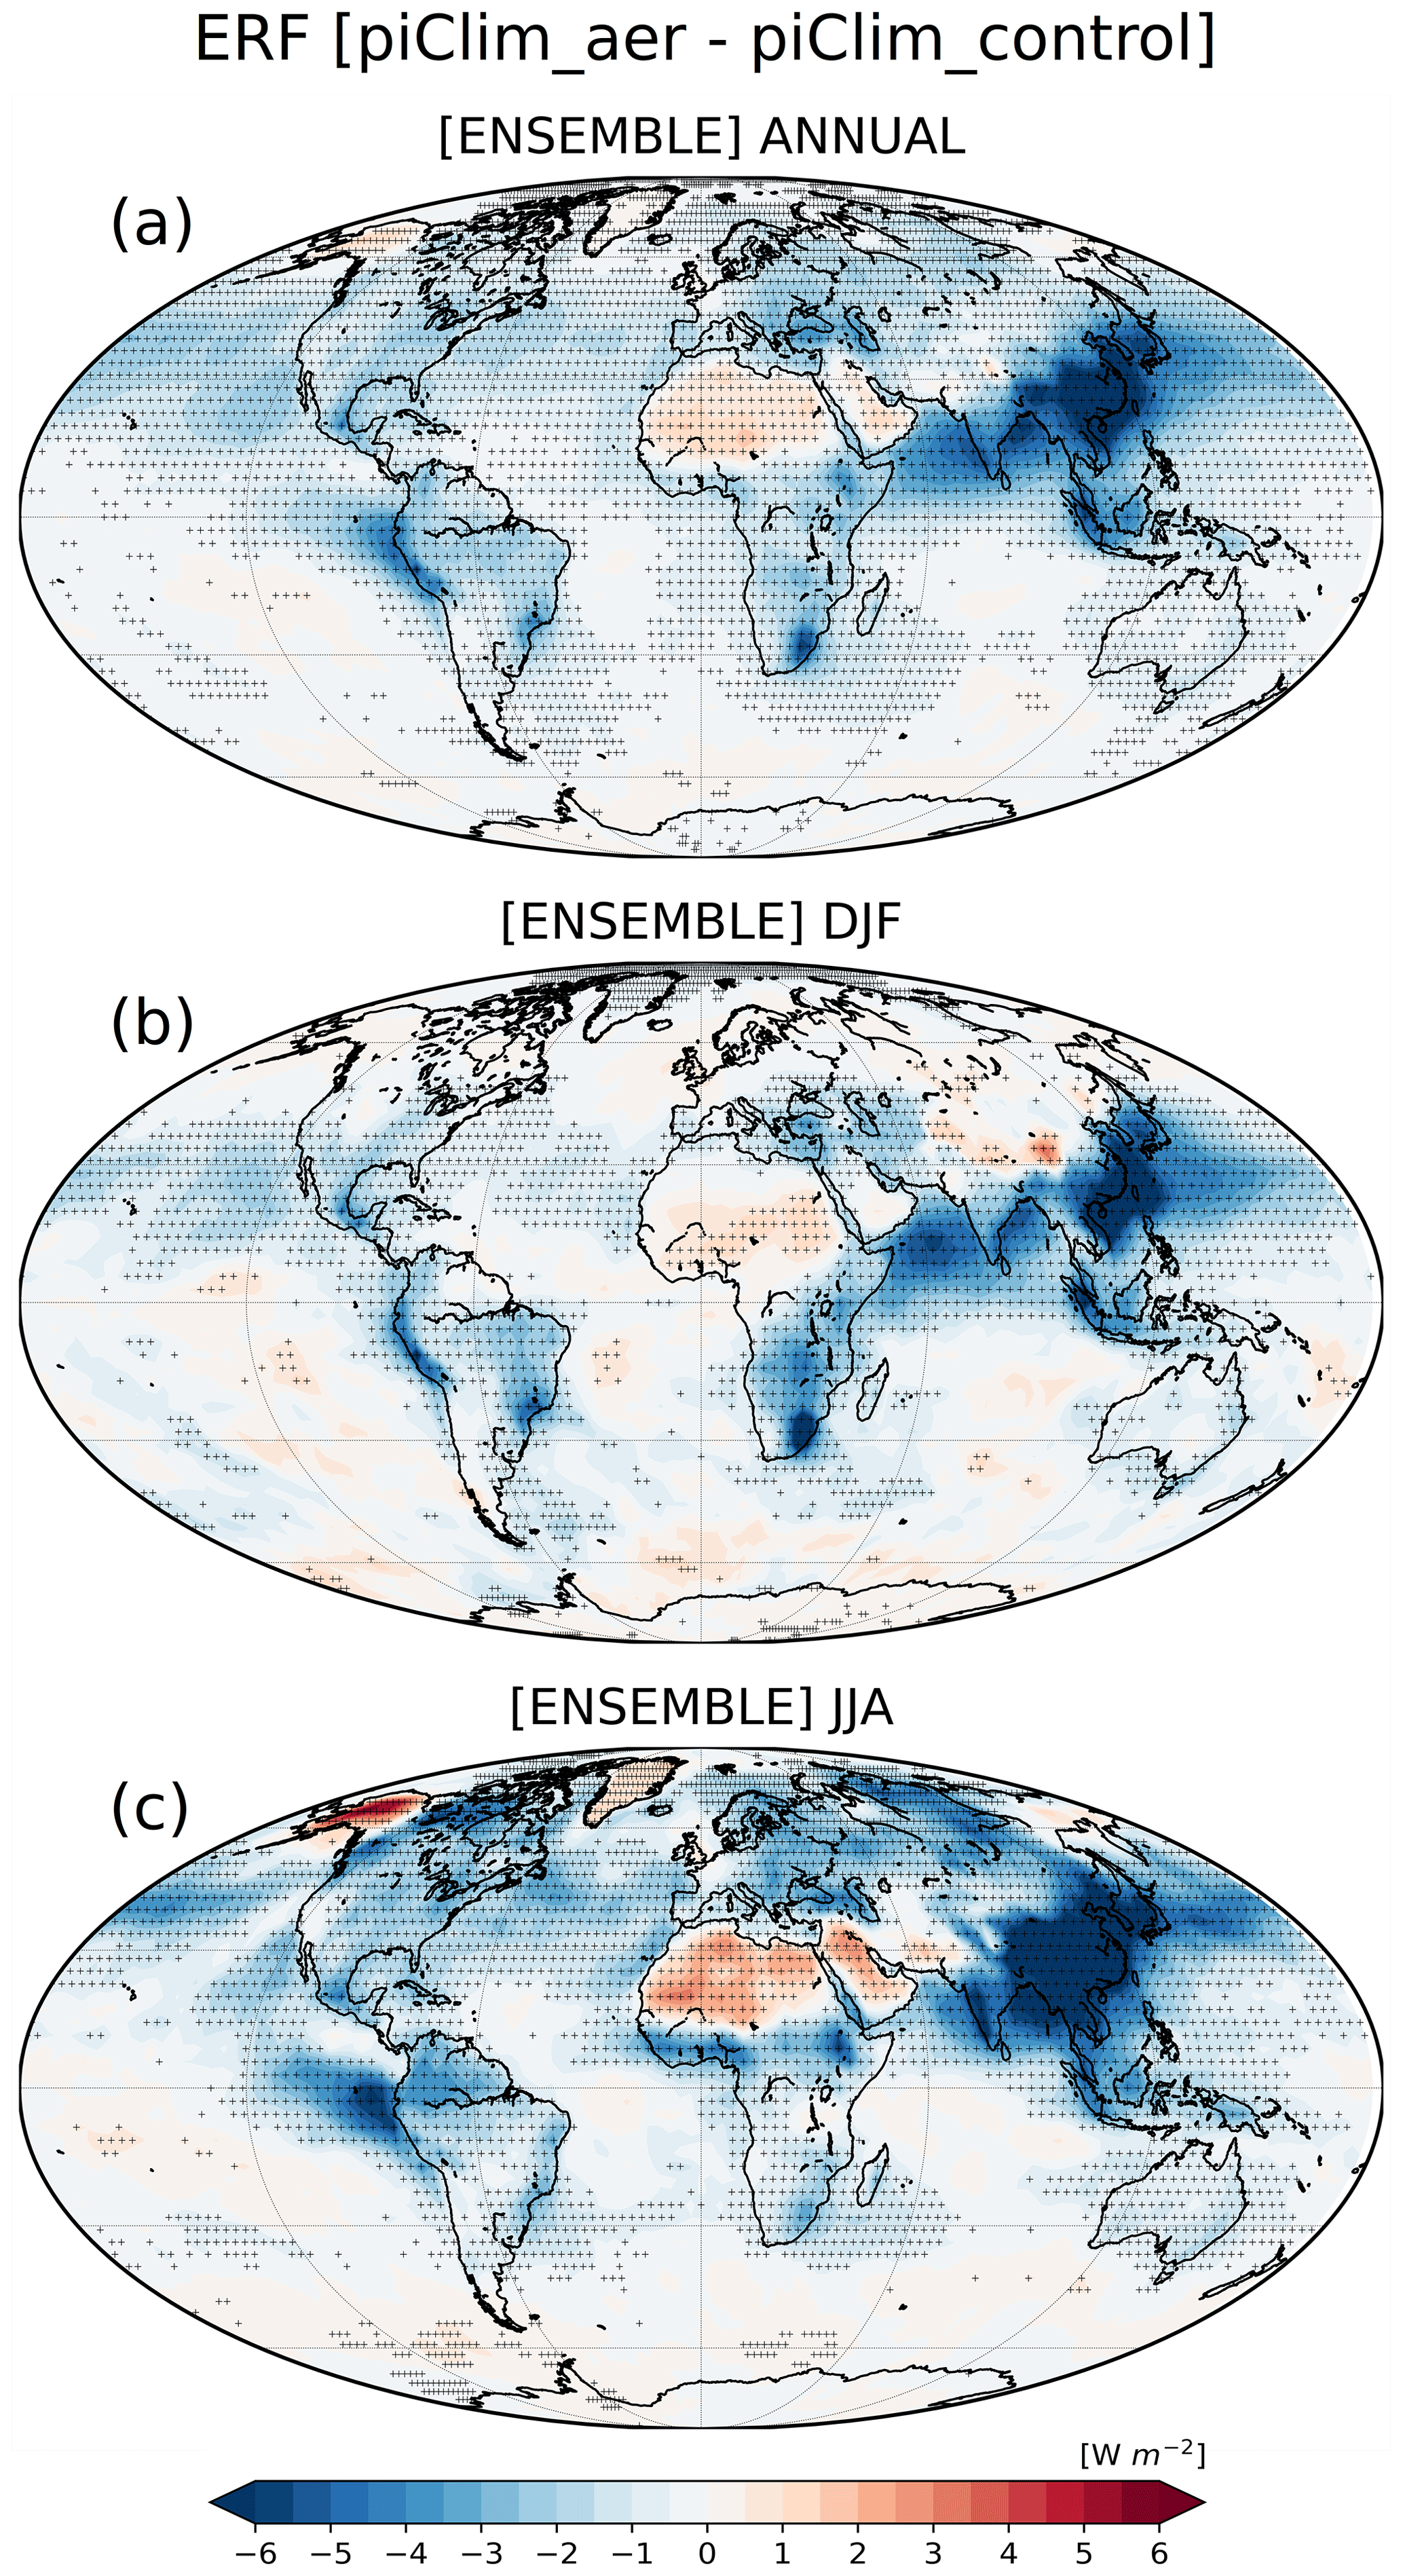
Figure 3Differences between piClim-aer and piClim-control in the net radiative flux (W m−2) at TOA including both SW and LW (all-aerosol ERF) for the ensemble of 10 models (a) on an annual basis, (b) for DJF and (c) for JJA. The dot shading indicates areas in which the differences are statistically significant at the 95 % confidence level.
The aerosol perturbation ERFs on an annual basis for each one of the models used in the ensemble are illustrated in Fig. 4. Figures S1 and S2 in the Supplement show the aerosol perturbation ERFs for each model, for DJF and for JJA, respectively. Despite regional differences, the spatially extensive negative ERF at the TOA over continental areas with the largest negative ERF values over East Asia and the positive ERF over the Sahara are robust features for all models on an annual basis (Fig. 4) and JJA (Fig. S2). Positive ERF values over the Arabian Desert, Greenland and Alaska are also seen in the majority of models on an annual basis (Fig. 4) with this signal becoming more robust and stronger during JJA (Fig. S2). In DJF there are also common features among the models such as the negative ERF values over East Asia, southern Africa and South America (Fig. S1). Differences in natural aerosols like dust could potentially also contribute to the positive ERF (e.g., in the case of the strong positive ERF in CESM2).

Figure 4Annual differences between piClim-aer and piClim-control in the net radiative flux (W m−2) at TOA including both SW and LW (aerosol ERF) for each one of the models used for the ensemble. The dot shading indicates areas in which the differences are statistically significant at the 95 % confidence level.
Figure 5 provides a comprehensive multi-model overview of the zonal mean aerosol TOA ERF (with ±1σ range of the 10 models), with the largest negative values found over the midlatitudes of the Northern Hemisphere (40∘ N) for the annual analysis (−2.1 W m−2 at 40∘ N), for JJA (−2.7 W m−2 at 40∘ N) and for DJF (−1.3 W m−2 at 30∘ N).
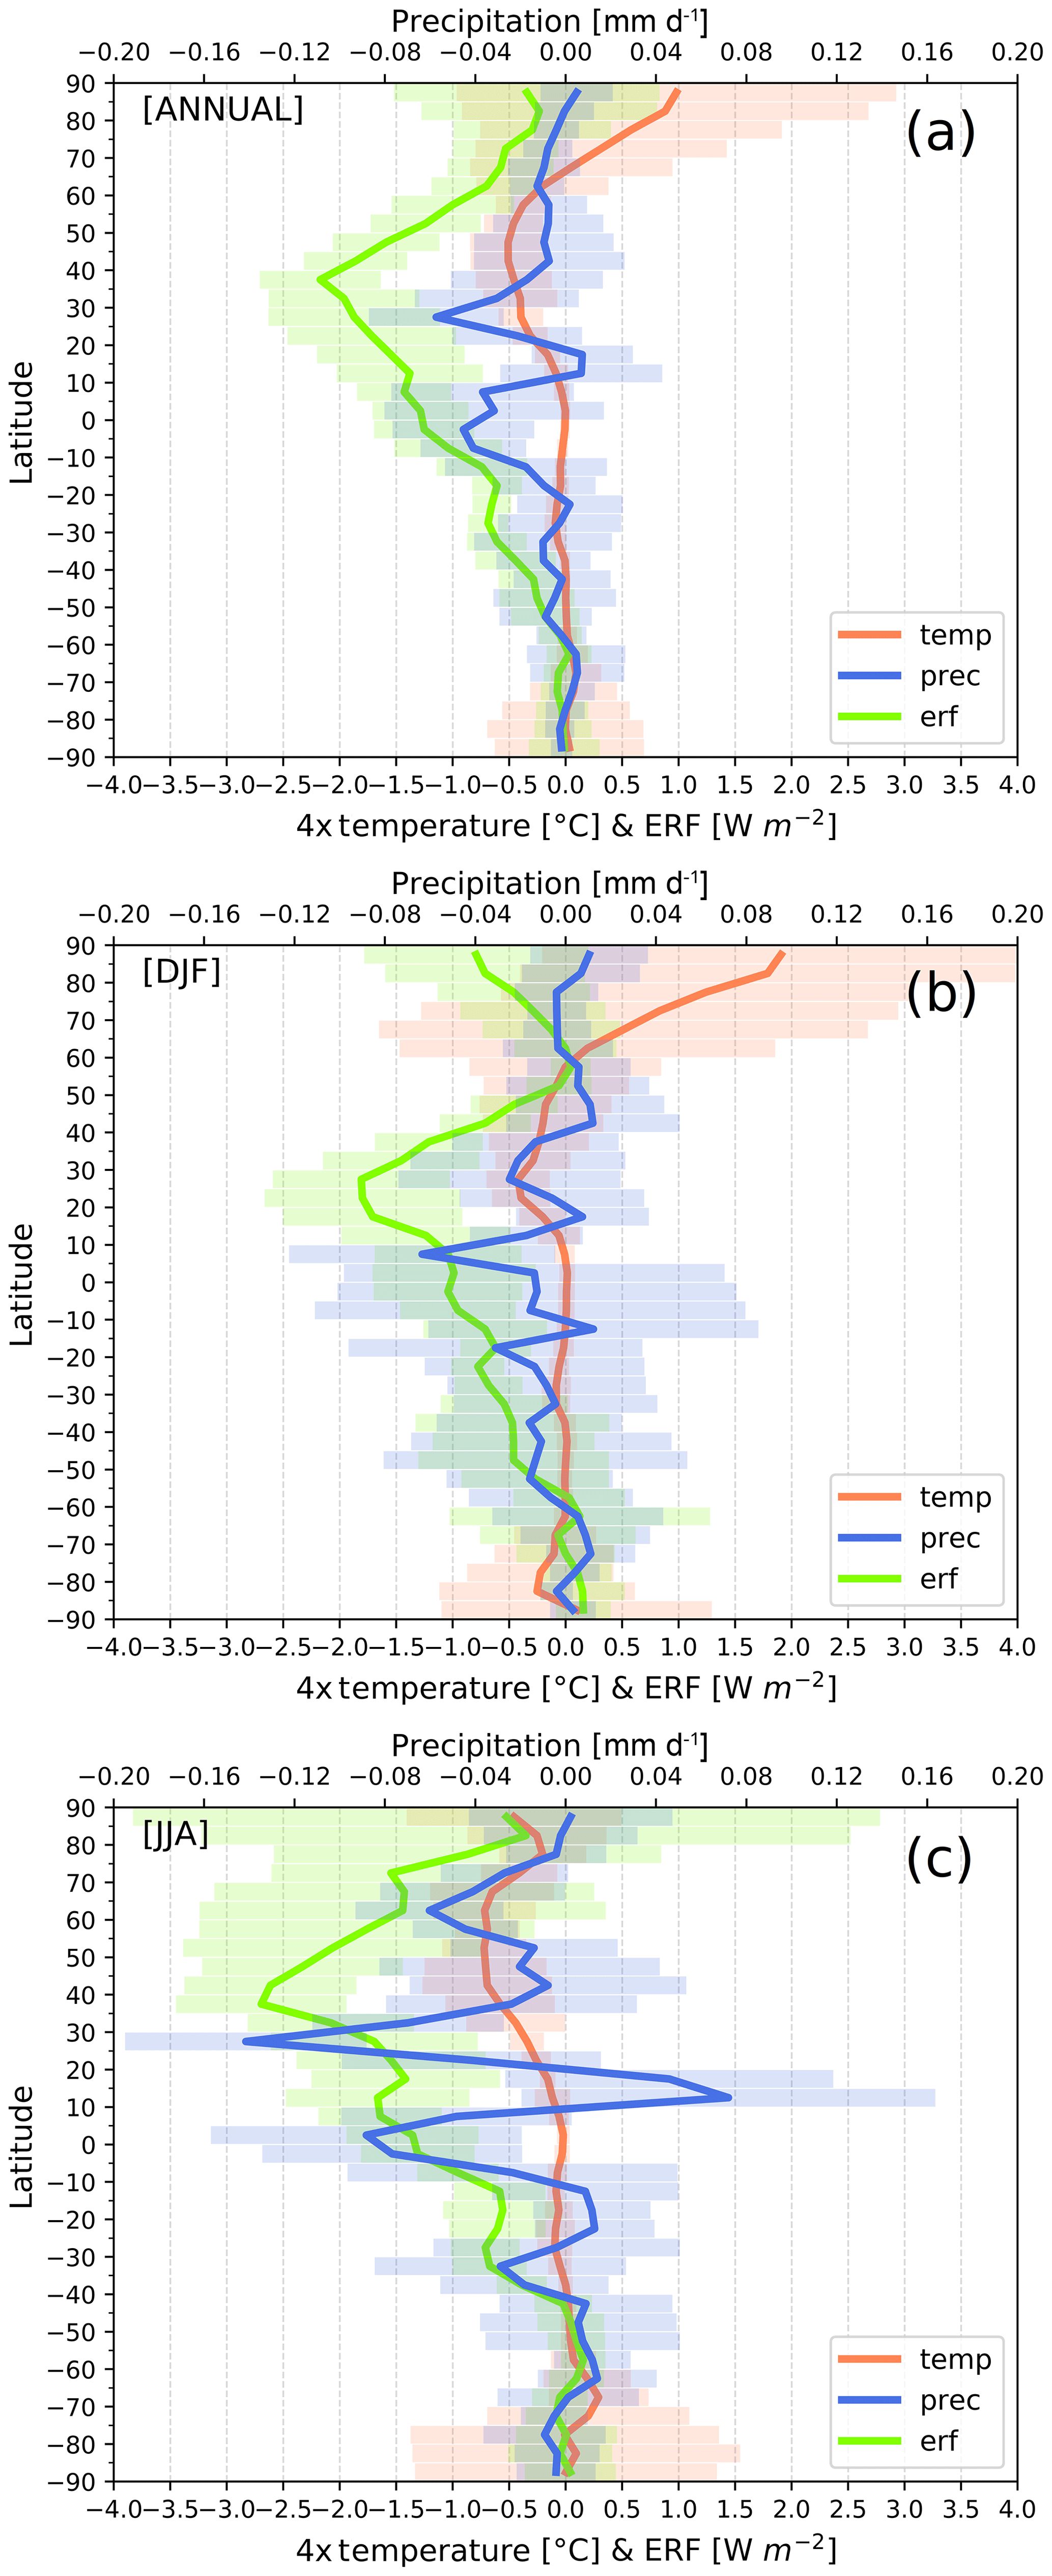
Figure 5Zonal means of the differences between piClim-aer and piClim-control in ERF (W m−2) with green line, in near-surface temperature (∘C) with pink line and in precipitation (mm d−1) with blue line for the ensemble of 10 models (a) on an annual basis, (b) for DJF and (c) for JJA. The shaded bands show ±1σ of the 10-model ensemble. Mind that the temperature difference has been multiplied by a factor of 4.
In this study, the piClim-SO2, piClim-BC and piClim-OC simulations were not available for all the participating models to decompose their respective ERF responses. Nevertheless, the available piClim-SO2, piClim-BC and piClim-OC simulations for CNRM-ESM2-1, MRI-ESM2-0 and NorESM2-LM (Fig. S3) show that their sulfate ERF patterns are similar to the all-aerosol ERF patterns (Fig. 4) indicating the overall dominating role of sulfates in the all-aerosols ERF (although there are regions where the role of BC outweighs the role of sulfates in the all-aerosols ERF).
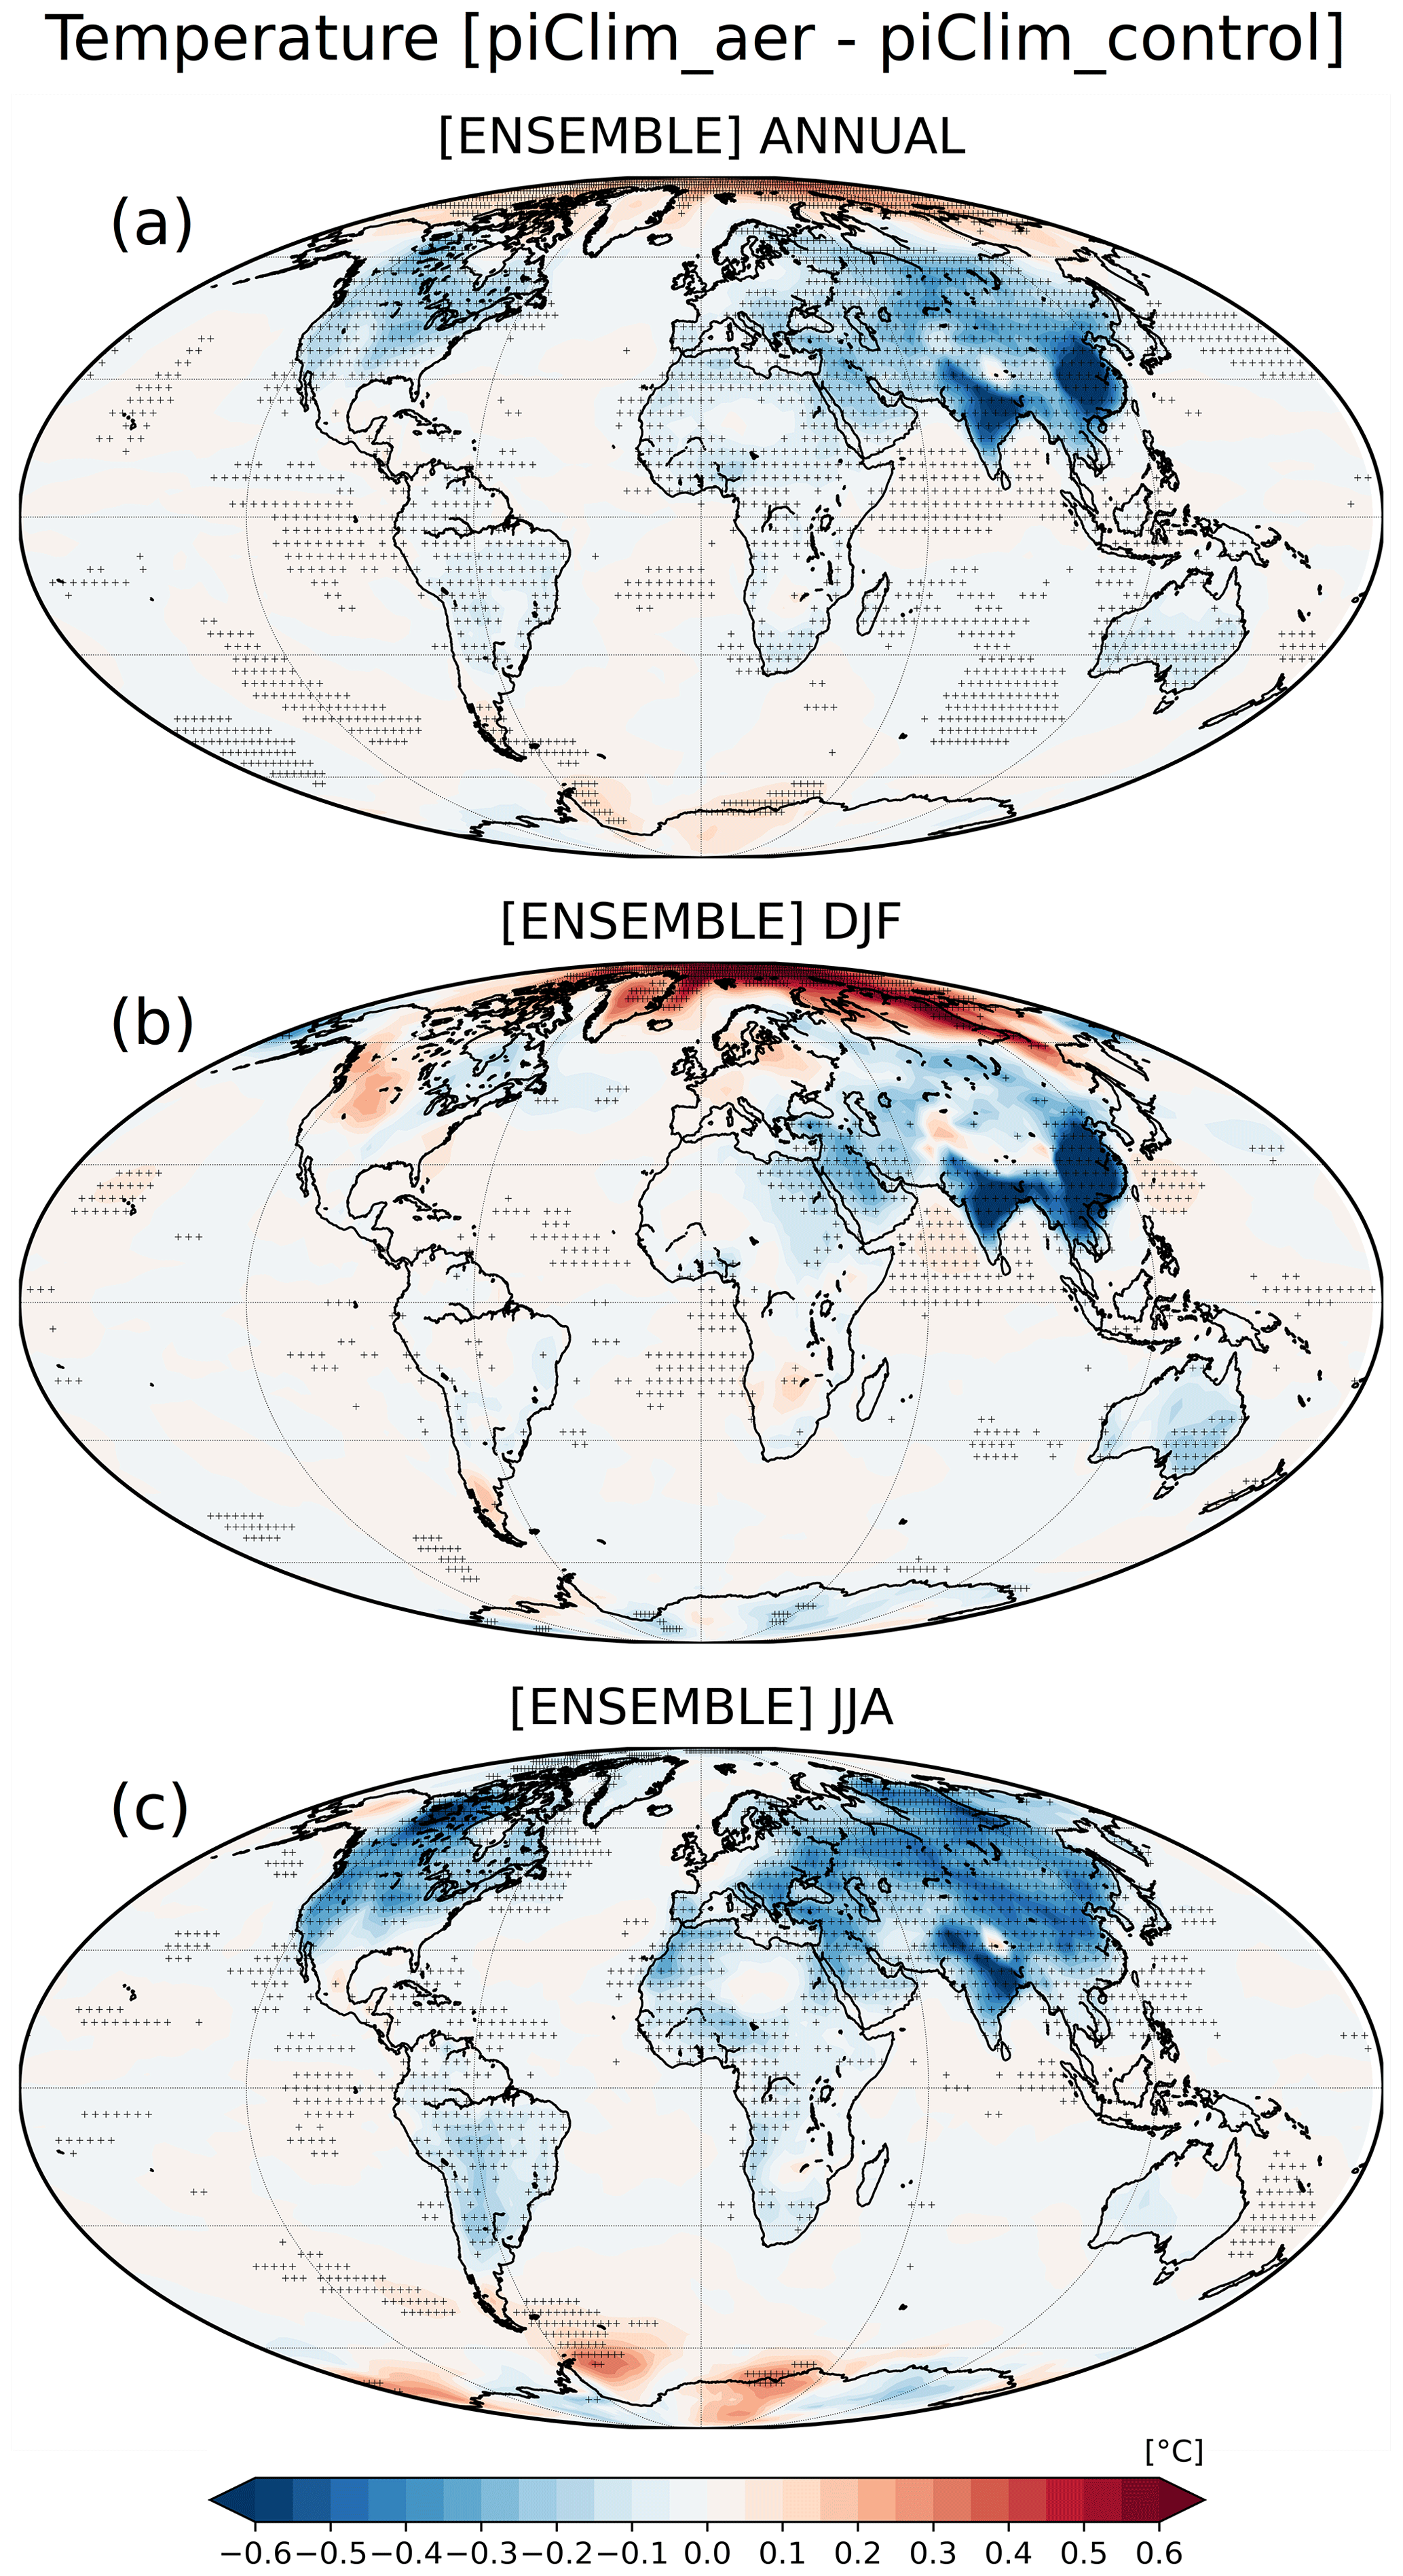
Figure 6Differences between piClim-aer and piClim-control in near-surface temperature (∘C) for the ensemble of 10 models (a) on an annual basis, (b) for DJF and (c) for JJA. The dot shading indicates areas in which the differences are statistically significant at the 95 % confidence level.
3.2 Near-surface temperature changes
The fast temperature responses on pre-industrial climate due to present-day aerosols are illustrated in Fig. 6 with the differences between piClim-aer and piClim-control in near-surface temperature for the ensemble of the 10 models on an annual basis as well as for DJF and JJA, separately. The mean fast temperature response values (global, Northern Hemisphere and Southern Hemisphere) for each model on an annual basis, DJF and JJA are shown in Table 2. On an annual basis (Fig. 6a), there is an overall cooling over the continental areas especially in the Northern Hemisphere with the largest cooling over East Asia and India in response to the SO2 emissions and the pattern of ERF. The cooling in the Northern Hemisphere is generally enhanced during the boreal summer (Fig. 6c) following the more negative ERF values presented in Sect. 3.1 for this season (Fig. 3c). The zonal means of the fast temperature responses (Fig. 5) reveal a general cooling over the midlatitudes in the Northern Hemisphere on an annual basis (up to −0.12 ∘C at 45∘ N), during JJA (−0.2 ∘C at 45∘ N) and during DJF (−0.1 ∘C at 30∘ N). These values are smaller compared to multi-model studies that incorporate both fast and slow responses. For example, multi-model sensitivity experiments with perturbations in anthropogenic emissions of SO2, BC and OC showed that the removal of present-day anthropogenic aerosol emissions induces a global mean surface heating of 0.5–1.1 ∘C, with sulfate aerosols being the dominant surface air temperature driver for the present-day emissions (Samset et al., 2018). Another multi-model study indicated a global mean surface temperature increase of 0.7 ∘C in response to the reduction in SO2, with the zonal mean temperature changes increasing with latitude up to a value of around 2.5 ∘C at the North Pole (Baker et al., 2015). In a recent modeling study it was shown that removing SO2 emissions from any of the main emission regions in the Northern Hemisphere (North America, Europe, East and South Asia) results in significant warming across the Northern Hemisphere with a preferred spatial pattern yet a varying magnitude (Kasoar et al., 2018). Simulated surface temperature changes due to the removal of US anthropogenic SO2 emissions revealed robust patterns of temperature responses over land, with increases in temperature for most of the Northern Hemisphere land regions and the strongest response towards the Arctic (Conley et al., 2018; Shindell et al., 2015).

Figure 7Annual differences between piClim-aer and piClim-control in near-surface temperature (∘C) for each one of the models used for the ensemble. The dot shading indicates areas in which the differences are statistically significant at the 95 % confidence level.
The fast temperature responses for each one of the models on annual basis are illustrated in Fig. 7, while Figs. S4 and S5 show the respective patterns for DJF and JJA. Most models show continental cooling on an annual basis with a robust feature of cooling over East Asia (Fig. 7), while the continental cooling in the Northern Hemisphere becomes stronger in JJA (Fig. S5). However, there are regional differences among the models in the pattern of induced fast temperature responses especially over Europe, North America and Africa on annual basis as well as for DJF and JJA. The available piClim-SO2, piClim-BC and piClim-OC simulations of three models (CNRM-ESM2-1, MRI-ESM2-0 and NorESM2) show that the patterns of temperature differences between piClim-SO2 and piClim-control resemble the patterns of the differences between piClim-aer and piClim-control (Fig. S6 vs. Fig. 7). This is in line with previous multi-model studies showing that sulfates are the dominant aerosol surface temperature driver for the present-day emissions (Baker et al., 2015; Samset et al., 2018).

Figure 8Differences between piClim-aer and piClim-control in precipitation (mm d−1) for the ensemble of 10 models (a) on an annual basis, (b) for DJF and (c) for JJA. The dot shading indicates areas in which the differences are statistically significant at the 95 % confidence level.
It is interesting to note the warming seen in the Arctic on the annual basis (Fig. 6a), which is not apparent in JJA (Fig. 6c) but becomes stronger in DJF (Fig. 6b). Practically, the DJF warming signal determines the annual warming signal over the Arctic. As can be seen in Fig. 5, in the northern polar latitudes there is a warming signal on an annual basis (up to 0.25 ∘C) and in DJF (up to 0.45 ∘C), but the model range is large. The pattern of ERF perturbation over the Arctic in DJF (Fig. 3b) cannot explain this warming signal, but the aerosol-induced circulation changes discussed in Sect. 3.3 provide a plausible explanation. Specifically, the wind vector and geopotential height (GH) differences at 850 hPa between piClim-aer and piClim-control (see discussion on Fig. 9b in Sect. 3.3) reveal a positive GH anomaly (anticyclonic anomaly) over northern Siberia and part of the Arctic which could induce adiabatic heating of the subsiding air. Furthermore, there is a characteristic dipole pattern with intensification of the Icelandic Low (cyclonic anomaly) and an anticyclonic anomaly over southeastern Europe and the Mediterranean inducing warm air advection towards the northern polar latitudes. Although sea ice is fixed in these simulations, snow and ice over land can change from the Arctic warming, thus activating albedo feedbacks which could potentially further amplify the warming signal. However, the respective changes in snow cover fraction over land between piClim-aer and piClim-control simulations (not shown) do not support such an albedo feedback. This is consistent with the fact that ERF changes and thus Arctic radiation changes do not seem to be a plausible explanation for the DJF Arctic warming. Furthermore, in these simulations there are no ocean circulation changes, and it remains as a plausible cause for the warming, the atmospheric circulation changes which are verified from the geopotential height and wind vector changes at 850 hPa.
Several models show this slight warming in regions of the Arctic on an annual basis, with CESM2 and NorESM2 revealing the largest warming signal (Fig. 7). This feature is stronger and more robust among the models during DJF (Fig. S4) implying the role of circulation changes rather than ERF as a plausible cause. For example, for CESM2 and NorESM2 there is no positive ERF to account for the Arctic warming (Fig. S1), but the DJF circulation anomalies (see discussion on Fig. S9 in Sect. 3.3) reveal a cyclonic (lower GH) anomaly over Europe which in association with an anticyclonic anomaly over Siberia induces a warm advection at the eastern side of the cyclonic anomaly (or western side of the anticyclonic anomaly) towards the polar regions. Furthermore, the available piClim-SO2, piClim-BC and piClim-OC simulations for NorESM2 (Fig. S6) show that the pattern of Arctic warming seen from the temperature differences between piClim-aer and piClim-control (Fig. 7) is similar to the pattern of temperature differences between piClim-SO2 and piClim-control and not to either piClim-BC or piClim-OC (Fig. S6). So, the heating due to present-day BC emissions cannot justify this warming in NorESM2. This warming signal in the Arctic in response to present-day cooling aerosols is also seen in a PDRMIP multi-model study from the pattern of fast temperature responses (with fixed SST) in perturbation experiments with a 5-fold increase in SO4 over Asia or Europe (see Fig. 2 in Liu et al., 2018). However, this is not a robust result as it is not evident in other previous multi-model perturbation experiments. For example, in a recent multi-model study for the Arctic, perturbation experiments with fixed SSTs applying a 10-fold increase in BC concentrations/emissions and a 5-fold increase in SO4 concentrations/emissions showed a temperature increase of roughly 0.2 ∘C and a temperature decrease of roughly −0.3 ∘C, respectively (see Fig. S2 in Stjern et al., 2019). Stjern et al. (2019) noted the large intermodel range in both slow and fast temperature responses over the Arctic, showing that the fast temperature responses are very small compared to the slow responses. Model sensitivity experiments by increasing SO2 in Europe, North America, East Asia and South Asia showed a consistent cooling almost everywhere in the Northern Hemisphere, with the Arctic exhibiting the largest temperature response in all experiments, but these results were considering both slow and fast temperature responses (Lewinschal et al., 2019). There are also single-model studies (Sand et al., 2013) and multi-model studies (Stjern et al., 2017) indicating relatively large responses in the Arctic to BC perturbation but with particularly large intermodel range.
3.3 Precipitation and circulation changes
The fast precipitation responses on pre-industrial climate due to present-day aerosols are illustrated in Fig. 8 with the differences between piClim-aer and piClim-control in precipitation for the ensemble of the 10 models on an annual basis as well as for DJF and JJA. Similarly, Fig. 9 shows the respective fast circulation responses based on aerosol-induced changes in the wind vectors and GH at 850 hPa. Generally, the largest fast precipitation responses are seen in the tropical belt regions with the highest precipitation rates, while the shift in pattern of these responses from DJF to JJA is linked possibly with a northward movement of the ITCZ from winter to summer (Fig. 8). The mean fast precipitation response values (global, Northern Hemisphere and Southern Hemisphere) for each model on an annual basis, DJF and JJA are shown in Table 2.
These fast precipitation responses are characterized generally by a reduction over parts of continental regions (e.g., East Asia, central and southern Africa, and Central and South America) with a global annual change of mm d−1. As has been shown in previous studies (Samset et al., 2016; Liu et al., 2018) there is strong correlation between global precipitation “fast” response and atmospheric absorption revealing the thermodynamic influence (due to cooling) on precipitation reduction at the global scale, but regional energy budget analysis clearly indicates the importance of dynamical contributions for heat transport at regional level (Muller and O'Gorman, 2011; Richardson et al., 2016; Liu et al., 2018). Liu et al. (2018) showed that, in sulfate perturbation experiments in ocean coupled simulations (fast + slow responses) or in SST fixed simulations (fast responses), the diabatic radiative term has only a small contribution to the changes in precipitation over almost all regions, whereas regional precipitation is mostly controlled by the atmospheric dynamics (see their Fig. S5). The pattern of annual precipitation responses (Fig. 8a) is very similar to the pattern of the fast precipitation experiments with a 5-fold increase in SO4 in a PDRMIP multi-model study (see Fig. 4 from Samset et al., 2016). The zonal means of fast precipitation responses on an annual basis show overall small reductions over the Northern Hemisphere, but the key feature is the appearance of the larger changes in the tropical belt with a southward shift of a decrease–increase pattern (Fig. 5a). This pattern exhibits some similarities with Fig. 2d from Hwang et al. (2013) indicating that anthropogenic aerosol cooling of the Northern Hemisphere is the primary cause of a consistent southward shift of the tropical rain belt across general circulation models (GCMs). The dimming over the Northern Hemisphere causes a relative cooling of the Northern Hemisphere compared to the Southern Hemisphere, which induces a southward shift of the northern edge of the tropical rain belt. Myhre et al. (2017) noted that over land, increased anthropogenic sulfate aerosols induce generally reduced precipitation, such as over equatorial Africa or South Asia, including both fast and slow precipitation responses. Multi-model studies show that the total precipitation response in perturbation experiments with increased/decreased sulfate aerosols is associated with a southward/northward shift of the ITCZ in response to hemispherically asymmetric cooling from a Northern Hemisphere aerosol perturbation (e.g., Acosta Navarro et al., 2017; Allen et al., 2015), leading the ITCZ and tropical precipitation to shift away from the cooled hemisphere patterns (Rotstayn et al., 2015; Liu et al., 2018; Undorf et al., 2018; Westervelt et al., 2018). In Liu et al. (2018), the pattern of precipitation changes over Asia shows similarities between ocean coupled simulations (total responses) and SST fixed simulations (fast responses) indicating both a southward shift in the storm tracks and ITCZ for the Asian sulfate increase experiment (see their Fig. S5). In another multi-model study, it was shown that in response to an idealized anthropogenic aerosol, fast and slow ITCZ shifts oppose each other with the slow ITCZ southward shift dominating over the small fast northward ITCZ shift (Voigt et al., 2017). The small fast ITCZ northward shift differs from our results, but in the study by Voigt et al. (2017) only aerosol–radiation interactions were considered. Allen and Ajoku (2016) reported that the increase in aerosols over the 20th century has led to contraction of the northern tropical belt, thereby offsetting part of the widening associated with the increase in GHGs. These processes partially also explain the southward shift of the NH tropical edge from the 1950s to the 1980s (Allen et al., 2015; Brönnimann et al., 2015) and the severe drought in the Sahel that peaked in the mid-1980s (Rotstayn and Lohmann, 2002; Undorf et al., 2018).

Figure 9Differences between piClim-aer and piClim-control in geopotential height (m) and wind vectors at the 850 hPa pressure level for the ensemble of 10 models (a) on an annual basis, (b) for DJF and (c) for JJA. The dot shading indicates areas in which the differences are statistically significant at the 95 % confidence level.
On an annual basis there is a characteristic dipole pattern of precipitation decreases over East Asia and increases over southern India, the Bay of Bengal and the South China Sea (Fig. 8a). This signal gets stronger during JJA in the monsoon season (Fig. 8c). The zonal mean precipitation changes in JJA (Fig. 5c) show a shift from −0.13 mm d−1 at 30∘ N to 0.04 mm d−1 at 15∘ N, which can be justified by the dipole pattern of precipitation decrease over East Asia and increase over southern India, the Bay of Bengal and the South China Sea in summer season. This pattern of precipitation decreases over East Asia and increases over southern India, the Bay of Bengal and the South China Sea is rather a robust feature in all model simulations for the annual basis (Fig. 10) and the monsoon season (Fig. S8). This dipole pattern of JJA precipitation responses over East Asia (Fig. 8c) is similar to the pattern of fast precipitation responses and of the changes in column-integrated dry static energy flux divergence over this region in perturbation experiments with a 5-fold increase in SO4 over Asia in a PDRMIP multi-model study (see Figs. 1 and S5 from Liu et al., 2018).
Figure 9a (annual basis) indicates a positive GH anomaly (anticyclonic anomaly) over East Asia and northern India with the horizontal wind vector anomalies implying weakening of the monsoon winds in East Asia. This is also supported by the weakening of the upward motions over East Asia, as derived from the piClim-aer and piClim-control differences in vertical velocities (not shown). The abovementioned signals for the annual basis become stronger during the monsoon season JJA (Fig. 9c) with the GH and wind vector anomalies implying a weakening of the East Asian monsoon system. This is a rather robust feature for all models in JJA (Fig. S10). Summer monsoon rainfall is caused by the faster solar heating of subtropical land compared to the adjacent oceans, which causes convergence and rising of the moist marine air over land. Therefore, the dimming weakens the monsoon flow and precipitation. Over East Asia there is an anticyclonic anomaly (Fig. 9c) which deteriorates the climatological southerly and southwesterly winds, thus weakening the East Asian monsoon and leading to lower precipitation (Fig. 8c). The anticyclonic anomaly indicated by the geopotential height anomaly at 850 hPa over East Asia is also confirmed by a positive sea level pressure anomaly over the region (not shown here). However, the effect of aerosols on the monsoon is only partly realized in these experiments because the ocean temperatures are kept fixed.
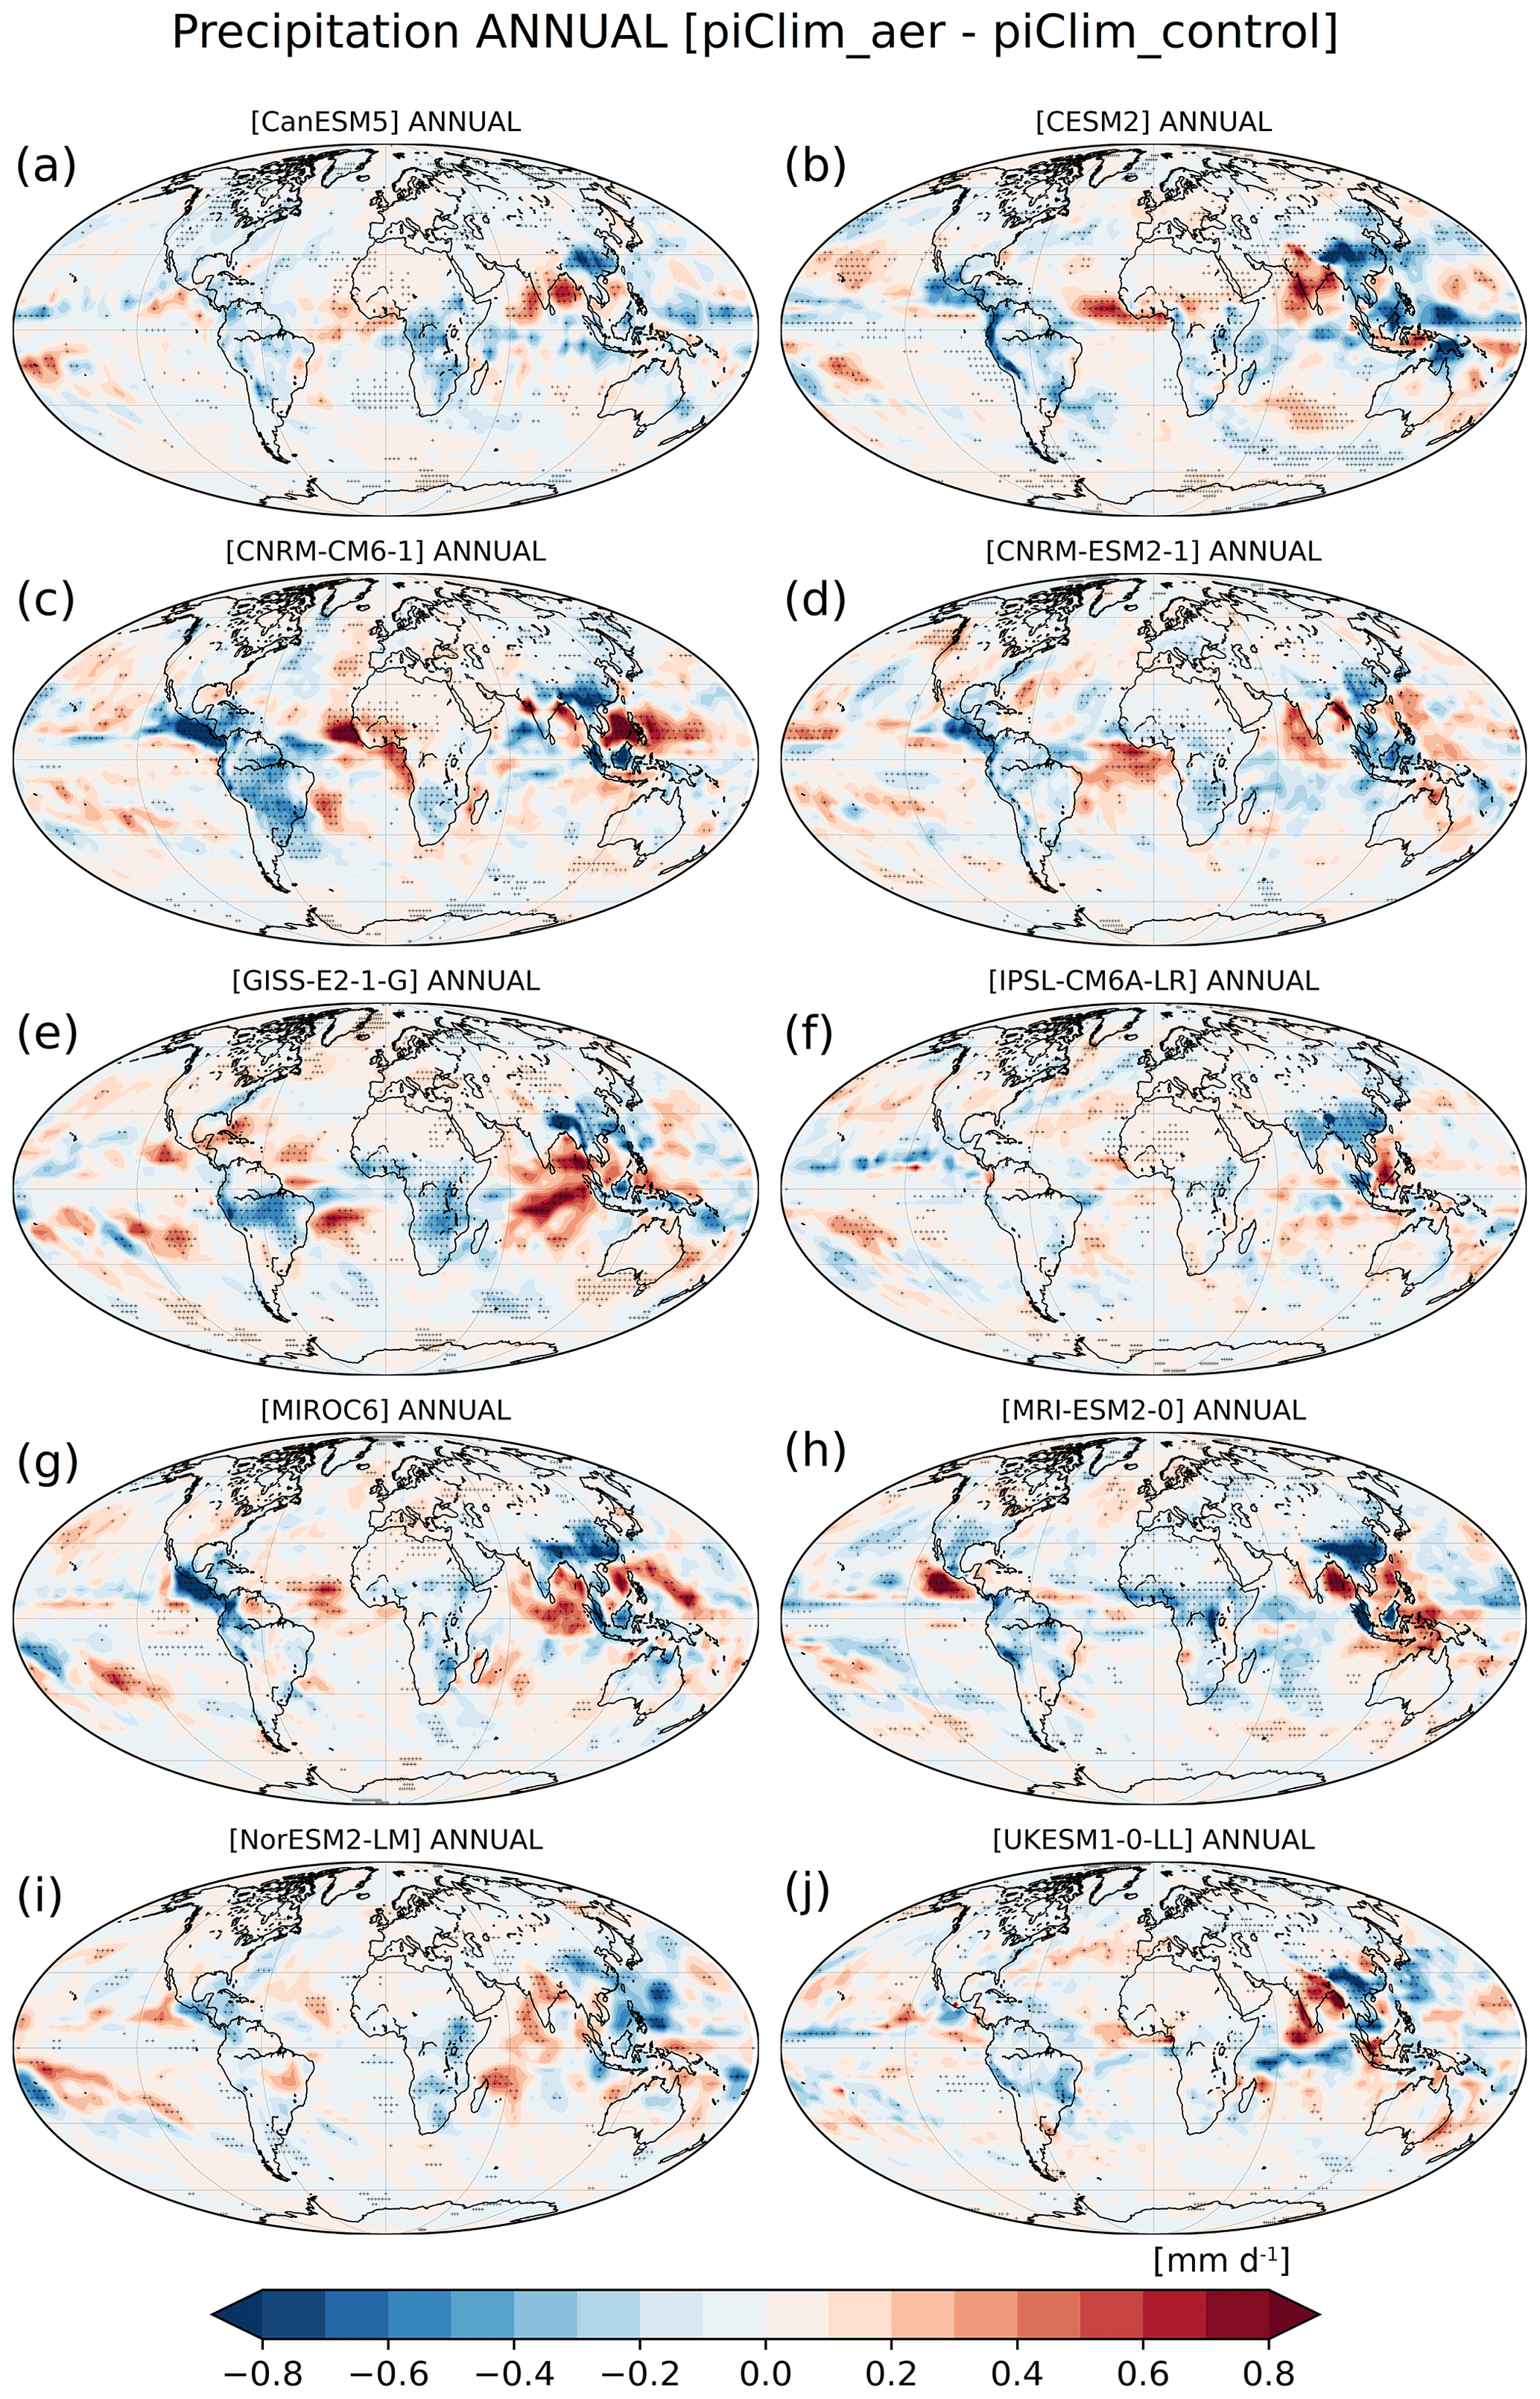
Figure 10Annual differences between piClim-aer and piClim-control in precipitation (mm d−1) for each one of the models used for the ensemble. The dot shading indicates areas in which the differences are statistically significant at the 95 % confidence level.
The importance of this precipitation decrease over East Asia due to the fast response is justified by similar results in two PDRMIP studies by Samset et al. (2016) and Liu et al. (2018) comparing fast and slow precipitation responses. Both PDRMIP studies indicate that the fast precipitation response to sulfate aerosols dominates the decrease in South and East Asian precipitation over land, while they also reveal an increase over the adjacent oceans. The decrease in land precipitation is consistent with aerosol weakening the land–sea warming contrast leading to anomalous high sea level pressure over land and weakening of the influx of moisture (monsoon weakening). This is presumably stronger in fixed SST than in ocean coupled simulations because the SSTs cannot also cool in response to the aerosols, while the cooling of the sea in the ocean coupled simulations mutes some of the impact on the land–sea contrast. So interestingly, the fast response plays a dominating role for the Asian/Indian monsoons. Over East Asia there is an anticyclonic anomaly (Fig. 9c) which deteriorates the climatological southerly and southwesterly winds, thus weakening the East Asian monsoon and leading to lower precipitation (Fig. 8c). Over India, there is a cyclonic flow anomaly extending from the Arabian Sea towards the Bay of Bengal (Fig. 9c) associated with a positive anomaly in precipitation constrained to a latitude lower than 22∘ N (Fig. 8c). This cyclonic anomaly reinforces the climatological westerly–southwesterly winds over southern India, thus strengthening the Indian monsoon and leading to more precipitation. However, the cyclonic anomaly weakens the climatological westerly flow at about 22∘ N, thus constraining the positive precipitation anomaly up to this latitude. This is presumably linked with a southward shift of the ITCZ as can be implied by the pattern of positive geopotential height anomaly north of 22∘ N and negative geopotential height anomaly south of 22∘ N (Fig. 9c). The circulation changes due to fast responses in Fig. 9c show similarities with the ones presented by Ganguly et al. (2012) (see their Fig. 2a) where also noted is a cyclonic flow anomaly in the Arabian Sea associated with a positive anomaly in precipitation as well as a positive precipitation anomaly over Bay of Bengal. Shawki et al. (2018) also showed similar results in the fast precipitation responses, with a precipitation decrease over India and increase over East Asia in JJA (see their Fig. S3), due to SO2 reductions (opposite perturbation experiment in relation to our study) in different emission regions. It was shown, however, that the location of the emission region plays an important role for shaping the detailed features and magnitude of the response. Decomposition of the total response into fast and slow components indicates that almost all of the precipitation reductions over India (south of 25∘ N), the Arabian Sea and Bay of Bengal are a result of the slow response to aerosol forcing, whereas increases in precipitation over the northwestern part of the subcontinent as well as decreases over northeast India and Nepal region are due to the fast response to aerosol forcing (Ganguly et al., 2012).
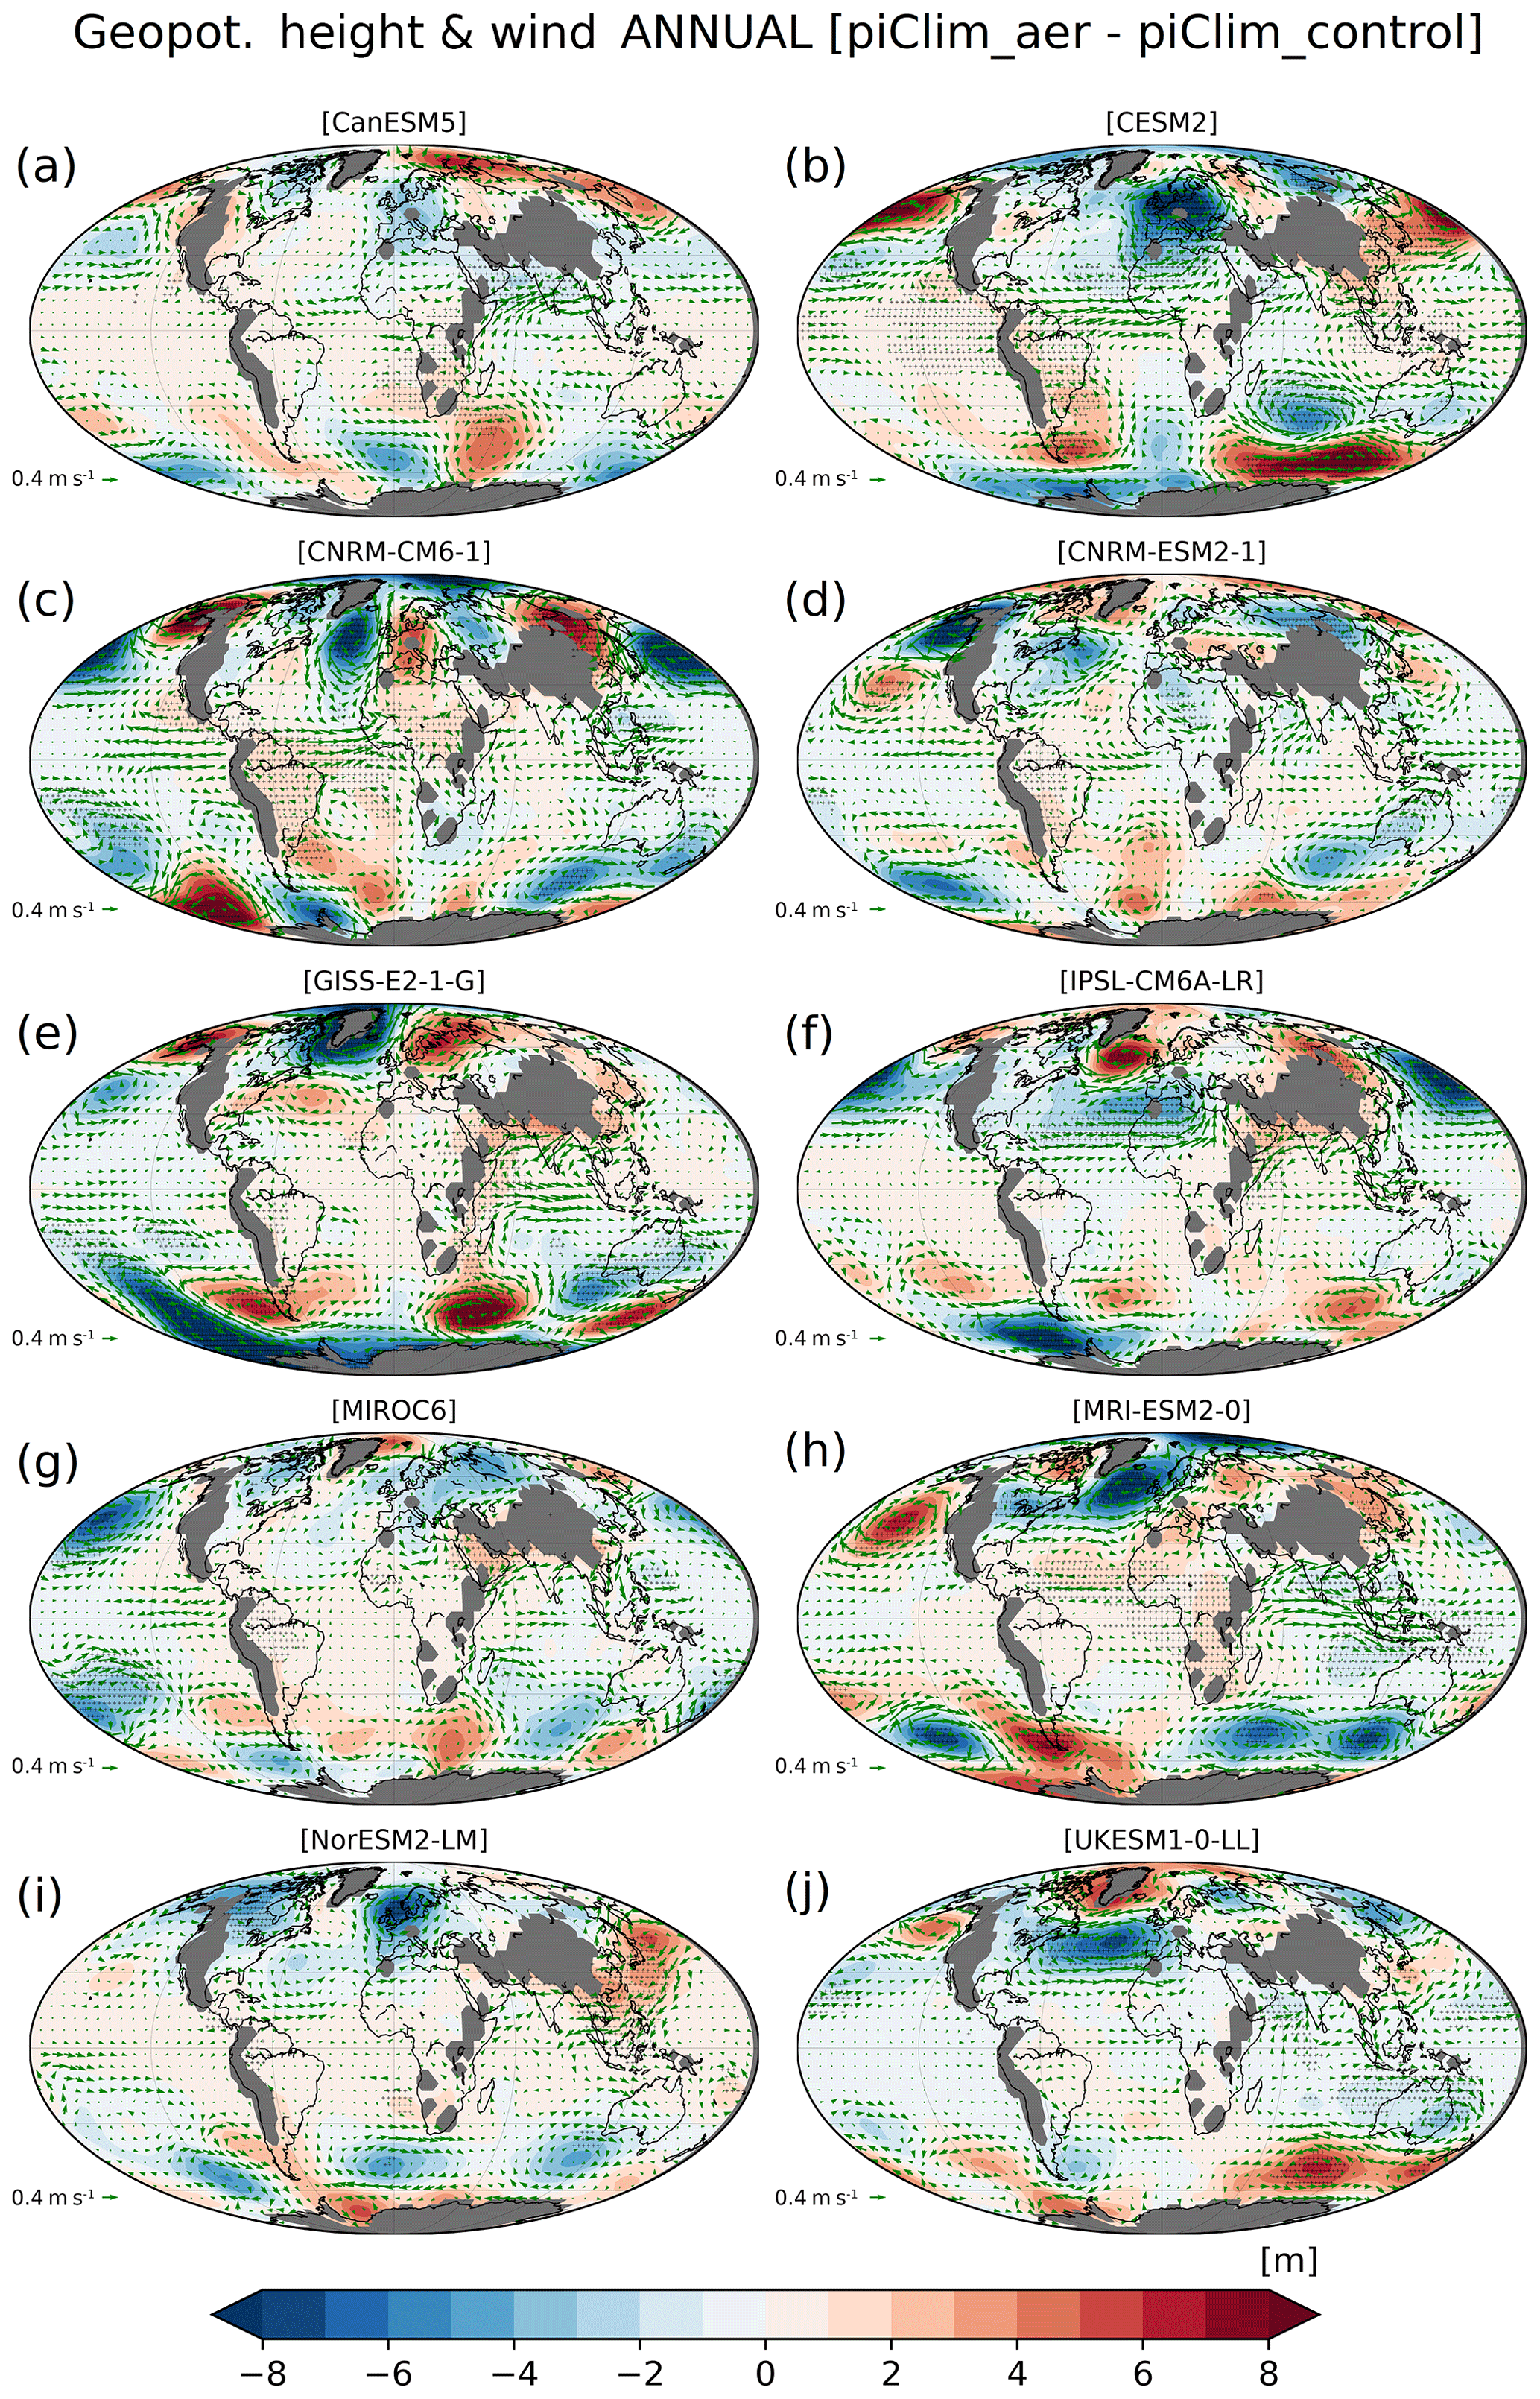
Figure 11Annual differences between piClim-aer and piClim-control in geopotential height (m) and wind vectors at the 850 hPa pressure level for each one of the models used for the ensemble. The dot shading indicates areas in which the differences are statistically significant at the 95 % confidence level. Areas with surface pressure lower than 850 hPa are masked with grey shading.
The fast response to Asian and European SO2 emissions leads to cooling of East Asia and a weakening of the East Asian summer monsoon with decrease of precipitation over East Asia and an increase to the south and over the western North Pacific (Dong et al., 2016). Bartlett et al., (2018) also showed that fast responses to increased sulfate aerosols in SO2 emission sensitivity experiments under RCP2.6 will lead to surface cooling and weakening of the East Asian monsoon circulation. A CMIP5 multi-model study showed that anthropogenic aerosols induce an overall reduction in Asian monsoon rainfall and circulation, which can be largely explained by the fast adjustments over land north of 20∘ N (Li et al., 2018). These processes may explain the observed decrease in southeast Asian monsoon precipitation during the second half of the 20th century as has been shown in several model studies (Bollasina et al., 2011; Ganguly et al., 2012; Li et al., 2015; Krishnan et al., 2016; Lau and Kim, 2017; Lin et al., 2018; Sanap, 2015; Takahashi et al., 2018; Undorf et al., 2018). Some other studies find that aerosols may (a) enhance monsoon rainfall and circulation over the South China Sea and adjacent ocean regions (Jiang et al., 2013), (b) increase precipitation due to secondary circulation changes in the jet stream by radiative cooling of sulfate aerosols (Kim et al., 2016), (c) cause intensification of the Indian summer monsoon rainfall due to the “elevated heat pump” hypothesis (Lau et al., 2006), and (d) cause an earlier onset and enhanced June rainfall over India (Bollasina et al., 2013) which is favored by remote aerosols (Bollasina et al., 2014), thus indicating high complexity and uncertainty associated with aerosol–monsoon interactions.
Another feature in the fast precipitation responses is the relative drying over Africa (southward of Sahel) on an annual basis (Fig. 8a), which is apparently a robust signal in all models (Fig. 10). The ensemble drying signal shifts from the Sahel in boreal summer JJA (Fig. 8c) to southern Africa in austral summer DJF (Fig. 8b). Most of the models show also this southward drying shift from JJA (Fig. S7) to DJF (Fig. S8). Specifically, the slight Sahel drying in JJA (Fig. 8c) is associated with Sahel cooling (Fig. 6c) and, in terms of circulation, changes with positive GH anomalies and an anticyclonic anomaly presumably weakening the West African monsoon over the Gulf of Guinea (Fig. 9c). The drying in southern Africa during austral summer DJF (Fig. 8b) is associated with positive GH anomalies and with a weakening of the southeast African monsoon winds (Fig. 9b). These results agree with studies showing a weakening of the West African monsoon and a decrease in the Sahel precipitation with increasing SO2 emissions (Dong et al., 2014). In response to US SO2 emission reductions (opposite to the perturbation in our study), in long-term perturbation experiments with three fully coupled chemistry-climate models, a northward shift of the tropical rain belt and the ITCZ was also noted delivering additional wet season rainfall to the Sahel (Westervelt et al., 2017). Similarly, other recent studies based on fully coupled chemistry-climate models showed that in West Africa and the Sahel, precipitation may increase in response to the aerosol reductions in remote regions, because an anomalous interhemispheric temperature gradient alters the position of the ITCZ (Undorf et al., 2018; Westervelt et al., 2018). Also, local black carbon and organic carbon aerosol emissions from biomass burning activities were suggested to be a main cause of local drying of the atmosphere and the observed decline in southern African dry season precipitation over the last century (Hodnebrog et al., 2016).
Figure 8a shows a relative drying over Central and South America on an annual basis with the drying seen more clearly over Central America in boreal summer JJA (Fig. 8c) and over South America in austral summer DJF (Fig. 8b). Despite the regional differences, these features are common in most of the models in JJA (Fig. S8) and DJF (Fig. S7). The Central American drying in boreal summer JJA (Fig. 8c) is associated with a positive GH anomaly and weakening of the dominating westerly flow (Fig. 9c), as well as weakening of the upward motions (not shown). These changes imply a weakening of the North American monsoon. The South American drying in austral summer DJF (Fig. 8b) is associated with a relevant cooling (Fig. 6b) and in terms of circulation changes with a weakening of the dominating westerly flow and of the South American monsoon winds (Fig. 9b).
An interesting feature in the wind vector and geopotential height (GH) differences at 850 hPa between piClim-aer and piClim-control is the anticyclonic anomaly over northern Siberia and part of the Arctic and a characteristic dipole pattern, with intensification of the Icelandic Low (cyclonic anomaly) and an anticyclonic anomaly over southeastern Europe and the Mediterranean, inducing warm air advection towards the northern polar latitudes in DJF (Fig. 9b). Furthermore, the slight near-surface warming over Europe in DJF (Fig. 6b) is not justified radiatively by the weak negative ERF over Europe (Fig. 3b) but is rather dynamically driven from the induced circulation changes, the anticyclonic anomaly over Europe and the cyclonic anomaly over the North Atlantic (Fig. 9b) causing warmer air advection and subsidence over Europe. The intensification of the Icelandic Low (cyclonic anomaly) is also apparent in the annual basis (Fig. 9a) and in JJA (Fig. 9c) and can be noted in the majority of models (although with spatial shifts) for the annual analysis (Fig. 11), for DJF (Fig. S9) and for JJA (Fig. S10). In JJA over Europe, the pattern of negative regional ERF anomalies (Fig. 3c) is similar to the pattern of near-surface temperature anomalies (Fig. 6c) pointing to radiative causes for the near-surface cooling. Over north Europe there is an anticyclonic anomaly (Fig. 9c) which could be linked to the negative regional radiative forcing and high stability. The large-scale cyclonic anomaly over the N Atlantic in JJA that extends towards Europe is presumably linked to global-scale circulation adjustment to the global-scale radiative forcing.
The pattern of aerosol-induced circulation changes in DJF looks similar to the pattern of geopotential height changes at 500 hPa in simulations with predominantly scattering aerosols and opposite in simulations with predominantly absorbing aerosols (see Fig. 12 in Allen and Sherwood, 2011). The deepening of the Icelandic Low is also apparent in the pattern of changes in sea level pressure in perturbation experiments with a 5-fold increase in SO4 over Asia or Europe in a PDRMIP multi-model study (see Fig. 7 from Liu et al., 2018). Figure 9b also indicates a slight deepening of the Aleutian Low in DJF, but this is not a robust feature for all models (Fig. S9). These circulation changes in piClim-aer simulations with the intensification of the Icelandic Low and Aleutian Low are in line with aerosol-induced circulation changes in CMIP6 historical simulations (with opposite sign) in response to aerosol reductions from 1990 to 2020 (Robert J. Allen, personal communication, 2020). Hence, it appears that CMIP6 simulations are suggesting a deepening of the Icelandic Low and Aleutian Low in response to an increase in aerosols and a weakening in response to aerosol decreases.
In this work, we use CMIP6 simulations from 10 different models (CanESM5, CESM2, CNRM-CM6-1, CNRM-ESM2-1, GISS-E2-1-G, IPSL-CM6A-LR, MIROC6, MRI-ESM2-0, NorESM2-LM and UKESM1-0-LL) to study the fast responses on pre-industrial climate due to the present-day aerosols. All models carried out two sets of simulations: the piClim-control (with all forcings set to the year 1850 using aerosol precursor emissions of 1850) and the piClim-aer (again with all forcings set to 1850 but using aerosol precursor emissions of the year 2014).
The perturbation by the present-day aerosols indicates negative TOA ERF values around the globe, especially over continental regions of the Northern Hemisphere in summer, with the largest negative values over East Asia in response to the SO2 emissions. Simulations in three models (CNRM-ESM2-1, MRI-ESM2-0 and NorESM2-LM) with individual perturbation experiments using present-day SO2 (piClim-SO2), BC (piClim-BC) and OC (piClim-OC) emissions show the dominating role of sulfates in all-aerosols ERF.
In response to the pattern of all-aerosol ERF, the fast temperature responses are characterized by cooling over the continental areas, especially in the Northern Hemisphere with the largest cooling over East Asia and India. The zonal means of the fast temperature responses reveal a general cooling over the midlatitudes in the Northern Hemisphere up to −0.12 ∘C at 45∘ N on an annual basis, up to −0.2 ∘C at 45∘ N during boreal summer and up to −0.1 ∘C at 30∘ N during boreal winter. The available piClim-SO2, piClim-BC and piClim-OC simulations of three models show that sulfates are the dominant aerosol surface temperature driver for the present-day emissions.
In the northern polar latitudes, there is a warming signal on an annual basis (up to 0.25 ∘C) and for DJF (up to 0.45 ∘C), but the model spread is large. This Arctic warming signal in DJF is not justified by the regional ERF signal but is presumably linked to aerosol-induced circulation changes causing adiabatic heating of the subsiding air over northern Siberia and part of the Arctic, as well as warm air advection from Europe towards the northern polar latitudes. NorESM2 is one of the models showing a strong warming in the Arctic in the piClim-aer simulation versus the piClim-control simulation. However, the perturbation experiment piClim-BC with present-day BC emissions does not show this warming. Instead, the pattern of Arctic warming seen from the temperature differences between piClim-aer and piClim-control resembles the perturbation experiment piClim-SO2 with present-day SO2 emissions.
The largest fast precipitation responses are seen in the tropical belt regions, generally characterized by reduction over the continental regions. The zonal mean of fast precipitation responses on an annual basis shows overall small reductions over the Northern Hemisphere, but the characteristic feature is the appearance of the larger changes in the tropical belt with a dipole decrease–increase pattern in response to a possibly southward shift of the tropical rain belt despite the fact that aerosols' effect on temperature and precipitation is only partly realized in these simulations as the sea surface temperatures are kept fixed.
The zonal mean precipitation changes in boreal summer show a shift from −0.13 mm d−1 at 30∘ N to 0.04 mm d−1 at 15∘ N, which can be largely justified by the dipole pattern of precipitation decrease over East Asia and increase over southern India, the Bay of Bengal and the South China Sea. This is a characteristic and robust feature among most of the models utilized in this study, verifying that the overall negative radiative forcing of aerosols over the land in Northern Hemisphere may cause a weakening of the East Asian monsoon system. Summer monsoon rainfall is caused by the faster solar heating of subtropical land compared to the adjacent oceans, which causes convergence and rising of the moist marine air over land. Therefore, the dimming weakens the monsoon flow and precipitation.
It is also noticed that most models in this study yield a drying signal in Africa, shifting from the Sahel in boreal summer JJA to southern Africa in austral summer DJF, linked to a weakening of the West African and southeast African monsoon systems, respectively. Furthermore, we note a drying signal in America, shifting from Central America in boreal summer JJA to South America in austral summer DJF, which is also associated with circulation changes inducing a weakening of the North American and South American monsoon winds.
The slight near-surface warming over Europe in DJF is not justified radiatively by the regional weak negative ERF but is rather dynamically driven from the induced circulation changes, the anticyclonic anomaly over Europe and the cyclonic anomaly over the N Atlantic causing warmer air advection and subsidence over Europe. The pattern of near-surface cooling in JJA over Europe is associated with the pattern of negative regional ERF anomalies.
An interesting feature in aerosol-induced circulation changes is the characteristic dipole pattern with intensification of the Icelandic Low (cyclonic anomaly) and an anticyclonic anomaly over southeastern Europe, inducing warm air advection towards the northern polar latitudes in DJF. It appears that the deepening of the Icelandic Low and the Aleutian Low in response to an increase in aerosols is a rather robust feature in the simulations presumably linked to large-scale circulation adjustment to the global-scale radiative forcing.
Finally, it should be reminded that all the above results are based on 30-year perturbation CMIP6 experiments with fixed SST and sea ice, and hence they refer to fast climate responses through rapid atmospheric adjustments. The analysis of slow climate responses in long-term centennial CMIP6 simulations through feedbacks affecting climate variables that are mediated by changes in surface temperature and involve the response of the oceans and cryosphere to the forcing are in progress within the framework of the IPCC AR6.
All CMIP6 model data used in the present study can be obtained from https://esgf-node.llnl.gov/search/cmip6/. (last access: 9 July 2020).
The supplement related to this article is available online at: https://doi.org/10.5194/acp-20-8381-2020-supplement.
PZ initiated the study. PZ, DA and AKG designed the analysis. DA performed the analysis with contributions from AKG. PZ wrote the paper with contributions from AKG. RJA contributed in the interpretation of the results and the revision of the manuscript. SEB and KT contributed in the GISS-E2-1-G simulations; OB and AS contributed in the IPSL-CM6A-LR simulations; JC contributed in the CanESM5 simulations; BJ and JM contributed in the UKESM1-0-LL simulations; MD and NO contributed in the MRI-ESM2-0 simulations; MM and PN contributed in the CNRM-CM6-1 and CNRM-ESM2-1 simulations; DO and MS contributed in the NorESM2-LM simulations, and TT contributed in the MIROC6 simulations. All authors contributed in the revision and editing of the paper.
The authors declare that they have no conflict of interest.
This article is part of the special issue “The Aerosol Chemistry Model Intercomparison Project (AerChemMIP)”. It is not associated with a conference.
This research was funded by the project “PANhellenic infrastructure for Atmospheric Composition and climatE change” (MIS 5021516), which is implemented under the action “Reinforcement of the Research and Innovation Infrastructure”, funded by the Operational Programme “Competitiveness, Entrepreneurship and Innovation” (NSRF 2014–2020) and co-financed by Greece and the European Union (European Regional Development Fund). Dirk Olivié and Michael Schulz were supported by the Research Council of Norway (grant nos. 229771, 285003 and 285013), by Notur/NorStore (NN2345K and NS2345K) and through EU H2020 grant no. 280060. Makoto Deushi and Naga Oshima were supported by the Japan Society for the Promotion of Science (grant nos. JP18H03363, JP18H05292 and JP20K04070) and the Environment Research and Technology Development Fund (2-1703, 2-2003 and 5-2001) of the Environmental Restoration and Conservation Agency, Japan. Toshihiko Takemura was supported by the Japan Society for the Promotion of Science (JSPS) KAKENHI grant number JP19H05669. The authors Susanne E. Bauer and Konstantinos Tsigaridis acknowledge funding from NASA's Atmospheric Composition Modeling and Analysis Program (ACMAP), contract number NNX15AE36G. Resources supporting this work were provided by the NASA High-End Computing (HEC) Program through the NASA Center for Climate Simulation (NCCS) at Goddard Space Flight Center. The authors from AUTH (Aristotle University of Thessaloniki) would like to acknowledge the support of the scientific computing services of the AUTH-IT Center (https://it.auth.gr/el, last access: 6 May 2020). The authors would like also to thank the two reviewers for their constructive comments.
This research has been supported by the PANhellenic infrastructure for Atmospheric Composition and climatE change (grant no. MIS 5021516).
This paper was edited by Holger Tost and reviewed by two anonymous referees.
Allen, R. J.: A 21st century northward tropical precipitation shift caused by future anthropogenic aerosol reductions, J. Geophys. Res.-Atmos., 120, 9087–9102, https://doi.org/10.1002/2015JD023623, 2015.
Allen, R. J. and Ajoku, O.: Future aerosol reductions and widening of the northern tropical belt, J. Geophys. Res.-Atmos., 121, 6765–6786, https://doi.org/10.1002/2016JD024803, 2016.
Allen, R. J. and Sherwood, S. C.: The impact of natural versus anthropogenic aerosols on atmospheric circulation in the Community Atmosphere Model, Clim. Dynam., 36, 1959–1978, https://doi.org/10.1007/s00382-010-0898-8, 2011
Allen, R. J., Evan, A. T., and Booth, B. B.: Interhemispheric Aerosol Radiative Forcing and Tropical Precipitation Shifts During the Late Twentieth Century, J. Climate, 28, 8219–8246, https://doi.org/10.1175/JCLI-D-15-0148.1, 2015.
Allen, R. J, Amiri-Farahani, A., Lamarque, J.-F., Smith, C., Drew Shindell, D., Taufiq Hassan, T., and Chung, C. E.: Observationally constrained aerosol–cloud semi-direct effects, npj Clim. Atmos. Sci., 2, 16, https://doi.org/10.1038/s41612-019-0073-9, 2019.
Andrews, T., Forster, P. M., Boucher, O., Bellouin, N., and Jones, A: Precipitation, radiative forcing and global temperature change, Geophys. Res. Lett., 37, L14701, https://doi.org/10.1029/2010GL043991, 2010.
Baker, L. H., Collins, W. J., Olivié, D. J. L., Cherian, R., Hodnebrog, Ø., Myhre, G., and Quaas, J.: Climate responses to anthropogenic emissions of short-lived climate pollutants, Atmos. Chem. Phys., 15, 8201–8216, https://doi.org/10.5194/acp-15-8201-2015, 2015.
Bartlett, R. E., Bollasina, M. A., Booth, B. B. B., Dunstone, N. J., Marenco, F., Messori, G., and Bernie, D. J.: Do differences in future sulfate emission pathways matter for near-term climate?, A case study for the Asian monsoon, Clim. Dynam., 50, 1863–1880, https://doi.org/10.1007/s00382-017-3726-6, 2018.
Bauer, S. E., Tsigaridis, K., Faluvegi, G., Kelley, M., Lo, K. K., Ro Miller, R., Nazarenko, L., Schmidt, A. G., and Wu, J.: Historical (1850–2014) aerosol evolution and role on climate forcing using the GISS ModelE2.1 contribution to CMIP6, J. Adv. Model. Earth Sy., in press, https://doi.org/10.1029/2019MS001978, 2020.
Bollasina, M., Ming, Y., and Ramaswamy, V.: Anthropogenic aerosols and the weakening of the South Asian summer monsoon, Science, 28, 502–505, https://doi.org/10.1126/science.1204994, 2011.
Bollasina, M. A., Ming, Y., and Ramaswamy, V.: Earlier onset of the Indian monsoon in the late twentieth century: The role of anthropogenic aerosols, Geophys. Res. Lett., 40, 3715–3720, https://doi.org/10.1002/grl.50719, 2013.
Bollasina, M. A., Ming, Y., Ramaswamy, V., Schwarzkopf, M. D., and Naik, V.: Contribution of local and remote anthropogenic aerosols to the twentieth century weakening of the South Asian Monsoon, Geophys. Res. Lett., 41, 680–687, https://doi.org/10.1002/2013GL058183, 2014.
Bond, T. C., Doherty, S. J., Fahey, D. W., Forster, P. M., Berntsen, T., DeAngelo, B. J., Flanner, M. G., Ghan, S., Karcher, B., Koch, D., Kinne, S., Kondo, Y., Quinn, P. K., Sarofim, M. C., Schultz, M. G., Schulz, M., Venkataraman, C., Zhang, H., Zhang, S., Bellouin, N., Guttikunda, S. K., Hopke, P. K., Jacobson, M. Z., Kaiser, J. W., Klimont, Z., Lohmann, U., Schwarz, J. P., Shindell, D., Storelvmo, T., Warren, S. G., and Zender, C. S.: Bounding the role of black carbon in the climate system: A scientific assessment, J. Geophys. Res., 118, 5380–5552, https://doi.org/10.1002/jgrd.50171, 2013.
Boucher, O., Randall, D., Artaxo, P., Bretherton, C., Feingold, G., Forster, P., Kerminen, V.-M., Kondo, Y., Liao, H., Lohmann, U., Rasch, P., Satheesh, S. K., Sherwood, S., Stevens, B., and Zhang, X. Y.: Clouds and Aerosols, in: Climate Change 2013: The Physical Science Basis, Contribution of Working Group I to the Fifth Assessment Report of the Intergovernmental Panel on Climate Change, edited by: Stocker, T. F., Qin, D., Plattner, G.-K., Tignor, M., Allen, S. K., Boschung, J., Nauels, A., Xia, Y., Bex, V., and Midgley, P. M., Cambridge University Press, Cambridge, United Kingdom and New York, NY, USA, 571–658, 2013.
Boucher, O., Denvil, S., Caubel, A., and Foujols, M. A.: IPSL IPSL-CM6A-LR model output prepared for CMIP6 RFMIP piClim-control, Version 20191210, Earth System Grid Federation, https://doi.org/10.22033/ESGF/CMIP6.5239, 2018.
Boucher, O., Denvil, S., Caubel, A., and Foujols, M. A.: IPSL IPSL-CM6A-LR model output prepared for CMIP6 RFMIP piClim-aer, Version 20191210, Earth System Grid Federation, https://doi.org/10.22033/ESGF/CMIP6.5237, 2019.
Brönnimann, S., Fischer, A. M, Rozanov, E., Poli, P., Compo, G. P., and Sardeshmukh, P. D.: Southward shift of the northern tropical belt from 1945 to 1980, Nat. Geosci., 8, 969–974, https://doi.org/10.1038/ngeo2568, 2015.
Cole, J. N. S., Li, J., Swart, N. C., Kharin, V. V., Lazare, M., Scinocca, J. F., Gillett, N. P., Anstey, J., Arora, V., Christian, J. R., Jiao, Y., Lee, W. G., Majaess, F., Saenko, O. A., Seiler, C., Seinen, C., Shao, A., Solheim, L., von Salzen, K., Yang, D., Winter, B., and Sigmond, M.: CCCma CanESM5 model output prepared for CMIP6 RFMIP piClim-control, Version 20191210, Earth System Grid Federation, https://doi.org/10.22033/ESGF/CMIP6.3662, 2019a.
Cole, J. N. S., Li, J., Swart, N. C., Kharin, V. V., Lazare, M., Scinocca, J. F., Gillett, N. P., Anstey, J., Arora, V., Christian, J. R., Jiao, Y., Lee, W. G., Majaess, F., Saenko, O. A., Seiler, C., Seinen, C., Shao, A., Solheim, L., von Salzen, K., Yang, D., Winter, B., and Sigmond, M.: CCCma CanESM5 model output prepared for CMIP6 RFMIP piClim-aer, Version 20191210, Earth System Grid Federation, https://doi.org/10.22033/ESGF/CMIP6.3660, 2019b.
Collins, W. J., Lamarque, J.-F., Schulz, M., Boucher, O., Eyring, V., Hegglin, M. I., Maycock, A., Myhre, G., Prather, M., Shindell, D., and Smith, S. J.: AerChemMIP: quantifying the effects of chemistry and aerosols in CMIP6, Geosci. Model Dev., 10, 585–607, https://doi.org/10.5194/gmd-10-585-2017, 2017.
Conley, A. J., Westervelt, D. M., Lamarque, J.-F., Fiore, A. M., Shindell, D., Correa, G., Faluvegi, G., and Horowitz, L. W.: Multi-model surface temperature responses to removal of U.S. sulfur dioxide emissions, J. Geophys. Res.-Atmos., 123, 2773–2796, https://doi.org/10.1002/2017JD027411, 2018.
Danabasoglu, G.: NCAR CESM2 model output prepared for CMIP6 RFMIP piClim-control, Version YYYYMMDD[1], Earth System Grid Federation, https://doi.org/10.22033/ESGF/CMIP6.7721, 2019a.
Danabasoglu, G.: NCAR CESM2 model output prepared for CMIP6 RFMIP piClim-aer, Version YYYYMMDD[1], Earth System Grid Federation, https://doi.org/10.22033/ESGF/CMIP6.7718 , 2019b.
Danabasoglu, G., Lamarque, J.-F., Bacmeister, J., Bailey, D. A., DuVivier, A. K., Edwards, J., Emmons, L. K., Fasullo, J., Garcia, R., Gettelman, A., Hannay,C., Holland, M. M., Large, W. G., Lauritzen, P. H., Lawrence, D. M., Lenaerts, J. T. M., Lindsay, K., Lipscomb, W. H., Mills, M. J., Neale, R., Oleson, K. W., Otto‐Bliesner, B., Phillips, A. S., Sacks, W., Tilmes, S., van Kampenhout, L., Vertenstein, M., Bertini, A., Dennis J., Deser, C., Fischer, C., Fox-Kemper, B., Kay, J. E., Kinnison, D., Kushner, P. J., Larson, V. E., Long, M. C., Mickelson, S., Moore, J. K., Nienhouse, E., Polvani, L., Rasch, P. J., and Strand, W. G.: The Community Earth System Model Version 2 (CESM2), J. Adv. Model. Earth Sy., 12, e2019MS001916, https://doi.org/10.1029/2019MS001916, 2020.
Forster, P. M., Richardson, T. B., Maycock, A., Smith, C. J., Samset, B. H., Myhre, G., Andrews, T., Pincus, R., and Schulz, M.: Recommendations for diagnosing effective radiative forcing from climate models for CMIP6, J. Geophys. Res., 121, 412–460, https://doi.org/10.1002/2016JD025320, 2016.
Ganguly, D., Rasch, P. J., Wang, H., and Yoon, J.-H.: Fast and slow responses of the South Asian monsoon system to anthropogenic aerosols, Geophys. Res. Lett., 39, L18804, https://doi.org/10.1029/2012GL053043, 2012.
GISS: NASA Goddard Institute for Space Studies (NASA/GISS), GISS-E2.1G model output prepared for CMIP6 RFMIP piClim-control, Version 20191210, Earth System Grid Federation, https://doi.org/10.22033/ESGF/CMIP6.7345, 2019a.
GISS: NASA Goddard Institute for Space Studies (NASA/GISS), GISS-E2.1G model output prepared for CMIP6 RFMIP piClim-aer, Version 20191210, Earth System Grid Federation, https://doi.org/10.22033/ESGF/CMIP6.7337, 2019b.
Hansen, J., Sato, M., Ruedy, R., Nazarenko, L., Lacis, A., Schmidt, G. A., Russell, G., Aleinov, I., Bauer, M., Bauer, S., Bell, N., Cairns, B., Canuto, V., Chandler, M., Cheng, Y., Del Genio, A., Faluvegi, G., Fleming, E., Friend, A., Hall, T., Jackman, C., Kelley, M., Kiang, N., Koch, D., Lean, J., Lerner, J., Lo, K., Menon, S., Miller, R., Minnis, P., Novakov, T., Oinas, V., Perlwitz, Ja., Perlwitz, Ju., Rind, D., Romanou, A., Shindell, D., Stone, P., Sun, S., Tausnev, N., Thresher, D., Wielicki, B., Wong, T., Yao, M., and Zhang, S.: Efficacy of Climate Forcings, J. Geophys. Res., 110, D18104, https://doi.org/10.1029/2005JD005776, 2005.
Haywood, J. and Boucher, O.: Estimates of the direct and indirect radiative forcing due to tropospheric aerosols: A review, Rev. Geophys., 38, 513–543, https://doi.org/10.1029/1999RG000078, 2000.
Hodnebrog, Ø., Myhre, G., Forster, P. M., Sillmann, J., and Sam-set, B. H.: Local biomass burning is a dominant cause of the observed precipitation reduction in southern Africa, Nat. Commun., 7, 11236, https://doi.org/10.1038/ncomms11236, 2016.
Hoesly, R. M., Smith, S. J., Feng, L., Klimont, Z., Janssens-Maenhout, G., Pitkanen, T., Seibert, J. J., Vu, L., Andres, R. J., Bolt, R. M., Bond, T. C., Dawidowski, L., Kholod, N., Kurokawa, J.-I., Li, M., Liu, L., Lu, Z., Moura, M. C. P., O'Rourke, P. R., and Zhang, Q.: Historical (1750–2014) anthropogenic emissions of reactive gases and aerosols from the Community Emissions Data System (CEDS), Geosci. Model Dev., 11, 369–408, https://doi.org/10.5194/gmd-11-369-2018, 2018.
Hwang, Y.-T., Frierson, D. M. W., and Kang, S. M.: Anthropogenic sulfate aerosol and the southward shift of tropical precipitation in the late 20th century, Geophys. Res. Lett., 40, 2845–2850, doi:10.1002/grl.50502, 2013
Jiang, Y., Liu, X., Yang, X.-Q., and Wang, M.: A numerical study of the effect of different aerosol types on East Asian summer clouds and precipitation, Atmos. Environ., 70, 51–63, https://doi.org/10.1016/j.atmosenv.2012.12.039, 2013.
Kasoar, M., Voulgarakis, A., Lamarque, J.-F., Shindell, D. T., Bellouin, N., Collins, W. J., Faluvegi, G., and Tsigaridis, K.: Regional and global temperature response to anthropogenic SO2 emissions from China in three climate models, Atmos. Chem. Phys., 16, 9785–9804, https://doi.org/10.5194/acp-16-9785-2016, 2016.
Kasoar, M., Shawki, D., and Voulgarakis, A.: Similar spatial patterns of global climate response to aerosols from different regions, Npj Clim. Atmos. Sci., 1, 12, https://doi.org/10.1038/s41612-018-0022-z, 2018.
Kelley, M., Schmidt, G. A., Nazarenko, L., Miller, R. L., Bauer, S. E., Ruedy, R., Russell, G. L., Aleinov, I., Bauer, M., Bleck, R., Canuto, V., Cesana, G., Cheng, Y., Clune, T. L., Cook, B., Cruz, C. A., Del Genio, A. D., Elsaesser,G. S., Faluvegi, G., Kiang, N. Y., Kim, D., Lacis, A. A., Leboissetier, A., LeGrande, A. N., Lo, K. K., Marshall, J. C., McDermid, S., Matthews, E. E., Mezuman, K., Murray, L. T., Oinas, V., Orbe, C., Pérez García-Pando, C., Perlwitz, J. P., Puma, M. J., Rind, D., Romanou, A., Shindell, D. T., Sun, S., Tausnev, N., Tsigaridis, K., Tselioudis, G., Weng, E., Wu, J., and Yao, M.-S.: GISS-E2.1: Configurations and climatology, J. Adv. Model. Earth Syst., in press, https://doi.org/10.1029/2019MS002025, 2020.
Kim, M. J., Yeh, S.-W., and Park, R. J.: Effects of sulfate aerosol forcing on East Asian summer monsoon for 1985–2010, Geophys. Res. Lett., 43, 1364–1372, https://doi.org/10.1002/2015GL067124, 2016.
Kirkevåg, A., Grini, A., Olivié, D., Seland, Ø., Alterskjær, K., Hummel, M., Karset, I. H. H., Lewinschal, A., Liu, X., Makkonen, R., Bethke, I., Griesfeller, J., Schulz, M., and Iversen, T.: A production-tagged aerosol module for Earth system models, OsloAero5.3 – extensions and updates for CAM5.3-Oslo, Geosci. Model Dev., 11, 3945–3982, https://doi.org/10.5194/gmd-11-3945-2018, 2018.
Krishnan, R., Sabin, T. P., Vellore, R., Mujumdar, M., Sanjay, J., Goswami, B. N., Hourdin, F., Dufresne, J.-L., and Terray, P.: Deciphering the desiccation trend of the South Asian monsoon hydroclimate in a warming world, Clim. Dynam., 47, 1007–1027, https://doi.org/10.1007/s00382-015-2886-5, 2016.
Kvalevåg, M. M., Samset, B. H., and Myhre, G.: Hydrological sensitivity to greenhouse gases and aerosols in a global climate model, Geophys. Res. Lett., 40, 1432–1438, https://doi.org/10.1002/grl.50318, 2013.
Lau, K.-M., Kim, M.-K., and Kim, K.-M.: Asian summer monsoon anomalies induced by aerosol direct forcing: The role of the Tibetan Plateau, Clim. Dynam., 26, 855–864, https://doi.org/10.1007/s00382-006-0114-z, 2006.
Lau, W. K. and Kim, K.: Competing influences of greenhouse warming and aerosols on Asian summer monsoon circulation and rainfall, Asia-Pacific, J. Atmos. Sci., 53, 181–194, https://doi.org/10.1007/s13143-017-0033-4, 2017.
Lewinschal, A., Ekman, A. M. L., Hansson, H.-C., Sand, M., Berntsen, T. K., and Langner, J.: Local and remote temperature response of regional SO2 emissions, Atmos. Chem. Phys., 19, 2385–2403, https://doi.org/10.5194/acp-19-2385-2019, 2019.
Li, X., Ting, M., Li, C., and Henderson, N.: Mechanisms of Asian Summer Monsoon Changes in Response to Anthropogenic Forcing in CMIP5 Models, J. Climate, 28, 4107–4125, https://doi.org/10.1175/JCLI-D-14-00559.1, 2015.
Li, X., Ting, M., and Lee, D. E.: Fast adjustments of the Asian summer monsoon to anthropogenic aerosols, Geophys. Res. Lett., 45, 1001–1010, https://doi.org/10.1002/2017GL076667, 2018.
Liu, L., Shawki, D., Voulgarakis, A., Kasoar, M., Samset, B. H., Myhre, G., Forster, P. M., Hodnebrog, Ø., Sillmann, J., Aalbergsjø, S. G., Boucher, O., Faluvegi, G., Iversen, T., Kirkevåg, A., Lamarque, J.-F., Olivié, D., Richardson, T., Shindell, D., Takemura, T., Liu, L., Shawki, D., Voulgarakis, A., Kasoar, M., Samset, B. H., Myhre, G., Forster, P. M., Hodnebrog, Ø., Sillmann, J., Aalbergsjø, S. G., Boucher, O., Faluvegi, G., Iversen, T., Kirkevåg, A., Lamarque, J.-F., Olivié, D., Richardson, T., Shindell, D., and Takemura, T.: A PDRMIP Multimodel Study on the Impacts of Regional Aerosol Forcings on Global and Regional Precipitation, J. Climate, 31, 4429–4447, https://doi.org/10.1175/JCLI-D-17-0439.1, 2018.
Lohmann, U. and Feichter, J.: Global indirect aerosol effects: a review, Atmos. Chem. Phys., 5, 715–737, https://doi.org/10.5194/acp-5-715-2005, 2005.
Michou, M., Nabat, P., Saint-Martin D., Bock, J., Decharme, B., Mallet M., Roehrig, R., Séférian, R., Sénési, S., and Voldoire, A.: Present-day and historical aerosol and ozone characteristics in CNRM CMIP6 simulations, J. Adv. Model. Earth Sy., 12, e2019MS001816, https://doi.org/10.1029/2019MS001816, 2020.
Mulcahy, J. P., Johnson, C., Jones, C. G., Povey, A. C., Scott, C. E., Sellar, A., Turnock, S. T., Woodhouse, M. T., Abraham, N. L., Andrews, M. B., Bellouin, N., Browse, J., Carslaw, K. S., Dalvi, M., Folberth, G. A., Glover, M., Grosvenor, D., Hardacre, C., Hill, R., Johnson, B., Jones, A., Kipling, Z., Mann, G., Mollard, J., O'Connor, F. M., Palmieri, J., Reddington, C., Rumbold, S. T., Richardson, M., Schutgens, N. A. J., Stier, P., Stringer, M., Tang, Y., Walton, J., Woodward, S., and Yool, A.: Description and evaluation of aerosol in UKESM1 and HadGEM3-GC3.1 CMIP6 historical simulations, Geosci. Model Dev. Discuss., https://doi.org/10.5194/gmd-2019-357, in review, 2020.
Muller, C. J. and O'Gorman, P. A.: An energetic perspective on the regional response of precipitation to climate change, Nat. Clim. Change, 1, 266–271, https://doi.org/10.1038/nclimate1169, 2011.
Myhre, G., Shindell, D., Bréon, F. M., Collins, W., Fuglestvedt, J., Huang, J., Koch, D., Lamarque, J. F., Lee, D., Mendoza, B., Nakajima, T., Robock, A., Stephens, G., Takemura, T., and Zhang, H.: Anthropogenic and natural radiative forcing, in: Climate Change 2013: The Physical Science Basis. Contribution of Working Group I to the Fifth Assessment Report of the Intergovernmental Panel on Climate Change, edited by: Stocker, T. F., Qin, D., Plattner, G.-K., Tignor, M., Allen, S. K., Nauels, A., Xia, Y., Bex, V., and Midgley, P. M., Cambridge University Press, Cambridge, United Kingdom and New York, NY, USA, 659–740, 2013.
Myhre, G., Forster, P. M., Samset, B. H., Hodnebrog, Ø., Sillmann, J., Aalbergsjø, S. G., Andrews, T., Boucher, O., Faluvegi, G., Fläschner, D., Iversen, T., Kasoar, M., Kharin, V., Kirkevåg, A., Lamarque, J., Olivié, D., Richardson, T. B., Shindell, D., Shine, K. P., Stjern C. W., Takemura, T., Voulgarakis, A., and Zwiers, F.: PDRMIP: A Precipitation Driver and Response Model Intercomparison Project – Protocol and Preliminary Results, B. Am. Meteorol. Soc., 98, 1185–1198, https://doi.org/10.1175/BAMS-D-16-0019.1, 2017.
NorESM2-LM: NCC NorESM2-LM model output prepared for CMIP6 RFMIP piClim-control, Earth System Grid Federation, available at: http://cera-www.dkrz.de/WDCC/meta/CMIP6/CMIP6.RFMIP.NCC.NorESM2-LM.piClim-control, 2018a.
NorESM2-LM: NCC NorESM2-LM model output prepared for CMIP6 RFMIP piClim-aer, Earth System Grid Federation, available at: http://cera-www.dkrz.de/WDCC/meta/CMIP6/CMIP6.RFMIP.NCC.NorESM2-LM.piClim-aer, 2018b.
O'Connor, F.: MOHC UKESM1.0-LL model output prepared for CMIP6 AerChemMIP piClim-control, Version 20200422, Earth System Grid Federation, https://doi.org/10.22033/ESGF/CMIP6.6276, 2019a.
Oliviè, D. J., Leo, B. M., Seland, Ø., Toniazzo, T., Gjermundsen, A., Graff, L. S., Debernard, J. B., Gupta, A. K., He, Y., Kirkevåg, A., Schwinger, J., Tjiputra, J., Aas, K. S., Bethke, I., Fan, Y., Griesfeller, J., Grini, A., Guo, C., Ilicak, M., Karset, I., Helene, H., Landgren, O. An., Liakka, J., Moseid, K. O., Nummelin, A., Spensberger, C., Tang, H., Zhang, Z., Heinze, C., Iversen, T., and Schulz, M.: NCC NorESM2-LM model output prepared for CMIP6 RFMIP piClim-control, Earth System Grid Federation, https://doi.org/10.22033/ESGF/CMIP6.8179, 2019a.
Oliviè, D. J., Leo, B. M., Seland, Ø., Toniazzo, T., Gjermundsen, A., Graff, L. S., Debernard, J. B., Gupta, A. K., He, Y., Kirkevåg, A., Schwinger, J., Tjiputra, J., Aas, K. S., Bethke, I., Fan, Y., Griesfeller, J., Grini, A., Guo, C., Ilicak, M., Karset, I., Helene, H., Landgren, O. An., Liakka, J., Moseid, K. O., Nummelin, A., Spensberger, C., Tang, H., Zhang, Z., Heinze, C., Iversen, T., and Schulz, M.: NCC NorESM2-LM model output prepared for CMIP6 RFMIP piClim-aer, Earth System Grid Federation, https://doi.org/10.22033/ESGF/CMIP6.8169, 2019b.
O'Connor, F.: MOHC UKESM1.0-LL model output prepared for CMIP6 AerChemMIP piClim-aer, Version 20200422, Earth System Grid Federation, https://doi.org/10.22033/ESGF/CMIP6.6270, 2019b.
Ramanathan, V. and Feng, Y.: Air pollution, greenhouse gases and climate change: Global and regional perspectives, Atmos. Environ., 43, 37–50, https://doi.org/10.1016/j.atmosenv.2008.09.063, 2009.
Richardson, T. B., Forster, P. M., Andrews, T., and Parker, D. J.: Understanding the Rapid Precipitation Response to CO2 and Aerosol Forcing on a Regional Scale, J. Climate, 29, 583–594, https://doi.org/10.1175/JCLI-D-15-0174.1, 2016.
Rosenfeld, D., Andreae, M. O., Asmi, A., Chin, M., de Leeuw, G., Donovan, D. P., Kahn, R., Kinne, S., Kivekas, N., Kulmala, M., Lau, W., Schmidt, K. S., Suni, T., Wagner, T., Wild, M., and Quaas, J.: Global observations of aerosol-cloud-precipitation-climate interactions, Rev. Geophys., 52, 750–808, https://doi.org/10.1002/2013rg000441, 2014a.
Rosenfeld, D., Sherwood, S., Wood, R., and Donner, L.: Climate Effects of Aerosol-Cloud Interactions, Science, 343, 379–380, https://doi.org/10.1126/science.1247490, 2014b.
Rotstayn, L. D. and Lohmann, U.: Tropical rainfall trends and the indirect aerosol effect, J. Climate, 15, 2103–2116, https://doi.org/10.1175/1520-0442(2002)015<2103:TRTATI>2.0.CO;2, 2002.
Rotstayn, L. D., Collier, M. A., and Luo, J.-J., Effects of declining aerosols on projections of zonally averaged tropical precipitation, Environ. Res. Lett., 10, 044018, https://doi.org/10.1088/1748-9326/10/4/044018, 2015.
Samset, B. H., Myhre, G., Forster, P. M., Hodnebrog, Ø., Andrews, T., Faluvegi, G., Fläschner, D., Kasoar, M., Kharin, V., Kirkevåg, A., Lamarque, J.-F., Olivié, D., Richardson, T., Shindell, D., Shine, K. P., Takemura, T., and Voulgarakis, A.: Fast and slow precipitation responses to individual climate forcers: A PDRMIP multimodel study, Geophys. Res. Lett., 43, 2782–2791, https://doi.org/10.1002/2016gl068064, 2016.
Samset, B. H., Sand, M., Smith, C. J., Bauer, S. E., Forster, P. M., Fuglestvedt, J. S., Osprey, S., and Schleussner, C.-F.: Climate Impacts From a Removal of Anthropogenic Aerosol Emissions, Geophys. Res. Lett., 45, 1020–1029, https://doi.org/10.1002/2017GL076079, 2018.
Sanap, S. D., Pandithurai, G., and Manoj, M. G.: On the response of Indian summer monsoon to aerosol forcing in CMIP5 model simulations, Clim. Dynam., 45, 2949–296, https://doi.org/10.1007/s00382-015-2516-2, 2015.
Sand, M., Berntsen, T. K., Kay, J. E., Lamarque, J. F., Seland, Ø., and Kirkevåg, A.: The Arctic response to remote and local forcing of black carbon, Atmos. Chem. Phys., 13, 211–224, https://doi.org/10.5194/acp-13-211-2013, 2013.
Sarangi, C., Kanawade, V. P., Tripathi, S. N., Thomas, A., and Ganguly, D.: Aerosol-induced intensification of cooling effect of clouds during Indian summer monsoon, Nat. Commun., 9, 3754, https://doi.org/10.1038/s41467-018-06015-5, 2018.
Seferian, R.: CNRM-CERFACS CNRM-ESM2-1 model output prepared for CMIP6 RFMIP piClim-control, Version 20191210, Earth System Grid Federation, https://doi.org/10.22033/ESGF/CMIP6.9646, 2019a.
Seferian, R.: CNRM-CERFACS CNRM-ESM2-1 model output prepared for CMIP6 RFMIP piClim-aer, Version 20191210, Earth System Grid Federation, https://doi.org/10.22033/ESGF/CMIP6.9644, 2019b.
Séférian, R., Nabat, P., Michou, M., Saint-Martin, D., Voldoire, A., Colin, J., Decharme, B., Delire, C., Berthet, S., Chevallier, M., Sénési, S., Franchisteguy, L., Vial, J., Mallet, M., Joetzjer, E., Geoffroy, O., Guérémy, J.-F., Moine, M.-P., Msadek, R., Ribes, A., Rocher, M., Roehrig, R., Salas-y-Mélia, D., Sanchez, E., Terray, L., Valcke, S., Waldman, R., Aumont, O., Bopp, L., Deshayes, J., Éthé, C., and Madec, G.: Evaluation of CNRM Earth-System model, CNRM-ESM2-1: role of Earth system processes in present-day and future climate, J. Adv. Model. Earth Sy., https://doi.org/10.1029/2019MS001791, 2019.
Sekiguchi, M. and Shiogama, H.: MIROC MIROC6 model output prepared for CMIP6 RFMIP piClim-control, Version 20191210, Earth System Grid Federation, https://doi.org/10.22033/ESGF/CMIP6.5697, 2019a.
Sekiguchi, M. and Shiogama, H.: MIROC MIROC6 model output prepared for CMIP6 RFMIP piClim-aer, Version 20191210, Earth System Grid Federation, https://doi.org/10.22033/ESGF/CMIP6.5694, 2019b.
Seland, Ø., Bentsen, M., Seland Graff, L., Olivié, D., Toniazzo, T., Gjermundsen, A., Debernard, J. B., Gupta, A. K., He, Y., Kirkevåg, A., Schwinger, J., Tjiputra, J., Schancke Aas, K., Bethke, I., Fan, Y., Griesfeller, J., Grini, A., Guo, C., Ilicak, M., Hafsahl Karset, I. H., Landgren, O., Liakka, J., Onsum Moseid, K., Nummelin, A., Spensberger, C., Tang, H., Zhang, Z., Heinze, C., Iverson, T., and Schulz, M.: The Norwegian Earth System Model, NorESM2 – Evaluation of theCMIP6 DECK and historical simulations, Geosci. Model Dev. Discuss., https://doi.org/10.5194/gmd-2019-378, in review, 2020.
Shawki, D., Voulgarakis, A., Chakraborty, A., Kasoar, M., and Srinivasan, J.: The South Asian monsoon response to remote aerosols: Global and regional mechanisms, J. Geophys. Res., 123, 11585–11601, https://doi.org/10.1029/2018JD028623, 2018.
Shindell, D., Kuylenstierna, J. C. I., Vignati, E., van Dingenen, R., Amann, M., Klimont, Z., Anenberg, S. C., Muller, N., Janssens-Maenhout, G., Raes, F., Schwartz, J., Faluvegi, G., Pozzoli, L., Kupiainen, K., Höglund-Isaksson, L., Emberson, L., Streets, D., Ramanathan, V., Hicks, K., Kim Oanh, N. T., Milly, G.,Williams, M., Demkine, V., and Fowler, D.: Simultaneously mitigating near-term climate change and improving human health and food security, Science, 335, 183–189, https://doi.org/10.1126/science.1210026, 2012.
Shindell, D. T., Lamarque, J.-F., Schulz, M., Flanner, M., Jiao, C., Chin, M., Young, P. J., Lee, Y. H., Rotstayn, L., Mahowald, N., Milly, G., Faluvegi, G., Balkanski, Y., Collins, W. J., Conley, A. J., Dalsoren, S., Easter, R., Ghan, S., Horowitz, L., Liu, X., Myhre, G., Nagashima, T., Naik, V., Rumbold, S. T., Skeie, R., Sudo, K., Szopa, S., Takemura, T., Voulgarakis, A., Yoon, J.-H., and Lo, F.: Radiative forcing in the ACCMIP historical and future climate simulations, Atmos. Chem. Phys., 13, 2939–2974, https://doi.org/10.5194/acp-13-2939-2013, 2013.
Shindell, Drew T., Faluvegi, G., Rotstayn, L., and Milly, G.: Spatial patterns of radiative forcing and surface temperature response, J. Geophys. Res.-Atmos., 120, 5385–5403, https://doi.org/10.1002/2014JD022752, 2015.
Stjern, C. W., Samset, B. H., Myhre, G., Forster, P. M., Hodnebrog, O., Andrews, T., Boucher, O., Faluvegi, G., Iversen, T., Kasoar, M., Kharin, V., Kirkevåg, A., Lamarque, J. F., Olivié, D., Richardson, T., Shawki, D., Shindell, D., Smith, C. J., Takemura, T., and Voulgarakis, A.: Rapid Adjustments Cause Weak Surface Temperature Response to Increased Black Carbon Concentrations, J. Geophys. Res.-Atmos., 122, 11462–11481, https://doi.org/10.1002/2017jd027326, 2017.
Stjern, C. W., Lund, M. T., Samset, B. H., Myhre, G., Forster, P. M., Andrews, T., Boucher, O., Faluvegi, G., Fläschner, D., Iversen, T., Kasoar, M., Kharin, V., Kirkevåg, A., Lamarque, J. F., Olivié, D., Richardson, T., Sand, M., Shawki, D., Shindell, D., Smith, C. J., Takemura, T., and Voulgarakis, A.: Arctic Amplification Response to Individual Climate Drivers, J. Geophys. Res.-Atmos., https://doi.org/10.1029/2018JD029726, 2019.
TS24: Takahashi, H. G., Watanabe, S., Nakata, M., and Takemura, T.: Response of the atmospheric hydrological cycle over the tropical Asian monsoon regions to anthropogenic aerosols and its seasonality, Prog. Earth Planet Sci., 5, 44, https://doi.org/10.1186/s40645-018-0197-2, 2018.
Thornhill, G. D., Ryder, C. L., Highwood, E. J., Shaffrey, L. C., and Johnson, B. T.: The effect of South American biomass burning aerosol emissions on the regional climate, Atmos. Chem. Phys., 18, 5321–5342, https://doi.org/10.5194/acp-18-5321-2018, 2018.
Undorf, S., Polson, D., Bollasina, M. A., Ming, Y., Schurer, A., and Hegerl, G. C.: Detectable Impact of Local and Remote Anthropogenic Aerosols on the 20th Century Changes of West African and South Asian Monsoon Precipitation, J. Geophys. Res.-Atmos., 123, 4871–4889, https://doi.org/10.1029/2017JD027711, 2018.
van Marle, M. J. E., Kloster, S., Magi, B. I., Marlon, J. R., Daniau, A.-L., Field, R. D., Arneth, A., Forrest, M., Hantson, S., Kehrwald, N. M., Knorr, W., Lasslop, G., Li, F., Mangeon, S., Yue, C., Kaiser, J. W., and van der Werf, G. R.: Historic global biomass burning emissions for CMIP6 (BB4CMIP) based on merging satellite observations with proxies and fire models (1750–2015), Geosci. Model Dev., 10, 3329–3357, https://doi.org/10.5194/gmd-10-3329-2017, 2017.
Voigt, A., Pincus, R., Stevens, B., Bony, S., Boucher, O., Bellouin, N., Lewinschal, A., Medeiros, B., Wang, Z., and Zhang, H.: Fast and slow shifts of the zonal-mean intertropical convergence zone in response to an idealized anthropogenic aerosol, J. Adv. Model. Earth Sy., 9, 870–892, https://doi.org/10.1002/2016MS000902, 2017.
Voldoire, A.: CNRM-CERFACS CNRM-CM6-1 model output prepared for CMIP6 RFMIP piClim-control, Version 20191210, Earth System Grid Federation, https://doi.org/10.22033/ESGF/CMIP6.4151, 2019a.
Voldoire, A.: CNRM-CERFACS CNRM-CM6-1 model output prepared for CMIP6 RFMIP piClim-aer, Version 20191210, Earth System Grid Federation, https://doi.org/10.22033/ESGF/CMIP6.4148, 2019b.
Westervelt, D. M., Conley, A. J., Fiore, A. M., Lamarque, J.-F., Shindell, D., Previdi, M., Faluvegi, G., Correa, G., and Horowitz, L. W.: Multimodel precipitation responses to removal of U.S. sulfur dioxide emissions, J. Geophys. Res.-Atmos., 122, 5024–5038, https://doi.org/10.1002/2017JD026756, 2017.
Westervelt, D. M., Conley, A. J., Fiore, A. M., Lamarque, J.-F., Shindell, D. T., Previdi, M., Mascioli, N. R., Faluvegi, G., Correa, G., and Horowitz, L. W.: Connecting regional aerosol emissions reductions to local and remote precipitation responses, Atmos. Chem. Phys., 18, 12461–12475, https://doi.org/10.5194/acp-18-12461-2018, 2018.
Wilcox, L. J., Highwood, E. J., Booth, B. B. B., and Carslaw, K. S.: Quantifying sources of inter-model diversity in the cloud albedo effect, Geophys. Res. Lett., 42, 1568–1575, https://doi.org/10.1002/2015GL063301, 2015.
Yukimoto, S., Koshiro, T., Kawai, H., Oshima, N., Yoshida, K., Urakawa, S., Tsujino, H., Deushi, M., Tanaka, T., Hosaka, M., Yoshimura, H., Shindo, E., Mizuta, R., Ishii, M., Obata, A., and Adachi, Y.: MRI MRI-ESM2.0 model output prepared for CMIP6 RFMIP piClim-control, Version 20191210, Earth System Grid Federation, https://doi.org/10.22033/ESGF/CMIP6.6888, 2019a.
Yukimoto, S., Koshiro, T., Kawai, H., Oshima, N., Yoshida, K., Urakawa, S., Tsujino, H., Deushi, M., Tanaka, T., Hosaka, M., Yoshimura, H., Shindo, E., Mizuta, R., Ishii, M., Obata, A., and Adachi, Y.: MRI MRI-ESM2.0 model output prepared for CMIP6 RFMIP piClim-aer, Version 20191210, Earth System Grid Federation, https://doi.org/10.22033/ESGF/CMIP6.6885, 2019b.
Zelinka, M. D., Myers, T. A., McCoy, D. T., Po-Chedley, S., Caldwell, P. M., Ceppi, P., Klein, S. A., and Taylor, K. E.: Causes of higher climate sensitivity in CMIP6 models, Geophys. Res. Lett., 47, e2019GL085782, https://doi.org/10.1029/2019GL085782, 2020.
Zhang, H., Xie, B., and Wang, Z.: Effective Radiative Forcing and Climate Response to Short-Lived Climate Pollutants Under Different Scenarios, Earth's Future, 6, 857–866, https://doi.org/10.1029/2018EF000832, 2018.