the Creative Commons Attribution 4.0 License.
the Creative Commons Attribution 4.0 License.
 | 03 Jan 2020
Regional variability in black carbon and carbon monoxide ratio from long-term observations over East Asia: assessment of representativeness for black carbon (BC) and carbon monoxide (CO) emission inventories
Yugo Kanaya
Seung-Myung Park
Atsushi Matsuki
Yasuhiro Sadanaga
Sang-Woo Kim
Itsushi Uno
Xiaole Pan
Meehye Lee
Hyunjae Kim
Dong Hee Jung
The black carbon (BC) and carbon monoxide (CO) emission ratios were estimated and compiled from long-term, harmonized observations of the ΔBC∕ΔCO ratios under conditions unaffected by wet deposition at four sites in East Asia, including two sites in South Korea (Baengnyeong and Gosan) and two sites in Japan (Noto and Fukuoka). Extended spatio-temporal coverage enabled estimation of the full seasonality and elucidation of the emission ratio in North Korea for the first time. The estimated ratios were used to validate the Regional Emission inventory in ASia (REAS) version 2.1 based on six study domains (“East China”, “North China”, “Northeast China”, South Korea, North Korea, and Japan). We found that the ΔBC∕ΔCO ratios from four sites converged into a narrow range (6.2–7.9 ng m−3 ppb−1), suggesting consistency in the results from independent observations and similarity in source profiles over the regions. The BC∕CO ratios from the REAS emission inventory (7.7 ng m−3 ppb−1 for East China – 23.2 ng m−3 ppb−1 for South Korea) were overestimated by factors of 1.1 for East China to 3.0 for South Korea, whereas the ratio for North Korea (3.7 ng m−3 ppb−1 from REAS) was underestimated by a factor of 2.0, most likely due to inaccurate emissions from the road transportation sector. Seasonal variation in the BC∕CO ratio from REAS was found to be the highest in winter (China and North Korea) or summer (South Korea and Japan), whereas the measured ΔBC∕ΔCO ratio was the highest in spring in all source regions, indicating the need for further characterization of the seasonality when creating a bottom-up emission inventory. At levels of administrative districts, overestimation in Seoul, the southwestern regions of South Korea, and Northeast China was noticeable, and underestimation was mainly observed in the western regions in North Korea, including Pyongyang. These diagnoses are useful for identifying regions where revisions in the inventory are necessary, providing guidance for the refinement of BC and CO emission rate estimates over East Asia.
- Article
(1259 KB) - Full-text XML
-
Supplement
(2082 KB) - BibTeX
- EndNote


Black carbon (BC), emitted from the incomplete combustion of fossil fuel and/or biomass burning, absorbs solar radiation and reduces the surface albedo of snow and ice after dry and wet deposition (Samset, 2018; Bond et al., 2013), thereby augmenting the global warming trend primarily induced by increased levels of carbon dioxide (CO2; Ramanathan and Carmichael, 2008; Jacobson, 2001; Myhre et al., 2013). In addition to global warming effects, BC is significantly associated with cardiovascular mortality (Smith et al., 2009; Geng et al., 2013) and is more related to health effects than PM2.5 (particulate matter having an aerodynamic diameter ≤2.5 µm; Janssen et al., 2011, 2012; Loomis et al., 2013).
In particular, the BC emissions from China, which accounted for 31 % of the total annual global emissions in 2012 (Crippa et al., 2018), showed an increasing trend from 1970 to 2012 (Kurokawa et al., 2013; Ohara et al., 2007; Crippa et al., 2018). To enhance the understanding of the behavior of BC in the atmosphere, it is essential to obtain a reliable BC concentration along with model simulations based on accurate bottom-up emission inventories. The bottom-up emission inventories may be subject to large uncertainties associated with emission factors from various types of combustion sources, countries, and species (Kurokawa et al., 2013), although the uncertainty in BC emissions decreased from 160.2 % in 1970 to 74.3 % in 2012 (Crippa et al., 2018). BC and carbon monoxide (CO) are by-products of the incomplete combustion of carbon-based fuels, and the ratio between ΔBC (the difference from the baseline level) and ΔCO could be a useful parameter for characterizing combustion types. Using these characteristics, past studies used the ΔBC∕ΔCO ratio to identify emission source types (Guo et al., 2017; Pan et al., 2011, 2013; Zhu et al., 2019) and/or validate BC emissions from bottom-up inventories (Han et al., 2009; Wang et al., 2011; Verma et al., 2011; Sahu et al., 2009; Kondo et al., 2006). However, it was hard to diagnose the accuracy of emission inventories over East Asia from those studies because either data covering short, intensive measurement periods at a single site were used or the studied source regions did not necessarily match the administrative districts for which a detailed emission inventory was constructed. In addition, BC concentrations can differ depending on the instruments and operation protocols used for observations – such discordance still poses a major obstacle to obtaining a comprehensive understanding. Kondo (2015) compiled ΔBC∕ΔCO ratios from systematic observations in Asia. However, information during the 2010s, when emissions patterns changed significantly, has not been covered. Kanaya et al. (2016) used observations at Fukue Island for 6 years (2009–2015) to derive a region-specific ΔBC∕ΔCO emission ratio. However, the seasons were limited to autumn–spring, and the footprint over each source region was still limited, as observations at a single site were analyzed.
In this study, we investigated the ΔBC∕ΔCO ratios from long-term measurements at four measurement sites (two South Korean and two Japanese sites which were measured for more than a year) over East Asia in order to comprehensively evaluate the Regional Emission inventory in ASia (REAS) version 2.1 based on the 2008 emission inventory (Kurokawa et al., 2013) of BC and CO with sufficient spatio-temporal coverage. The REAS inventory comprises emissions data from 30 Asian countries and regions, including China, North Korea, South Korea, and Japan, between the years 2000 and 2008 at a horizontal resolution. The emission sources consisted of power plants, combustible and non-combustible sources in industry, on-road and off-road sources in transport, and residential and other activities, such as agricultural activities and evaporative sources (Han et al., 2015; Itahashi et al., 2017; Kurokawa et al., 2013; Saikawa et al., 2017; Uno et al., 2017). The improved spatio-temporal coverage enabled estimation of the full seasonality and elucidation of the emissions ratio from North Korea for the first time. By comparing the regional and seasonal ΔBC∕ΔCO ratios between the REAS emission inventory and the measurements, this study identifies the points of improvement for bottom-up emission inventories.
2.1 Measurement sites and periods
Figure 1 shows the locations of the measurement sites in this study. Both Baengnyeong (37.97∘ N, 124.63∘ E) and Gosan (33.28∘ N, 126.17∘ E) are representative background sites in South Korea. The Baengnyeong site is an intensive measurement station operated by the Korean Ministry of Environment. The Gosan site is a supersite of many international campaigns, such as Aerosol Characterization Experiments in Asia (ACE-Asia; Huebert et al., 2003) and the Atmospheric Brown Cloud (ABC; Nakajima et al., 2007) and Cheju ABC Plume–Monsoon Experiment (CAPMEX; Ramana et al., 2010). Since the two sites in South Korea are located in the western region of the Korean Peninsula, with similar longitudes but different latitudes, these sites are suitable for monitoring pollutant transport from China, North Korea (especially Baengnyeong), and South Korea. In Japan, the Fukuoka site (33.52∘ N, 130.47∘ E) is located at the Chikushi campus of Kyushu University, located in the suburbs of Fukuoka, and the site is the largest center of commerce on the island of Kyushu (Itahashi et al., 2017; Uno et al., 2017). The Noto site (37.45∘ N, 137.36∘ E) is located at the Ground-based Research Observatory (NOTOGRO), which has been apart from Kanazawa and Toyama, the nearest provincial cities, by approximately 115 km to the southwest and 85 km to the south, respectively. Therefore, Noto is a suitable place for monitoring the background concentrations and/or outflows of pollution from the Asian continent (Ueda et al., 2016). The measurement periods were commonly in the early 2010s, while slight differences were present among the sites (Table 1). The longest measurement period was in Noto for approximately 6 years (from 2011 to 2016), followed by that in Baengnyeong (5 years), Gosan (3 years), and Fukuoka (1.5 years). The measurements in Baengnyeong did not include 2011 to 2012 due to the absence of CO data.
Table 1Description of the measurement sites, periods, and instruments.
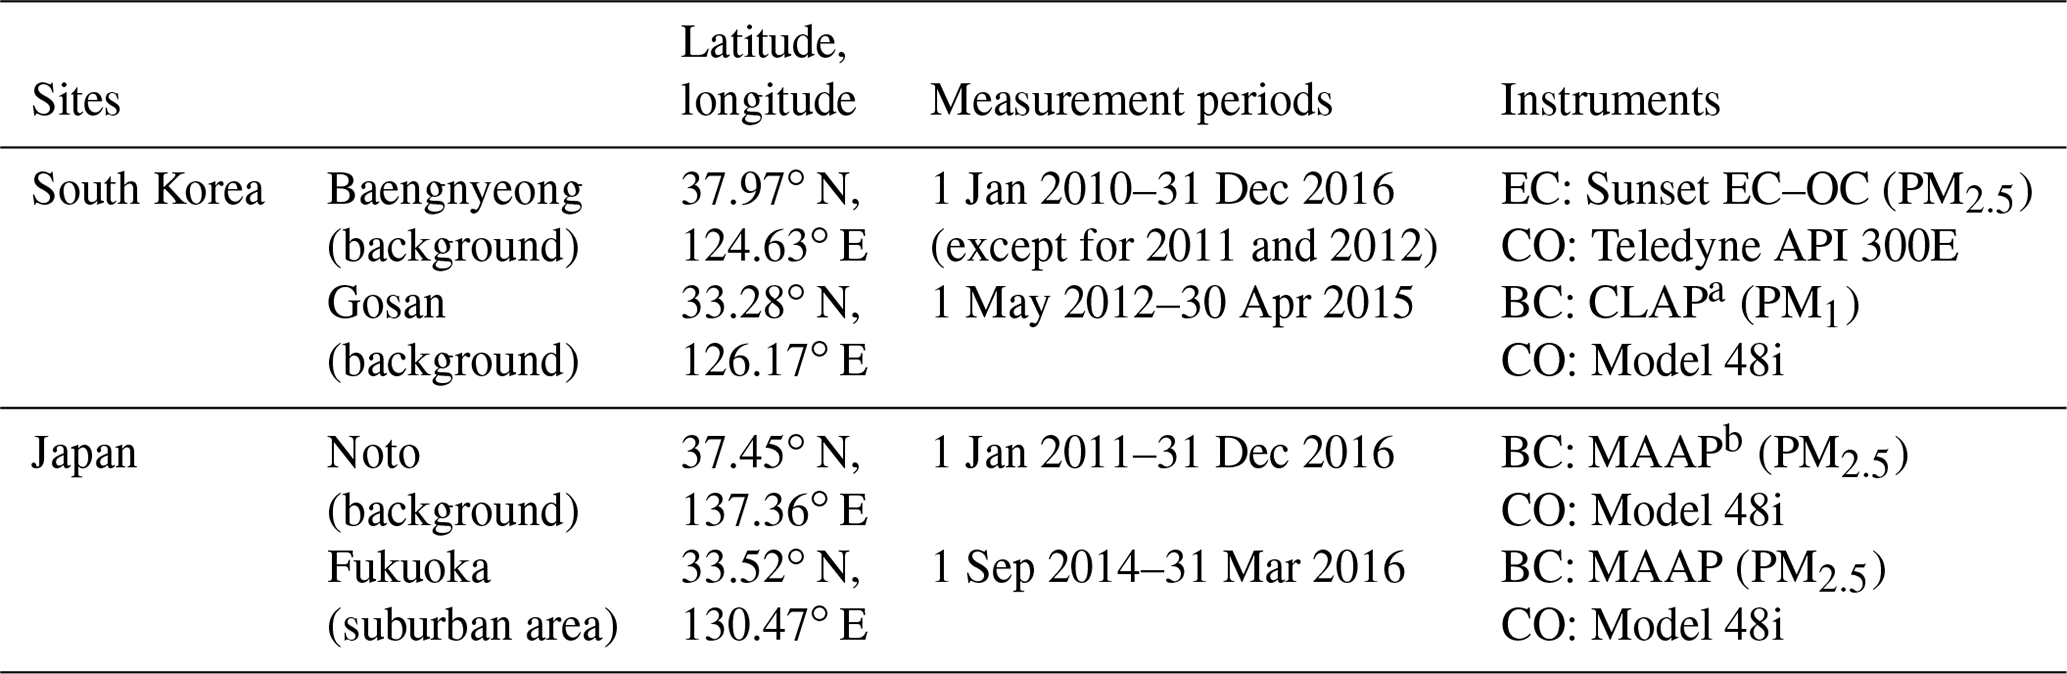
a continuous light absorption photometer. b multi-angle absorption photometer.
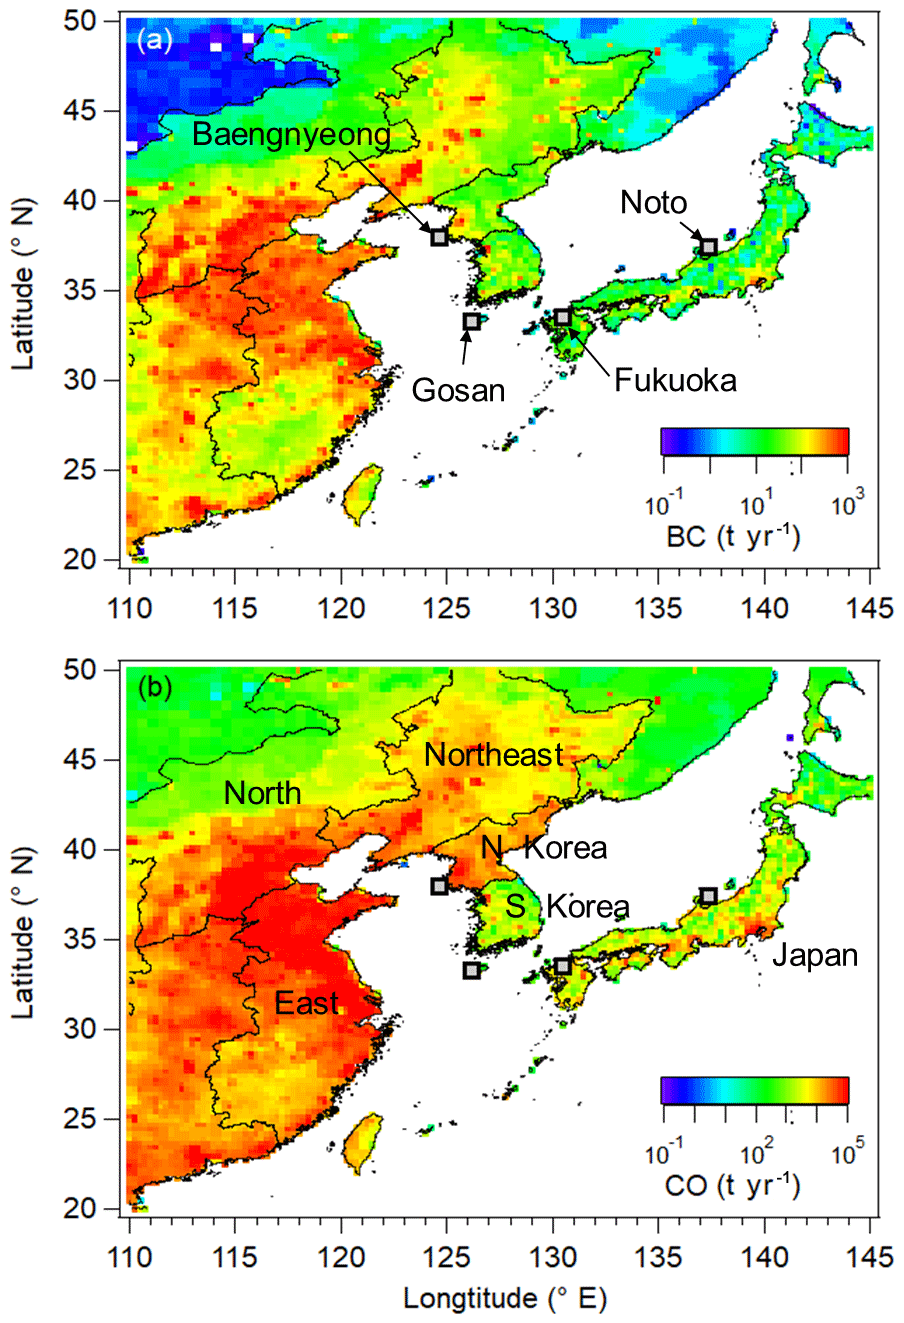
Figure 1Yearly (a) BC and (b) CO emission rates (t yr−1) over East Asia in 2008 from the REAS version 2.1 bottom-up emission inventory (Kurokawa et al., 2013). The four measurement sites are shown in (a). (b) shows that the six study domains are divided by country and/or administrative district, including three Chinese regions (“East China”, “North China”, and “Northeast China”), two Korean Peninsula regions (South and North Korea), and Japan.
2.2 Instruments
It is crucial to ensure reliable atmospheric BC concentrations, which were measured by different instruments, by excluding the effects of co-existing scattering particles. To keep the harmonization, we considered BC concentrations to be reliable when the data were measured by pre-validated instruments reported to have good agreement, including OC–EC analyzers (Sunset Laboratory Inc., USA) with optical corrections, single-particle soot photometers (SP2), continuous soot-monitoring systems (COSMOS), and multi-angle absorption photometers (MAAPs; MAAP 5012, Thermo Scientific; e.g., Kondo et al., 2011; Kanaya et al., 2008, 2013, 2016; Miyakawa et al., 2016, 2017; Taketani et al., 2016; Ohata et al., 2019).
Hourly elemental carbon (EC) concentrations in PM2.5 at the Baengnyeong site were measured by a Model-4 Semi-Continuous OC–EC Field Analyzer using the thermal–optical transmittance (TOT) method and the nondispersive infrared (NDIR) method based on NIOSH method 5040 (NIOSH, 1996). The particles passed through a PM2.5 cyclone with 8.0 L min−1 and a carbon-impregnated multi-channel parallel plate diffusion denuder (Turpin et al., 2000) and were collected on a quartz fiber filter for 45 min. Organic carbon (OC) and EC were then analyzed during the last 15 min. The detection limit of EC, which is defined as twice the average of the field blanks, was reported to be 30 ng m−3, and the precision of EC was 7.5 % (Park et al., 2013).
At both the Noto and Fukuoka sites, PM2.5 BC concentrations were measured using a MAAP. The BC concentration is converted from the absorption coefficients, which were determined by measuring both the transmittance and reflectance of a filter loaded with aerosols. Because the MAAP installed a light detector that locates light reflected from the filter at 130∘ and 165∘ from the illumination direction (Petzold et al., 2005), the MAAP can correct for scattering particle effects. It should be noted that we used a different mass absorption efficiency (MAE) value of 10.3 m2 g−1, as suggested by Kanaya et al. (2013), instead of the default MAE of 6.6 m2 g−1. This value was validated with COSMOS, which showed a reliable performance with the SP2 and OC–EC analyzer (Miyakawa et al., 2017; Kondo et al., 2011; Ohata et al., 2019) on a long-term basis at Fukue (Kanaya et al., 2016) and in Tokyo (Kanaya et al., 2013). The consistency between MAAP and SP2 at Noto was reported to be ∼10 % (Taketani et al., 2016). At Fukuoka, a similar behavior was expected, as the BC there would be a mixture from the continent and urban sources, as experienced at Fukue and Tokyo. The reported minimum detection limit of the MAAP was different depending on the averaging time of 12 ng m−3 for 1 h and 64 ng m−3 for 1 min by applying the revised MAE (10.3 m2 g−1).
The Gosan site has monitored BC concentrations using a continuous light absorption photometer (CLAP) with three wavelengths, including 467, 528, and 652 nm (Cho et al., 2019). Through PM1 and PM10 impactors, which were switched every 30 min, the particles were collected on 47 mm diameter glass-fiber filters (Pallflex type E70-2075W). The volumetric flow rate was 1 L min−1. The raw absorption coefficient of the CLAP was corrected using the methods of Bond et al. (1999) to eliminate effects due to filter loading errors. The absorption coefficient at 528 nm was used to determine the BC concentration by applying 10 m2 g−1 for MAE. In this study, we used the PM1 BC concentration because BC particles mainly exist in amounts less than 1 µm (Miyakawa et al., 2017; Bond et al., 2013). Although the uncertainty derived from scattering particles was reported to be ∼25 % at Gosan (Ogren et al., 2017), the BC from CLAP was verified by comparison with a co-located semi-continuous OC–EC field analyzer (Lim et al., 2012). The slope of the best-fit line through the origin was close to 1, at 1.17, implying that the PM1 BC concentration from CLAP was well consistent with that from PM2.5 EC.
Hourly CO concentrations were measured by a gas filter correlation CO analyzer (Model 300EU, Teledyne API Inc.) at Baengnyeong and nondispersive infrared absorption photometers (48C, Thermo Scientific) at the other three sites. The overall uncertainties of the BC and CO measurements were estimated to be less than 15 % (except for Gosan, at 20 %) and 5 %, respectively. The overall regional ΔBC∕ΔCO ratio varied from −0.7 (−8 %) to 0.8 (10 %) due to uncertainty.
2.3 ΔBC∕ΔCO ratio and allocation of the dominant emission region
To identify the origin of BC and CO emission sources, backward trajectories at 500 m during the past 5 d (120 h) were calculated by the Hybrid Single Particle Lagrangian Integrated Trajectory (HYSPLIT) 4 model (Draxler et al., 2018) for every 6 h interval (00:00, 06:00, 12:00, and 18:00 UTC) using the Global Data Assimilation System (GDAS) with a horizontal resolution of , as the GDAS with 0.5∘ resolution did not account for vertical motion (Su et al., 2015). The spatial distribution of the number of endpoints for backward trajectories from the four measurement sites revealed the large spatial coverage of the footprint over East Asia (Fig. S1 in the Supplement). These four sites could be representative for monitoring outflows from China, North Korea, and South Korea because of the dominance of wintertime monsoons. Moreover, the footprint of the Noto site could cover the middle part of Japan, such as the Kanto, Chubu, and Kansai regions. To exclude cases with wet-deposition influence, the accumulated precipitation along with trajectory (APT) was calculated over the past 72 h (Kanaya et al., 2016; Oshima et al., 2012), and we only used cases with APT=0.
As aforementioned, BC and CO are commonly emitted from incomplete fuel combustion, and the ΔBC∕ΔCO ratio is used to evaluate the bottom-up emission inventory as a representative indicator, preserving the emission ratio when wet removal is not influential (Kanaya et al., 2016). ΔCO was calculated by subtracting the baseline level from the observed CO mixing ratio. Though there are several methods for estimating the CO baseline level (e.g., Matsui et al., 2011; Miyakawa et al., 2017; Oshima et al., 2012; Verma et al., 2011), the CO baseline in this study was regarded as a 14 d moving 5th percentile based on Kanaya et al. (2016). On the other hand, ΔBC is the BC concentration as is (BC baseline is 0) because the atmospheric lifetime of BC is estimated to be several days (Park et al., 2005), in contrast to that of CO, which has a 1-month or 2-month lifetime (Bey et al., 2001). It should be noted that we used the CO concentration when it was higher than the moving 25th percentile of CO so that only data with meaningful enhancement were employed.
To determine the dominant emission region of each sample, we calculated the residence time over the six regions (“East China”, “North China”, “Northeast China”, North Korea, South Korea, and Japan) using backward trajectories covering the previous 72 h. Hourly endpoints with altitudes of less than 2.5 km were counted (Kanaya et al., 2016). Based on the fractions of the total 73 h, the highest fraction of the region was classified as the dominant emission region when the fraction of the frequency was higher than 5 % to secure statistics (Sect. S1 and Fig. S2 in the Supplement). In addition, we checked (1) the dry-deposition effect during the traveling time, (2) the influences of other regions on ΔBC∕ΔCO depending on the residence time, and (3) biomass burning events that could cause distortion producing higher ΔBC∕ΔCO values. As a result, it was determined that there was no significant dry-deposition effect (Sect. S2 and Fig. S3) or interruption by other regions (Sect. S3 and Fig. S4), implying that the BC∕CO ratio was preserved regardless of the residence time over other regions when the threshold (N>5) of each bin (20 % interval) was satisfied. In addition, the influences from biomass burning were minimized during long-term periods, as confirmed by no significant difference between the ratios produced by including and excluding biomass burning events selected by the Moderate Resolution Imaging Spectroradiometer (MODIS) Fire Information for Resource Management System (FIRMS). Miyakawa et al. (2019) also pointed out that ∼90 % of BC in springtime at Fukue originated from the combustion of fossil fuel.
The uncertainty of the BC∕CO ratio that may arise from estimating the CO baseline by different methods and from allocation methods involving selecting different altitudes is discussed in the Supplement Sect. S4.
3.1 Seasonal variation in BC and CO
The BC, CO, and ΔCO concentrations are summarized in Table 2. The mean BC and ΔCO concentrations were highest in Baengnyeong, followed by Fukuoka, Gosan, and Noto, according to the distance from the main BC and CO emission sources in China. Although the levels at Baengnyeong and Gosan were high, they maintained regional representativeness, as the BC concentration levels were lower than those at urban sites such as Daejon (1.78 µg m−3), Seoul (1.52 µg m−3), and Gwangju (1.13 µg m−3) in South Korea (Yu et al., 2018). Despite the suburban location of Fukuoka, the BC concentration was even lower than that of Baengnyeong. However, the CO baseline concentration was highest among the measurement sites, suggesting the influence of local sources, though it could be varied depending on geographical location. To check the influence of local pollution at Fukuoka, we tested by applying more stringent CO baseline criteria (14 d moving 2nd percentile; ∼166 ppbv). As a result, there were no significant changes in our results (less than −4 %). In the case of Noto, the BC concentration was the lowest among the sites, at 0.24 µg m−3. The concentration level was lower than the annual averages of 0.36 µg m−3 at Fukue (Kanaya et al., 2016) and 0.29 µg m−3 at Cape Hedo (Verma et al., 2011), which are regarded as background monitoring sites in Japan. The seasonal variation in the BC concentration at all sites showed similar patterns of being low in summer due to rainout followed by precipitation and increasing from fall onwards due to house heating and/or crop biomass burning along with the transition to westerly winds.
Table 2Means and standard deviations of the black carbon (BC)a, carbon monoxide (CO)b, ΔCO concentrationsb, CO baselineb, amount of APTc, and the number of data for all (Nall) and APT=0 (NAPT=0) cases at each site.
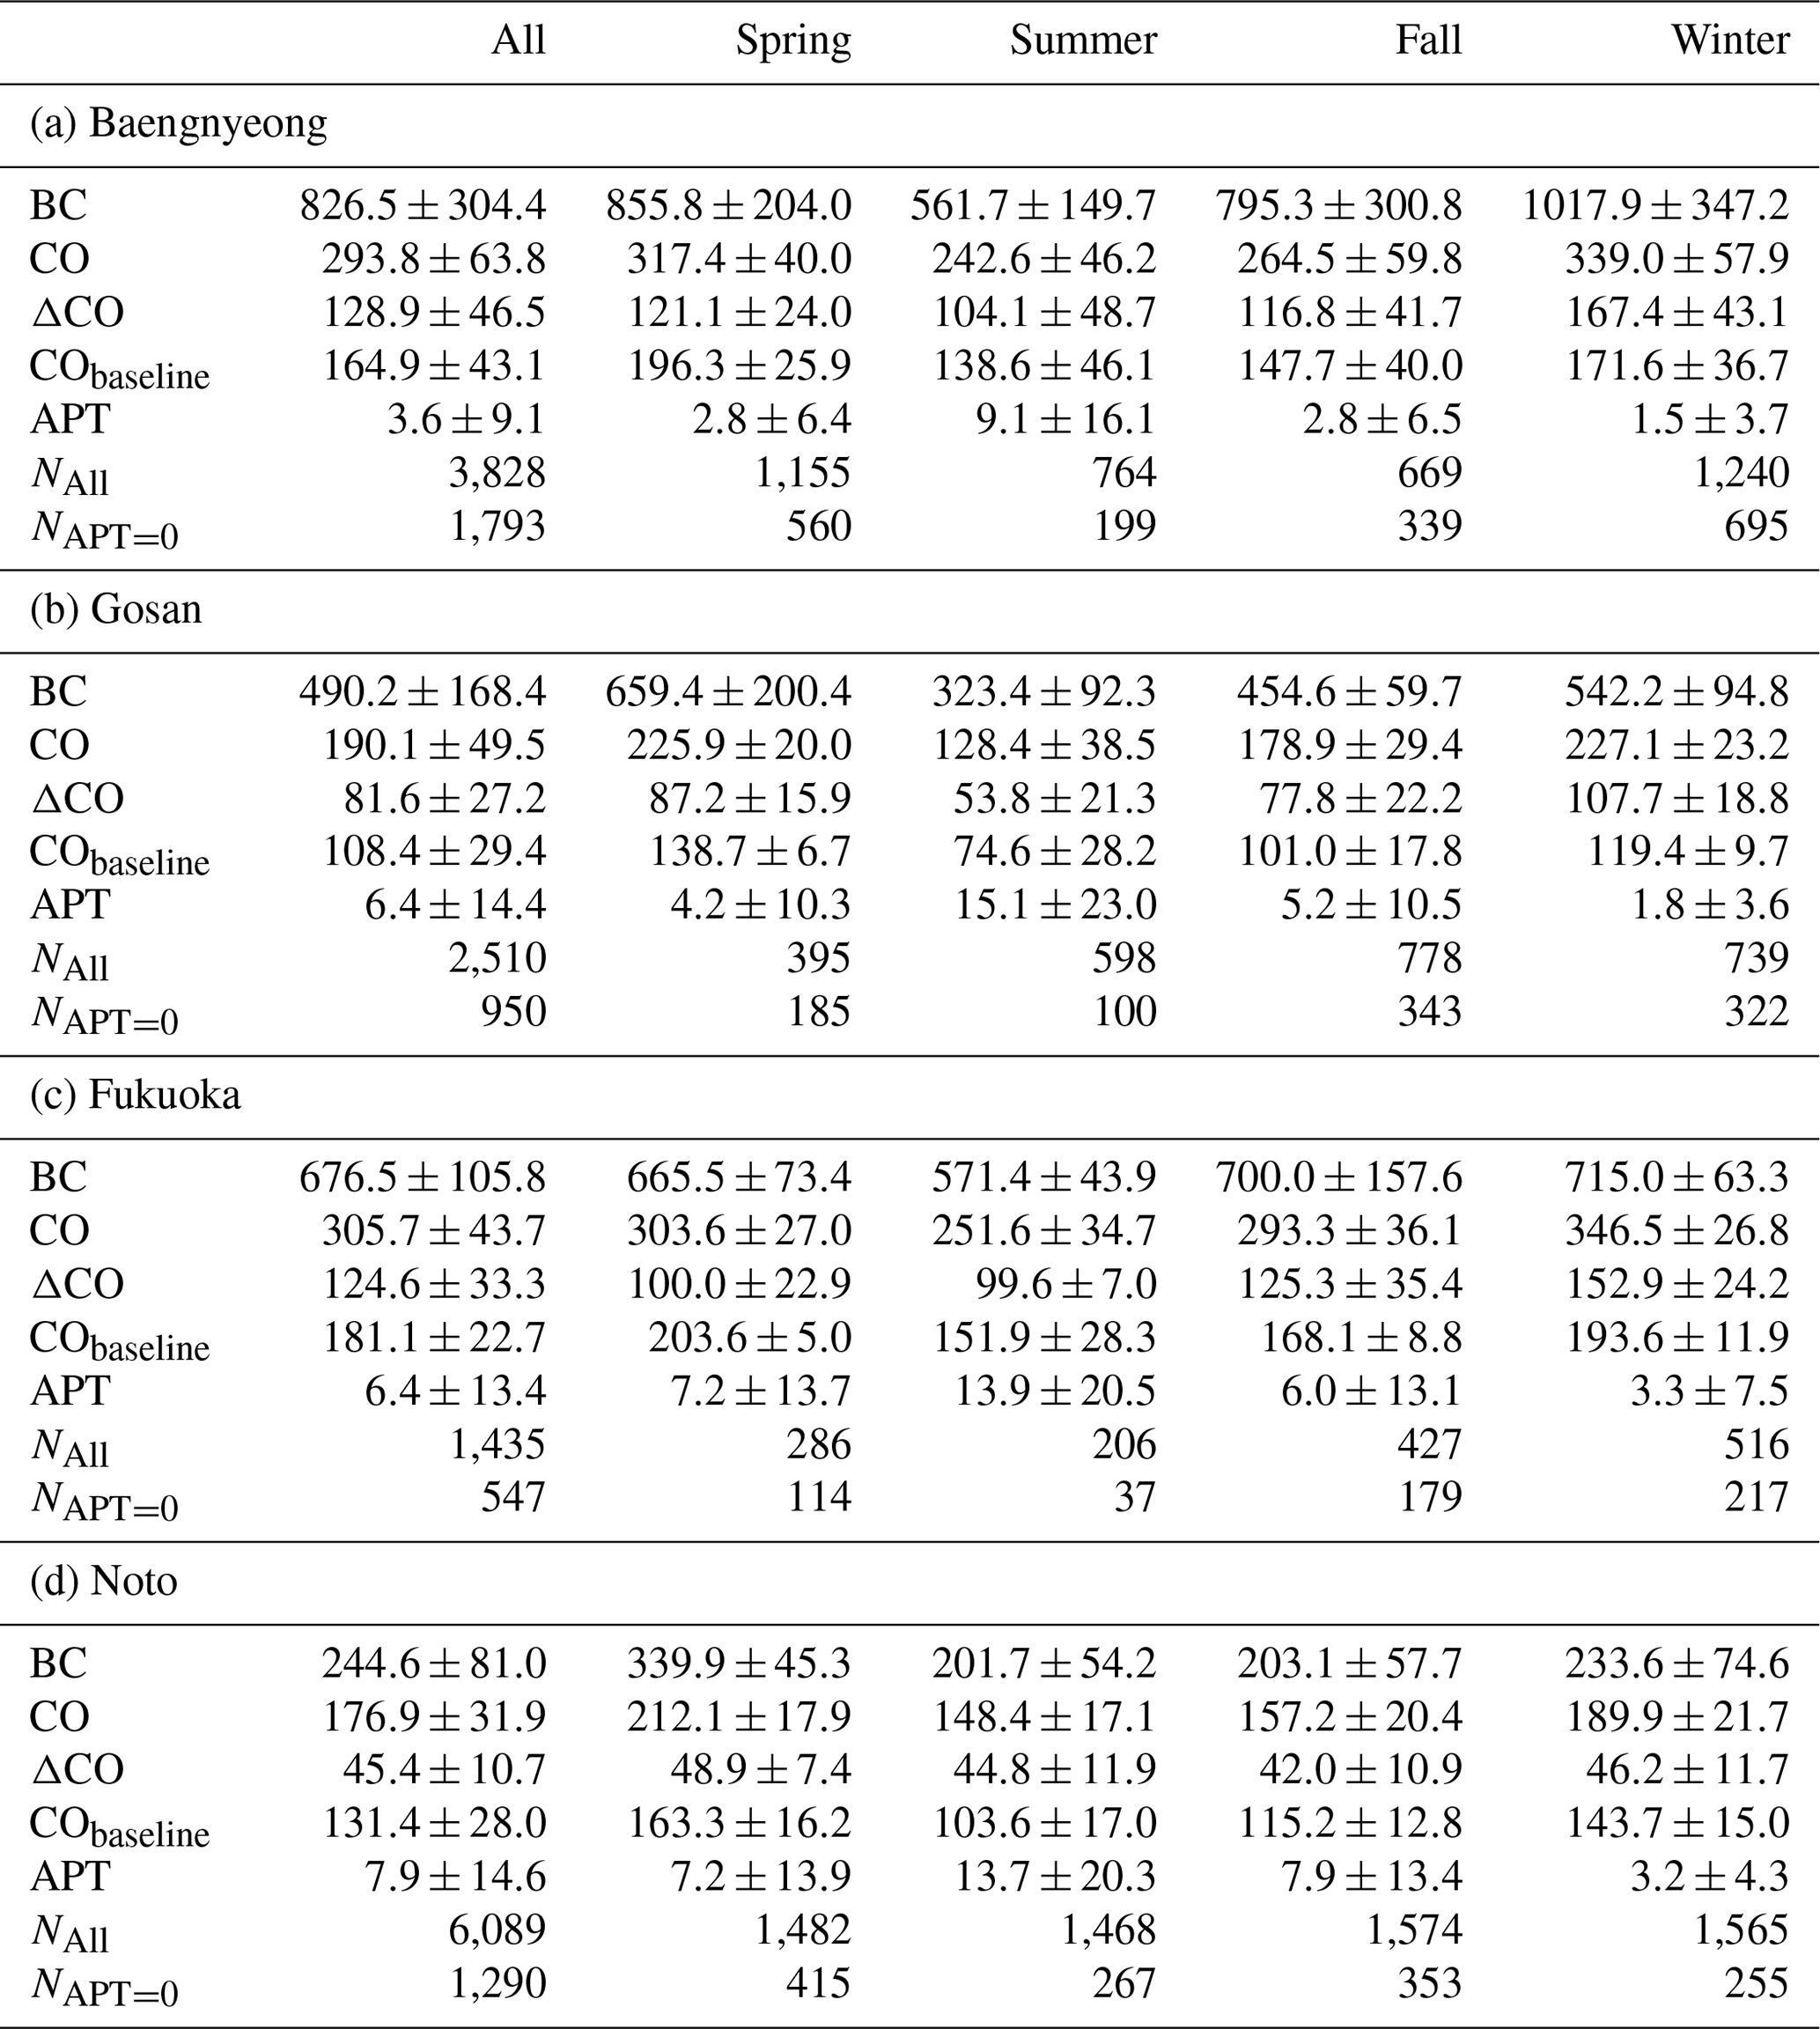
a ng m−3. b ppbv. c mm.
Figure 2 shows the time series of the BC, CO, ΔBC∕ΔCO ratio and APTs at the Noto site. Regardless of precipitation during the measurement periods, the correlation coefficient (R) between BC and CO was 0.70 within the significance level (p<0.01), indicating that BC and CO were emitted from similar sources. Additionally, the R between ΔBC∕ΔCO and APT showed a slightly negative relationship, at −0.24, within the significance level (p<0.01), suggesting that the wet removal process removed BC, which resulted in a low ΔBC∕ΔCO ratio. However, compared to Noto, the other sites showed weak negative relationships within the significance level (p<0.01) because the amounts of APT at the other three sites were lower than the amount for Noto, which led to less-distinctive wet removal effects (Table 2).
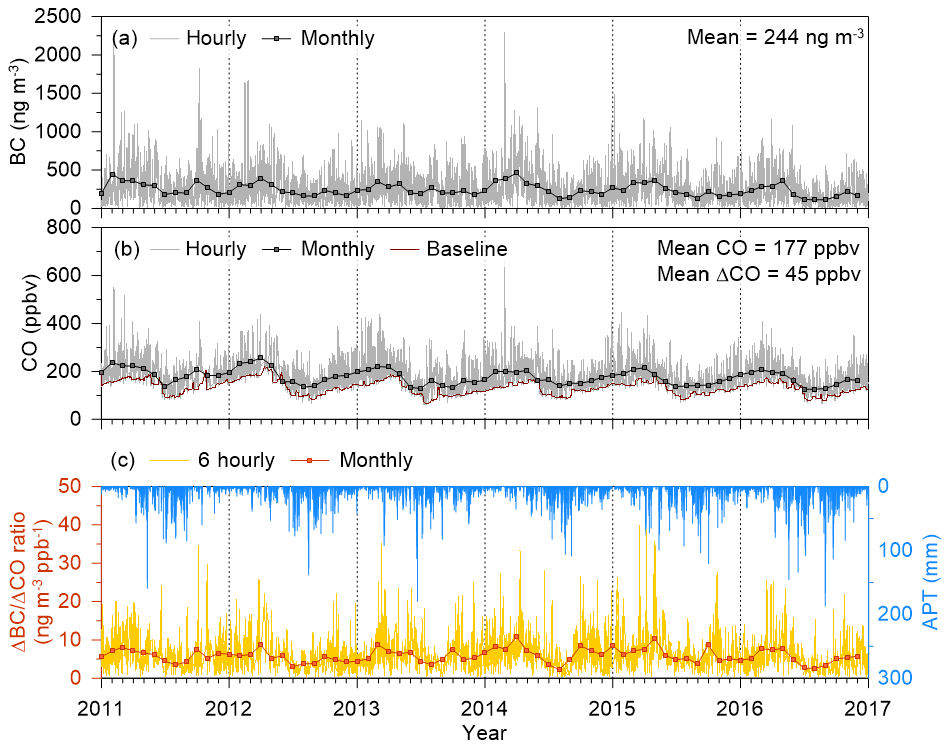
Figure 2Time series of (a) BC concentration, (b) CO and ΔCO concentrations, and (c) ΔBC∕ΔCO ratio and accumulated precipitation along with trajectory (APT) during the measurement periods (from 2011 to 2017) in Noto, Japan. The square symbols with solid lines in (a) and (b) indicate hourly and monthly concentrations.
3.2 Regional variation in the ΔBC∕ΔCO ratio
Figure 3 shows a comparison of the ΔBC∕ΔCO ratio between the REAS emission inventories and measured values at four sites. The solid symbols with error bars satisfy the fraction of frequency (>5 % in Fig. S2) and the number of data for each bin (N>5 in Fig. S4). The open symbols with a dashed error bar were excluded from the analysis because they did not satisfy the criteria. It should be noted that the total number of data for dominant emission regions in this study was 2.7 times higher than that used by Kanaya et al. (2016), indicating significant improvement in the representativeness of the regional variation. Due to the large spatial variations in BC and CO in the REAS emission inventory depending on the dominant emission region, the coefficient of variation (CV; standard deviation divided by the mean) of the BC∕CO ratio from the REAS emission inventory (0.65; over the six regions) was much higher than the ratios from the measurements (0.09–0.13) at each site. The CV from the REAS emission inventory was still as high as 0.27 when the highest (South Korea) and the lowest ratios (North Korea) were excluded. Moreover, the BC∕CO ratio from the REAS emission inventory was slightly higher than the measured ratios, except for North Korea, indicating that the REAS BC∕CO ratio did not represent the real value. It should be noted that there were no significant changes in trends for the long-term variation in the ΔBC∕ΔCO ratios of all sites as well as BC∕CO ratios from the Emissions Database for Global Atmospheric Research (EDGAR version 4.3.2; Crippa et al., 2018) emission inventory since 2008 and the MIX emission inventory (Li et al., 2017) in 2008 and 2010 (Fig. S6). This result implied that comparison between the measurements and the REAS emission inventory was a reasonable approach even though the timescale between them did not match. The differences in the ratios between the REAS and the measurements will be discussed further in Sect. 3.3.

Figure 3ΔBC∕ΔCO ratios at the four measurement sites and Fukue from Kanaya et al. (2016) according to the dominant emission region. The symbols with vertical lines are the means and standard deviations of the ΔBC∕ΔCO ratio. The bar graph on the bottom indicates the number of data in the dominant emission region. Open symbols with dashed vertical lines indicate data excluded because of a low number of data. The solid blue horizontal lines with dashed lines for each region indicate the means and standard deviations of the measured ΔBC∕ΔCO, excluding the areas with limited data. The solid red horizontal lines depict the overall mean BC∕CO ratios of dominant emission regions from the REAS version 2.1 emission inventory (Kurokawa et al., 2013).
The ΔBC∕ΔCO ratio in North China showed the lowest average value across China, at 6.2±0.5 ng m−3 ppb−1, followed by East China (6.8±0.3 ng m−3 ppb−1) and Northeast China (7.9±0.7 ng m−3 ppb−1). The ratios of two or three regions in China showed significant differences at all sites when Welch's t test or the ANOVA test was applied (p<0.05), except for Baengnyeong. The lower ΔBC∕ΔCO ratio in North China than in East China was also reported with 5.3±2.1 and 6.4±2.2 ng m−3 ppb−1 in Fukue, 7.0±3.3 and 7.5±4.6 ng m−3 ppb−1 in Cape Hedo, and 6.5±0.4 and 8.8±0.9 ng m−3 ppb−1 in Mt. Huang, respectively (Kanaya et al., 2016; Pan et al., 2011; Verma et al., 2011). In the case of Northeast China, the variation in the ratio over the measurement sites (0.09 of the CV) was higher than that over other Chinese regions (0.07 and 0.04 of the CV in East China and North China, respectively). The reason why a higher CV was observed even in the same emission source region is that the pathways of the backward trajectories were different, depending on the measurement site (Fig. S7); the backward trajectory of Noto passed over the eastern region (Heilongjiang), whereas that of Baengnyeong passed over the western region of Northeast China (Liaoning). The information of emissions of Northeast China obtained from measurements at Gosan might have been more strongly affected by emissions from South Korea than that at Baengnyeong (Sect. S5).
The mean ΔBC∕ΔCO ratios of North Korea and South Korea were similar, at 7.3 and 7.8±1.2 ng m−3 ppb−1, respectively. Verma et al. (2011) reported a lower ratio for the Korean Peninsula (both South and North Korea) of 5.7±2.0 ng m−3 ppb−1. It should be noted that the ΔBC∕ΔCO ratios for South Korea estimated from observations at Korean and Japanese sites were significantly different, at 8.9±5.3 ng m−3 ppb−1 and 6.7±3.8 ng m−3 ppb−1, respectively (p≤0.01). These differences were also consistent with previous studies that reported ratios of 8.5 ng m−3 ppb−1 at Gosan (Sahu et al., 2009) and 6.7±3.7 ng m−3 ppb−1 at Fukue (Kanaya et al., 2016). The difference between the ratios could also be caused by the different influences of the emission source regions, similar to the case in Northeast China. Baengnyeong and Gosan were mainly influenced by the southwestern region of South Korea, including the Seoul metropolitan area (SMA), whereas the Fukuoka and Noto sites were mainly influenced by the southeastern region of South Korea (Fig. S8), suggesting large spatial variation in BC∕CO over the Korean Peninsula. In the case of Japan, the mean ΔBC∕ΔCO ratio was 6.8±0.2 ng m−3 ppb−1, which was higher than or similar to the reported values of 5.9±3.4 ng m−3 ppb−1 at Fukue, 5.7±0.9 ng m−3 ppb−1 at Tokyo, and 6.3±0.5 ng m−3 ppb−1 at Nagoya (Kondo et al., 2006; Kanaya et al., 2016). Moreover, there were no significant differences in the ΔBC∕ΔCO ratio between Noto and Fukuoka, although the trajectories passed through different regions of Japan (Fig. S9), suggesting that the spatial variation in the ΔBC∕ΔCO ratio of Japan was smaller than that of South Korea. The higher ΔBC∕ΔCO ratio of South Korea could be explained by the higher ratio of diesel to gasoline vehicles in South Korea (0.88) than in Japan (0.09) in 2015 (MLIT, 2019; MOLIT, 2019) because the BC∕CO ratio from diesel vehicles is higher than that from gasoline vehicles due to the different carbon atom contents (Zhou et al., 2009; Guo et al., 2017).
3.3 Comparison between the REAS version 2.1 and measured ΔBC∕ΔCO ratios
In this section, we investigated the differences in ΔBC∕ΔCO between the measured values and the REAS version 2.1 emission inventory. We adopted the mean fractional bias (MFB; ranging from −2 to 2), defined by
where Ri and Mi denote the REAS emission inventory and the measured ratio corresponding to sample i, respectively.
East China showed the lowest MFB value among Chinese regions, at 0.12, and the other two regions had similar MFB values of 0.48 for North China and 0.35 for Northeast China, indicating an overestimation of the REAS emission inventory in China. The BC∕CO ratio from the REAS emission inventory showed a higher ratio in North China (10.0 ng m−3 ppb−1) than in East China (7.7 ng m−3 ppb−1), which is an opposite pattern to that of the measured ratios. Considering that most trajectories passed Inner Mongolia (12.5 ng m−3 ppb−1) and Hebei (6.6 ng m−3 ppb−1) in North China with lower measured ΔBC∕ΔCO ratios, the BC∕CO ratio in Inner Mongolia was likely overestimated. In Northeast China, the higher BC∕CO ratio in Heilongjiang (14.0 ng m−3 ppb−1 in REAS) than in Liaoning (11.3 ng m−3 ppb−1 in REAS) was consistent with the tendency of the measured ΔBC∕ΔCO ratio.
The BC∕CO ratios from the REAS emission inventory for South Korea (23.2 ng m−3 ppb−1) and North Korea (3.7 ng m−3 ppb−1) were highly over- and underestimated along with large absolute values of MFB of 0.99 (by factor 3.0) and −0.66 (by factor 2.0), respectively. The ΔBC∕ΔCO ratio in South Korea was still found to be 9.6±0.5 ng m−3 ppb−1 when the condition was restricted to less than the 25th percentile of the maximum relative humidity during the previous 72 h (less than 67.2 %) to ensure choosing cases without wet-deposition effects. Kanaya et al. (2016) pointed out that the industry and transport sectors could be the sources of the large discrepancy between the REAS emission inventory and the measurements. Although the ratio of the industry sector in South Korea (41.4 ng m−3 ppb−1) is also much higher (13 times) than that in Japan, BC and CO from industrial emissions in South Korea only accounted for 13.4 % and 7.9 % of the total, respectively. Here, we identify the relative importance of the road transport sector; the BC∕CO ratio from road transportation in South Korea was 26.8 ng m−3 ppb−1, which was 3.6 times higher than the ratio in Japan of 7.4 ng m−3 ppb−1. Upon looking more closely into the transportation sector, the BC∕CO ratios from diesel vehicles were found to be similar between South Korea (120 ng m−3 ppb−1) and Japan (109 ng m−3 ppb−1), although the BC emissions could vary depending on the installation of diesel particulate filters.
To easily compare the CO emission rates from gasoline vehicles between South Korea and Japan, we roughly estimated the CO emission factor from gasoline vehicles. This hypothetical CO emission factor was calculated by considering the actual mean daily mileage (31 and 12 km d−1 for South Korea and Japan, respectively), the actual number of gasoline vehicles in 2008 (MLIT, 2016, 2019; MOLIT, 2019; TS, 2009), and the total CO emission rates in the REAS emission inventory; the hypothetical CO emission factor in Japan (15.8 CO g km−1; 2.82 Tg yr−1 from 40.8 million) was 6.9 times higher than that in South Korea (2.3 CO g km−1; 0.22 Tg yr−1 from 8.3 million). Underestimation of the hypothetical CO emission factor in South Korea was also observed in motorcycles (2.8 CO g km−1; 0.06 Tg yr−1 from 1.8 million), which was lower than that in Japan (14.7 g km−1; 0.15 Tg yr−1 from 1.5 million), assuming the same motorcycle mileage in South Korea. Clearly the hypothetical CO emission factor thus derived for South Korea is unlikely, pointing to underestimation of the assumed CO emission rate. We can roughly revise the total CO emission rates (2.2 Tg) from gasoline vehicles (1.46 Tg) and motorcycles (0.31 Tg) by applying the hypothetical CO emission factor of Japan. Although the hypothetical CO emission factors had large uncertainties due to inaccurate mileage for gasoline vehicles and motorcycles, the revised REAS BC∕CO ratio decreased to 7.3 ng m−3 ppb−1, which was closer to that of the observations.
The recently updated Korean emission inventory Clean Air Policy Support System (CAPSS; Lee et al., 2011; Yeo et al., 2019) based on the year 2015 also showed a high BC∕CO ratio of 25.1 ng m−3 ppb−1 (Table 3), with much lower hypothetical CO emission factors for gasoline vehicles (1.1 CO g km−1) and motorcycles (1.7 CO g km−1) with similar mean mileage values (30.4 km d−1; TS, 2016), suggesting that BC and CO emissions still need to be improved. This high BC∕CO ratio (35.6 ng m−3 ppb−1) was also found in the MIX emission inventory, whereas the BC∕CO ratio from the EDGAR inventory in 2010 was much closer to the measured ratio of 7.68 ng m−3 ppb−1. Many researchers have been trying to improve the accuracy of the CO emission rate in South Korea through the bottom-up emission inventory (0.90 Tg) and top-down estimation (1.10 Tg) derived from the KORUS-AQ campaign (Table 3). However, discrepancies still exist in not only the ΔBC∕ΔCO ratio but also the CO emission rate. In particular, the CO emission rate in South Korea showed large variations according to the emission inventory, suggesting that CO emission rates over South Korea should be improved preferentially.
Table 3(a) Regional ΔBC∕ΔCO (ng m−3 ppb−1) ratios and emission rates of (b) BC and (c) CO (in Tg per year) over East Asia from various emission inventories.
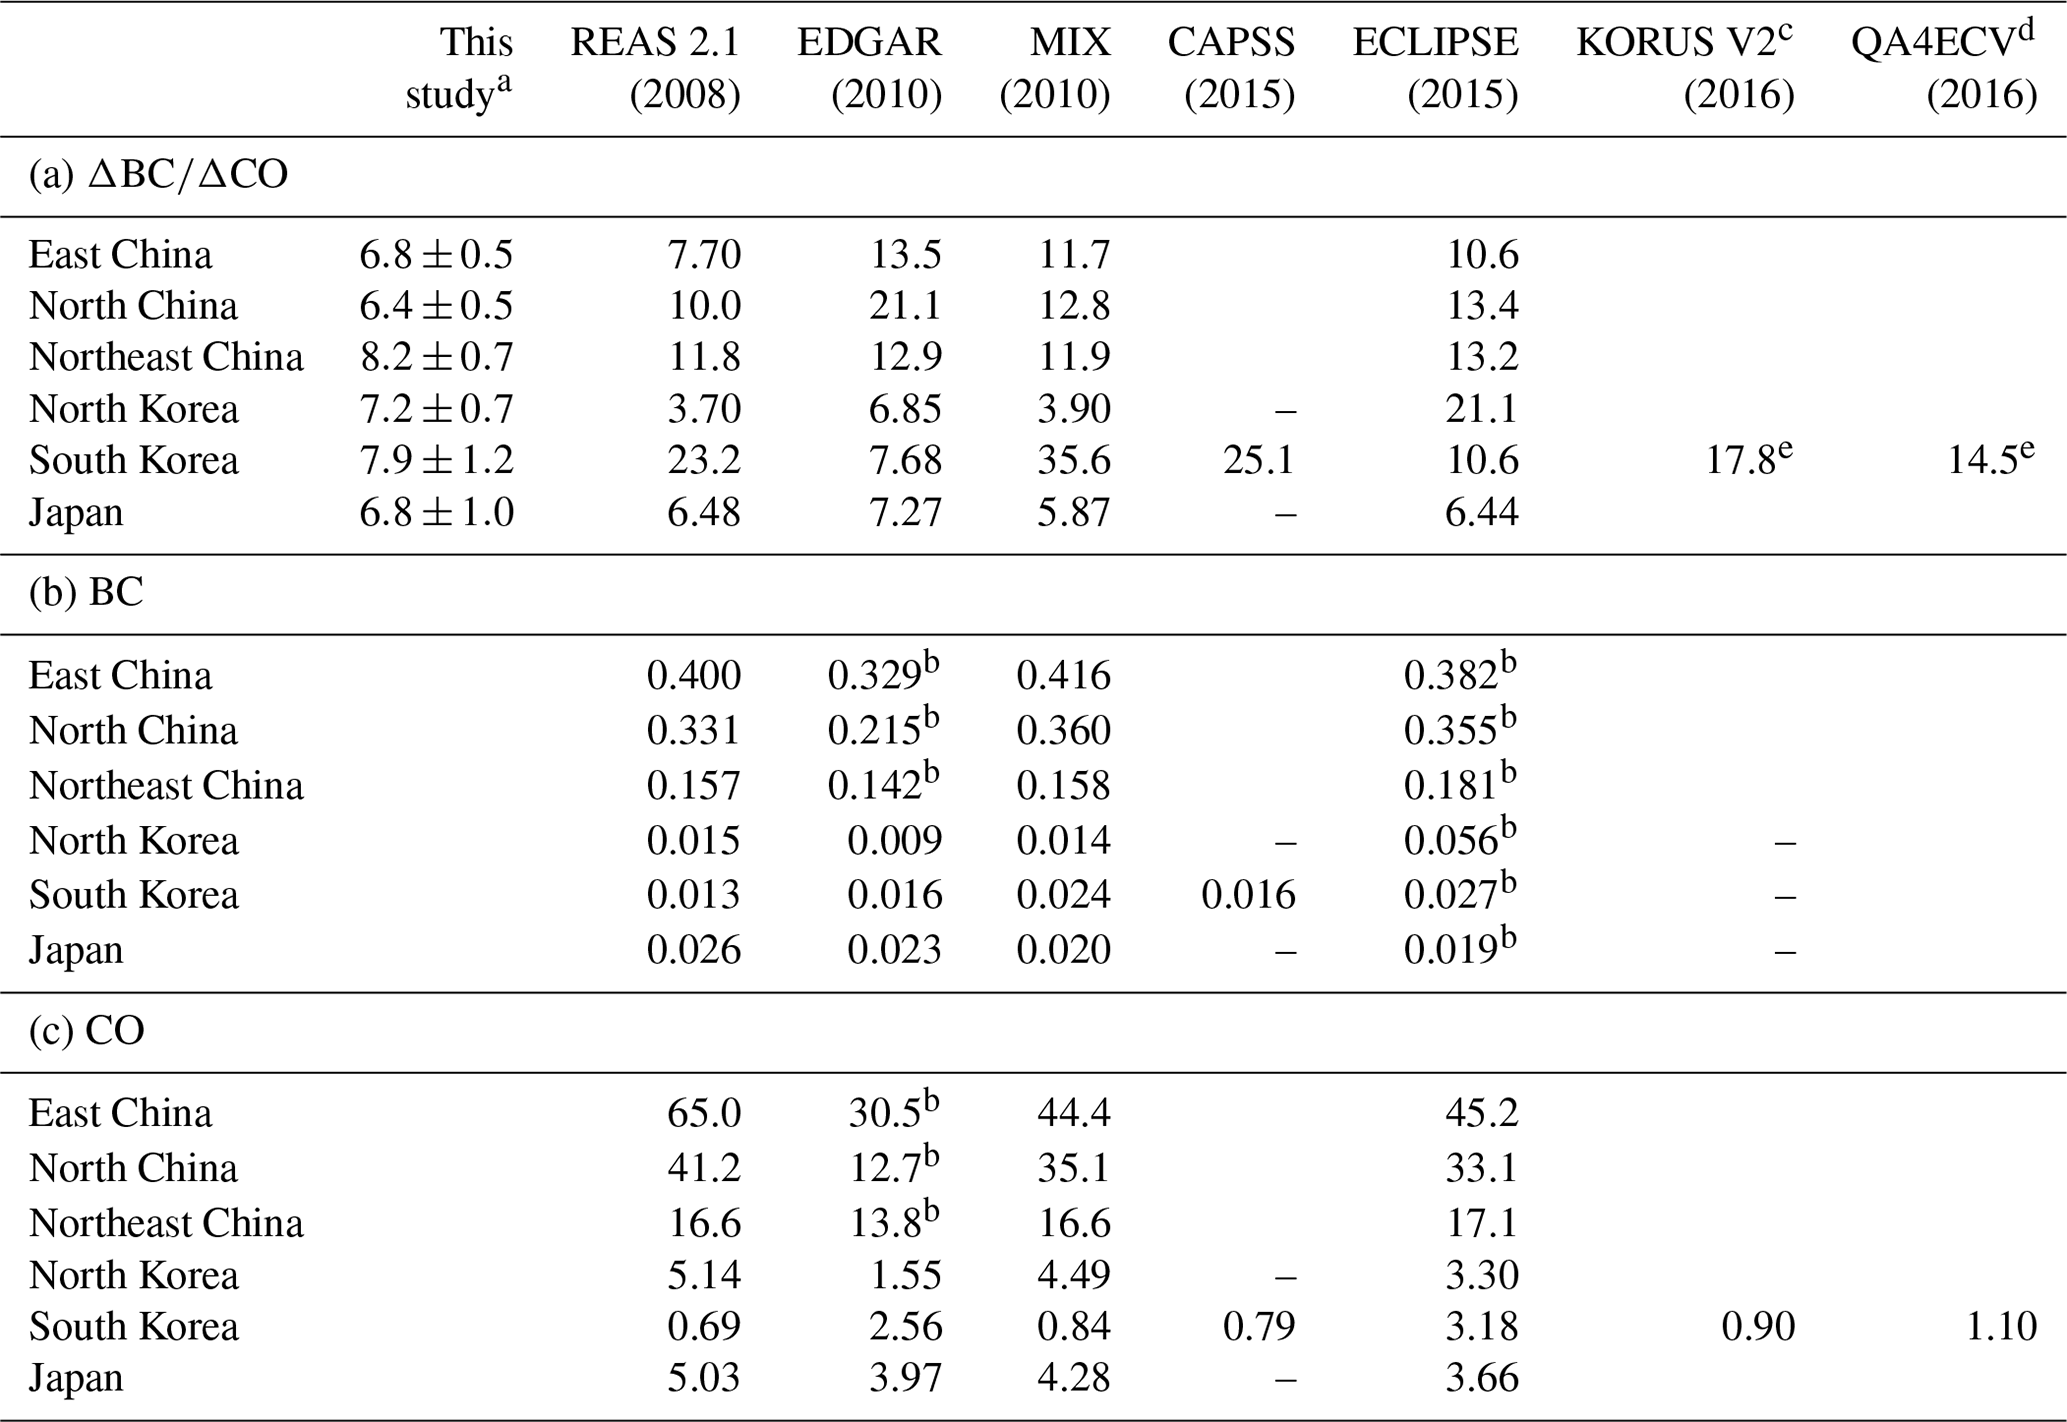
a With uncertainty (1σ) calculated by regional and seasonal mean values. b Calculated based on administrative division from the emission inventory, which did not provide regional emission rates. c Based on the improved CAPSS for 2015 and CREATE v3 in China for 2015 using SMOKE-Asia emission processing at a 0.1∘ resolution (Woo et al., 2012). d From multiconstituent data assimilation; more details can be found in Miyazaki et al. (2019). e Using the BC emission rate from the REAS version 2.1 emission inventory.
In the case of North Korea, the CO emission rate (5.14 Tg) from REAS was considerably higher than that of South Korea by a factor of 7.4 and was especially higher than that of Japan, resulting in a low BC∕CO ratio of 3.7 ng m−3 ppb−1. The domestic and industrial sectors in North Korea showed relatively low BC∕CO ratios of 6.79 and 4.45 ng m−3 ppb−1, respectively, compared to those in China (9.5–10.5 ng m−3 ppb−1 for industry and 13.9–15.6 ng m−3 ppb−1 for the domestic sector). The BC and CO emission rates were under- and/or overestimated, respectively, although the quality of fuel and/or end-of-pipe technology could be different. In addition, when we considered registered vehicles in North Korea (0.26 million) and South Korea (16.8 million), the CO emission from road transportation in North Korea (1.75 Tg) was similar to the roughly revised CO emission in South Korea (1.88 Tg), implying a highly overestimated CO emission rate for the transportation sector (Statics of Korea, 2017). The Comprehensive Regional Emissions inventory for Atmospheric Transport Experiment (CREATE; Woo et al., 2014) in 2015 and EDGAR reported much lower CO emission rates in North Korea (1.41 and 1.55 Tg, respectively). As a result, the BC∕CO ratio from EDGAR falls within a reasonable range as 6.85 ng m−3 ppb−1, indicating agreement with the measured ratio (7.3 ng m−3 ppb−1). This is because the ratio in EDGAR CO emission rates relative to REAS rates (30 % of REAS) was much smaller than that for EDGAR BC (56 % of REAS; Table 3), especially in the road transportation (9 % for CO and 21 % for BC) and industry sectors (38 % for CO and 51 % for BC). Kim and Kim (2019) pointed out that the uncertainty in the REAS CO emission rate in North Korea could result from inaccurate emission factors for biofuel compared to fossil fuels because the REAS emission inventory included several biofuel sources (such as fuel wood, crop residue, and animal waste).
The mean ΔBC∕ΔCO ratio in Japan showed good consistency between the REAS emission inventory (6.84 ng m−3 ppb−1) along with the lowest absolute MFB, at −0.05, which was close to the value of 0.09 from Kanaya et al. (2016). The BC and CO emission rates from EDGAR, MIX, and ECLIPSE V5a were close to those from the REAS emission inventory, indicating that the BC and CO emission rates over Japan were more accurate than those over other regions (Table 3).
In the case of the MIX emission inventory, the emission rates from North and South Korea were derived from the REAS and CAPSS inventories, respectively, and both the emission rates and BC∕CO ratio were within a narrow range of those of the REAS inventory. However, for EDGAR, while the BC∕CO ratios in North Korea, South Korea, and Japan were relatively consistent with the ratios from measurements, the overestimation for China was remarkable compared to both the measurement ratios and other emission inventories. Especially North China showed the highest BC∕CO ratio compared to East and Northeast China because the industry sector in North China has the largest BC and CO emission rates (63 % and 35 % of total, respectively) along with a high BC∕CO ratio (38.5 ng m−3 ppb−1).
3.4 Seasonal variation in the ΔBC∕ΔCO ratio
The regional ΔBC∕ΔCO ratios in the previous sections might still contain variability because of spatial (differences in the pathways of trajectories) and/or temporal variation (differences in monthly emissions) even within the same dominant emission region. To explore this finer spatio-temporal variability in the ΔBC∕ΔCO ratio, the monthly BC and CO emission rates in each grid (0.25∘ by 0.25∘) in the REAS emission inventory were integrated over the pathway of the backward trajectory satisfying altitudes ≤2.5 km and were compared with the observations. Figure 4 shows the seasonal variation in the recalculated BC∕CO ratios from the REAS emission inventory and the measured ΔBC∕ΔCO ratios regardless of the measurement sites.
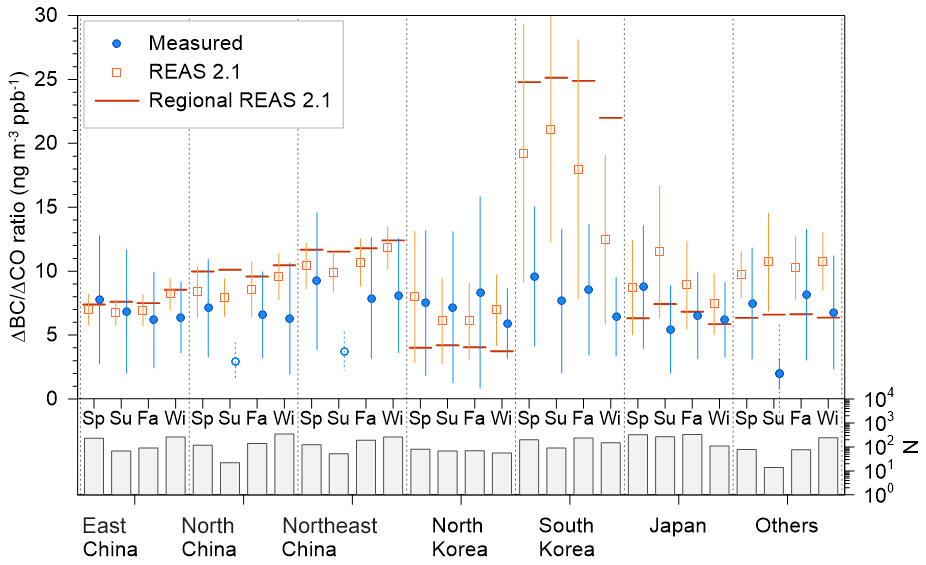
Figure 4The seasonal ΔBC∕ΔCO ratios from four measurement sites (filled blue circles) and recalculated REAS BC∕CO ratios according to the pathway of the trajectory (open orange squares), depending on the dominant emission region. The symbols with vertical lines are the means and standard deviations of the ΔBC∕ΔCO ratios. Open-circle symbols with dashed vertical lines indicate data excluded because of a low number of data (≤50). The horizontal lines for each region indicate the overall mean values of the ΔBC∕ΔCO ratios of dominant emission regions from the REAS version 2.1 emission inventory (Kurokawa et al., 2013). The bar graph on the bottom indicates the number of data in each season and the dominant emission region. The abbreviations “Sp”, “Su”, “Fa”, and “Wi” indicate spring, summer, fall, and winter, respectively.
The recalculated BC∕CO ratios of China and North Korea showed similar seasonal variations, being relatively high in winter and low in summer. This result was caused by the seasonal variation in the BC emission rate (CV: 0.11–0.17) being higher than that in the CO emission rate (CV: 0.07–0.14) according to REAS in China, and domestic heating is the main factor affecting the seasonality. In contrast, the seasonal pattern in the REAS BC∕CO ratios of South Korea and Japan, higher in summer than in spring or winter, can be explained by the term of the CO emission rate (CV: 0.05 for South Korea and 0.12 for Japan) compared to that of BC (CV: 0.005 for South Korea and 0.03 for Japan), which showed a relatively constant rate throughout the year.
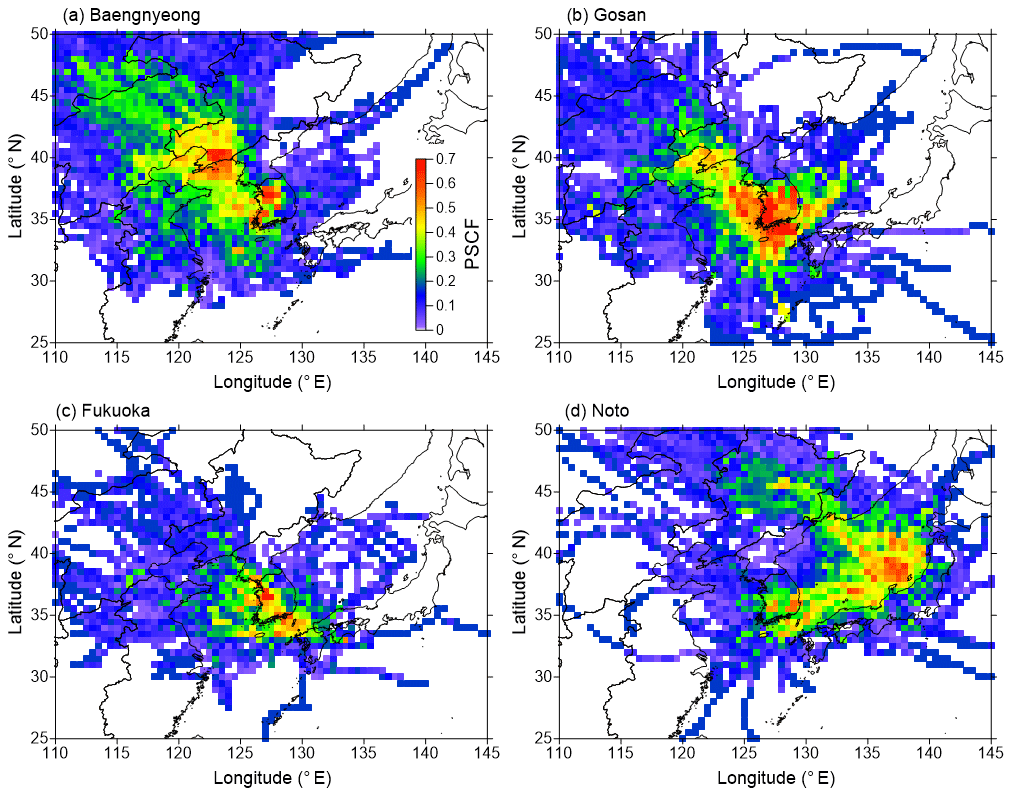
Figure 5Spatial distribution of the PSCF results for the mean fractional bias (MFB) ≥ 0.5 for overestimation cases at the (a) Baengnyeong, (b) Gosan, (c) Fukuoka, and (d) Noto sites. MFB is calculated from 2× (, where Ri and Mi denote the mean values of the recalculated REAS BC∕CO ratio along with the backward trajectory and the measured BC∕CO ratio, respectively.
The average absolute MFB of ΔBC∕ΔCO between the recalculated REAS and the measured values in all regions was 0.29, and that in spring was the lowest, at 0.19, followed by winter (0.33), fall (0.34), and summer (0.61). However, the MFB in summer decreased to 0.30, which was close to that in fall and winter, when the low ΔBC∕ΔCO ratio in North China and Northeast China was excluded due to the small number of data (≤50). The MFB in South Korea was too high, ranging from 0.64 to 0.93, due to underestimation of the CO emission rate, as discussed in Sect. 3.3. It should be noted that the measured ΔBC∕ΔCO ratios in spring were the highest among the seasons for all dominant emission regions except for North Korea; in particular, those in East China, South Korea, and Japan showed significant differences in the ΔBC∕ΔCO ratios between spring and winter (p≤0.05). These higher ΔBC∕ΔCO ratios in spring than in winter were also observed at Hedo, Okinawa (Verma et al., 2011). This difference might be caused by the seasonality of BC emissions from the domestic sector between spring and winter, which was overwhelmed by the seasonality of CO emissions. The annual consumption of coal (high BC∕CO ratios) for households slightly decreased, from 1.004×10⁸ to 9.35×10⁷ t, whereas that of natural gas (non-emitted BC) showed a significant increase, from 7.9×10⁹ to 3.6×10¹⁰ m3, a factor of 3.6 times, from 2005 to 2015 (National Bureau of Statistics of China, 2017). This fuel transition for the domestic sector could have caused a decreased ΔBC∕ΔCO ratio in winter due to the constant BC emission rate along with an increasing CO emission rate.
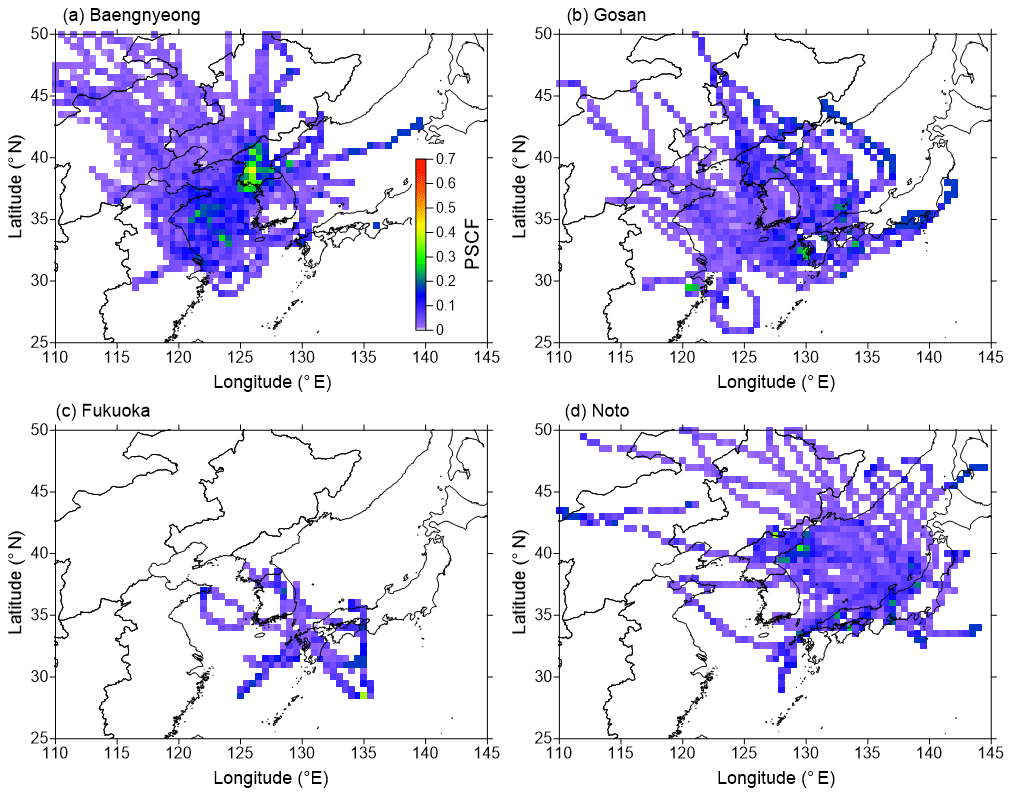
Figure 6Same as Fig. 5, except for the mean fractional bias (MFB) for underestimation cases.
Although the ΔBC∕ΔCO in Japan showed good agreement with the regional REAS BC∕CO ratio, the mean absolute MFB was 0.30, which was not low, as we expected. In the REAS emission inventory, the CO emission rates in South Korea and Japan mainly varied due to the domestic sector and road transportation, respectively, and those rates were maximum in winter and minimum in summer. The reason why the observed ΔBC∕ΔCO ratios in both South Korea and Japan showed the highest values in spring and not summer is that the ratio of ΔBC in spring to that in summer was higher than the corresponding ratio of ΔCO, implying that seasonal variations in the CO emission rate could not represent the seasonal characteristics.
Similar to the regional variation, the seasonal variation in other inventories also showed large differences not only in the variation pattern but also in magnitude (Fig. S10). As discussed for the regional variations in the emission inventory (Sect. 3.3), the MIX inventory showed similar seasonal variations to those of the REAS emission inventory, indicating high BC∕CO ratios in winter for China (due to residential heating) and high values in summer for Japan (due to traffic). On the other hand, the seasonal variation in EDGAR reached the maximum in summer for China and in winter for South Korea and Japan, which is an opposite seasonal pattern to that of the REAS and MIX emission inventories. The reason why the summer ratio was high in China is that the emission rates from industry increased in summer. This tendency was prominent in North China due to the much higher BC∕CO ratio (this was especially relevant for oil refineries and the transformation industry). High BC∕CO ratios in winter in South Korea and Japan were due to the reduced effect from road transportation, which has a low BC∕CO ratio.
3.5 Estimated potential regions of over- and underestimation for ΔBC∕ΔCO
An investigation of the potential locations for over- and underestimated ΔBC∕ΔCO ratios was performed using a potential source contribution function (PSCF). Typically, the PSCF has been widely applied to identify source regions of aerosols on regional scales as well as to identify long-range transported pollution to a receptor site (Guo et al., 2015; Kim et al., 2016). Unlike the grid size of the REAS emission inventory, the trajectory endpoints are assigned to cells of geographic coordinates with a latitude (i) and longitude (j), and the number of trajectory segment endpoints within the grid cell are counted. The PSCF at the i,jth grid cell can be calculated by the following:
where ni,j is the total number of trajectory endpoints over the i,jth grid cell and mi,j is the number of these endpoints that corresponds to values higher or lower than certain criteria over a certain grid cell. We applied MFB values higher than 0.5 and lower than −0.5 for over- and underestimated criteria, respectively. If the total number of trajectory segment endpoints in a particular cell is small, the PSCF value may be biased toward overestimation, especially when the value of is higher at the receptor site. To reduce the effect of abnormal and large PSCFi,j values with low , a weight function (Guo et al., 2015) was applied with the power law of the total number of trajectories (NAPT=0 for each site in Table 2).
For overestimated cases (MFB≥0.5; Fig. 5), South Korea was clearly identified as a region with a higher PSCF value regardless of the measurement site. In particular, the western region of South Korea, including the SMA and the southwestern region, showed the highest PSCF values. High PSCF values in Baengnyeong were observed in the SMA region (17.2 ng m−3 ppb−1 from REAS) with 0.60, whereas those in Gosan were located in the southwestern region of South Korea (30.7 ng m−3 ppb−1 from REAS) with 0.65, suggesting that the southwestern region of South Korea is more overestimated than the SMA region. Although the measured ΔBC∕ΔCO ratios were similar at Fukuoka and Noto, the overestimated region for Fukuoka was more emphasized in SMA, with a higher PSCF value (0.61) than that for Noto, which indicated that the southeastern region (27.0 ng m−3 ppb−1 from REAS) had a relatively low PSCF (0.42). In China, Liaoning (10.8 ng m−3 ppb−1 from REAS) in Northeast China revealed the highest PSCF (0.43), followed by Tianjin (7.0 ng m−3 ppb−1 from REAS) in North China at Baengnyeong, along with similar results in Gosan. Fukuoka and Noto did not directly point out the overestimated regions in China. Nonetheless, Noto may indicate that Heilongjiang (14.0 ng m−3 ppb−1) is related to a large overestimation of the ratio, as deduced from the pathway of air mass toward Northeast China. For Japan, the Kyushu and central region (Kansai, Kanto, and Chubu) showed moderate PSCF values (∼0.3), implying relatively good consistency between the REAS and the measured ratios.
On the other hand, a PSCF value higher than 0.2 for an underestimated case (, Fig. 6) was observed only at the Baengnyeong site for North Korea. The most underestimated regions were identified as the western regions of North Korea, such as Pyongyang (4.72 ng m−3 ppb−1 from REAS) and nearby. These regions showed the highest CO emission rates (Fig. 1), especially from the industrial sector, suggesting that the accuracies of the CO emission rates from not only road transportation but also the industrial sector should be improved. The results of PSCF analysis provided useful information on the potentially over- and underestimated BC∕CO ratio regions where the BC and CO emission rates should be preferentially updated.
To verify the REAS bottom-up emission inventory, the ΔBC∕ΔCO ratios were diagnosed from long-term, best-effort observations at four sites in East Asia, including two sites in South Korea (Baengnyeong and Gosan) and two sites in Japan (Fukuoka and Noto). Based on the backward trajectories covering the past 72 h, dominant emission regions were assigned to six study domains divided by country and/or administrative district, including three Chinese regions (East, North, and Northeast China), two Korean Peninsula regions (South and North Korea), and Japan. To choose cases without wet-deposition effects, the ΔBC∕ΔCO ratio was considered only when the accumulated precipitation along a backward trajectory (APT) for 3 d was equal to zero.
The regional ΔBC∕ΔCO ratios were overestimated in the REAS emission inventory from East, North, and Northeast China. The REAS BC∕CO ratio of South Korea was 3.0 times higher than the measured ΔBC∕ΔCO ratio, whereas Japan showed good consistency between the two ratios. The plausible reason was that the CO emissions rates from gasoline vehicles and motorcycles in South Korea were highly underestimated when considering hypothetical CO emission factors compared to those in Japan. However, North Korea revealed a highly underestimated region by a factor of 2.0 due to unrealistically overestimated CO emissions from vehicles, although it is hard to directly compare these emissions with those in other countries due to the possibility of differences in fuel usage and combustion technology. The seasonal variation in the ΔBC∕ΔCO ratio revealed different tendencies. The BC∕CO ratios from REAS (and MIX) peaked in winter (China and North Korea) and in summer (South Korea and Japan), which is an opposite seasonal pattern to that of EDGAR values. In contrast, the measured ratio was the highest in spring, implying that the REAS and other emission inventories did not reflect the major seasonality driver. From the PSCF analysis, the potentially over- and underestimated regions were emphasized in the SMA and southwestern regions of South Korea and Pyongyang of North Korea, respectively. In addition to the highlighted regions in the Korean Peninsula, moderate PSCF values for overestimation were also observed at Tianjin (East China), Liaoning, Heilongjiang (Northeast China), on Kyushu, and in the central region in Japan.
This study provided the overall mean BC∕CO ratio with uncertainty for each dominant emission region by taking into consideration the full range of the ΔBC∕ΔCO ratio based on spatial (four sites) and temporal variations (four seasons; Table 3). The BC emissions over East Asia can be estimated by multiplying the observed ΔBC∕ΔCO ratio by reliable estimates of the CO emission rate. The discrepancy in the BC∕CO ratio is largely contributed by inaccurate CO emission rates in emission inventories in addition to BC emission factors. Therefore, to enhance the accuracy of the BC emission rate over East Asia, a comprehensive and in-depth investigation of CO emissions should be performed to accurately assess the CO emission rate by considering not only the annual total but also the monthly basis, particularly in the Korean Peninsula.
The observational data set for BC is available upon request to the corresponding author.
The supplement related to this article is available online at: https://doi.org/10.5194/acp-20-83-2020-supplement.
YC and YK designed the study and prepared the paper, with contributions from all co-authors. SMP, HK, and DHJ were responsible for measurements at Baengnyeong. AM and YS conducted measurements at Noto, and IU provided the data at Fukuoka. SWK and ML contributed to ground observations and quality control at Gosan. XP contributed the data analysis. All co-authors provided professional comments to improve the paper.
The authors declare that they have no conflict of interest.
The authors thank NOAA ARL for providing the HYSPLIT backward trajectories.
This research has been supported by the Environment Research and Technology Development Fund of the Ministry of the Environment, Japan (grant no. 2-1803).
This paper was edited by Qiang Zhang and reviewed by two anonymous referees.
Bey, I., Jacob, D., Logan, J., and Yantosca, R.: Asian chemical outflow to the Pacific in spring: Origins, pathways, and budgets, J. Geophys. Res.-Atmos., 106, 23097–23113, https://doi.org/10.1029/2001JD000806, 2001
Bond, T. C., Anderson, T. L., and Campbell, D.: Calibration and Intercomparison of Filter-Based Measurements of Visible Light Absorption by Aerosols, Aerosol Sci. Technol., 30, 582–600, https://doi.org/10.1080/027868299304435, 1999.
Bond, T. C., Doherty, S. J., Fahey, D., Forster, P., Berntsen, T., DeAngelo, B., Flanner, M., Ghan, S., Kärcher, B., and Koch, D.: Bounding the role of black carbon in the climate system: A scientific assessment, J. Geophys. Res.-Atmos., 118, 5380–5552, 2013.
Cho, C., Kim, S.-W., Lee, M., Lim, S., Fang, W., Gustafsson, Ö., Andersson, A., Park, R. J., and Sheridan, P. J.: Observation-based estimates of the mass absorption cross-section of black and brown carbon and their contribution to aerosol light absorption in East Asia, Atmos. Environ., 212, 65–74, https://doi.org/10.1016/j.atmosenv.2019.05.024, 2019.
Crippa, M., Guizzardi, D., Muntean, M., Schaaf, E., Dentener, F., van Aardenne, J. A., Monni, S., Doering, U., Olivier, J. G. J., Pagliari, V., and Janssens-Maenhout, G.: Gridded emissions of air pollutants for the period 1970–2012 within EDGAR v4.3.2, Earth Syst. Sci. Data, 10, 1987–2013, https://doi.org/10.5194/essd-10-1987-2018, 2018.
Draxler, R,. Stunder, B., Rolph, G., Stein, A., and Taylor, A.: HYSPLIT4 user's guide, version 4, available at: http://www.arl.noaa.gov/documents/reports/hysplit_user_guide.pdf (last access: 27 June 2019), 2018.
Geng, F., Hua, J., Mu, Z., Peng, L., Xu, X., Chen, R., and Kan, H.: Differentiating the associations of black carbon and fine particle with daily mortality in a Chinese city, Environ. Res., 120, 27–32, https://doi.org/10.1016/j.envres.2012.08.007, 2013.
Guo, Q., Hu, M., Guo, S., Wu, Z., Hu, W., Peng, J., Hu, W., Wu, Y., Yuan, B., Zhang, Q., and Song, Y.: The identification of source regions of black carbon at a receptor site off the eastern coast of China, Atmos. Environ., 100, 78–84, https://doi.org/10.1016/j.atmosenv.2014.10.053, 2015.
Guo, Q., Hu, M., Guo, S., Wu, Z., Peng, J., and Wu, Y.: The variability in the relationship between black carbon and carbon monoxide over the eastern coast of China: BC aging during transport, Atmos. Chem. Phys., 17, 10395–10403, https://doi.org/10.5194/acp-17-10395-2017, 2017.
Han, S., Kondo, Y., Oshima, N., Takegawa, N., Miyazaki, Y., Hu, M., Lin, P., Deng, Z., Zhao, Y., Sugimoto, N., and Wu, Y.: Temporal variations of elemental carbon in Beijing, J. Geophys. Res.-Atmos., 114, D23202, https://doi.org/10.1029/2009JD012027, 2009.
Han, K. M., Lee, S., Chang, L. S., and Song, C. H.: A comparison study between CMAQ-simulated and OMI-retrieved NO2 columns over East Asia for evaluation of NOx emission fluxes of INTEX-B, CAPSS, and REAS inventories, Atmos. Chem. Phys., 15, 1913–1938, https://doi.org/10.5194/acp-15-1913-2015, 2015.
Huebert, B. J., Bates, T., Russell, P. B., Shi, G., Kim, Y. J., Kawamura, K., Carmichael, G., and Nakajima, T.: An overview of ACE-Asia: Strategies for quantifying the relationships between Asian aerosols and their climatic impacts, J. Geophys. Res.-Atmos., 108, 8633, https://doi.org/10.1029/2003JD003550, 2003.
Itahashi, S., Uno, I., Osada, K., Kamiguchi, Y., Yamamoto, S., Tamura, K., Wang, Z., Kurosaki, Y., and Kanaya, Y.: Nitrate transboundary heavy pollution over East Asia in winter, Atmos. Chem. Phys., 17, 3823–3843, https://doi.org/10.5194/acp-17-3823-2017, 2017.
Jacobson, M. Z.: Strong radiative heating due to the mixing state of black carbon in atmospheric aerosols, Nature, 409, 695, https://doi.org/10.1038/35055518, 2001.
Janssen, N., A. H., Hoek, G., Simic-Lawson, M., Fischer, P., van Bree, L., ten Brink, H., Keuken, M., Atkinson Richard, W., Anderson, H. R., Brunekreef, B., and Cassee Flemming, R.: Black Carbon as an Additional Indicator of the Adverse Health Effects of Airborne Particles Compared with PM10 and PM2.5, Environ. Health Perspect., 119, 1691–1699, https://doi.org/10.1289/ehp.1003369, 2011.
Janssen, N. A., Gerlofs-Nijland, M. E., Lanki, T., Salonen, R. O., Cassee, F., Hoek, G., Fischer, P., Brunekreef, B., and Krzyzanowski, M.: Health effects of black carbon, WHO Regional Office for Europe Copenhagen, 2012.
Kanaya, Y., Komazaki, Y., Pochanart, P., Liu, Y., Akimoto, H., Gao, J., Wang, T., and Wang, Z.: Mass concentrations of black carbon measured by four instruments in the middle of Central East China in June 2006, Atmos. Chem. Phys., 8, 7637–7649, https://doi.org/10.5194/acp-8-7637-2008, 2008.
Kanaya, Y., Taketani, F., Komazaki, Y., Liu, X., Kondo, Y., Sahu, L. K., Irie, H., and Takashima, H.: Comparison of Black Carbon Mass Concentrations Observed by Multi-Angle Absorption Photometer (MAAP) and Continuous Soot-Monitoring System (COSMOS) on Fukue Island and in Tokyo, Japan, Aerosol Sci. Technol., 47, 1–10, https://doi.org/10.1080/02786826.2012.716551, 2013.
Kanaya, Y., Pan, X., Miyakawa, T., Komazaki, Y., Taketani, F., Uno, I., and Kondo, Y.: Long-term observations of black carbon mass concentrations at Fukue Island, western Japan, during 2009–2015: constraining wet removal rates and emission strengths from East Asia, Atmos. Chem. Phys., 16, 10689–10705, https://doi.org/10.5194/acp-16-10689-2016, 2016.
Kim, B. M., Seo, J., Kim, J. Y., Lee, J. Y., and Kim, Y.: Transported vs. local contributions from secondary and biomass burning sources to PM2.5, Atmos. Environ., 144, 24–36, https://doi.org/10.1016/j.atmosenv.2016.08.072, 2016.
Kim, I. S. and Kim, Y. P.: Characteristics of Energy Usage and Emissions of Air Pollutants in North Korea, J. Korean Soc. Atmos. Environ., 35, 125–137, 2019.
Kondo, Y., Komazaki, Y., Miyazaki, Y., Moteki, N., Takegawa, N., Kodama, D., Deguchi, S., Nogami, M., Fukuda, M., Miyakawa, T., Morino, Y., Koike, M., Sakurai, H., and Ehara, K.: Temporal variations of elemental carbon in Tokyo, J. Geophys. Res.-Atmos., 111, D12205, https://doi.org/10.1029/2005JD006257, 2006.
Kondo, Y., Sahu, L., Moteki, N., Khan, F., Takegawa, N., Liu, X., Koike, M., and Miyakawa, T.: Consistency and Traceability of Black Carbon Measurements Made by Laser-Induced Incandescence, Thermal-Optical Transmittance, and Filter-Based Photo-Absorption Techniques, Aerosol Sci. Technol., 45, 295–312, https://doi.org/10.1080/02786826.2010.533215, 2011.
Kondo, Y.: Effects of black carbon on climate: Advances in measurement and modeling, Monogr. Environ. Earth Planets, 3, 1–85, 2015.
Kurokawa, J., Ohara, T., Morikawa, T., Hanayama, S., Janssens-Maenhout, G., Fukui, T., Kawashima, K., and Akimoto, H.: Emissions of air pollutants and greenhouse gases over Asian regions during 2000–2008: Regional Emission inventory in ASia (REAS) version 2, Atmos. Chem. Phys., 13, 11019–11058, https://doi.org/10.5194/acp-13-11019-2013, 2013.
Lee, D.-G., Lee, Y.-M., Jang, K.-W., Yoo, C., Kang, K.-H., Lee, J.-H, Jung, S.-W., Park, J.-M, Lee, S.-B., Han, J.-S., Hong, J.-H., and Lee, S.-J.: Korean national emissions inventory system and 2007 air pollutant emissions, Asian J. Atmos. Environ., 5, 278–291, https://doi.org/10.5572/ajae.2011.5.4.278, 2011.
Li, M., Zhang, Q., Kurokawa, J.-I., Woo, J.-H., He, K., Lu, Z., Ohara, T., Song, Y., Streets, D. G., Carmichael, G. R., Cheng, Y., Hong, C., Huo, H., Jiang, X., Kang, S., Liu, F., Su, H., and Zheng, B.: MIX: a mosaic Asian anthropogenic emission inventory under the international collaboration framework of the MICS-Asia and HTAP, Atmos. Chem. Phys., 17, 935–963, https://doi.org/10.5194/acp-17-935-2017, 2017.
Lim, S., Lee, M., Lee, G., Kim, S., Yoon, S., and Kang, K.: Ionic and carbonaceous compositions of PM10, PM2.5 and PM1.0 at Gosan ABC Superstation and their ratios as source signature, Atmos. Chem. Phys., 12, 2007–2024, https://doi.org/10.5194/acp-12-2007-2012, 2012.
Loomis, D., Grosse, Y., Lauby-Secretan, B., Ghissassi, F. E., Bouvard, V., Benbrahim-Tallaa, L., Guha, N., Baan, R., Mattock, H., and Straif, K.: The carcinogenicity of outdoor air pollution, Lancet Oncol., 14, 1262–1263, https://doi.org/10.1016/S1470-2045(13)70487-X, 2013.
Matsui, H., Kondo, Y., Moteki, N., Takegawa, N., Sahu, L. K., Zhao, Y., Fuelberg, H. E., Sessions, W. R., Diskin, G., Blake, D. R., Wisthaler, A., and Koike, M.: Seasonal variation of the transport of black carbon aerosol from the Asian continent to the Arctic during the ARCTAS aircraft campaign, J. Geophys. Res.-Atmos., 116, D05202, https://doi.org/10.1029/2010JD015067, 2011.
Miyakawa, T., Kanaya, Y., Komazaki, Y., Taketani, F., Pan, X., Irwin, M., and Symonds, J.: Intercomparison between a single particle soot photometer and evolved gas analysis in an industrial area in Japan: Implications for the consistency of soot aerosol mass concentration measurements, Atmos. Environ., 127, 14–21, https://doi.org/10.1016/j.atmosenv.2015.12.018, 2016.
Miyakawa, T., Oshima, N., Taketani, F., Komazaki, Y., Yoshino, A., Takami, A., Kondo, Y., and Kanaya, Y.: Alteration of the size distributions and mixing states of black carbon through transport in the boundary layer in east Asia, Atmos. Chem. Phys., 17, 5851–5864, https://doi.org/10.5194/acp-17-5851-2017, 2017.
Miyakawa, T., Komazaki, Y., Zhu, C., Taketani, F., Pan, X., Wang, Z., and Kanaya, Y.: Characterization of carbonaceous aerosols in Asian outflow in the spring of 2015: Importance of non-fossil fuel sources, Atmos. Environ., 214, 116858, https://doi.org/10.1016/j.atmosenv.2019.116858, 2019.
Miyazaki, K., Sekiya, T., Fu, D., Bowman, K. W., Kulawik, S. S., Sudo, K., Walker, T., Kanaya, Y., Takigawa, M., Ogochi, K., Eskes, H., Boersma, K. F., Thompson, A. M., Gaubert, B., Barre, J., and Emmons, L. K.: Balance of Emission and Dynamical Controls on Ozone During the Korea-United States Air Quality Campaign From Multiconstituent Satellite Data Assimilation, J. Geophys. Res.-Atmos., 124, 387–413, https://doi.org/10.1029/2018JD028912, 2019.
MLIT (Ministry of Land, Infrastructure, Transport and Tourism): Annual report of Automobile transportation statistics in 2015, available at; https://www.e-stat.go.jp/stat-search/file-download?statInfId=000031752810&fileKind=2 (last access: 25 January 2019), 2016 (in Japanese).
MLIT: Traffic statistics book, available at: http://www.mlit.go.jp/statistics/kotsusiryo.html, last access: 27 June 2019 (in Japanese).
MOLIT (Ministry of Land, Infrastructure and Transport): Total Registered Moter Vehicles, available at: http://stat.molit.go.kr/portal/cate/statFileView.do?hRsId=58&hFormId=5, last access: 8 February 2019 (in Korean).
Myhre, G., Shindell, D., Bréon, F.-M., Collins, W., Fuglestvedt, J., Huang, J., Koch, D., Lamarque, J.-F., Lee, D., Mendoza, B., Nakajima, T., Robock, A., Stephens, G., Takemura, T., and Zhang, H.: Anthropogenic and Natural Radiative Forcing. In: Climate Change 2013: The Physical Science Basis, Contribution of Working Group I to the Fifth Assessment Report of the Intergovernmental Panel on Climate Change, Cambridge University Press, Cambridge, United Kingdom and New York, NY, USA, 2013.
Nakajima, T., Yoon, S.-C., Ramanathan, V., Shi, G.-Y., Takemura, T., Higurashi, A., Takamura, T., Aoki, K., Sohn, B.-J., Kim, S.-W., Tsuruta, H., Sugimoto, N., Shimizu, A., Tanimoto, H., Sawa, Y., Lin, N.-H., Lee, C.-T., Goto, D., and Schutgens, N.: Overview of the Atmospheric Brown Cloud East Asian Regional Experiment 2005 and a study of the aerosol direct radiative forcing in east Asia, J. Geophys. Res.-Atmos., 112, D24S91, https://doi.org/10.1029/2007JD009009, 2007.
National Bureau of Statistics of China: China Statistical Yearbook 2017, China Statistics Press, Beijing, ISBN-13: 978-7503782534, 2017.
NIOSH: Method 5040 issue 1: elemental carbon (diesel exhaust), 4th ed., Cincinnati, OH, 1996.
Ogren, J. A., Wendell, J., Andrews, E., and Sheridan, P. J.: Continuous light absorption photometer for long-term studies, Atmos. Meas. Tech., 10, 4805–4818, https://doi.org/10.5194/amt-10-4805-2017, 2017.
Ohara, T., Akimoto, H., Kurokawa, J., Horii, N., Yamaji, K., Yan, X., and Hayasaka, T.: An Asian emission inventory of anthropogenic emission sources for the period 1980–2020, Atmos. Chem. Phys., 7, 4419–4444, https://doi.org/10.5194/acp-7-4419-2007, 2007.
Ohata, S., Kondo, Y., Moteki, N., Mori, T., Yoshida, A., Sinha, P. R., and Koike, M.: Accuracy of black carbon measurements by a filter-based absorption photometer with a heated inlet, Aerosol Sci. Technol., 53, 1079–1091, https://doi.org/10.1080/02786826.2019.1627283, 2019.
Oshima, N., Kondo, Y., Moteki, N., Takegawa, N., Koike, M., Kita, K., Matsui, H., Kajino, M., Nakamura, H., Jung, J. S., and Kim, Y. J.: Wet removal of black carbon in Asian outflow: Aerosol Radiative Forcing in East Asia (A-FORCE) aircraft campaign, J. Geophys. Res.-Atmos., 117, D03204, https://doi.org/10.1029/2011JD016552, 2012.
Pan, X. L., Kanaya, Y., Wang, Z. F., Liu, Y., Pochanart, P., Akimoto, H., Sun, Y. L., Dong, H. B., Li, J., Irie, H., and Takigawa, M.: Correlation of black carbon aerosol and carbon monoxide in the high-altitude environment of Mt. Huang in Eastern China, Atmos. Chem. Phys., 11, 9735–9747, https://doi.org/10.5194/acp-11-9735-2011, 2011.
Pan, X. L., Kanaya, Y., Wang, Z. F., Komazaki, Y., Taketani, F., Akimoto, H., and Pochanart, P.: Variations of carbonaceous aerosols from open crop residue burning with transport and its implication to estimate their lifetimes, Atmos. Environ., 74, 301–310, https://doi.org/10.1016/j.atmosenv.2013.03.048, 2013.
Park, R. J., Jacob, D. J., Palmer, P. I., Clarke, A. D., Weber, R. J., Zondlo, M. A., Eisele, F. L., Bandy, A. R., Thornton, D. C., Sachse, G. W., and Bond, T. C.: Export efficiency of black carbon aerosol in continental outflow: Global implications, J. Geophys. Res.-Atmos., 110, 1–7, https://doi.org/10.1029/2004JD005432, 2005.
Park, S.-S., Jung, S.-A., Gong, B.-J., Cho, S.-Y., and Lee, S.-J.: Characteristics of PM2.5 Haze Episodes Revealed by Highly Time-Resolved Measurements at an Air Pollution Monitoring Supersite in Korea, Aerosol Air Qual. Res., 13, 957–976, https://doi.org/10.4209/aaqr.2012.07.0184, 2013.
Petzold, A., Schloesser, H., Sheridan, P. J., Arnott, W. P., Ogren, J. A., and Virkkula, A.: Evaluation of Multiangle Absorption Photometry for Measuring Aerosol Light Absorption, Aerosol Sci. Technol., 39, 40–51, https://doi.org/10.1080/027868290901945, 2005.
Ramana, M. V., Ramanathan, V., Feng, Y., Yoon, S. C., Kim, S. W., Carmichael, G. R., and Schauer, J. J.: Warming influenced by the ratio of black carbon to sulphate and the black-carbon source, Nat. Geosci., 3, 542–545, 2010.
Ramanathan, V. and Carmichael, G.: Global and regional climate changes due to black carbon, Nat. Geosci., 1, 221, https://doi.org/10.1038/ngeo156, 2008.
Sahu, L. K., Kondo, Y., Miyazaki, Y., Kuwata, M., Koike, M., Takegawa, N., Tanimoto, H., Matsueda, H., Yoon, S. C., and Kim, Y. J.: Anthropogenic aerosols observed in Asian continental outflow at Jeju Island, Korea, in spring 2005, J. Geophys. Res.-Atmos., 114, D03301, https://doi.org/10.1029/2008JD010306, 2009.
Saikawa, E., Kim, H., Zhong, M., Avramov, A., Zhao, Y., Janssens-Maenhout, G., Kurokawa, J.-I., Klimont, Z., Wagner, F., Naik, V., Horowitz, L. W., and Zhang, Q.: Comparison of emissions inventories of anthropogenic air pollutants and greenhouse gases in China, Atmos. Chem. Phys., 17, 6393–6421, https://doi.org/10.5194/acp-17-6393-2017, 2017.
Samset, B. H.: How cleaner air changes the climate, Science, 360, 148–150, https://doi.org/10.1126/science.aat1723, 2018.
Smith, K. R., Jerrett, M., Anderson, H. R., Burnett, R. T., Stone, V., Derwent, R., Atkinson, R. W., Cohen, A., Shonkoff, S. B., Krewski, D., Pope, C. A., Thun, M. J., and Thurston, G.: Public health benefits of strategies to reduce greenhouse-gas emissions: health implications of short-lived greenhouse pollutants, The Lancet, 374, 2091–2103, https://doi.org/10.1016/S0140-6736(09)61716-5, 2009.
Statics of Korea: Major Statistics Indicators of North Korea, Statistics Korea, Korea, 287 pp., 2017.
Su, L., Yuan, Z., Fung, J. C. H., and Lau, A. K. H.: A comparison of HYSPLIT backward trajectories generated from two GDAS datasets, Sci. Total Environ., 506–507, 527–537, https://doi.org/10.1016/j.scitotenv.2014.11.072, 2015.
Taketani, F., Kanaya, Y., Nakayama, T., Ueda, S., Matsumi, Y., Sadanaga, Y., Iwamoto, Y., and Matsuki, A.: Property of Black Carbon Particles Measured by a Laser-Induced Incandescence Technique in the spring at Noto Peninsula, Japan, J. Aerosol Res., 31, 194–202, https://doi.org/10.11203/jar.31.194, 2016 (Abstract in English).
TS (Korea Transportation Safety Authority): A research on the real condition of driving mileage in 2008, available at: https://www.kotems.or.kr/app/kotems/forward?pageUrl=/kotems/ptl/bbs/KotemsPtlBbsStatsLs&topmenu1=06&topmenu2=03&topmenu3=03, last access: 25 June 2009 (in Korean).
TS: A research on the real condition of actual driving mileage in 2015 (2012–2015), available at: https://www.kotems.or.kr/app/kotems/forward?pageUrl=/kotems/ptl/bbs/KotemsPtlBbsStatsLs&topmenu1=06&topmenu2=03&topmenu3=03 (last access: 25 June 2019), 2016 (in Korean).
Turpin, B. J., Saxena, P., and Andrews, E.: Measuring and simulating particulate organics in the atmosphere: problems and prospects, Atmos. Environ., 34, 2983–3013, https://doi.org/10.1016/S1352-2310(99)00501-4, 2000.
Ueda, S., Nakayama, T., Taketani, F., Adachi, K., Matsuki, A., Iwamoto, Y., Sadanaga, Y., and Matsumi, Y.: Light absorption and morphological properties of soot-containing aerosols observed at an East Asian outflow site, Noto Peninsula, Japan, Atmos. Chem. Phys., 16, 2525–2541, https://doi.org/10.5194/acp-16-2525-2016, 2016.
Uno, I., Osada, K., Yumimoto, K., Wang, Z., Itahashi, S., Pan, X., Hara, Y., Kanaya, Y., Yamamoto, S., and Fairlie, T. D.: Seasonal variation of fine- and coarse-mode nitrates and related aerosols over East Asia: synergetic observations and chemical transport model analysis, Atmos. Chem. Phys., 17, 14181–14197, https://doi.org/10.5194/acp-17-14181-2017, 2017.
Verma, R. L., Kondo, Y., Oshima, N., Matsui, H., Kita, K., Sahu, L. K., Kato, S., Kajii, Y., Takami, A., and Miyakawa, T.: Seasonal variations of the transport of black carbon and carbon monoxide from the Asian continent to the western Pacific in the boundary layer, J. Geophys. Res.-Atmos., 116, D21307, https://doi.org/10.1029/2011JD015830, 2011.
Wang, Y., Wang, X., Kondo, Y., Kajino, M., Munger, J. W., and Hao, J.: Black carbon and its correlation with trace gases at a rural site in Beijing: Top-down constraints from ambient measurements on bottom-up emissions, J. Geophys. Res.-Atmos., 116, D24304, https://doi.org/10.1029/2011JD016575, 2011.
Woo, J.-H., Choi, K.-C., Kim, H. K., Baek, B. H., Jang, M., and Eum, J.-H.: Development of an anthropogenic emissions processing system for Asia using SMOKE. Atmos. Environ., 58, 5–13, 2012.
Woo, J.-H., Quan, S., Choi, K.-C., Kook, H., Jin, H., Song, C.-K., Han, J., and Lee, S.: Development of the CREATE inventory in support of integrated modeling of climate and air quality for East Asia, GEIA Conference, Boulder, USA, 2014.
Yeo, S.-Y., Lee, H.-K., Choi, S.-W., Seol, S.-H., Jin, H.-A., Yoo, C., Lim, J.-Y., and Kim, J.-S.: Analysis of the National Air Pollutant Emission Inventory (CAPSS 2015) and the Major Cause of Change in Republic of Korea, Asian J. Atmos. Environ., 13, 212–231, 2019.
Yu, G. H., Park, S. S., Ghim, Y. S., Shin, H. J., Lim, C. S., Ban, S. J., Yu, J. A., Kang, H. J., Seo, Y. K., Kang, K. S., Jo, M. R., Jung, S. A., Lee, M. H., Hwang, T. K., Kang, B. C., and Kim, H. S.: Difference in Chemical Composition of PM2.5 and Investigation of its Causing Factors between 2013 and 2015 in Air Pollution Intensive Monitoring Stations, J. Korean Soc. Atmos. Environ., 34, 16–37, 2018.
Zhou, X., Gao, J., Wang, T., Wu, W., and Wang, W.: Measurement of black carbon aerosols near two Chinese megacities and the implications for improving emission inventories, Atmos. Environ., 43, 3918–3924, https://doi.org/10.1016/j.atmosenv.2009.04.062, 2009.
Zhu, C., Kanaya, Y., Yoshikawa-Inoue, H., Irino, T., Seki, O., and Tohjima, Y.: Sources of atmospheric black carbon and related carbonaceous components at Rishiri Island, Japan: The roles of Siberian wildfires and of crop residue burning in China, Environ. Pollut., 247, 55–63, https://doi.org/10.1016/j.envpol.2019.01.003, 2019.