the Creative Commons Attribution 4.0 License.
the Creative Commons Attribution 4.0 License.
 | 17 Jul 2020
Measured solid state and subcooled liquid vapour pressures of nitroaromatics using Knudsen effusion mass spectrometry
Petroc D. Shelley
Thomas J. Bannan
Stephen D. Worrall
M. Rami Alfarra
Ulrich K. Krieger
Carl J. Percival
Arthur Garforth
David Topping
Knudsen effusion mass spectrometry (KEMS) was used to measure the solid state saturation vapour pressure () of a range of atmospherically relevant nitroaromatic compounds over the temperature range from 298 to 328 K. The selection of species analysed contained a range of geometric isomers and differing functionalities, allowing for the impacts of these factors on saturation vapour pressure (Psat) to be probed. Three subsets of nitroaromatics were investigated: nitrophenols, nitrobenzaldehydes and nitrobenzoic acids. The values were converted to subcooled liquid saturation vapour pressure () values using experimental enthalpy of fusion and melting point values measured using differential scanning calorimetry (DSC). The values were compared to those estimated by predictive techniques and, with a few exceptions, were found to be up to 7 orders of magnitude lower. The large differences between the estimated and the experimental values can be attributed to the predictive techniques not containing parameters to adequately account for functional group positioning around an aromatic ring, or the interactions between said groups. When comparing the experimental of the measured compounds, the ability to hydrogen bond (H bond) and the strength of the H bond formed appear to have the strongest influence on the magnitude of the Psat, with steric effects and molecular weight also being major factors. Comparisons were made between the KEMS system and data from diffusion-controlled evaporation rates of single particles in an electrodynamic balance (EDB). The KEMS and the EDB showed good agreement with each other for the compounds investigated.
- Article
(1876 KB) - Full-text XML
-
Supplement
(357 KB) - BibTeX
- EndNote


Organic aerosols (OAs) are an important component of the atmosphere with regards to resolving the impact aerosols have on both climate and air quality (Kroll and Seinfeld, 2008). To predict how OA will behave requires knowledge of their physiochemical properties. OAs consist of primary organic aerosols (POAs) and secondary organic aerosols (SOAs). POAs are emitted directly into the atmosphere as solid or liquid particulates and make up about 20 % of OA mass globally (Ervens et al., 2011), but the exact percentage of POA varies by a significant amount from region to region. SOAs are not emitted into the atmosphere directly as aerosols but instead form through atmospheric processes such as gas-phase photochemical reactions followed by gas-to-particle partitioning in the atmosphere (Pöschl, 2005). A key property for predicting the partitioning of compounds between the gaseous and aerosol phase is the pure component equilibrium vapour pressure, also known as the saturation vapour pressure (Psat) (Bilde et al., 2015). It has been estimated that the number of organic compounds in the atmosphere is in excess of 100 000 (Hallquist et al., 2009); therefore it is not feasible to measure the Psat of each experimentally. Instead, Psat values are often estimated using group contribution methods (GCMs) that are designed to capture the functional dependencies on predicting absolute values. GCMs start with a base molecule with known properties, typically the carbon skeleton. A functional group is then added to the base molecule. This addition will change the Psat, and the difference between the base molecule and the functionalised molecule is the contribution from that particular functional group. If this concept is true then the contribution from the functional group should not be affected by the base molecule to which it is added (Bilde et al., 2015). Whilst this is true in many cases, there are numerous exceptions. These exceptions normally occur when proximity effects occur, such as neighbouring group interactions or other mesomeric effects. In this work there will be a focus on the Nannoolal et al. method (Nannoolal et al., 2008), the Myrdal and Yalkowsky method (Myrdal and Yalkowsky, 1997), and SIMPOL (Pankow and Asher, 2008). Detailed assessments of such methods have been made by Barley and McFiggans (2010) and O'Meara et al. (2014), often showing predicted values differ significantly from experimental data. The limitations and uncertainties of GCMs come from a range of factors including underrepresentation of long-chain hydrocarbons (>C18); underrepresentation of certain functional groups, such as nitro or nitrate groups; a lack of data for the impact of intramolecular bonding; and the temperature dependence due to the need for extrapolation over large temperature ranges to reach ambient conditions (Bilde et al., 2015). This has important implications for partitioning modelling, in a mechanistic sense, such as an over- or underestimation of the fraction partitioning to the particulate state. Different GCMs have different levels of reliability for different classes of compounds and perform much more reliably if the compound of interest resembles those used in the parameterisation data set of the GCM (Kurtén et al., 2016). For example, in the assessment by O'Meara et al. (2014), for the compounds to which it is applicable, EVAPORATION (Estimation of VApour Pressure of ORganics, Accounting for Temperature, Intramolecular, and Non-additivity effects, Compernolle et al., 2011) was found to give the minimum mean absolute error, the highest accuracy for SOA loading estimates and the highest accuracy for SOA composition. Despite this, EVAPORATION should not be used for aromatic compounds, as there are no aromatic compounds in the parameterisation data set (Compernolle et al., 2011). Methods developed with OA in mind, such as EVAPORATION (Compernolle et al., 2011), are not without their limitations due to the lack of experimental data available for highly functionalised, low-volatility organic compounds (Bannan et al., 2017). As the degree of functionality increases, so does the difficulty in predicting the Psat as more intramolecular forces, steric effects and shielding effects must be considered. The majority of GCMs designed for estimating Psat of organic compounds were developed for the chemical industry with a focus on monofunctional compounds with Psat on the order of 103–105 Pa (Bilde et al., 2015). SOAs, in contrast, are typically multifunctional compounds with Psat often many orders of magnitude below 10−1 Pa (Barley and McFiggans, 2010). GCM development, with a focus on the Psat of SOA, has to deal with a lack of robust experimental data and, historically, large differences in measurement data depending on the technique and instrument used to acquire the data. To address this problem Krieger et al. (2018) identified a reference data set for validating Psat measurements using the polyethylene glycol (PEG) series. To improve the performance of GCMs when applied to highly functionalised compounds, more data are required that probe both the effect of relative functional group positioning and the effects of interaction between functional groups on Psat, such as in the work by Booth et al. (2012) and Dang et al. (2019). In this study the solid state saturation vapour pressure () and subcooled liquid saturation vapour pressure () of three families of nitroaromatic compounds are determined using Knudsen effusion mass spectrometry (KEMS), building on the work done by Dang et al. (2019) and Bannan et al. (2017). These include substituted nitrophenols, substituted nitrobenzoic acids and nitrobenzaldehydes. Nitroaromatics are useful tracers for anthropogenic emissions (Grosjean, 1992), and many nitroaromatic compounds are noted to be highly toxic (Kovacic and Somanathan, 2014). Studies quantifying the overall role of nitrogen-containing organics on aerosol formation would also benefit from more refined Psat (Duporté et al., 2016; Smith et al., 2008). Even if mechanistic models perform poorly in predicting aerosol mass due to missing process phenomena, resolving the partitioning is still important. Several studies have reported the observation of methyl nitrophenols (Chow et al., 2016; Kitanovski et al., 2012; Schummer et al., 2009) and nitrobenzoic acids (van Pinxteren and Herrmann, 2007). Nitrobenzaldehydes can form from the photo-oxidation of toluene in a high-NOx environment (Bouya et al., 2017). Both nitrophenols and nitrobenzoic acids were identified in the review paper by Bilde et al. (2015) as compounds of interest and recommendations for further study. Aldehyde groups tend to have little impact on Psat by themselves but the =O of the aldehyde group can act as a hydrogen bond acceptor.
There is a general lack of literature vapour pressure data for nitroaromatic compounds, and despite recent work on nitrophenols by Bannan et al. (2017), there is still a lack of data on such compounds in the literature. This is reflected, in part, in the effectiveness of the GCMs to predict the Psat of such compounds.
Here we present and data for 20 nitroaromatic compounds. The data were collected using KEMS with a subcooled correction performed with thermodynamic data from a differential scanning calorimeter (DSC). The trends in the data are considered, and chemical explanations are given to explain the observed differences.
As identified by Bilde et al. (2015), experimental Psat can differ by several orders of magnitude among techniques. One way of mitigating this is to collect data for a compound using multiple techniques, whilst running reference compounds to assess consistency among the employed methods. We therefore use supporting data from the electrodynamic balance (EDB) at ETH Zurich for three of the nitroaromatic compounds.
The data are then compared with the predicted of the GCMs, highlighting where they perform well and where they perform poorly. Finally, these measurements using the new PEG reference standards are compared to past KEMS measurements using an old reference standard due to differences in experimental Psat between this work and previous KEMS work.
Compound selection
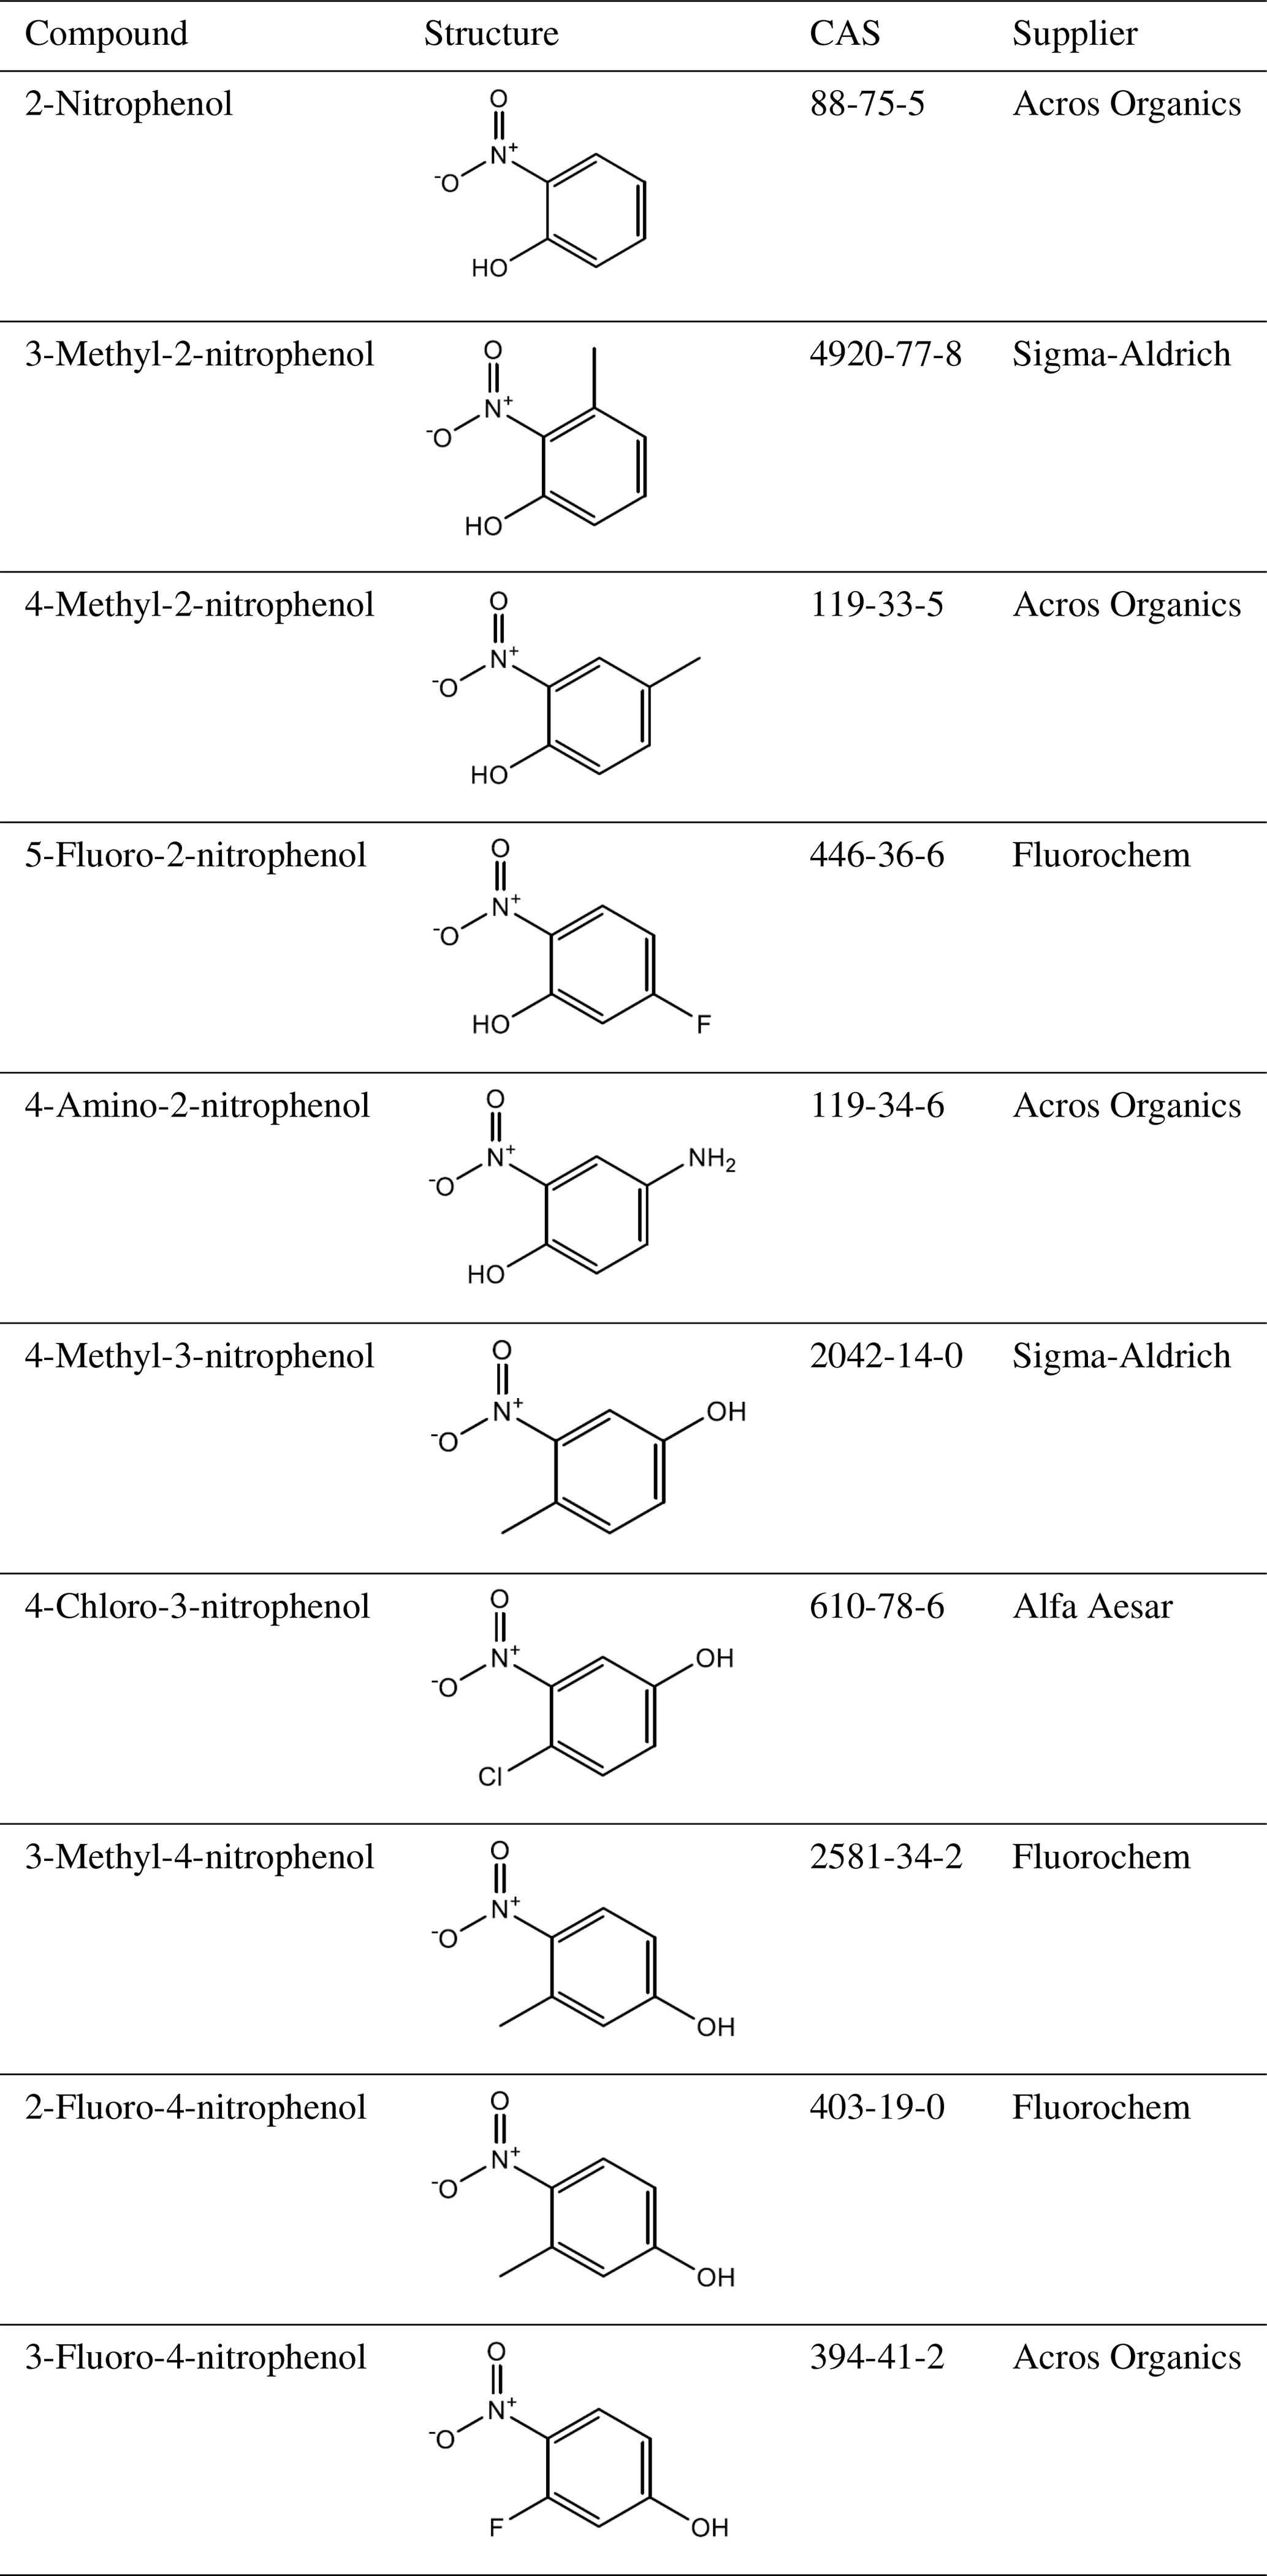
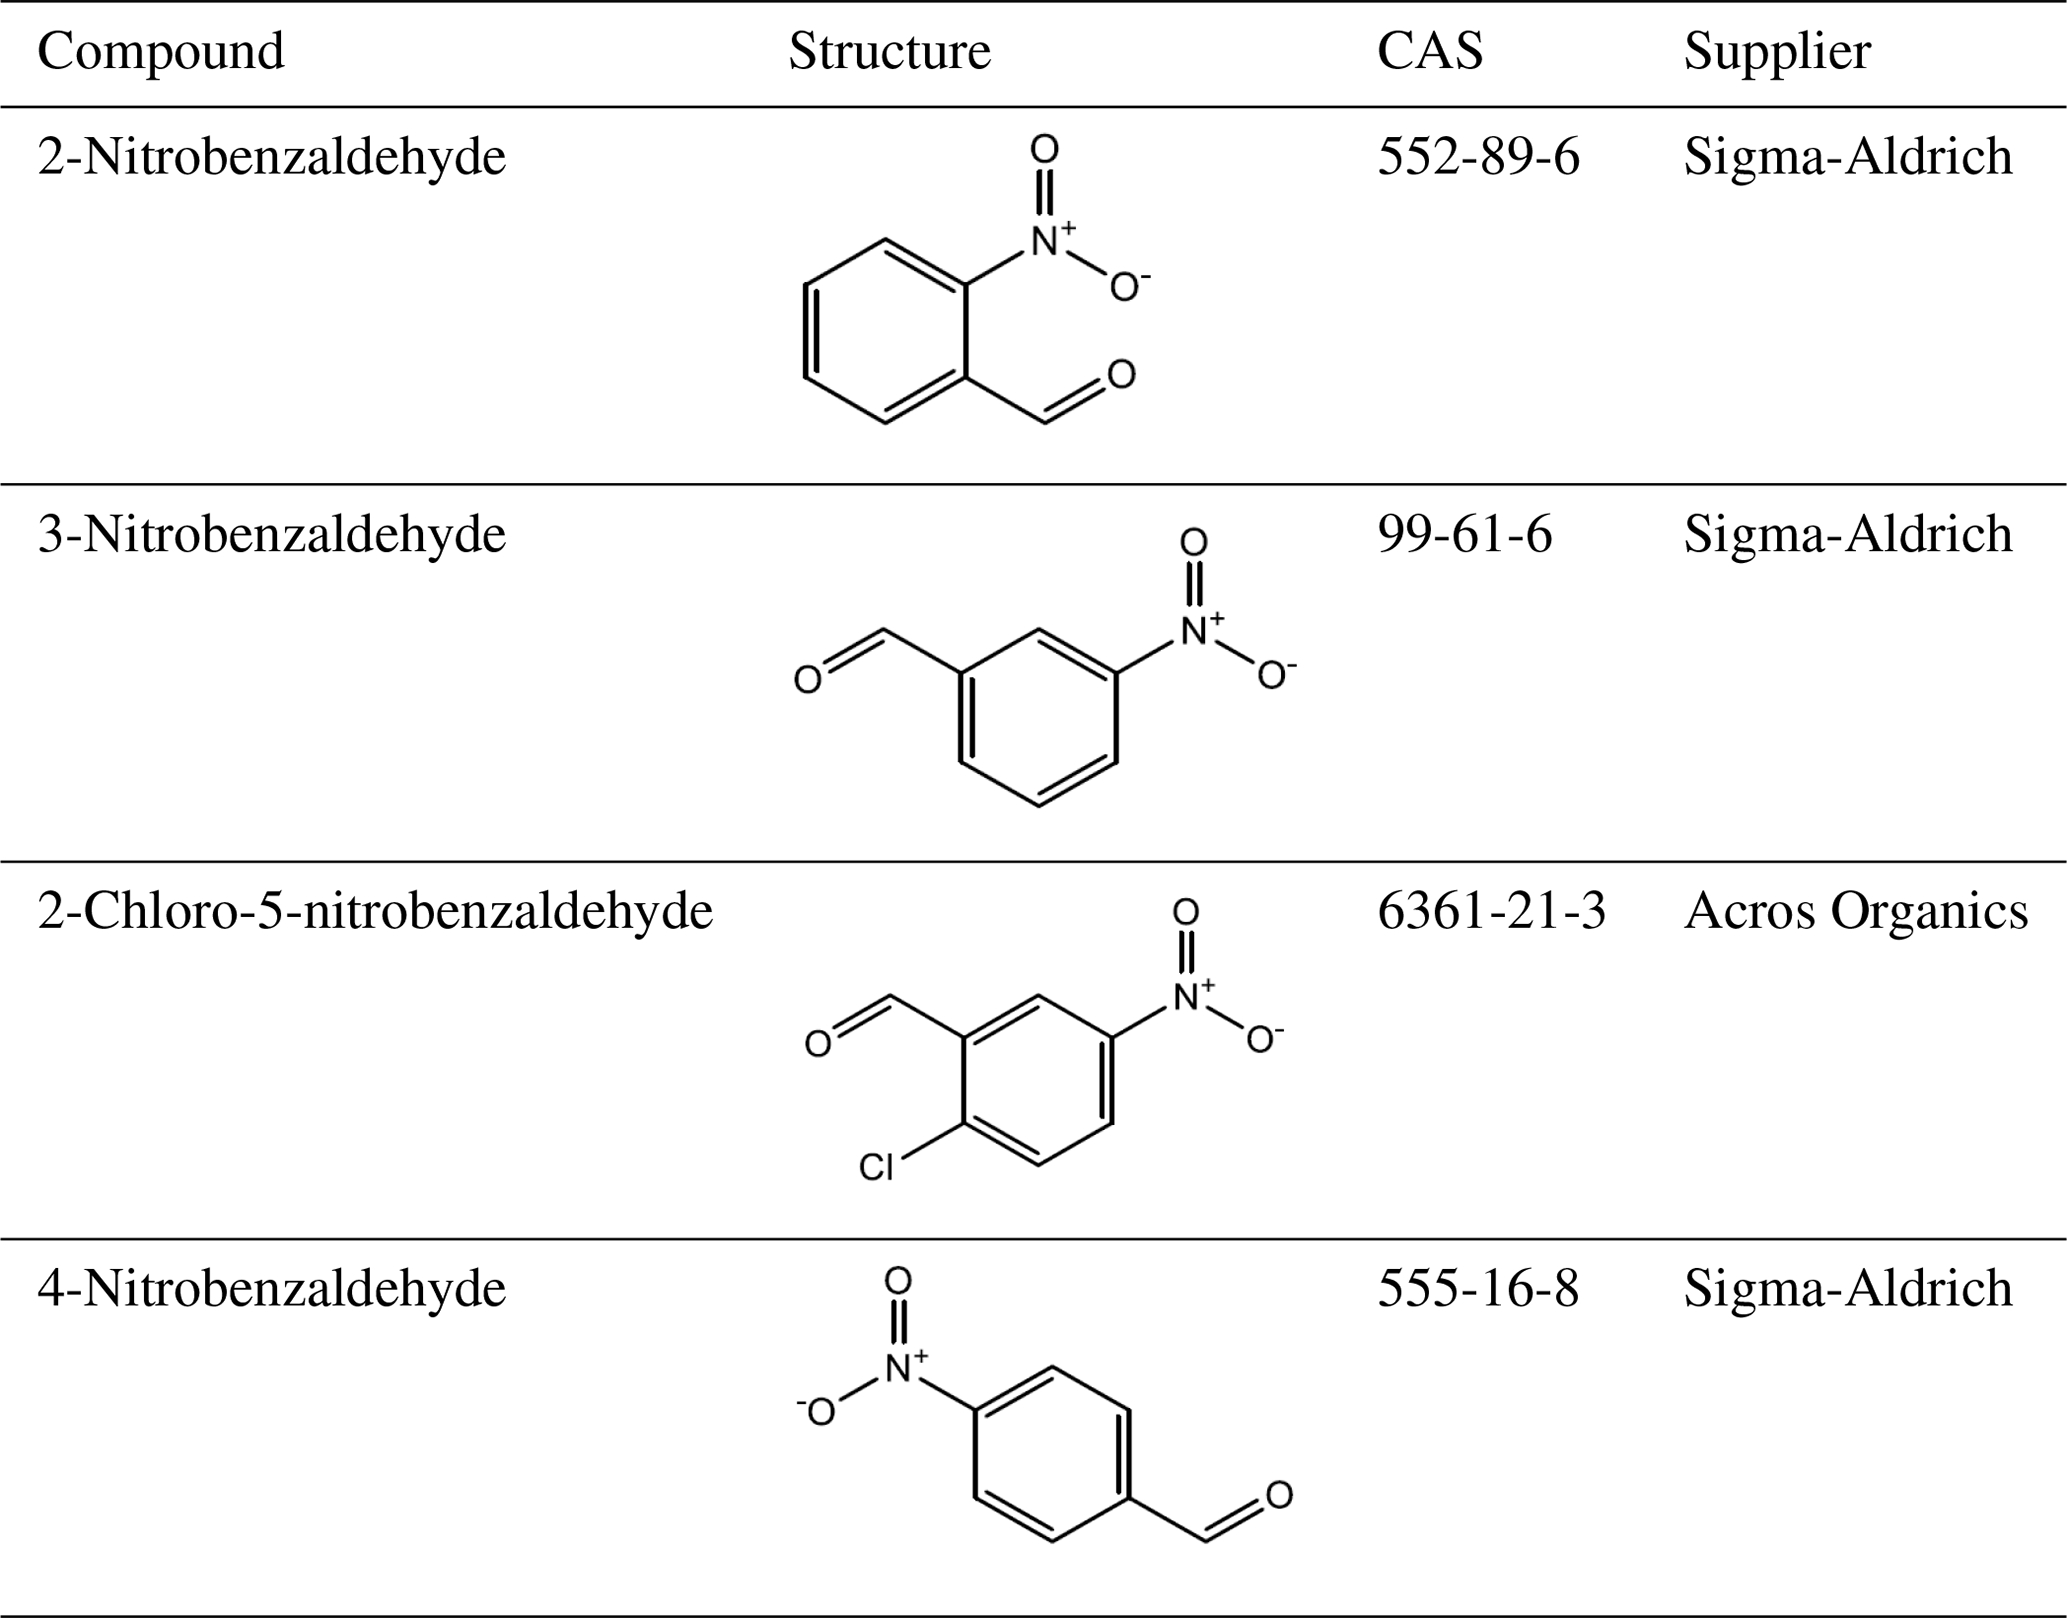
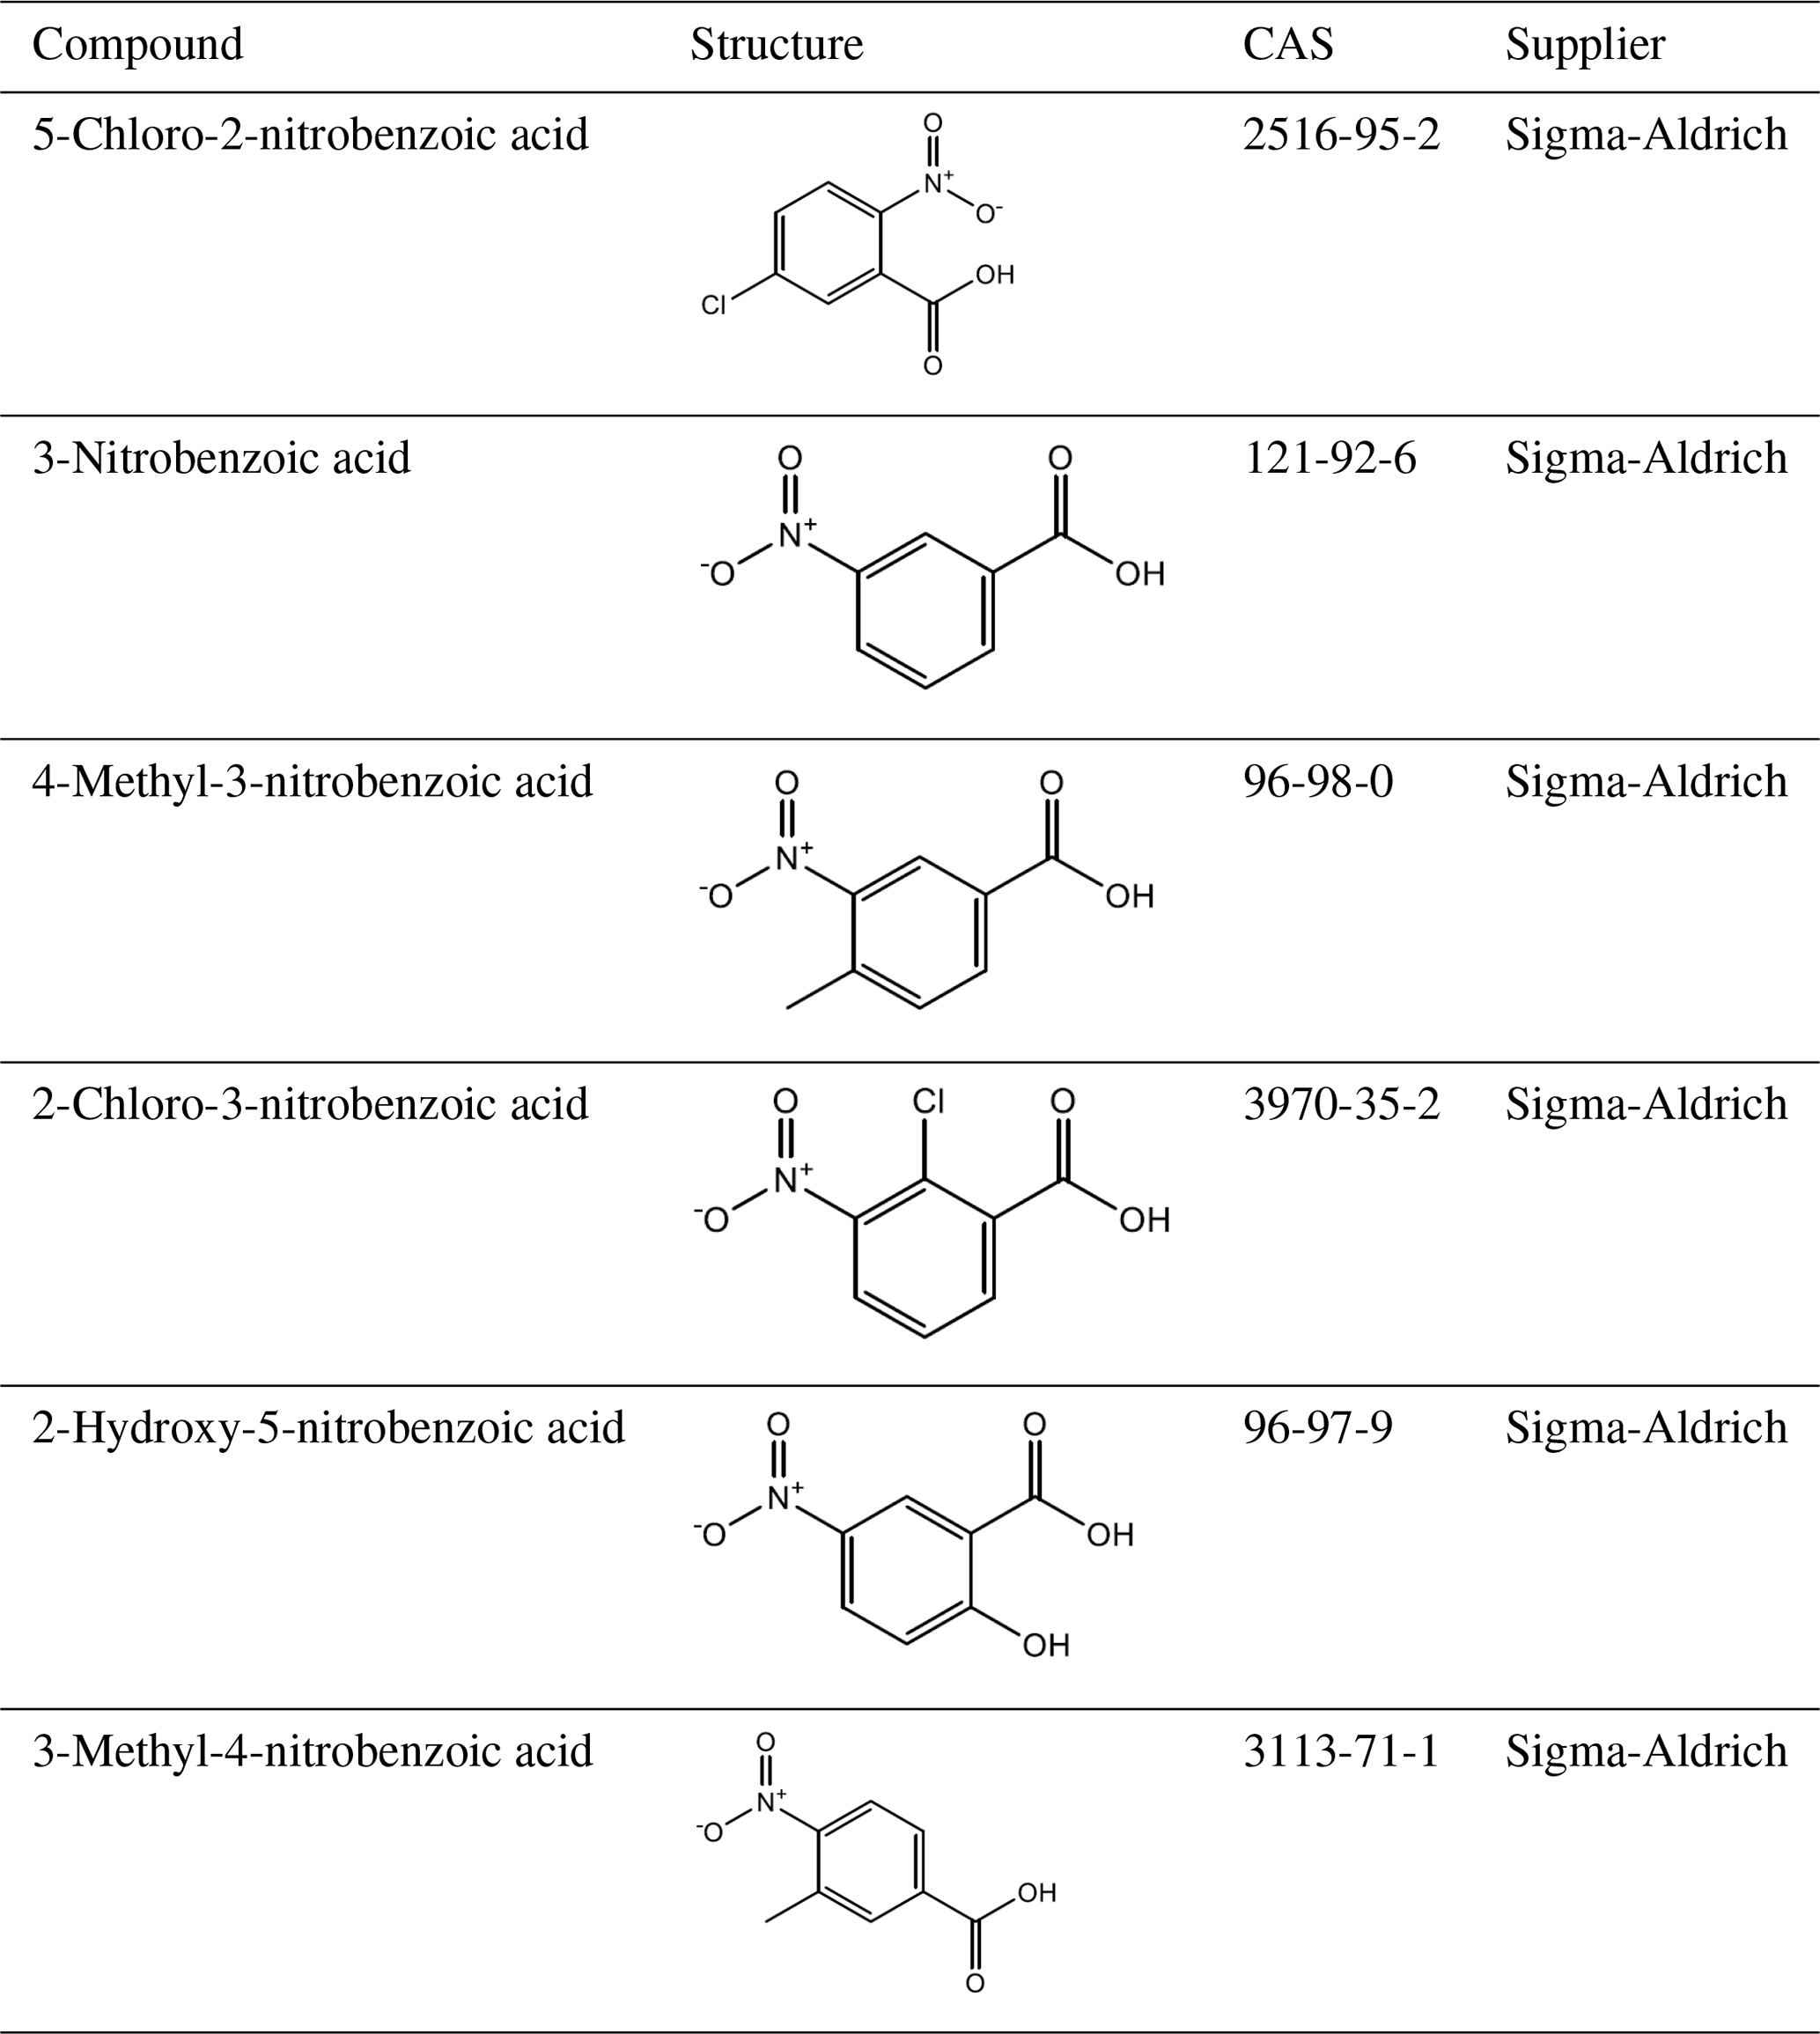
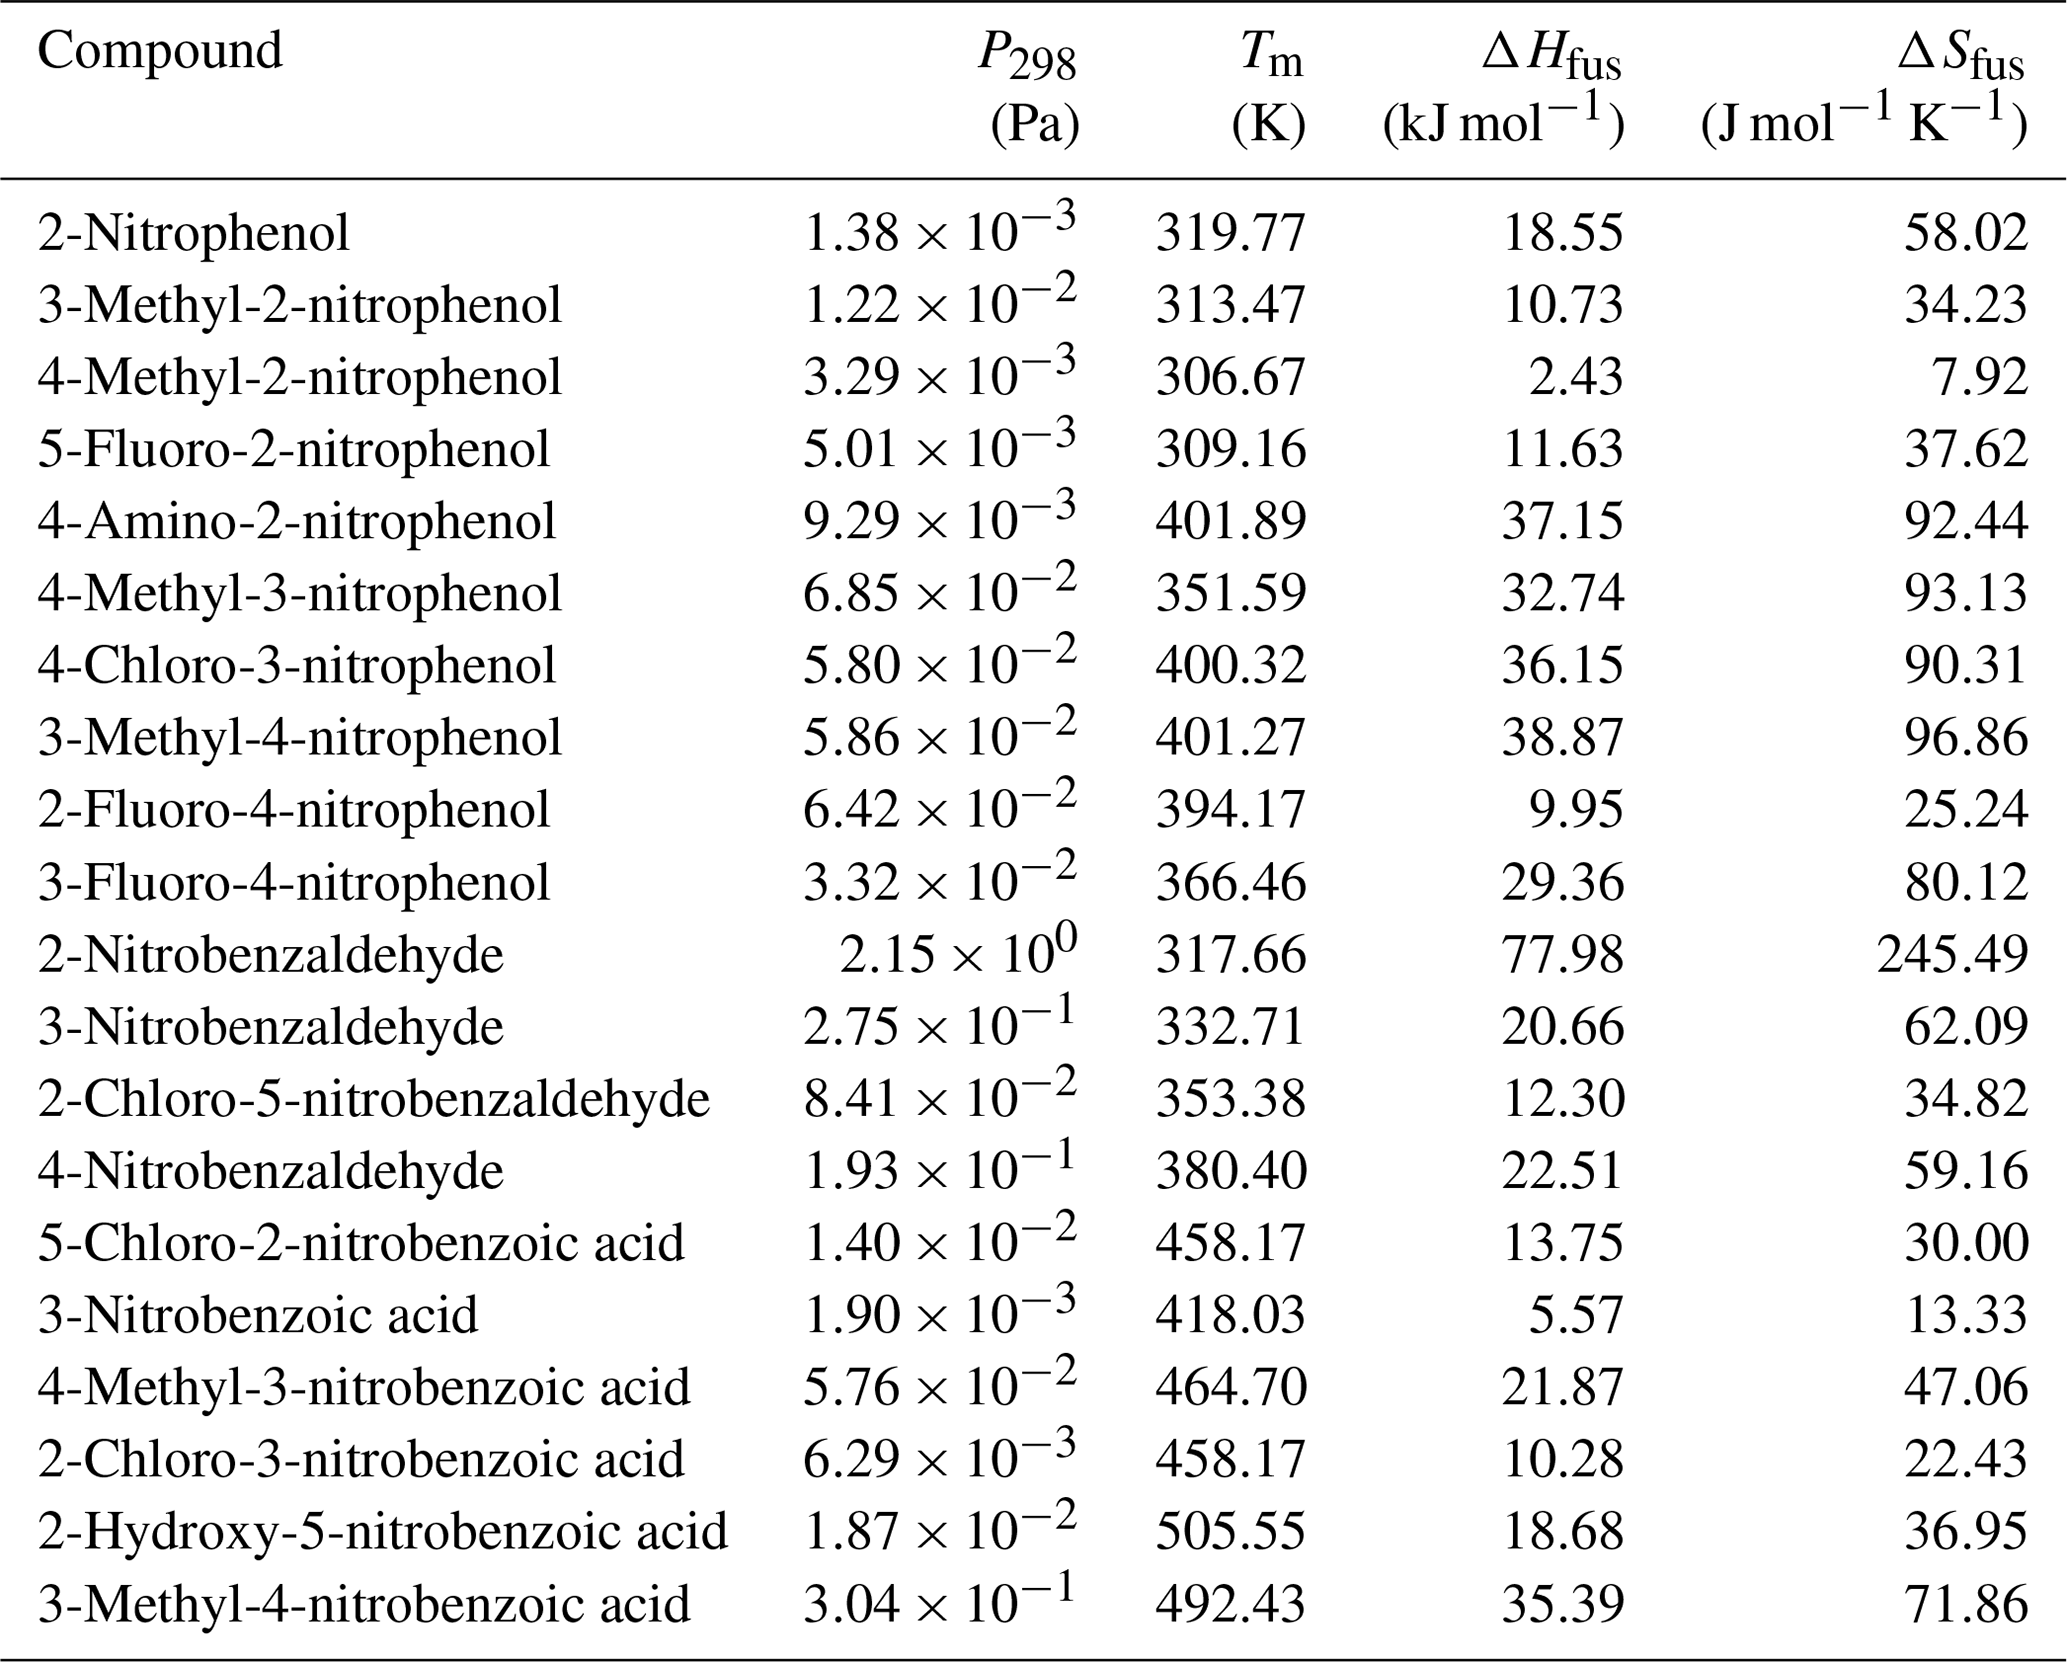
A total of 10 nitrophenol compounds were selected for this study including 9 monosubstituted, 4 nitrobenzaldehydes including 1 monosubstituted and 6 nitrobenzoic acids including 5 monosubstituted. The nitrophenols are shown in Table 1, the nitrobenzaldehydes are shown in Table 2 and the nitrobenzoic acids are shown in Table 3. All compounds selected for this study were purchased at a purity of 99 % and were used without further preparation. All compounds are solid at room temperature.
2.1 Knudsen effusion mass spectrometry system (KEMS)
The KEMS system is the same system that has been used in previous studies (Bannan et al., 2017; Booth et al., 2009, 2010), and a summary of the measurement procedure will be given here. For a more detailed overview see Booth et al. (2009). To calibrate the KEMS, a reference compound of known Psat is used. In this study the polyethylene glycol series (PEG series), PEG-3 ( Pa) and PEG-4 ( Pa) (Krieger et al., 2018), were used. The KEMS has been shown to accurately measure the Psat of PEG-4 in the study by Krieger et al. (2018), but the KEMS did not measure the Psat of PEG-3. In this study when using PEG-4 as a reference compound for PEG-3 the measured Psat of PEG-3 had an error of 30 % compared to the experimental values from Krieger et al. (2018), which is well within the quoted 40 % error margin of the KEMS (Booth et al., 2009). When using PEG-3 as the reference compound for PEG-4, the measured Psat of PEG-4 had an error of 20 %.
The reference compound is placed in a temperature-controlled Knudsen cell. The cell has a chamfered orifice through which the sample effuses, creating a molecular beam. The size of the orifice is the mean free path of the gas molecules in the cell. This ensures that the particles effusing through the orifice do not disturb the thermodynamic equilibrium of the cell. The molecular beam is then ionised using a standard 70 eV electron impact ionisation and analysed using a quadrupole mass spectrometer.
After correcting for the ionisation cross section (Booth et al., 2009), the signal generated is proportional to the Psat. Once the calibration process is completed it is possible to measure a sample of unknown Psat. When the sample is changed it is necessary to isolate the sample chamber from the measurement chamber using a gate valve so that the sample chamber can be vented, whilst the ioniser filament and the secondary electron multiplier (SEM) detector can remain on and allow for direct comparisons with the reference compound. The Psat of the sample can be determined from the intensity of the mass spectrum, if the ionisation cross section at 70 eV and the temperature at which the mass spectrum was taken are known. The samples of unknown Psat are typically solid so it is the that is determined. After the (Pa) has been determined for multiple temperatures, the Clausius–Clapeyron equation (Eq. 1) can be used to determine the enthalpy and entropy of sublimation as shown in Booth et al. (2009).
where T is the temperature (K), R is the ideal gas constant (J mol−1 K−1), ΔHsub is the enthalpy of sublimation (J mol−1) and ΔSsub is the entropy of sublimation (J mol−1 K−1). Psat was obtained over a range of 30 K in this work, starting at 298 K and rising to 328 K. The reported solid state vapour pressures are calculated from a linear fit of ln (Psat) vs. 1∕T using the Clausius–Clapeyron equation.
2.2 Differential scanning calorimetry (DSC)
According to the reference state used in atmospheric models, and as predicted by GCMs, is required. Therefore it is necessary to convert the determined by the KEMS system into a . As with previous KEMS studies (Bannan et al., 2017; Booth et al., 2010, 2017) the melting point (Tm) and the enthalpy of fusion (ΔHfus) are required for the conversion. These values were measured with a TA Instruments DSC 2500 differential scanning calorimeter (DSC). Within the DSC, heat flow and temperature were calibrated using an indium reference and heat capacity using a sapphire reference. A heating rate of 10 K min−1 was used. A sample of 5–10 mg was measured using a microbalance and then pressed into a hermetically sealed aluminium DSC pan. A purge gas of N2 was used with a flow rate of 30 mL min−1. Data processing was performed using the Trios software supplied with the instrument. Δcp,sl was estimated using (Grant et al., 1984; Mauger et al., 1972).
2.3 Electrodynamic balance (EDB)
The recently published paper by Dang et al. (2019) measured the Psat of several of the same compounds that are studied in this paper using the same KEMS system; however, in this study the newly defined best-practice reference sample was used (Krieger et al., 2018), whereas Dang et al. (2019) used malonic acid. The difference in reference compound led to a discrepancy in the experimental Psat. Supporting measurements for the compounds were performed using the EDB from ETH Zurich in order to rule out instrumental problems with the KEMS. The EDB from ETH Zurich has been used to investigate Psat of low-volatility compounds in the past (Huisman et al., 2013; Zardini et al., 2006; Zardini and Krieger, 2009), and a brief overview will be given here. For full details see Zardini et al. (2006) and Zardini and Krieger (2009). The EDB can be applied to both liquid particles and non-spherical solid particles (Bilde et al., 2015). The EDB uses a double ring configuration (Davis et al., 1990) to levitate a charged particle in a cell with a gas flow free from the evaporating species under investigation. There is precise control of both temperature and relative humidity within the cell. Diffusion-controlled evaporation rates of the levitated particle are measured at a fixed temperature and relative humidity by precision sizing using optical resonance spectroscopy in backscattering geometry with a broadband LED source and Mie theory for the analysis (Krieger et al., 2018). Psat is calculated at multiple temperatures, and the Clausius–Clapeyron equation can be used to calculate Psat at a given temperature (Eq. 1).
As single particles injected from a dilute solution may either stay in a supersaturated liquid state or crystallise, it is important to identify its physical state.
For 4-methyl-3-nitrophenol a 3 % solution dissolved in isopropanol was injected into the EDB. After the injection and fast evaporation of the isopropanol, all particles were non-spherical but with only small deviations from a sphere, meaning that it was unclear whether the phase was amorphous or crystalline. To determine the phase of this first experiment, a second experiment was performed, where a solid particle was injected directly into the EDB. Mass loss with time was measured by following the DC voltage necessary to compensate for the gravitational force acting on the particle to keep the particle levitating. When comparing the Psat from both of these experiments it is clear that the initial measurement of 4-methyl-3-nitrophenol was in the crystalline phase.
3-Methyl-4-nitrophenol was only injected as a solution but the particle crystallised and was clearly in the solid state.
4-Methyl-2-nitrophenol was injected as both a 3 % and 10 % solution. Despite being able to trap a particle, the particle would completely evaporate within about 30 s. This evaporation timescale is too small to allow the EDB to collect any quantitative data. Using the equation for large particles neglecting evaporative cooling (Hinds, 1999) (Eq. 2), it is possible to estimate :
where t is the time that the particle was trapped within the cell of the EDB, R is the ideal gas constant, ρ is the density of the particle, dp is the diameter of the particle, D is the diffusion coefficient, M is the molecular mass, T is the temperature, and Psat is the saturation vapour pressure. Equation (2) gives approximately Pa for at 290 K.
3.1 Subcooled correction
The conversion between and is done using the Prausnitz equation (Prausnitz et al., 1998) (Eq. 3):
where is the ratio between and , ΔHfus is the enthalpy of fusion (J mol−1), Δcp,sl is the change in heat capacity between the solid and liquid states (J mol−1 K−1), T is the temperature (K), and Tm is the melting point (K).
3.2 Vapour pressure predictive techniques
The most common Psat prediction techniques are GCMs. Several different GCMs have been developed (Moller et al., 2008; Myrdal and Yalkowsky, 1997; Nannoolal et al., 2008; Pankow and Asher, 2008) with some being more general and others, such as the EVAPORATION method (Compernolle et al., 2011), having been developed with OA as the target compounds. The Myrdal and Yalkowsky method (Myrdal and Yalkowsky, 1997), the Nannoolal et al. method (Nannoolal et al., 2008), and the Moller et al. method (Moller et al., 2008) are combined methods requiring a boiling point, Tb, as an input. If the Tb of a compound is known experimentally it is an advantage, but most atmospherically relevant compounds have an unknown Tb so the Tb that is used as an input is calculated using a GCM. The combined methods use a Tb calculated using a GCM for many of the same reasons that GCMs are used to calculate Psat, i.e. the difficulty in acquiring experimental data for highly reactive compounds or compounds with short lifetimes. The Nannoolal et al. method (Nannoolal et al., 2004), Stein and Brown method (Stein and Brown, 1994), and Joback and Reid method (Joback et al., 1987) are most commonly used. The Joback and Reid method is not considered in this paper due to its known biases (Barley and McFiggans, 2010), with the Stein and Brown method being an improved version of Joback and Reid. The Tb used in the combined methods is, however, another source of potential error, and for methods that extrapolate Psat from Tb, the size of this error increases with increasing difference between Tb and the temperature to which it is being extrapolated (O'Meara et al., 2014). EVAPORATION (Compernolle et al., 2011) and SIMPOL (Pankow and Asher, 2008) do not require a boiling point, only requiring a structure and a temperature of interest. The main limitation for many GCMs, aside from the data required to create and refine them, is not accounting for intramolecular interactions, such as hydrogen bonding, or steric effects. The Nannoolal et al. method (Nannoolal et al., 2008), Moller et al. method (Moller et al., 2008) and EVAPORATION (Compernolle et al., 2011) attempt to address this by having secondary interaction terms. In the Nannoolal et al. method (Nannoolal et al., 2008), there are terms to account for ortho, meta and para isomerism of aromatic compounds; however, there are no terms for dealing with tri- or greater substituted aromatics, and in these instances all isomers give the same prediction. A common misuse of GCMs occurs when a GCM is applied to a compound containing functionality not included in the training set, e.g. using EVAPORATION (Compernolle et al., 2011) with aromatic compounds or using SIMPOL (Pankow and Asher, 2008) with compounds containing halogens. As the GCM does not have the tools to deal with this functionality it will either misattribute a contribution, in the EVAPORATION (Compernolle et al., 2011) example the aromatic structure would be treated as a cyclical aliphatic structure, or simply ignore the functionality, as is the case when SIMPOL (Pankow and Asher, 2008) is used for halogen-containing compounds. When selecting a GCM to model Psat it is essential to investigate whether the method is applicable to the compounds of interest. Of the popular Psat GCMs, the Myrdal and Yalkowsky method (Myrdal and Yalkowsky, 1997) contains only three nitroaromatic compounds, the Nannoolal et al. method (Nannoolal et al., 2008) contains 13, the Moller et al. (2008) method contains no more than 14, SIMPOL (Pankow and Asher, 2008) contains 25 and EVAPORATION (Compernolle et al., 2011) contains zero. The specific nitroaromatics used by the Nannoolal et al. method and the Moller et al. method are not stated (to the author's knowledge) as the data were taken directly from the Dortmund Data Bank. Despite the SIMPOL (Pankow and Asher, 2008) method containing 25 nitroaromatic compounds, 11 of these are taken from a gas chromatography method using a single data point from a single data set (Schwarzenbach et al., 1988).
3.3 Inductive and resonance effects
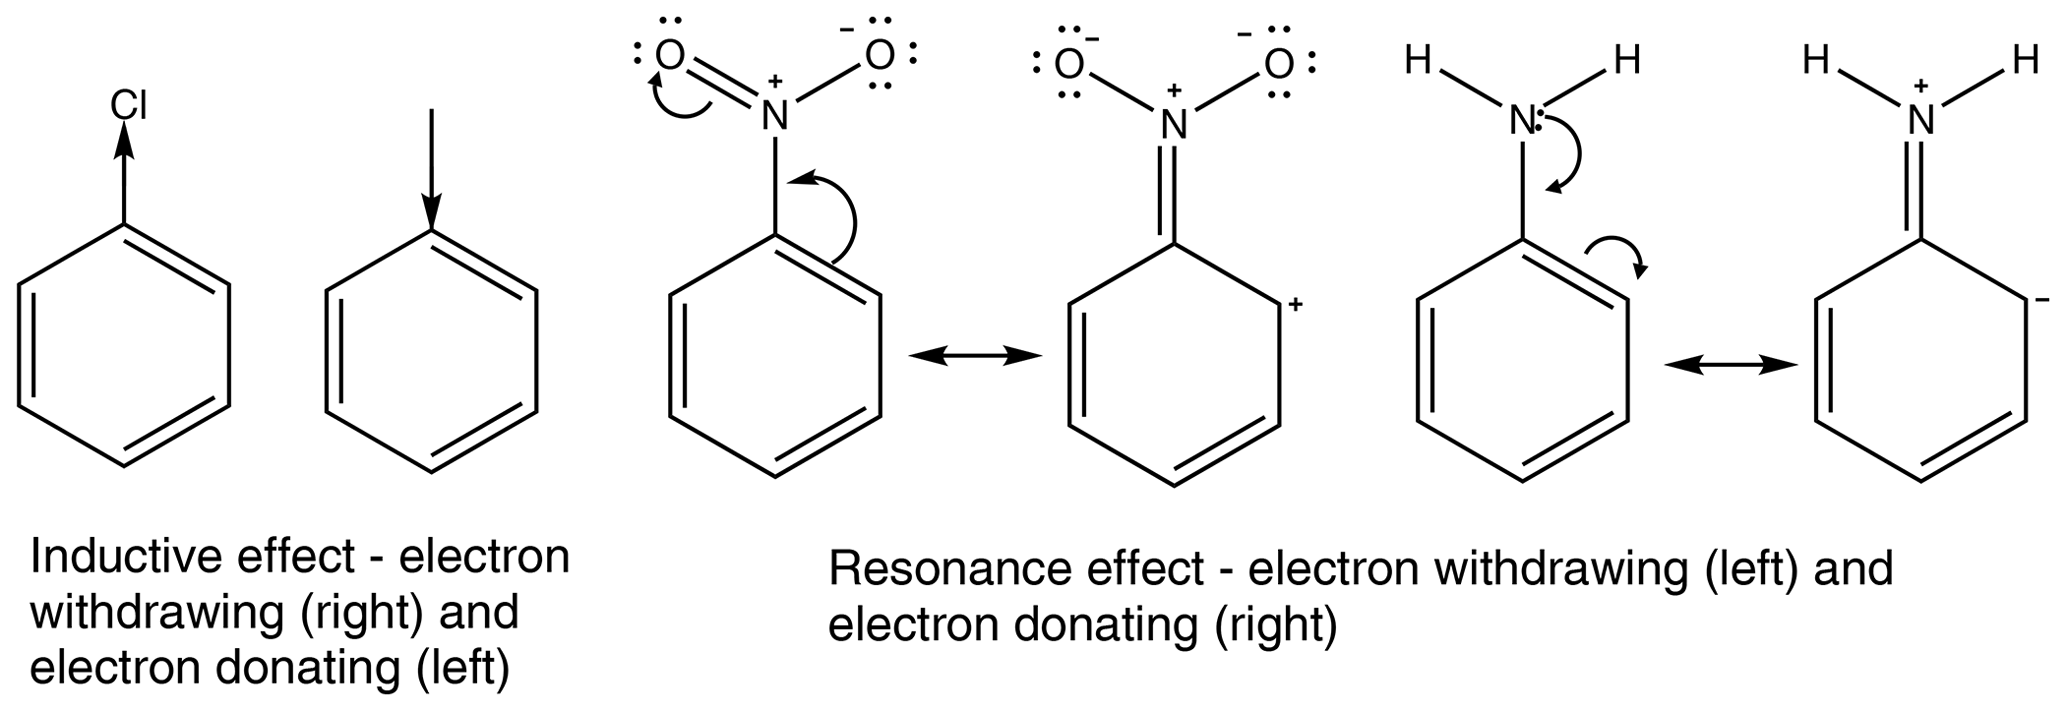
All functional groups around an aromatic ring either withdraw or donate electron density. This is a result of two major effects, the inductive effect and the resonance effect, or a combination of the two (Ouellette et al., 2015a). The inductive effect is the unequal sharing of the bonding electron through a chain of atoms within a molecule. A methyl group donates electron density, relative to a hydrogen atom, so is therefore considered an electron-donating group, whereas a chloro group withdraws electron density and is therefore considered an electron-withdrawing group. The resonance effect occurs when a compound can have multiple resonance forms. In a nitro group, as the oxygen atoms are more electronegative than the nitrogen atom, a pair of electrons from the nitrogen–oxygen double bond can be moved onto the oxygen atom followed by a pair of electrons being moved out of the ring to form a carbon–nitrogen double bond and leaving the ring with a positive charge. This leads to the nitro group acting as an electron-withdrawing group. In an amino group, on the other hand, the hydrogens are not more electronegative than the nitrogen; instead the lone pair on the nitrogen can be donated into the ring, causing the ring to have a negative charge and the amino group to act as an electron-donating group. Examples of the inductive effect and the resonance effect are given in Fig. 1 (Ouellette et al., 2015a).
Some functional groups, such as an aromatic OH group, can both donate and withdraw electron density at the same time. In phenol the OH group withdraws electron density via the inductive effect, but it also donates electron density via the resonance effect. This is shown in Fig. 2. As the resonance effect is typically much stronger than the inductive effect, OH has a net donation of electron density in phenol (see Fig. 2).
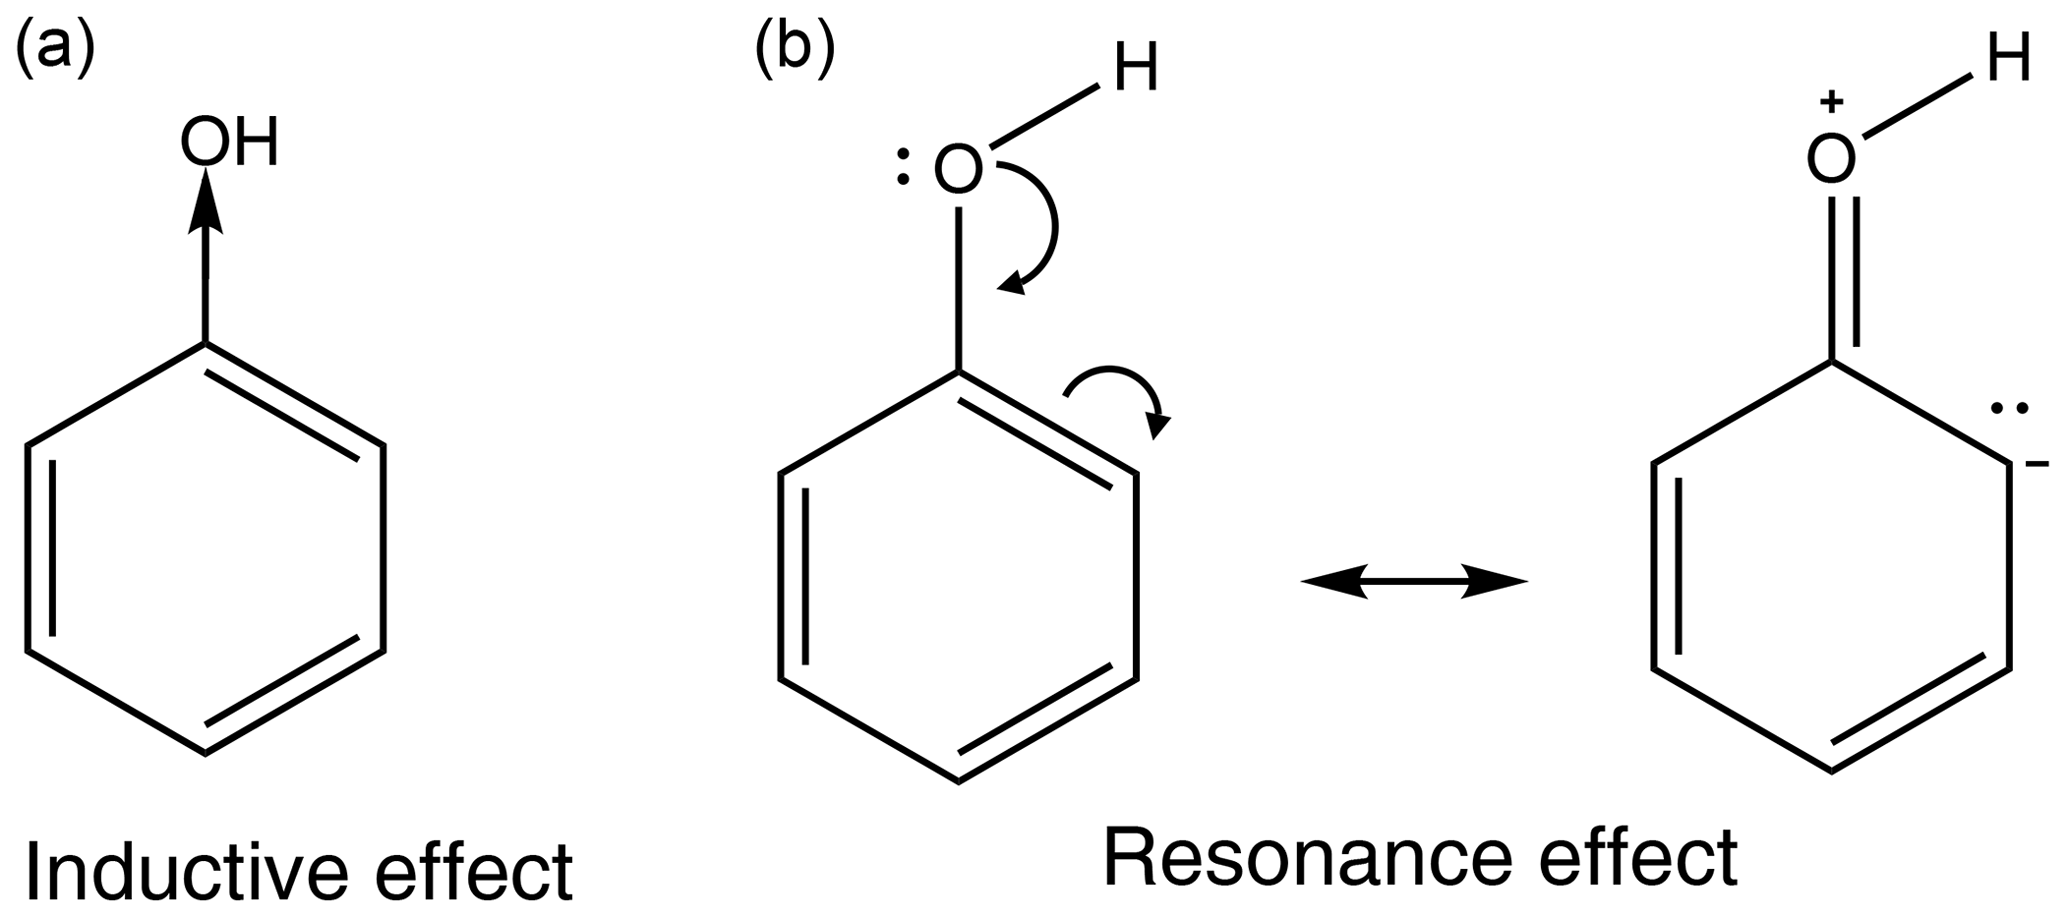
Figure 2Phenol can withdraw electron density via the inductive effect (a) and donate electron density via the resonance effect (b).
The positioning of the functional groups around the aromatic ring determines to what extent the inductive and resonance effects occur. The changes in electron density due to the inductive effect and the resonance effect also change the partial charges on the atoms within the aromatic ring. These changes impact the strength of any potential H bonds that may form.
4.1 Solid state vapour pressure
values measured directly by the KEMS are given in Tables 4, 5 and 6 for the nitrophenols, nitrobenzaldehydes and nitrobenzoic acids respectively. Measurements were made at increments of 5 K from 298 to 328 K, with the exception of the following compounds that melted during the temperature ramp. 2-Nitrophenol was measured between 298 and 318 K, 3-methyl-4-nitrophenol was measured between 298 and 313 K, 4-methyl-2-nitrophenol was measured between 298 and 303 K, 5-fluoro-2-nitrophenol was measured between 298 and 308 K, and 2-nitrobenzaldehyde was measured between 298 and 313 K. The Clausius–Clapeyron equation (Eq. 1) was used to calculate the enthalpies and entropies of sublimation. The melting points of compounds studied are given in Table 7. Generally speaking, considering the different groups of compounds as a whole, the nitrobenzaldehydes studied exhibit higher (order of magnitude) than the nitrophenols and nitrobenzoic acids studied. This is most likely due to the fact that none of the nitrobenzaldehydes studied herein are capable of undergoing hydrogen bonding (H bonding), whilst all of the nitrophenols and nitrobenzoic acids, to varying extents, are capable of hydrogen bonding. The nitrophenols and nitrobenzoic acids studied exhibit a range of overlapping so nothing can be inferred when considering these two types of compounds together as groups; therefore the differences within each of the groups must be considered.
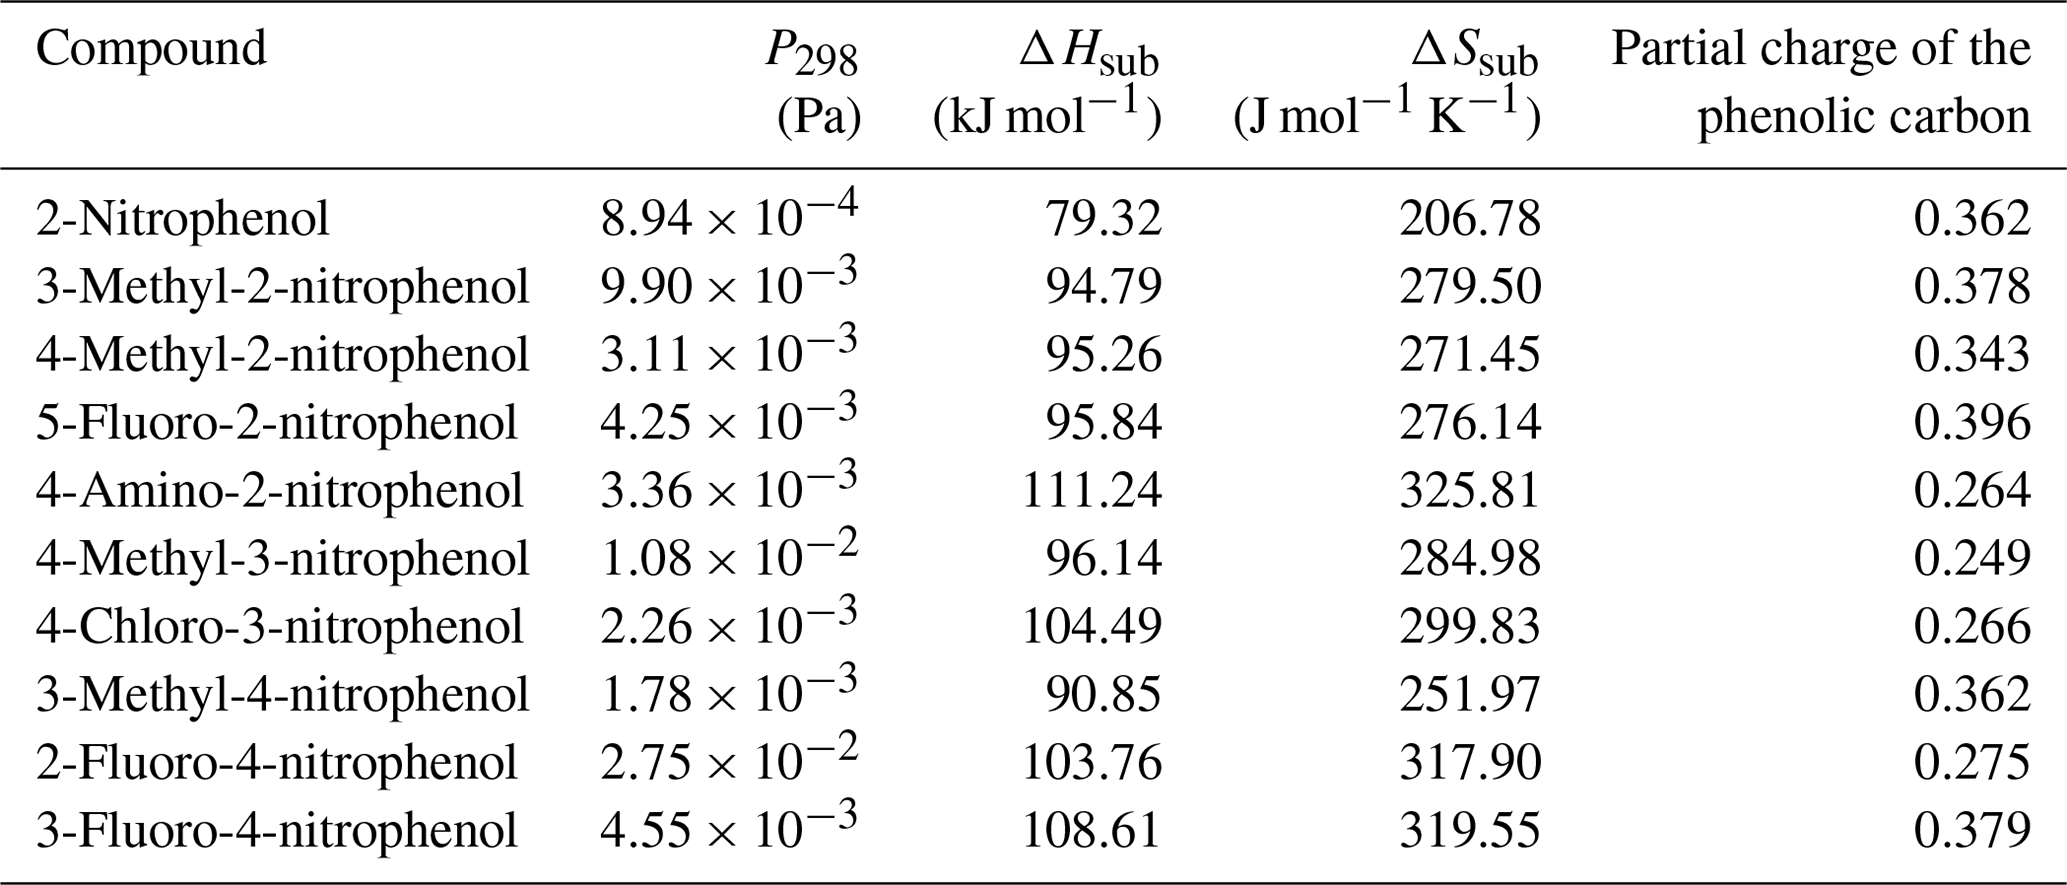
Table 4 at 298 K, enthalpies and entropies of sublimation, and partial charge of the phenolic carbon of nitrophenols determined using KEMS.
Considering first the nitrophenols, Table 4, the highest compound is 2-fluoro-4-nitrophenol ( Pa). There are two potential H-bonding explanations for why this compound has such a high relative to the other nitrophenols and fluoro nitrophenols. First, in this isomer the presence of the F atom on the C adjacent to the OH group gives rise to intramolecular H bonding (Fig. 3a), which reduces the extent of intermolecular interaction possible and increases . This effect can clearly be seen from the fact that in 3-fluoro-4-nitrophenol, where the F atom is positioned further away from the OH group, the is significantly lower () due to the fact that intermolecular H bonding can occur (Fig. 3b). However, in the work by Shugrue et al. (2016) it is stated that neutral organic fluoro and nitro groups form very weak hydrogen bonds, which whilst they do exist, can be difficult to even detect by many conventional methods.
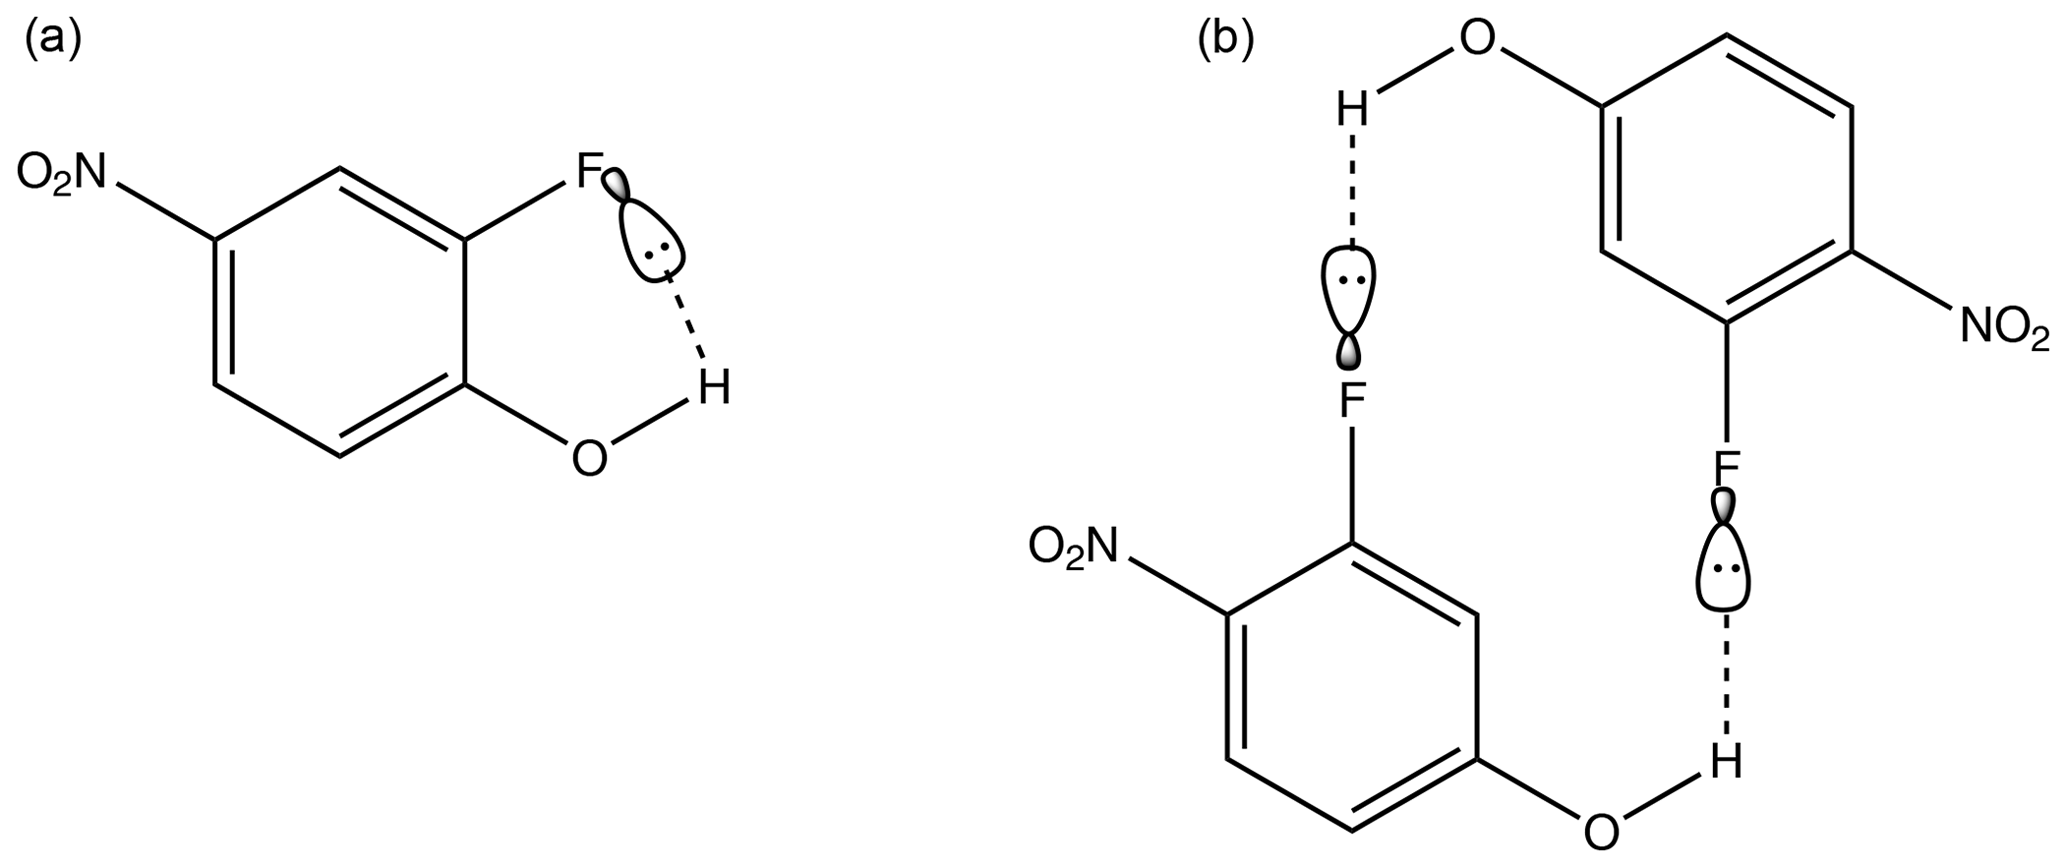
Figure 3Intramolecular hydrogen bonding in 2-fluoro-4-nitrophenol (a) in comparison to intermolecular hydrogen bonding in 3-fluoro-4-nitrophenol (b).
The second explanation depends on the inductive effect mentioned previously. By using MOPAC2016 (Stewart, 2016), a semi-empirical quantum chemistry program based on the neglect of diatomic differential overlap (NDDO) approximation (Dewar and Thiel, 1977), the partial charges of the phenolic carbon can be calculated. The partial charge of the phenolic carbon can be dependent on the orientation of the OH if the molecule does not have a plane of symmetry, so in this work the partial charge used is an average of the two extreme orientations of the OH, as shown in Fig. 4. A plot of vs. the partial charge of the phenolic carbon for the nitrophenols can be found in Fig. 5.
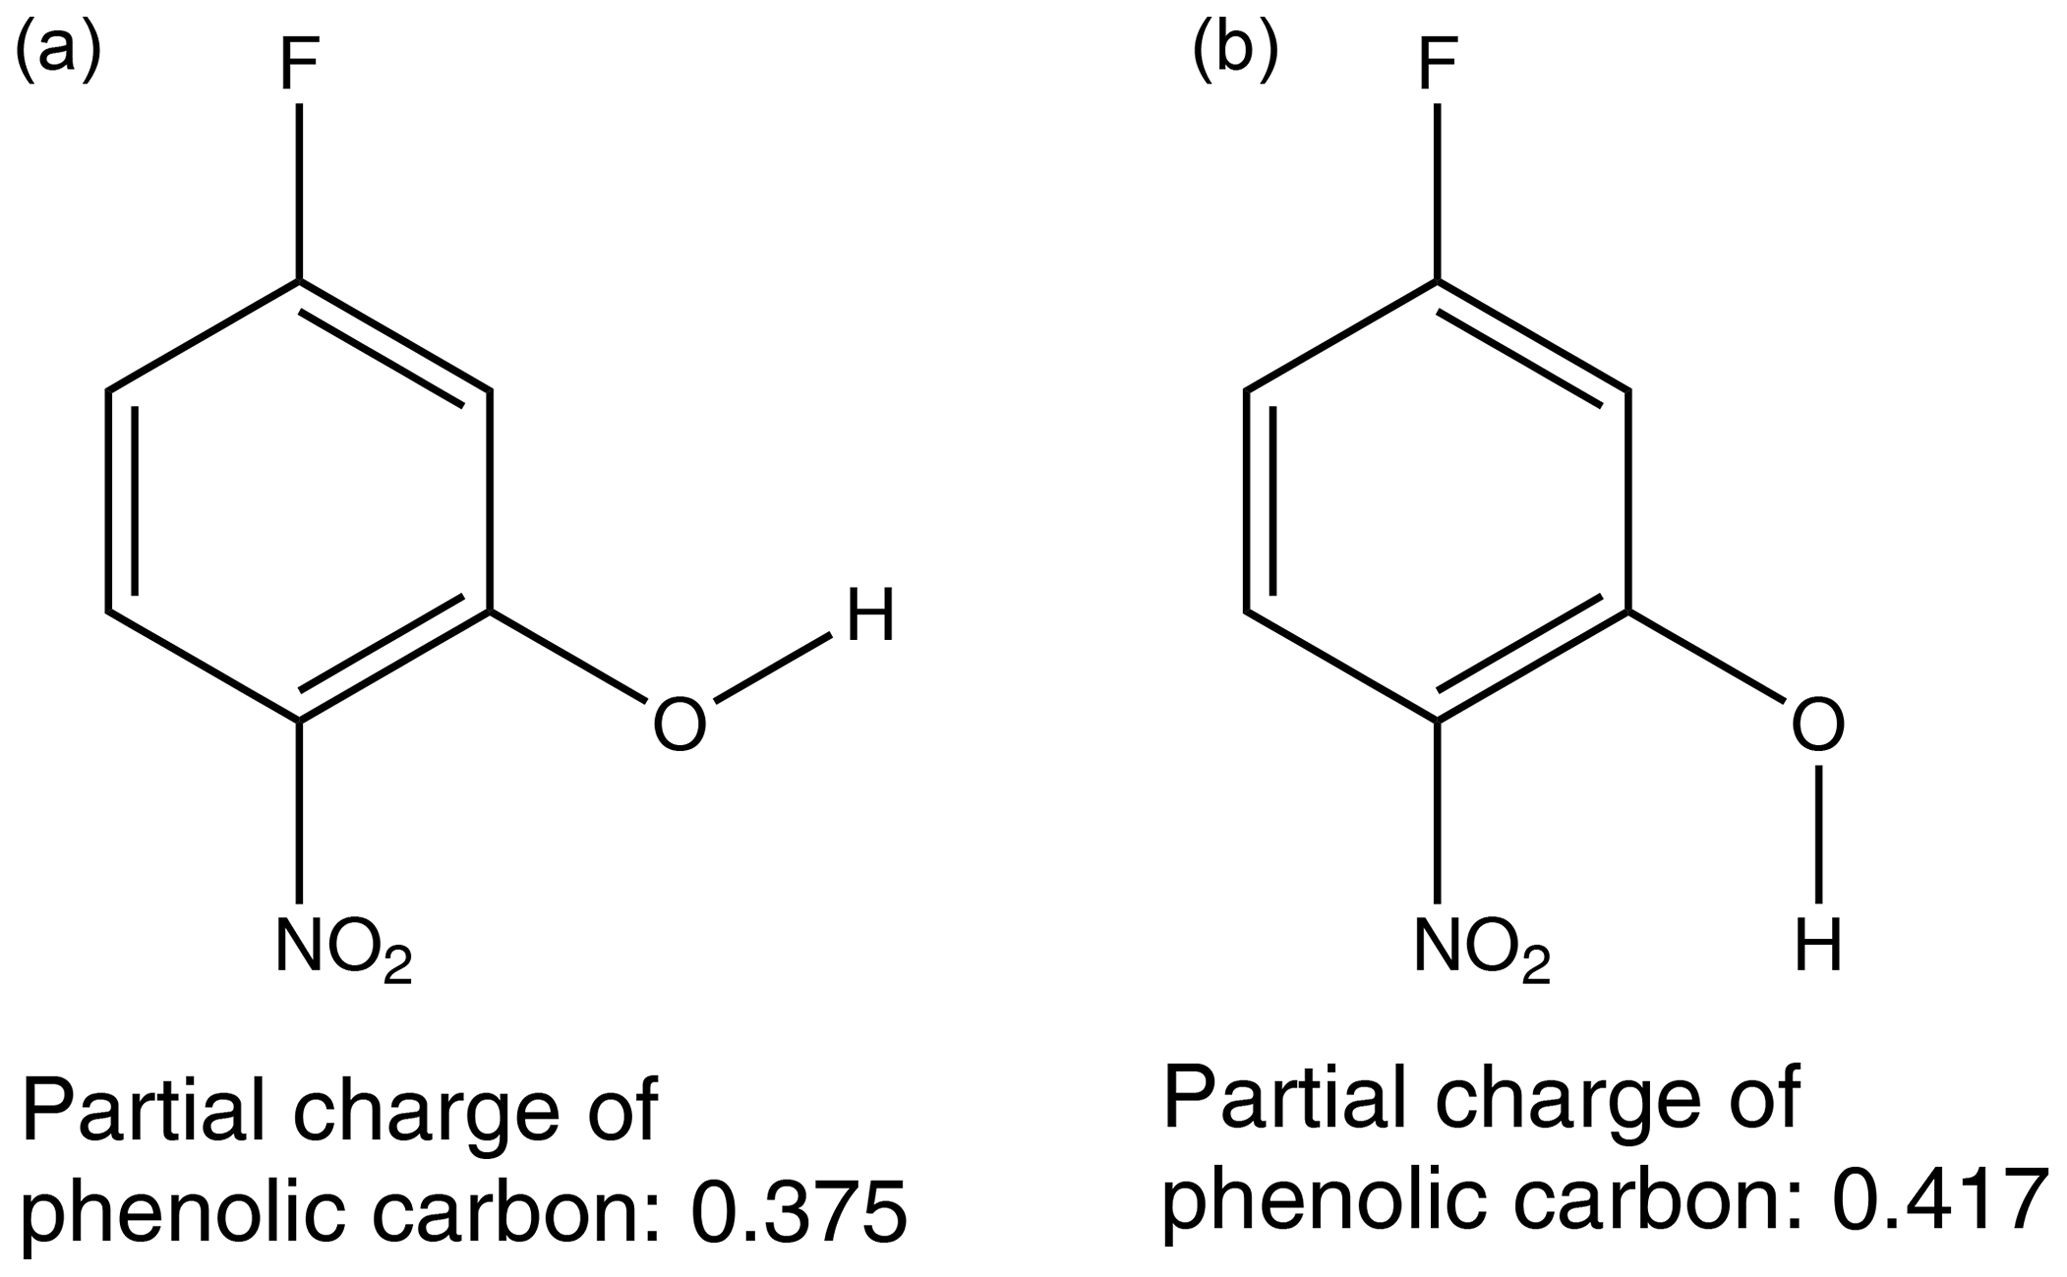
Figure 4The orientation of the OH group can impact the partial charge of the phenolic carbon.

The partial charge of the phenolic carbon in 2-fluoro-4-nitrophenol is 0.275 with a of Pa, whereas for 3-fluoro-4-nitrophenol it is 0.379 with a of Pa. The more positive the partial charge of the phenolic carbon the better it is able to stabilise the increased negative charge which will develop on the O atom as a result of H-bond formation. As a result stronger intermolecular H bonds are formed, therefore giving rise to a lower . Moving the nitro group from being para to the OH in 3-fluoro-4-nitrophenol to meta to the OH in 5-fluoro-2-nitrophenol further reduces the to Pa. This reduction in can also be explained via the combination of the inductive effect and the resonance effect as the partial charge of the phenolic carbon rises from 0.379 to 0.396, again implying stronger intermolecular H bonds and, therefore, a lower . For the fluoro nitrophenols, as shown in Fig. 5, as the partial charge of the phenolic carbon increases the increases.
A similar trend occurs in the methyl nitrophenols as in the fluoro nitrophenols with a larger partial charge of the phenolic carbon corresponding to a lower , as shown in Fig. 5. 3-Methyl-2-nitrophenol is an exception to this and is discussed shortly. 3-Methyl-4-nitrophenol has the most positive partial charge with 0.362 and the lowest of Pa, 4-methyl-2-nitrophenol has the next most positive partial charge of 0.343 and the next lowest of , and 4-methyl-3-nitrophenol has the least positive partial charge of 0.249 and the highest of . 3-Methyl-2-nitrophenol does not follow this trend, however, with it having a partial charge of 0.378 and a of . As shown in Fig. 5, 3-methyl-2-nitrophenol would be expected to have a much lower than is observed due to the high partial charge on the phenolic carbon. A possible explanation as to why 3-methyl-2-nitrophenol does not follow this same trend is the positioning of its functional groups. As shown in Fig. 6a, all of the functional groups are clustered together and the proximity of the functional groups sterically hinders the formation of H bonds, thus increasing the . Conversely as shown in Fig. 6b the fact that the methyl group is further away in 4-methyl-2-nitrophenol leads to less steric hindrance of H-bond formation.
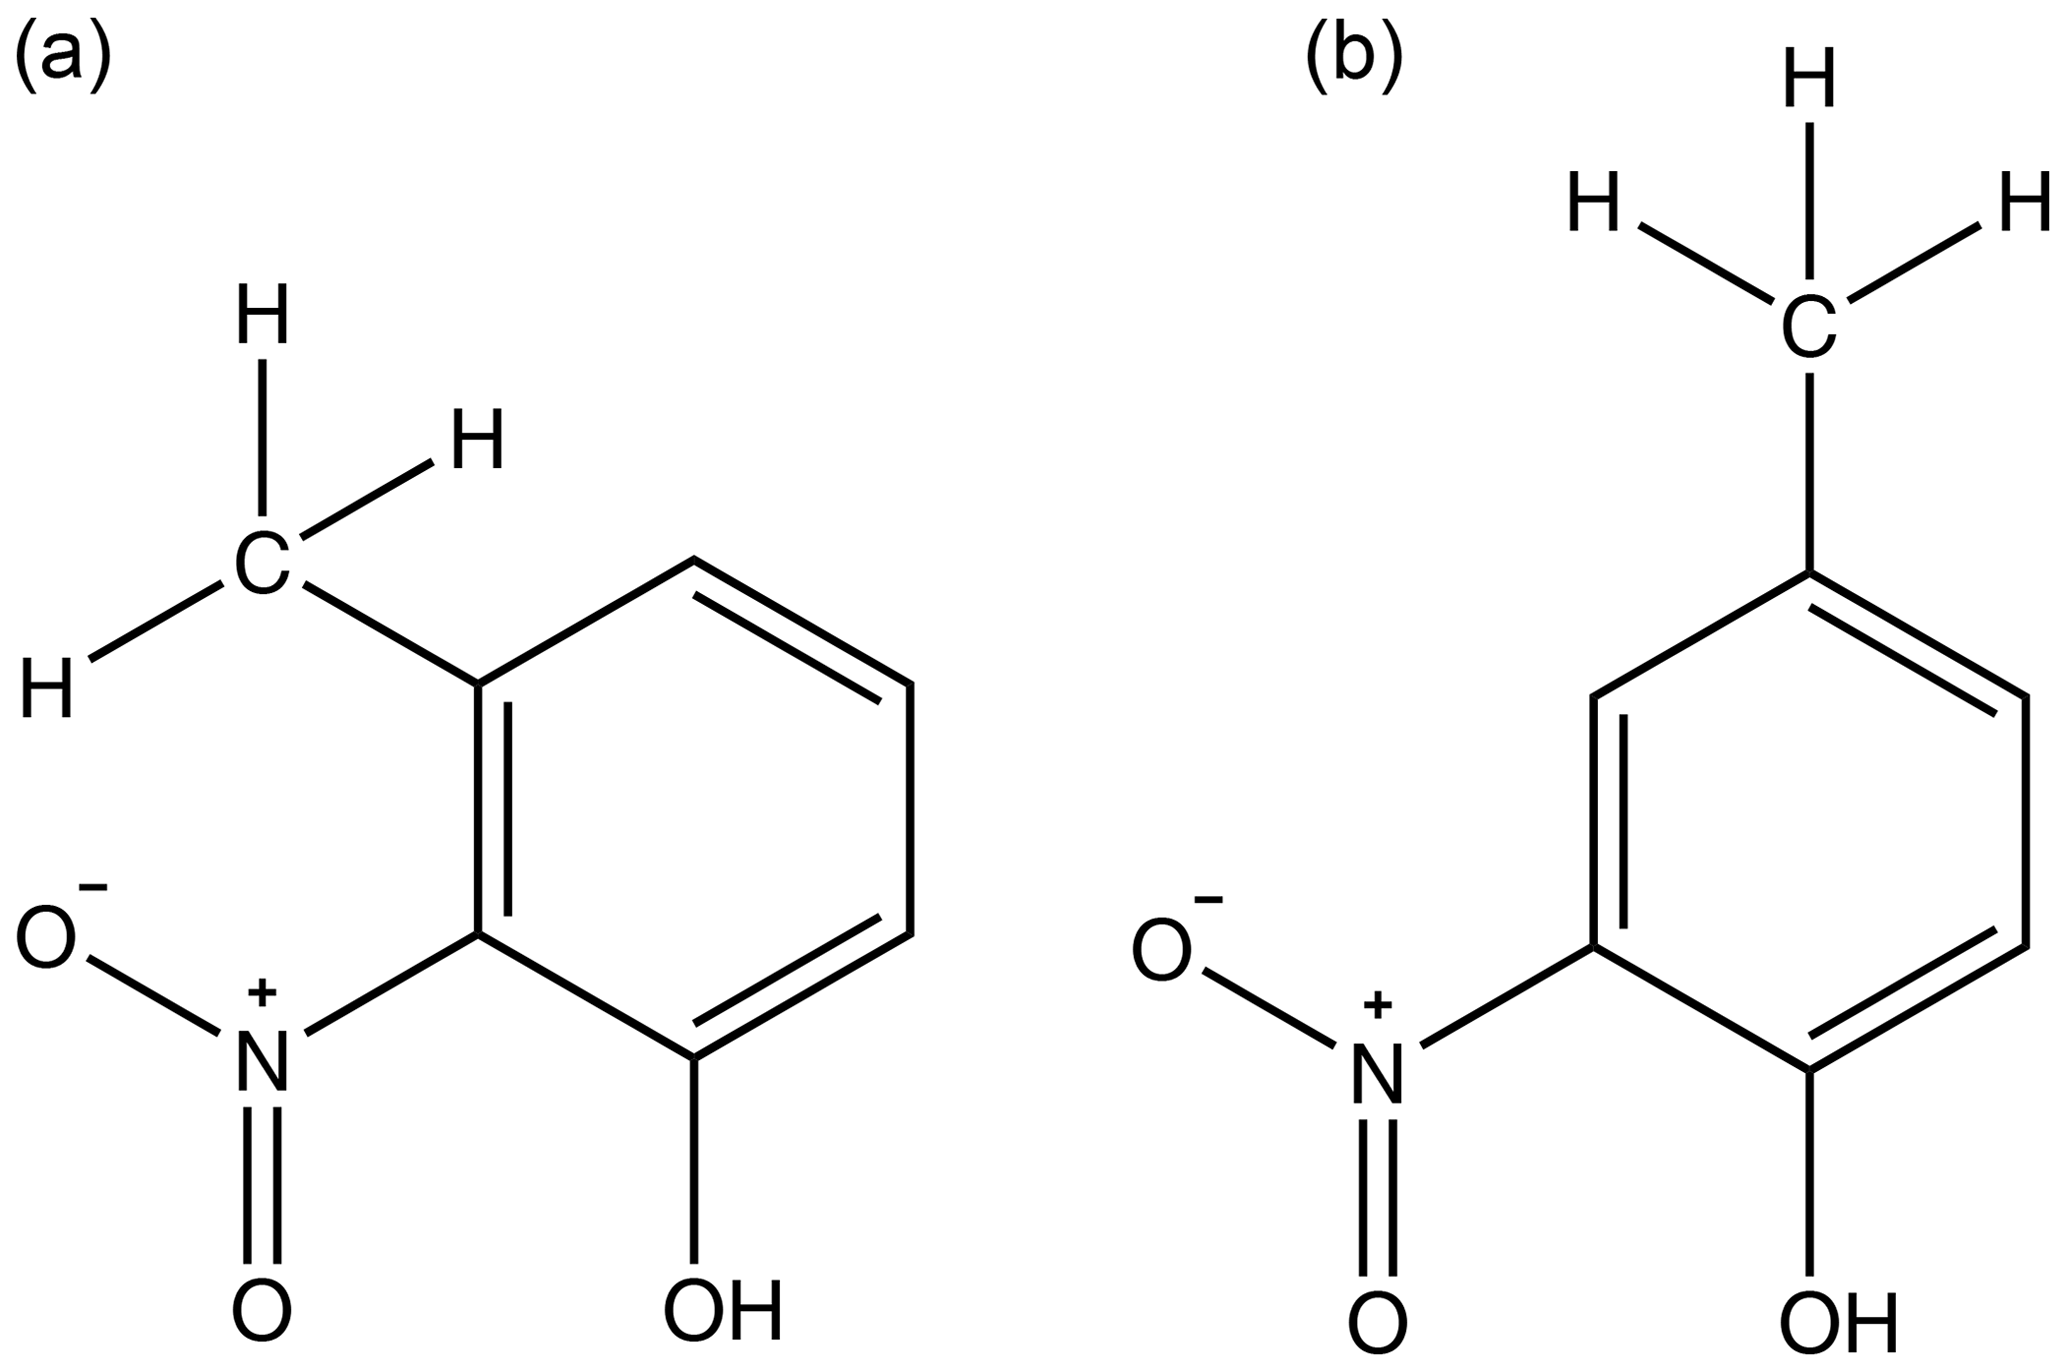
Figure 6Diagram emphasising how the proximity of the bulky methyl group sterically hinders intermolecular interactions with the nitro group in 3-methyl-2-nitrophenol (a) but not in 4-methyl-2-nitrophenol (b).
Whilst 3-methyl-2-nitrophenol has a higher than is expected given the partial charge on the phenolic carbon, 4-amino-2-nitrophenol has a much lower (Fig. 5). This is likely due to 4-amino-2-nitrophenol being capable of forming more than one hydrogen bond, whereas all the other compounds investigated were only capable of forming one H bond. However, despite 4-amino-2-nitrophenol being capable of forming more than 1 H bond, replacing the methyl group on 4-methyl-2-nitrophenol with an amino group to form 4-amino-2-nitrophenol surprisingly increases the from to Pa. The higher can be explained via the combination of the inductive effect and the resonance effect. Whilst the partial charge of the phenolic carbon in 4-methyl-2-nitrophenol is 0.343, the partial charge of the phenolic carbon in 4-amino-2-nitrophenol is only 0.264, and the partial charge of the carbon bonded to the amine group is only 0.211. So whilst 4-amino-2-nitrophenol is capable of forming two intermolecular H bonds compared to 4-methyl-2-nitrophenol's one, they will be much weaker. 4-Amino-2-nitrophenol is a good example of a compound with multiple competing factors affecting leading to higher than would be expected due to one factor and lower than expected from another.
Similar to 4-amino-2-nitrophenol, 4-chloro-3-nitrophenol also has a lower than expected according to the partial charge of the phenolic carbon. This can be seen in Fig. 5. Unlike 4-amino-2-nitrophenol the explanation for 4-chloro-3-nitrophenol is simpler. Replacing the methyl group on 4-methyl-3-nitrophenol with a chloro group to form 4-chloro-3-nitrophenol reduces the from to Pa. This reduction in can be explained by the increase in partial charge of the phenolic carbon from 0.249 to 0.266, as well as a 13 % increase in molecular weight.
Replacing the F atom in 3-fluoro-4-nitrophenol with a methyl group to form 3-methyl-4-nitrophenol further reduces the (), although exactly why is unclear. The methyl group cannot engage in intermolecular H bonding; it will sterically hinder any H bonding that the NO2 group undergoes; and it reduces the partial charge of the phenolic carbon of the molecule (from 0.379 to 0.362) (Stewart, 2016), which would reduce the strength of H-bonding interactions between the molecules. It is possible that the crystallographic packing density of 3-methyl-4-nitrophenol is higher although no data are available to support this, although when looking at data (Sect. 4.2) 3-methyl-4-nitrophenol exhibits a higher than 3-fluoro-4-nitrophenol, which is what would be expected given the respective partial charges of the phenolic carbons.
Removing the methyl group from 4-methyl-2-nitrophenol to give 2-nitrophenol causes the to drop from to Pa. This reduction in matches an increase in the positive partial charge of the phenolic carbon, from 0.343 to 0.383, implying an increase in the strength of the intermolecular H bonds and therefore a reduction in .
Table 5 at 298 K, enthalpies and entropies of sublimation, and crystallographic packing densities of nitrobenzaldehydes determined using KEMS.
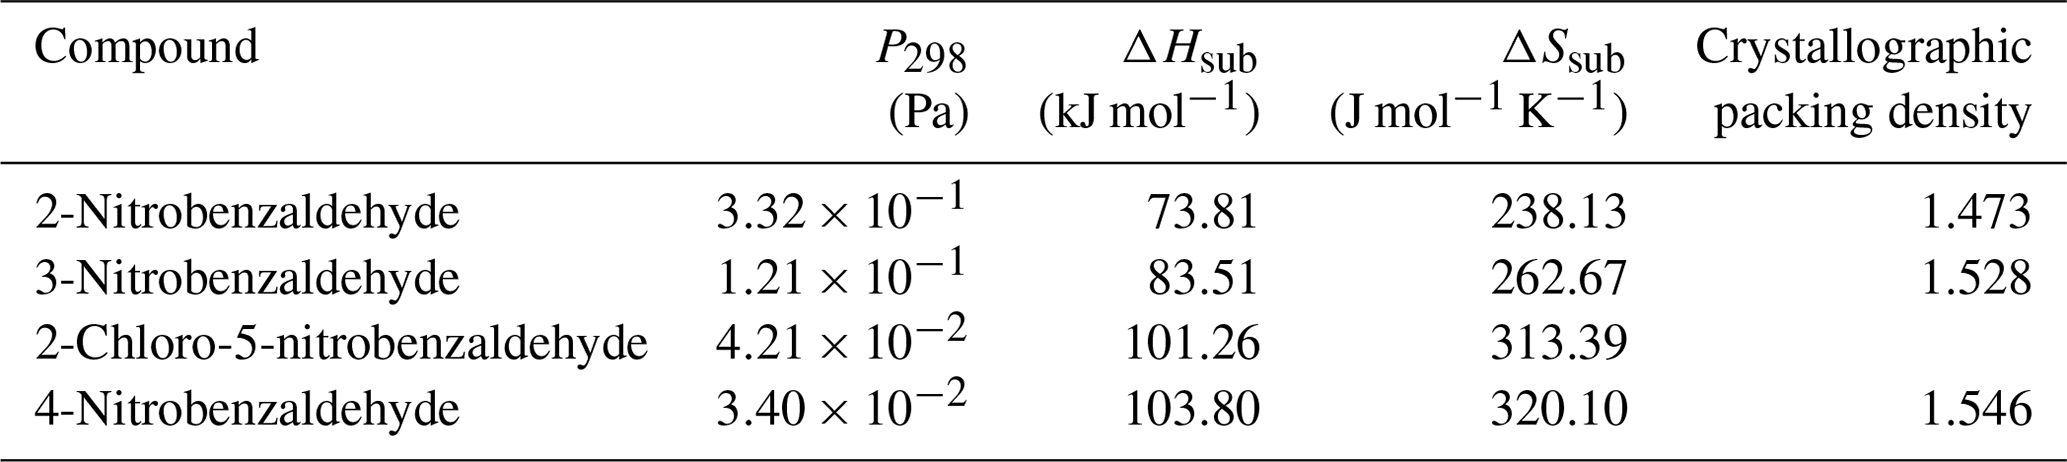
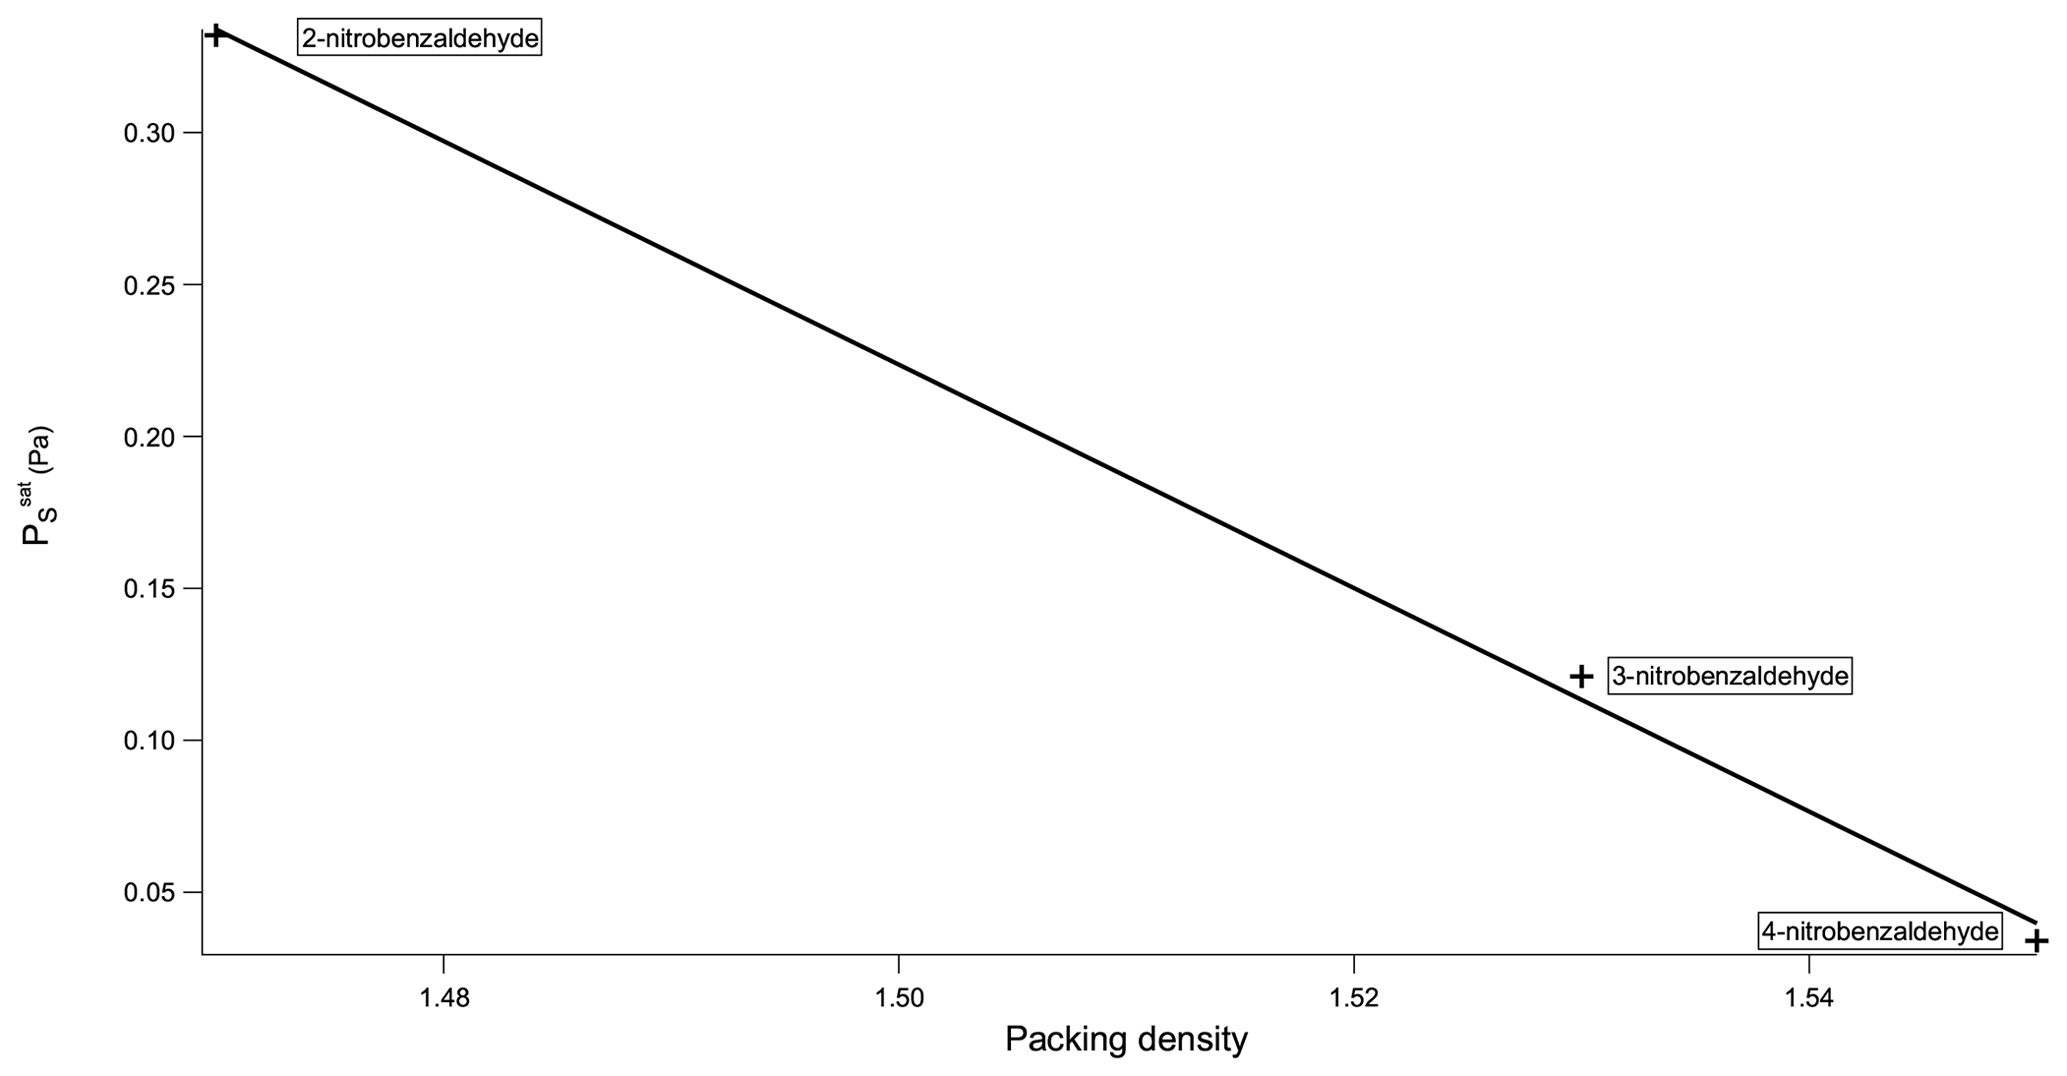
Now considering the nitrobenzaldehydes (Table 5) the highest compound is 2-nitrobenzaldehyde (). Comparing this to 2-nitrophenol () shows how significant the ability to form H bonds is to the of a compound, with replacing a hydroxyl group (capable of H bonding) with an aldehyde group (incapable of H bonding) raising the of the compound by more than 2 orders of magnitude. The decrease in observed by moving the nitro group from being ortho to the aldehyde group in 2-nitrobenzaldehyde to being meta in 3-nitrobenzaldehyde () and para in 4-nitrobenzaldehyde () can be explained using the different crystallographic packing densities of the three isomers as shown in Fig. 7. Crystallographic packing density is a measure of how densely packed the molecules of a given compound are when they crystallise – the more closely packed molecules are the greater the overall extent of interaction between them and the lower the . The order of the observed here for the three isomers of nitrobenzaldehyde matches that of their crystallographic packing densities (Coppens and Schmidt, 1964; Engwerda et al., 2018; King and Bryant, 1996), with the lowest correlating with the highest packing density and vice versa.
The addition of a Cl atom to 3-nitrobenzaldehyde is also observed to decrease the compounds. This can be simply rationalised due to the greater than 25 % increase this causes to the molecular weight. The higher a compound's molecular weight the greater the overall extent of interaction between its molecules and the lower its .
Table 6 at 298 K, enthalpies and entropies of sublimation, and partial charge of the carboxylic carbon of nitrobenzoic acids determined using KEMS.
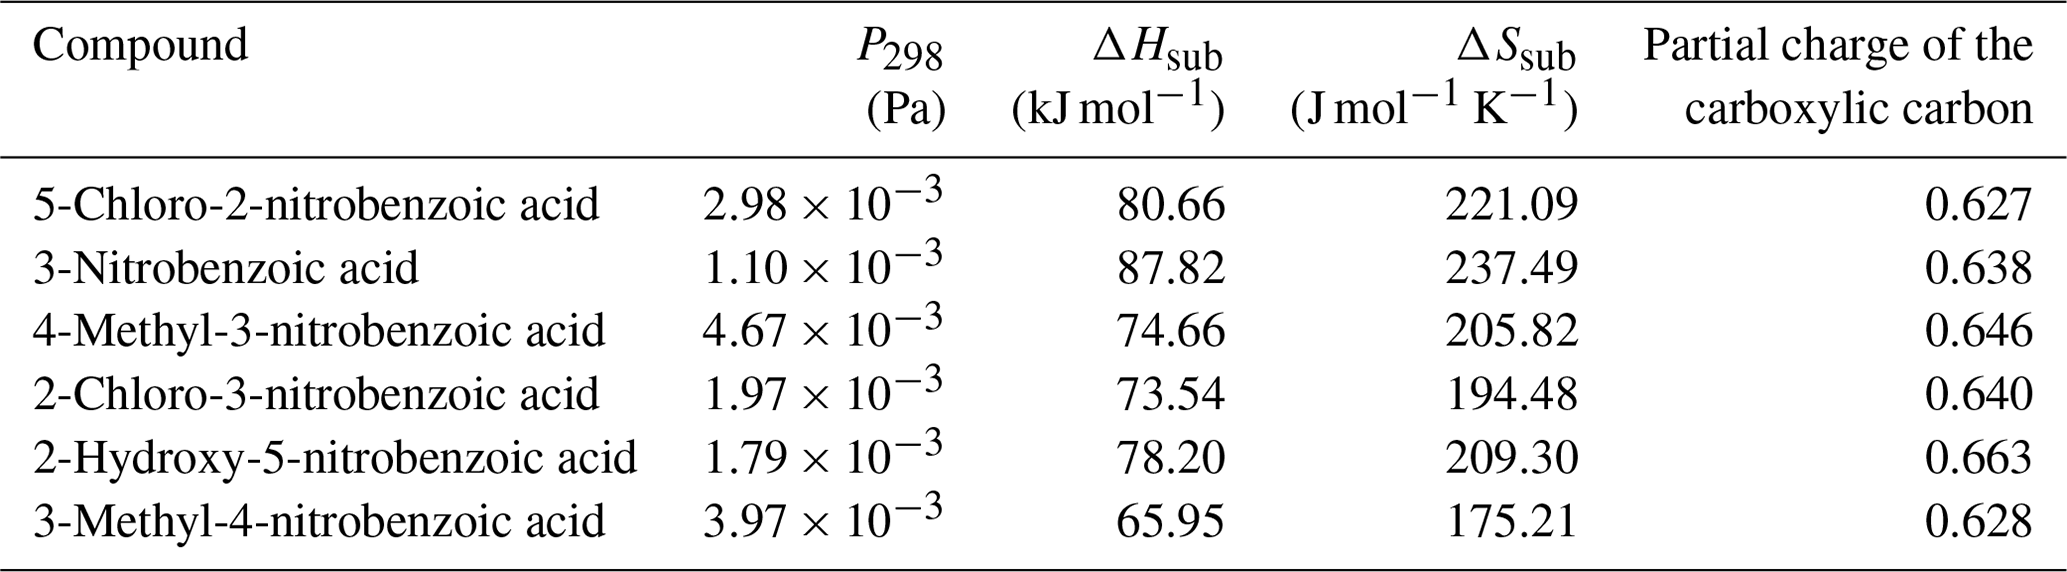
Finally, considering the nitrobenzoic acids (Table 6), the highest compound is 4-methyl-3-nitrobenzoic acid (). Its isomer, 3-methyl-4-nitrobenzoic acid, possesses a slightly lower () as well as a slightly lower partial charge of the carboxylic carbon (0.644 vs. 0.628) although the difference in is not significant.
Removing the methyl group from 4-methyl-3-nitrobenzoic acid to give 3-nitrobenzoic acid () reduces the observed most likely due to the reduction in steric hindrance around the nitro group, which would allow for more effective H bonding. In addition 3-nitrobenzoic acid possesses a lower than the corresponding 3-nitrobenzaldehyde due to its ability to form H bonds. Adding a hydroxyl group or a Cl atom to 3-nitrobenzoic acid to give 2-hydroxy-5-nitrobenzoic acid () or 2-chloro-3-nitrobenzoic acid () respectively increases the observed as the addition of the extra functional group leads to increased intramolecular H bonding occurring. Additionally, comparing 2-hydroxy-5-nitrobenzoic acid with 2-fluoro-4-nitrophenol demonstrates how the increased ability of carboxylic acid to partake in H bonding compared to an F atom leads to a suppression of . 5-Chloro-2-nitrobenzoic acid has a higher ( Pa) than 2-chloro-3-nitrobenzoic acid ( Pa), its structural isomer. The increase in can be attributed to the increased partial charge of the carbon within the carboxylic acid group (0.627 increasing to 0.640).
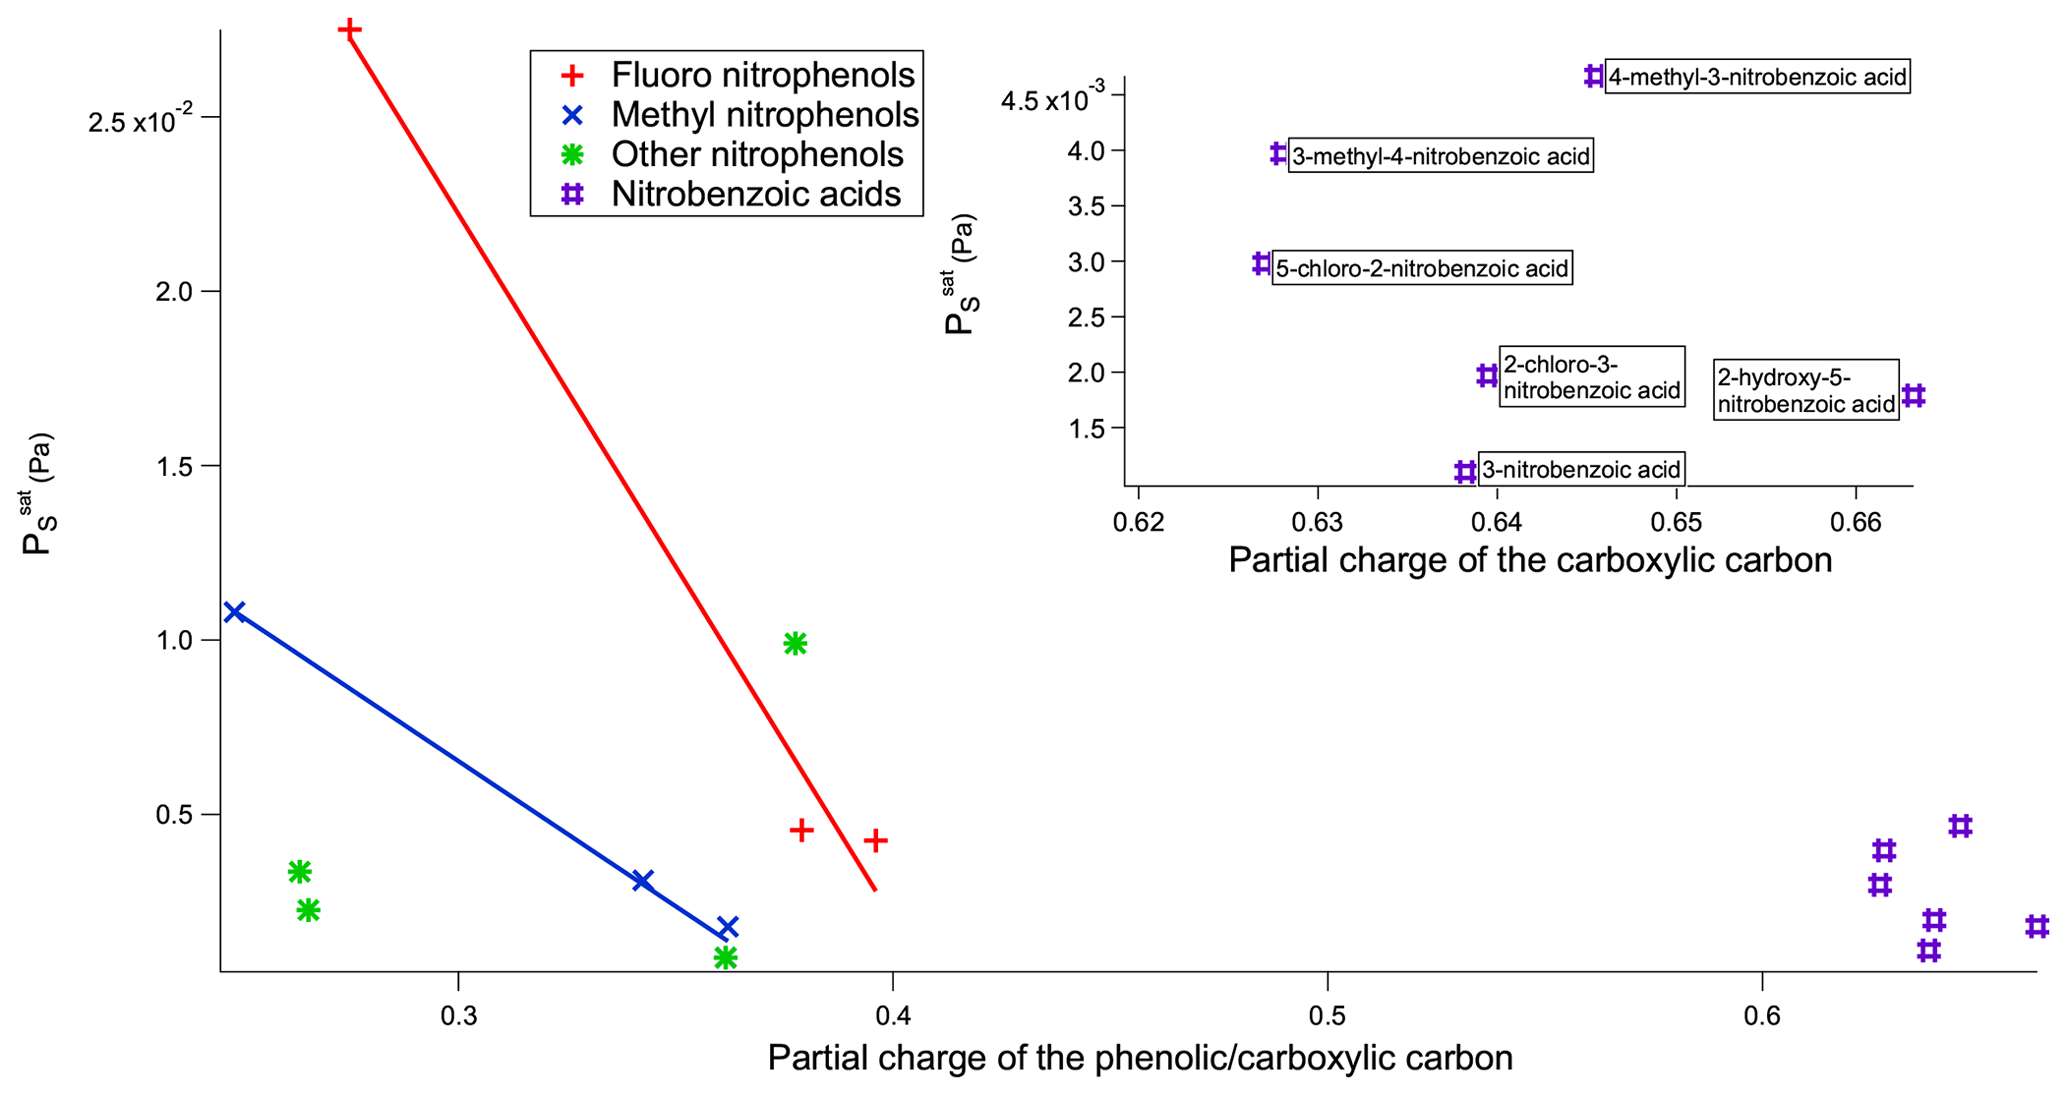
Figure 8 vs. partial charge of the phenolic/carboxylic carbon of the nitrophenols and nitrobenzoic acids.
When comparing nitrobenzoic acids as a whole with nitrophenols, nitrobenzoic acids have a much higher than would be expected based solely on the partial charges of the carboxylic carbon. As can be seen in Fig. 8, there is overlap in the range of for the nitrobenzoic acids and many of the nitrophenols; however, there is no overlap in terms of partial charges of the carboxylic and phenolic carbons, with all of the nitrobenzoic acids having partial charges of the carboxylic carbon greater than 0.6, whilst the nitrophenols had much lower partial charges of the phenolic carbon between 0.2 and 0.4. It is widely known that the H bonds of carboxylic acids are stronger than the H bonds of alcohols (Ouellette et al., 2015b), so therefore it would be expected that the carboxylic acids would have a lower . A likely reason as to why the of the nitrobenzoic acids is higher than would be expected, compared to the nitrophenols, based only on the partial charge of the carboxylic carbon is the propensity for carboxylic acids to dimerise (see Fig. 9). Nitrophenols are unable to dimerise, instead being able to form H bonds with up to two other molecules as shown in Fig. 9. By dimerising, the nitrobenzoic acids, despite having much stronger H bonds than the nitrophenols, will not have a proportionally lower .
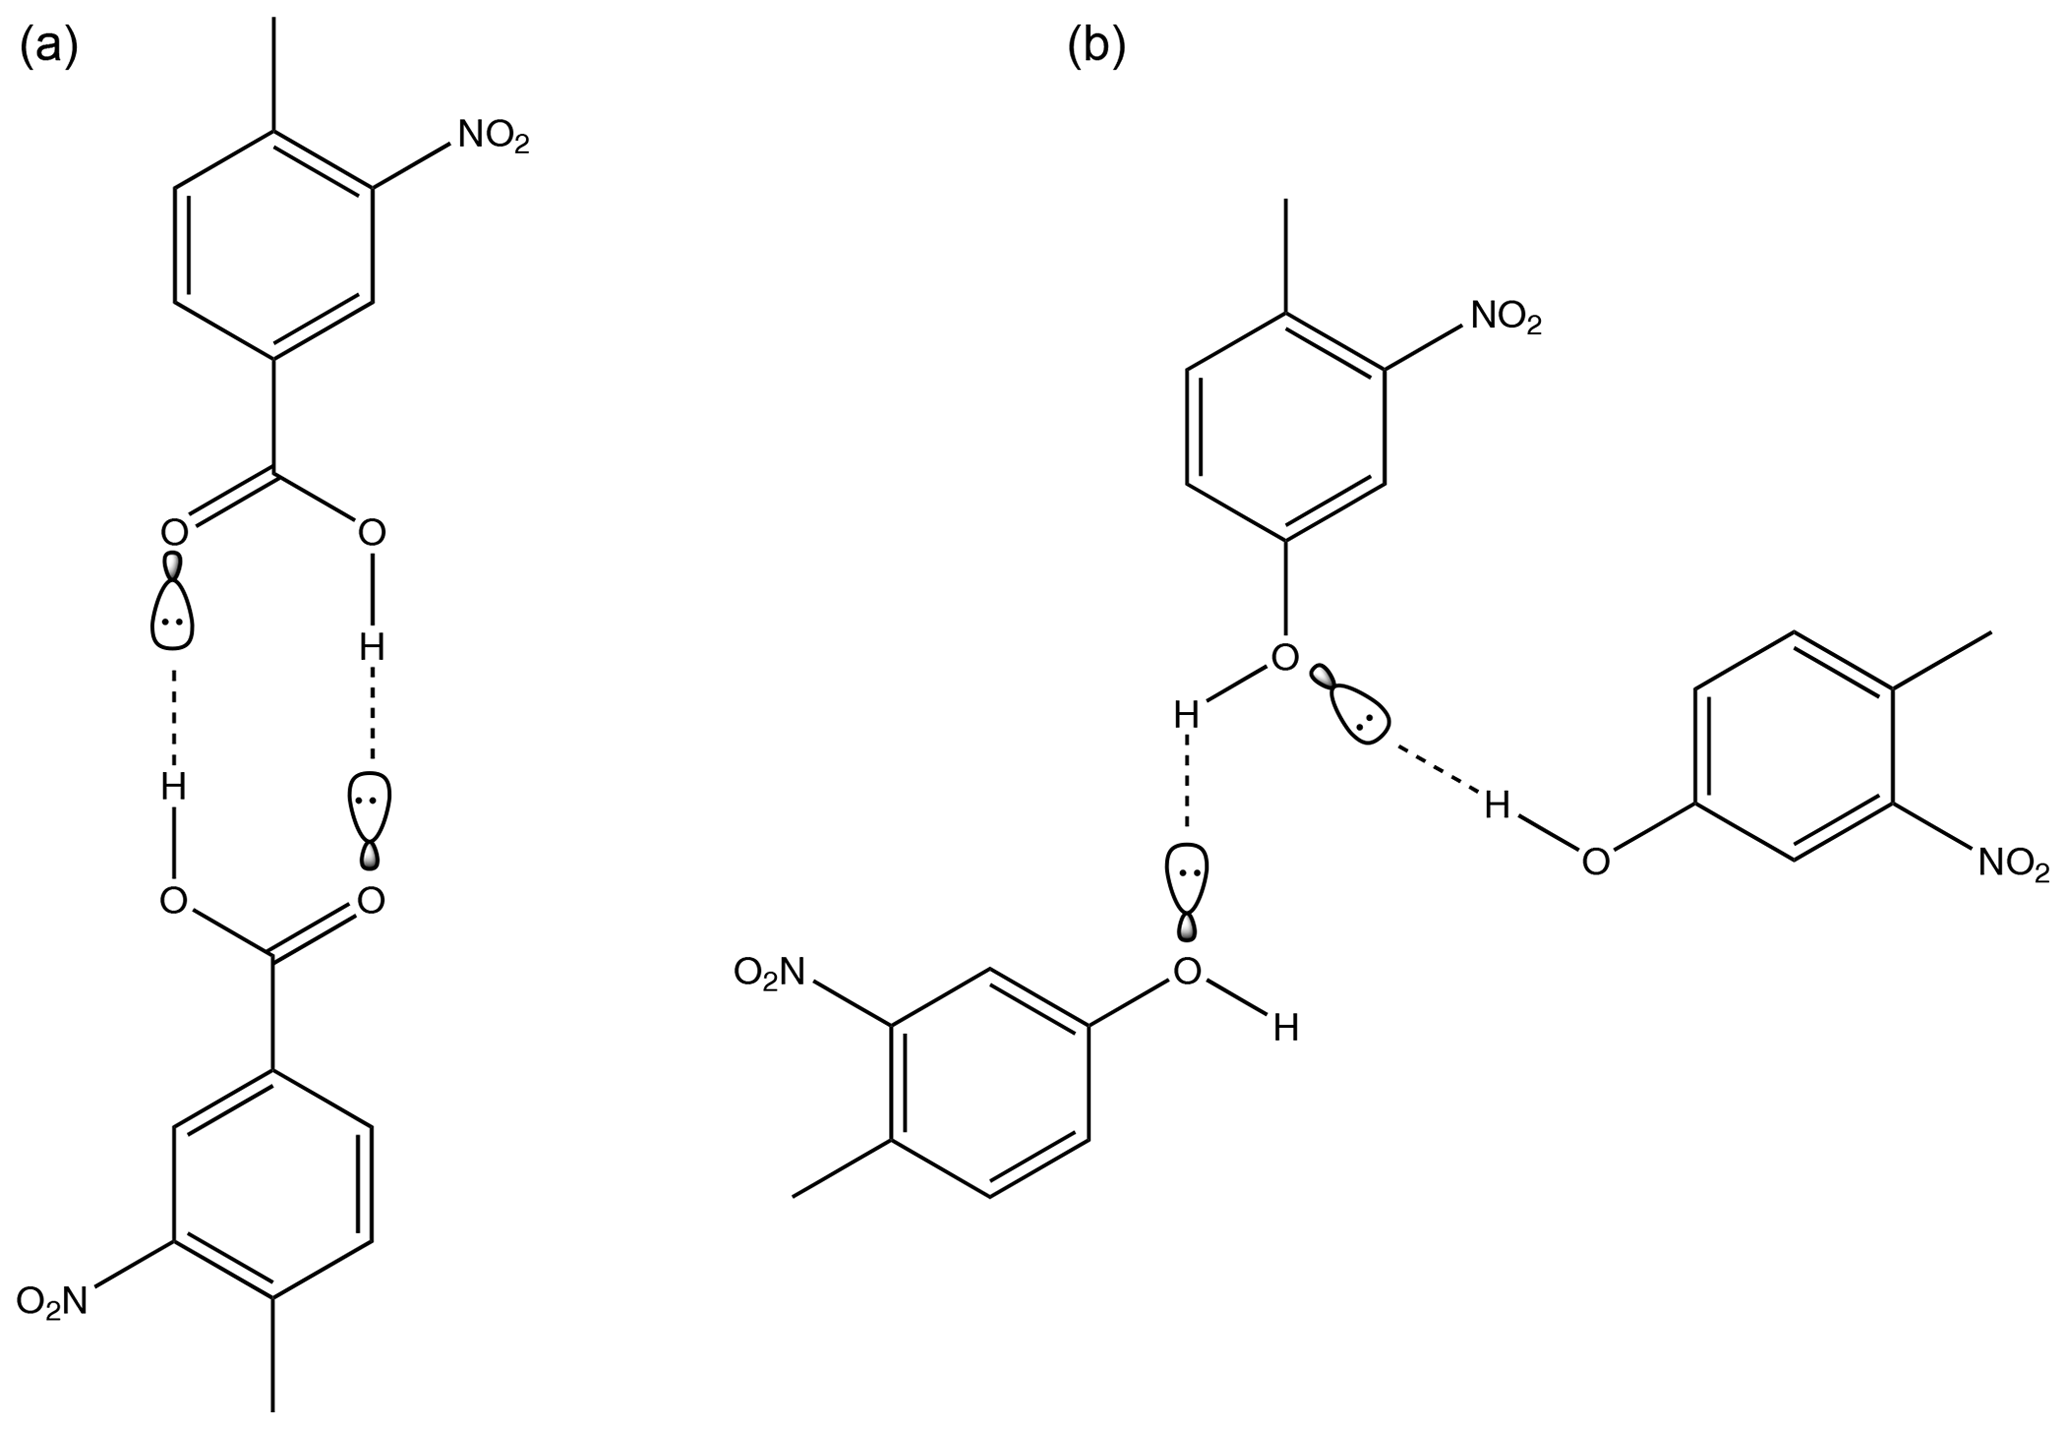
Figure 9Diagram demonstrating how a carboxylic acid functionality allows a molecule to dimerise using H bonds in 4-methyl-3-nitrobenzoic acid (a) whilst a hydroxyl group only allows for hydrogen bonding to two other molecules with no opportunity to dimerise in 4-methyl-3-nitrophenol (b).
In summary the ability to form H bonds appears to be the most significant factor affecting the of a compound, where molecules that are able to form these strong intermolecular interactions generally always exhibit lower than those that cannot. Additionally different functional groups are able to form different numbers of H bonds, with those that are able to form more H bonds generally suppressing to a greater extent than those that form less. The relative positioning of those functional groups responsible for the H bonding is also important as when positioned too close together intramolecular H bonding can occur, which competes with intermolecular H bonding and generally raises . The positioning of non-H-bonding functional groups within the molecule can also have an impact upon the extent of H bonding, with bulky substituents positioned close to H-bonding groups causing steric hindrance, which reduces the extent of H bonding and generally raises . The positioning of all the functional groups around the aromatic ring affect the partial charges of the atoms, via a combination of the inductive effect and the resonance effect. The inductive effect and the partial charges appear to be most important when comparing isomers and less important when one functional group has been swapped for another. In addition greater molecular weight and increased crystallographic packing density also negatively correlate with as they both lead to increased overall intermolecular interactions. However in many cases these different factors compete with each other, making it difficult to predict the expected , and currently it is not possible to determine which factor will dominate in any given case. Dipole moments were also investigated but overall showed very little impact on .
4.2 Subcooled liquid vapour pressure
The were obtained from the using thermochemical data obtained through use of a DSC and Eq. (3). The results are detailed in Table 7.
Table 7, melting point, and the enthalpy and entropy of fusion of the nitrophenols.
Comparing the of the nitrophenols with the solid state values there are a few changes in the overall ordering, but they mostly have little effect upon the preceding discussion. A few previously significant increases/decreases in Psat become insignificant, and a few that were insignificant are now significant. One point of note, however, is that 3-methyl-4-nitrophenol () now exhibits a higher Psat than 3-fluoro-4-nitrophenol (). This trend is what would be expected based on the reduction in steric hindrance, increased potential for H bonding and increase in the partial charge of the phenolic carbon that the F atom provides in comparison to the methyl group.
For the nitrobenzaldehydes one change in the overall ordering of the Psats is observed after converting to , but this has no effect on the preceding discussion.
Finally, for the nitrobenzoic acids, whilst some previously insignificant differences in have now become significant, the only change that impacts upon the discussion is that the Psat of 3-methyl-4-nitrobenzoic acid () is now higher than that of 4-methyl-3-nitrobenzoic acid (). This change could be explained as a result of the higher partial charge of the carboxylic carbon of 4-methyl-3-nitrobenzoic acid (0.646 vs. 0.628) (Stewart, 2016) playing a more important role in the subcooled liquid state than in the solid state.
4.3 Comparison with estimations from GCMs
In Fig. 10 the experimentally determined values of the nitroaromatics are compared to the predicted values of several GCMs. All predicted values can be found in Table S1 in the Supplement. The average difference between the experimental and the predicted for each class of compound and overall is shown in Table 8. These GCMs are SIMPOL (Pankow and Asher, 2008), the Nannoolal et al. method (Nannoolal et al., 2008), and the Myrdal and Yalkowsky method (Myrdal and Yalkowsky, 1997). The Nannoolal et al. method (Nannoolal et al., 2008) and the Myrdal and Yalkowsky method (Myrdal and Yalkowsky, 1997) are both combined methods which require a boiling point to function. As for many compounds where the experimental boiling point is unknown, boiling point group contribution methods are required. The Nannoolal et al. method (Nannoolal et al., 2004) and the Stein and Brown method (Stein and Brown, 1994) are used.
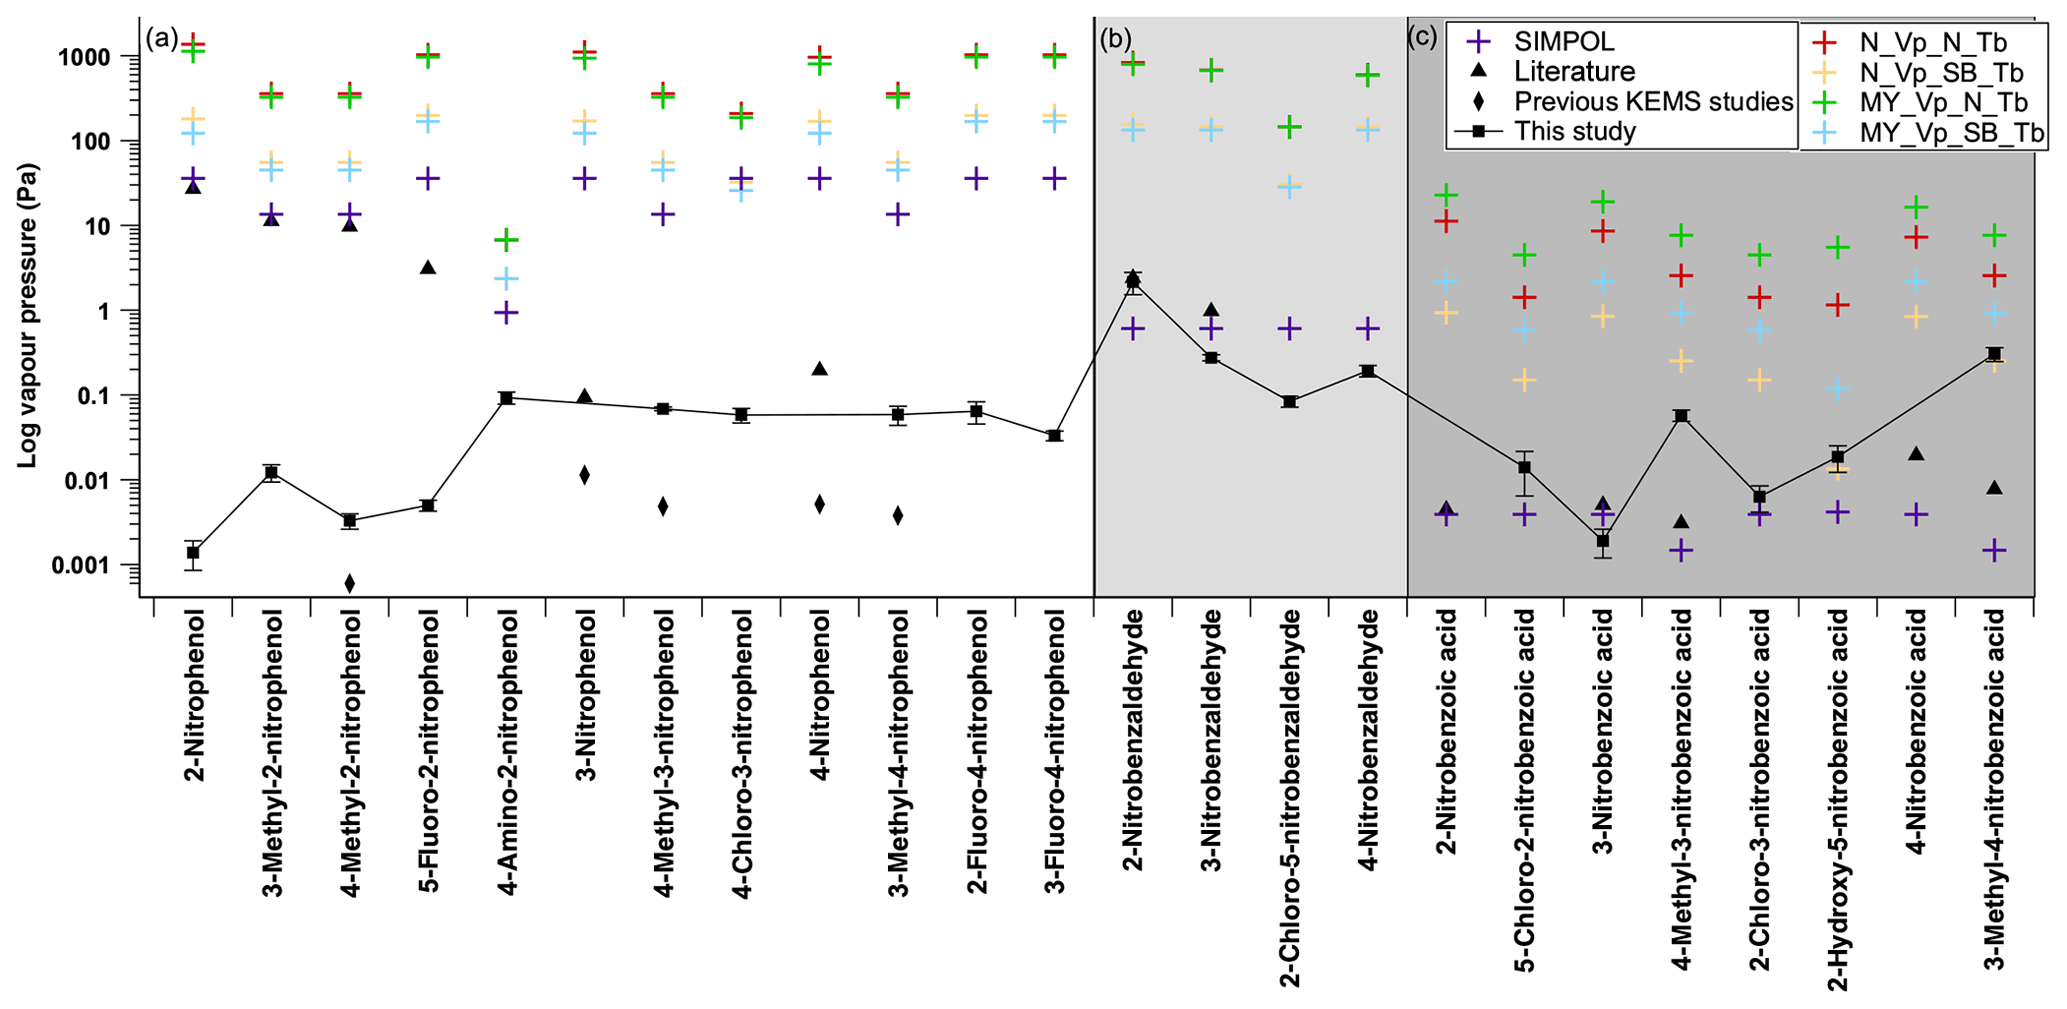
Figure 10Comparison of estimated and measured subcooled saturation vapour pressures. N_Vp (Nannoolal vapour pressure), MY_Vp (Myrdal and Yalkowsky vapour pressure), SIMPOL (SIMPOL vapour pressure), N_Tb (Nannoolal boiling point), SB_Tb (Stein and Brown boiling point), literature – black triangle (2-nitrophenol, 3-methyl-2-nitrophenol, 4-methyl-2-nitrophenol, 5-fluoro-2-nitrophenol and 4-nitrophenol from Schwarzenbach et al., 1988; 3-nitrophenol from Ribeiro da Silva et al., 1992; 2-nitrobenzaldehyde and 3-nitrobenzaldehyde from Perry et al., 1984; 2-nitrobenzoic acid, 3-nitrobenzoic acid and 4-nitrobenzoic acid from Ribeiro Da Silva et al., 1999; 4-methyl-3-nitrobenzoic acid and 3-methyl-4-nitrobenzoic acid from Monte et al., 2001), and literature data for previous KEMS studies – black diamond (3-nitrophenol and 4-nitrophenol from Bannan et al., 2017; 4-methyl-2-nitrophenol, 4-methyl-3-nitrophenol and 3-methyl-4-nitrophenol from Dang et al., 2019). Error bars on the experimental data points are ±1 standard deviation. Panel (a) contains nitrophenols, panel (b) contains nitrobenzaldehydes and panel (c) contains nitrobenzoic acids.
Table 8Average difference between the experimental and the predicted . N_Vp is the Nannoolal et al. vapour pressure method (Nannoolal et al., 2008), MY_Vp is the Myrdal and Yalkowsky vapour pressure method (Myrdal and Yalkowsky, 1997), N_Tb is the Nannoolal et al. boiling point method (Nannoolal et al., 2004), and SB_Tb is the Stein and Brown boiling point method (Stein and Brown, 1994).

The Myrdal and Yalkowsky method (Myrdal and Yalkowsky, 1997) shows poor agreement with the experimental data for almost all compounds but is not particularly surprising given that it only contains three nitroaromatic compounds in this method's fitting data set, with none of these compounds containing both a nitro group and another oxygen-containing group. The Myrdal and Yalkowsky method (Myrdal and Yalkowsky, 1997) is the oldest method examined in this study, and much of the atmospherically relevant Psat data have been collected after the end of the development of this model. The Myrdal and Yalkowsky method's (Myrdal and Yalkowsky, 1997) reliance on a predicted boiling point may also be a major source of error in the Psat predictions of the nitroaromatics.
On average the SIMPOL method (Pankow and Asher, 2008) predicts values closest to the experimental data, on average predicting 1.3 orders of magnitude higher than the experimental values, despite absolute differences of up to 4.4 orders of magnitude.
The Nannoolal et al. method (Nannoolal et al., 2004) is persistently worse than the Stein and Brown method (Stein and Brown, 1994) for the nitroaromatic compounds involved in this study as shown in Table 8. When discussing the Nannoolal et al. method (Nannoolal et al., 2008) and the Myrdal and Yalkowsky method (Myrdal and Yalkowsky, 1997) from this point onwards they are used with the Stein and Brown method (Stein and Brown, 1994) unless stated otherwise.
The Nannoolal et al. method (Nannoolal et al., 2008) has slightly better agreement with the experimental data when compared to the Myrdal and Yalkowsky method (Myrdal and Yalkowsky, 1997), on average predicting 2.52 orders of magnitude higher than the experimental values, whereas the Myrdal and Yalkowsky method (Myrdal and Yalkowsky, 1997) on average predicts 2.65 orders of magnitude higher than the experimental values. The Nannoolal et al. method (Nannoolal et al., 2008), unlike the others, contains parameters for ortho, meta and para isomerism and even demonstrates the same trend as the experimental data for 2-nitrobenzaldehyde, 3-nitrobenzaldehyde and 4-nitrobenzaldehyde, although 3 orders of magnitude higher. Despite the ortho, meta and para parameters, as soon as a third functional group is present around the aromatic ring the Nannoolal et al. method (Nannoolal et al., 2008) no longer accounts for relative positioning of the functional groups.
Figure 10a shows the comparison between the experimental and predicted for the nitrophenols. Both SIMPOL (Pankow and Asher, 2008) and the Nannoolal et al. method (Nannoolal et al., 2008) contain nitrophenol data from Schwarzenbach et al. (1988). These data of Schwarzenbach et al. (1988), however, are questionable in reliability due to being taken from a single data point from a single data set. The values given are also 3–4 orders of magnitude greater than those measured in this work as well as those measured by Bannan et al. (2017) and those measured by Dang et al. (2019). The use of the Schwarzenbach et al. (1988) nitrophenol Psat data, which make up 11 of the 12 nitrophenol data points within the fitting data set of the SIMPOL method (Pankow and Asher, 2008), is a likely cause of the SIMPOL method (Pankow and Asher, 2008) overestimating the Psat of nitrophenols by 3 to 4 orders of magnitude. The one nitrophenol used in the SIMPOL method (Pankow and Asher, 2008) not from Schwarzenbach et al. (1988), 3-nitrophenol from Ribeiro da Silva et al. (1992), has a much lower Psat than those of Schwarzenbach et al. (1988) and is only 1 order of magnitude higher than that from Bannan et al. (2017). Additionally, whilst the Nannoolal et al. (2008) method performs slightly better than the Myrdal and Yalkowsky method (Myrdal and Yalkowsky, 1997) overall for this study, when taking the nitrophenol data in isolation this performance is flipped, with the Myrdal and Yalkowsky method (Myrdal and Yalkowsky, 1997) showing better performance (overestimating on average by 3.4 to 3.5 orders of magnitude).
Figure 10b shows the comparison between the experimental and predicted for the nitrobenzaldehydes. There are no nitrobenzaldehydes present in any fitting data set of the GCMs considered in this study. Despite this, whilst not capturing the effects of ortho, meta and para isomerism, SIMPOL (Pankow and Asher, 2008) predicts the Psat of the nitrobenzaldehydes to, on average, 0.29 orders of magnitude. As polar groups such as aldehydes have been shown to have little impact on volatility in the pure component, and by extension Psat (Bilde et al., 2015), this implies that SIMPOL (Pankow and Asher, 2008) captures the contribution of the nitro group very well. Similar to the nitrophenols the performance of the Nannoolal et al. method (Nannoolal et al., 2008) and the Myrdal and Yalkowsky method (Myrdal and Yalkowsky, 1997) has switched for the nitrobenzaldehydes compared to the entire data set. The Myrdal and Yalkowsky method (Myrdal and Yalkowsky, 1997) overestimates by 2.4 orders of magnitude compared to the Nannoolal et al. method (Nannoolal et al., 2008), which overestimates by 2.5 orders of magnitude.
Figure 10c shows the comparison between the experimental and predicted for the nitrobenzoic acids. SIMPOL (Pankow and Asher, 2008) contains, though in limited amounts, nitrobenzoic acid data in its fitting parameters. Although there are no lists of the data used to form the Nannoolal et al. method (Nannoolal et al., 2008) available (to the authors' knowledge), it is stated that the values come from the Dortmund Data Bank, and from searches on this database there are nitrobenzoic acid Psat data available. Having even this limited number of data available for the nitrobenzoic acids allows for SIMPOL (Pankow and Asher, 2008) to predict the s of 5-chloro-2-nitrobenzoic acid, 3-nitrobenzoic acid, 2-chloro-3-nitrobenzoic acid and 2-hydroxy-5-nitrobenzoic acid to within 1 order of magnitude of the experimental values. On average the SIMPOL (Pankow and Asher, 2008) method underestimates by 0.8 orders of magnitude. The nitrobenzoic acids that had large discrepancies with SIMPOL (Pankow and Asher, 2008), 4-methyl-3-nitrobenzoic acid and 3-methyl-4-nitrobenzoic acid, as well as 2-hydroxy-5-nitrobenzoic acid, agreed to within 1 order of magnitude of the Nannoolal et al. method (Nannoolal et al., 2008). On average the Nannoolal et al. method (Nannoolal et al., 2008) overestimates by 0.9 orders of magnitude.
Overall SIMPOL (Pankow and Asher, 2008) performs relatively well for the nitrobenzaldehydes and the nitrobenzoic acids, and the Nannoolal et al. method (Nannoolal et al., 2008) performs moderately well for the nitrobenzoic acids when compared to the experimental values found in this study. All of the methods perform poorly when compared to the experimental nitrophenol values. These observations are not particularly surprising when taking into account how the methods were fitted and what data are present in the fitting set.
One surprising observation comes when looking at the halogenated nitroaromatics. SIMPOL (Pankow and Asher, 2008) has the smallest order of magnitude difference between experimental and predicted for all of the halogenated nitroaromatics in this study. This is particularly surprising as SIMPOL (Pankow and Asher, 2008) contains no halogenated compounds in its fitting data set, whereas the other GCMs do. This implies that accurately predicting the impact on of the carbon skeleton and other functional groups such as, nitro, hydroxy, aldehyde and carboxylic acid is more important than the impact of a chloro or fluoro group.
When looking at nitroaromatics as a whole, SIMPOL (Pankow and Asher, 2008) shows the smallest difference between experimental and predicted (as shown in Table 8) and would therefore be the most appropriate method to use when predicting for this group of compounds. In the case of nitrophenols, despite SIMPOL (Pankow and Asher, 2008) showing the best performance the absolute differences are still close to 3 orders of magnitude, so any work using these predictions should be aware of the very larger errors that these predictions could introduce. For nitrobenzaldehydes SIMPOL (Pankow and Asher, 2008) shows very good agreement and is the clear choice to be used when predicting . For nitrobenzoic acids the preferred method for predicting is not quite as clear. Both the Nannoolal et al. method (Nannoolal et al., 2008) and SIMPOL (Pankow and Asher, 2008) predict within an order of magnitude, with Nannoolal et al. (Nannoolal et al., 2008) generally overestimating and SIMPOL (Pankow and Asher, 2008) underestimating.
4.4 Comparison with existing experimental data
For the compounds in this study that had previous literature data there are differences from the values determined experimentally in this work. The differences between the values from this work and those of Dang et al. (2019) are discussed in Sect. 4.5 but can be attributed to the use of a different reference compound.
For the nitrophenols, shown in Fig. 10a, the differences between the experimental values and the literature values from Schwarzenbach et al. (1988) range from 3 to 4 orders of magnitude. The relationship between the and temperature from Schwarzenbach et al. (1988) was derived from gas chromatographic (GC) retention data. This GC method requires a reference compound of known Psat, as well as for the reference compound and the compound of interest to have very similar interactions with the stationary phase of the GC. Schwarzenbach et al. (1988) used 2-nitrophenol as the reference compound for all of the other nitrophenol data they collected. In this work the at 298 K was Pa, whereas Schwarzenbach et al. (1988) reported it as 2.69×101 Pa. As the difference between the Psat of 2-nitrophenol in this work and Schwarzenbach et al. (1988) differs by approximately 4 orders of magnitude, this could explain why the other nitrophenol measurements also differ by 3–4 orders of magnitude.
For the nitrobenzaldehydes, shown in Fig. 10b, the literature data from Perry et al. (1984) and the experimental data from this work agree within 1 order of magnitude, with 2-nitrobenzaldehyde especially agreeing very closely (2.39×100 Pa vs. 2.15×100 Pa).
The nitrobenzoic acids are shown in Fig. 10c. The value for 3-nitrobenzoic acid from this work is Pa compared to from Ribeiro da Silva et al. (1999) Whilst not matching perfectly, the Psat of 3-nitrobenzoic acid is on this order of magnitude. The disagreements between the values of this work and the values from Monte et al. (2001) for 4-methyl-3-nitrobenzoic acid and 3-methyl-4-nitrobenzoic acid are quite large. 4-Methyl-3-nitrobenzoic acid differs by over 1 order of magnitude, and 3-methyl-4-nitrobenzoic acid is closer to 2 orders of magnitude. The Psat values from Monte et al. (2001) were collected using a Knudsen mass loss method. Knudsen mass loss is similar to KEMS in that it also utilises a Knudsen cell which effuses the compound of interest. However for an amount of mass to be lost such that it can be detected the experiments need to be performed at higher temperatures than the KEMS. This means that the data must be extrapolated further to reach ambient temperatures. This is a potential source of error and could explain the difference. Measurement by a third or even fourth technique would be required to confirm this.
4.5 Sensitivity of vapour pressure measurement techniques to reference standards
The recently published paper by Dang et al. (2019) measured the Psat of several of the same compounds that are studied in this paper using the same KEMS system; however, in this study the newly defined best-practice reference sample was used (Krieger et al., 2018), whereas Dang et al. (2019) used malonic acid. These compounds were 4-methyl-3-nitrophenol, 3-methyl-4-nitrophenol and 4-methyl-2-nitrophenol. The difference in reference compound led to a discrepancy in the experimental Psat (shown in Table 9). Due to these differences additional measurements were made using malonic acid as the reference material. Additionally, supporting measurements for the compounds were performed using the EDB from ETH Zurich in order to rule out instrumental problems with the KEMS.
Table 9Comparison between nitrophenols measured in this paper and by Dang et al. (2019).
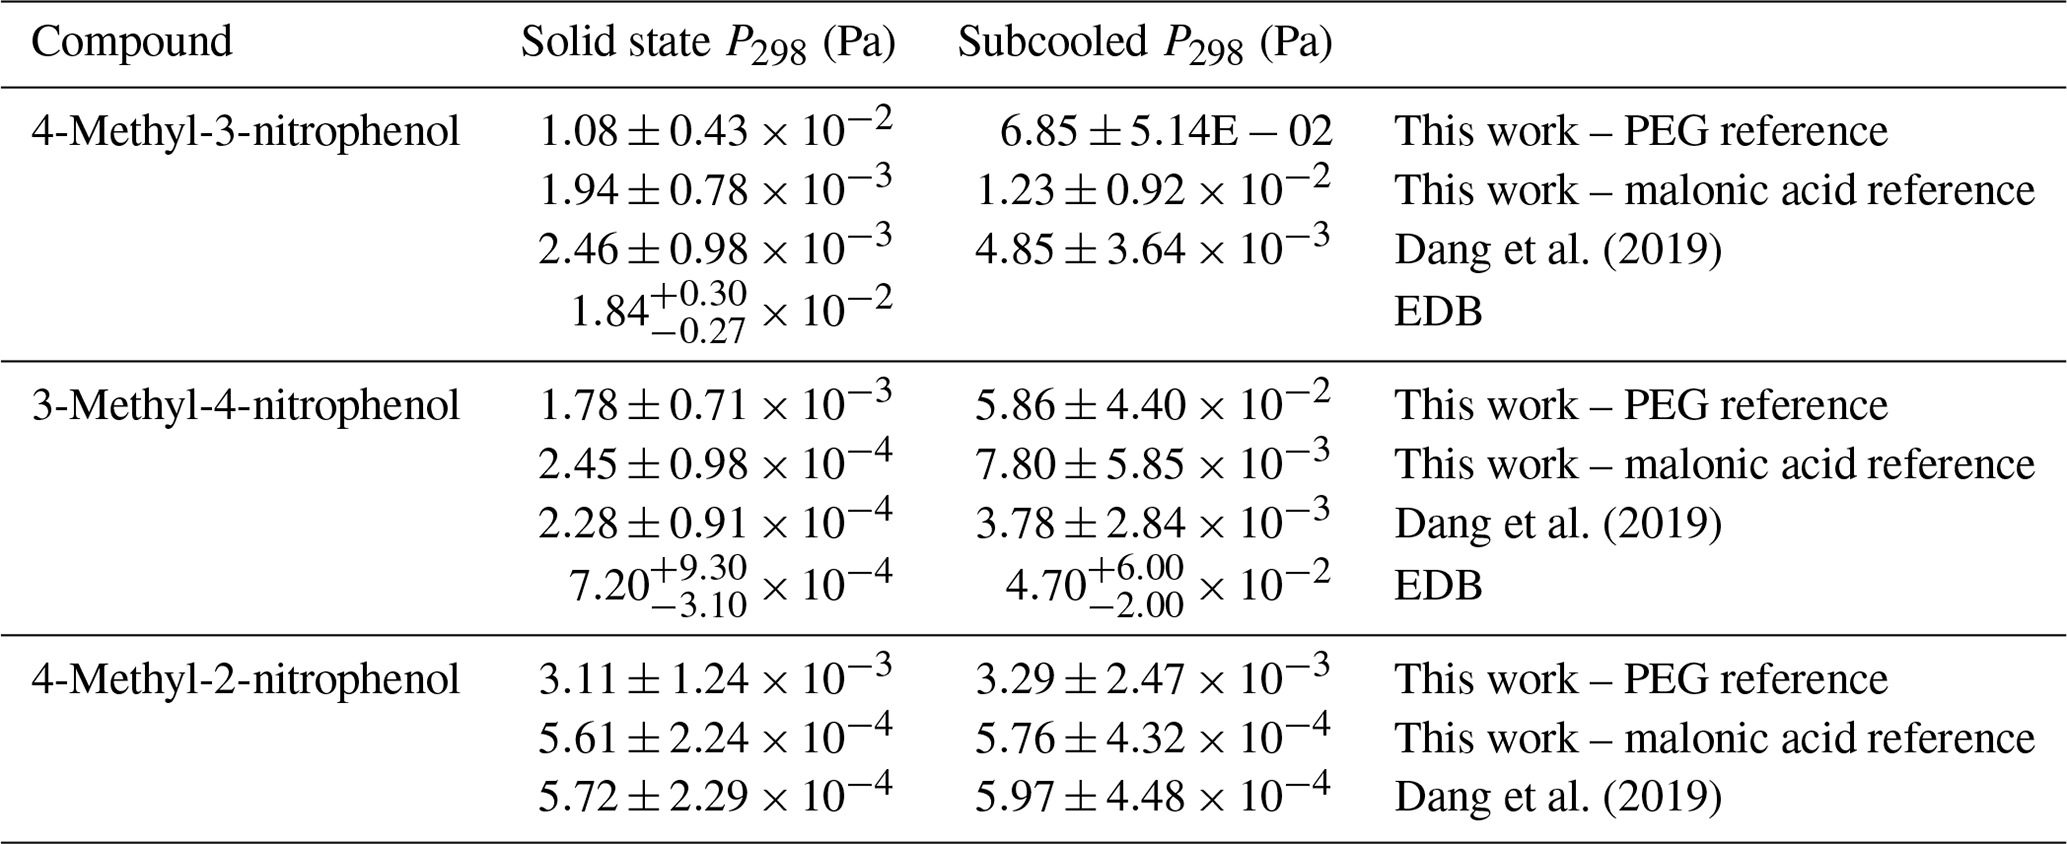
Comparisons between Psat at 298 K from the KEMS using a PEG reference, the KEMS using a malonic acid reference, Dang et al. (2019) and the EDB are shown in Table 9. Following this, values, extrapolated down to 290 K, from the KEMS using a PEG reference and the KEMS using a malonic acid reference are compared to the estimated based on the findings from the EDB using Eq. (2).
Whilst the absolute values of the nitrophenols shown in Table 9 changed, the Psat trends did not. The values from Dang et al. (2019) are between 4.39 and 7.81 times lower than those in this work using the PEGs as the reference compound, which is now deemed as best practice in the community. To ensure that the difference in reference compound was the cause of the difference in Psat 4-methyl-2-nitrophenol, 4-methyl-3-nitrophenol and 3-methyl-4-nitrophenol were also measured using malonic acid as a reference again. The differences between the Psat determined by Dang et al. (2019) and those in this work using malonic acid as a reference compound were between 2 % and 27 %, which is well within the quoted 40 % error margin of the KEMS (Booth et al., 2009), therefore showing that the instrument is behaving reproducibly but with now improved reference standards being used, as is discussed below.
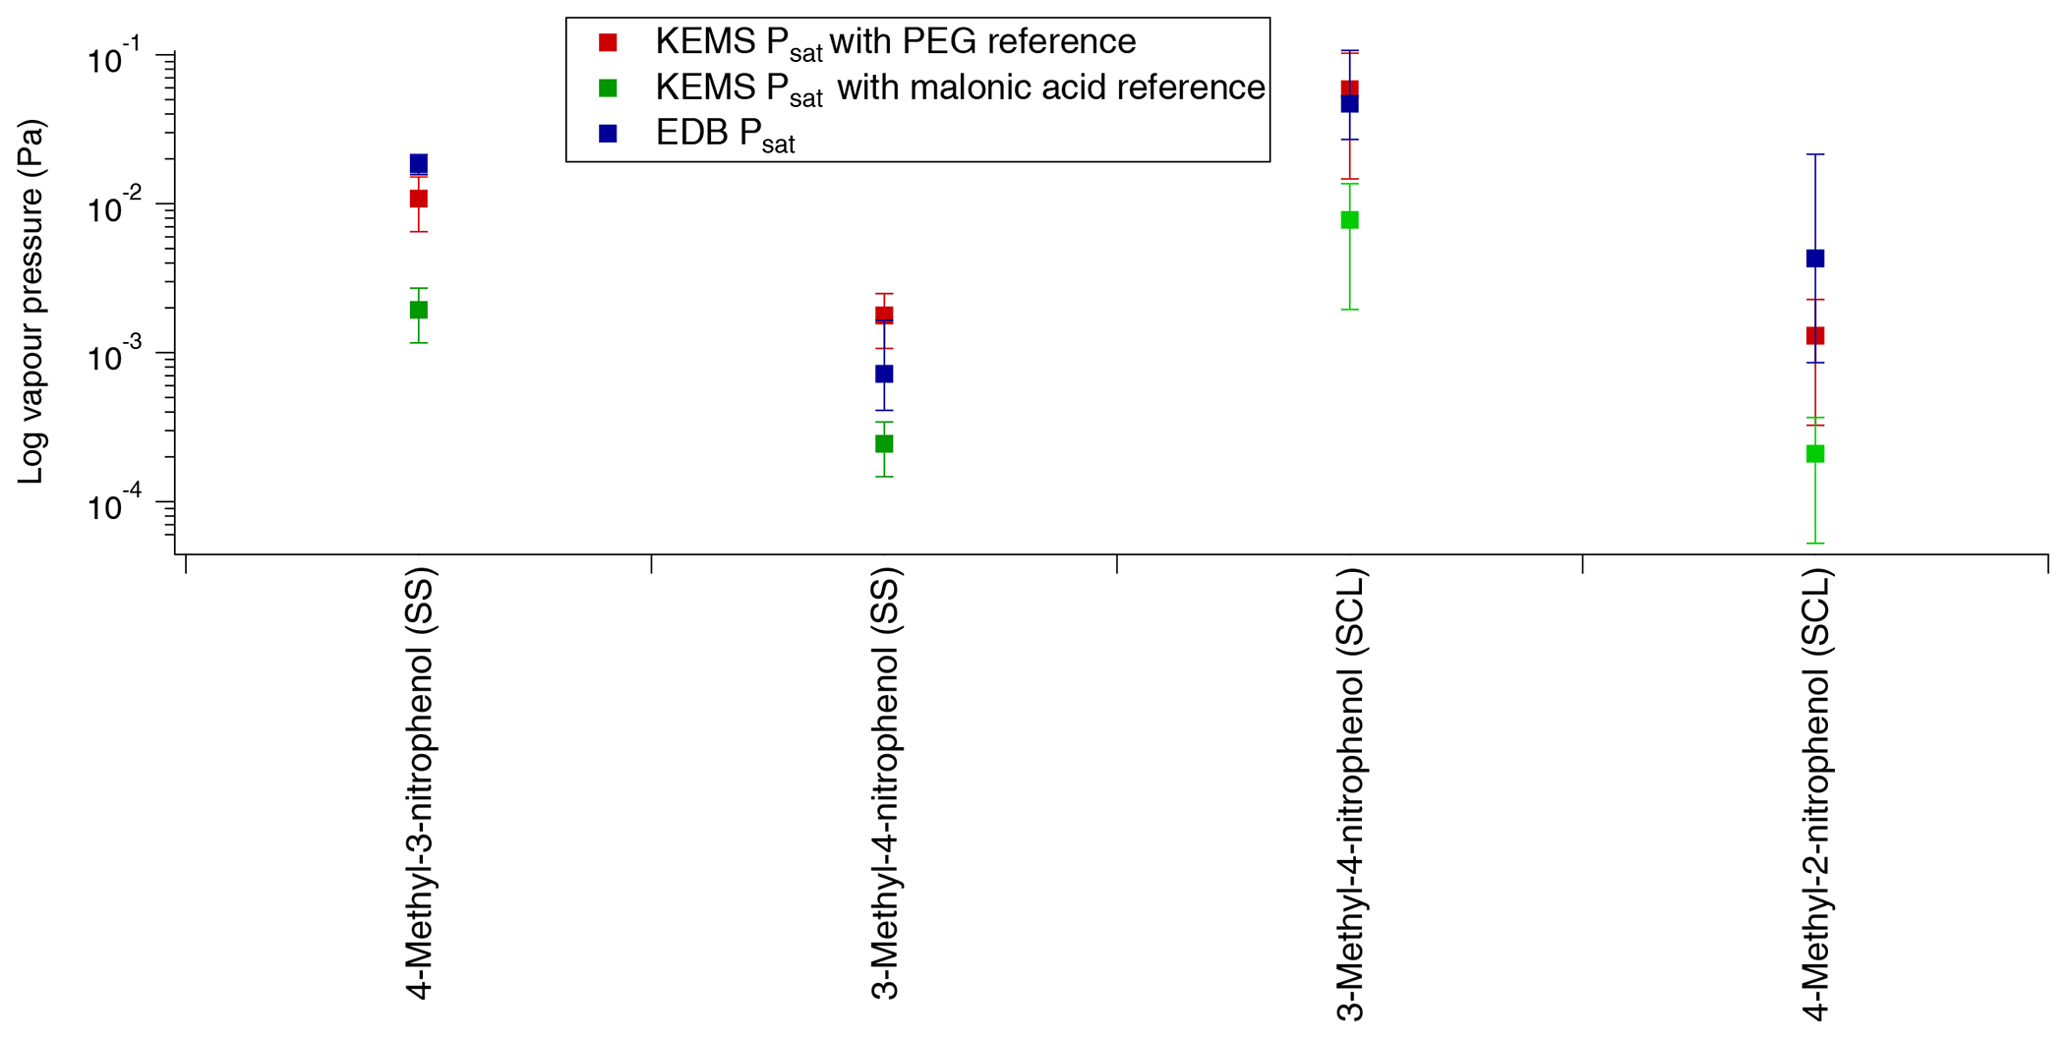
Figure 11Comparison of Psat between the EDB and the KEMS using both PEGs and malonic acid as the reference compound (SS – solid state, SCL – subcooled liquid).
Starting with 4-methyl-3-nitrophenol the EDB has much better agreement with the KEMS when the PEGs are used as the reference compound than when malonic acid is used as the reference compound. When the quoted errors of both the EDB (shown in Table 9) and the KEMS (±40 % for and ±75 % for ; Booth et al., 2009) are taken into account, the lower limit of the EDB ( Pa) and the upper limit of the KEMS using the PEG references ( Pa) almost overlap, whereas the EDB data are almost 1 order of magnitude larger than the KEMS when the malonic acid reference is used (shown in Fig. 11).
For 3-methyl-4-nitrophenol a comparison can be made for both and . Looking first at the the EDB appears to be somewhere in between the KEMS depending on what the KEMS is using as a reference, with its absolute value being closer to that of the malonic acid reference. However when the quoted errors are taken into account (shown in Table 9) the EDB actually has better agreement with the KEMS when the PEG references are used. This can be seen more clearly in Fig. 11. For the EDB and the KEMS when using the PEG references appears to agree very well with a large overlap when the quoted errors are taken into account. This can also be seen in Fig. 11.
The confidence with which the comparison between the EDB and the KEMS can be made for 4-methyl-2-nitrophenol is lower than with the other compounds looked at due to how quickly 4-methyl-2-nitrophenol evaporated in the EDB. To make this comparison the from the KEMS measurements has been extrapolated down to 290 K to match that of the EDB estimation. The predicted EDB value (shown in Fig. 11) is higher than the KEMS for both references but has a very large error margin (approximately a factor of 5). When this error is considered the KEMS using the PEG reference is within this range, whereas there is close to an order of magnitude difference between the lower limit of this estimate and the upper limit of the KEMS when malonic acid is used as the reference.
In all cases the EDB showed better agreement with the KEMS using the PEGs as the reference material compared to when malonic acid was used as the reference material. For 4-methyl-3-nitrophenol the agreement was very close between the EDB and the KEMS using the PEGs as the reference compounds, and for 3-methyl-4-nitrophenol the measurements for the EDB and the KEMS agreed with each other within the quoted errors. For 4-methyl-2-nitrophenol the KEMS with PEG as a reference also showed the best agreement with the EDB, but as this was an estimate with a large error range this comparison is the least certain.
Experimental values for the and have been obtained using KEMS and DSC for nitrophenols, nitrobenzaldehydes and nitrobenzoic acids.
The predictive models have been shown to overestimate in almost every instance by several orders of magnitude. As the Psat from these predictive techniques are often used in mechanistic partitioning models (Lee-Taylor et al., 2011; Shiraiwa et al., 2013), the overestimation of the Psat can lead to an overestimation of the fraction in gaseous state. The experimental values from this study can be used in conjunction with other measurements to improve the accuracy of GCMs and give an insight into the impact of functional group positioning which is missing, or only available in a limited capacity, for the currently available GCMs.
The differences in trends of the experimental Psat have been explained chemically, with the potential and strength of H bonding appearing to be the most significant factor, where present, in determining the Psat and the stronger hydrogen bond and increasing number of possible hydrogen bonds decreasing the Psat. Whilst H bonding is typically the most important factor, it is not the only factor. Steric effects by functional groups can also have significant effects on the Psat. In the solid state crystallographic packing density can also be an important factor. To further investigate the impacts of H bonding, inductive and resonance effects, and steric effects on Psat, more compounds need to be investigated, with select compounds being chosen to probe these effects.
The predictive models consistently overestimate the s by up to 6 orders of magnitude with the nitrophenols performing especially poorly. This demonstrates a need for more experimental data to be used in the fitting data sets of the GCMs to reduce the errors and give more accurate results for nitroaromatic compounds.
Deviations between the measurements in Dang et al. (2019) and this work can be explained by the difference of the reference material used, which demonstrates the necessity of a consistent, widely used reference compound. The PEG series, looked at by Krieger et al. (2018), is currently the preferred reference/calibration series.
Comparisons between the KEMS and the EDB from ETH were made for several nitrophenols. The EDB showed close agreement with the KEMS when the PEG series was used as the reference compounds.
Compounds such as the nitrobenzaldehydes, which are capable of being H-bond acceptors but not H-bond donors, are likely to deviate negatively from Raoult's law in mixtures with compounds that can act as H-bond donors, due to the adhesive forces present. This could call into question the validity of pure component vapour pressure measurements for looking at atmospheric systems due to the atmosphere not being made up of the pure component. This would be an interesting avenue of research and the natural progression from pure component measurements to investigate their usefulness.
All data in this paper are available from https://doi.org/10.5281/zenodo.3613581 (Shelley et al., 2020b). Supplementary material is available from https://doi.org/10.5281/zenodo.3625641 (Shelley et al., 2020a).
The supplement related to this article is available online at: https://doi.org/10.5194/acp-20-8293-2020-supplement.
PDS carried out the experiments on the KEMS and DSC. UKK carried out the experiments on the EDB. Formal analysis of the data was carried out by PDS, SDW and UKK. Project supervision was undertaken by DT, MRA and TJB. KEMS training was performed by TJB. Access to and training on the DSC was undertaken by AG. Verification on the reliability of the KEMS was carried out by UKK, with the EDB measurements being used to validate the KEMS measurements. The original draft manuscript was written by PDS, SDW and CJP. Internal review and editing was performed by TJB, DT, MRA, SDW and UKK.
The authors declare that they have no conflict of interest.
The work contained in this paper contains work conducted during a PhD study supported by the Natural Environment Research Council (NERC) EAO Doctoral Training Partnership and is fully funded by NERC, whose support is gratefully acknowledged (grant no. NE/L002469/1).
The work by Carl J. Percival was carried out at the Jet Propulsion Laboratory, California Institute of Technology, under contract with the National Aeronautics and Space Administration (NASA), and was supported by the Upper Atmosphere Research Program and Tropospheric Chemistry Program.
This research has been supported by the Natural Environment Research Council (grant no. NE/L002469/1).
This paper was edited by Alexander Laskin and reviewed by Thomas Mentel and one anonymous referee.
Bannan, T. J., Booth, A. M., Jones, B. T., O'meara, S., Barley, M. H., Riipinen, I., Percival, C. J., and Topping, D.: Measured Saturation Vapor Pressures of Phenolic and Nitro-aromatic Compounds, Environ. Sci. Technol, 51, 3922–3928, https://doi.org/10.1021/acs.est.6b06364, 2017.
Barley, M. H. and McFiggans, G.: The critical assessment of vapour pressure estimation methods for use in modelling the formation of atmospheric organic aerosol, Atmos. Chem. Phys., 10, 749–767, https://doi.org/10.5194/acp-10-749-2010, 2010.
Bilde, M., Barsanti, K., Booth, M., Cappa, C. D., Donahue, N. M., Emanuelsson, E. U., McFiggans, G., Krieger, U. K., Marcolli, C., Topping, D., Ziemann, P., Barley, M., Clegg, S., Dennis-Smither, B., Hallquist, M., Hallquist, Å. M., Khlystov, A., Kulmala, M., Mogensen, D., Percival, C. J., Pope, F., Reid, J. P., V Ribeiro da Silva, M. A., Rosenoern, T., Salo, K., Pia Soonsin, V., Yli-Juuti, T., Prisle, N. L., Pagels, J., Rarey, J., Zardini, A. A., and Riipinen, I.: Saturation Vapor Pressures and Transition Enthalpies of Low-Volatility Organic Molecules of Atmospheric Relevance: From Dicarboxylic Acids to Complex Mixtures, Chem. Rev, 115, 4115–4156, https://doi.org/10.1021/cr5005502, 2015.
Booth, A. M., Markus, T., McFiggans, G., Percival, C. J., Mcgillen, M. R., and Topping, D. O.: Design and construction of a simple Knudsen Effusion Mass Spectrometer (KEMS) system for vapour pressure measurements of low volatility organics, Atmos. Meas. Tech., 2, 355–361, https://doi.org/10.5194/amt-2-355-2009, 2009.
Booth, A. M., Barley, M. H., Topping, D. O., McFiggans, G., Garforth, A., and Percival, C. J.: Solid state and sub-cooled liquid vapour pressures of substituted dicarboxylic acids using Knudsen Effusion Mass Spectrometry (KEMS) and Differential Scanning Calorimetry, Atmos. Chem. Phys., 10, 4879–4892, https://doi.org/10.5194/acp-10-4879-2010, 2010.
Booth, A. M., Bannan, T., McGillen, M. R., Barley, M. H., Topping, D. O., McFiggans, G., and Percival, C. J.: The role of ortho, meta, para isomerism in measured solid state and derived sub-cooled liquid vapour pressures of substituted benzoic acids, RSC Adv., 2, 4430, https://doi.org/10.1039/c2ra01004f, 2012.
Booth, A. M., Bannan, T. J., Benyezzar, M., Bacak, A., Alfarra, M. R., Topping, D., and Percival, C. J.: Development of lithium attachment mass spectrometry – knudsen effusion and chemical ionisation mass spectrometry (KEMS, CIMS), Analyst, 142, 3666–3673, https://doi.org/10.1039/C7AN01161J, 2017.
Bouya, H., Al Rashidi, M., Roth, E., Salghi, R., and Chakir, A.: Atmospheric degradation of 2-nitrobenzaldehyde: Photolysis and reaction with OH radicals, Atmos. Environ., 171, 221–228, https://doi.org/10.1016/J.ATMOSENV.2017.10.021, 2017.
Chow, K. S., Huang, X. H. H., and Yu, J. Z.: Quantification of nitroaromatic compounds in atmospheric fine particulate matter in Hong Kong over 3 years: field measurement evidence for secondary formation derived from biomass burning emissions, Environ. Chem., 13, 665–673, https://doi.org/10.1071/EN15174, 2016.
Compernolle, S., Ceulemans, K., and Müller, J.-F.: EVAPORATION: a new vapour pressure estimation methodfor organic molecules including non-additivity and intramolecular interactions, Atmos. Chem. Phys., 11, 9431–9450, https://doi.org/10.5194/acp-11-9431-2011, 2011.
Coppens, P. and Schmidt, G. M. J.: X-ray diffraction analysis of o-nitrobenzaldehydes, Acta Crystallogr., 17, 222–228, https://doi.org/10.1107/S0365110X64000585, 1964.
Dang, C., Bannan, T., Shelley, P., Priestley, M., Worrall, S. D., Waters, J., Coe, H., Percival, C. J., and Topping, D.: The effect of structure and isomerism on the vapour pressures of organic molecules and its potential atmospheric relevance, Aerosol Sci. Technol., 53, 1–32, https://doi.org/10.1080/02786826.2019.1628177, 2019.
Davis, E. J., Buehler, M. F., and Ward, T. L.: The double-ring electrodynamic balance for microparticle characterization, Rev. Sci. Instrum., 61, 1281, https://doi.org/10.1063/1.1141227, 1990.
Dewar, M. J. S. and Thiel, W.: A semiempirical model for the two-center repulsion integrals in the NDDO approximation, Theor. Chim. Acta, 46, 89–104, https://doi.org/10.1007/BF00548085, 1977.
Duporté, G., Parshintsev, J., Barreira, L. M. F., Hartonen, K., Kulmala, M., and Riekkola, M.-L.: Nitrogen-Containing Low Volatile Compounds from Pinonaldehyde-Dimethylamine Reaction in the Atmosphere: A Laboratory and Field Study, Environ. Sci. Technol., 50, 4693–4700, https://doi.org/10.1021/acs.est.6b00270, 2016.
Engwerda, A. H. J., Brugman, S. J. T., Tinnemans, P., and Vlieg, E.: 3-Nitrobenzaldehyde, IUCrData, 3, x180092, https://doi.org/10.1107/S2414314618000925, 2018.
Ervens, B., Turpin, B. J., and Weber, R. J.: Secondary organic aerosol formation in cloud droplets and aqueous particles (aqSOA): a review of laboratory, field and model studies, Atmos. Chem. Phys., 11, 11069–11102, https://doi.org/10.5194/acp-11-11069-2011, 2011.
Grant, D. J. W., Mehdizadeh, M., Chow, A. H.-L., and Fairbrother, J. E.: Non-linear van't Hoff solubility-temperature plots and their pharmaceutical interpretation, Int. J. Pharm., 18, 25–38, https://doi.org/10.1016/0378-5173(84)90104-2, 1984.
Grosjean, D.: In situ organic aerosol formation during a smog episode: Estimated production and chemical functionality, Atmos. Environ. A-Gen., 26, 953–963, https://doi.org/10.1016/0960-1686(92)90027-I, 1992.
Hallquist, M., Wenger, J. C., Baltensperger, U., Rudich, Y., Simpson, D., Claeys, M., Dommen, J., Donahue, N. M., George, C., Goldstein, A. H., Hamilton, J. F., Herrmann, H., Hoffmann, T., Iinuma, Y., Jang, M., Jenkin, M. E., Jimenez, J. L., Kiendler-Scharr, A., Maenhaut, W., McFiggans, G., Mentel, Th. F., Monod, A., Prévôt, A. S. H., Seinfeld, J. H., Surratt, J. D., Szmigielski, R., and Wildt, J.: The formation, properties and impact of secondary organic aerosol: current and emerging issues, Atmos. Chem. Phys., 9, 5155–5236, https://doi.org/10.5194/acp-9-5155-2009, 2009.
Hinds, W. C.: Aerosol Technology: Properties, Behavior, and Measurement of airborne Particles, in: Aerosol Technology: Properties, Behavior, and Measurement of airborne Particles, John Wiley & Sons, New York, USA, p. 504, 1999.
Huisman, A. J., Krieger, U. K., Zuend, A., Marcolli, C., and Peter, T.: Vapor pressures of substituted polycarboxylic acids are much lower than previously reported, Atmos. Chem. Phys., 13, 6647–6662, https://doi.org/10.5194/acp-13-6647-2013, 2013.
Joback, K. G., Reid, R. C., and Reid, C.: Estimation Of Pure-Component Properties From Group-Contributions, Chem. Eng. Commun., 157, 233–243, https://doi.org/10.1080/00986448708960487, 1987.
King Jr., J. A. and Bryant Jr., G. L.: p-Nitrobenzaldehyde, Acta Crystallogr. C, 52, 1691–1693, https://doi.org/10.1107/S0108270196001254, 1996.
Kitanovski, Z., Grgić, I., Vermeylen, R., Claeys, M., and Maenhaut, W.: Liquid chromatography tandem mass spectrometry method for characterization of monoaromatic nitro-compounds in atmospheric particulate matter, J. Chromatogr. A, 1268, 35–43, https://doi.org/10.1016/J.CHROMA.2012.10.021, 2012.
Kovacic, P. and Somanathan, R.: Nitroaromatic compounds: Environmental toxicity, carcinogenicity, mutagenicity, therapy and mechanism, J. Appl. Toxicol., 34, 810–824, https://doi.org/10.1002/jat.2980, 2014.
Krieger, U. K., Siegrist, F., Marcolli, C., Emanuelsson, E. U., Gøbel, F. M., Bilde, M., Marsh, A., Reid, J. P., Huisman, A. J., Riipinen, I., Hyttinen, N., Myllys, N., Kurtén, T., Bannan, T., Percival, C. J., and Topping, D.: A reference data set for validating vapor pressure measurement techniques: homologous series of polyethylene glycols, Atmos. Meas. Tech., 11, 49–63, https://doi.org/10.5194/amt-11-49-2018, 2018.
Kroll, J. H. and Seinfeld, J. H.: Chemistry of secondary organic aerosol: Formation and evolution of low-volatility organics in the atmosphere, Atmos. Environ., 42, 3593–3624, https://doi.org/10.1016/j.atmosenv.2008.01.003, 2008.
Kurtén, T., Tiusanen, K., Roldin, P., Rissanen, M., Luy, J.-N., Boy, M., Ehn, M., and Donahue, N.: α-Pinene Autoxidation Products May Not Have Extremely Low Saturation Vapor Pressures Despite High O : C Ratios, J. Phys. Chem. A, 120, 2569–2582, https://doi.org/10.1021/acs.jpca.6b02196, 2016.
Lee-Taylor, J., Madronich, S., Aumont, B., Baker, A., Camredon, M., Hodzic, A., Tyndall, G. S., Apel, E., and Zaveri, R. A.: Explicit modeling of organic chemistry and secondary organic aerosol partitioning for Mexico City and its outflow plume, Atmos. Chem. Phys., 11, 13219–13241, https://doi.org/10.5194/acp-11-13219-2011, 2011.
Mauger, J. W., Paruta, A. N., and Gerraughty, R. J.: Solubilities of Sulfadiazine, Sulfisomidine, and Sulfadimethoxine in Several Normal Alcohols, J. Pharm. Sci., 61, 94–97, https://doi.org/10.1002/JPS.2600610117, 1972.
Moller, B., Rarey, J., and Ramjugernath, D.: Estimation of the vapour pressure of non-electrolyte organic compounds via group contributions and group interactions, J. Mol. Liq., 143, 25–63, https://doi.org/10.1016/j.molliq.2008.04.020, 2008.
Monte, M. J. S., Hillesheim, D. M., Monte, M. J. S., and Hillesheim, D. M.: Thermodynamic study on the sublimation of six methylnitrobenzoic acids, J. Chem. Thermodyn., 33, 103–112, https://doi.org/10.1006/jcht.2000.0729, 2001.
Myrdal, P. B. and Yalkowsky, S. H.: Estimating Pure Component Vapor Pressures of Complex Organic Molecules, Ind. Eng. Chem. Res., 36, 2494–2499, 1997.
Nannoolal, Y., Rarey, J., Ramjugernath, D., and Cordes, W.: Estimation of pure component properties Part 1. Estimation of the normal boiling point of non-electrolyte organic compounds via group contributions and group interactions, Fluid Phase Equilibr., 226, 45–63, https://doi.org/10.1016/j.fluid.2004.09.001, 2004.
Nannoolal, Y., Rarey, J., and Ramjugernath, D.: Fluid Phase Equilibria Estimation of pure component properties Part 3. Estimation of the vapor pressure of non-electrolyte organic compounds via group contributions and group interactions, Fluid Phase Equilibr., 269, 117–133, https://doi.org/10.1016/j.fluid.2008.04.020, 2008.
O'Meara, S., Booth, A. M., Barley, M. H., Topping, D., and Mcfiggans, G.: An assessment of vapour pressure estimation methods, Phys. Chem. Chem. Phys., 16, 19453–19469, https://doi.org/10.1039/c4cp00857j, 2014.
Ouellette, R. J., Rawn, J. D., Ouellette, R. J., and Rawn, J. D.: Aromatic Compounds, Princ. Org. Chem., 133–162, https://doi.org/10.1016/B978-0-12-802444-7.00005-7, 2015a.
Ouellette, R. J., Rawn, J. D., Ouellette, R. J., and Rawn, J. D.: Carboxylic Acids and Esters, Princ. Org. Chem., 287–314, https://doi.org/10.1016/B978-0-12-802444-7.00011-2, 2015b.
Pankow, J. F. and Asher, W. E.: SIMPOL.1: a simple group contribution method for predicting vapor pressures and enthalpies of vaporization of multifunctional organic compounds, Atmos. Chem. Phys., 8, 2773–2796, https://doi.org/10.5194/acp-8-2773-2008, 2008.
Perry, R. H., Green, D. W., and Maloney, J. O.: Perry's Chemical engineers' handbook, 6th ed., McGraw-Hill, New York, USA, 1984.
Pöschl, U.: Atmospheric Aerosols: Composition, Transformation, Climate and Health Effects, Angew. Chem. Int. Edit., 44, 7520–7540, https://doi.org/10.1002/anie.200501122, 2005.
Prausnitz, J., Lichtenthaler, R., and Azevedo, E. de: Molecular thermodynamics of fluid-phase equilibria, Pearson Education, Upper Saddle River, USA, 1998.
Ribeiro da Silva, M. A. V., Reis, A. M. M. V., Monte, M. J. S., Bártolo, M. M. S. S. F., and Rodrigues, J. A. R. G. O.: Enthalpy of combustion, vapour pressures, and enthalpy of sublimation of 3-nitrophenol, J. Chem. Thermodyn., 24, 653–659, https://doi.org/10.1016/S0021-9614(05)80037-0, 1992.
Ribeiro Da Silva, M. A. V, Agostinha, M., Matos, R., Monte, M. J. S., Hillesheim, D. M., Marques, M. C. P. O., and Vieira, N. F. T. G.: Enthalpies for combustion, vapour pressures, and enthalpies of sublimation of three methoxy-nitrobenzoic acids. Vapour pressures and enthalpies of sublimation of the three nitrobenzoic acids, J. Chem. Thermodyn., 31, 1429–1441, 1999.
Schummer, C., Groff, C., Al Chami, J., Jaber, F., and Millet, M.: Analysis of phenols and nitrophenols in rainwater collected simultaneously on an urban and rural site in east of France, Sci. Total Environ., 407, 5637–5643, https://doi.org/10.1016/J.SCITOTENV.2009.06.051, 2009.
Schwarzenbach, R. P., Stierli, R., Folsom, B. R., and Zeyer, J.: Compound Properties Relevant for Assessing the Environmental Partitioning of Nitrophenols, Environ. Sci. Technol, 22, 83–92, 1988.
Shelley, P. D., Bannan, T. J., Worrall, S. D., Alfarra, M. R., Krieger, U. K., Percival, C. J., Garforth, A., and Topping, D.: PetrocShelley/Measured-solid-state-and-sub-cooled-liquid-vapour-pressures-of-nitroaromatics-Supplementary-material, Zenodo, https://doi.org/10.5281/zenodo.3625641, 2020a.
Shelley, P. D., Bannan, T. J., Worrall, S. D., Alfarra, M. R., Krieger, U. K., Percival, C. J., Garforth, A., and Topping, D.: Measured solid state and sub cooled liquid vapour pressures of nitroaromatics using KEMS dataset, Zenodo, https://doi.org/10.5281/zenodo.3613581, 2020b.
Shiraiwa, M., Zuend, A., Bertram, A. K., and Seinfeld, J. H.: Gas–particle partitioning of atmospheric aerosols: interplay of physical state, non-ideal mixing and morphology, Phys. Chem. Chem. Phys., 15, 11441, https://doi.org/10.1039/c3cp51595h, 2013.
Shugrue, C. R., Defrancisco, J. R., Metrano, A. J., Brink, B. D., Nomoto, R. S., and Linton, B. R.: Detection of weak hydrogen bonding to fluoro and nitro groups in solution using H/D exchange, Org. Biomol. Chem., 14, 2223, https://doi.org/10.1039/c5ob02360b, 2016.
Smith, J. N., Dunn, M. J., VanReken, T. M., Iida, K., Stolzenburg, M. R., McMurry, P. H., and Huey, L. G.: Chemical composition of atmospheric nanoparticles formed from nucleation in Tecamac, Mexico: Evidence for an important role for organic species in nanoparticle growth, Geophys. Res. Lett., 35, L04808, https://doi.org/10.1029/2007GL032523, 2008.
Stein, S. E. and Brown, R. L.: Estimation of Normal Boiling Points from Group Contributions, J. Chem. Inf. Comput. Sci, 34, 581–587, 1994.
Stewart, J. J.: MOPAC2016, Stewart Comput. Chem., available at: http://openmopac.net (last access: 20 January 2020), 2016.
van Pinxteren, D. and Herrmann, H.: Determination of functionalised carboxylic acids in atmospheric particles and cloud water using capillary electrophoresis/mass spectrometry, J. Chromatogr. A, 1171, 112–123, https://doi.org/10.1016/J.CHROMA.2007.09.021, 2007.
Zardini, A. A. and Krieger, U. K.: Evaporation kinetics of a non-spherical, levitated aerosol particle using optical resonance spectroscopy for precision sizing, Opt. Express, 17, 4659, https://doi.org/10.1364/OE.17.004659, 2009.
Zardini, A. A., Krieger, U. K., and Marcolli, C.: White light Mie resonance spectroscopy used to measure very low vapor pressures of substances in aqueous solution aerosol particles, Opt. Express, 14, 6951, https://doi.org/10.1364/OE.14.006951, 2006.