the Creative Commons Attribution 4.0 License.
the Creative Commons Attribution 4.0 License.
 | 02 Jul 2020
Effects of atmospheric circulations on the interannual variation in PM2.5 concentrations over the Beijing–Tianjin–Hebei region in 2013–2018
Renhe Zhang
The Chinese government has made many efforts to mitigate fine particulate matter pollution in recent years by taking strict measures on air pollutant reduction, which has generated the nationwide improvements in air quality since 2013. However, under the stringent air pollution controls, how the wintertime PM2.5 concentration (i.e., the mass concentration of atmospheric particles with diameters less than 2.5 µm) varies and how much the meteorological conditions contribute to the interannual variations in PM2.5 concentrations are still unclear, and these very important for the local government to assess the emission reduction of the previous year and adjust mitigation strategies for the next year. The effects of atmospheric circulation on the interannual variation in wintertime PM2.5 concentrations over the Beijing–Tianjin–Hebei (BTH) region in the period of 2013–2018 are evaluated in this study. Generally, the transport of clean and dry air masses and an unstable boundary layer in combination with the effective near-surface horizontal divergence or pumping action at the top of the boundary layer benefits the horizontal or vertical diffusion of surface air pollutants. Instead, the co-occurrence of a stable boundary layer, frequent air stagnation, positive water vapor advection and deep near-surface horizontal convergence exacerbate the wintertime air pollution. Favorable circulation conditions lasting for 2–4 d are beneficial for the diffusion of air pollutants, and 3–7 d of unfavorable circulation events exacerbates the accumulation of air pollutants. The occurrence frequency of favorable circulation events is consistent with the interannual variation in seasonal mean PM2.5 concentrations. There is better diffusion ability in the winters of 2014 and 2017 than in other years. A 59.9 % observed decrease in PM2.5 concentrations in 2017 over the BTH region could be attributed to the improvement in atmospheric diffusion conditions. It is essential to exclude the contribution of meteorological conditions to the variation in interannual air pollutants when making a quantitative evaluation of emission reduction measurements.
- Article
(8173 KB) - Full-text XML
-
Supplement
(7386 KB) - BibTeX
- EndNote


Rapid economic development and associated emissions have led to recent severe air pollution over China, which has become a central issue of concern for the public and governments (Mu and Zhang, 2014; Song et al., 2018; Tao et al., 2018; Wang et al., 2018b, 2015; Zhang et al., 2014; Zhao and Garrett, 2015). High levels of fine particulate matter (PM2.5) concentrations influence people's daily lives and threaten public health (Liu et al., 2019; B. Zhao et al., 2018; Hong et al., 2019; Zhang et al., 2017; Hu et al., 2019). In addition, they are efficient in scattering and absorbing solar radiation and are involved in climate change by changing the surface energy budget (Bi et al., 2016; S. Chen et al., 2019; Che et al., 2019; Feng and Wang, 2019; Y. He et al., 2018; Li et al., 2018; Jian et al., 2018; Wang et al., 2009, 2018a; Yang et al., 2018; Zhao et al., 2019c). To mitigate PM2.5 pollution, the Chinese government issued the Air Pollution Prevention and Control Action Plan (hereinafter referred to as the Clean Air Plan) in 2013, which required the Beijing–Tianjin–Hebei (BTH) region, Yangtze River Delta and Pearl River Delta to reduce their PM2.5 concentrations by 15 %–25 % from 2013 to 2017 (China's State Council, 2013). A series of stringent clean air plans was implemented to improve air quality, including improving industrial emission standards, phasing out small and polluting factories, strengthening vehicle emission standards and more (Zhao et al., 2019b; Zhang and Geng, 2019). To further improve air quality, the state council released a 3-year plan to win the battle for a blue sky in 2018, solidifying a timetable and roadmap for improving air quality. By 2020, emissions of sulfur dioxide and nitrogen oxides are required to decline by at least 15 % from 2015 levels, while cities with low air quality standards should see their PM2.5 density fall by at least 18 %, according to the plan (China's State Council, 2018). To achieve these goals, many efforts have focused on adjustments to industrial, energy and transportation structures involved with central to local government.
With the implementation of the toughest-ever clean air plans from the Clean Air Plan, the anthropogenic emissions show significant decreases of 59 % for SO2, 21 % for NOx, 23 % for CO, 36 % for PM10 and 33 % for primary PM2.5 from 2013 to 2017 (Zheng et al., 2018; Y. Wang et al., 2019; Zhang et al., 2020). As a consequence, air quality in China improved significantly in terms of annual mean PM2.5 concentrations, polluted days and pollution durations from 2013 to 2017, and the mitigation targets of the Clean Air Plan were surpassed (Fan et al., 2020; Gui et al., 2019; H. Zhao et al., 2018; Zhong et al., 2018; K. Zhang et al., 2019). By the end of 2017, the BTH region achieved its primary goal of reducing the annual average PM2.5 concentration to less than 60 µg m−3 with a decreasing trend of µg m−3 (Y. Wang et al., 2019). However, in addition to air pollutant emissions, atmospheric meteorological conditions play an important role in the long-range transport, accumulation, vertical diffusion, scavenging and chemical production of particles, which drive the evolution of every air pollution episode (Leung et al., 2018; Huang et al., 2018; Sun et al., 2019; Garrett et al., 2010; Wang et al., 2016; Wang and Wang, 2016; Zhang et al., 2012; C. Zhao et al., 2018). Moreover, the interannual to interdecadal variations in meteorological or climate signals (e.g., monsoon intensity, variation in sea ice, and the occurrence of El Niño–Southern Oscillation (ENSO) and North Atlantic Oscillation (NAO)) also have significant effects on the variation in ambient PM2.5 concentrations (H. Chen et al., 2019; Chen and Wang, 2015; Dang and Liao, 2019; Feng et al., 2019; Li et al., 2016; Yin et al., 2019, 2017; S. Zhao et al., 2018; Y. Chen et al., 2019). The global warming associated with climate change may also contribute to the air pollution in China (Cai et al., 2017; Zhang, 2017).
Recently, many researchers investigated how much of the recent decreased PM2.5 concentrations could be attributed to the contribution from emission reduction compared to the effects of atmospheric elements. The studies were carried out to evaluate the relative effects of emission reduction and meteorological conditions on the recent decrease in PM2.5 concentrations (Ding et al., 2019; Guo et al., 2019; J. He et al., 2018; Y. Zhang et al., 2019; Zhao et al., 2019a). Based on a multiple linear regression model, 12 % of the decreased PM2.5 over China is due to favorable meteorological conditions between 2013 and 2018 (Zhai et al., 2019). For the BTH region, X. Zhang et al. (2019) used the parameter linking air quality and meteorology (PLAM) index (a meteorological pollution index for air quality) to evaluate meteorological conditions and found that only approximately 5 % of the 39.6 % reduction in PM2.5 in 2017 could be attributed to meteorological changes. The relative contribution of emission reduction to the decreased PM2.5 concentrations in Beijing calculated by the statistical model and Weather Research and Forecasting-Community Multiscale Air Quality (WRF-CMAQ) was 80 %, indicating that emission reductions were crucial for air quality improvement in Beijing from 2013 to 2017 (Z. Chen et al., 2019). In addition, Q. Zhang et al. (2019) quantified the contribution of different emission control policies to the rapid improvement in PM2.5 pollution over China from 2013 to 2017 and highlighted the significant effects of strengthening industrial emission standards and upgrading industrial boilers on air quality improvement during the Clean Air Plan.
Based on the investigation of different methods, the effectiveness of emission mitigation plans was confirmed to drive the recent remarkable improvement in air quality in China since 2013. However, most of the existing studies have focused on the relative long-term variation of air quality (i.e., 5 to 6 years since 2013) and evaluated emission reduction effects over a multiyear timescale. The Chinese government took a series of steps to reduce air pollutant emissions, which requires a certain sacrifice regarding economic growth. In this situation, the local government need an accurate evaluation of the emission reduction effects during the previous year and reasonable adjustment of the mitigation policies of next year to maintain the balance of economic growth and environmental protection. The accurate evaluation of emission reduction effects should exclude the meteorological element contribution to the interannual variations of air quality. China's air quality shows obvious seasonal and regional distributions, with more frequent severe air pollution episodes in wintertime and higher air pollutant concentrations in eastern China. As one of the three key regions in the Clean Air Plan, many mitigation measurements have been taken over BTH region in recent years, which results in the significant improvement of local air quality, especially in wintertime. But the relative contribution from meteorological factors is still unclear. Therefore, the contribution of meteorological conditions to the interannual variation in wintertime PM2.5 concentrations over the BTH region will be discussed in this study.
2.1 On-site PM2.5 mass concentration
The wintertime (December to February of the following year) hourly observed PM2.5 mass concentration dataset over China from 2013 to 2018 was provided by the Ministry of Ecology and Environment of the People's Republic of China (http://106.37.208.233:20035, last access: 25 June 2020). This study mainly focuses on the BTH region (113.5–119∘ E and 36–42.5∘ N, the solid-line box in Fig. 2), and 114 PM2.5 stations are available in this region. Daily PM2.5 data are set as missing when the valid hourly data on the specific day make up less than 40 % of the total data.
2.2 Method of atmospheric circulation classification
Commonly used objective classification methods include correlation, clustering, nonlinear methods, principal component analysis (PCA) and fuzzy analysis. Huth et al. (2008) compared these five classification methods and proposed that the performance of the T-mode PCA was the best in terms of its reproduction of predefined types, temporal and spatial stabilities, and reduced dependence on preset parameters. In this model, the input data matrix is spatially and temporally two-dimensional: the rows represent spatial grids, and the columns are time series. The data are divided into 10 subsets to speed up computations, the principal components (PCs) are achieved using the singular value decomposition for each subset, and an oblique rotation is applied to the PCs to achieve better classification effects. Then, a chi-square test is used to evaluate the 10 classifications based on the subsets and the subset with the highest sum is chosen and assigned to a type. The T-mode PCA has been successfully applied to studies of general circulation models (Huth, 2000), climate change (Cavazos, 2000) and local air pollution (Xu et al., 2016; Valverde et al., 2015; Miao et al., 2017; Li et al., 2019). Zhang et al. (2012) first employed the obliquely rotated T-mode PCA method developed by European Cooperation in Science & Technology (COST) plan 733 (http://cost733.geo.uni-augsburg.de/cost733wiki, last access: 25 June 2020) (Philipp et al., 2014) to identify the circulation pattern that is conducive to particulate matter pollution in northern China. In this study, the four-times-daily dataset of the fifth-generation European Centre for Medium-Range Weather Forecasts (ECMWF ERA5) atmospheric reanalysis in winters from 2013 to 2018 with a horizontal resolution of 0.25∘ was used for synoptic circulation classification. The daily mean geopotential height fields at 925, 850 and 500 hPa were applied to the T-mode PCA method in the Cost733 toolbox. Our target region is 30–55∘ N and 105–125∘ E (the dashed box in Fig. 3). Prior to using Cost733, the number of principal components need to be defined manually. To exclude the influences of various number of principal components, sensitivity tests with principal components from 2 to 10 are conducted in this study, the explained variances of which are shown in Fig. S1 in the Supplement.
2.3 Model simulation
The regional chemical transport model WRF chemical model (WRF-Chem) version 4.0 was applied to simulate the effects of meteorological condition variation on seasonal air pollution over northern China at a horizontal resolution of 9 km (245×220 horizontal grid cells) and vertical resolution of 33 layers. The simulation domain covers most areas of the northern China region (Fig. 10). The initial and lateral meteorological boundary conditions are derived from the National Centers for Environmental Prediction Final (NCEP FNL) reanalysis data every 6 h. The chemical and aerosol mechanisms used were the RADM2 chemical mechanism from Stockwell et al. (1990) and MADE/SORGAM aerosols (Ackermann et al., 1998; Schell et al., 2001). MADE/SORGAM aerosols are used to simulate all major aerosol components including sulfate, nitrate, ammonium, black carbon, organic carbon, sodium, chloride, mineral dust and water content. Madronich photolysis was used to calculate photochemical reactions. Other major physical processes included CAM shortwave radiation (Collins et al., 2004), RRTMG longwave radiation (Iacono et al., 2008), the unified Noah model land surface option and MYJ planetary boundary layer parameterization (Janjić, 1994). To consider the coupled effects of aerosol and meteorology, the parameterization of feedback from aerosol to radiation; feedback from convection to atmospheric radiation; and photolysis, wet scavenging and cloud chemistry are turned on in the simulation.
To evaluate the impacts of meteorological contributions on the PM2.5 variation between the 2016 winter (December 2016 to February 2017) and 2017 winter (December 2017 to February 2018) over the BTH region, we conducted two sensitivity runs: the same emissions as the 2016 winter and the actual meteorological conditions of 2016 and 2017. Thus, the difference in the simulated PM2.5 concentrations between the 2016 and 2017 winters could be attributed to the meteorological variation, which can be assumed as a typical value of meteorological contribution to the interannual variation of PM2.5 concentrations. The anthropogenic emission inventory for 2016 developed by Tsinghua University was used in this study (available at http://www.meicmodel.org, last access: 25 June 2020), named the Multiresolution Emission Inventory for China (MEIC), which contains monthly anthropogenic emissions of SO2, NOx, CO, NH3, PM2.5, PMcoarse, BC, OC and NMVOCs. The horizontal resolution of the MEIC used in this study is 0.25∘. Each simulation is initialized at 00:00 UTC on 23 November, and the first week of simulations is regarded as the spin-up period. Daily mean PM2.5 concentrations between 1 December 2016 and 28 February 2017 and between 1 December 2017 and 28 February 2018 are used to investigate the effects of meteorological conditions on seasonal air pollution.
3.1 Dominant synoptic circulation types in winter over the BTH region
As shown in Fig. 1, the wintertime PM2.5 concentrations over the BTH region show a remarkable decrease from 2013 to 2018 due to a series of air pollution reduction measures. Compared to 2013, the mean PM2.5 concentration for 2018 decreased by 35.6 % over 114 stations around the BTH region (see Table 1). However, under the background of improved air quality, evident interannual variations in PM2.5 concentrations have been observed in recent years. The PM2.5 concentrations in the winters of 2016 and 2018 are higher than those in the same period of the previous year, with mean values increasing by 18 % and 13.36 %, respectively. The high emissions of primary fine particulate matters and its precursors are considered as internal factors of severe PM2.5 pollution in China; thus, emission reduction is the most direct and effective way to improve local air quality. However, the evolution of each air pollution episode is strongly affected by the local synoptic circulation pattern. Both emissions and atmospheric conditions are related to the ambient PM2.5 concentration level. It is essential to exclude the atmospheric circulation impacts on air quality when assessing emission mitigation effects.
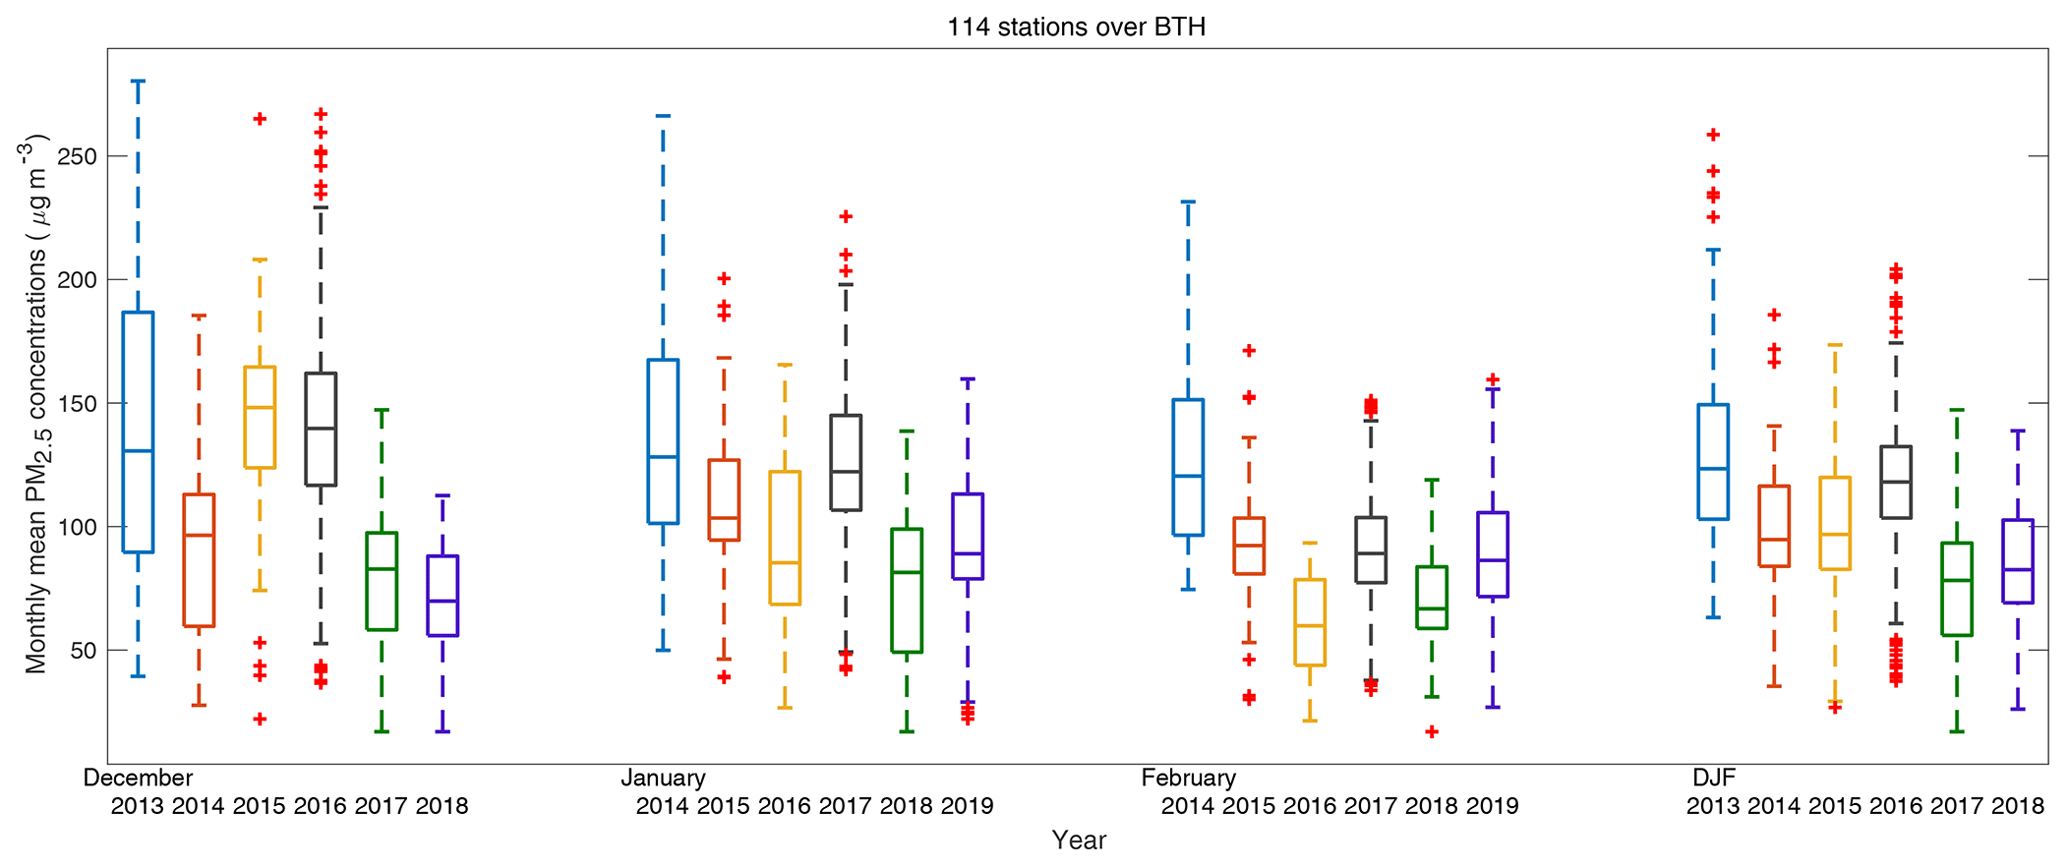
Figure 1Interannual variation in the wintertime PM2.5 concentrations at 114 stations over the BTH region. In each box, the central mark indicates the median, and the bottom and top edges of the box indicate the 25th and 75th percentiles, respectively. The whiskers extending to the most extreme data points are considered outliers. The region covered by the blue box in Fig. 2 is considered as the BTH region (36–42∘ N and 113–117.5∘ E).
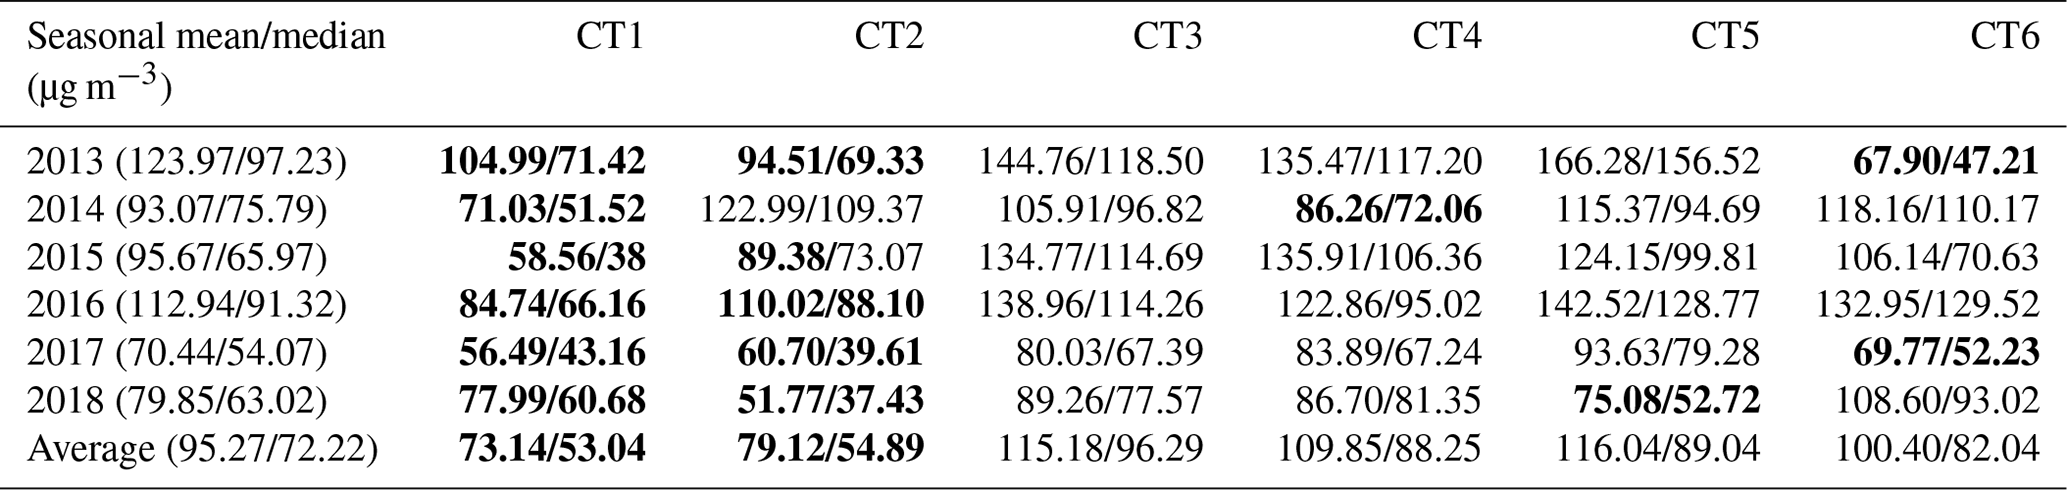
Table 1The seasonal mean and median PM2.5 concentrations in each atmospheric circulation type (CT) over the BTH region. PM2.5 concentrations in bold represent the mean/median value of each CT lower than the all-case seasonal mean/median value.
We use synoptic circulation types to measure the ability of atmospheric circulation to accumulate, remove and transport air pollutants. The daily mean geopotential height fields at 925, 800 and 500 hPa in the winters of 2013 to 2018 (a total of 451 d) are used to conduct objective synoptic circulation classification based on the T-mode PCA method with the Cost733 toolbox. Three levels of geopotential height fields (i.e., 925, 850 and 500 hPa) in the lower to middle troposphere over 105–125∘ E and 30–55∘ N are used in circulation type (CT) classification. Six typical synoptic CTs are identified during winter in the BTH region, with a total explained variance of 70 % (Fig. S1). The horizontal (i.e., sea level pressure (SLP), wind, relative humidity (RH) and boundary layer height (BLH)) and vertical (i.e., atmospheric stability, vertical velocity, temperature and divergence) distributions of meteorological variables are used to illustrate the mechanism behind CT effects on air pollution. To obtain a broad view of the six CTs, the horizontal distribution of atmospheric circulation patterns, as shown in Figs. 2 and 3, cover a larger area than the area used in the CT classification with the Cost733 toolbox.
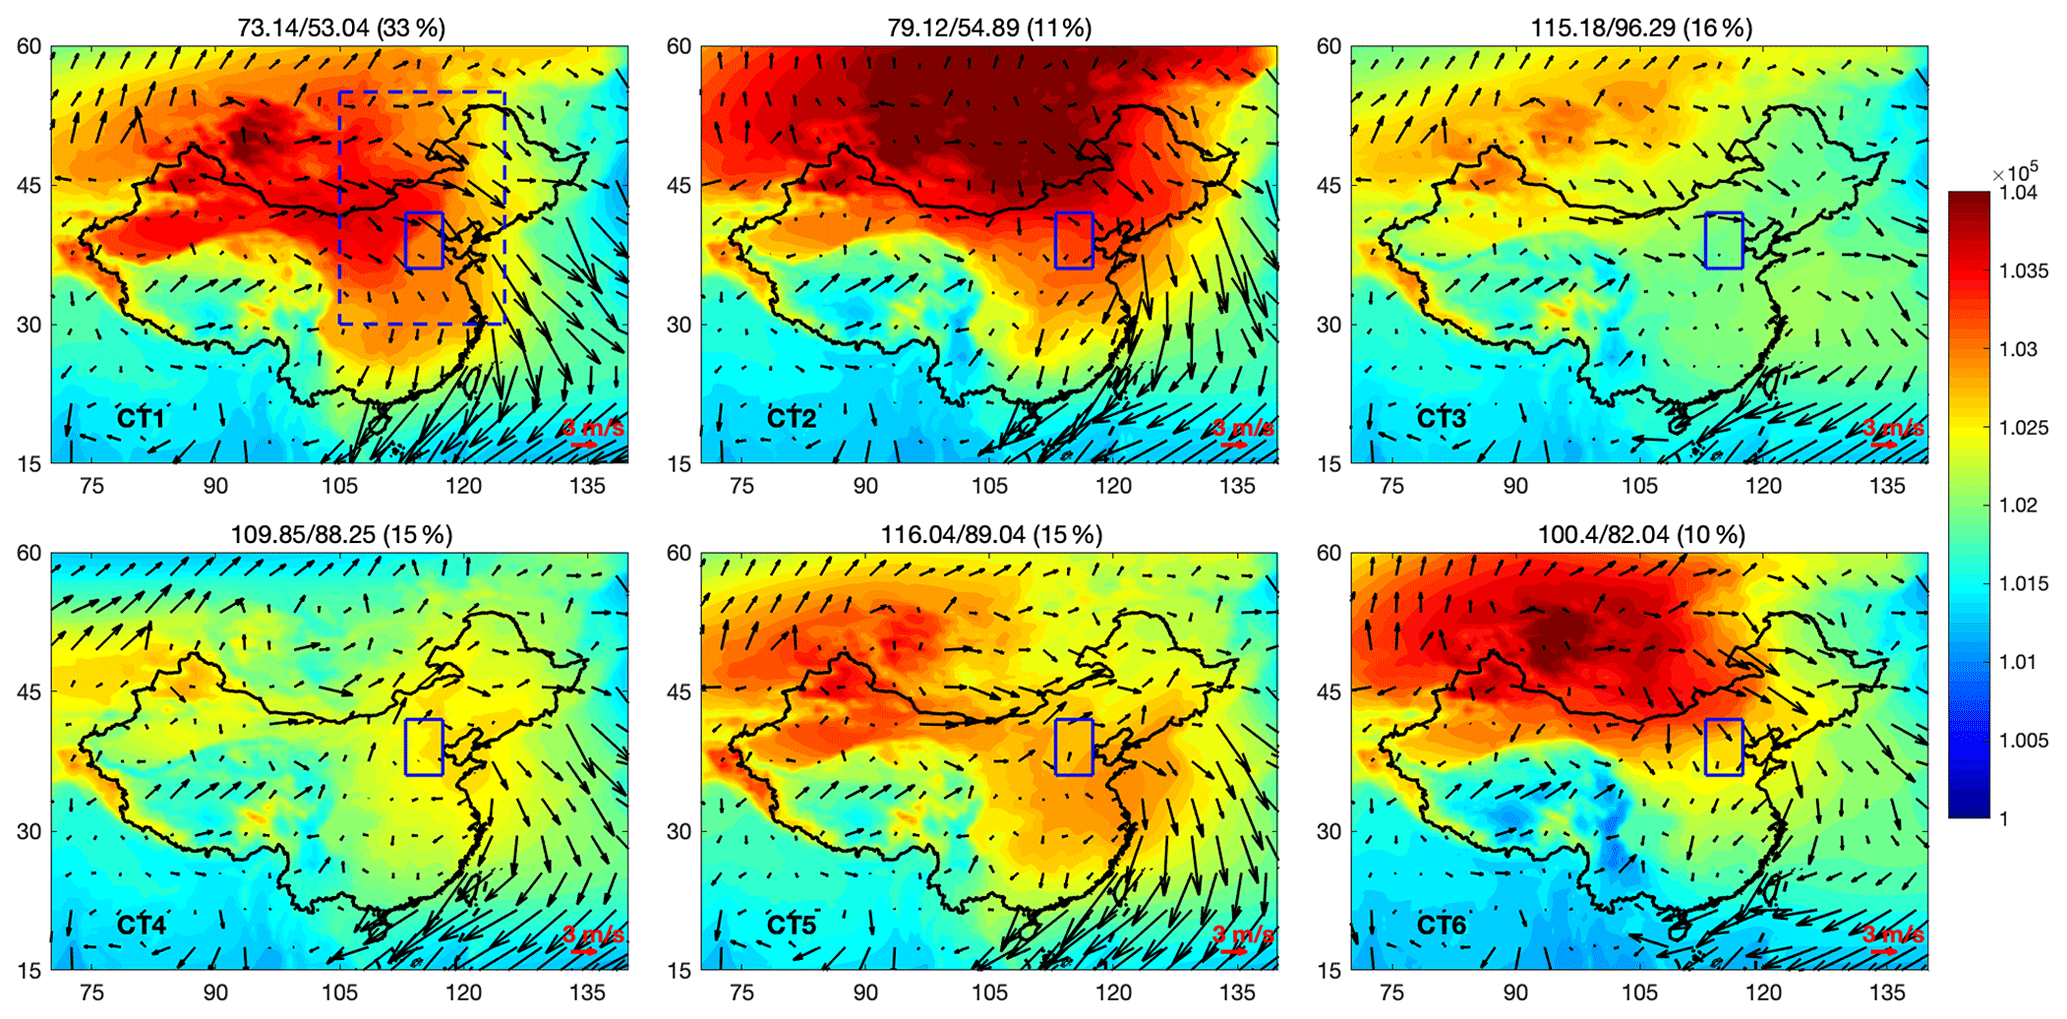
Figure 2The distribution of sea level pressure (shaded, unit: Pa) and 10 m wind fields (vector, unit: m s−1) in each circulation type. The number over each subplot indicates the occurrence frequency of the specific circulation type. The solid blue box is the location of the BTH region. The daily mean geopotential height fields at 925, 850 and 500 hPa over the dashed blue box (30–55∘ N and 105–125∘ E) were applied to the T-mode PCA method with the Cost733 toolbox. The region mean wind speed of each circulation type is shown in Table 2.
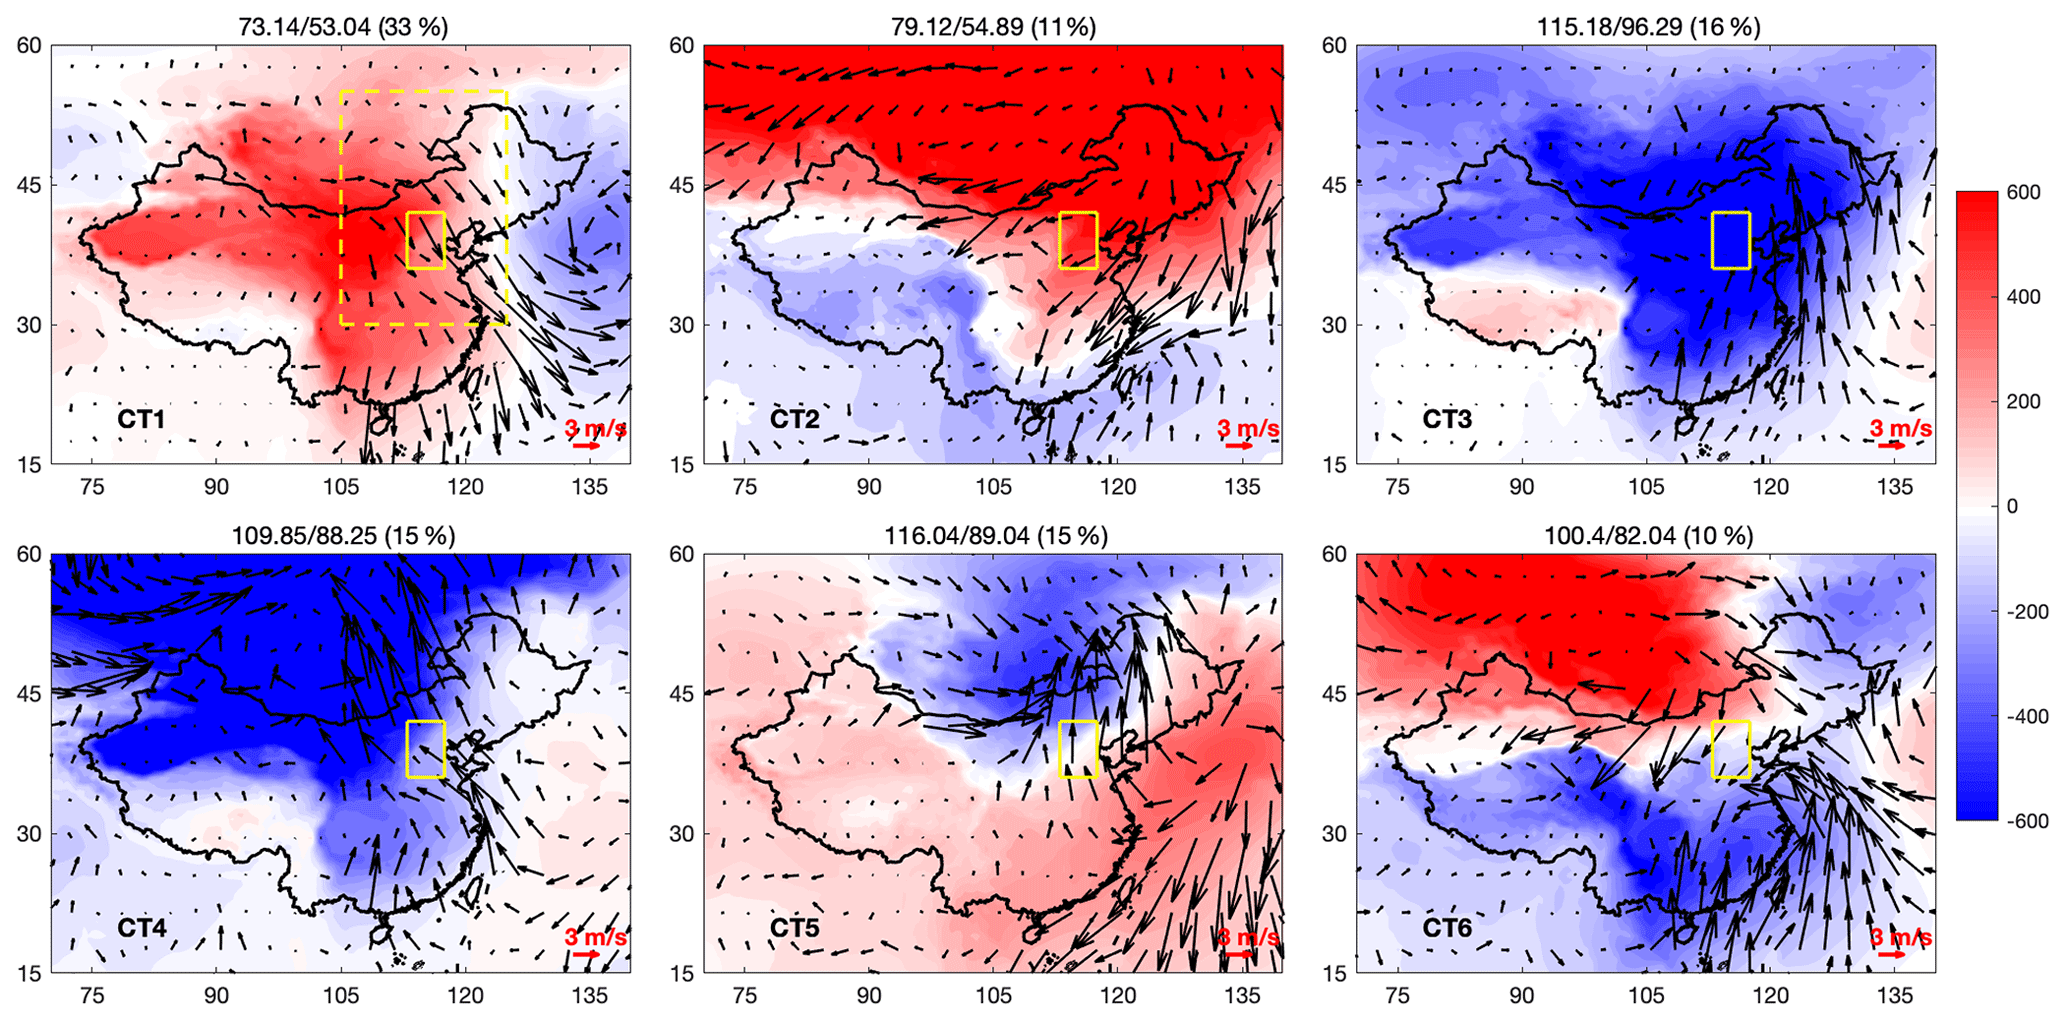
Figure 3The distribution of sea level pressure (unit: Pa) and 10 m wind field (unit: m s−1) anomalies in each circulation type. The anomaly values are with respect to the 1980–2010 mean. The regional mean wind speed anomaly of each circulation type is summarized in Table 2.
Table 2Regional mean meteorological variables over the BTH region under each circulation type.
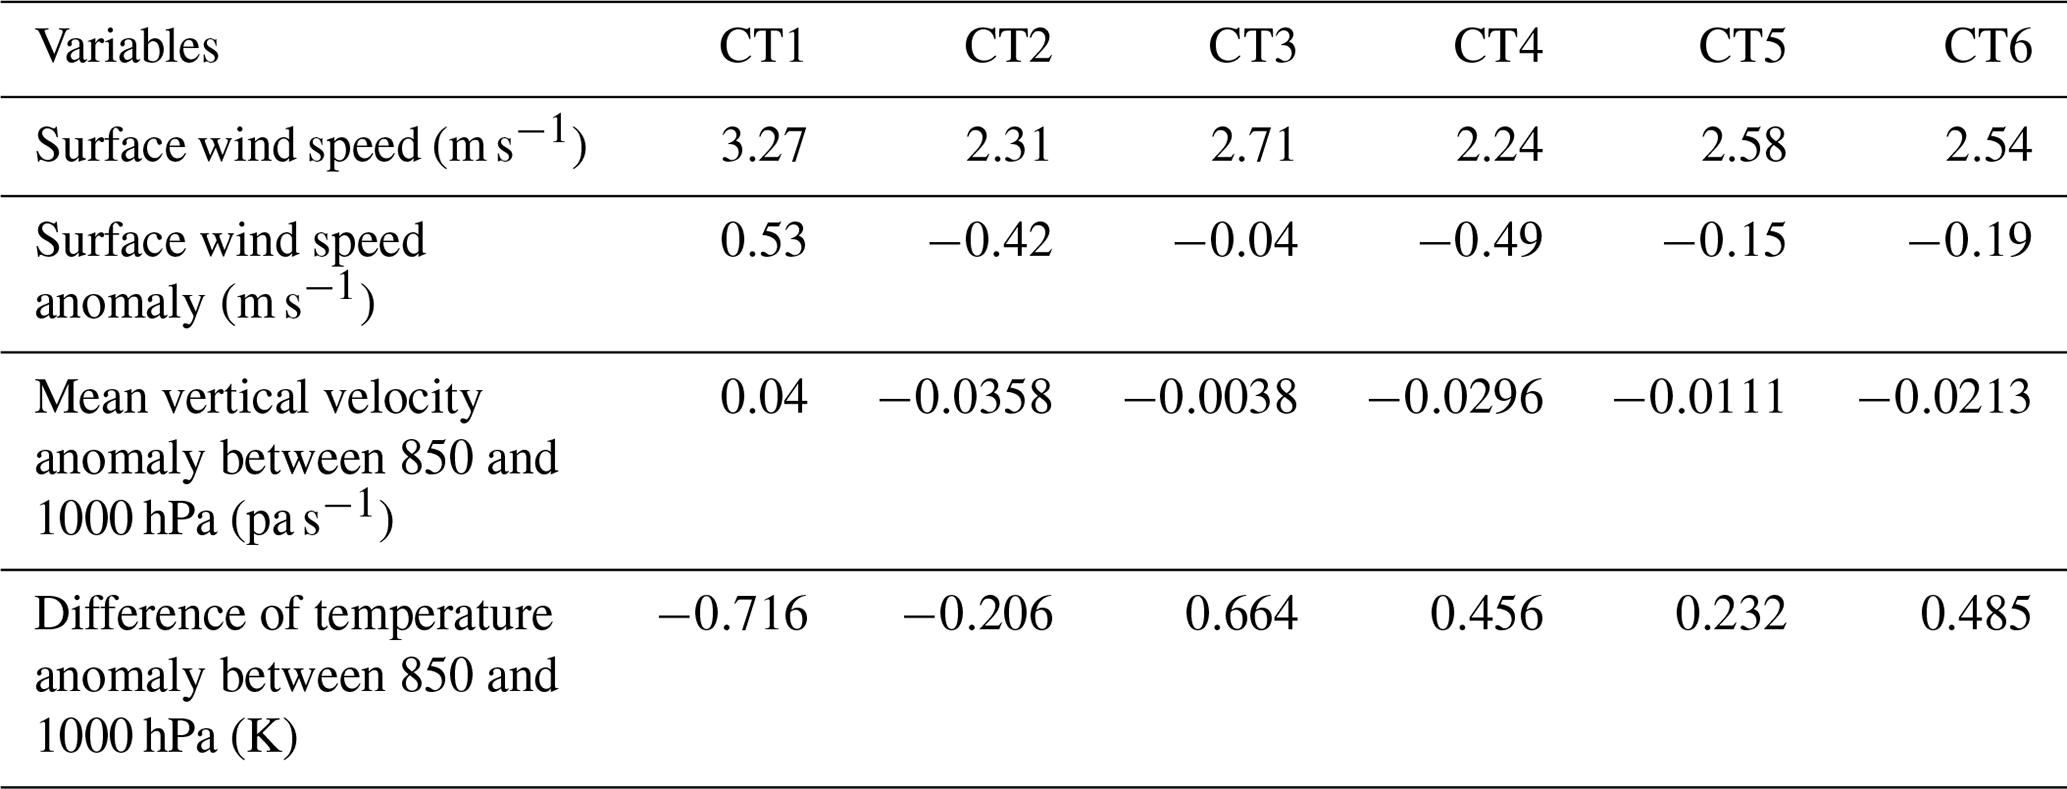
Figures 2 and 3 exhibit the original and anomalous patterns of the mean SLP and surface wind field of each CT, respectively. CT1 is the most frequent CT during the study period, with an occurrence frequency of 33 % based on the results of the Cost733 classification. CT1 shows that a high-pressure system originates in the Siberian region, extending along central Inner Mongolia to southern China. Northwesterly winds prevail in northern China and turn into northerly winds in southern China. The mean wind speed is 3.27 m s−1 over the BTH region (see Table 2), which is the highest among the six CTs and benefits the outward transport of local air pollutants. Figure 3 shows the SLP and surface wind anomalies of each CT. In the CT1 situation, the BTH region is located west of the cyclonic anomaly, which is dominated by an obvious northwesterly wind anomaly. The wind field pattern corresponds to the negative RH anomaly over the BTH region in Fig. 4. The vertical profiles of dynamic and thermodynamic stratification are included to investigate vertical diffusion. Based on the vertical distribution of atmospheric stability shown in Fig. 5, atmospheric stratification is characterized by a stable layer at the top of the boundary layer for all the cases. For CT1, an obvious unstable stratification occurs at the bottom of the boundary layer over the BTH region, which enhances the turbulent activities and is beneficial for the vertical diffusion of air pollutants. The unstable boundary layer is also confirmed by the positive BLH anomaly and elevated negative temperature anomaly, as shown in Figs. S2 and S3. Figure S4 shows a strong surface divergence and strong top convergence vertical pattern in CT1, which generates sinking movement over the BTH region. As shown in Fig. 6, a subsidence anomaly appears at the lower to middle troposphere over the BTH region with a mean descending velocity of 0.04 Pa s−1 between 850 and 1000 hPa. The strong downdraft brings a clean and dry air mass to the surface and increases the horizontal divergence of surface air pollutants (shown in Fig. S4). The cold, clean and dry air mass transported by the surface northwesterly winds, unstable boundary layer and strong horizontal divergence is favorable for the improvement in ambient air quality.

Figure 4The distribution of relative humidity in each circulation type (unit: %). The anomaly values are with respect to the 1980–2010 mean.
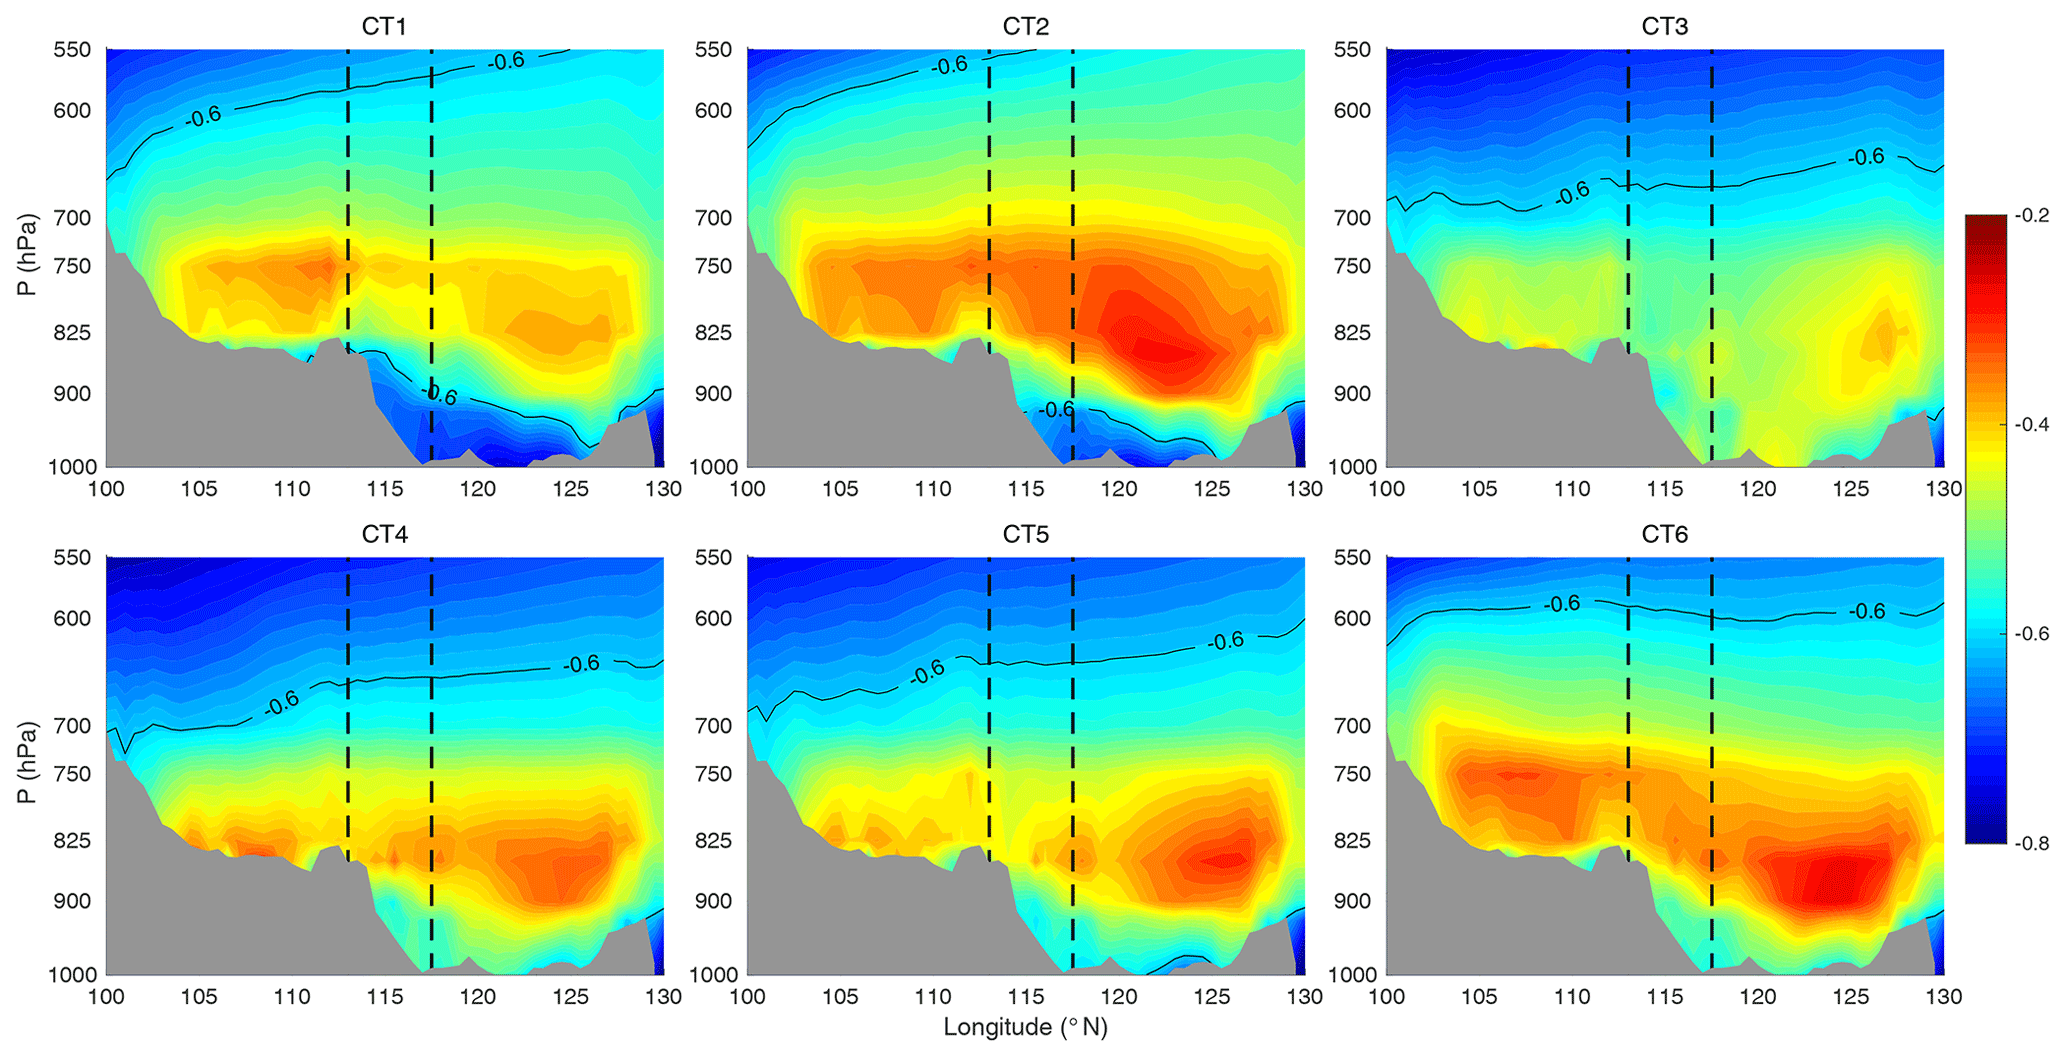
Figure 5Zonal profile of temperature lapse rate over the BTH region (36–42∘ N) (unit: K (100 m)−1). The gray region indicates the average altitude over 36–42∘ N. The region between the two dashed lines is the horizontal location of the BTH region (113–117.5∘ E).
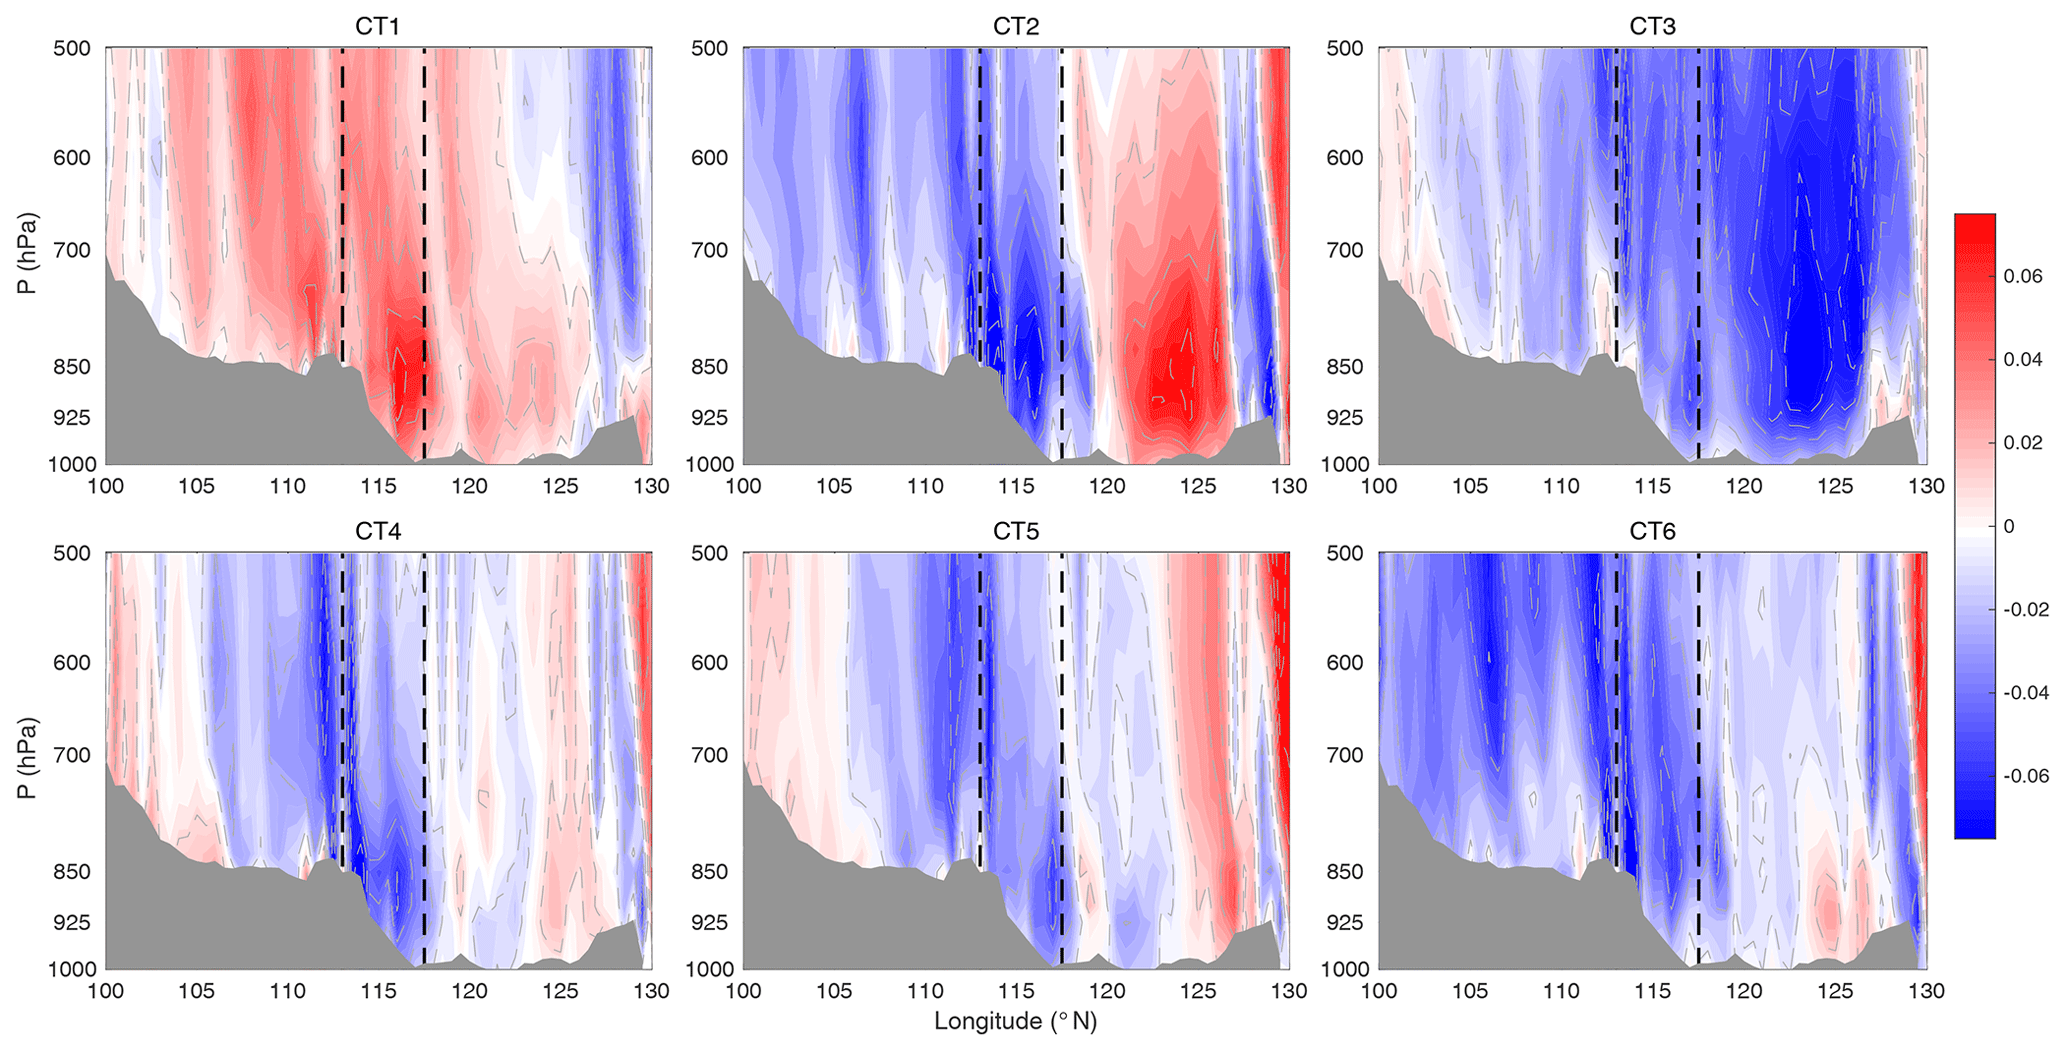
Figure 6Zonal vertical profile of vertical velocity anomaly over BTH region (unit: Pa s−1). The anomaly of the vertical velocities is with respect to the 1980 to 2010 mean value.
The occurrence frequency of CT2 is 11 %. As shown in Fig. 2, a high-pressure system around Baikal is obvious under the CT2 condition, which is stronger and further east than CT1. The BTH region is located at the ridge of the high-pressure system with weak northwesterly winds occurring in the northern BTH region, which turn to northeasterly in the southern BTH region. The anomalous fields in Fig. 3 show a large area of a positive SLP anomaly over the area north of 40∘ N. The BTH region is just located at the south edge of the anticyclone anomaly with prevailing northeasterly surface wind. Figure 4 shows a weak negative RH anomaly over the BTH region due to the dry wind from the northeast. Similar to CT1, CT2 also shows an unstable stratification in the boundary layer, which increases the vertical diffusion of air pollution. Both the weak positive BLH anomaly and elevated negative temperature anomaly indicate the enhanced instability of the atmospheric boundary layer (Figs. S2–S3). Intense updraft is stimulated by strong convergence at the surface working with strong divergence at the top of the boundary layer, as shown in Fig. S4. As shown in Fig. 6, upward movement dominates in the middle–low troposphere over the BTH region with a mean ascending velocity of 0.0358 Pa s−1 between 850 and 1000 hPa. Although the elevated temperature stability is relatively strong in CT2, the bottom-up updraft breaks through the stable layer and brings the surface air pollutants to the free atmosphere. In summary, the unstable boundary layer working with the upper divergence pumping action enhances the vertical diffusion of surface air pollutants, which will decrease the surface concentrations of air pollutant.
CT3 shows a relatively uniform SLP distribution with a weak pressure gradient over the BTH region as shown in Fig. 2. The prevailing westerly wind hinders the southward transport of the cold air mass to some extent. The cyclonic anomaly with southwesterly wind can be found over the BTH region. As shown in Fig. 3, the southwesterly wind transports the upstream air pollutants and warm moisture to the BTH, which accelerates the hygroscopic growth of particles, promotes the gas-to-particle transformation and increases the local air pollutant concentration (X. Wang et al., 2019). The positive RH and temperature anomaly in Figs. 4 and S3 correspond to the southwesterly wind anomaly. Unlike CT1 and CT2, CT3 shows a stable stratification below 700 hPa. In addition, the upper unstable stratification of CT3 is lower than that of CT1 and CT2, indicating a negative BLH anomaly (as shown in Fig. S2). CT3 also shows upward movement over the BTH region, but it is weaker than CT2 by 1 order of magnitude. By contrast, the effects of the stronger near-surface convergence will offset the upward transport, which will increase the local air pollutants. The stable boundary layer, southeasterly warm moisture and effective convergence aggravate local air pollution.
For the cases of CT4 and CT5, the BTH region is co-located with a weak surface anticyclone with low average surface winds of 2.24 and 2.58 m s−1, respectively. The calm surface winds coexisting with the lower BLHs (see Fig. S2) decrease the ventilation coefficient and increase the occurrence of air stagnation conditions. The surface anomaly fields show southeasterly and southerly winds in CT4 and CT5, respectively. As shown in Fig. 4, the northward wind anomaly increases the humidity and air pollutants of the BTH region. Based on the vertical profiles of temperature and atmospheric stability, an elevated positive temperature anomaly increases the stability of the boundary layer, thus reducing the vertical diffusion of air pollutants. The weak near-surface convergence could increase the accumulation of air pollution, but moderate upward movement will bring the surface air pollutants to the outside of the boundary layer, which offsets the surface convergence to some extent. CT4 and CT5 had the same occurrence of 15 % during the study period. Although the CT4 and CT5 show different large-scale surface circulation patterns, the meteorological variables over the BTH region are almost the same. The air stagnation conditions and southerly water vapor transport result in the accumulation and hygroscopic growth of particles.
In terms of CT6, the BTH region is located at the ridge of the Mongolian anticyclone, and its high-pressure system is weaker than that of CT2. The prevailing wind turns from northwest to northeast over the BTH region. As shown by the surface meteorological anomaly distribution, the BTH region is situated at the border between the northern anticyclonic and southern cyclonic anomalies with prevailing northeasterly wind coming from the Bohai Sea. A large amount of water vapor from the sea plays an important role in the hygroscopic growth of particles over the BTH region. Figure 5 indicates a stable boundary layer when CT6 occurs, which reduces the vertical diffusion of surface air pollutants. CT6 shows a deep horizontal convergence under 850 hPa, which is favorable for the accumulation of moisture and air pollutants. The effect of the relatively weak divergence above strong convergence is not distinct for the improvement in surface air quality. Therefore, the circulation pattern of warm moist flow from the sea, a stable boundary and effective horizontal convergence exacerbates local air pollution.
3.2 Atmospheric circulation pattern effects on air quality
The potential mechanisms of the CT effects on local air quality are discussed in Sect. 3.1. Combinations of the following situations are favorable for the improvement in air quality: transport of a clean and dry air mass, unstable boundary layer, effective horizontal divergence and vertical transport of air pollutants to the free atmosphere. In contrast, the positive humidity anomaly, stable boundary layer, frequent air stagnation conditions and deep horizontal convergence exacerbate air pollution.
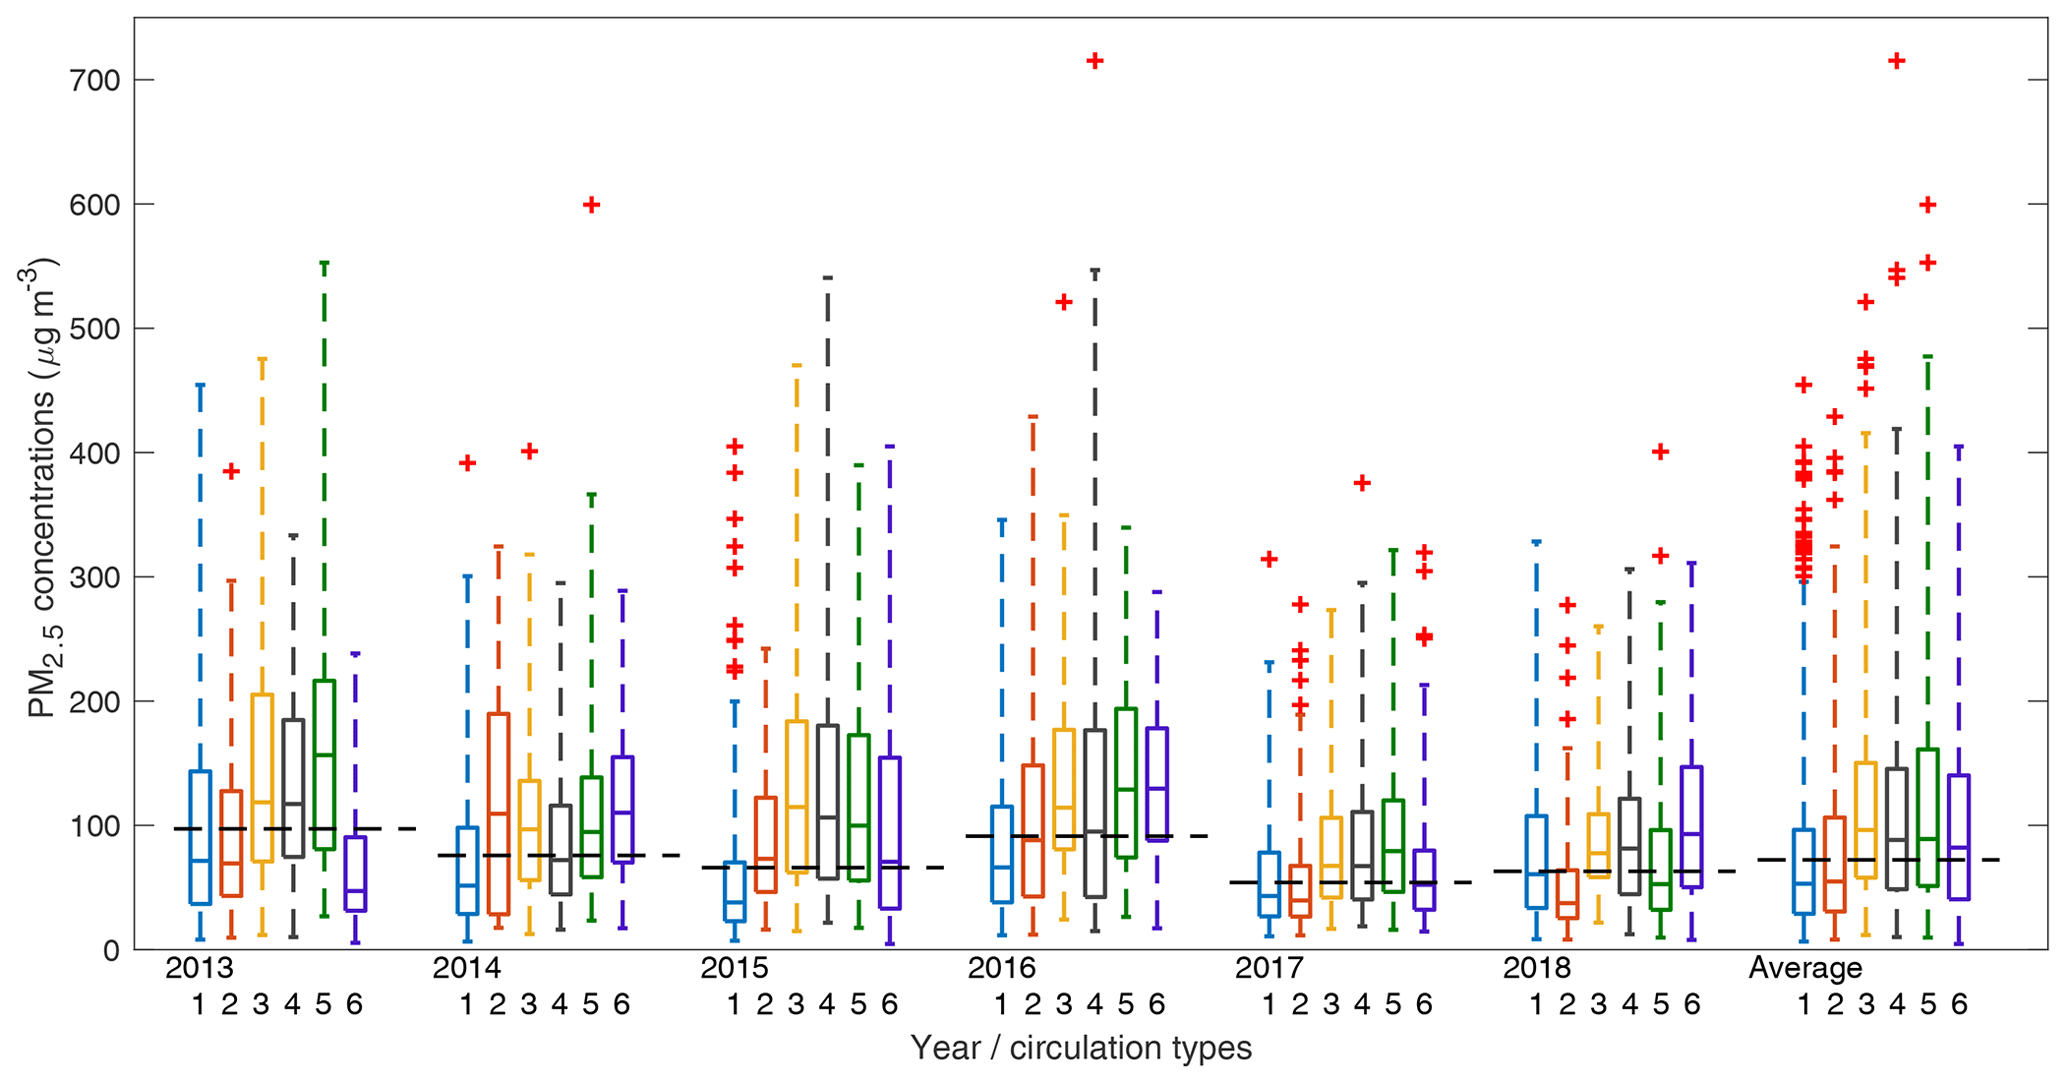
Figure 7The box plot of the PM2.5 concentrations varies with the circulation types. To exclude the effect of emission reduction on the annual mean PM2.5 concentrations, the PM2.5 distributions at the year and multiyear (average) scales are shown here. The dashed line for each year indicates the median PM2.5 concentrations in wintertime of a specific year.
To exclude the effects of interannual variation in air quality due to the emission reduction background, the daily PM2.5 concentration distribution displayed by year and CT, as shown in Fig. 7, reveals the effects of CT on air quality. The mean and median values of PM2.5 concentrations during each CT are summarized in Table 1. The mean and median PM2.5 concentrations in the CT1 condition are both lower than the seasonal mean and median for all years. Under the CT2 condition, the PM2.5 concentrations are also lower than the seasonal mean except for 2014. However, the PM2.5 concentrations are generally higher than the seasonal mean in CT3–CT6. As for the multiyear average, it shows distinctly lower PM2.5 concentrations in CT1 and CT2 than the other CTs. Based on the PM2.5 concentration in each CT, CT1 and CT2 can be considered as favorable CTs for air quality, which are beneficial for the diffusion of air pollutants, and CT3–CT6 are unfavorable CTs, which exacerbate air pollution.
In the above analysis, PM2.5 concentration tended to be lower than normal when a favorable CT occurred, and vice versa. Therefore, the occurrence frequency of each CT plays an important role in air quality during the study period. CT1 and CT2 are combined as the favorable circulation, and CT3–CT6 are referred to as the unfavorable circulation. Figure S5 exhibits the seasonal occurrences of favorable and unfavorable circulation types. In winter 2013, 54 d of unfavorable circulation occurred, which is the highest frequency during the study period. A higher unfavorable circulation frequency was also shown in 2014 and 2018 winters. In contrast, the favorable circulations were much higher in 2015 and 2017 winters than in the other winters. The seasonal frequencies of favorable and unfavorable circulations are in line with the trend in seasonal PM2.5 concentrations. It is worth noting that although the seasonal mean PM2.5 concentration in the winter of 2015 (December 2015 to February 2016) is lower than that of 2014, the PM2.5 concentration in December 2015 is much higher than that in December 2014. The high PM2.5 concentration in December 2015 is consistent with the high frequency of unfavorable CTs during that time, which indicates the robustness of circulation classification.
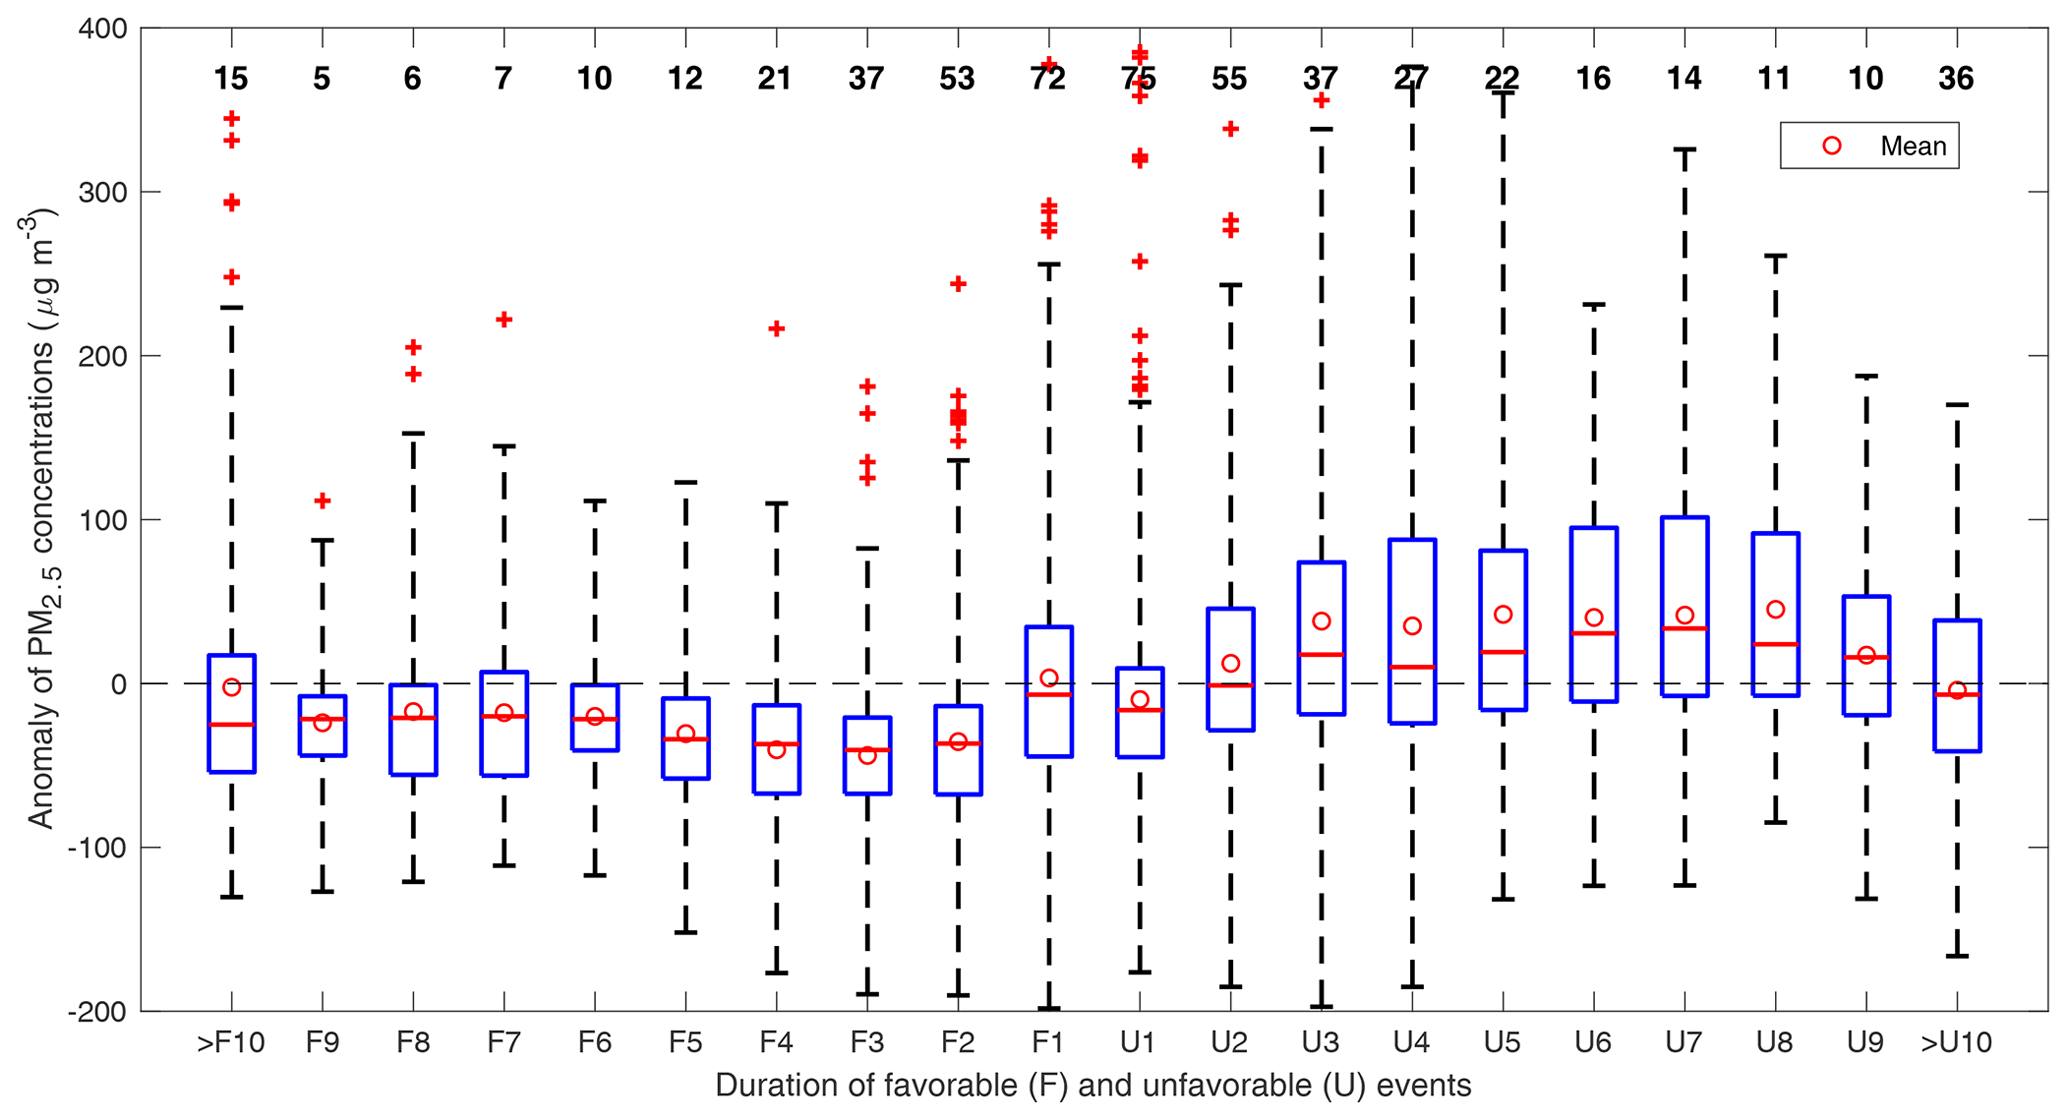
Figure 8The daily PM2.5 concentration anomalies vary with favorable (F) and unfavorable (U) event durations. The occurrences of CT1 and CT2 are collectively called favorable events, and CT3 to CT6 are referred to as unfavorable events. U1 indicates an unfavorable circulation event lasting for 1 d, and U2 means a 2 d event. The central red line in each box indicates the median, and the circle is the mean value.
However, every air pollution event has a duration from the development to decay stage. Generally, several days are needed for the accumulation of air pollutants, followed by a relatively quick removal. The variation in meteorological conditions controls the evolution of each air pollution episode. Therefore, the duration of each CT determines the duration of the air pollution event. Figure 8 exhibits the variation in the PM2.5 concentration anomaly with the duration of favorable and unfavorable CTs. As discussed above, the favorable circulations generally correspond to the negative PM2.5 concentration anomaly (lower than the monthly mean), while the unfavorable circulations result in a positive PM2.5 concentration anomaly. When the favorable circulation duration is shorter than 4 d, the absolute values of the negative anomaly of PM2.5 concentrations increase with the duration of favorable circulation; however, with the continuous increase in favorable circulation durations, the magnitude of the negative anomaly of PM2.5 concentrations decreases slightly and remains unchanged. Similarly, the positive anomalies of the PM2.5 concentrations increase with the duration of unfavorable circulation durations when the duration is less than 7 d. However, the effect of circulation on air pollutant diffusion is not obvious when a 1 d favorable or 1–2 d unfavorable circulation occurs. That is, favorable CTs lasting 2–4 d are beneficial for the diffusion of air pollutants, and unfavorable circulation events lasting 3–7 d exacerbate the accumulation of air pollutants.
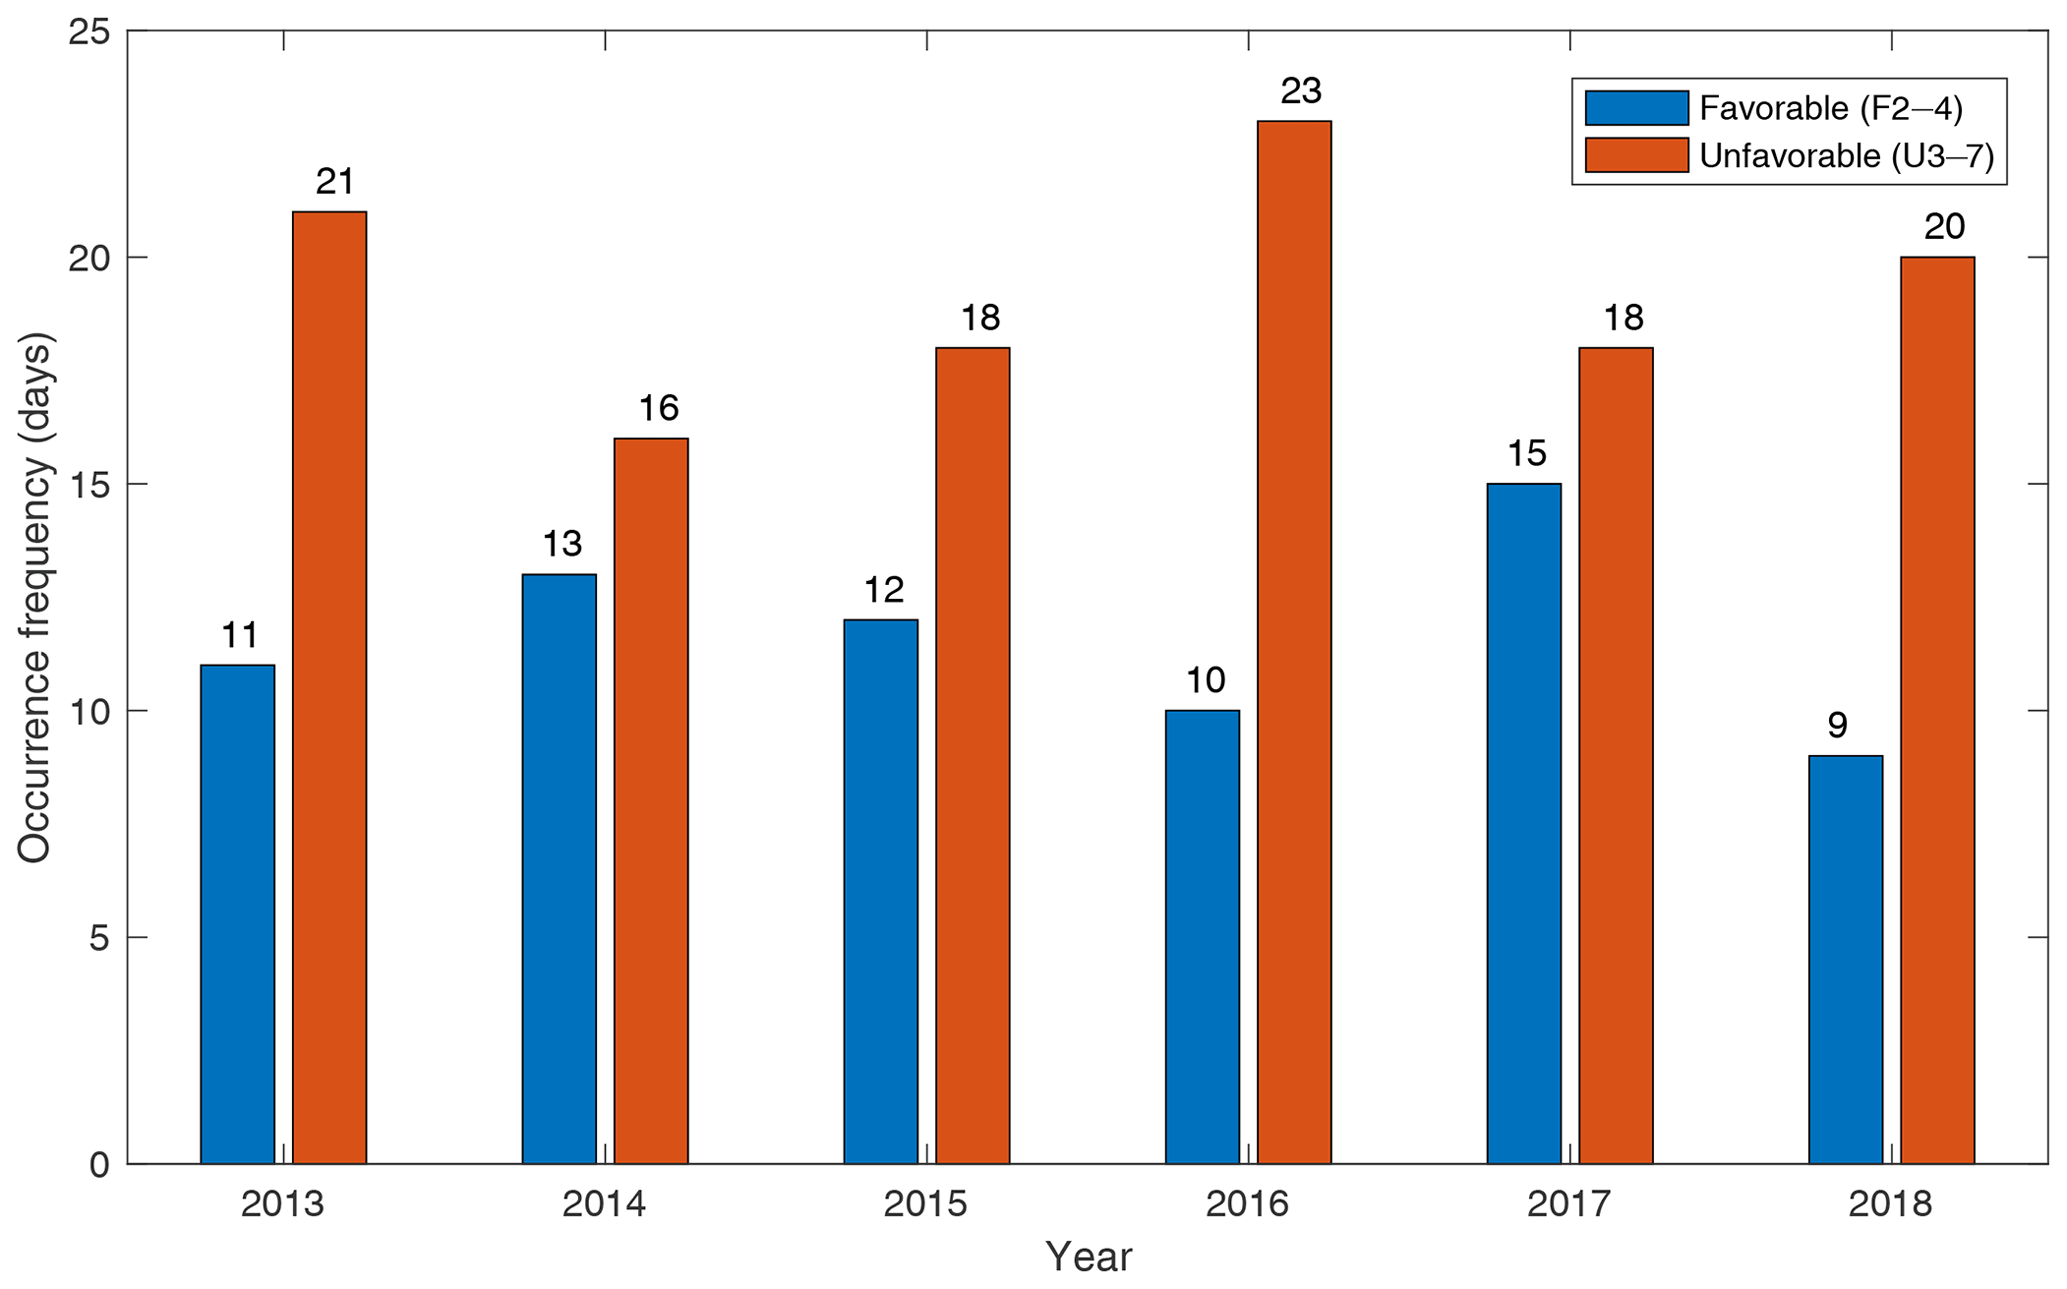
Figure 9Occurrence frequencies of the effective favorable and unfavorable events. The effective favorable events referred to the favorable events lasting for 2–4 d. The effective unfavorable events indicate the unfavorable events lasting for 3–7 d. The specific number of days for favorable and unfavorable events is shown on the top of each bar.
The occurrences of 2–4 d favorable circulation and 3–7 d of unfavorable CTs are shown in Fig. 9. It shows a high frequency of 2–4 d of favorable circulation in 2017 and 2014 with 15 and 13 d in total, respectively. The favorable circulation occurrences are lower in the winters of 2016 and 2018 than in the other winters. In terms of the 3–7 d of unfavorable circulations, the years of 2013, 2016 and 2018 show higher frequencies than the other years. Therefore, based on the occurrence of favorable and unfavorable CTs, the atmospheric diffusion abilities are better in 2014 and 2017 than in the other years. The significant improvement in air quality in 2014 and 2017 is consistent with the improvement in atmospheric diffusion abilities compared to their previous years.
3.3 Contributions of atmospheric diffusion condition variations to the PM2.5 concentration decrease between 2016 and 2017
Although the interannual variation in PM2.5 concentrations show good correlation with the occurrence of favorable or unfavorable circulation, Sect. 3.2 is just a qualitative analysis. Taking the interannual variation in PM2.5 concentrations between 2016 and 2017 as an example, the model simulation based on the WRF-Chem model is used to evaluate the quantitative contributions of meteorological condition variations to the PM2.5 concentration decrease in 2017. The emissions are fixed in 2016 (December 2016 to February 2017), and the meteorological fields come from the NECP GDAS FNL analysis dataset for the 2016 and 2017 winters, respectively. The meteorological fields and air pollutants over some cities from north to south in the simulated domain (i.e., Shijiazhuang, Beijing, Tianjin, Xuzhou and Shanghai) are included to evaluate the performance of the model simulation. Figure S6 shows the variations in the observed and simulated daily mean air temperature, sea level pressure, relative humidity and surface wind speed from January to February of 2017. Although the model slightly overestimates the surface wind speed over Shijiazhuang and Shanghai, most of the simulated meteorological variables agree well with the observations over all cities. For the concentration of air pollutants in Fig. S7, the model generally underestimates the PM2.5 concentrations under highly polluted conditions, with a bias of 44.9 %–59.6 % (different cities) when the observed PM2.5 was higher than 75 µg m−3. However, the bias between the simulated and observed PM2.5 concentrations decreased to 12.4 %–26.8 % at lower PM2.5 concentration levels. Due to the deficiency of the PBL scheme (Tie et al., 2015), the heterogeneous/aqueous process in the model (Li et al., 2011) and uncertainty in the emission inventory, current air quality models show limited capacity in severe air pollution episodes. However, the day-to-day variation in all the air pollutants can be well captured by the WRF-Chem model, with the highest correlation coefficient of 0.76 between the observed and simulated PM2.5 in Xuzhou. Overall, both the meteorological variables and air pollutants are well reproduced by the WRF-Chem model, which provides confidence for further discussions.
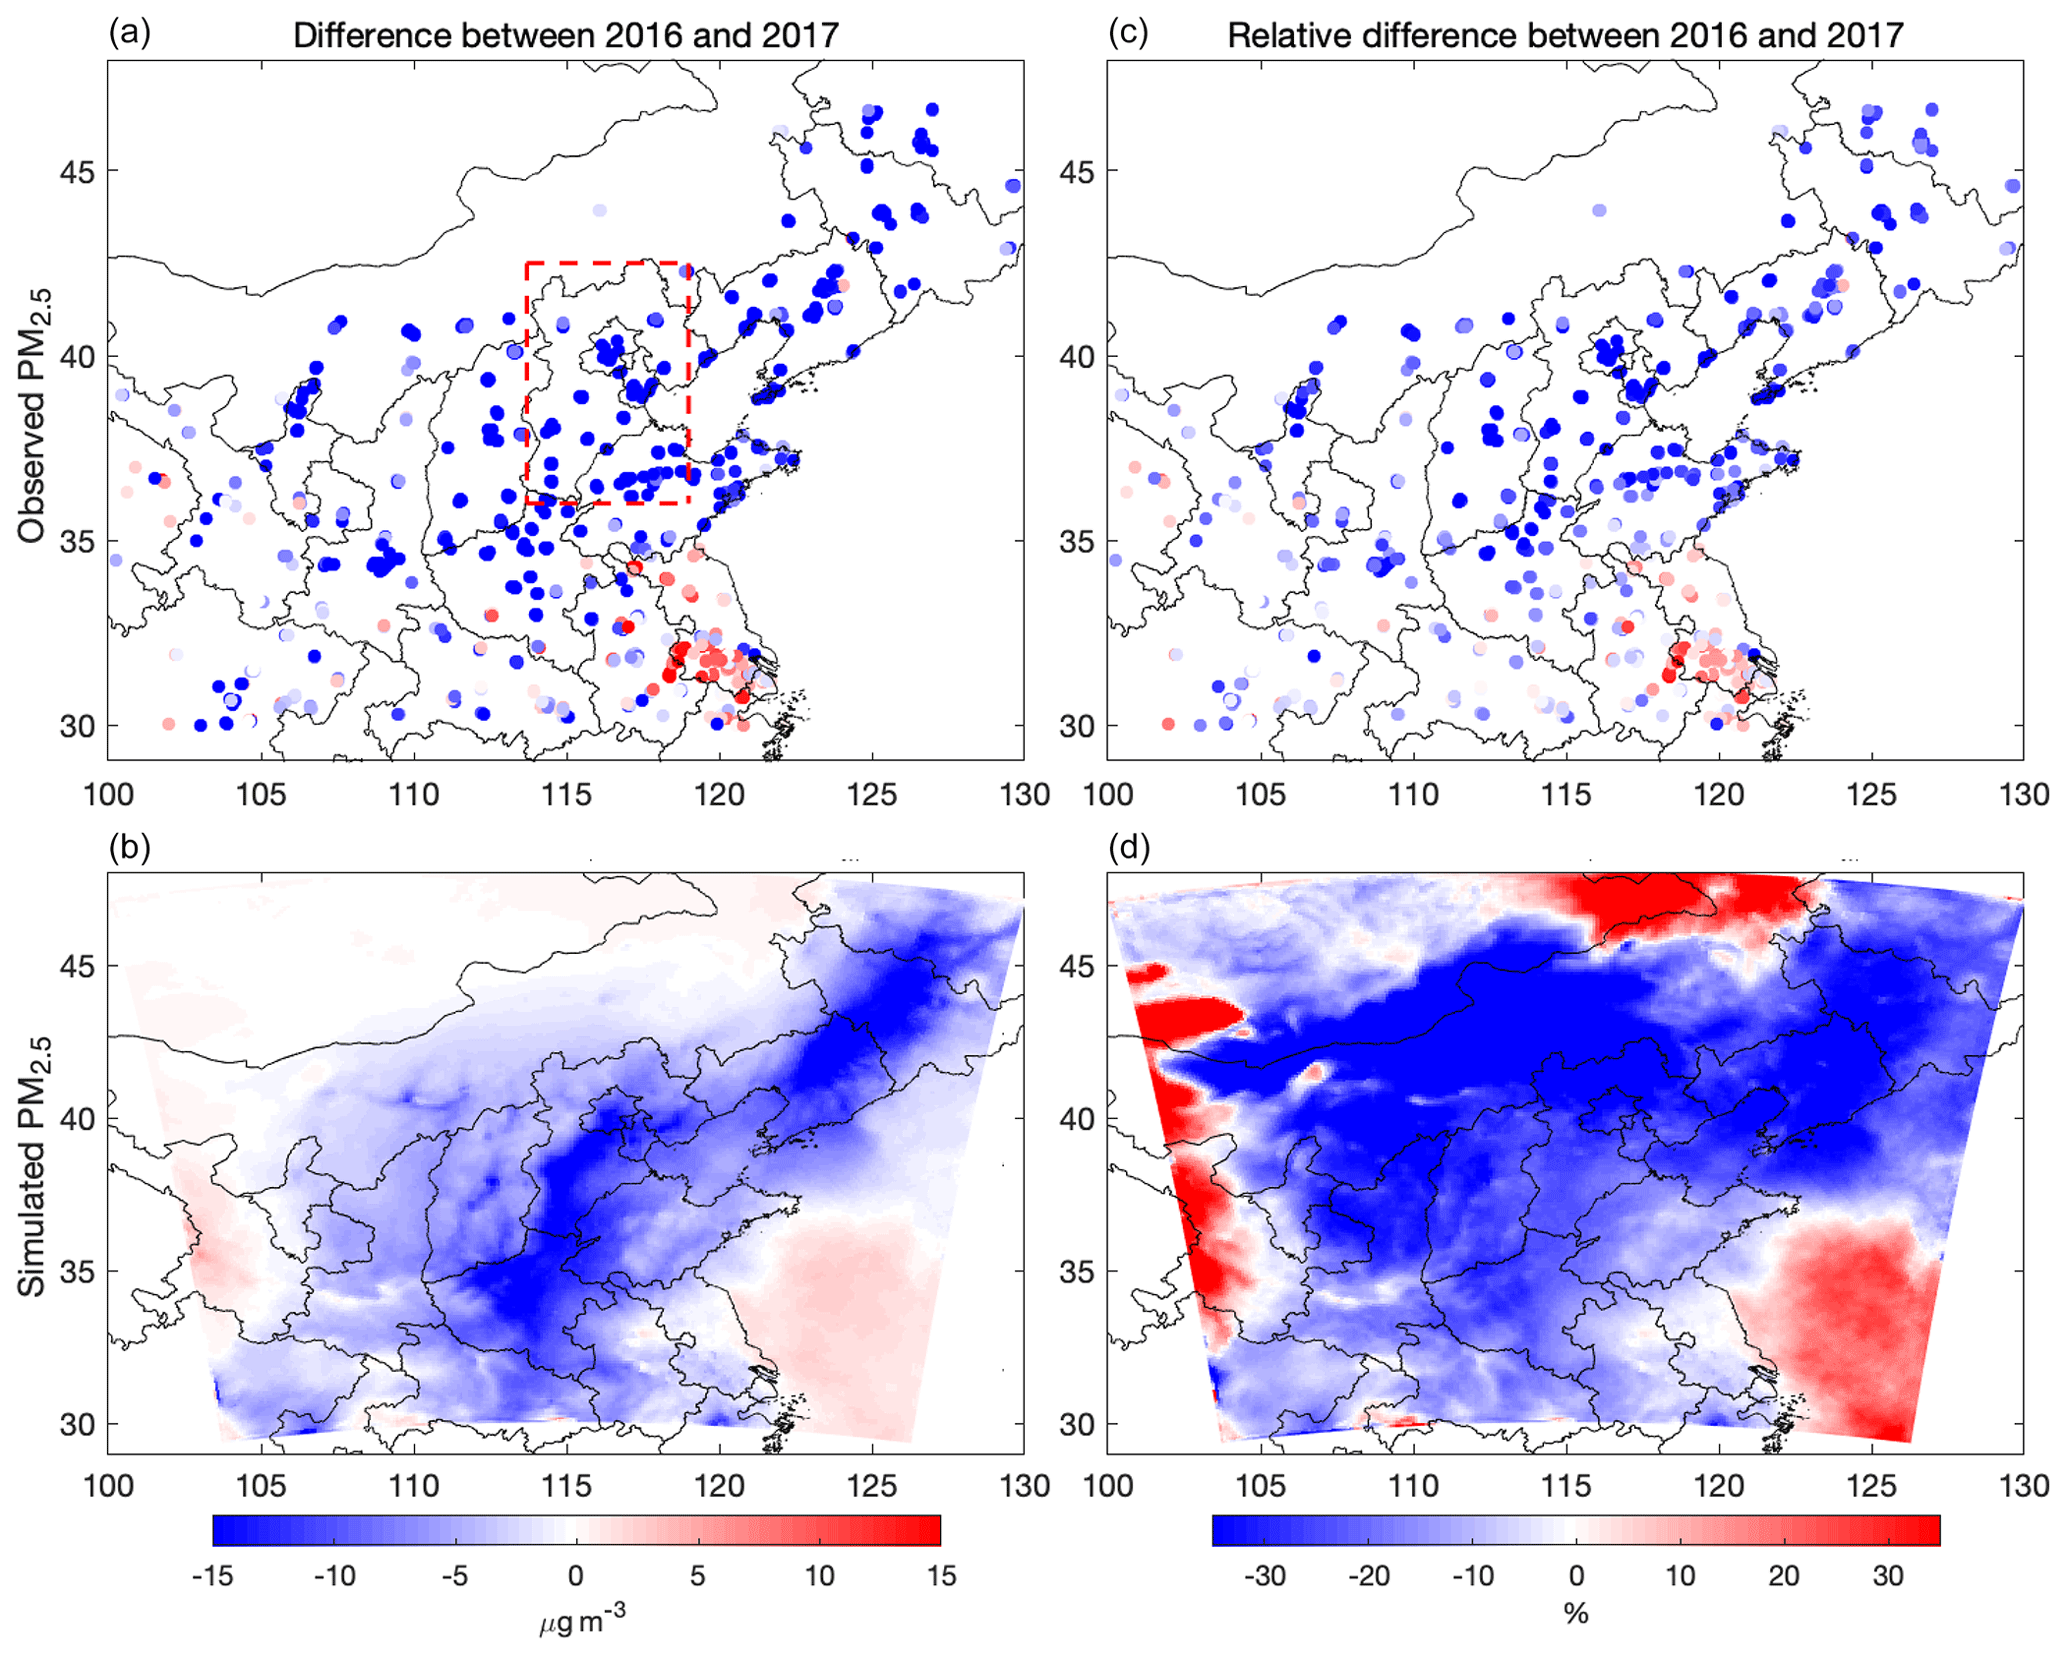
Figure 10Distributions of the observed and simulated PM2.5 difference between the winters of 2016 and 2017. Panels (a, b) show the absolute value (unit: µg m−3), and panels (c, d) show the relative difference with respect to the mean value of 2016 (unit: %). The simulated seasonal mean PM2.5 concentrations during the two years are shown in Fig. S8.
The simulated seasonal mean PM2.5 concentrations of the 2016 and 2017 winters are presented in Fig. S8. It shows a significant spatial distribution of seasonal PM2.5 concentrations with higher concentrations over the BTH region and Shandong and Henan Provinces. Even though the emissions were set to the level of 2016, the simulated seasonal PM2.5 concentrations in 2016 were much higher than those in 2017 due to the difference in meteorological fields. Figure 10 exhibits the observed and simulated PM2.5 concentration differences between 2017 and 2016. Both the observations and simulations show significant negative growth in PM2.5 concentrations over northern China from 2016 to 2017 in winter but relatively weak positive growth over the lower Yangtze River Delta. The BTH region is located at the center of negative growth, with an observed 47.7 µg m−3 decrease in PM2.5 concentration from 2016 to 2017 at 114 stations over the region of 36–42∘ N and 113–117.5∘ E, while the simulated difference of PM2.5 at these 114 stations is −11.7 µg m−3, which is much lower than the observed value. The absolute PM2.5 concentration would be underestimated because of the limited performance of the WRF-Chem model under severe air pollution; therefore, the relative differences between 2016 and 2017 are involved to evaluate the effects of meteorological field variations on the decrease in PM2.5 concentrations. Based on the relative difference in PM2.5 concentration between 2016 and 2017, the observed difference at the 114 stations over the BTH region is −37.7 % compared to the mean value of winter 2016, and the averaged simulated difference is −22.6 %, which is due to the difference in meteorological conditions. Thus, 59.9 % of the observed 37.7 % decrease in PM2.5 concentration in 2017 over the BTH region could be attributed to the improvement in atmospheric diffusion conditions. The variation of meteorological conditions plays an important role in the interannual variation in air pollutant concentrations.
Recent severe PM2.5 pollution in China has aroused unprecedented public concern. The Chinese government has implemented many emission reduction measurements, which has greatly improved the air quality recently. The wintertime PM2.5 concentration of 2018 decreased by 35.6 % compared to 2013 over the BTH region. However, there was obvious interannual variation in PM2.5 concentrations from 2013 to 2018. An atmospheric circulation classification method based on the Cost733 toolbox is used to investigate the mechanism behind atmospheric circulation effects on air pollutant diffusion. Six CTs are identified during the winters from 2013 to 2018 over northern China, two of which are considered as favorable circulations for air pollutant diffusion; the other four CTs exacerbate local air pollution. Generally, the transport of clean and dry air mass and unstable boundary layers working with the effective near-surface horizontal divergence or pumping action at the top of the boundary layer will benefit the horizontal or vertical diffusion of surface air pollutants. However, the co-occurrence of a stable boundary layer, frequent air stagnation, positive water vapor advection and deep near-surface horizontal convergence exacerbates the air pollution.
Except for the atmospheric circulation characteristic of CTs, the durations of each circulation type also have a great influence on the local air quality. The 1 d favorable or less than 2 d unfavorable circulations have no significant effects on the diffusion and accumulation of air pollutants. Comparatively speaking, favorable CTs lasting for 2–4 d are beneficial for the diffusion of air pollutants, and the 3–7 d of unfavorable circulation events exacerbate the accumulation of air pollutants. The occurrences of 2–4 d of favorable and 3–7 d of unfavorable circulation are used to evaluate the atmospheric diffusion ability, which shows better diffusion abilities in 2014 and 2017 than in the other years. Taking the decrease of PM2.5 concentration between 2016 and 2017 as an example, 59.9 % of the decreased concentration over the BTH region could be attributed to the improvement in atmospheric diffusion conditions of 2017. The variation in meteorological conditions plays an important role in the interannual variation in air pollutant concentrations. The key and target year for the 3-year plan to win the battle for a blue sky is 2020. It is essential to exclude the contribution of meteorological conditions to the variation in interannual air pollutants when making a quantitative evaluation of emission reduction measurements.
The quantitative evaluation of meteorological elements' contribution to the interannual variation of PM2.5 concentrations between the winters of 2016 and 2017 is derived from the WRF-Chem simulation in this study. Although the model performance for PM2.5 is generally satisfactory in Fig. S7, it shows obvious underestimation in the severe haze days. Reasons for these biases might be the overestimation in surface wind speed, uncertainties of the emission inventory and insufficient treatments of some new chemistry mechanisms of particle formation, which need be further discussed in the future. In addition, some emission modules are turned off to reduce the computation cost, i.e., dust, sea salt, dimethyl sulfide, biomass burning and wildfires, which would result in the uncertainty of simulated PM2.5 mass concentrations.
The release version 4.0 of WRF-Chem can be download from http://www2.mmm.ucar.edu/wrf/users/download/get_source.html (UCAR, 2020). Hourly PM2.5 concentration observations were obtained from the website of Ministry of Ecology and Environment of the People's Republic of China (http://106.37.208.233:20035, CNEMC, 2020). The 4-times daily ECMWF ERA5 dataset of 2013 to 2018 was downloaded from https://www.ecmwf.int/en/forecasts/datasets/reanalysis-datasets/era5 (ECMWF, 2020). Hourly observations of meteorological variables used for the WRF-Chem simulation evaluations were downloaded from the Integrated Surface Database of National Climate Data Center (https://www.ncdc.noaa.gov/isd (NCEI, 2020), NOAA National Centers for Environmental Information, last access: 25 June 2020).
The supplement related to this article is available online at: https://doi.org/10.5194/acp-20-7667-2020-supplement.
XW and RZ designed research;. XW performed the analyses and wrote the paper. Both authors contributed to the final version of the paper.
The authors declare that they have no conflict of interest.
This research has been supported by the National Natural Science Foundation of China (grant nos. 41790470 and 41805117).
This paper was edited by Qiang Zhang and reviewed by two anonymous referees.
Ackermann, I. J., Hass, H., Memmesheimer, M., Ebel, A., Binkowski, F. S., and Shankar, U.: Modal aerosol dynamics model for Europe: Development and first applications, Atmos. Environ., 32, 2981–2999, 1998.
Bi, J., Huang, J., Holben, B., and Zhang, G.: Comparison of key absorption and optical properties between pure and transported anthropogenic dust over East and Central Asia, Atmos. Chem. Phys., 16, 15501–15516, https://doi.org/10.5194/acp-16-15501-2016, 2016.
Cai, W., Li, K., Liao, H., Wang, H., and Wu, L.: Weather conditions conducive to Beijing severe haze more frequent under climate change, Nat. Clim. Change 7, 257–262, 2017.
Cavazos, T.: Using self-organizing maps to investigate extreme climate events: An application to wintertime precipitation in the Balkans, J. Climate, 13, 1718–1732, 2000.
Che, H., Xia, X., Zhao, H., Dubovik, O., Holben, B. N., Goloub, P., Cuevas-Agulló, E., Estelles, V., Wang, Y., Zhu, J., Qi, B., Gong, W., Yang, H., Zhang, R., Yang, L., Chen, J., Wang, H., Zheng, Y., Gui, K., Zhang, X., and Zhang, X.: Spatial distribution of aerosol microphysical and optical properties and direct radiative effect from the China Aerosol Remote Sensing Network, Atmos. Chem. Phys., 19, 11843–11864, https://doi.org/10.5194/acp-19-11843-2019, 2019.
Chen, H. and Wang, H.: Haze Days in North China and the associated atmospheric circulations based on daily visibility data from 1960 to 2012, J. Geophys. Res., 120, 5895–5909, 2015.
Chen, H., Wang, H., Sun, J., Xu, Y., and Yin, Z.: Anthropogenic fine particulate matter pollution will be exacerbated in eastern China due to 21st century GHG warming, Atmos. Chem. Phys., 19, 233–243, https://doi.org/10.5194/acp-19-233-2019, 2019.
Chen, S., Zhang, X., Lin, J., Huang, J., Zhao, D., Yuan, T., Huang, K., Luo, Y., Jia, Z., and Zang, Z.: Fugitive Road Dust PM2.5 Emissions and Their Potential Health Impacts, Environ. Sci. Technol., 53, 8455–8465, 2019.
Chen, Y., Zhao, C., and Ming, Y.: Potential impacts of Arctic warming on Northern Hemisphere mid-latitude aerosol optical depth, Clim. Dynam., 53, 1637–1651, 2019.
Chen, Z., Chen, D., Kwan, M.-P., Chen, B., Gao, B., Zhuang, Y., Li, R., and Xu, B.: The control of anthropogenic emissions contributed to 80 % of the decrease in PM2.5 concentrations in Beijing from 2013 to 2017, Atmos. Chem. Phys., 19, 13519–13533, https://doi.org/10.5194/acp-19-13519-2019, 2019.
China National Environmental Monitoring Centre (CNEMC): Publishing platform for the real time air quality observations in China, available at: http://106.37.208.233:20035, last access: 25 June 2020.
China's State Council: Notice of the General Office of the State Council on Issuing the Air Pollution Prevention and Control Action Plan, available at: http://www.gov.cn/zwgk/2013-09/12/ content_2486773.htm (last access: 30 December 2019), 2013.
China's State Council: The State Council rolls out a three-year action plan for clean air, available at: http://www.gov.cn/zhengce/content/2018-07/03/content_5303158.htm (last access: 30 December 2019), 2018.
Collins, W. D., Rasch, P. J., Boville, B. A., Hack, J. J., McCaa, J. R., Williamson, D. L., Kiehl, J. T., Briegleb, B., Bitz, C., and Lin, S.-J.: Description of the NCAR community atmosphere model (CAM 3.0), NCAR Tech. Note NCAR/TN-464+ STR, NCAR Scientific Divisions, 226, 2004.
Dang, R. and Liao, H.: Severe winter haze days in the Beijing–Tianjin–Hebei region from 1985 to 2017 and the roles of anthropogenic emissions and meteorology, Atmos. Chem. Phys., 19, 10801–10816, https://doi.org/10.5194/acp-19-10801-2019, 2019.
Ding, A., Huang, X., Nie, W., Chi, X., Xu, Z., Zheng, L., Xu, Z., Xie, Y., Qi, X., Shen, Y., Sun, P., Wang, J., Wang, L., Sun, J., Yang, X.-Q., Qin, W., Zhang, X., Cheng, W., Liu, W., Pan, L., and Fu, C.: Significant reduction of PM2.5 in eastern China due to regional-scale emission control: evidence from SORPES in 2011–2018, Atmos. Chem. Phys., 19, 11791–11801, https://doi.org/10.5194/acp-19-11791-2019, 2019.
European Centre for Medium-Range Weather Forecasts (ECMWF): Reanalysis datasets/ERA5, available at: https://www.ecmwf.int/en/forecasts/datasets/reanalysis-datasets/era5, last access: 25 June 2020.
Fan, H., Zhao, C., and Yang, Y.: A comprehensive analysis of the spatio-temporal variation of urban air pollution in China during 2014–2018, Atmos. Environ., 220, 117066, https://doi.org/10.1016/j.atmosenv.2019.117066, 2020.
Feng, F. and Wang, K.: Determining Factors of Monthly to Decadal Variability in Surface Solar Radiation in China: Evidences From Current Reanalyses, J. Geophys. Res., 124, 9161–9182, 2019.
Feng, J., Li, J., Liao, H., and Zhu, J.: Simulated coordinated impacts of the previous autumn North Atlantic Oscillation (NAO) and winter El Niño on winter aerosol concentrations over eastern China, Atmos. Chem. Phys., 19, 10787–10800, https://doi.org/10.5194/acp-19-10787-2019, 2019.
Garrett, T. J., Zhao, C., and Novelli, P. C.: Assessing the relative contributions of transport efficiency and scavenging to seasonal variability in Arctic aerosol, Tellus B, 62, 190–196, 2010.
Gui, K., Che, H., Wang, Y., Wang, H., Zhang, L., Zhao, H., Zheng, Y., Sun, T., and Zhang, X.: Satellite-derived PM2.5 concentration trends over Eastern China from 1998 to 2016: Relationships to emissions and meteorological parameters, Environ. Pollut., 247, 1125–1133, 2019.
Guo, J., Xu, H., Liu, L., Chen, D., Peng, Y., Yim, S. H. L., Yang, Y., Li, J., Zhao, C., and Zhai, P.: The trend reversal of dust aerosol over East Asia and the North Pacific Ocean attributed to large-scale meteorology, deposition and soil moisture, J. Geophys. Res.-Atmos., 124, 10450–10466, 2019.
He, J., Lu, S., Yu, Y., Gong, S., Zhao, S., and Zhou, C.: Numerical Simulation Study of Winter Pollutant Transport Characteristics over Lanzhou City, Northwest China, Atmosphere, 9, 382, https://doi.org/10.3390/atmos9100382, 2018.
He, Y., Wang, K., Zhou, C., and Wild, M.: A Revisit of Global Dimming and Brightening Based on the Sunshine Duration, Geophys. Res. Lett., 45, 4281–4289, 2018.
Hong, C., Zhang, Q., Zhang, Y., Davis, S. J., Tong, D., Zheng, Y., Liu, Z., Guan, D., He, K., and Schellnhuber, H. J.: Impacts of climate change on future air quality and human health in China, P. Natl. Acad. Sci. USA, 116, 17193–17200, 2019.
Hu, Z., Huang, J., Zhao, C., Ma, Y., Jin, Q., Qian, Y., Leung, L. R., Bi, J., and Ma, J.: Trans-Pacific transport and evolution of aerosols: spatiotemporal characteristics and source contributions, Atmos. Chem. Phys., 19, 12709–12730, https://doi.org/10.5194/acp-19-12709-2019, 2019.
Huang, X., Wang, Z., and Ding, A.: Impact of Aerosol-PBL Interaction on Haze Pollution: Multiyear Observational Evidences in North China, Geophys. Res. Lett., 45, 8596–8603, 2018.
Huth, R.: A circulation classification scheme applicable in GCM studies, Theor. Appl. Climatol., 67, 1–18, 2000.
Huth, R., Beck, C., Philipp, A., Demuzere, M., Ustrnul, Z., Cahynová, M., Kyselý, J., and Tveito, O. E.: Classifications of atmospheric circulation patterns: recent advances and applications, Ann. NY Acad. Sci., 1146, 105–152, 2008.
Iacono, M. J., Delamere, J. S., Mlawer, E. J., Shephard, M. W., Clough, S. A., and Collins, W. D.: Radiative forcing by long-lived greenhouse gases: Calculations with the AER radiative transfer models, J. Geophys. Res.-Atmos., 113, D13103, https://doi.org/10.1029/2008JD009944, 2008.
Janjić, Z. I.: The Step-Mountain Eta Coordinate Model: Further Developments of the Convection, Viscous Sublayer, and Turbulence Closure Schemes, Mon. Weather Rev., 122, 927–945, https://doi.org/10.1175/1520-0493(1994)122<0927:TSMECM>2.0.CO;2, 1994.
Jian, B., Li, J., Wang, G., He, Y., Han, Y., Zhang, M., and Huang, J.: The Impacts of Atmospheric and Surface Parameters on Long-Term Variations in the Planetary Albedo, J. Climate, 31, 8705–8718, 2018.
Leung, D. M., Tai, A. P. K., Mickley, L. J., Moch, J. M., van Donkelaar, A., Shen, L., and Martin, R. V.: Synoptic meteorological modes of variability for fine particulate matter (PM2.5) air quality in major metropolitan regions of China, Atmos. Chem. Phys., 18, 6733–6748, https://doi.org/10.5194/acp-18-6733-2018, 2018.
Li, G., Zavala, M., Lei, W., Tsimpidi, A. P., Karydis, V. A., Pandis, S. N., Canagaratna, M. R., and Molina, L. T.: Simulations of organic aerosol concentrations in Mexico City using the WRF-CHEM model during the MCMA-2006/MILAGRO campaign, Atmos. Chem. Phys., 11, 3789–3809, https://doi.org/10.5194/acp-11-3789-2011, 2011.
Li, J., Lv, Q., Jian, B., Zhang, M., Zhao, C., Fu, Q., Kawamoto, K., and Zhang, H.: The impact of atmospheric stability and wind shear on vertical cloud overlap over the Tibetan Plateau, Atmos. Chem. Phys., 18, 7329–7343, https://doi.org/10.5194/acp-18-7329-2018, 2018.
Li, J., Liao, H., Hu, J., and Li, N.: Severe particulate pollution days in China during 2013–2018 and the associated typical weather patterns in Beijing-Tianjin-Hebei and the Yangtze River Delta regions, Environ. Pollut., 248, 74–81, 2019.
Li, Q., Zhang, R., and Wang, Y.: Interannual variation of the wintertime fog–haze days across central and eastern China and its relation with East Asian winter monsoon, Int. J. Climatol., 36, 346–354, 2016.
Liu, C., Chen, R., Sera, F., Vicedo-Cabrera, A. M., Guo, Y., Tong, S., Coelho, M. S., Saldiva, P. H., Lavigne, E., and Matus, P.: Ambient particulate air pollution and daily mortality in 652 cities, New Engl. J. Med., 381, 705–715, 2019.
Miao, Y., Guo, J., Liu, S., Liu, H., Li, Z., Zhang, W., and Zhai, P.: Classification of summertime synoptic patterns in Beijing and their associations with boundary layer structure affecting aerosol pollution, Atmos. Chem. Phys., 17, 3097–3110, https://doi.org/10.5194/acp-17-3097-2017, 2017.
Mu, M. and Zhang, R.: Addressing the issue of fog and haze: A promising perspective from meteorological science and technology, Sci. China Earth Sci., 57, 1–2, https://doi.org/10.1007/s11430-013-4791-2, 2014.
NOAA National Centers for Environmental Information (NCEI): Integrated Surface Database (ISD), available at: https://www.ncdc.noaa.gov/isd, last access: 25 June 2020.
Philipp, A., Beck, C., Esteban, P., Kreienkamp, F., Krennert, T., Lochbihler, K., Lykoudis, S. P., Pianko-Kluczynska, K., Post, P., and Alvarez, D. R.: cost733class-1.2 User guide, University of Augsburg, Augsburg, Germany, 10–21, 2014.
Schell, B., Ackermann, I. J., Hass, H., Binkowski, F. S., and Ebel, A.: Modeling the formation of secondary organic aerosol within a comprehensive air quality model system, J. Geophys. Res.-Atmos., 106, 28275–28293, 2001.
Song, Z., Fu, D., Zhang, X., Wu, Y., Xia, X., He, J., Han, X., Zhang, R., and Che, H.: Diurnal and seasonal variability of PM2.5 and AOD in North China plain: Comparison of MERRA-2 products and ground measurements, Atmos. Environ., 191, 70–78, 2018.
Stockwell, W. R., Middleton, P., Chang, J. S., and Tang, X.: The second generation regional acid deposition model chemical mechanism for regional air quality modeling, J. Geophys. Res.-Atmos., 95, 16343–16367, 1990.
Sun, Y., Zhao, C., Su, Y., Ma, Z., Li, J., Letu, H., Yang, Y., and Fan, H.: Distinct Impacts of Light and Heavy Precipitation on PM2.5 Mass Concentration in Beijing, Earth Space Sci., 6, 1915–1925, 2019.
Tao, S., Ru, M. Y., Du, W., Zhu, X., Zhong, Q. R., Li, B. G., Shen, G. F., Pan, X. L., Meng, W. J., Chen, Y. L., Shen, H. Z., Lin, N., Su, S., Zhuo, S. J., Huang, T. B., Xu, Y., Yun, X., Liu, J. F., Wang, X. L., Liu, W. X., Cheng, H. F., and Zhu, D. Q.: Quantifying the rural residential energy transition in China from 1992 to 2012 through a representative national survey, Nature Energy, 3, 567–573, https://doi.org/10.1038/s41560-018-0158-4, 2018.
Tie, X., Zhang, Q., He, H., Cao, J., Han, S., Gao, Y., Li, X., and Jia, X. C.: A budget analysis of the formation of haze in Beijing, Atmos. Environ., 100, 25–36, 2015.
University Corporation for Atmospheric Research (UCAR): WRF Users Page, available at: https://www2.mmm.ucar.edu/wrf/users/download/get_source.html, last access: 25 June 2020.
Valverde, V., Pay, M. T., and Baldasano, J. M.: Circulation-type classification derived on a climatic basis to study air quality dynamics over the Iberian Peninsula, Int. J. Climatol., 35, 2877–2897, 2015.
Wang, H., Chen, H., and Liu, J.: Arctic Sea Ice Decline Intensified Haze Pollution in Eastern China, Atmos. Ocean. Sci. Lett., 8, 1–9, 2015.
Wang, K., Dickinson, R. E., and Liang, S.: Clear sky visibility has decreased over land globally from 1973 to 2007, Science, 323, 1468–1470, 2009.
Wang, X. and Wang, K.: Homogenized Variability of Radiosonde-Derived Atmospheric Boundary Layer Height over the Global Land Surface from 1973 to 2014, J. Climate, 29, 6893–6908, 2016.
Wang, X., Wang, K., and Su, L.: Contribution of atmospheric diffusion conditions to the recent improvement in air quality in China, Sci. Rep., 6, 36404, https://doi.org/10.1038/srep36404, 2016.
Wang, X., Wen, H., Shi, J., Bi, J., Huang, Z., Zhang, B., Zhou, T., Fu, K., Chen, Q., and Xin, J.: Optical and microphysical properties of natural mineral dust and anthropogenic soil dust near dust source regions over northwestern China, Atmos. Chem. Phys., 18, 2119–2138, https://doi.org/10.5194/acp-18-2119-2018, 2018a.
Wang, X., Dickinson, R. E., Su, L., Zhou, C., and Wang, K.: PM2.5 pollution in China and how it has been exacerbated by terrain and meteorological conditions, B. Am. Meteorol. Soc., 99, 105–119, 2018b.
Wang, X., Zhang, R., and Yu, W.: The effects of PM2.5 concentrations and relative humidity on atmospheric visibility in Beijing, J. Geophys. Res.-Atmos., 124, 2235–2259, 2019.
Wang, Y., Li, W., Gao, W., Liu, Z., Tian, S., Shen, R., Ji, D., Wang, S., Wang, L., and Tang, G.: Trends in particulate matter and its chemical compositions in China from 2013–2017, Sci. China Earth Sci., 62, 1857–1871, 2019.
Xu, J., Chang, L., Qu, Y., Yan, F., Wang, F., and Fu, Q.: The meteorological modulation on PM2.5 interannual oscillation during 2013 to 2015 in Shanghai, China, Sci. Total Environ., 572, 1138–1149, 2016.
Yang, X., Zhao, C., Zhou, L., Li, Z., Cribb, M., and Yang, S.: Wintertime cooling and a potential connection with transported aerosols in Hong Kong during recent decades, Atmos. Res., 211, 52–61, https://doi.org/10.1016/J.ATMOSRES.2018.04.029, 2018.
Yin, Z., Wang, H., and Chen, H.: Understanding severe winter haze events in the North China Plain in 2014: roles of climate anomalies, Atmos. Chem. Phys., 17, 1641–1651, https://doi.org/10.5194/acp-17-1641-2017, 2017.
Yin, Z., Wang, H., and Ma, X.: Possible Relationship between the Chukchi Sea Ice in the Early Winter and the February Haze Pollution in the North China Plain, J. Climate, 32, 5179–5190, 2019.
Zhai, S., Jacob, D. J., Wang, X., Shen, L., Li, K., Zhang, Y., Gui, K., Zhao, T., and Liao, H.: Fine particulate matter (PM2.5) trends in China, 2013–2018: separating contributions from anthropogenic emissions and meteorology, Atmos. Chem. Phys., 19, 11031–11041, https://doi.org/10.5194/acp-19-11031-2019, 2019.
Zhang, J. P., Zhu, T., Zhang, Q. H., Li, C. C., Shu, H. L., Ying, Y., Dai, Z. P., Wang, X., Liu, X. Y., Liang, A. M., Shen, H. X., and Yi, B. Q.: The impact of circulation patterns on regional transport pathways and air quality over Beijing and its surroundings, Atmos. Chem. Phys., 12, 5031–5053, https://doi.org/10.5194/acp-12-5031-2012, 2012.
Zhang, K., Zhao, C., Fan, H., Yang, Y., and Sun, Y.: Toward Understanding the Differences of PM2.5 Characteristics Among Five China Urban Cities, Asia Pac. J. Atmos. Sci., 1–10, https://doi.org/10.1007/S13143-019-00125-W, 2019.
Zhang, Q. and Geng, G.: Impact of clean air action on PM2.5 pollution in China, Sci. China Earth Sci., 62, 1845–1846, https://doi.org/10.1007/s11430-019-9531-4, 2019.
Zhang, Q., Jiang, X., Tong, D., Davis, S. J., Zhao, H., Geng, G., Feng, T., Zheng, B., Lu, Z., and Streets, D. G.: Transboundary health impacts of transported global air pollution and international trade, Nature, 543, 705, https://doi.org/10.1038/nature21712, 2017.
Zhang, Q., Zheng, Y., Tong, D., Shao, M., Wang, S., Zhang, Y., Xu, X., Wang, J., He, H., and Liu, W.: Drivers of improved PM2.5 air quality in China from 2013 to 2017, P. Natl. Acad. Sci. USA, 116, 24463–24469, 2019.
Zhang, Q., Song, Y., Li, M., and Zheng, B.: Anthropogenic Emissions of SO2, NOx, and NH3 in China, in: Atmospheric Reactive Nitrogen in China: Emission, Deposition and Environmental Impacts, edited by: Liu, X. and Du, E., Springer Singapore, Singapore, 13–40, 2020.
Zhang, R., Li, Q., and Zhang, R.: Meteorological conditions for the persistent severe fog and haze event over eastern China in January 2013, Sci. China Earth Sci., 57, 26–35, 2014.
Zhang, R.: Atmospheric science: Warming boosts air pollution, Nat. Clim. Change, 7, 238–239, 2017.
Zhang, X., Xu, X., Ding, Y., Liu, Y., Zhang, H., Wang, Y., and Zhong, J.: The impact of meteorological changes from 2013 to 2017 on PM2.5 mass reduction in key regions in China, Sci. China Earth Sci., 62, 1885–1902, https://doi.org/10.1007/s11430-019-9343-3, 2019.
Zhang, Y., Vu, V. T., Sun, J., He, J., Shen, X., Lin, W., Zhang, X., Zhong, J., Gao, W., and Wang, Y.: Significant changes in chemistry of fine particles in wintertime Beijing from 2007 to 2017: Impact of clean air actions, Environ. Sci. Technol., 54, 1344–1352, 2019.
Zhao, B., Zheng, H., Wang, S., Smith, K. R., Lu, X., Aunan, K., Gu, Y., Wang, Y., Ding, D., and Xing, J.: Change in household fuels dominates the decrease in PM2.5 exposure and premature mortality in China in 2005–2015, P. Natl. Acad. Sci. USA, 115, 12401–12406, 2018.
Zhao, C. and Garrett, T. J.: Effects of Arctic haze on surface cloud radiative forcing, Geophys. Res. Lett., 42, 557–564, https://doi.org/10.1002/2014GL062015, 2015.
Zhao, C., Yanan, L. I., Zhang, F., Sun, Y., and Wang, P.: Growth rates of fine aerosol particles at a site near Beijing in June 2013, Adv. Atmos. Sci., 35, 209–217, 2018.
Zhao, C., Wang, Y., Shi, X., Zhang, D., Wang, C., Jiang, J. H., Zhang, Q., and Fan, H.: Estimating the Contribution of Local Primary Emissions to Particulate Pollution Using High-Density Station Observations, J. Geophys. Res.-Atmos., 124, 1648–1661, 2019a.
Zhao, C., Yang, Y., Fan, H., Huang, J., Fu, Y., Zhang, X., Kang, S., Cong, Z., Letu, H., and Menenti, M.: Aerosol characteristics and impacts on weather and climate over the Tibetan Plateau, Natl. Sci. Rev., 7, 492–495, https://doi.org/10.1093/NSR/NWZ184, 2019b.
Zhao, C., Yu, Y., Kuang, Y., Tao, J., and Zhao, G.: Recent progress of aerosol light-scattering enhancement factor studies in China, Adv. Atmos. Sci., 36, 1015–1026, 2019c.
Zhao, H., Che, H., Xia, X., Wang, Y., Wang, H., Wang, P., Ma, Y., Yang, H., Liu, Y., and Wang, Y.: Multiyear Ground-Based Measurements of Aerosol Optical Properties and Direct Radiative Effect Over Different Surface Types in Northeastern China, J. Geophys. Res.-Atmos., 123, 13887–13916, 2018.
Zhao, S., Zhang, H., and Xie, B.: The effects of El Niño–Southern Oscillation on the winter haze pollution of China, Atmos. Chem. Phys., 18, 1863–1877, https://doi.org/10.5194/acp-18-1863-2018, 2018.
Zheng, B., Tong, D., Li, M., Liu, F., Hong, C., Geng, G., Li, H., Li, X., Peng, L., Qi, J., Yan, L., Zhang, Y., Zhao, H., Zheng, Y., He, K., and Zhang, Q.: Trends in China's anthropogenic emissions since 2010 as the consequence of clean air actions, Atmos. Chem. Phys., 18, 14095–14111, https://doi.org/10.5194/acp-18-14095-2018, 2018.
Zhong, Q., Ma, J., Shen, G., Shen, H., Zhu, X., Yun, X., Meng, W., Cheng, H., Liu, J., Li, B., Wang, X., Zeng, E. Y., Guan, D., and Tao, S.: Distinguishing Emission-Associated Ambient Air PM2.5 Concentrations and Meteorological Factor-Induced Fluctuations, Environ. Sci. Technol., 52, 10416–10425, https://doi.org/10.1021/acs.est.8b02685, 2018.