the Creative Commons Attribution 4.0 License.
the Creative Commons Attribution 4.0 License.
Why do models perform differently on particulate matter over East Asia? A multi-model intercomparison study for MICS-Asia III
Jiani Tan
Gregory R. Carmichael
Syuichi Itahashi
Zhining Tao
Kan Huang
Xinyi Dong
Kazuyo Yamaji
Tatsuya Nagashima
Xuemei Wang
Yiming Liu
Hyo-Jung Lee
Chuan-Yao Lin
Baozhu Ge
Mizuo Kajino
Jia Zhu
Meigen Zhang
Hong Liao
Zifa Wang
This study compares the performance of 12 regional chemical transport models (CTMs) from the third phase of the Model Inter-Comparison Study for Asia (MICS-Asia III) on simulating the particulate matter (PM) over East Asia (EA) in 2010. The participating models include the Weather Research and Forecasting model coupled with Community Multiscale Air Quality (WRF-CMAQ; v4.7.1 and v5.0.2), the Regional Atmospheric Modeling System coupled with CMAQ (RAMS-CMAQ; v4.7.1 and v5.0.2), the Weather Research and Forecasting model coupled with chemistry (WRF-Chem; v3.6.1 and v3.7.1), Goddard Earth Observing System coupled with chemistry (GEOS-Chem), a non-hydrostatic model coupled with chemistry (NHM-Chem), the Nested Air Quality Prediction Modeling System (NAQPMS) and the NASA-Unified WRF (NU-WRF). This study investigates three model processes as the possible reasons for different model performances on PM. (1) Models perform very differently in the gas–particle conversion of sulfur (S) and oxidized nitrogen (N). The model differences in sulfur oxidation ratio (50 %) are of the same magnitude as that in concentrations. The gas–particle conversion is one of the main reasons for different model performances on fine mode PM. (2) Models without dust emission modules can perform well on PM10 at non-dust-affected sites but largely underestimate (up to 50 %) the PM10 concentrations at dust sites. The implementation of dust emission modules in the models has largely improved the model accuracies at dust sites (reduce model bias to −20 %). However, both the magnitude and distribution of dust pollution are not fully captured. (3) The amounts of modeled depositions vary among models by 75 %, 39 %, 21 % and 38 % for S wet, S dry, N wet and N dry depositions, respectively. Large inter-model differences are found in the washout ratios of wet deposition (at most 170 % in India) and dry deposition velocities (generally 0.3–2 cm s−1 differences over inland regions).
- Article
(21146 KB) - Full-text XML
-
Supplement
(567 KB) - BibTeX
- EndNote
Atmospheric pollution due to particulate matter (PM) has raised worldwide attention for its relationship with environmental and public health issues (Fuzzi et al., 2015; Nel, 2005). Fine particles (PM2.5) are associated with cardiovascular- and respiratory-related cancers and premature death (Hoek and Raaschou-Nielsen, 2014; Knol et al., 2009). Outdoor PM2.5 pollution is estimated to cause 2.1–5.2 million premature deaths worldwide annually (Lelieveld et al., 2015; Rao et al., 2012; Silva et al., 2013). It accounted for 8 % of global mortality in 2015 and ranks fifth in the list of global mortality risk (Cohen et al., 2017). East Asia (EA) has been suffering from severe PM pollution due to anthropogenic emissions and natural dust emissions (Akimoto, 2003). China and India are the top two countries suffering from outdoor air pollution, which altogether accounted for 20 % of global mortality caused by PM2.5 exposure in 2010 (Lelieveld et al., 2015). The mixing of dust with anthropogenic pollutants can even increase the effects of pollution (Li et al., 2012). However, the impact evaluation of PM pollution is of high uncertainty due to the unclearness of the toxicity of PM components (Lippmann, 2014) and difficulty in the measurement and prediction of PM concentrations.
For a better understanding of PM pollution, a modeling approach has been adopted to study the spatial distributions of PM with the aid of measurements. The multi-model ensemble approach, which interprets modeling results with combined information from several models, has been proven to increase the reliability of model accuracy (Tebaldi and Knutti, 2007). This method has been widely used for studies in Europe (Bessagnet et al., 2016; Vivanco et al., 2017) and at global scales (Lamarque et al., 2013; Galmarini et al., 2017) on air quality issues. The Model Inter-Comparison Study for Asia (MICS-Asia) aims at understanding the air quality issues in EA. The first phase of MICS-Asia (MICS-Asia I) was carried out in the 1990s with eight regional chemical transport models (CTMs). The study focused on air pollution issues related to sulfur (S, including SO2, and wet deposition). The second phase of MICS-Asia (MICS-Asia II) was launched in the early 2000s with nine CTMs (Carmichael and Ueda, 2008). The study covered the chemistry and transport of S, nitrogen (N), PM and acid deposition. Multi-model results on , and (SNA) were evaluated with measurements from 14 sites of Acid Deposition Monitoring Network in East Asia (EANET) and the Fukue site in Japan. However, a non-exhaustive evaluation on PM10 concentrations in China with scarce datasets left an unclear view of the models' ability in this area, a region recognized as one of the most heavily polluted in EA. Meanwhile, model results were found with high inconsistencies on simulating both gas and aerosol phases of S and N (Hayami et al., 2008). Further efforts are needed to investigate the reasons for model differences to improve model accuracies.
This study compares the performance of 12 regional models which participated in the third phase of MICS-Asia (MICS-Asia III) on simulating PM over EA. The comparison among models aims at identifying the reasons for different model performances. The models involved in this study include the Weather Research and Forecasting Model (WRF) coupled with Community Multiscale Air Quality (CMAQ) modeling (version 4.7.1 and v5.0.2), the Regional Atmospheric Modeling System coupled with CMAQ (RAMS-CMAQ), WRF model coupled with chemistry (WRF-Chem) (v3.6.1 and v3.7.1), Goddard Earth Observing System coupled with chemistry (GEOS-Chem), a non-hydrostatic model coupled with chemistry (NHM-Chem), the Nested Air Quality Prediction Modeling System (NAQPMS) and the NASA-Unified WRF (NU-WRF). The models' performance on simulating PM has been reported in a companion paper (Chen et al., 2019). The main findings are described in Sect. 3.1. Section 3.2–3.4 examine the influences of three model processes on model performance: (1) formation of fine particles (PMF) – model differences in the gas–particle conversion; (2) formation of coarse particles (PMC) – model improvements by implementing dust emission modules for simulating PM and the remaining problems; and (3) removal processes of particles from the atmosphere – uncertainties lie in the efficiencies of wet and dry depositions. Section 4 concludes the findings of this study and provides suggestions for further study.
Table 1Multi-model performance on simulating annual average concentrations of PM10 at the dust and non-dust sites (unit: µg m−3).
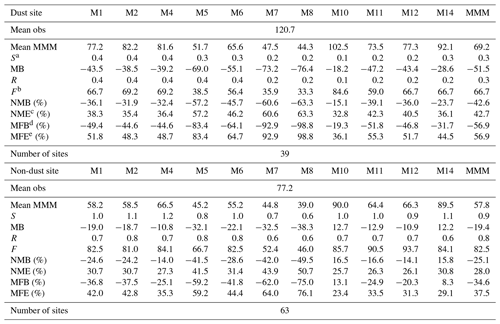
a S stands for linear fit slope. b F stands for fraction (of model results) within ±50 % of observation. c NME stands for normalized mean error. d MFB stands for mean fractional bias. e MFE stands for mean fractional gross error.
2.1 Framework of MICS-Asia
MICS-Asia is a model intercomparison study with contributions from international modeling groups to simulate the air quality and deposition over EA. MICS-Asia I focused on air quality issues related to S. The multi-model performances on simulating SO2 and concentrations and wet deposition were evaluated with observations from 18 stations (Carmichael et al., 2002). A source–receptor relationship of S deposition was developed based on the sensitivity simulations for seven prescribed receptor regions: Komae, Oki, Fukue, Yangyang, Beijing, Nanjing and Taichung (Carmichael et al., 2002).
MICS-Asia II was initiated in 2003. Nine regional models simulated the air quality for 4 months (March, July and December of 2001 and March of 2002) to study the chemistry and transport of air pollutants and acid deposition (Carmichael and Ueda, 2008). All modeling groups were enforced to use the same emission: the Transport and Chemical Evolution over the Pacific (TRACE-P) emission of 2000 and common initial condition (IC) and boundary condition (BC) to facilitate a comparison between the physical and chemical mechanisms of the models. The modeling species expanded to S, N, O3, PM and acid deposition. Model evaluations and major findings can be found in the literature (Carmichael et al., 2008; Fu et al., 2008; Han et al., 2008; Hayami et al., 2008).
MICS-Asia III was launched in 2010. The simulation time covers the whole year of 2010. All modeling groups are required to use the prescribed anthropogenic emissions and natural inputs (including biogenic emissions, biomass burning emissions and volcanic SO2 emissions. Dust and sea-salt emissions are produced by the corresponding modules in different models) (Li et al., 2017). Three purposes are set for this project. Topic I aims at evaluating the strengths and weaknesses of current multi-scale air quality models in simulating air qualities over EA and providing suggestions to reduce uncertainty for future simulations. Topic II intends to develop a reliable anthropogenic emission inventory for EA. The purpose of Topic III is to investigate the interaction of aerosol–weather–climate by using online coupled air quality models. This study focuses on Topic I.
2.2 Model configurations
The model setup can be found in Table 1 of Chen et al. (2019). Fourteen modeling groups (M1-M14) participated, but M3 and M9 are not included in this study due to uncompleted model submissions. The M14 model has a smaller simulation domain than the others; therefore, it is not included in the multi-model mean (MMM) results. The gas and aerosol modules and dust schemes employed by the participating models were introduced in detail in Sect. 2.1 of Chen et al. (2019). The following are the descriptions on the model setup for wet and dry depositions.
Wet deposition removes gases and aerosols from the atmosphere by rain droplets, involving both in-cloud scavenging (rainout) and below-cloud scavenging (washout). The gases in the atmosphere are dissolved in the raindrop and then removed from the atmosphere. For the nonreactive gases, the removal rate depends on the solubility of gases and is a function of Henry's law. Particles take part in the cloud condensation nuclei in the presence of supersaturated water vapor and then grow into cloud droplets. In this study, only M2, M4, M6, M11 and M12 submitted the main components of S and N depositions. All these models use the same wet deposition scheme based on Henry's law. The efficiency of wet deposition is assessed by the so-called “washout ratio”, calculated as the ratio of particle concentrations in deposition to particle concentrations in surface air as shown in Eq. (1).
where λwet (%) is the washout ratio for wet deposition, Cdepo (µg m−3) is the concentration of particles in deposition and Csurface_air (µg m−3) is the concentration of particles at near-surface atmosphere.
Dry deposition is mainly driven by turbulent and molecular diffusion processes. All models except M12 use the same dry deposition scheme from Wesely (1989). The dry deposition flux is proportional to the concentration of pollutants at height. The dry deposition velocity is calculated with Eq. (2).
where Fc (mg m−2 yr−1) is the dry deposition flux, Vd (cm s−1) is the deposition velocity and Ca (µg m−3) is the concentration of species at height. The negative mark indicates the direction of the dry deposition velocity. The Vd is determined by the resistance of the air layer (r). The total r is composed of three factors (Eq. 3): the aerodynamic resistance (ra), boundary layer resistance (rbc) and canopy resistance (rsurf).
M12 uses the general approach from Wesely (1989) and updates from Zhang et al. (2003). Zhang et al. (2003) update the value of non-stomatal resistance (rns), which is a component of rsurf related to the soil uptake and cuticle uptake of dry deposition. A model evaluation shows the updates can improve the model prediction of dry deposition velocities of SO2 (Zhang et al., 2003).
2.3 Observational data
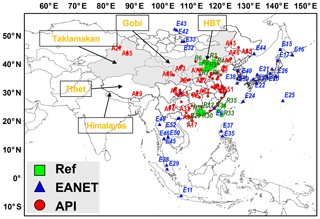
To make the discussion clear, we define the regions used in the following analysis here: northern EA (Russia and Mongolia), central EA (China), eastern EA (Japan and the Korean Peninsula) and southern EA (Cambodia, Lao PDR, Myanmar, Thailand, Vietnam, Indonesia, Malaysia and the Philippines). The following monitoring datasets are used in the analysis in Sect. 3.2–3.4. The air pollution index (API) provides monthly average PM10 data from 86 sites (A1–A86 in Fig. 1) (http://www.mee.gov.cn/, last access: 17 June 2020). This dataset has been widely used to study PM pollution (Qu et al., 2010; Chen et al., 2008; Deng et al., 2011), as well as for model evaluation (Wang et al., 2012; Xing et al., 2015) in China. It was replaced by the air quality index (AQI) in 2013. The API data cover eastern China well with intensively located sites, but sites in western China are very limited. EANET (E1-E54) provides monthly average concentrations of PM10 and SNA, as well as S and N depositions, from 54 sites (http://www.eanet.asia/, last access: 28 May 2018). For PM10, this dataset has a very limited number of sites in China. The sites are generally located along the east coast of China and could not cover the areas with high PM10 pollution well, such as the Hebei–Beijing–Tianjin (HBT) region (Fig. 1). The data completeness in northern EA is not as satisfying as the other regions. Only three sites located in Rishiri (E15), Ochiishi (E16) and Oki (E21) in Japan have PM2.5 observations during our study period. R1-R35 (green) are 35 reference (Ref) sites provided by the Institute of Atmospheric Physics Chinese Academy of Science (IAP-CAS). The sites are concentrated in three regions: HBT region, Pearl River Delta (PRD) and Taiwan.
3.1 Brief results of model performance evaluation
All models have submitted the monthly average concentrations of PM10, PM2.5 and SNA at the surface layer except PM10 from M13 and and from M10. An evaluation of the models' performance on aerosols can be found in our companion paper (Chen et al., 2019). The following are the main findings. The differences between MMM and observational and satellite data for the surface concentrations of PM10, PM2.5, , and and the column integrated aerosol optical depth (AOD) were −32.6 %, 4.4 %, −19.1 %, 4.9 %, 14.0 % and 18.7 %, respectively (calculated with normalized mean biases, NMBs). PM10 concentrations were generally underestimated over the simulation domain. PM2.5 concentrations were also underestimated over eastern EA but were simulated well in central EA. The models failed to reproduce the high peaks of concentrations in central EA probably due to missing formation mechanisms (such as heterogeneous chemistry), which have been reported as an important formation pathway of in China. concentrations were overpredicted by most models over the simulation domain and were associated with the underestimation of . The M7 and M8 models produced significantly lower concentrations than observations and other models due to the underestimation of NH3 concentrations, which might be caused by low NH3 emissions, and missing N2O5 heterogeneous reactions, which serve as an important formation pathway of (Chen et al., 2019). The spatial distributions of AOD were generally simulated well, but several models were found to underestimate the AOD values around the Himalaya mountains, Taklamakan Desert and Gobi Desert.
This study compares the models' performance with a global-scale model study. The Task Force on Hemispheric Transport of Air Pollution (TF HTAP) is an intercomparison study of global and regional models to assess the impact of the hemispheric transport of air pollutants on regional atmosphere. The second phase of HTAP (HTAP-II) involved more than 20 global models to simulate the air quality in 2010 (Galmarini et al., 2017). Most models utilize coarse-resolution grids at about 2–3∘. HTAP-II and MICS-Asia III share some common points like using the same emission inventory in East Asia (Li et al., 2017) and using the same observational dataset to evaluate PM10 (more than 100 EANET and API sites) and PM2.5 (two EANET sites) (Dong et al., 2018). The mean bias (MB) of PM10 over EA is −30.7 and −18.6 µg m−3 for HTAP-II and this study, respectively (values for sites used by both studies). The MB of PM2.5 is −1.6 and −4.3 µg m−3 for HTAP-II and this study, respectively. Both studies find an underestimation of PM10 concentrations, while PM2.5 concentrations are produced well. The models of MICS-Asia III perform slightly better than those of HTAP-II with lower model bias in PM10, probably taking advantage of finer resolutions of model grids.
The so-called “diagnostic evaluation” approach is adopted to check the model bias oriented by individual processes (Dennis et al., 2010). Although all modeling groups are required to use the prescribed emission inventory, a mismatch was found during the temporal and vertical treatments of emission files by different modeling groups which has caused differences in the model inputs (Itahashi et al., 2020). To avoid the possible impacts on the inter-model comparison, we compare the indicators (i.e., sulfur oxidation ratio, SOR) instead of direct model outputs (i.e., concentrations) to focus on the differences caused by model mechanisms. The following three processes are examined.
-
Formation of PMF. Section 3.2 investigates the differences in the gas–particle conversion of S and N among different models.
-
Formation of PMC. Section 3.3 assesses the models' ability to reproduce the spatial and temporal distributions of PM in regions affected by dust storms. A comparison is conducted between models with and without dust emission modules.
-
Removal of particles from the atmosphere. Section 3.4 compares the models' performance in simulating the amounts of deposition and the efficiencies of wet and dry depositions.
3.2 Gas–particle conversion
The following two indicators are calculated to illustrate the gas–particle conversions of S and N.
where n-, n-SO2, n- and n-NO2 (mol m−3) are the mole concentrations of particles, SO2 gas, particles and NO2 gas. The C(NO2) (%) indicator only has and NO2 in the denominator due to the limitations of observational data, but it still can portray the conversion of N between the gas phase and the particle phase.
Figures 2 and 3 show the distributions of the SOR and C(NO2) values of the models. The SOR values are lowest around the HBT region in northeastern China (10 %–40 %) and highest in southwestern China (60 %–80 %) (Fig. 2). The CMAQ models (including WRF-CMAQ and RAMS-CMAQ) produce similar SOR patterns, except that the CMAQv5.0.2 models (M1 and M2) predict a 10 % higher SOR in the HBT region than the CMAQv4.7.1 models (M4, M5 and M6). CMAQv502 updated the production of in the aqueous reaction of the older version (Appel et al., 2013; Fountoukis and Nenes, 2007). The explicit treatment of Fe and Mn allows a more consistent treatment of aqueous reactions from SO2 to . For the Chem models (including WRF-Chem, GEOS-Chem and NHM-Chem), the two WRF-Chem models (M7 and M8) produce similar SOR magnitudes and distributions in all regions except southwestern China (around Tibet in Fig. 1) and the open oceans, while the NHM-Chem (M12) and GEOS-Chem (M13) models produce slightly higher SOR values over the whole simulation domain. The differences between the CMAQ and the Chem models are significant over the inland regions of northern and eastern China, Japan, and southern EA. The CMAQ models generally predict 5 %–20 % higher SOR values than the Chem models. Similarly, the CMAQ models generally give 20 % higher C(NO2) values than the WRF-Chem models especially in eastern EA (Fig. 3). The C(NO2) of M8 is extremely low due to unreasonably low concentrations.
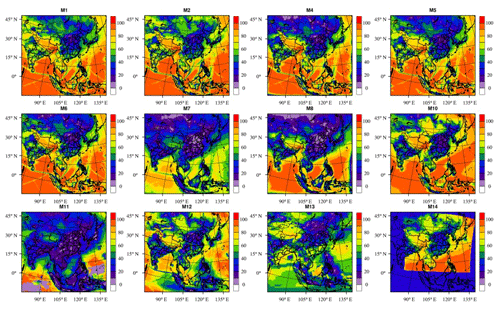
Figure 2SOR values at the surface layer for models (unit: %). The SOR is calculated by %. The SO2 and concentrations are converted from (ppb) and (µg m−3) to (mol (S) m−3) before calculating the SOR. Values are calculated by annual average data.
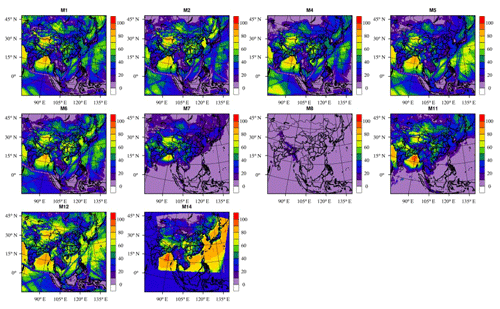
Figure 3Same as Fig. 2 but for C(NO2) (unit: %). C(NO2) is calculated by %. The C(NO2) of M8 is extremely low due to the unreasonably low concentration, which is considered an outlier in this study. Values are calculated by annual average data.
Figure 4 shows the gas–particle conversions of S and N by models and observations at the EANET sites. The red bars represent concentrations of gases, and the black bars represent concentrations of aerosols. The values with the blue color above the bars are observed and modeled SORs and C(NO2) values. Results for individual sites are available in the Supplement Fig. S1. According to Fig. 4a, the total amount of S (SO2 gas+SO particle) is about 0.15 µmol (S) m−3. Most models have biases on this value especially the moderate underestimation by M7, M8 and M13. On the other hand, the SOR value (0.25) is well simulated by M1 (0.26), M2 (0.20), M10 (0.29) and M13 (0.26). Other models generally underpredict the SOR value except M12 (0.33) and M14 (0.57). The WRF-CMAQv5.0.2 models (M1 and M2) produce higher SORs than the WRF-CMAQv4.7.1 models (M4, M5 and M6), probably attributed to the updates in the formation pathway of .
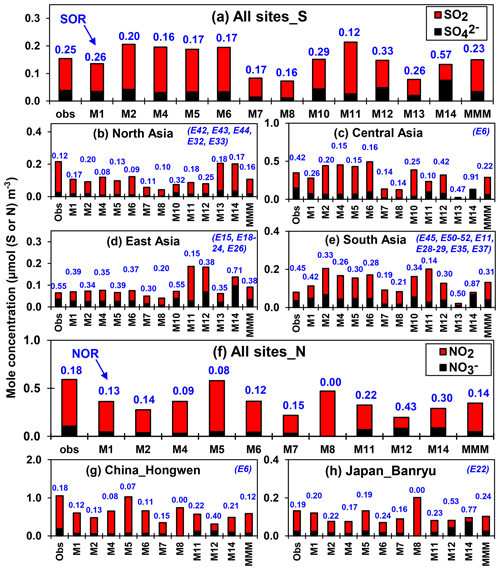
Figure 4Gas–particle conversions of S and N from observations and models at EANET sites. The unit is micromoles of sulfur or nitrogen per cubic meter (µmol (S or N) m−3). The red bars and black bars represent the concentrations of gases and aerosols. The blue-colored values above the bars are observed and modeled SORs and C(NO2). Values are calculated with annual average concentrations. The concentrations of gases and aerosols are all converted to (µmol (S or N) m−3) before calculation. The blue-colored numbers to the top right (e.g., E22) are site numbers. The locations of the sites are illustrated in Fig. 1. Results for individual sites are shown in Supplement Fig. S1.
Figure 4b–e show the results in different regions. In northern EA, the total amount of S is underestimated by all models except M13 and M14. However, the SOR value (0.12) is reproduced well by most models (0.08–0.20) except M12 (0.25) and M10 (0.32). There is only one site available for central EA. Most models (except M12 and M13) have largely underestimated the SOR value, while M14 has largely overestimated it. For eastern EA, the total amount of S is captured well by all models except M11, M12 and M14. The SOR value (0.55) is generally underestimated by all models except M10 (0.55) and M14 (0.71). For southern EA, the total amount of S is generally overestimated by all models except M13, while the SOR value is underestimated by all models except M13 and M14. Overall, the models have both positive and negative biases in simulating the total amounts of S, but they generally underestimate the SOR values in all regions. Furthermore, the modeled SOR values vary largely among models (ranging from 0.12 to 0.57), resulting in a large inter-model difference (1 standard deviation %, SD %, =50 %, SD % is calculated as 100 %×1 SD ∕ MMM). This variation is of the same magnitude as the variation of concentrations (1 SD % =50 % in Supplement Fig. S2). The results suggest that differences in gas–particle conversion among models could account largely for the models' inconsistency in simulating the concentrations.
Figure 4f–h compare the gas–particle conversion of N with the C(NO2) indicator. Only one site in China and one site in Japan have both NO2 and observations. At the Hongwen sites in China, all models except M5 underestimate the sum of NO2 and , but the modeled C(NO2) values are close to the observation (0.18) except M5 (0.07), M8 (0.00) and M12 (0.40). Similar to the results of S conversion, the newer version of the WRF-CMAQ model generally produces higher C(NO2) than the older version, but the differences between the two in C(NO2) are smaller than those for SOR. At the Banryu site in Japan, the sum of NO2 and is simulated well by all models except M8. The C(NO2) (0.19) value is also simulated well by all models except M8 (0.00), M12 (0.53) and M14 (0.77). Overall, the model accuracy of C(NO2) is slightly higher than that of SOR according to the comparison with observed values. The models also have higher consistencies with C(NO2) than SOR. However, further validation is required due to the limited number of observations for the conversion of N.
Besides the inter-model differences in the pathways of and formation, the interaction between aerosols and atmospheric oxidants can also affect the formation of aerosols (Liao et al., 2003). Aerosols affect the tropospheric oxidant (i.e., HOx) budget by altering the photolysis rates and uptake of reactive gases (Tie et al., 2005; Li et al., 2018). In turn, the abundance of HOx affects the gas–aerosol conversion of S and N. In addition, the conversion between sulfuric acid and depends on the abundance of neutralizers such as Na+ and .
3.3 Implementation of dust emission modules in the models
The PMC concentrations at the surface layer are calculated by subtracting PM2.5 from PM10. Figure 5 shows the spatial distribution of annual average PMC in the models. Most models show very low (<2 µg m−3) concentrations of PMC around the Taklamakan Desert and the Gobi Desert in northern China except M10, M11 and M14. These three models use dust emission modules in simulations (Chen et al., 2019). M12 also includes dust emissions, but its PM10 concentrations over northern China are much lower than the three models. The predicted PMC concentrations of the three models differ largely. The domain-average concentrations of PMC are 21, 7 and 12 µg m−3 for M10, M11 and M14, respectively. The distributions of PMC also differ largely over northwestern China, where the impacts of dust are most significant. The differences among the models mainly come from the different parameterizations such as source functions, dust-lifting mechanisms and the size distributions of particles (Chen et al., 2019). Different PMC concentrations are also found over oceans, mainly attributed to the sea-salt emissions in this study. The sea-salt emissions are parameterized in the models with various formulas (Chen et al., 2019). In this study, the WRF-Chem models (M7 and M8) turned off the sea-salt emissions; thus, their PMC concentrations over the oceans and seas are not defined. The two WRF-CMAQ models use the in-line sea-salt emission module of Gong (2003) with updates by Kelly et al. (2010). They predict consistent distributions of PMC over oceans. M10 and M11 use the same module as the CMAQ models (Gong, 2003) but produce higher PMC over oceans. M12 adopts the method of breaking waves over the seashore by Clarke et al. (2006) and produces the highest PMC over oceans among all models.
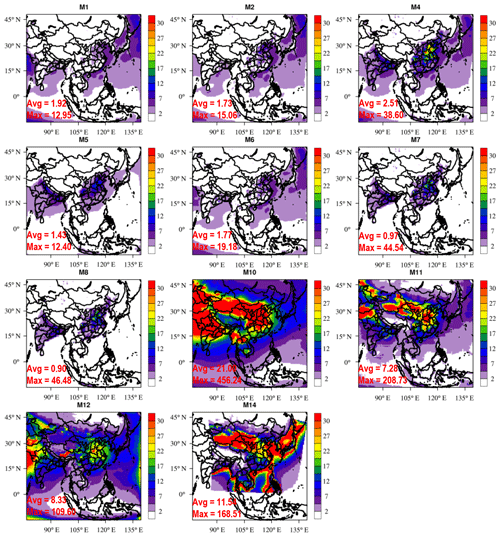
Figure 5Annual average PMC concentrations at the surface layer of individual models (µg m−3). The value is calculated by subtracting PM2.5 from PM10. The values in the bottom left are domain average (Avg) and maximum (Max) values.
The implementation of dust emissions is expected to improve the models' performance, but how significant could the improvement be? Can models predict the PM concentrations reasonably at regions affected by dust with current dust emission modules? To answer these questions, all sites are grouped as dust and non-dust sites according to their locations. The sites located in regions that have been reported to receive severe impacts and the rapid deposition of dust are marked as dust sites (Shao and Dong, 2006) (gray-colored shaded areas in Fig. 1). Figure 6a–b and Table 1 compare the models' performance at the dust and non-dust sites. For the non-dust sites (Fig. 6b), most models have captured well the magnitudes of PM10 at the “API non-coastal, non-dust” sites (MB % and NMB %). The sites marked “API coastal”, which are located close to the coastal regions, are all slightly underestimated by about 25 µg m−3 (30 %). Similarly, the PRD and Taiwan sites, which are also located near the coastal regions, are all underestimated by about 20 µg m−3 (37 %). Bias in sea-salt emissions is the possible reason. Sea-salt emissions are reported to contribute 20 %–40 % of SNA and PM10 over coastal regions (Liu et al., 2015). Including the sea-salt emissions in model simulations can improve the model accuracy with an 8 %–20 % increase in PM10, SNA, Na+ and Cl− (Kelly et al., 2010; Im, 2013). The influence of sea-salt emissions is not the focus of this study, but further study is strongly recommended.
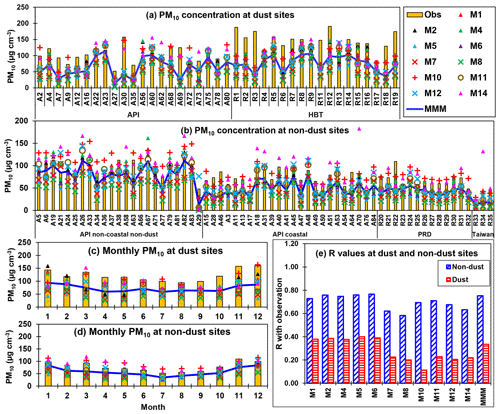
Figure 6Multi-model performances on simulating (a–b) annual average PM10 concentrations at the dust sites and non-dust sites and (c–d) monthly average PM10 concentrations at the dust sites and non-dust sites. The x axis for (a–b) indicates site numbers. The locations of the sites are illustrated in Fig. 1. The yellow bars are observations, the blue lines are the MMM and different markers represent individual model results. The R values (e) between model results and observations at the dust and non-dust sites.
For the dust sites (Fig. 6a), most models have generally underestimated the PM10 concentrations by 10–40 µg m−3 (15 %–50 %). The three models with dust modules perform better than the others at the dust sites, especially site A2, A30, A68, A69, R5 and R18. However, they miss the high PM10 concentrations at sites like R1–R3 and R11 and overestimate the PM10 concentrations at sites such as A60 and A80. This indicates that the dust emission modules involved in this study can not fully capture the magnitudes and distributions of dust pollution over EA. In addition, the modeled PMC differs a lot with different dust emission modules (Fig. 5). The M10 model produces very high PMC over the whole of eastern China, while the M11 model only predicts high PMC around the HBT region. Overall, the models' performance with PM over dust regions can be improved largely by including dust emission modules. However, the concentrations and distributions are not yet captured well, and large inconsistencies are found among different dust emission modules.
Figure 6c–d compare the modeled monthly trends of PM10 with observations at the dust and non-dust sites, and Fig. 6e shows the correlation (R) values between models and observations. For the non-dust sites (Fig. 6d), the trends are caught well by most models. The R values are close to 0.70 for all models except M7 (0.62), M8 (0.58) and M14 (0.63). The WRF-Chem models (M7 and M8) simulate too low PM10 concentrations in winter. The M14 model overestimates the PM10 concentrations from March to May. Most models have much lower R values at the dust sites than the non-dust sites (Fig. 6e) due to the underestimation of the PM10 concentrations during winter. For instance, R values of M10 drop from 0.7 at the non-dust sites to 0.11 at the dust sites. Spring (March, April and May) has the largest model biases at the dust sites, which is coincident with the dust storm season in Asia (Arimoto et al., 2006). The M10 and M14 models perform well in most months at both the dust and non-dust sites, taking advantage of their dust emission modules, but their R values at the dust sites are still low. Future study is strongly suggested for a better understanding of the seasonal variations of dust pollution.
3.4 Wet and dry depositions
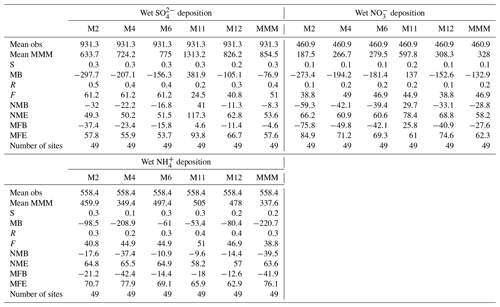
Figure 7 and Table 2 show the models' performance on simulating wet deposition. For wet deposition, despite the fact that the two sites with the highest deposition (E2 and E3) in China are underestimated, the other sites are generally well simulated by MMM with a low MB of −8 %. The individual model bias varies from −22 % to 41 %. The CMAQ models (M2, M4 and M6) all underestimate the wet deposition. There are large differences between CMAQv4.7.1 and CMAQv5.0.2 in Japan, where the CMAQv4.7.1 models (M4 and M6) slightly overestimate the wet deposition at E19 and E23, while the CMAQv5.0.2 model (M2) slightly underestimates the value at these sites. The M11 model produces a considerably higher wet deposition of and than the other models in eastern EA. The possible reasons are discussed later. The MMM underestimates the wet deposition by 29 % due to the large underprediction in southern EA. Southern EA has several sites with very high depositions, such as the E29 site in Malaysia and the E35 and E36 sites in the Philippines, but all models fail to catch those high peaks. The individual model bias varies from −59 % to 30 % among the models. M2, M4, M6 and M12 perform similarly with a high underestimation ranging from 39 % to 59 %. M11 is the only model that succeeds in capturing the high wet deposition at E2 and E3 in China, but it overestimates most sites in China, Japan and the Korean Peninsula. In the case of wet deposition, the MMM generally underestimates the amount at all sites with a bias of −40 % especially at E2–E4 in China, E45 in Thailand, and E35 and E36 in the Philippines. The individual model bias varies from −10 % to −37 %. The M2, M4 and M6 models perform similarly, while the M11 and M12 models predict higher depositions at all sites. Overall, large inter-model disagreements are found in eastern EA for wet depositions of and and in southern EA for the wet deposition. The observations of dry depositions are composed by the observed concentration of air pollutants and the simulated deposition velocity. Since the EANET network only provides the former, a complete evaluation of the dry deposition is not available in this study (complete observation for dry deposition with velocity is available after 2013).
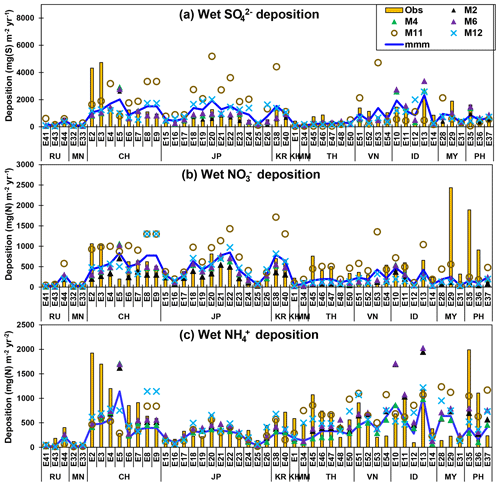
Figure 7Modeled annual-accumulated wet depositions of , and compared with observations from the EANET network. The units are (mg (S or N) m−2 yr−1). Abbreviation for regions: RU – Russia, MN – Mongolia, CH – China, JP – Japan, KR – the Korean Peninsula, KH – Cambodia, MN – Myanmar, TH – Thailand, VN – Vietnam, ID – Indonesia, MY – Malaysia and PH – the Philippines.
Table 3 lists the domain-total, annual-accumulated amounts of S and N depositions by the models. The total wet S deposition (DSwet) includes wet depositions of SO2, H2SO4 and . The total dry S deposition (DSdry) includes dry depositions of SO2, H2SO4 and . The total wet N deposition (DNwet) includes wet depositions of , , HNO3 and NH3. The total dry N deposition (DNdry) includes dry depositions of NO, NO2, , , HNO3 and NH3. DSwet values range from 10.5 to 31.3 Tg (S) yr−1 among models (1 SD % =75 %). The estimation by the M11 model is 2-fold higher than the other four models. The inter-model difference is significant even among the same type of models with different versions. The CMAQv4.7.1 models (M4 and M6) produce 12.5 Tg (S) yr−1 (M4) and 13.8 Tg (S) yr−1 (M6) of DSwet, while the prediction by the CMAQv5.0.2 model (M2) is 25 % lower. Despite the large discrepancies in the total amount, all five models agree that over 95 % of DSwet is wet deposition. The total amounts of DSdry range from 4.3 to 10.6 Tg (S) yr−1 among models (1 SD % =39 %). M11 predicts higher DSdry than the other models, and the CMAQv5.0.2 model (M2) predicts 45 % lower DSdry than the two CMAQv4.7.1 models (M4 and M6). Similar to DSwet, all models have strong agreements on the proportions of the components. DNwet ranges from 12.2 to 20.0 Tg (N) yr−1 among models (1 SD % =21 %). The CMAQ models (M2, M4 and M6) simulate close results (12–15 Tg (N) yr−1), while M11 (20.0 Tg (N) yr−1) and M12 (16.5 Tg (N) yr−1) simulate slightly higher amounts. As for the proportion of components, the M2, M4, M6 and M12 models predict high proportions of wet and wet depositions (particle phase), while the M11 model produces higher percentages of wet HNO3 and wet NH3 depositions (gas phase). DNdry ranges from 3.9 to 14.1 Tg (N) yr−1 (1 SD % =38 %). M12 gives a considerably lower amount than the other models. The models are quite consistent on the proportions of components. The amount of wet deposition is determined by the Csurface_air and λwet (mentioned in Sect. 2.2). In this study, Csurface_air may be partially influenced by different model inputs, caused by a mismatch occurring in the vertical and temporal allocation of emission inputs and the employment of different mechanisms to produce dust and sea-salt emissions. Thus, we used λwet, instead of direct model outputs of wet deposition, as an indicator to reveal the inter-model differences of wet deposition in the following analysis. For the same reason, we used Vd as an indicator for the inter-model comparison of dry deposition.
Table 3Domain-total annual-accumulated S and N depositions of models (Tg (S or N) yr−1). Empty values mean no model submissions or the values are 0.
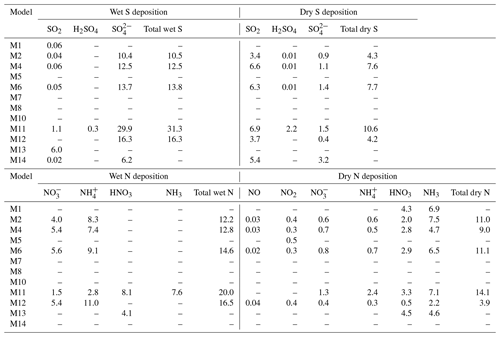
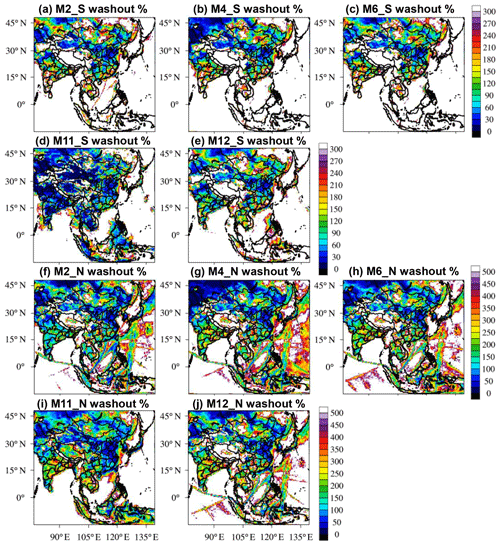
Figure 8Washout ratios (λwet) of (a–e) S deposition and (f–j) N deposition of models. Values are calculated with annual accumulated depositions. The unit is percent (%).
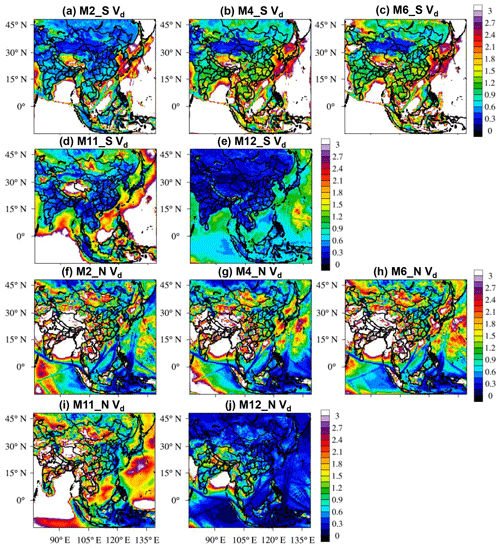
Figure 9Dry deposition velocities (Vd) of (a–e) S deposition and (f–j) N deposition of models. Values are calculated with annual accumulated depositions. The unit is (cm s−1).
Figure 8a–e show λwet of S deposition (λswet) by the models. The CMAQ models (M2, M4 and M6) have similar patterns for λswet over the inland regions, while the M12 model predicts 30 %–90 % lower ratios in India. The M11 model generally predicts about 20 %–70 % lower λswet than the other four models except India, where the difference could reach up to 170 %. For λwet of N deposition (λNwet) (Fig. 8f–j), the CMAQv4.7.1 models (M4 and M6) and M12 perform similarly, but the CMAQv5.0.2 model (M2) predicts 30 % lower λNwet in India, Japan and the Korean Peninsula. M11 generally predicts lower ratios in India (60 % lower), Indonesia and the Philippines (120 % lower) than the CMAQ models. Figure 9 shows the spatial distributions of Vd. For Vd of S deposition (VSd) (Fig. 9a–e), the CMAQ models (M2, M4 and M6) simulate very similar spatial distributions. The M11 and M12 models predict a 0.5 cm s−1 lower VSd than the CMAQ models over the whole inland regions especially in eastern China and the Indian peninsula. For Vd of N deposition (VNd) (Fig. 9f–j), the CMAQ models (M2, M4 and M6) predict very similar distributions. M11 and M12 predict about a 0.3 and 1–2 cm s−1 lower VNd than the CMAQ models over the inland regions. Both λwet and Vd of M11 are much lower than the other models especially over eastern EA. This is a possible reason for the biased performance of M11 for wet deposition (Fig. 7). Overall, large inter-model differences are found in predicting both the amounts of depositions and the efficiencies of depositions.
Topic I of the MICS-Asia III aims at (i) evaluating the strengths and weaknesses of current multiscale air quality models in simulating concentration and deposition fields over East Asia and (ii) providing suggestions for future model developments. This study compares the performance of 12 regional models for the prediction of PM concentrations over EA. The participating models include WRF-CMAQ (v4.7.1 and v5.0.2), RAMS-CMAQ, WRF-Chem (v3.6.1 and v3.7.1), GEOS-Chem, NHM-Chem, NAQPMS and NU-WRF. Three processes/mechanisms are investigated to identify the causes of inter-model differences.
For the formation of PMF, SOR and C(NO2) values are used to demonstrate the inter-model differences in gas–particle conversions. The SOR values are generally underestimated by most models at the EANET sites. A general trend is found that the WRF-CMAQv5.0.2 models produce the highest SOR values among all models, followed by the WRF-CMAQv4.7.1 models (10 % lower in the HBT region), the WRF-Chem models and other models (5 %–20 % lower over inland regions). The inter-model variation of SOR (1 SD % =50 %) is of the same magnitude as that of concentrations. Similar results are found in C(NO2), but models have stronger agreements on C(NO2) than SOR. The different treatments of gas–particle conversions account largely for the different model performances on simulating PMF.
For the formation of PMC, the models without dust emission modules generate very low (<2 µg m−3) PMC concentrations. They can capture well the PM10 concentrations at non-dust-affected sites but underestimate the PM10 concentrations at sites affected by dust storms by up to 50 %. This underestimation is largely improved by implementing dust emission modules (bias reduced to around −20 %). However, both the magnitude and distribution of dust pollution are not fully captured. In addition, models employing different dust emission modules show strong disagreements on the distribution of PMC.
For the removal of PM from the atmosphere, the amounts of atmospheric deposition vary largely among models (1 SD %) by 75 %, 39 %, 21 % and 38 % for DSwet, DSdry, DNwet and DNdry, respectively. The λwet and Vd indicators are used to exclude the influences brought by model inputs. For λwet, models agree more on the DSwet than DNwet. The largest model inconsistencies are found in India (up to 170 %), Indonesia and the Philippines (up to 120 %). For Vd, models differ more on DNdry than DSdry. The inter-model differences are widely found over the inland regions for DSdry (about 0.5 cm s−1) and DNdry (0.3–2 cm s−1).
The following are the main observations of this study. (1) We compare the modeled conversions of S and N between gas and particle phases with observations, which makes it possible to both quantify the inter-model differences and tell which module might be more reasonable. (2) Several new updates on dust modules have been published in recent literature, but there is limited study on the intercomparison. This study provides an opportunity to bring together the new updates on dust emission modules and review their performance in EA. (3) The study provides a comprehensive view on the total budget of S and N aerosols by including the analysis of the removal processes. It turns out that this process brings significant uncertainties to inter-model differences. It should be noted that other factors such as vertical diffusion can also contribute to model differences. Meanwhile, this study focuses on comparing the models' ability in simulating PM in 2010. The chemical regimes may have changed drastically due to the rapid changes in emissions and the implementation of control policies in Asia. Studies on more recent years and heavily polluted episodes are under preparation.
The observation data are introduced with details in Sect. 2.3 with web links of publicly available datasets. The model data are available upon request.
The supplement related to this article is available online at: https://doi.org/10.5194/acp-20-7393-2020-supplement.
JT and JSF designed the study. JT processed and analyzed the data. JSF, GRC, SI and ZT contributed to the results and discussions. JSF, ZT, KH, SI, KY, TN, YM, XW, YL, HJL, JEK, CYL, BG, MK, JZ, MZ, LH and ZW provided modeling data. All co-authors provided comments on the paper.
The authors declare that they have no conflict of interest.
This article is part of the special issue “Regional assessment of air pollution and climate change over East and Southeast Asia: results from MICS-Asia Phase III”. It is not associated with a conference.
We thank all participating modeling groups of MICS-Asia III. We acknowledge the support of the Advanced Computing Facility (ACF), Joint Institute for Computational Sciences of the University of Tennessee. We are also thankful for the support of the Oak Ridge National Laboratory for computational resources, which is supported by the Office of Science of the U.S. Department of Energy (contract DE-AC05-00OR22725).
This paper was edited by Alma Hodzic and Barbara Ervens and reviewed by three anonymous referees.
Akimoto, H.: Global air quality and pollution, Science, 302, 1716–1719, https://doi.org/10.1126/science.1092666, 2003.
Appel, K. W., Pouliot, G. A., Simon, H., Sarwar, G., Pye, H. O. T., Napelenok, S. L., Akhtar, F., and Roselle, S. J.: Evaluation of dust and trace metal estimates from the Community Multiscale Air Quality (CMAQ) model version 5.0, Geosci. Model Dev., 6, 883–899, https://doi.org/10.5194/gmd-6-883-2013, 2013.
Arimoto, R., Kim, Y. J., Kim, Y. P., Quinn, P. K., Bates, T. S., Anderson, T. L., Gong, S., Uno, I., Chin, M., Huebert, B. J., Clarke, A. D., Shinozuka, Y., Weber, R. J., Anderson, J. R., Guazzotti, S. A., Sullivan, R. C., Sodeman, D. A., Prather, K. A., and Sokolik, I. N.: Characterization of Asian Dust during ACE-Asia, Global Planet. Change, 52, 23–56, https://doi.org/10.1016/j.gloplacha.2006.02.013, 2006.
Bessagnet, B., Pirovano, G., Mircea, M., Cuvelier, C., Aulinger, A., Calori, G., Ciarelli, G., Manders, A., Stern, R., Tsyro, S., García Vivanco, M., Thunis, P., Pay, M.-T., Colette, A., Couvidat, F., Meleux, F., Rouïl, L., Ung, A., Aksoyoglu, S., Baldasano, J. M., Bieser, J., Briganti, G., Cappelletti, A., D'Isidoro, M., Finardi, S., Kranenburg, R., Silibello, C., Carnevale, C., Aas, W., Dupont, J.-C., Fagerli, H., Gonzalez, L., Menut, L., Prévôt, A. S. H., Roberts, P., and White, L.: Presentation of the EURODELTA III intercomparison exercise – evaluation of the chemistry transport models' performance on criteria pollutants and joint analysis with meteorology, Atmos. Chem. Phys., 16, 12667–12701, https://doi.org/10.5194/acp-16-12667-2016, 2016.
Carmichael, G. R. and Ueda, H.: MICS-Asia II: The model intercomparison study for Asia phase II, Atmos. Environ., 42, 3465–3467, https://doi.org/10.1016/j.atmosenv.2007.10.003, 2008.
Carmichael, G. R., Calori, G., Hayami, H., Uno, I., Cho, S. Y., Engardt, M., Kim, S. B., Ichikawa, Y., Ikeda, Y., Woo, J. H., Ueda, H., and Amann, M.: The MICS-Asia study: model intercomparison of long-range transport and sulfur deposition in East Asia, Atmos. Environ., 36, 175–199, https://doi.org/10.1016/S1352-2310(01)00448-4, 2002.
Carmichael, G. R., Sakurai, T., Streets, D., Hozumi, Y., Ueda, H., Park, S. U., Fung, C., Han, Z., Kajino, M., Engardt, M., Bennet, C., Hayami, H., Sartelet, K., Holloway, T., Wang, Z., Kannari, A., Fu, J., Matsuda, K., Thongboonchoo, N., and Amann, M.: MICS-Asia II: The model intercomparison study for Asia Phase II methodology and overview of findings, Atmos. Environ., 42, 3468–3490, https://doi.org/10.1016/j.atmosenv.2007.04.007, 2008.
Chen, L., Gao, Y., Zhang, M., Fu, J. S., Zhu, J., Liao, H., Li, J., Huang, K., Ge, B., Wang, X., Lam, Y. F., Lin, C.-Y., Itahashi, S., Nagashima, T., Kajino, M., Yamaji, K., Wang, Z., and Kurokawa, J.: MICS-Asia III: multi-model comparison and evaluation of aerosol over East Asia, Atmos. Chem. Phys., 19, 11911–11937, https://doi.org/10.5194/acp-19-11911-2019, 2019.
Chen, Z. H., Cheng, S. Y., Li, J. B., Guo, X. R., Wang, W. H., and Chen, D. S.: Relationship between atmospheric pollution processes and synoptic pressure patterns in northern China, Atmos. Environ., 42, 6078–6087, 10.1016/j.atmosenv.2008.03.043, 2008.
Clarke, A. D., Owens, S. R., and Zhou, J. C.: An ultrafine sea-salt flux from breaking waves: Implications for cloud condensation nuclei in the remote marine atmosphere, J. Geophys. Res.-Atmos., 111, D06202, https://doi.org/10.1029/2005JD006565, 2006.
Cohen, A. J., Brauer, M., Burnett, R., Anderson, H. R., Frostad, J., Estep, K., Balakrishnan, K., Brunekreef, B., Dandona, L., Dandona, R., Feigin, V., Freedman, G., Hubbell, B., Jobling, A., Kan, H., Knibbs, L., Liu, Y., Martin, R., Morawska, L., Pope, C. A., Shin, H., Straif, K., Shaddick, G., Thomas, M., van Dingenen, R., van Donkelaar, A., Vos, T., Murray, C. J. L., and Forouzanfar, M. H.: Estimates and 25-year trends of the global burden of disease attributable to ambient air pollution: an analysis of data from the Global Burden of Diseases Study 2015, Lancet, 389, 1907–1918, 10.1016/s0140-6736(17)30505-6, 2017.
Deng, J. J., Wang, T. J., Jiang, Z. Q., Xie, M., Zhang, R. J., Huang, X. X., and Zhu, J. L.: Characterization of visibility and its affecting factors over Nanjing, China, Atmos. Res., 101, 681–691, https://doi.org/10.1016/j.atmosres.2011.04.016, 2011.
Dennis, R., Fox, T., Fuentes, M., Gilliland, A., Hanna, S., Hogrefe, C., Irwin, J., Rao, S. T., Scheffe, R., Schere, K., Steyn, D., and Venkatram, A.: A framework for evaluating regional-scale numerical photochemical modeling systems, Environ. Fluid Mech., 10, 471–489, https://doi.org/10.1007/s10652-009-9163-2, 2010.
Dong, X., Fu, J. S., Zhu, Q., Sun, J., Tan, J., Keating, T., Sekiya, T., Sudo, K., Emmons, L., Tilmes, S., Jonson, J. E., Schulz, M., Bian, H., Chin, M., Davila, Y., Henze, D., Takemura, T., Benedictow, A. M. K., and Huang, K.: Long-range transport impacts on surface aerosol concentrations and the contributions to haze events in China: an HTAP2 multi-model study, Atmos. Chem. Phys., 18, 15581–15600, https://doi.org/10.5194/acp-18-15581-2018, 2018.
Fountoukis, C. and Nenes, A.: ISORROPIA II: a computationally efficient thermodynamic equilibrium model for K+–Ca2+–Mg2+––Na+–––Cl−–H2O aerosols, Atmos. Chem. Phys., 7, 4639–4659, https://doi.org/10.5194/acp-7-4639-2007, 2007.
Fu, J. S., Jang, C. J., Streets, D. G., Li, Z., Kwok, R., Park, R., and Han, Z.: MICS-Asia II: Modeling gaseous pollutants and evaluating an advanced modeling system over East Asia, Atmos. Environ., 42, 3571–3583, https://doi.org/10.1016/j.atmosenv.2007.07.058, 2008.
Fuzzi, S., Baltensperger, U., Carslaw, K., Decesari, S., Denier van der Gon, H., Facchini, M. C., Fowler, D., Koren, I., Langford, B., Lohmann, U., Nemitz, E., Pandis, S., Riipinen, I., Rudich, Y., Schaap, M., Slowik, J. G., Spracklen, D. V., Vignati, E., Wild, M., Williams, M., and Gilardoni, S.: Particulate matter, air quality and climate: lessons learned and future needs, Atmos. Chem. Phys., 15, 8217–8299, https://doi.org/10.5194/acp-15-8217-2015, 2015.
Galmarini, S., Koffi, B., Solazzo, E., Keating, T., Hogrefe, C., Schulz, M., Benedictow, A., Griesfeller, J. J., Janssens-Maenhout, G., Carmichael, G., Fu, J., and Dentener, F.: Technical note: Coordination and harmonization of the multi-scale, multi-model activities HTAP2, AQMEII3, and MICS-Asia3: simulations, emission inventories, boundary conditions, and model output formats, Atmos. Chem. Phys., 17, 1543–1555, https://doi.org/10.5194/acp-17-1543-2017, 2017.
Gong, S. L.: A parameterization of sea-salt aerosol source function for sub- and super-micron particles, Global Biogeochem. Cy., 17, 1097, https://doi.org/10.1029/2003GB002079, 2003.
Han, Z., Sakurai, T., Ueda, H., Carmichael, G. R., Streets, D., Hayami, H., Wang, Z., Holloway, T., Engardt, M., Hozumi, Y., Park, S. U., Kajino, M., Sartelet, K., Fung, C., Bennet, C., Thongboonchoo, N., Tang, Y., Chang, A., Matsuda, K., and Amann, M.: MICS-Asia II: Model intercomparison and evaluation of ozone and relevant species, Atmos. Environ., 42, 3491–3509, https://doi.org/10.1016/j.atmosenv.2007.07.031, 2008.
Hayami, H., Sakurai, T., Han, Z., Ueda, H., Carmichael, G. R., Streets, D., Holloway, T., Wang, Z., Thongboonchoo, N., Engardt, M., Bennet, C., Fung, C., Chang, A., Park, S. U., Kajino, M., Sartelet, K., Matsuda, K., and Amann, M.: MICS-Asia II: Model intercomparison and evaluation of particulate sulfate, nitrate and ammonium, Atmos. Environ., 42, 3510–3527, https://doi.org/10.1016/j.atmosenv.2007.08.057, 2008.
Hoek, G., and Raaschou-Nielsen, O.: Impact of fine particles in ambient air on lung cancer, Chinese Journal of Cancer, 33, 197–203, https://doi.org/10.5732/cjc.014.10039, 2014.
Im, U.: Impact of sea-salt emissions on the model performance and aerosol chemical composition and deposition in the East Mediterranean coastal regions, Atmos. Environ., 75, 329–340, https://doi.org/10.1016/j.atmosenv.2013.04.034, 2013.
Itahashi, S., Ge, B., Sato, K., Fu, J. S., Wang, X., Yamaji, K., Nagashima, T., Li, J., Kajino, M., Liao, H., Zhang, M., Wang, Z., Li, M., Kurokawa, J., Carmichael, G. R., and Wang, Z.: MICS-Asia III: overview of model intercomparison and evaluation of acid deposition over Asia, Atmos. Chem. Phys., 20, 2667–2693, https://doi.org/10.5194/acp-20-2667-2020, 2020.
Kelly, J. T., Bhave, P. V., Nolte, C. G., Shankar, U., and Foley, K. M.: Simulating emission and chemical evolution of coarse sea-salt particles in the Community Multiscale Air Quality (CMAQ) model, Geosci. Model Dev., 3, 257–273, https://doi.org/10.5194/gmd-3-257-2010, 2010.
Knol, A. B., de Hartog, J. J., Boogaard, H., Slottje, P., van der Sluijs, J. P., Lebret, E., Cassee, F. R., Wardekker, A., Ayres, J. G., Borm, P. J., Brunekreef, B., Donaldson, K., Forastiere, F., Holgate, S. T., Kreyling, W. G., Nemery, B., Pekkanen, J., Stone, V., Wichmann, H. E., and Hoek, G.: Expert elicitation on ultrafine particles: likelihood of health effects and causal pathways, Part. Fibre Toxicol., 6, 19, https://doi.org/10.1186/1743-8977-6-19, 2009.
Lamarque, J.-F., Shindell, D. T., Josse, B., Young, P. J., Cionni, I., Eyring, V., Bergmann, D., Cameron-Smith, P., Collins, W. J., Doherty, R., Dalsoren, S., Faluvegi, G., Folberth, G., Ghan, S. J., Horowitz, L. W., Lee, Y. H., MacKenzie, I. A., Nagashima, T., Naik, V., Plummer, D., Righi, M., Rumbold, S. T., Schulz, M., Skeie, R. B., Stevenson, D. S., Strode, S., Sudo, K., Szopa, S., Voulgarakis, A., and Zeng, G.: The Atmospheric Chemistry and Climate Model Intercomparison Project (ACCMIP): overview and description of models, simulations and climate diagnostics, Geosci. Model Dev., 6, 179–206, https://doi.org/10.5194/gmd-6-179-2013, 2013.
Lelieveld, J., Evans, J. S., Fnais, M., Giannadaki, D., and Pozzer, A.: The contribution of outdoor air pollution sources to premature mortality on a global scale, Nature, 525, p. 367, https://doi.org/10.1038/nature15371, 2015.
Li, J., Wang, Z., Zhuang, G., Luo, G., Sun, Y., and Wang, Q.: Mixing of Asian mineral dust with anthropogenic pollutants over East Asia: a model case study of a super-duststorm in March 2010, Atmos. Chem. Phys., 12, 7591–7607, https://doi.org/10.5194/acp-12-7591-2012, 2012.
Li, M., Zhang, Q., Kurokawa, J.-I., Woo, J.-H., He, K., Lu, Z., Ohara, T., Song, Y., Streets, D. G., Carmichael, G. R., Cheng, Y., Hong, C., Huo, H., Jiang, X., Kang, S., Liu, F., Su, H., and Zheng, B.: MIX: a mosaic Asian anthropogenic emission inventory under the international collaboration framework of the MICS-Asia and HTAP, Atmos. Chem. Phys., 17, 935–963, https://doi.org/10.5194/acp-17-935-2017, 2017.
Li, J., Chen, X. S., Wang, Z. F., Du, H. Y., Yang, W. Y., Sun. Y. L., Hu, B., Li, J. J., Wang. W., Wang. T., Fu, P. Q., and Huang, H. L.: Radiative and heterogeneous chemical effects of aerosols on ozone and inorganic aerosols over East Asia, Sci. Total Environ., 622–623, 1327–1342, https://doi.org/10.1016/j.scitotenv.2017.12.041, 2018.
Liao, H., Adams, P. J., Chung, S. H., Seinfeld, J. H., Mickley, L. J., and Jacob, D. J.: Interactions between tropospheric chemistry and aerosols in a unified general circulation model, J. Geophys. Res., 108, 4001, https://doi.org/10.1029/2001JD001260, 2003.
Lippmann, M.: Toxicological and epidemiological studies of cardiovascular effects of ambient air fine particulate matter (PM2.5) and its chemical components: Coherence and public health implications, Crit. Rev. Toxicol., 44, 299–347, https://doi.org/10.3109/10408444.2013.861796, 2014.
Liu, Y. M., Zhang, S. T., Fan, Q., Wu, D., Chan, P. W., Wang, X. M., Fan, S. J., Feng, Y. R., and Hong, Y. Y.: Accessing the Impact of Sea-Salt Emissions on Aerosol Chemical Formation and Deposition over Pearl River Delta, China, Aerosol Air Qual. Res., 15, 2232–2245, https://doi.org/10.4209/aaqr.2015.02.0127, 2015.
Nel, A.: Air pollution-related illness: Effects of particles, Science, 308, 804–806, https://doi.org/10.1126/science.1108752, 2005.
Qu, W. J., Arimoto, R., Zhang, X. Y., Zhao, C. H., Wang, Y. Q., Sheng, L. F., and Fu, G.: Spatial distribution and interannual variation of surface PM10 concentrations over eighty-six Chinese cities, Atmos. Chem. Phys., 10, 5641–5662, https://doi.org/10.5194/acp-10-5641-2010, 2010.
Rao, S., Chirkov, V., Dentener, F., Van Dingenen, R., Pachauri, S., Purohit, P., Amann, M., Heyes, C., Kinney, P., Kolp, P., Klimont, Z., Riahi, K., and Schoepp, W.: Environmental Modeling and Methods for Estimation of the Global Health Impacts of Air Pollution, Environ. Model. Assess., 17, 613–622, https://doi.org/10.1007/s10666-012-9317-3, 2012.
Shao, Y. and Dong, C. H.: A review on East Asian dust storm climate, modeling and monitoring, Global Planet. Change, 52, 1–22, 2006.
Silva, R. A., West, J. J., Zhang, Y. Q., Anenberg, S. C., Lamarque, J. F., Shindell, D. T., Collins, W. J., Dalsoren, S., Faluvegi, G., Folberth, G., Horowitz, L. W., Nagashima, T., Naik, V., Rumbold, S., Skeie, R., Sudo, K., Takemura, T., Bergmann, D., Cameron-Smith, P., Cionni, I., Doherty, R. M., Eyring, V., Josse, B., MacKenzie, I. A., Plummer, D., Righi, M., Stevenson, D. S., Strode, S., Szopa, S., and Zeng, G.: Global premature mortality due to anthropogenic outdoor air pollution and the contribution of past climate change, Environ. Res. Lett., 8, 3, https://doi.org/10.1088/1748-9326/8/3/034005, 2013.
Tebaldi, C. and Knutti, R.: The use of the multi-model ensemble in probabilistic climate projections, Philos. T. R. Soc. A, 365, 2053–2075, https://doi.org/10.1098/rsta.2007.2076, 2007.
Tie, X., Madronich, S., Walters, S., Edwards, D. P., Ginoux, P., Mahowald, N., Zhang, R., Lou, C., and Brasseur, G.: Assessment of the global impact of aerosols on tropospheric oxidants, J. Geophys. Res., 110, D03204, https://doi.org/10.1029/2004JD005359, 2005.
Vivanco, M. G., Bessagnet, B., Cuvelier, C., Theobald, M. R., Tsyro, S., Pirovano, G., Aulinger, A., Bieser, J., Calori, G., Ciarelli, G., Manders, A., Mircea, M., Aksoyoglu, S., Briganti, G., Cappelletti, A., Colette, A., Couvidat, F., D'Insidoro, M., Kranenburg, R., Meleux, F., Menut, L., Pay, M. T., Rouil, L., Silibello, C., Thunis, P., and Ung, A.: Joint analysis of deposition fluxes and atmospheric concentrations of inorganic nitrogen and sulphur compounds predicted by six chemistry transport models in the frame of the EURODELTAIII project, Atmos. Environ., 151, 152–175, https://doi.org/10.1016/j.atmosenv.2016.11.042, 2017.
Wang, K., Zhang, Y., Nenes, A., and Fountoukis, C.: Implementation of dust emission and chemistry into the Community Multiscale Air Quality modeling system and initial application to an Asian dust storm episode, Atmos. Chem. Phys., 12, 10209–10237, https://doi.org/10.5194/acp-12-10209-2012, 2012.
Wesely, M. L.: Parameterization of Surface Resistances to Gaseous Dry Deposition in Regional-Scale Numerical-Models, Atmos. Environ., 23, 1293–1304, https://doi.org/10.1016/0004-6981(89)90153-4, 1989.
Xing, J., Mathur, R., Pleim, J., Hogrefe, C., Gan, C.-M., Wong, D. C., Wei, C., Gilliam, R., and Pouliot, G.: Observations and modeling of air quality trends over 1990–2010 across the Northern Hemisphere: China, the United States and Europe, Atmos. Chem. Phys., 15, 2723–2747, https://doi.org/10.5194/acp-15-2723-2015, 2015.
Zhang, L., Brook, J. R., and Vet, R.: A revised parameterization for gaseous dry deposition in air-quality models, Atmos. Chem. Phys., 3, 2067–2082, https://doi.org/10.5194/acp-3-2067-2003, 2003.


