the Creative Commons Attribution 4.0 License.
the Creative Commons Attribution 4.0 License.
 | 22 Jun 2020
PTR-TOF-MS eddy covariance measurements of isoprene and monoterpene fluxes from an eastern Amazonian rainforest
Jeong-Hoo Park
Roger Seco
Eliane Alves
Sarah Batalha
Raoni Santana
Saewung Kim
James Smith
Julio Tóta
Oscar Vega
Biogenic volatile organic compounds (BVOCs) are important components of the atmosphere due to their contribution to atmospheric chemistry and biogeochemical cycles. Tropical forests are the largest source of the dominant BVOC emissions (e.g. isoprene and monoterpenes). In this study, we report isoprene and total monoterpene flux measurements with a proton transfer reaction time-of-flight mass spectrometer (PTR-TOF-MS) using the eddy covariance (EC) method at the Tapajós National Forest (2.857∘ S, 54.959∘ W), a primary rainforest in eastern Amazonia. Measurements were carried out from 1 to 16 June 2014, during the wet-to-dry transition season. During the measurement period, the measured daytime (06:00–18:00 LT) average isoprene mixing ratios and fluxes were 1.15±0.60 ppb and 0.55±0.71 mg C m−2 h−1, respectively, whereas the measured daytime average total monoterpene mixing ratios and fluxes were 0.14±0.10 ppb and 0.20±0.25 mg C m−2 h−1, respectively. Midday (10:00–14:00 LT) average isoprene and total monoterpene mixing ratios were 1.70±0.49 and 0.24±0.05 ppb, respectively, whereas midday average isoprene and monoterpene fluxes were 1.24±0.68 and 0.46±0.22 mg C m−2 h−1, respectively. Isoprene and total monoterpene emissions in Tapajós were correlated with ambient temperature and solar radiation. Significant correlation with sensible heat flux, SHF (r2=0.77), was also observed. Measured isoprene and monoterpene fluxes were strongly correlated with each other (r2=0.93). The MEGAN2.1 (Model of Emissions of Gases and Aerosols from Nature version 2.1) model could simulate most of the observed diurnal variations (r2=0.7 to 0.8) but declined a little later in the evening for both isoprene and total monoterpene fluxes. The results also demonstrate the importance of site-specific vegetation emission factors (EFs) for accurately simulating BVOC fluxes in regional and global BVOC emission models.
- Article
(6128 KB) - Full-text XML
- BibTeX
- EndNote


The Amazon rainforest acts as a large photochemical reactor of atmospheric trace gases and aerosols which is significantly influenced by biogenic volatile organic compounds (BVOCs) emitted from the forest (Andreae et al., 2002). These BVOCs undergo atmospheric oxidation processes to produce secondary pollutants such as tropospheric ozone (O3) and secondary organic aerosol (SOA) that have significant impact on air quality and climate (Karl et al., 2010; Pöschl et al., 2010). Isoprene (C5H8) dominates the global BVOC budget (500 Tg yr−1; Guenther et al., 2006) and plays an important role in the oxidation capacity of the atmosphere due to its high reactivity with the hydroxyl (OH) radical (Claeys et al., 2004; Karl et al., 2010). Global monoterpene (C10H16) emissions are primarily dominated by α-pinene, β-pinene, t-β-ocimene, limonene, myrcene, sabinene, camphene, 3-carene, β-phellandrene and terpinolene (Guenther et al., 2012). Although monoterpene emissions are reported to be smaller than isoprene, they are an important class of BVOCs due to their capacity for higher SOA production (Sakulyanontvittaya et al., 2008; Hallquist et al., 2009). Emissions of both isoprene and monoterpenes from plants depend on the environmental conditions such as solar radiation, ambient temperature, relative humidity and CO2 concentrations (Kesselmeier et al., 1999; Guenther et al., 2006). However, the magnitude of BVOC emissions from most Amazonian tree species and their variations and distribution over most of the Amazon Basin remains unknown.
Although studies related to BVOC emissions and chemistry in the Amazon rainforest have been carried out in recent decades (Greenberg et al., 2004; Harley et al., 2004; Jardine et al., 2015; Yáñez-Serrano et al., 2015; Alves et al., 2016; Liu et al., 2016, 2018), the extent to which BVOCs control air quality and regional climate through earth system interactions remains poorly understood. The Model of Emissions of Gases and Aerosols from Nature (MEGAN) estimates BVOC emission fluxes by taking into account the environmental conditions, land use and vegetation emission factors (EFs), based on simple mechanistic algorithms that represent the major processes controlling BVOC emissions (Guenther et al., 2006, 2012). MEGAN2.1 estimates that ∼80 % of global terpenoid emissions are from tropical forests. Satellite observations suggest lower isoprene emissions in the tropics (Bauwens et al., 2016). However, aircraft flux measurements during the TROpical Forest and Fire Emissions Experiment (TROFFEE; Karl et al., 2007) and the Green Ocean Amazon (GoAmazon 2014/5) campaign (Gu et al., 2017) both report isoprene emission rates that are not only higher than satellite top–down estimates but are also 35 % to 65 % higher than MEGAN2.1 estimates (Karl et al., 2007; Gu et al., 2017). Therefore, to reduce the uncertainty in the modelled BVOC flux estimations, it is important to estimate site-specific BVOC emission factors (EFs) based on in situ BVOC flux measurements. Incorporating these site-specific EFs in MEGAN can improve global BVOCs estimation.
Eddy covariance (EC) volatile organic compound (VOC) flux measurements using the proton transfer reaction time-of-flight mass spectrometry (PTR-TOF-MS) technique were first introduced by Müller et al. (2010) and have since been reported for several other studies (Ruuskanen et al., 2011; Park et al., 2013; Acton et al., 2016; Schallhart et al., 2018). The major advantage of using a PTR-TOF-MS over a conventional PTR-QMS (with a quadrupole mass analyser) for VOC flux measurements is the ability of PTR-TOF-MS to measure all masses simultaneously and also to separate the isobaric species based on their monoisotopic masses, allowing us to characterize more VOC species and thus minimize interfering compounds. The simultaneous mass measurements of the PTR-TOF-MS enables the collection of VOC data with a 10 Hz frequency for EC estimation, which reduces the random uncertainty in the EC measurement. During a previous comparison study of BVOC fluxes estimated using both PTR-TOF-MS and PTR-QMS in a mixed oak forest in northern Italy, isoprene fluxes were observed to be identical using both the instruments, whereas ∼25 % higher monoterpene fluxes were estimated by PTR-QMS due to the detection of other interfering ions at the same nominal mass (Acton et al., 2016). The results revealed the importance of using a PTR-TOF-MS to perform accurate measurements of total monoterpene fluxes using the EC approach.
The terpenoid concentration and flux observations reported in this paper were conducted in the Tapajós National Forest, located in the eastern Amazonian rainforest, using a commercially available PTR-TOF-MS from 1 to 16 June 2014. We have previously summarized the observed monoterpene mixing ratios and fluxes (Batalha et al., 2018). In this paper, we also report isoprene concentrations and fluxes and compare the observations with the BVOC fluxes estimated with the MEGAN2.1 model. The comparison between the measured and the modelled isoprene and monoterpene fluxes are discussed and the importance of site-specific parameters for BVOC flux estimation is highlighted. In addition, the measured BVOC fluxes were compared with previously reported measurements from the Amazon rainforest.
2.1 Measurement site
The eddy covariance flux measurements of isoprene and total monoterpenes were performed at the Santarem-Km67-Primary Forest (BR-Sa1) tower site in the Tapajós National Forest (2.857∘ S, 54.959∘ W), located near km-67 of the Santarém–Cuiabá highway, ∼50 km south of Santarém (Pará state) in north central Brazil. The Tapajós National Forest contains ∼450 000 ha of protected old-growth evergreen forest with a closed canopy (mean tree height ∼40 m). It is comparatively drier than the more extensive wet forests in the Amazon Basin (Saleska et al., 2003; Longo et al., 2018). The forest experiences a 7-month wet season with total rainfall of ∼1920 mm yr−1 (Saleska et al., 2003) and mid-July until mid-December is considered to be the dry season (da Rocha et al., 2009). Among the 151 group of specimens found in the measurement area, the dominant tree species were Erisma uncinatum Warm., Carapa guianensis Aubl., Manilkara huberi (Ducke) A. Chev., Protium sp., Lecythis lurida (Miers) S. A. Mori, Tachigali spp., Ocotea sp., Parkia sp., Couratari sp. and Astronium gracile Engl. (Gonçalves and Santos , 2008). Trees in the Tapajós forest show little impact of stress during the dry season as they can access the deep-soil water (Nepstad et al., 1994; Saleska et al., 2003). The canopy phenology also plays an important role in the forest’s ecosystem sensitivity to droughts (Longo et al., 2018). It is predicted that the Amazon will become drier in the future due to climate change and, therefore, Tapajós can be regarded as a model forest for the future Amazon (Cox et al., 2000). Figure 1 shows the location of the flux measurement site.
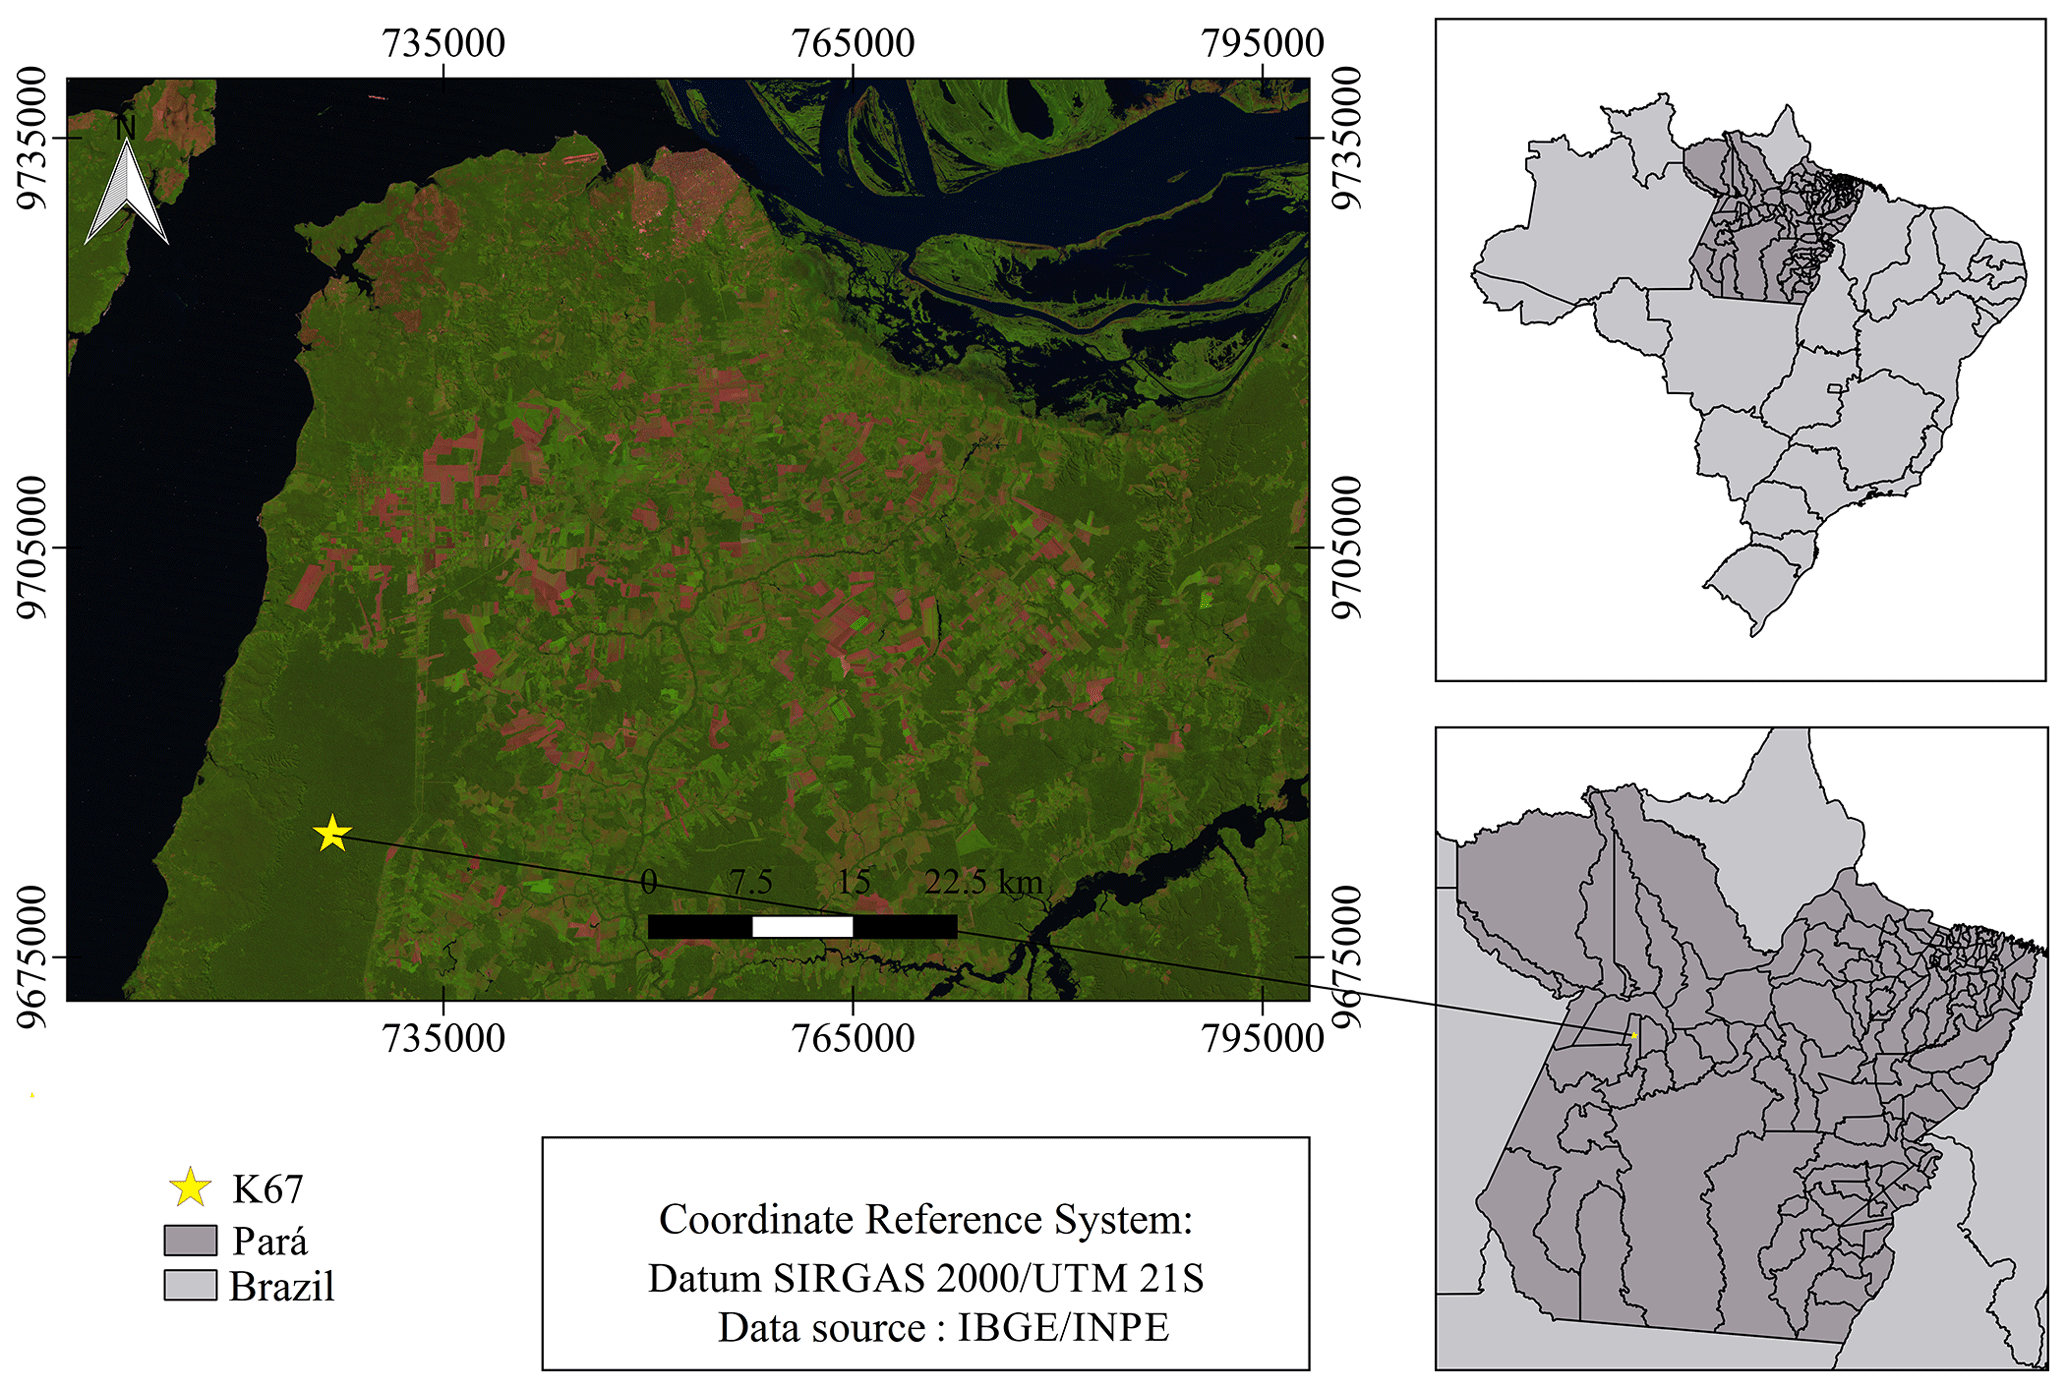
Figure 1Location of the flux measurement site (yellow star) in the state of Pará, Brazil, obtained from Landsat imagery courtesy of the Brazilian Institute for Space Research (INPE Landsat). The map of Brazil and the state of Pará (right side of the figure) were obtained from the IBGE (Brazilian Institute of Geography and Statistics) website.
2.2 Instrumentation
The BVOC eddy covariance flux measurements were performed using a commercial high-sensitivity PTR-TOF-MS (model 8000; Ionicon Analytic GmbH, Innsbruck, Austria) from 1 to 16 June 2014, during the transition period between wet and dry seasons in Tapajós. The instrument enables high mass-resolution () measurements with a detection limit of a few parts per trillion (Lindinger et al., 1998; Müller et al., 2010; Sarkar et al., 2016). The PTR-TOF-MS was operated at a drift tube voltage of 600 V and drift tube pressure of 2 mbar, resulting in an E∕N ratio of ∼136 Td.
The instrument was calibrated four times (3, 7, 10 and 13 June 2014) during the measurement period using a gravimetric mixture of a 14-component VOC gas standard (Apel-Reimer Environmental Inc., at ∼500 ppb; stated accuracy better than 8 %) containing methanol, acetaldehyde, acetone, isoprene, methacrolein, methyl ethyl ketone, benzene, toluene, o-xylene, chlorobenzene, α-pinene, 1,2,4-trichlorobenzene and 1,3,5-triisopropylbenzene. Calibrations were performed in the range of 2–10 ppb. In order to establish the instrumental background, VOC-free zero air was generated by passing the ambient air through a catalytic converter (stainless steel tube filled with platinum-coated glass wool) heated at 350 ∘C. The measured ion signals were normalized to the primary ion (H3O+, ) as follows (Sarkar et al., 2016):
The VOC sensitivities did not show any significant change during the four calibrations performed as the instrumental operating conditions remained constant, which is in agreement with several previous studies (de Gouw and Warneke, 2007). During these four calibrations, average isoprene and total monoterpene sensitivities were 12.8±0.32 ncps ppb−1 (54.9±1.32 cps ppb−1) and 14.7±0.86 ncps ppb−1 (63.1±3.69 cps ppb−1), respectively. Sensitivity for total monoterpenes were estimated by considering the fragmentation at and 81.070. Therefore, the signal measured at was scaled by 2.5, as the calibrations at the abovementioned instrumental settings showed ∼40 % of total monoterpenes was detected at . This fragmentation pattern of monoterpenes is in agreement with previously reported studies with similar operating conditions (Tani et al., 2004; Sarkar et al., 2016). Overall, ∼42 % isoprene signal was detected at m∕z 41.009 (isoprene fragment) at 136 Td which was also taken into account while calculating the final isoprene mixing ratios.
The limit of detection (LOD) was determined by passing VOC-free zero air through the instrument and estimated as the 2σ value of the measured normalized signal (Sarkar et al., 2016). The total uncertainty for the calibrated VOCs were estimated by considering the accuracy error of the VOC standard, the instrumental precision error and the flow fluctuations of the mass flow controllers (MFCs) during the calibrations. The total uncertainty for isoprene and monoterpenes was estimated to be <20 % for this study.
IoniTof software was used for the data acquisition of the 10 Hz mass spectra and the data processing was performed using the PTRwid data processing tool (Holzinger , 2015). PTRwid has several unique features such as the accurate mass-scale calibration and computation of a “unified mass list”, from which a robust attribution of mass peaks is possible. The analysis was done on the SumSpectrum stored with the raw mass spectral data, which minimizes the data processing time significantly. The eddy covariance flux calculations were performed using MATLAB software (Mathworks). Further data analysis and plotting of the data were performed using IGOR Pro (WaveMetrics, Inc.).
The VOC sample inlet was located above the forest canopy (height ∼65 m) and air was sampled continuously through a 100 m long Teflon tube (OD: , ID: ; theoretical residence time of air sample in the tube: ∼4.8 s) at a flow rate of 40 L min−1, maintained by a mass flow controller (MKS Instruments, Inc.). A PTFE membrane particle filter (pore size 2 µm) was used to protect the inlet line from dust and debris. A 3D sonic anemometer (Applied Technologies, Inc., Boulder, CO) was also installed near the top of the tower which was collocated with the VOC sample inlet. The sonic anemometer was used to measure air temperature and wind speed components (u: zonal; v: southern; w: vertical), which were used for the eddy covariance flux calculation. The 10 Hz 3D sonic anemometer data was recorded by a data logger (CR3000, Campbell Scientific Inc., Logan, UT).
During the study period, solar radiation data were not collected due to the failure of the pyranometer sensor at the site and therefore reanalysis solar radiation data from the MERRA-2 satellite (Modern-Era Retrospective analysis for Research and Applications, Version 2; Gelaro et al., 2017) were used. The MERRA-Land data provide hourly average land-surface data at a horizontal resolution of 0.5∘ latitude and 0.667∘ longitude (Reichle et al., 2011). The solar radiation data along with air temperature and sensible heat flux data were downloaded from MERRA-Land in the NetCDF format. This NetCDF data file was then processed by extracting the data for the coordinates of the measurement site (2.857∘ S, 54.959∘ W) and then the output was saved in .csv format. Figure 2 shows the time series and diel box-and-whisker profiles for the measured air temperature and sensible heat flux along with estimated air temperature, solar radiation and sensible heat flux obtained from MERRA-2. Most of the days during the measurement period were sunny, while a couple of days experienced cloud cover (on 11 and 13 June 2014). Daytime (06:00–18:00 LT) and midday (10:00–14:00 LT) average temperatures for the measurement period were 301.5±1.5 K ( ∘C) and 303.0±1.0 K ( ∘C), respectively, whereas estimated daytime and midday average temperatures from MERRA-2 were 299.1±1.7 K ( ∘C) and 300.2±1.1 K ( ∘C), respectively. There were several gaps on the measured air temperature data due to sensor failure and therefore both air temperature and solar radiation data obtained from MERRA-2 were used for the BVOC flux estimation using the MEGAN model (Sect. 2.4). The daytime and midday average solar radiation values from MERRA-2 were 359.1±289.5 and 663.9±114.2 W m−2, respectively.
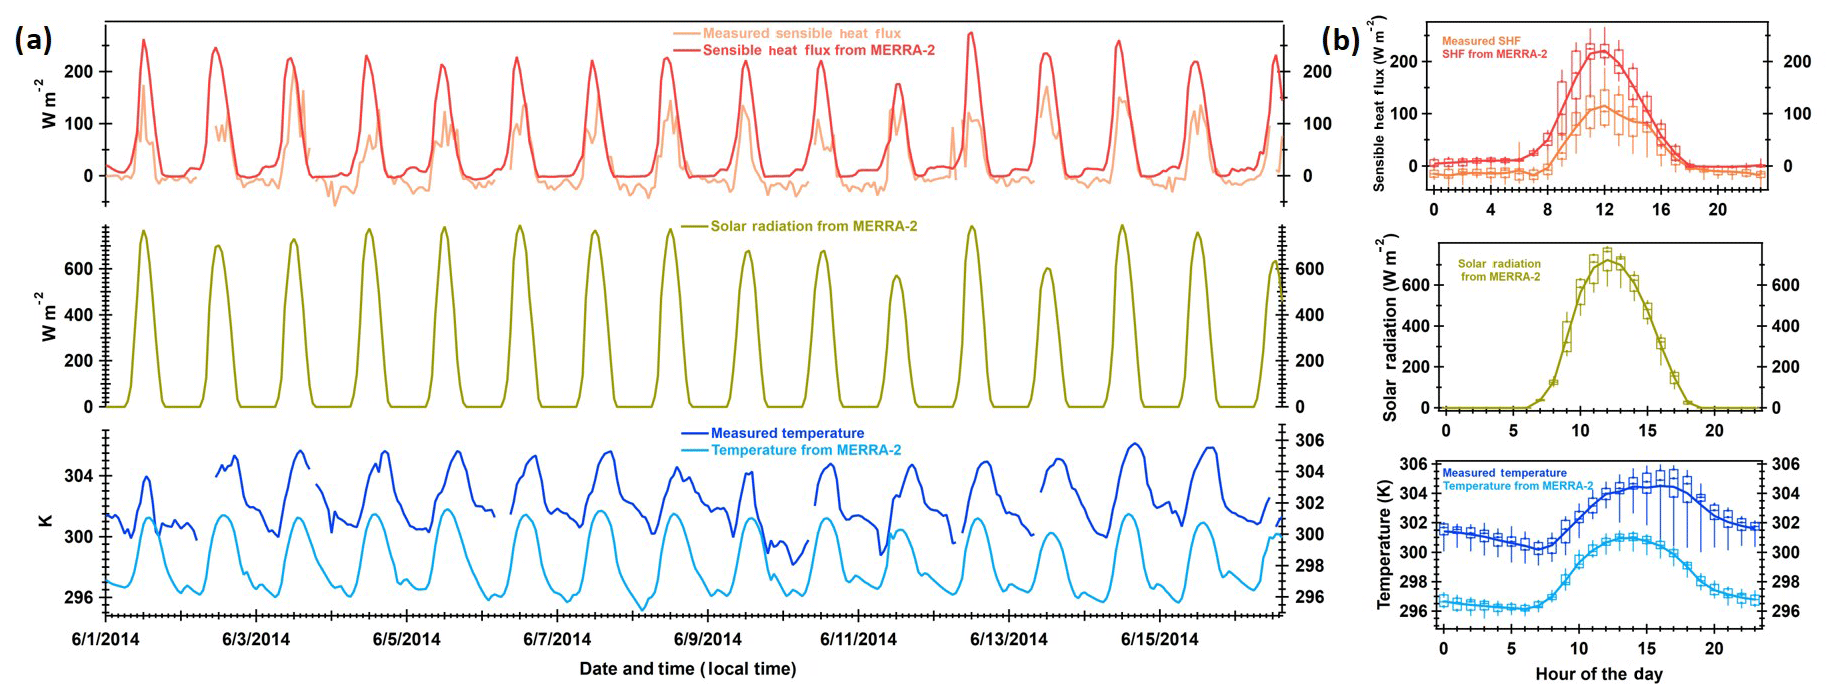
Figure 2(a) Time series and (b) diel box-and-whisker plots for the measured air temperature and sensible heat flux (SHF) along with estimated air temperature, solar radiation and sensible heat flux obtained from MERRA-2. The time stamp in the x axis of Fig. 2b represents the start time of the respective hourly data bin (e.g. 6 for data averaged between 06:00 and 07:00).
2.3 Eddy covariance (EC) method for BVOC flux calculation
BVOC fluxes (Fwc, mg C m−2 h−1) were determined for 30 min periods using the eddy covariance method in which vertical BVOC fluxes were estimated using the mean covariance of deviations for vertical wind speed and individual BVOC mixing ratios according to the following equation (Park et al., 2013):
where σ is air density (mol m−3), N is the number of data points, () or wi′ is instantaneous deviation of vertical wind speed from its mean, and () or ci′ is instantaneous deviation of BVOC mixing ratios from its mean. As per the procedure described in Park et al. (2013), EC flux error estimations were carried out by considering the systematic errors due to inlet dampening (<12 %), sensor separation (<1.1 %), instrument response time (0.3 %), random noise in EC flux (isoprene <4.0 % ; monoterpenes <0.2 %) and uncertainties associated with concentration determinations. Lag times between wind and VOC data varied during the experiment because they were stored on two different computers. The lag time of each 30 min sample period was visually inspected and manually corrected.
2.4 MEGAN2.1 model for BVOC flux estimation
MEGAN2.1 was used to estimate BVOC fluxes. MEGAN2.1 is based on simple mechanistic algorithms and estimates BVOC emissions by considering the main processes that drive BVOC emissions (Guenther et al., 2012). Following Guenther et al. (2012), the BVOC activity factor (γi) can be expressed as
where CCE is canopy environment coefficient; γp, γT, γA, γSM and are emission responses to the leaf area index, light, temperature, leaf age, soil moisture and CO2 inhibition activity, respectively. Solar radiation and air temperature hourly data obtained from MERRA-2 were used as an input to run MEGAN2.1 for this study. Based on the change in leaf area index (LAI), leaf age was estimated by the model. For this study, we assumed that there was no variation in soil moisture (γSM) and CO2 () inhibition activity. A detailed description of MEGAN2.1 model settings can be obtained from Guenther et al. (2012).
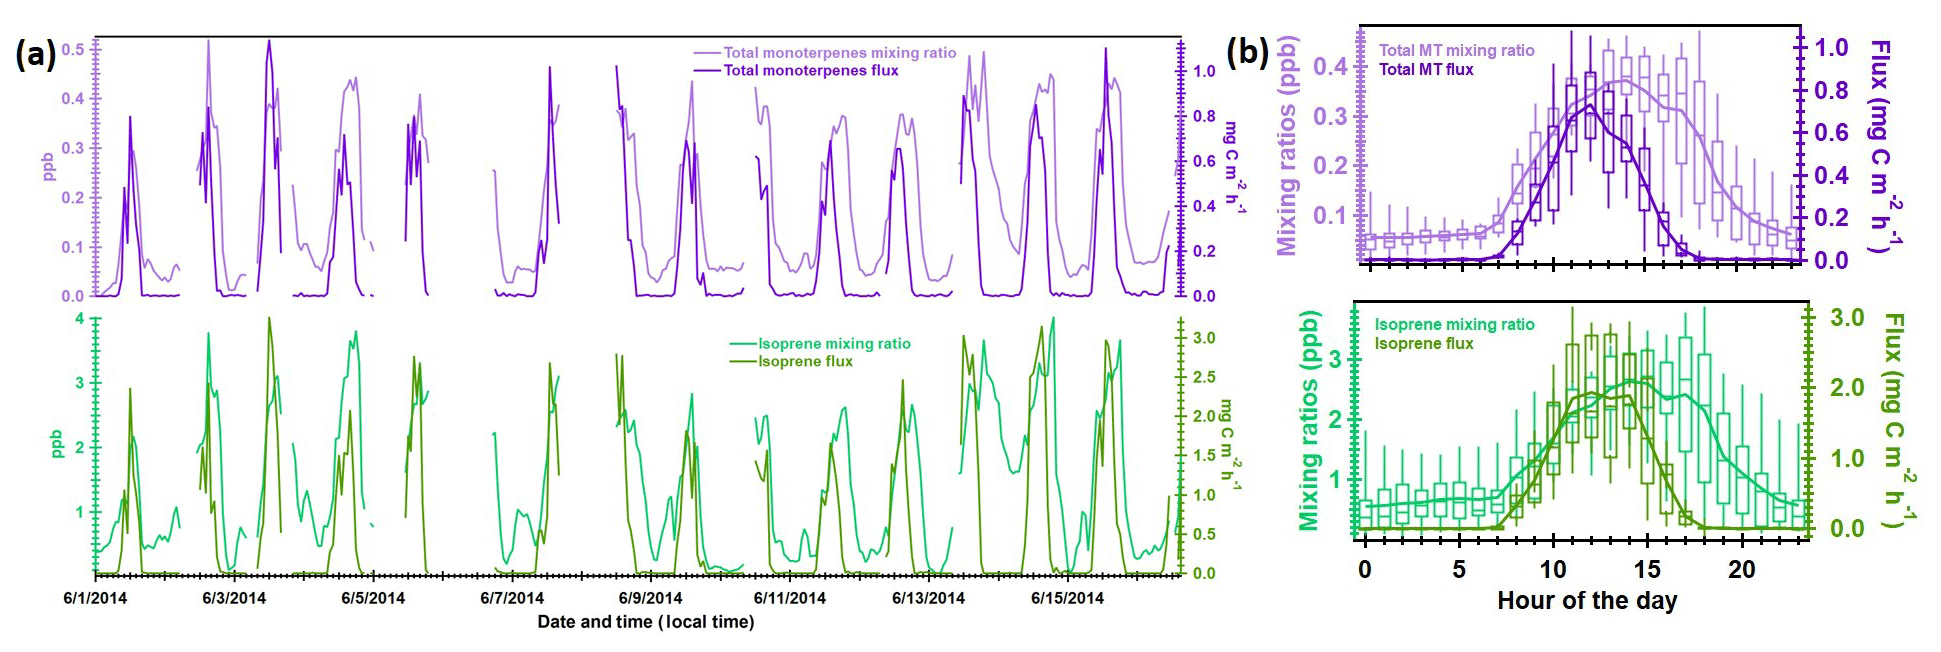
Figure 3(a) Time series profile for the measured isoprene and total monoterpene mixing ratios and fluxes; (b) box-and-whisker plots for measured mixing ratios and fluxes of isoprene and total monoterpenes (MTs).
3.1 BVOC mixing ratios and fluxes
Figure 3a shows the time series of 30 min averaged mixing ratios and fluxes of isoprene and total monoterpenes for the period of 1–16 June 2014. As can be seen from Fig. 3a, measured isoprene and total monoterpene mixing ratio variations followed a similar behaviour throughout the measurement period. Daytime isoprene and total monoterpene mixing ratios as high as ∼4 and ∼0.5 ppb, respectively, were observed for several days (2, 4, 13–15 June) during the measurement period, corresponding to the highest isoprene and monoterpene fluxes of ∼3.2 and ∼1.1 mg C m−2 h−1, respectively. A few days (e.g. 9–11 June) had lower daytime isoprene and total monoterpene mixing ratios (peak values of ∼2.8 and ∼0.37 ppb, respectively) and fluxes (peak values of ∼1.7 and ∼0.64 mg C m−2 h−1, respectively) as expected (Guenther et al., 2006) from cloudy conditions that result in lower solar radiation and ambient temperature (refer Fig. 2). As mentioned in Sect. 2.2, solar radiation was not measured at the site during the study period. However, the solar radiation data obtained from the MERRA-2 satellite for the study period indicated that there were some cloudy days, e.g. 11 and 13 June (refer to Fig. 2) during the measurement period. Some days during the measurement period had comparatively warmer conditions that led to the higher isoprene and monoterpene emissions. The measured sensible heat flux and ambient temperature, which are also decreased during cloudy conditions, showed similar day-to-day variations that were correlated with isoprene and monoterpenes. The measurement site is dominated by broadleaf evergreen tropical trees, which include some species that are known to have high isoprene and monoterpene emission potentials that are both light and temperature dependent (Kuhn et al., 2004; Karl et al., 2007; Guenther et al., 2012), which is consistent with the observed light-dependent emission behaviour. The average daytime (06:00–18:00 LT) emissions of isoprene (0.55±0.71 mg C m−2 h−1) and total monoterpenes (0.20±0.25 mg C m−2 h−1) at the site are relatively low, indicating a low fraction of high-emitting trees. The maximum emission rates of both isoprene and monoterpenes are about 5 times higher than the daytime average emission rates.
Figure 3b depicts the box-and-whisker plots for isoprene and total monoterpene mixing ratios and respective fluxes to show the diel trends. Both isoprene and monoterpene mixing ratios followed a similar trend to that of temperature (refer Fig. 2b), with daytime maxima between 14:00 and 15:00 LT (maximum isoprene and total monoterpene mixing ratios of ∼2.93 and ∼0.76 ppb, respectively). On the other hand, the measured isoprene and total monoterpene fluxes tend to follow the diel profile of solar radiation obtained from MERRA-2 with the maxima between 12:00 and 14:00 LT. This indicates that these biogenic emissions at the Tapajós site are mostly light-dependent and are also stimulated by the increase in temperature. The light-dependent emissions of monoterpenes from Amazonian tree species have previously been reported (Kuhn et al., 2004; Karl et al., 2007; Jardine et al., 2015). However, non-zero nighttime mixing ratios for isoprene and monoterpenes were consistently observed during the measurement period. The measured average nighttime (18:00–06:00 LT) isoprene and total monoterpene mixing ratios were 1.14±0.59 and 0.14±0.09 ppb, respectively, and could be a result of emissions that continue in the late afternoon and early evening after the major sinks (photochemical loss and vertical transport) are diminished due to the decreased surface heating and the photochemical production of oxidants. Non-zero nighttime isoprene mixing ratios have previously been observed at other forested sites in central Amazonia (Yáñez-Serrano et al., 2015; Alves et al., 2016). In addition, monoterpenes are often emitted at night from pools in specialized storage structures such as resin ducts and glandular trichomes (Guenther et al., 2012). Since the average measured temperature at night during the measurement period was only slightly lower than the daytime average temperature (∼29 ∘C during the daytime, while ∼28 ∘C at nighttime), any light-independent nighttime monoterpene emissions are expected to continue at only slightly lower rates and can build up due to the lower mixing height which can increase concentrations of any compounds emitted at the surface.
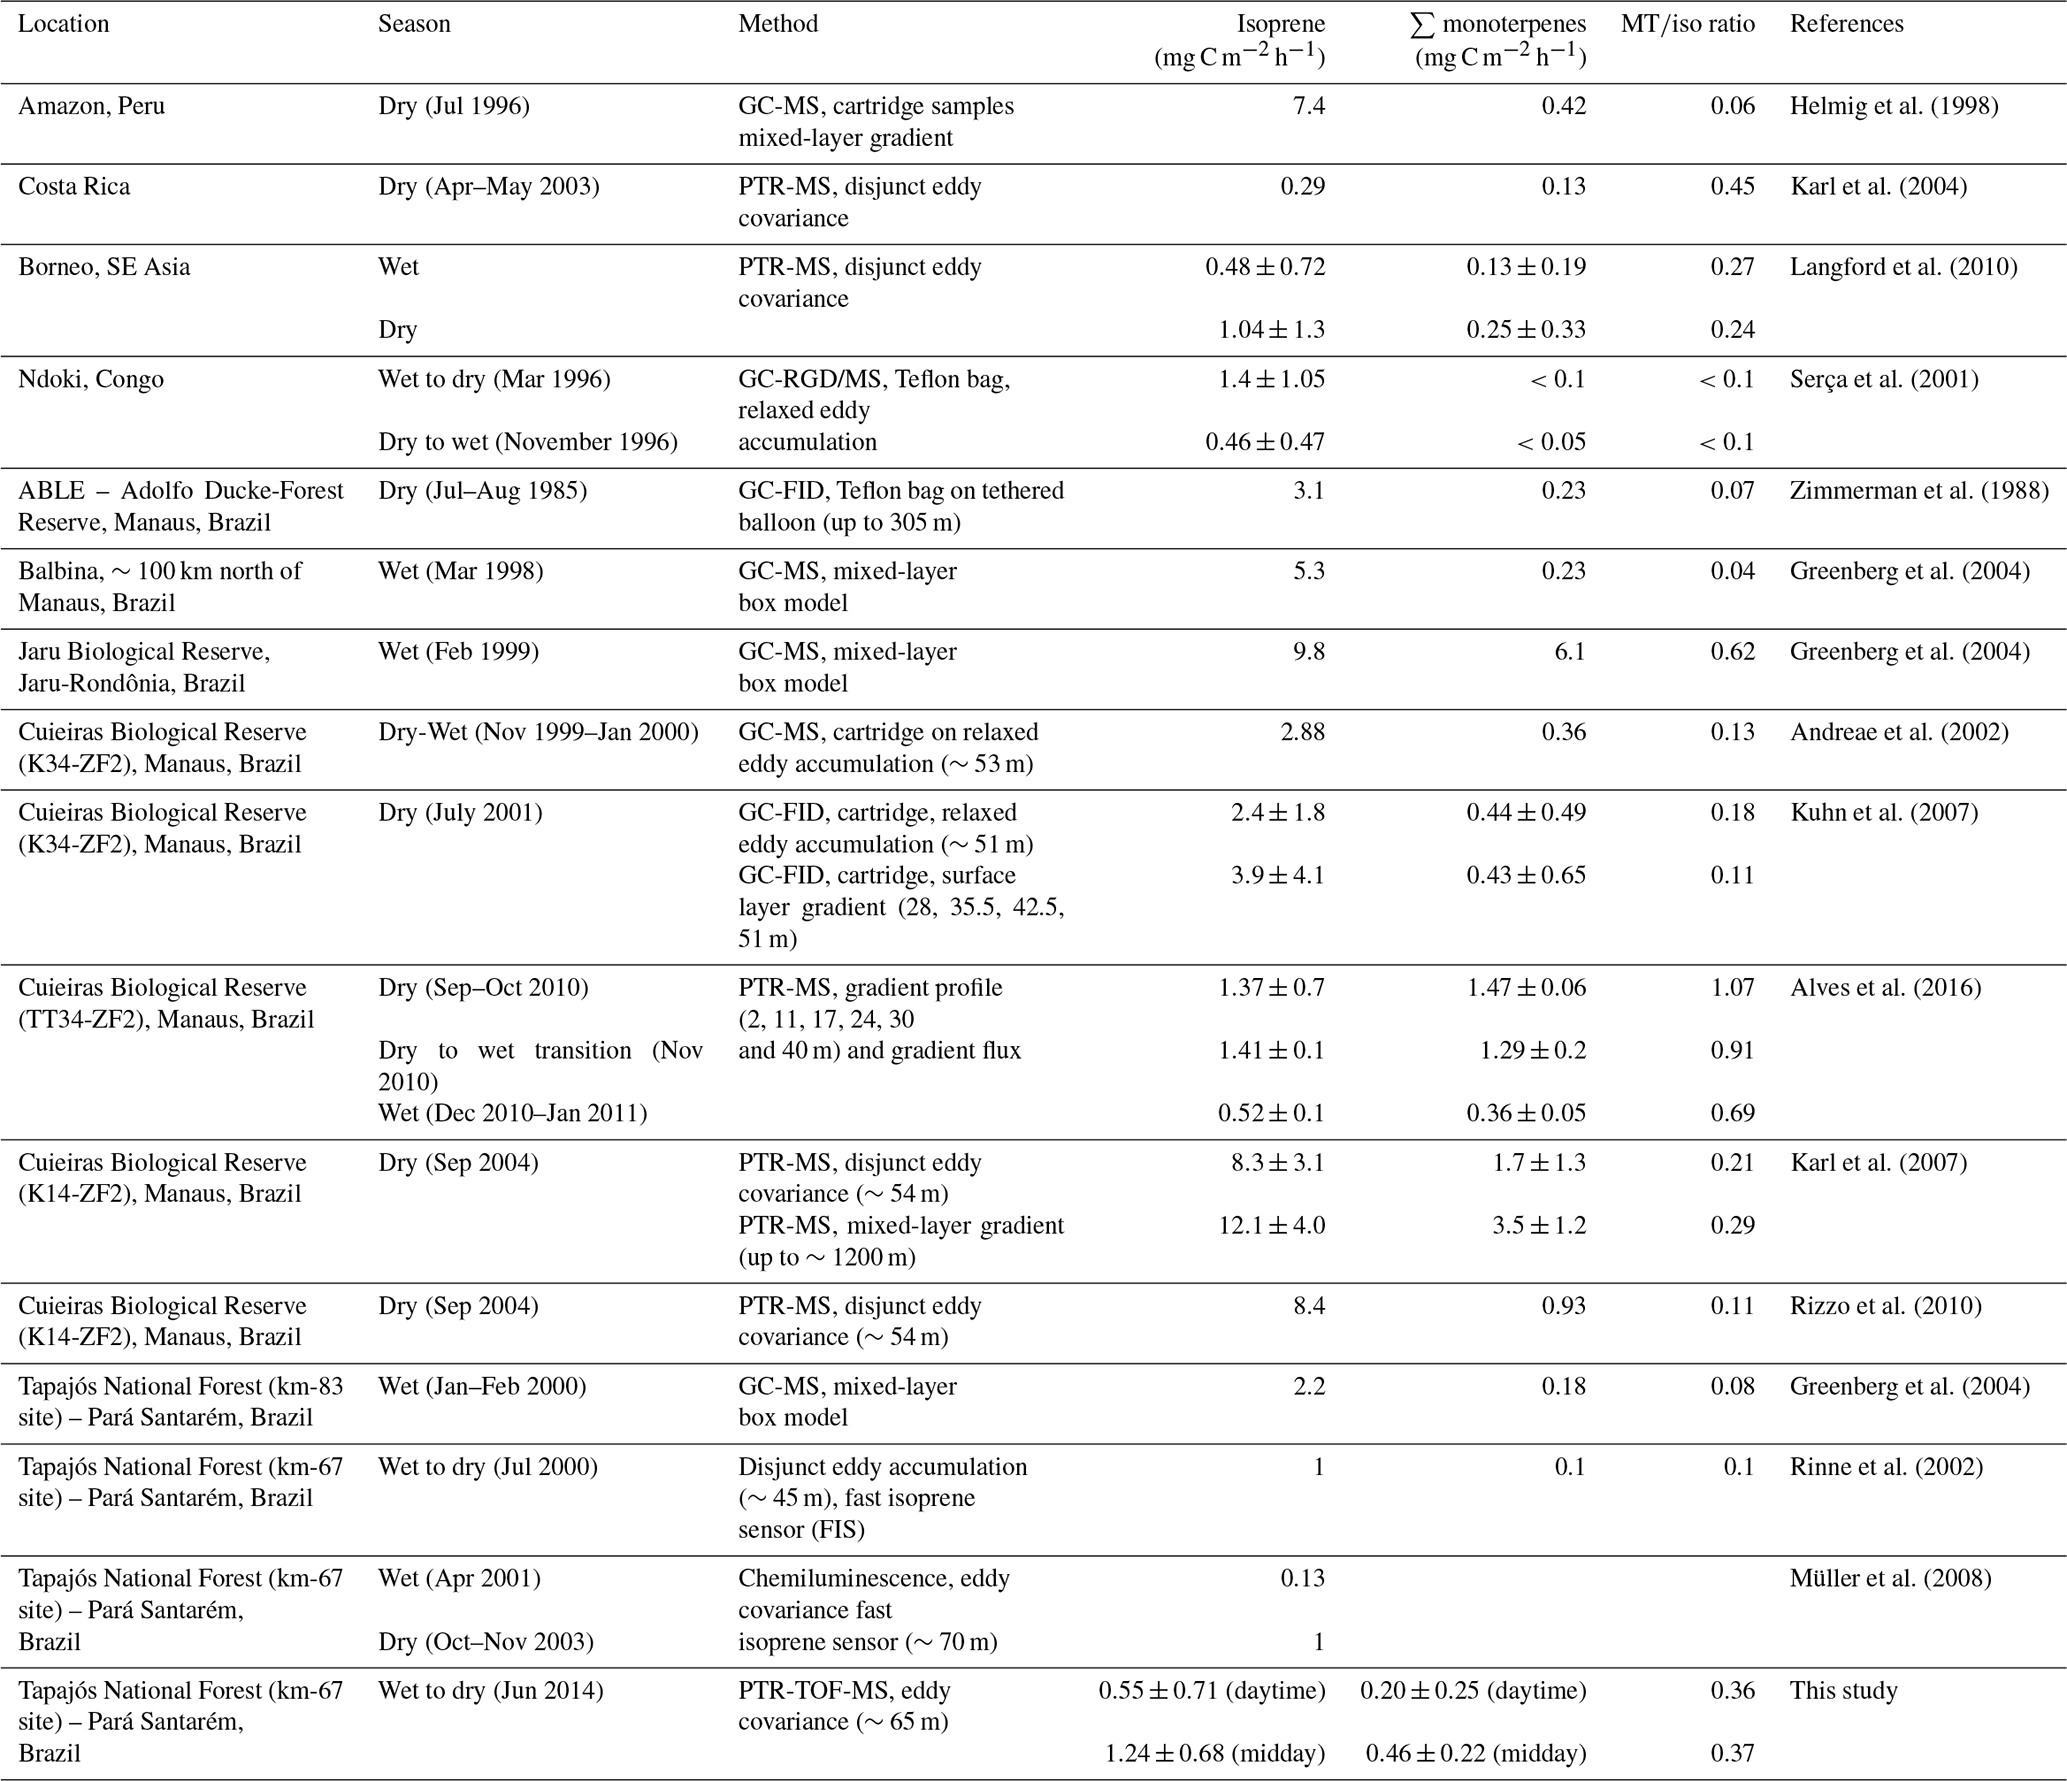
Helmig et al. (1998)Karl et al. (2004)Langford et al. (2010)Serça et al. (2001)Zimmerman et al. (1988)Greenberg et al. (2004)Greenberg et al. (2004)Andreae et al. (2002)Kuhn et al. (2007)Alves et al. (2016)Karl et al. (2007)Rizzo et al. (2010)Greenberg et al. (2004)Rinne et al. (2002)Müller et al. (2008)Table 1Comparison of average daytime isoprene and monoterpene fluxes and their typical ratios (∑ monoterpenes∕isoprene) at different locations in the Amazonian rainforest and other tropical forests in the world.
3.2 Comparison with previous flux studies from the Amazon and other tropical forests
Table 1 compares isoprene and monoterpene fluxes reported in this study with previously reported flux studies conducted in the Amazon rainforest and other tropical forests around the world. It is difficult to compare measurements at these sites given the large diurnal and seasonal variations and the lack of a consistent approach for reporting these measurements. We have reported both daytime average, which we define as the measurements made between 06:00 and 18:00 local solar time (LST), and midday average for 10:00–14:00 LST. We expect that measurements for most of the studies in Table 1 are representative of conditions that fall somewhere in between these two periods. The daytime, and even the midday, average isoprene fluxes observed in this study (0.55±0.71 mg C m−2 h−1 during the daytime and 1.24±0.68 mg C m−2 h−1 during midday), are lower than the isoprene emission rates reported for previous studies carried out during the dry season and wet-to-dry transition periods in other locations in the Amazon rainforest, which indicates that there are relatively few high isoprene emitting tree species at Tapajós in comparison to other locations in the Amazon. This is in agreement with previous leaf (Harley et al., 2004), canopy (Rinne et al., 2002; Müller et al., 2008) and landscape-scale measurements at the Tapajós forest. Harley et al. (2004) combined a leaf enclosure emission survey with plot-level tree inventories at 14 Amazon sites and found that the percentage of isoprene emitters ranged from 20.5 % to 41.5 % across the Amazon Basin. The three sites with the lowest percentages, 20.5 % to 21.5 %, of isoprene emitters were all near the Tapajós km-67 site. Harley et al. (2004) report that a fourth site (km-83) in the Tapajós forest, ∼16 km south of the km-67 site, had a somewhat higher percentage (29 %) of isoprene emitters. Greenberg et al. (2004) deployed a tethered-balloon sampling system in the wet season of the year 2000 to measure isoprene concentrations in the mixed layer above the Tapajós km-83 site. They used a simple box model to estimate isoprene fluxes of 2.2 mg C m−2 h−1, which is about a factor of 2 higher than the isoprene flux that we observed at the km-67 site. Tapajós isoprene fluxes in this study were lower than most other tropical forest studies with the exception of fluxes reported for a tropical forest in Costa Rica during an extreme drought period (Karl et al., 2004) and tropical forests in Borneo, which have a relatively low fraction of isoprene-emitting trees (Langford et al., 2010).
In contrast to isoprene, total monoterpene fluxes observed in this study (daytime average flux was 0.20±0.25 and 0.46±0.22 mg C m−2 h−1, respectively) were comparable or higher than values reported for several previous studies carried out in the Amazon. Andreae et al. (2002) and Kuhn et al. (2007) observed similar monoterpene fluxes in Manaus using relaxed eddy covariance methods coupled with GC-MS/FID (gas chromatography–mass spectrometry/flame ionization detector), while Helmig et al. (1998) reported similar values based on mixed-layer concentration measurements in the Peruvian Amazon. Monoterpene fluxes reported in this study were significantly higher than the observed fluxes in the tropical forests in Costa Rica and Borneo (Karl et al., 2004; Langford et al., 2010). The monoterpene flux of 0.18 mg C m−2 h−1 measured at the Tapajós km-83 site by Greenberg et al. (2004) is about a factor of 2 lower in contrast to their measured isoprene, which is about a factor of 2 higher. Our results suggest that Tapajós has relatively lower isoprene and higher monoterpene emitting tree species in comparison with other locations in the Amazon rainforest, but the values reported for the Tapajós km-83 site (Greenberg et al., 2004) indicate that this could be highly variable even within the Tapajós National Forest. Our results emphasize the diversity of the isoprene- and monoterpene-emitting tree species distributions in the Amazon rainforest and the importance of in situ measurements in different parts of Amazon and at a multiple sites within a region, to obtain regionally representative EFs that are required for accurate BVOC emission estimates using MEGAN or other biogenic VOC emission models.
3.3 Comparison of measured BVOC fluxes with MEGAN2.1
The MEGAN2.1 model (Guenther et al., 2012) estimates isoprene and monoterpene emissions as the product of a landscape average emission factor, based on the emission capacity of the vegetation types in the landscape, and an emission activity factor based on light, temperature and other environmental conditions. MEGAN2.1 has options for assigning emission factors representative of 16 plant function types (PFTs) or using a global map of emission factor distributions that accounts for variations within those PFTs (Guenther et al., 2012). The MEGAN2.1 emission factors for the evergreen tropical broadleaf tree PFT that dominates in the Tapajós forest is 6.18 and 1.15 mg C m−2 h−1 for isoprene and total monoterpenes, respectively. These values are assigned to all tropical forests when using the 16 PFT emission factor scheme. In contrast, the MEGAN2.1 emission factor distribution map accounts for the variations within tropical forests on a scale of ∼ 1 km. The MEGAN2.1 1 km resolution global emission factor map (Guenther et al., 2012) was generated by integrating emissions data reported in the literature for each of the 862 global ecoregions in the scheme developed by Olson et al. (2001). The BVOC emissions data that Guenther et al. (2012) used to characterize the “Tapajós-Xingu moist forests” eco-region, which contains the Tapajós flux tower field site, includes measurements reported by Greenberg et al. (2004) and Harley et al. (2004). For the ∼3 km × ∼3 km region surrounding the Tapajós km-67 study site, the MEGAN2.1 emission factor map average values are 1.75 and 1.02 mg C m−2 h−1 for isoprene and total monoterpenes, respectively. The emission factors estimated from the observed isoprene and monoterpene fluxes, 1.94 and 0.71 mg C m−2 h−1, respectively, are ∼10 % higher for isoprene and ∼32 % lower for total monoterpenes. While the MEGAN2.1 PFT-average emission scheme and the MEGAN2.1 1 km emission factor distribution map have similar global averages, this comparison shows that they can differ by more than a factor of 3 locally and demonstrates the importance of using the emission factor distribution map for local- to regional-scale studies and comparisons to field measurements.
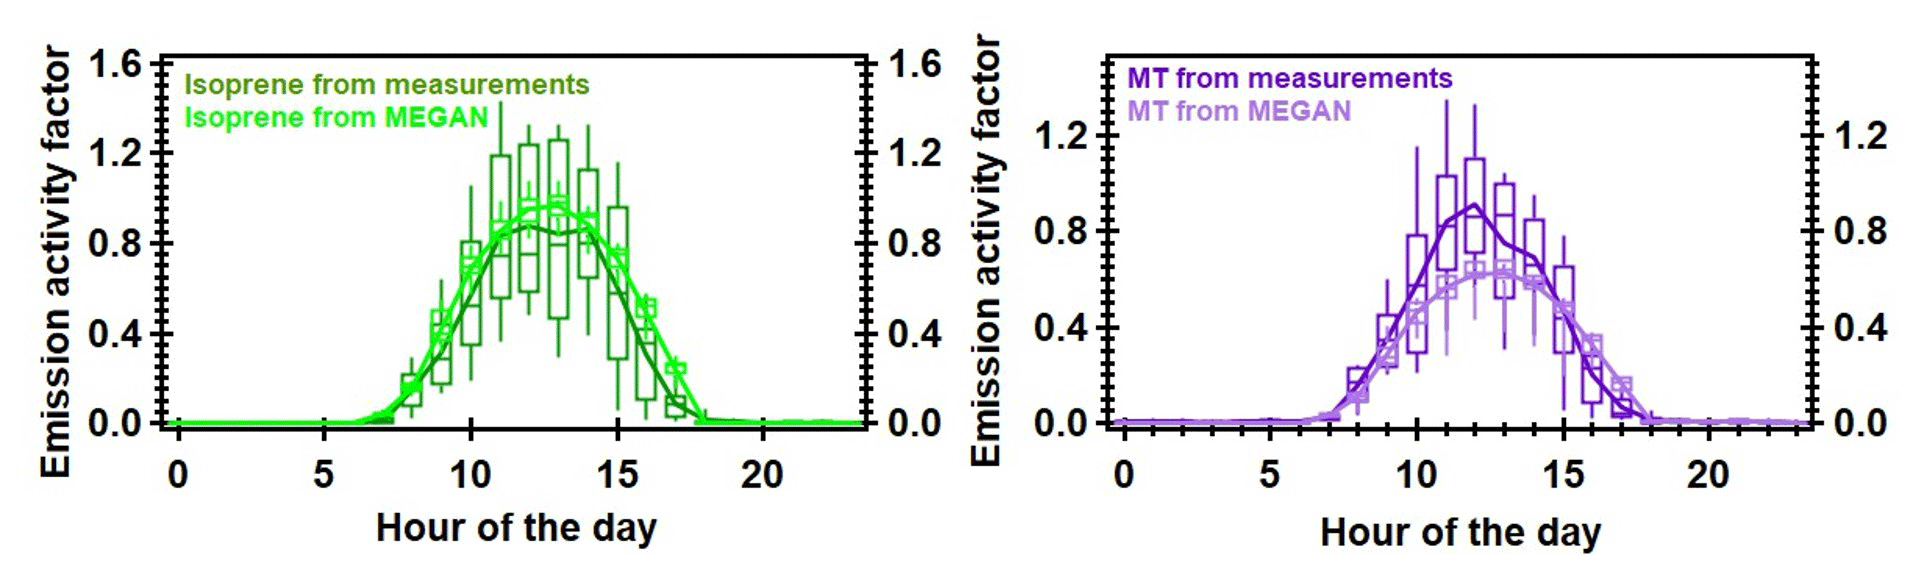
Figure 4Comparison of diel profiles of the emission activity factors calculated based on the measured and MEGAN2.1-predicted isoprene and total monoterpene fluxes.
Figure 4 shows box-and-whisker plots comparing the diel profiles of measured and MEGAN-predicted isoprene and total monoterpene emission activity factors, respectively. The emission activity factors for the observed fluxes were calculated as the ratio of the observed emission to the emission factor and provide a direct comparison to the model estimates of the diurnal behaviour. The diel profiles in Fig. 4 show a strong resemblance between the MEGAN prediction, based on light and temperature, and the measured isoprene and total monoterpenes emission activity factors. A delay in the evening decline in emissions was observed for both isoprene and monoterpenes estimated by MEGAN2.1. The diel profiles for measured isoprene and monoterpenes emission activity factors showed a slightly different pattern during midday (isoprene is relatively constant from 11:00 to 14:00 while monoterpenes showed a peak around 11:00 to 12:00) which contrasts with the model predictions.

Figure 5Scatterplots for measured and MEGAN2.1 estimated isoprene and total monoterpene fluxes and their correlations.
Figure 5a and b show scatterplots of the measured and MEGAN-predicted isoprene and total monoterpene fluxes, respectively. Figure 5a and b are colour-coded according to the solar radiation data obtained from MERRA-2 and the measured temperature, respectively. Significant correlations were found between the measured and MEGAN-predicted isoprene (r2=0.70) and total monoterpene fluxes (r2=0.79), which indicates that MEGAN accounts for most of the short-term variability at the Tapajós site. The differences in the magnitude of the observed and predicted emissions are due to emission factor variability in the Amazon tropical forests and potentially other factors. The evening delay in the simulated decrease in isoprene may be responsible for the marginally lower correlation as compared to total monoterpenes. As can be seen from the figures, higher isoprene fluxes were always associated with higher solar radiation, whereas higher temperatures correspond to higher monoterpene fluxes. Higher nighttime isoprene fluxes (∼0.5 mg C m−2 h−1) were observed on a few occasions during the measurement period, most likely due to the evening accumulation of isoprene within the canopy layer. Figure 5c and d show the correlations between the measured isoprene vs. total monoterpene fluxes and between the MEGAN-predicted isoprene vs. total monoterpene fluxes, respectively. In both cases, we observed strong correlations (r2=0.93 and 0.99, respectively), which further indicates that the isoprene and monoterpene emissions at Tapajós are driven by both solar radiation and temperature.
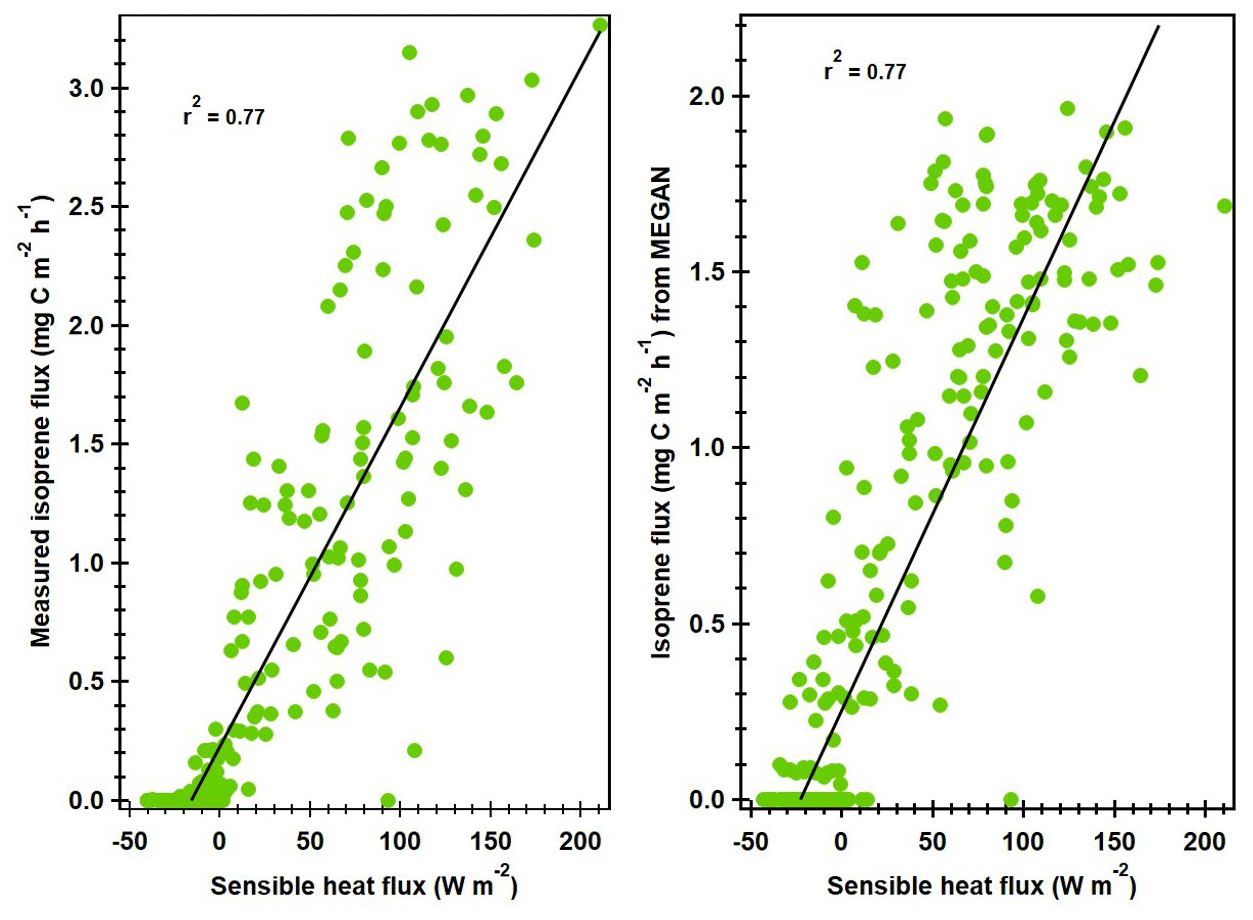
Figure 6Scatterplots for measured and MEGAN2.1 estimated isoprene flux with measured sensible heat flux.
Figure 6 depicts correlation plots for measured and MEGAN-predicted isoprene fluxes with measured sensible heat flux. Both measured and modelled isoprene fluxes had good correlations with measured SHF (r2=0.77 in both cases). The variations between the light environment within the canopy and the actual temperature contributes to this higher correlation. Further, the measured isoprene fluxes and sensible heat fluxes are interdependent since they use the same sonic anemometer data (Rinne et al., 2002). However, it is important to note that the MEGAN-predicted isoprene fluxes have a similar correlation with the measured SHF, even though they were calculated using the MERRA-2-derived solar radiation and temperature data, which are independent of the sonic anemometer data. This shows that MEGAN can predict diurnal variations even when driven by satellite-derived meteorology data that have higher uncertainties than measurements. An even more important requirement for accurate isoprene fluxes is to constrain the vegetation EFs for a specific landscape.
Isoprene and monoterpene fluxes were measured by PTR-TOF-MS eddy covariance at an eastern Amazon rainforest in the Tapajós National Forest during the wet-to-dry transition period (1–16 June 2014). The highest measured daytime isoprene and total monoterpene mixing ratios were ∼4 and ∼0.5 ppb, respectively. The daytime (06:00–18:00 LT) average isoprene mixing ratios and fluxes were 1.15±0.60 and 0.55±0.71 mg C m−2 h−1, respectively, whereas the measured daytime average total monoterpene mixing ratios and fluxes were 0.14±0.10 ppb and 0.20±0.25 mg C m−2 h−1, respectively. The emissions of isoprene and monoterpenes were dependent on both solar radiation and ambient temperature at Tapajós. The measured isoprene fluxes were comparatively lower than isoprene fluxes reported from other locations in the Amazon rainforest but similar to previous measurements at the Tapajós km-67 flux tower. However, monoterpene fluxes were in agreement with several previous studies in Amazon, suggesting that the Tapajós National Forest has a lower fraction of isoprene-emitting tree species and has a higher monoterpene∕isoprene ratio.
Comparison of the measured isoprene and total monoterpene fluxes with MEGAN2.1 model estimates suggests that MEGAN2.1 can explain most of the diurnal variations in BVOCs at Tapajós. However, site-specific EFs based on the in situ measurements are required to accurately represent the magnitude of the emissions. The emission factors estimated from the observed isoprene and monoterpene fluxes were ∼10 % higher for isoprene and ∼32 % lower for total monoterpenes in comparison to the MEGAN2.1 1 km emission factor distribution map but were 69 % lower for isoprene and 38 % lower for monoterpenes compared to the MEGAN2.1 PFT approach. This comparison shows that the MEGAN2.1 PFT emission scheme and the MEGAN2.1 1 km emission factor distribution map can differ by more than a factor of 3 locally, although they have similar global averages. This demonstrates the importance of using the emission factor distribution map for local- to regional-scale studies and comparisons to field measurements.
Data used in this paper can be obtained by sending an email to chinmoysarkar8@gmail.com or alex.guenther@uci.edu.
ABG, JHP, RS, SK, JS, JT and OV conceptualized the study. JHP, RS, EA, SB, JT and OV conducted the field measurements. CS, AG, JHP, RS, EA and SB analysed the data. ABG, SK, JS and JT supervised the research and administered the project. CS and ABG conducted model simulations and wrote the original draft. All authors reviewed and edited the paper. All authors have given approval to the final version of the paper.
The authors declare that they have no conflict of interest.
The authors acknowledge Núcleo de Apoio à Pesquisa no Pará (NAPPA) em Santarém-Pa/Instituto Nacional de Pesquisas da Amazônia (INPA), Programa de Grande Escala Biosfera Atmosfera na Amazônia (LBA) and Instituto Chico Mendes de Conservação da Biodiversidade (ICMBio) em Santarém-Pa for the support during the field campaign. Sarah Batalha acknowledges Coordenação de Aperfeiçoamento de Pessoal de Nível Superior (CAPES) and Fundação Amazônia de Amparo a Estudos e Pesquisas (FAPESPA) for her PhD fellowship.
This research has been supported by the National Science Foundation (NSF) Atmospheric Chemistry programme (grant no. AGS1643042).
This paper was edited by Rupert Holzinger and reviewed by two anonymous referees.
Acton, W. J. F., Schallhart, S., Langford, B., Valach, A., Rantala, P., Fares, S., Carriero, G., Tillmann, R., Tomlinson, S. J., Dragosits, U., Gianelle, D., Hewitt, C. N., and Nemitz, E.: Canopy-scale flux measurements and bottom-up emission estimates of volatile organic compounds from a mixed oak and hornbeam forest in northern Italy, Atmos. Chem. Phys., 16, 7149–7170, https://doi.org/10.5194/acp-16-7149-2016, 2016. a, b
Alves, E. G., Jardine, K., Tota, J., Jardine, A., Yãnez-Serrano, A. M., Karl, T., Tavares, J., Nelson, B., Gu, D., Stavrakou, T., Martin, S., Artaxo, P., Manzi, A., and Guenther, A.: Seasonality of isoprenoid emissions from a primary rainforest in central Amazonia, Atmos. Chem. Phys., 16, 3903–3925, https://doi.org/10.5194/acp-16-3903-2016, 2016. a, b, c
Andreae, M. O., Artaxo, P., Brandão, C., Carswell, F. E., Ciccioli, P., da Costa, A. L., Culf, A. D., Esteves, J. L., Gash, J. H. C., Grace, J., Kabat, P., Lelieveld, J., Malhi, Y., Manzi, A. O., Meixner, F. X., Nobre, A. D., Nobre, C., Ruivo, M. d. L. P., Silva-Dias, M. A., Stefani, P., Valentini, R., von Jouanne, J., and Waterloo, M. J.: Biogeochemical cycling of carbon, water, energy, trace gases, and aerosols in Amazonia: The LBA-EUSTACH experiments, J. Geophys. Res.-Atmos., 107, 1–25, https://doi.org/10.1029/2001jd000524, 2002. a, b, c
Batalha, S., Park, J.-H., Alves, E., Santana, R., Seco, R., Bustillos, J. O. V., Smith, J., Guenther, A. B., and Tóta, J.: Aspectos micrometeorológicos da emissão de monoterpenos em uma floresta na Amazônia central, Ciência e Natura, 40, 1–6, https://doi.org/10.5902/2179460x30729, 2018. a
Bauwens, M., Stavrakou, T., Müller, J. F., De Smedt, I., Van Roozendael, M., van der Werf, G. R., Wiedinmyer, C., Kaiser, J. W., Sindelarova, K., and Guenther, A.: Nine years of global hydrocarbon emissions based on source inversion of OMI formaldehyde observations, Atmos. Chem. Phys., 16, 10133–10158, https://doi.org/10.5194/acp-16-10133-2016, 2016. a
Claeys, M., Graham, B., Vas, G., Wang, W., Vermeylen, R., Pashynska, V., Cafmeyer, J., Guyon, P., Andreae, M. O., Artaxo, P., and Maenhaut, W.: Formation of Secondary Organic Aerosols Through Photooxidation of Isoprene, Science, 303, 1173–1176, https://doi.org/10.1126/science.1092805, 2004. a
Cox, P. M., Betts, R. A., Jones, C. D., Spall, S. A., and Totterdell, I. J.: Acceleration of global warming due to carbon-cycle feedbacks in a coupled climate model, Nature, 408, 184–187, https://doi.org/10.1038/35041539, 2000. a
da Rocha, H. R., Manzi, A. O., Cabral, O. M., Miller, S. D., Goulden, M. L., Saleska, S. R., R.-Coupe, N., Wofsy, S. C., Borma, L. S., Artaxo, P., Vourlitis, G., Nogueira, J. S., Cardoso, F. L., Nobre, A. D., Kruijt, B., Freitas, H. C., von Randow, C., Aguiar, R. G., and Maia, J. F.: Patterns of water and heat flux across a biome gradient from tropical forest to savanna in Brazil, J. Geophys. Res.-Biogeo., 114, 1–8, https://doi.org/10.1029/2007jg000640, 2009. a
de Gouw, J. and Warneke, C.: Measurements of volatile organic compounds in the earth's atmosphere using proton-transfer-reaction mass spectrometry, Mass Spectrom. Rev., 26, 223–257, https://doi.org/10.1002/mas.20119, 2007. a
Gelaro, R., McCarty, W., Suárez, M. J., Todling, R., Molod, A., Takacs, L., Randles, C. A., Darmenov, A., Bosilovich, M. G., Reichle, R., Wargan, K., Coy, L., Cullather, R., Draper, C., Akella, S., Buchard, V., Conaty, A., Silva, A. M. d., Gu, W., Kim, G.-K., Koster, R., Lucchesi, R., Merkova, D., Nielsen, J. E., Partyka, G., Pawson, S., Putman, W., Rienecker, M., Schubert, S. D., Sienkiewicz, M., and Zhao, B.: The Modern-Era Retrospective Analysis for Research and Applications, Version 2 (MERRA-2), J. Clim., 30, 5419–5454, https://doi.org/10.1175/jcli-d-16-0758.1, 2017. a
Gonçalves, F. G. and dos Santos, J. R.: Floristic composition and structure of a sustainable forest management unit in the Tapajós National Forest, Pará, Acta Amazon., 38, 229–244, https://doi.org/10.1590/S0044-59672008000200006, 2008. a
Greenberg, J. P., Guenther, A. B., Pétron, G., Wiedinmyer, C., Vega, O., Gatti, L. V., Tota, J., and Fisch, G.: Biogenic VOC emissions from forested Amazonian landscapes, Glob. Change Biol., 10, 651–662, https://doi.org/10.1111/j.1365-2486.2004.00758.x, 2004. a, b, c, d, e, f, g, h
Gu, D., Guenther, A. B., Shilling, J. E., Yu, H., Huang, M., Zhao, C., Yang, Q., Martin, S. T., Artaxo, P., Kim, S., Seco, R., Stavrakou, T., Longo, K. M., Tóta, J., de Souza, R. A. F., Vega, O., Liu, Y., Shrivastava, M., Alves, E. G., Santos, F. C., Leng, G., and Hu, Z.: Airborne observations reveal elevational gradient in tropical forest isoprene emissions, Nat. Commun., 8, 15541, https://doi.org/10.1038/ncomms15541, 2017. a, b
Guenther, A., Karl, T., Harley, P., Wiedinmyer, C., Palmer, P. I., and Geron, C.: Estimates of global terrestrial isoprene emissions using MEGAN (Model of Emissions of Gases and Aerosols from Nature), Atmos. Chem. Phys., 6, 3181–3210, https://doi.org/10.5194/acp-6-3181-2006, 2006. a, b, c, d
Guenther, A. B., Jiang, X., Heald, C. L., Sakulyanontvittaya, T., Duhl, T., Emmons, L. K., and Wang, X.: The Model of Emissions of Gases and Aerosols from Nature version 2.1 (MEGAN2.1): an extended and updated framework for modeling biogenic emissions, Geosci. Model Dev., 5, 1471–1492, https://doi.org/10.5194/gmd-5-1471-2012, 2012. a, b, c, d, e, f, g, h, i, j, k
Hallquist, M., Wenger, J. C., Baltensperger, U., Rudich, Y., Simpson, D., Claeys, M., Dommen, J., Donahue, N. M., George, C., Goldstein, A. H., Hamilton, J. F., Herrmann, H., Hoffmann, T., Iinuma, Y., Jang, M., Jenkin, M. E., Jimenez, J. L., Kiendler-Scharr, A., Maenhaut, W., McFiggans, G., Mentel, T. F., Monod, A., Prévôt, A. S. H., Seinfeld, J. H., Surratt, J. D., Szmigielski, R., and Wildt, J.: The formation, properties and impact of secondary organic aerosol: current and emerging issues, Atmos. Chem. Phys., 9, 5155–5236, https://doi.org/10.5194/acp-9-5155-2009, 2009. a
Harley, P., Vasconcellos, P., Vierling, L., Pinheiro, C. C. d. S., Greenberg, J., Guenther, A., Klinger, L., Almeida, S. S. d., Neill, D., Baker, T., Phillips, O., and Malhi, Y.: Variation in potential for isoprene emissions among Neotropical forest sites, Glob. Change Biol., 10, 630–650, https://doi.org/10.1111/j.1529-8817.2003.00760.x, 2004. a, b, c, d, e
Helmig, D., Balsley, B., Davis, K., Kuck, L. R., Jensen, M., Bognar, J., Smith, T., Arrieta, R. V., Rodríguez, R., and Birks, J. W.: Vertical profiling and determination of landscape fluxes of biogenic nonmethane hydrocarbons within the planetary boundary layer in the Peruvian Amazon, J. Geophys. Res.-Atmos., 103, 25519–25532, https://doi.org/10.1029/98jd01023, 1998. a, b
Holzinger, R.: PTRwid: A new widget tool for processing PTR-TOF-MS data, Atmos. Meas. Tech., 8, 3903–3922, https://doi.org/10.5194/amt-8-3903-2015, 2015. a
Jardine, A. B., Jardine, K. J., Fuentes, J. D., Martin, S. T., Martins, G., Durgante, F., Carneiro, V., Higuchi, N., Manzi, A. O., and Chambers, J. Q.: Highly reactive light-dependent monoterpenes in the Amazon, Geophys. Res. Lett., 42, 1576–1583, https://doi.org/10.1002/2014gl062573, 2015. a, b
Karl, T., Potosnak, M., Guenther, A., Clark, D., Walker, J., Herrick, J. D., and Geron, C.: Exchange processes of volatile organic compounds above a tropical rain forest: Implications for modeling tropospheric chemistry above dense vegetation, J. Geophys. Res.-Atmos., 109, 1–19, https://doi.org/10.1029/2004jd004738, 2004. a, b, c
Karl, T., Guenther, A., Yokelson, R. J., Greenberg, J., Potosnak, M., Blake, D. R., and Artaxo, P.: The tropical forest and fire emissions experiment: Emission, chemistry, and transport of biogenic volatile organic compounds in the lower atmosphere over Amazonia, J. Geophys. Res.-Atmos., 112, 1–17, https://doi.org/10.1029/2007jd008539, 2007. a, b, c, d, e
Karl, T., Harley, P., Emmons, L., Thornton, B., Guenther, A., Basu, C., Turnipseed, A., and Jardine, K.: Efficient Atmospheric Cleansing of Oxidized Organic Trace Gases by Vegetation, Science, 330, 816–819, https://doi.org/10.1126/science.1192534, 2010. a, b
Kesselmeier, J. and Staudt, M.: Biogenic Volatile Organic Compounds (VOC): An Overview on Emission, Physiology and Ecology, J. Atmos. Chem., 33, 23–88, https://doi.org/10.1023/a:1006127516791, 1999. a
Kuhn, U., Rottenberger, S., Biesenthal, T., Wolf, A., Schebeske, G., Ciccioli, P., Brancaleoni, E., Frattoni, M., Tavares, T. M., and Kesselmeier, J.: Seasonal differences in isoprene and light-dependent monoterpene emission by Amazonian tree species, Glob. Change Biol., 10, 663–682, https://doi.org/10.1111/j.1529-8817.2003.00771.x, 2004. a, b
Kuhn, U., Andreae, M. O., Ammann, C., Araújo, A. C., Brancaleoni, E., Ciccioli, P., Dindorf, T., Frattoni, M., Gatti, L. V., Ganzeveld, L., Kruijt, B., Lelieveld, J., Lloyd, J., Meixner, F. X., Nobre, A. D., Pöschl, U., Spirig, C., Stefani, P., Thielmann, A., Valentini, R., and Kesselmeier, J.: Isoprene and monoterpene fluxes from Central Amazonian rainforest inferred from tower-based and airborne measurements, and implications on the atmospheric chemistry and the local carbon budget, Atmos. Chem. Phys., 7, 2855–2879, https://doi.org/10.5194/acp-7-2855-2007, 2007. a, b
Langford, B., Misztal, P. K., Nemitz, E., Davison, B., Helfter, C., Pugh, T. A. M., MacKenzie, A. R., Lim, S. F., and Hewitt, C. N.: Fluxes and concentrations of volatile organic compounds from a South-East Asian tropical rainforest, Atmos. Chem. Phys., 10, 8391–8412, https://doi.org/10.5194/acp-10-8391-2010, 2010. a, b, c
Lindinger, W., Hansel, A., and Jordan, A.: On-line monitoring of volatile organic compounds at pptv levels by means of proton-transfer-reaction mass spectrometry (PTR-MS) medical applications, food control and environmental research, Int. J. Mass Spectrom., 173, 191–241, https://doi.org/10.1016/S0168-1176(97)00281-4, 1998. a
Liu, Y., Brito, J., Dorris, M. R., Rivera-Rios, J. C., Seco, R., Bates, K. H., Artaxo, P., Duvoisin, S., Keutsch, F. N., Kim, S., Goldstein, A. H., Guenther, A. B., Manzi, A. O., Souza, R. A. F., Springston, S. R., Watson, T. B., McKinney, K. A., and Martin, S. T.: Isoprene photochemistry over the Amazon rainforest, P. Natl. Acad. Sci. USA, 113, 6125–6130, https://doi.org/10.1073/pnas.1524136113, 2016. a
Liu, Y., Seco, R., Kim, S., Guenther, A. B., Goldstein, A. H., Keutsch, F. N., Springston, S. R., Watson, T. B., Artaxo, P., Souza, R. A. F., McKinney, K. A., and Martin, S. T.: Isoprene photo-oxidation products quantify the effect of pollution on hydroxyl radicals over Amazonia, Sci. Adv., 4, eaar2547, https://doi.org/10.1126/sciadv.aar2547, 2018. a
Longo, M., Knox, R. G., Levine, N. M., Alves, L. F., Bonal, D., Camargo, P. B., Fitzjarrald, D. R., Hayek, M. N., Restrepo-Coupe, N., Saleska, S. R., da Silva, R., Stark, S. C., Tapajós, R. P., Wiedemann, K. T., Zhang, K., Wofsy, S. C., and Moorcroft, P. R.: Ecosystem heterogeneity and diversity mitigate Amazon forest resilience to frequent extreme droughts, New Phytol., 219, 914–931, https://doi.org/10.1111/nph.15185, 2018. a, b
Müller, J. F., Stavrakou, T., Wallens, S., De Smedt, I., Van Roozendael, M., Potosnak, M. J., Rinne, J., Munger, B., Goldstein, A., and Guenther, A. B.: Global isoprene emissions estimated using MEGAN, ECMWF analyses and a detailed canopy environment model, Atmos. Chem. Phys., 8, 1329–1341, https://doi.org/10.5194/acp-8-1329-2008, 2008. a, b
Müller, M., Graus, M., Ruuskanen, T. M., Schnitzhofer, R., Bamberger, I., Kaser, L., Titzmann, T., Hörtnagl, L., Wohlfahrt, G., Karl, T., and Hansel, A.: First eddy covariance flux measurements by PTR-TOF, Atmos. Meas. Tech., 3, 387–395, https://doi.org/10.5194/amt-3-387-2010, 2010. a, b
Nepstad, D. C., de Carvalho, C. R., Davidson, E. A., Jipp, P. H., Lefebvre, P. A., Negreiros, G. H., da Silva, E. D., Stone, T. A., Trumbore, S. E., and Vieira, S.: The role of deep roots in the hydrological and carbon cycles of Amazonian forests and pastures, Nature, 372, 666–669, https://doi.org/10.1038/372666a0, 1994. a
Olson, D. M., Dinerstein, E., Wikramanayake, E. D., Burgess, N. D., Powell, G. V. N., Underwood, E. C., D'Amico, J. A., Itoua, I., Strand, H. E., Morrison, J. C., Loucks, C. J., Allnutt, T. F., Ricketts, T. H., Kura, Y., Lamoreux, J. F., Wettengel, W. W., Hedao, P., and Kassem, K. R.: Terrestrial ecoregions of the world: a new map of life on Earth, Bioscience, 51, 933–938, 2001. a
Park, J. H., Goldstein, A. H., Timkovsky, J., Fares, S., Weber, R., Karlik, J., and Holzinger, R.: Eddy covariance emission and deposition flux measurements using proton transfer reaction – time of flight – mass spectrometry (PTR-TOF-MS): comparison with PTR-MS measured vertical gradients and fluxes, Atmos. Chem. Phys., 13, 1439–1456, https://doi.org/10.5194/acp-13-1439-2013, 2013. a, b, c
Pöschl, U., Martin, S. T., Sinha, B., Chen, Q., Gunthe, S. S., Huffman, J. A., Borrmann, S., Farmer, D. K., Garland, R. M., Helas, G., Jimenez, J. L., King, S. M., Manzi, A., Mikhailov, E., Pauliquevis, T., Petters, M. D., Prenni, A. J., Roldin, P., Rose, D., Schneider, J., Su, H., Zorn, S. R., Artaxo, P., and Andreae, M. O.: Rainforest Aerosols as Biogenic Nuclei of Clouds and Precipitation in the Amazon, Science, 329, 1513–1516, https://doi.org/10.1126/science.1191056, 2010. a
Reichle, R. H., Koster, R. D., Lannoy, G. J. M. D., Forman, B. A., Liu, Q., Mahanama, S. P. P., and Touré, A.: Assessment and Enhancement of MERRA Land Surface Hydrology Estimates, J. Clim., 24, 6322–6338, https://doi.org/10.1175/jcli-d-10-05033.1, 2011. a
Rinne, H. J. I., Guenther, A. B., Greenberg, J. P., and Harley, P. C.: Isoprene and monoterpene fluxes measured above Amazonian rainforest and their dependence on light and temperature, Atmos. Environ., 36, 2421–2426, https://doi.org/10.1016/S1352-2310(01)00523-4, 2002. a, b, c
Rizzo, L. V., Artaxo, P., Karl, T., Guenther, A. B., and Greenberg, J.: Aerosol properties, in-canopy gradients, turbulent fluxes and VOC concentrations at a pristine forest site in Amazonia, Atmos. Environ., 44, 503–511, https://doi.org/10.1016/j.atmosenv.2009.11.002, 2010. a
Ruuskanen, T. M., Müller, M., Schnitzhofer, R., Karl, T., Graus, M., Bamberger, I., Hörtnagl, L., Brilli, F., Wohlfahrt, G., and Hansel, A.: Eddy covariance VOC emission and deposition fluxes above grassland using PTR-TOF, Atmos. Chem. Phys., 11, 611–625, https://doi.org/10.5194/acp-11-611-2011, 2011. a
Sakulyanontvittaya, T., Guenther, A., Helmig, D., Milford, J., and Wiedinmyer, C.: Secondary Organic Aerosol from Sesquiterpene and Monoterpene Emissions in the United States, Environ. Sci. Technol., 42, 8784–8790, https://doi.org/10.1021/es800817r, 2008. a
Saleska, S. R., Miller, S. D., Matross, D. M., Goulden, M. L., Wofsy, S. C., da Rocha, H. R., de Camargo, P. B., Crill, P., Daube, B. C., de Freitas, H. C., Hutyra, L., Keller, M., Kirchhoff, V., Menton, M., Munger, J. W., Pyle, E. H., Rice, A. H., and Silva, H.: Carbon in Amazon Forests: Unexpected Seasonal Fluxes and Disturbance-Induced Losses, Science, 302, 1554–1557, https://doi.org/10.1126/science.1091165, 2003. a, b, c
Sarkar, C., Sinha, V., Kumar, V., Rupakheti, M., Panday, A., Mahata, K. S., Rupakheti, D., Kathayat, B., and Lawrence, M. G.: Overview of VOC emissions and chemistry from PTR-TOF-MS measurements during the SusKat-ABC campaign: high acetaldehyde, isoprene and isocyanic acid in wintertime air of the Kathmandu Valley, Atmos. Chem. Phys., 16, 3979–4003, https://doi.org/10.5194/acp-16-3979-2016, 2016. a, b, c, d
Schallhart, S., Rantala, P., Kajos, M. K., Aalto, J., Mammarella, I., Ruuskanen, T. M., and Kulmala, M.: Temporal variation of VOC fluxes measured with PTR-TOF above a boreal forest, Atmos. Chem. Phys., 18, 815–832, https://doi.org/10.5194/acp-18-815-2018, 2018. a
Serça, D., Guenther, A., Klinger, L., Vierling, L., Harley, P., Druilhet, A., Greenberg, J., Baker, B., Baugh, W., Bouk-Biona, C., and Loemba-Ndembi, J.: EXPRESSO flux measurements at upland and lowland Congo tropical forest site, Tellus B, 53, 220–234, https://doi.org/10.3402/tellusb.v53i3.16593, 2001. a
Stavrakou, T., Müller, J. F., Bauwens, M., De Smedt, I., Van Roozendael, M., Guenther, A., Wild, M., and Xia, X.: Isoprene emissions over Asia 1979–2012: impact of climate and land-use changes, Atmos. Chem. Phys., 14, 4587–4605, https://doi.org/10.5194/acp-14-4587-2014, 2014.
Tani, A., Hayward, S., Hansel, A., and Hewitt, C. N.: Effect of water vapour pressure on monoterpene measurements using proton transfer reaction-mass spectrometry (PTR-MS), Int. J. Mass Spectrom., 239, 161–169, https://doi.org/10.1016/j.ijms.2004.07.020, 2004. a
Yáñez-Serrano, A. M., Nölscher, A. C., Williams, J., Wolff, S., Alves, E., Martins, G. A., Bourtsoukidis, E., Brito, J., Jardine, K., Artaxo, P., and Kesselmeier, J.: Diel and seasonal changes of biogenic volatile organic compounds within and above an Amazonian rainforest, Atmos. Chem. Phys., 15, 3359–3378, https://doi.org/10.5194/acp-15-3359-2015, 2015. a, b
Zimmerman, P. R., Greenberg, J. P., and Westberg, C. E.: Measurements of atmospheric hydrocarbons and biogenic emission fluxes in the Amazon Boundary layer, J. Geophys. Res.-Atmos., 93, 1407–1416, https://doi.org/10.1029/JD093iD02p01407, 1988. a