the Creative Commons Attribution 4.0 License.
the Creative Commons Attribution 4.0 License.
 | 12 Jun 2020
Air mass physiochemical characteristics over New Delhi: impacts on aerosol hygroscopicity and cloud condensation nuclei (CCN) formation
Sahil Bhandari
Shahzad Gani
Joshua S. Apte
Lea Hildebrandt Ruiz
Gazala Habib
Delhi is a megacity subject to high local anthropogenic emissions and long-range transport of pollutants. This work presents for the first time time-resolved estimates of hygroscopicity parameter (κ) and cloud condensation nuclei (CCN), spanning for more than a year, derived from chemical composition and size distribution data. As a part of the Delhi Aerosol Supersite (DAS) campaign, the characterization of aerosol composition and size distribution was conducted from January 2017 to March 2018. Air masses originating from the Arabian Sea (AS), Bay of Bengal (BB), and southern Asia (SA) exhibited distinct characteristics of time-resolved sub-micron non-refractory PM1 (NRPM1) species, size distributions, and CCN number concentrations. The SA air mass had the highest NRPM1 loading with high chloride and organics, followed by the BB air mass, which was more contaminated than AS, with a higher organic fraction and nitrate. The primary sources were identified as biomass-burning, thermal power plant emissions, industrial emissions, and vehicular emissions. The average hygroscopicity parameter (κ), calculated by the mixing rule, was approximately 0.3 (varying between 0.13 and 0.77) for all the air masses (0.32±0.06 for AS, 0.31±0.06 for BB, and 0.32±0.10 for SA). The diurnal variations in κ were impacted by the chemical properties and thus source activities. The total, Aitken, and accumulation mode number concentrations were higher for SA, followed by BB and AS. The mean values of estimated CCN number concentration (NCCN; 3669–28926 cm−3) and the activated fraction (af; 0.19–0.87), for supersaturations varying from 0.1 % to 0.8 %, also showed the same trend, implying that these were highest in SA, followed by those in BB and then those in AS. The size turned out to be more important than chemical composition directly, and the NCCN was governed by either the Aitken or accumulation modes, depending upon the supersaturation (SS) and critical diameter (Dc). af was governed mainly by the geometric mean diameter (GMD), and such a high af (0.71±0.14 for the most dominant sub-branch of the SA air mass – R1 – at 0.4 % SS) has not been seen anywhere in the world for a continental site. The high af was a consequence of very low Dc (25–130 nm, for SS ranging from 0.1 % to 0.8 %) observed for Delhi. Indirectly, the chemical properties also impacted CCN and af by impacting the diurnal patterns of Aitken and accumulation modes, κ and Dc. The high-hygroscopic nature of aerosols, high NCCN, and high af can severely impact the precipitation patterns of the Indian monsoon in Delhi, impact the radiation budget, and have indirect effects and need to be investigated to quantify this impact.
- Article
(3036 KB) - Full-text XML
-
Supplement
(865 KB) - BibTeX
- EndNote


High aerosol loading can have huge climatic repercussions on precipitation including land surface feedback through rainfall, surface energy budget, and variation in latent heat atmospheric influx (Tao et al., 2012). Added cloud condensation nuclei (CCN) may nucleate a larger number of smaller droplets, which then take a longer time to coalesce into raindrops (Gunn and Phillips, 1957; Squires, 1958). A greater cloud depth, indicating higher rain initiation, occurs in more polluted clouds. Complete suppression of warm rain might also occur and get aggravated due to additional CCN activation above the cloud base (Braga et al., 2017). While rain suppression was observed in the case of polluted urban and industrial plumes (Rosenfeld, 2000), and smoke arising from forest fires (Rosenfeld, 1999), the precipitation tendency increases due to influx of giant CCN consisting of sea salt (Rosenfeld et al., 2002) and salt playas (Rudich et al., 2002) due to acceleration of the auto-conversion rate (Rosenfeld et al., 2008). To understand the impact of pollution on indirect radiative forcing and precipitation in highly polluted regions, the information on CCN number concentration is essential in global climate models (GCMs) and regional climate models (RCMs).
As per the fifth IPCC report (Boucher et al., 2013), the two most important factors governing CCN activation and number concentration are size and composition. The aerosol chemical composition impacts the aerosol hygroscopicity, which impacts the critical diameter and hence CCN activation. The hygroscopicity parameter (κ) is defined as the total water uptake ability of aerosols (Petters and Kredenweis, 2007). Further, the increase in relative humidity (RH) due to water uptake by aerosol can impact visibility (Lee et al., 2016; Liu et al., 2012); secondary particle formation (Ervens et al., 2011); and measurements of remote sensing (Wang and Martin, 2007; Brock et al., 2016), aerosol loading, and its chemical composition (Chen et al., 2018). Hence, it is essential to determine the hygroscopicity of aerosols, especially in the polluted regions of the world, where these impacts are expected to be highly significant.
Although the recent precipitation data during 1950–2011, averaged over July and August for Delhi, reveal a significant decreasing trend, there has been an increasing trend in the frequency of heavy rainfall events and a decrease in the frequency of wet and rainy days when it rains for a shorter period (Guhathakurta et al., 2015). These occurrences are most likely signatures of aerosols impacting the cloud-nucleating properties, which calls for detailed CCN data examination. The high uncertainties associated with radiative forcings, both direct and indirect, especially at the regional level, are a result of poor representation of the aerosol distributions in GCMs. This is critical for the Indian sub-continent, where the variability in aerosol microphysical properties is very high, at various spatial and temporal scales. These necessitate the measurement of long-term aerosol physiochemical properties, the hygroscopicity parameter, and CCN estimates. Detailed CCN and κ measurements have been carried out in different parts of the world (Rissler et al., 2004; Bougiatioti et al., 2011; Engelhart et al., 2012) and in India, in places like Kanpur (Bhattu and Tripathi, 2014, 2015; Ram et al., 2014), Mahabaleshwar (Leena et al., 2016), and the eastern Himalayas (Roy et al., 2017). However, no CCN measurements or estimates have been developed so far for Delhi. There is only one study that has estimated aerosol hygroscopicity based on PM2.5 mass, RH, and visibility data (Wang and Chen, 2019).
In this work, for the first time for Delhi, time-resolved size distribution and chemical speciation measurements were carried out from 15 January 2017 to 31 March 2018 as a part of the Delhi Aerosol Supersite (DAS) campaign (Gani et al., 2019). The time-resolved hygroscopicity parameter and CCN estimates were derived using chemical speciation data from an aerosol chemical speciation monitor (ACSM), and number concentration data from a scanning mobility particle sizer (SMPS), measured from January 2017 to March 2018. Data were analysed to investigate the following hypotheses: (a) the precursors to secondary organic aerosol (SOA) formation critically impact the chemical composition over Delhi, (b) the emission sources significantly impact CCN formation by governing the size distributions and chemical composition, and thus hygroscopicity, and (c) physical properties impact CCN more compared to chemical properties directly – however, the physical properties are, in turn, shaped by the chemical properties.
2.1 Instrumentation
For a detailed assessment of aerosol physiochemical properties, an SMPS (TSI, Shoreview, MN), ACSM (Aerodyne Research, Billerica MA), and aethalometer (Magee Scientific Model AE33, Berkeley, CA) were operated at the Indian Institute of Technology (IIT) Delhi in Block 5, at a height of nearly 15 m, as a part of the DAS campaign. This sampling site in New Delhi was free from any source activity, except for a road, located 150 m away. The IIT campus is cleaner than the rest of the city. However, it lies in the heart of the city, and the outskirts of the campus experience fresh traffic influx. The IIT campus allows only limited access to vehicles and therefore has less traffic compared to the city in general. A temperature-controlled room was used to carry out the measurements. Two separate and thermally insulated sampling lines (3∕4 in. outer-diameter stainless-steel tubes) with flows of 3 and 2 L min−1 equipped with PM1 cyclone, in line with a water trap and a Nafion membrane diffusion dryer (Magee Scientific Sample Stream Dryer, Berkeley, CA), were used for (1) an SMPS and ACSM in conjunction with a flow controller and (2) an aethalometer, respectively. A brief description of the instruments is given below. A detailed description of the instruments is given in Gani et al. (2019) and Bhandari et al. (2020).
The SMPS was comprised of a differential mobility analyser (DMA; TSI 3081), an electrostatic classifier (TSI 3080), an X-ray aerosol neutralizer (TSI 3088), and a water-based condensation particle counter (CPC; TSI 3785). The ambient air was sampled in the size range 12–560 nm, with a time difference of 135 s between two scans. The sheath-to-aerosol flow ratio was 4 : 1, and the total flow drawn by the CPC was 1 L min−1. The two dominant modes (Aitken and accumulation) are well captured within this size range. The ACSM sampled the inlet air at a flow rate of 0.1 L min−1 with a time resolution of ∼1 min. The calibration procedures and data processing are discussed in Gani et al. (2019). The ACSM collected time-resolved NRPM1 (non-refractory PM1) based on species that volatilize by 600 ∘C and included , Cl−, , , and organics.
2.2 Qualitative separation of organic aerosols as BBOA, HOA, and OOA
The composition data presented in this work were collected in the DAS study. PMF (positive matrix factorization) analysis was conducted on the 15 months in the dataset. As a result, biomass-burning organic aerosol (BBOA) could be resolved as a separate factor only in spring 2018. This inability to resolve primary organic aerosol (POA) to separate factors, namely hydrocarbon-like organic aerosol (HOA) and BBOA, was attributed to the unit mass resolution of the instrument (Bhandari et al., 2020, and references therein). Owing to the lack of explicit BBOA and HOA separation in all seasons, the Ng et al. (2010) compilation of profiles was analysed, combined with the profiles identified in spring in Delhi. It was observed that spring 2018 profiles fell within the bounds of the uncertainty of the Ng et al. (2010) compilation. Thus, Ng et al. (2010) reference profiles were utilized for source attribution of each cluster. While factor profiles can differ across the world, taking regionally relevant profiles together with those usually employed as reference profiles for PMF analysis likely accounts for this variability. As a part of the analysis conducted here, the mean strength at the relevant m∕z (s) (m∕z 57 and 60) and the standard deviation (SD) of the profiles at these m∕z (s) were utilized in the analysis.
Organic aerosols were qualitatively segregated by comparing the m∕z ratios of f57 and f60 with the reference profiles of BBOA (f57: 0.0337±0.00884, f60: 0.025±0.00521), HOA (f57: 0.0838±0.00378, f60: 0.00227±0.00214), and oxygenated organic aerosol (OOA) (f57: 0.00997±0.00786, f60: 0.00571±0.00349), as reported by Ng et al. (2010). This was done by first calculating the cluster means of f57 and f60 for each cluster (Table 2). This was followed by an evaluation of residuals. Residuals represent the deviation of the cluster means from the reference profiles. The HOA, BBOA, and OOA residuals (RHOA, RBBOA, and ROOA) were then calculated based on cluster means of f57 and f60 ( and ), with respect to the corresponding means of reference profiles ( and ), as given below for HOA in Eq. (1):
The reference residuals for HOA, BBOA, and OOA (RRef_HOA, RRef_BBOA, RRef_OOA) were then calculated using standard deviations of reference profiles (, , ), as given below for HOA in Eq. (2):
The residuals of the cluster means were then compared with the reference residuals as per the six conditions described in detail in Sect. S1 in the Supplement and classified as HOA, BBOA, OOA, or mixed.
2.3 Estimation of κ and CCN
The ACSM data were used to calculate κ as per the following mixing rule in Eq. (3) (Petters and Kredenweis, 2007):
where ϵi and κi represent the volume fractions and individual hygroscopicity parameters of the various components. The inorganics were represented by (NH4)2SO4, NH4Cl, and NH4NO3. The organic κi was taken as 0.1 (Gunthe et al., 2009, 2011; Dusek et al., 2010; Rose et al., 2011). κi values were taken as 0.61 for (NH4)2SO4, 1.02 for NH4Cl, and 0.67 for NH4NO3 (Sullivan et al., 2009; Petters and Kredenweis, 2007). The density values to estimate the volume fraction of the inorganic constituents were taken as 1770 kg m−3 for (NH4)2SO4, 1519 kg m−3 for NH4Cl, and 1720 kg m−3 for NH4NO3 (Haynes et al., 2014). The density of organics was taken as 1500 kg m−3 (Bougiatioti et al., 2009). κ for BC was taken as zero, as reported in several studies (Hong et al., 2014; Leng et al., 2014; Wu et al., 2013).
It should be noted that we assumed that the κ calculated from NRPM1 data of ACSM represents the bulk hygroscopicity parameter in the absence of size-resolved measurements and is a limitation of this work. The difference due to the assumption cannot be accounted for and should be investigated in the future. However, it is reported that for κ>0.1, CCN closures within 20 % can be achieved assuming bulk composition and internal mixing (Wang et al., 2010). Temperature, relative humidity (RH), and the calculated κ were then used to calculate the critical diameter (Dc) from the multi-component κ-Köhler theory (Bhattu and Tripathi, 2015). The temperature and RH data are available from the RK Puram site (∼ 3–4 km aerial distance from the measurement site) maintained by the Central Pollution Control Board (CPCB), India. NCCN was then estimated by integrating the size distribution obtained from SMPS above Dc. The CCN estimates were obtained for the supersaturation (SS) of 0.1 %, 0.15 %, 0.2 %, 0.35 %, 0.4 %, 0.5 %, 0.6 %, 0.7 %, 0.75 %, 0.8 %, 0.85 %, and 1 %. However, for the sake of detailed analysis, 0.1 %, 0.4 %, and 0.8 % were chosen: 0.1 % represents the condition when the effect of chemical composition is expected to be the highest, 0.4 % represents the condition for convective clouds, and 0.8 % represents a high-supersaturation state, when almost all aerosols tend to get activated as CCN.
2.4 Air mass characterization
To characterize the air masses, the Hybrid Single Particle Lagrangian Integrated Trajectory (HYSPLIT) model was used (Draxler and Rolph, 2003) to determine the major pathways of aerosols reaching Delhi. The 5 d back-trajectory analysis was done at the receptor site at a height of 500 m. The cluster analysis was then performed seasonally to identify the cluster mean trajectories per season. These mean trajectories were then again re-clustered to identify three main clusters based on the directions of the mean cluster trajectories: the Arabian Sea (AS) branch (16.5 % of total trajectories), the Bay of Bengal (BB) branch (13 % of total trajectories), and the southern Asian (SA) branch (70.5 % of total trajectories). The BB branch was further classified as B (54 %) and B.reg (45 %), where B represents the air masses reaching the sea, while B.reg represents the air masses that aligned towards reaching the Bay of Bengal but did not hit the sea. The SA branch was partitioned into L (17.5 %), R1 (54 %), R2 (18 %), and R3 (11 %). L represents the local trajectories originating within India, mainly from Delhi, Punjab, and Haryana. R1 represents trajectories coming from Pakistan and Afghanistan. R2 represents trajectories originating from Iran. R3 is representative of all trajectories beyond these, including a portion of South Africa, the Mediterranean Sea, and Turkey. The seasonal clusters for the winter, spring, summer, and monsoon of the year 2017 and winter and spring of the year 2018 are shown in Fig. S1 in the Supplement. The re-clustering is shown in Fig. 1. All the chemical speciation data from ACSM and size distribution data from SMPS were then categorized as per the classification discussed above and used in the following discussion.

Figure 1HYSPLIT grouping of cluster mean trajectories based on directions and distances of source regions. Cluster mean trajectories were obtained for all seasons and clubbed as per directions. AS branch originated from the Arabian Sea; BB branch, with sub-branches B and B.reg, originated from Bay of Bengal; and SA branch, with sub-branches L, R1, R2, and R3 from the north-western direction, originated mainly on the southern Asian landmass. The map layer used is from “World Countries (Generalized)”, by Esri, Garmin International (2010, https://www.arcgis.com/home/item.html?id=170b5e6529064b8d9275168687880359, last access: 17 May 2020). © Esri, Garmin. All rights reserved. This map is intellectual property of Esri, Garmin, and used under license. Further details may be found at https://www.esri.com (last access: 17 May 2020).
2.5 Aerosol ageing estimation
The NOx, toluene, and benzene data inventory for the entire campaign was taken from the CPCB for RK Puram, whenever available. The data were not available for branch B. To determine the photochemical ageing of aerosols, toluene and benzene concentrations were used to calculate the life (in hours), as per Nault et al. (2018) in Eq. (4):
where molecules cm−3 (Nault et al., 2018), , and (Atkinson et al., 2006) are the rate constants for each aromatic compound, toluenei(o)=1.85 and benzenei(o)=2.31. [OH] is not constant and varies considerably temporally and spatially, but due to the unavailability of data of its variation for Delhi, it was assumed constant for ageing calculation.
The HYSPLIT analysis revealed that the north-western direction is the most dominant direction, which is representative of SA air masses, and within it, R1 is the most dominant, indicating that overall, the emissions from Pakistan and Afghanistan and the sources en route govern Delhi's aerosol characteristics. However, the chemical signatures were potentially different for the various clusters, which explains the variation in aerosol properties with time. Due to the different nature of sources and pathways, aerosol properties vary, resulting in different hygroscopic properties and CCN forming potential. These aspects are discussed in the following sections.
3.1 Introduction to characteristics and sources of air masses
Out of the three main branches, the SA branch was the most anthropogenically contaminated, followed by BB and AS branches, as indicated by the mean NRPM1 mass concentrations: 125.2±91.6, 45.9±23.3, and 32.5±20.6 µg m−3, respectively (Fig. 2a). The total NRPM1 loading for the SA branch followed the sequence: . Amongst the SA branches, L was associated with the lowest organic (52.8±40.6 µg m−3) and inorganic (42.1±33.1 µg m−3) content, while R2 had the maximum organic (85.4±59.8 µg m−3) and inorganic (57.9±47.5 µg m−3) content. A summary of the overall characteristics is given in Table 1. The prominent sources for the SA air mass include metal processing industries (Haryana and Delhi NCR), coke and petroleum refining (Punjab), thermal power plants (Pakistan, Punjab, and NCR Delhi), agricultural-residue burning (Punjab and Haryana), soil dust (Pakistan, Punjab) (Jaiprakash et al., 2017), and coal mines in Pakistan, where non-ideal burning of (NH4)2SO4 occurs (Chakraborty et al., 2015).

Figure 2Mean values of (a–c) NRPM1; (d–f) organics, inorganics, and BC; and (g–i) PM1 species (from top to bottom) for the various air masses. Panels (a), (d), and (g) are for AS, BB, and SA; (b), (e), and (h) are for BB branches (B and B.reg); and (c), (f), and (i) are for SA branches (L, R1, R2, and R3).
Table 1Mean values of NRPM1 species and BC (µg m−3) for all clusters.
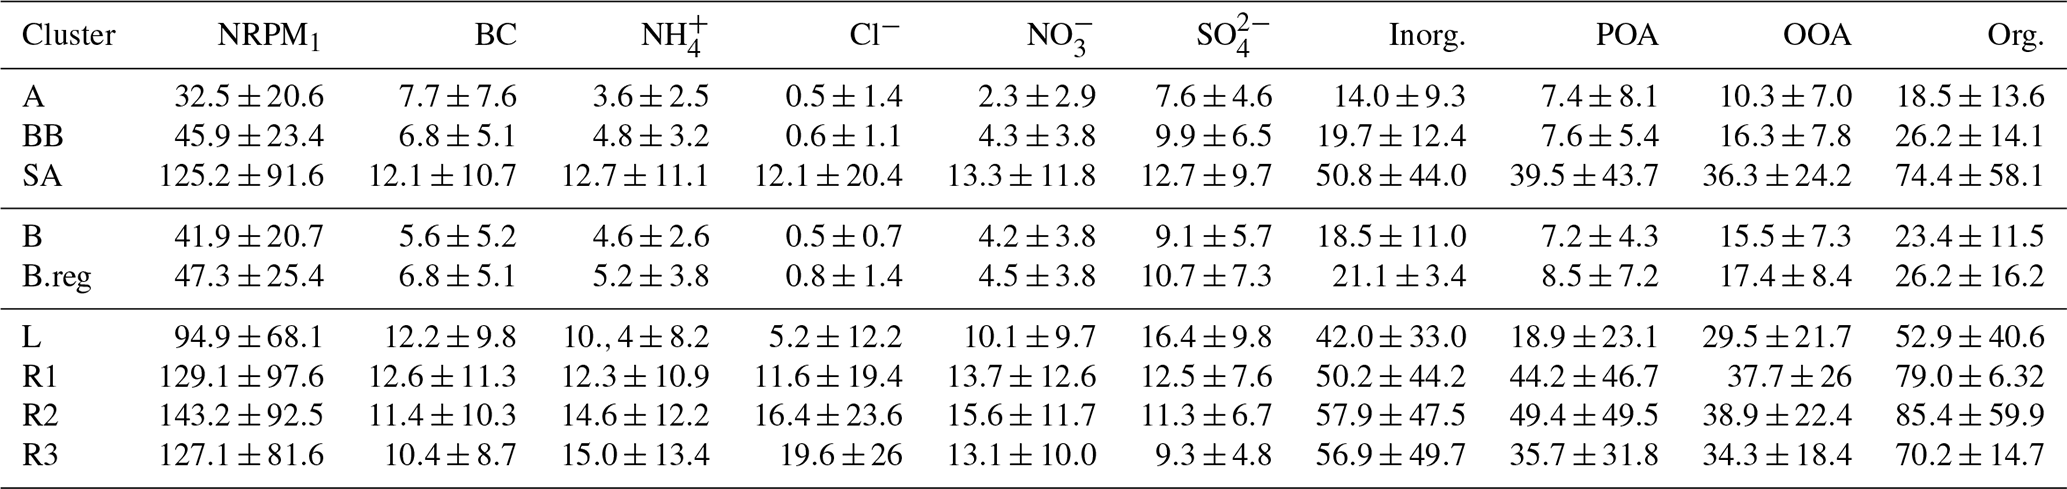
Table 2Cluster means of f57 and f60 values for all branches, where SD means standard deviation.

When comparing the BB branches, total NRPM1 for B (41.9±20.8 µg m−3) was slightly less than that for B.reg (47.3±25.4 µg m−3), and this can be attributed to the fact that the B.reg air mass does not travel over water (originates adjacent to the coastline) but is subject to its influence, while the B air mass travels over water and is therefore cleaner. B.reg had a slightly higher inorganic and organic content than that of B.
The relatively higher abundance of aerosols of BB over AS can be attributed to both the sources and the pathways of air masses. In terms of source, the Bay of Bengal is more anthropogenically impacted than the Arabian Sea, as concluded by the ICARB campaign (Kalapureddy et al., 2009). Previous studies (Nair et al., 2008a, b; Moorthy et al., 2008) reported higher aerosol number concentration (NCN), as well as black carbon (BC) concentration, over the Bay of Bengal than over the Arabian Sea, in all size ranges within the marine boundary layer as well as the vertical column. The BB air mass travelled over the Indo-Gangetic Plain (IGP), and the AS air mass travelled across western India and the desert region of Rajasthan. Based on previous emission estimates (Habib et al., 2006), the emission fluxes from fossil fuel dominate the aerosol burden over the IGP. The aerosol over the IGP is largely composed of inorganic oxidized matter (IOM), including fly ash from coal-fired power plants and mineral matter from open crop waste burning (Habib et al., 2006). The AS air mass travels over western India and brings pollution from both fossil fuel combustion and desert dust (Habib et al., 2006).
3.2 PM1 chemical composition of different air masses
Mass closure between SMPS size distribution data and the sum of ACSM species together with BC was achieved (R2=0.83) as detailed in our parallel paper (Gani et al., 2019). The NRPM1 species (, Cl−, , , POA, and OOA) and BC varied significantly for the different air masses, both in terms of the mass of species (Fig. 2c) and the diurnal patterns (Fig. 3), leading to different aerosol chemistry and chemical reactions. A summary of the average mass of each species for all air masses is detailed in Table 1. In brief, both POA and OOA, followed by , , and Cl−, dominated the PM composition for the SA air mass, while OOA, followed by and OOA, was dominant for BB and AS air masses. High chloride was a special feature of the SA air mass which was not apparent in the other two branches.

Figure 3Diurnal variation in NRPM1 species (, Cl−, , , POA, and OOA) and BC for AS on the left, BB (B and B.reg) in the middle, and SA (L, R1, R2, and R3) air masses on the right.
was assumed to be the dominant cation based on high aerosol neutralization ratio (ANR) values (mean values ranging from 0.95 to 0.85). The ANR is defined as the normalized ratio of the measured concentration to the concentration needed for full neutralization of the anions and calculated as per Eq. (5) (Zhang et al., 2007):
Detailed ANR values are given in Table S1 in the Supplement. ANR values revealed that while AS, B, and L branches were completely neutralized, B.reg, R1, R2, and R3 were only partly neutralized, indicating that minor components of sulfate, chloride, and nitrate may be bound to non-volatile salts such as NaNO3, NaCl, or Na2SO4 or are associated with organics as organosulfates, organochlorides, or organonitrates, evidence for which is shown in a previous DAS study (Bhandari et al., 2020).
To determine the dominant salts, ions were neutralized with ions. The speciation of salts of and was determined by the molar ratio of to ions (). is indicative of (NH4)2SO4 , while indicates a mixture of (NH4)2SO4 and NH4HSO4, and indicates a mixture of H2SO4 and NH4HSO4 (Nenes et al., 1998; Asa-Awuku et al., 2011; Padró et al., 2012). For Delhi, was obtained for all branches, indicating that (NH4)2SO4 was present in all branches. Furthermore, the non-sulfate ions [ns-] were calculated, as per . The r2 values were then determined for the coupling of ns- ions with (a) Cl− ions, (b) ions, and (c) ions jointly (Du et al., 2010). All r2 values are detailed in Table S1. This analysis revealed that (NH4)2SO4 is the dominant salt for AS and B branches based on values of 0.78 for AS and 0.75 for BB 0.75. NH4Cl formation for SA was confirmed by a high r2 value (0.90) for ns- coupling with Cl−. A similar finding is reported by Bhandari et al. (2020) based on the coupling of the NH4Cl factor with wind direction. Coupling of ns- with revealed a good correlation for B (0.70) and B.reg (0.63) (Fig. S6). In all cases, an increase in r2 for combined as compared to individual ions indicates that both HNO3 and HCl were synchronously neutralized by NH3. If Cl− and are present in the fine mode, they are expected to be in the form of their respective ammonium salts (Harrison and Pio, 1983). Thus, the dominating salts were (NH4)2SO4 for AS, (NH4)2SO4 and NH4NO3 for the BB air mass, and NH4Cl for SA and its sub-branches.
The organic speciation revealed that AS organics were BBOA; BB (both B and B.reg) organics were a mix of the three; and SA organics were BBOA, wherein L, R1, and R2 organics were BBOA while R3 organics were both HOA and BBOA.
The NOx emissions (in µg m−3) for the SA air mass (96.88±127.22) were the highest, followed by those in BB (38.30±64.79) and then those in the AS (36.71±68.13) air mass. BB is representative of B.reg only, as NOx data for the B air mass were not available. NOx data for AS were also scarce. The SA aerosols exhibited less ageing (4.38±4.49 h) compared to B.reg. (11.58±3.45 h), but both were representative of aged aerosols. Ageing was not calculated for AS due to very little data availability.
To determine the presence of biomass burning and traffic emissions, BCwb (wood-burning component) and BCff (traffic component) for all air masses were determined, based on aethalometer data, as per Sandradewi et al. (2008). The contributions of BCwb and BCff are summarized in Table S4. Since fossil fuel sources are active year-round, there was a strong presence of BCff, ranging from 70 % to 86 %. However, biomass burning is only active during certain specific times for short durations and is very prominent in the north-western direction for the SA air masses. It was observed that the more distant air masses exhibited a higher BCwb contribution compared to those originating within proximity. Hence, while L was associated with 13.9 % BCwb, R3 exhibited 29.2 % BCwb. The BCwb contribution for A and BB air masses was 21 %. It can thus be concluded that both biomass burning and traffic emissions are important sources contributing to the chemical composition of the various air masses.
3.3 Diurnal variation in chemical species and probable sources
3.3.1 The southern Asian air mass
This air mass ranked highest in concentration compared to other branches. Locally (i.e. for L), the source for may be attributed to NH3 gas from the nearby agricultural fields of the Indian Agricultural Research Institute (IARI) (Sharma et al., 2014). For R1, R2, and R3, sharp spikes in early morning hours seen in the diurnal patterns of indicate its formation from ammonia as a result of industrial exhaust of untreated ammonia. This is because its diurnal variation is very similar to the diurnal of NH3 emissions of an industrial origin (Wang et al., 2015). A very prominent feature of the SA that made it distinct from the other two air masses was the presence of high chloride ( and [Cl−]R3). High Cl− in the SA branch can be attributed to several factors: (a) Khewra salt mines in Pakistan that might contribute to high Cl− in other branches compared to L; (b) locally, plastic burning, refuse burning, and soil dispersion; (c) biomass burning, which is a very prominent feature of the SA branch, as indicated by f57 and f60 values and also by a large number of fire counts from MODIS fire-count data (Bhattu and Tripathi, 2015), dominantly in Punjab, Haryana, and a few places in Pakistan; (e) coal-based thermal power plants in Delhi, Punjab, Haryana, and Pakistan; and (f) small- and medium-scale metal processing industries in Delhi, Punjab, and Haryana, where HCl is used in a pickling process of hot and cold rolling of steel sheets and acid recovery from fume generation is not practised (Jaiprakash et al., 2017).
As far as the increase in chloride with the increasing length of trajectories is concerned, the most plausible explanation is biomass burning. It is pointed out in Sect. 3.2 that BCwb contribution increases as the air mass trajectories become distant, a feature similar to chloride emissions. There was a marked similarity in the diurnal patterns of and Cl− ions such that the sequence of [Cl−] for SA sub-branches was also valid for [], indicating the formation of NH4Cl. NH4Cl may also be emitted directly from cement plants (Cheney et al., 1983) in Punjab. The equilibrium constant for Cl− is more sensitive to ambient temperature than , as a result of which, during the daytime, a large amount of NH4Cl dissociates to form NH3 and HCl if the temperature exceeds 10 ∘C (Kaneyasu et al., 1999). The diurnal patterns of both [] and [Cl−] exhibited a sharp decrease after 08:00 LT (all times listed in the paper are in local time, UTC+5:30) in the morning, which is obvious, since for the SA air mass is mostly associated with Cl−. At the same time [] showed an increase between 09:00 and 10:00 and then started decreasing, but the rate of decrease was lower than NH4Cl. This is expected, as NH4NO3 is more stable than NH4Cl (Kaneyasu et al., 1999). During winter, the ambient temperature drops slightly below 10 ∘C in the morning hours, increases sharply after 08:00 to reach a maximum at 14:00, and then again starts decreasing and reaches around 10 ∘C at midnight (Gani et al., 2019). Since during winters, the air mass comes mostly from the north-western direction of the SA air mass, it is evident that the formation and dissociation of NH4Cl were governed by the ambient temperature at the receptor site.
The reduction in chloride concentrations at midday can also be attributed to sulfate substitution mechanism, when sulfate formation enhances, and was also marked by the ratio ratio greater than 2 for L, R1, R2, and R3. This is valid especially for L, wherein [] increased significantly. However, the diurnal patterns of [] and [] did not resemble each other, indicating that (NH4)2SO4 may be present in small amounts, but primarily is associated elsewhere. Hence, in combined form can be expressed in two ways: (a) small amounts of (NH4)2SO4 and (b) mostly in combination with K+. Thus, the sharp jump in [] in locally originated air masses in the late morning and afternoon hours may be attributed to SO2 emissions. SO2 emissions in India are primarily attributed to power generation plants that make use of coal combustion as the chief source (Reddy and Venkataraman, 2002), followed by transportation. Such coal-based power plants are located in the IGP, with a high concentration in Haryana. SO2 dissolves readily in water and can form sulfite ion, which in the presence of ozone can form sulfate ion (Erickson et al., 1977). H2SO4 formed from the reaction of SO2 and ozone can react with NH3 to form NH4HSO4, which combines with NH3 again to form (NH4)2SO4 (Stelson and Seinfeld, 1982; Seinfeld, 1986). Since the ozone spiked during the daytime (10:00–16:00), more sulfate formation was seen when ozone was maximum. The diurnal variation for ozone is explained in Gaur et al. (2014) for Kanpur, where a spike in ozone levels was seen during 10:00–16:00. A peak in sulfate concentration was also previously observed for the foggy period in Kanpur at 10:00 due to the resumption of photochemical activity after fog dissipation (Chakraborty et al., 2015). in SA branches may also combine with K+, as K+ is produced in biomass burning. Evidence for the presence of K+ along with in the accumulation mode is reported in Fuzzi et al. (2007). and emissions may also be associated with secondary formation for R1, R2, and R3 due to industrial emissions from metal product manufacturing industries in Punjab and Haryana; large-scale manufacturing of porcelain insulators; switchgear in Islamabad (Jaiprakash et al., 2017); and steel rolling mills in Iran, Iraq, and Turkey and Punjab.
The levels were very high for SA. The high in SA can be explained by the non-ideal burning of NH4NO3 and NOx emissions due to mining equipment in the coal mines in Pakistan, leading to high formation (Chakraborty et al., 2015). It is mentioned in Sect. 3.2 that NOx emissions in the SA branch are very high. neutralizes simultaneously with Cl−; however, the correlation of [] with [ns-] is moderate for SA. Therefore, it is expected that might be associated with K+ and Na+, since biomass burning results in K+ and Na+ emissions (Fuzzi et al., 2007). K+ and Na+ exhibit a high affinity for nitrate during neutralization reactions, thus aiding in particulate nitrate formation (Bi et al., 2011). This is in addition to other nitrate sources that are discussed above along with sources for SA.
The BC concentrations were highest for SA, followed by those in AS and then those in BB. The biomass burning in the SA air mass could be a major source of BC besides power plants, cement plants, local traffic, and industries. The POA emissions for SA followed the order . The spikes during the early morning hours and nighttime of the POA diurnal profile may be attributed to lower boundary layer heights during the two periods. BC and POA were well correlated (r2=0.77) for R3, indicating that they come from primary emissions. The diurnal profiles for all branches were similar, which shows a decline as the day proceeds, followed by an increase as the night proceeds. OOA was present significantly in all the three branches but is maximum for SA. Its diurnal variation resembled that of (r2=0.78), indicative of its semi-volatile nature. OOA and correlations were strongest for L (r2=0.91), followed by R2 (r2=0.85), R3 (r2=0.81) and R1 (r2=0.75).
3.3.2 The Bay of Bengal air mass
[Cl−] was lower in this air mass compared to that in SA. For both of the BB branches, fossil fuel combustion was the most likely source of Cl−, as fossil fuel emissions dominate the IGP. Cl− for BB was not correlated with ns- and may be present in the form of methyl chloride, methylene chloride, carbon tetrachloride, and tetrachloroethene (Ho et al., 2004).
Fossil fuel combustion from coal plants along the IGP can be explained as a common source for both and ions, leading to (NH4)2SO4 formation (). This was also seen in the diurnal profiles of [] and [], both of which exhibited a sharp spike in the early morning hours between 10:00 and 16:00. SO2 emissions, as explained for SA via photochemical oxidation by O3 in combination with NH3, can lead to (NH4)2SO4 formation. For the B.reg branch, the diurnal profiles of and exhibited double spikes (M pattern, which is a typical feature of NOx profile for traffic emissions) during heavy traffic hours (06:00–08:00 and around 16:00–19:00), indicating (NH4)2SO4 formation. NO from automobile exhaust can also form NH3 in three ways catalytic convertors (Gandhi and Shelf, 1991), which in combination with SO2, formed due to pyrolysis of sulfide fuels and subsequent oxidation, can lead to (NH4)2SO4 formation.
The correlation of [] with [ns-] was appreciably high for both B and B.reg. For both these branches, the fossil fuel combustion resulting in emissions in combination with (Rajput et al., 2015; Pan et al., 2016) can lead to NH4NO3 formation. This is also evident from the diurnal profile of that shows a very similar pattern to and is expected to be in the form of NH4NO3. The diurnal profiles of show a decline as the temperature increases during the day and converts back to HNO3 due to its semi-volatile nature.
The BC concentration in BB air masses was considerably lower than in the SA air masses. The missing points in the diurnal variability in BC for the B region are on account of the unavailability of aethalometer data. The BC in the IGP can be emitted from industries (as for B), traffic (as for B.reg), and natural sources (Derwent et al., 2001). For B and B.reg, the B.reg branch was subjected to a longer duration of anthropogenic influence compared to B, which also spent considerable time on the water; hence after the early morning hours, when the various fresh emissions start increasing, the magnitude of POA for B.reg exceeds B. However, POA for BB was very low compared to SA. For B.reg, the spike in OOA during daytime hours was very similar to that of odd oxygen (O3+NO2) for Delhi. The Ox profile for Delhi is given in Tiwari et al. (2015), indicating its production by local photochemistry despite the increase in boundary layer height in the afternoon. The similarity in OOA and Ox diurnal profiles was also noted for Kanpur (Chakraborty et al., 2016).
3.3.3 The Arabian Sea air mass
Chloride amounts were very low for AS compared to that in SA. Biomass burning as indicated by f57 and f60 measurements seems to be the main Cl− contributor to AS and might be associated with K+, which is also emitted along with it.
Similar to the cases of the L branch in the case of the SA air mass and the BB air mass, the power stations in Gujarat and Rajasthan lead to SO2 emissions. Since the power plants in this region, over which the AS air mass traverses, are relatively small in number, the SO2 concentration is much lower compared to that in the BB air masses. SO2 emissions subsequently lead to (NH4)2SO4 formation, which was the main salt present in this branch and was also evident from the high correlation between the two ions. (NH4)2SO4 may be formed due to emissions from both power plants and traffic (similar to B.reg). Traffic emissions can be understood from the M pattern in diurnal profiles of and , though the variation was not very pronounced and might be suppressed due to power plant emissions. The traffic signal was more clearly implied by the diurnal profile of (NH4)2SO4 for AS, as seen in Fig. S2. The correlation of [] with [ns-] was very poor for AS, indicating that might be associated with K+ and Na+, similar to B.reg.
Both BC and POA for the AS air mass were less than in the SA air mass. However, compared to BB, BC was slightly higher and POA was comparable. BC was likely of an industrial origin. The POA diurnal profile was similar to the other air masses. Similar to B.reg, the OOA diurnal pattern resembled that of odd oxygen, where the odd-oxygen profile is reported in Tiwari et al. (2015).
Thus, the direct emission sources and the precursors (SOx, NOx, NH3, O3, and Ox) that lead to particulate matter formation strongly impacted the chemical properties of aerosols. The chemical properties of aerosol also impacted the hygroscopicity of aerosols, as is discussed in the following section.
3.4 Impact of chemical composition on the hygroscopicity of air masses
This study provides the first long-term estimation of aerosol hygroscopicity in the PM1 regime. The mean κ was approximately the same for all the air masses, which is ∼0.3 (0.32±0.06 for AS, 0.31±0.06 for BB, and 0.32±0.10 for SA) and in line with the global average value of 0.27±0.21 for continental aerosols (Andreae and Rosenfeld, 2008; Petters and Kreidenweis, 2007; Pöschl et al., 2009; Pringle et al., 2010). Including BC in κ calculations leads to a difference of 10 % in κ on average, shifting the mean κ of 0.32 to 0.29. The BC mass fraction and volume fractions were 10 % and 9 %, respectively. Thus, the change in κ due to the introduction of BC was not significant.
κ varied from 0.13 to 0.77, and there was a difference in the diurnal variation in the hygroscopicity parameter for the various air masses (Fig. 4). A similar finding was observed in China, with a mean κ of 0.3, varying in the range 0.1–0.5 (Rose et al., 2010). Recently, κ of 0.42±0.07 was also reported for PM2.5 for Delhi based on beta attenuation monitor (BAM) measurements of PM2.5 (Wang and Chen, 2019), using an indirect method in the absence of direct measurements. Thus, the dependence of κ on size cannot be underestimated for Delhi and should be dealt with in the future.
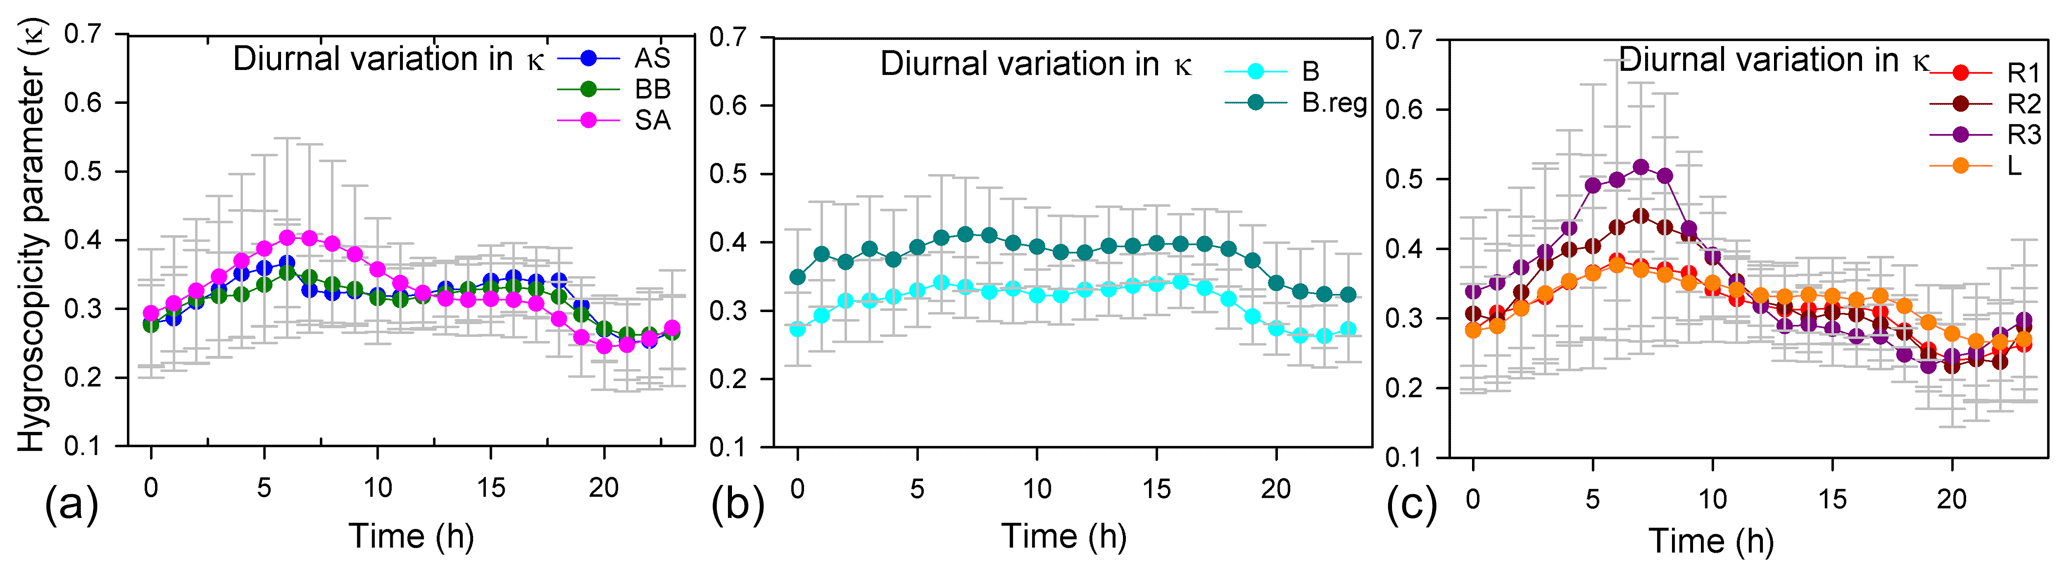
Figure 4Diurnal variation in κ with time. Panel (a) is for AS, BB, and SA; panel (b) is for BB branches (B and B.reg), and panel (c) is for SA branches (L, R1, R2, and R3).
Variation in κ with size has been seen in several places in the world; e.g. at 97 % RH, mass growth factors of 6.95 and 9.78 were reported for the size ranges 0.53–1.6 and 1.6–5.1 µm, respectively, on the Slovenian coast (Turšič et al., 2006). Aitken mode κ was 0.25, while the accumulation mode κ was 0.45 for Beijing (Gunthe et al., 2011). An increase in κ for the higher size regime points to the fact that the organic fraction is higher in the smaller size range, while the inorganic fraction increases substantially with size.
In the PM1 size range, while κ of 0.1 indicates secondary organic aerosol, κ varied from 0.01 to 0.8 for biomass-burning aerosols in lab studies (Petters et al., 2009). κ varied from 0.15 to 0.25, with lower values (around 0.16) being observed during the night, when biomass-burning particles prevailed during wintertime in Athens, Greece (Psichoudaki et al., 2018). Thus, κ values for Delhi can represent both secondary formation and biomass burning. This is true for Delhi, which had both POA and OOA in all the air masses, while BBOA was present in AS and SA air masses, as detailed in the preceding sections on chemical properties.
An important observation for all branches is that when the inorganic volume fraction (of dominant salt) increased (Fig. S2), during the times when κ was high (Fig. 4), or when the organic volume fraction decreased (Fig. S2), a dip in Dc (Fig. 6) was seen, implying that a larger size regime was available for activation. The diurnal variation in κ (Fig. 4) more strongly followed the diurnal pattern of the dominant inorganic salts for a cluster (Fig. S2), since the hygroscopicity parameters for inorganic salts are considerably higher than those of organics. Pearson correlation coefficient (r) values between κ and the salt volume fractions revealed that the diurnal patterns of κ were governed dominantly by volume fractions of (NH4)2SO4 (r: 0.85) for AS, moderately by (NH4)2SO4 (r: 0.55) and NH4NO3 (r: 0.49) for BB, and dominantly by NH4Cl for SA air masses. For the two BB branches, κ of the B branch was governed dominantly by (NH4)2SO4 (r: 0.78) and moderately by (NH4)2SO4 (r: 0.57) and NH4NO3 (r: 0.54) for B.reg. For SA air masses, κ of R1, R2, and R3 was governed dominantly by NH4Cl (r values of 0.71, 0.89, and 0.95) and jointly by NH4Cl (r: 0.65) and NH4NO3 (r: 0.73) for L.
High volume fractions of (NH4)2SO4 and NH4NO3 may be attributed to SOx, NOx, and NH3 emissions due to power plant emissions and traffic. In the SA sub-branches (Fig. 4), the spike in κ during the early morning (07:00–08:00) exhibited the sequence , and the lower spike in late evening (18:00–22:00) exhibited the sequence and is attributed to NH4Cl formation. This implies that during the morning, R3 aerosols were most hygroscopic, while L aerosols were least hygroscopic, while after 09:00, L aerosols were most hygroscopic and R3 aerosols were the least hygroscopic. The flatter curve of κ can be attributed to two factors: (a) the chloride contribution of distant trajectories decreased very steeply with time compared to the local emissions, and (b) κ of L was also supplemented substantially by NH4NO3. Thus, the source activities by which the chemical properties of aerosols are shaped impacted the hygroscopicity parameter tremendously. This consequently impacted the size regime of aerosols available for activation and is discussed in the following section.
3.5 Impact of governing parameters on CCN estimates of air masses
CCN number concentration (NCCN) for SA (22 526 ± 13 439) was higher compared to that in BB (12 526 ± 5626) and AS (11 089 ± 6650), where values (cm−3) are given at 0.4 % SS. Amongst the SA sub-branches, NCCN followed an increasing order, as NCCN(L) (18 810 ± 9434) < NCCN(R3) (20 469 ± 10 580) < NCCN(R2) (23 736 ± 13 739) < NCCN(R1) (24 053 ± 14 743), while for the B branches, the order of increase in NCCN (cm−3) was NCCN(B) (11 699 ± 4900) < NCCN(B.reg) (14 088 ± 6506) at 0.4 % SS. Correspondingly, the activated fractions (af) followed the sequence af(SA) (0.70±0.15) < af(BB) (0.64±0.17) < af(AS) (0.55±0.18), wherein for SA sub-branches, af(R3) (0.65±0.16) < af(R2) (0.694±0.16) < af(L) (0.692±0.13) < af(R1) (0.71±0.15), and for BB, af(B.reg) (0.62±0.16) < af(B) (0.65±0.18) at 0.4 % SS. Mean NCCN and af for all branches at 0.1 %, 0.4 %, and 0.8 % SS are detailed in Tables 3 and 4, respectively. The total number concentrations (NCN in cm−3) followed the sequence NCN(AS) (20 558 ± 9654) < NCN(BB) (20 864 ± 9731) < NCN(SA) (31 406 ± 15 168), and for SA, NCN(L) (27 009 ± 11 651) < NCN(R3) (30 974 ± 12 223) < NCN(R1) (32 772 ± 16 475) < NCN(R2) (33 371 ± 14 989), and NCN(B) (19 025 ± 7704) < NCN(B.reg) (24 333 ± 11 956). Mean NCN values for all branches are listed in Table S2.
Table 3Mean values of CCN number concentrations (cm−3) at 0.1 %, 0.4 %, and 0.8 % SS for all clusters.
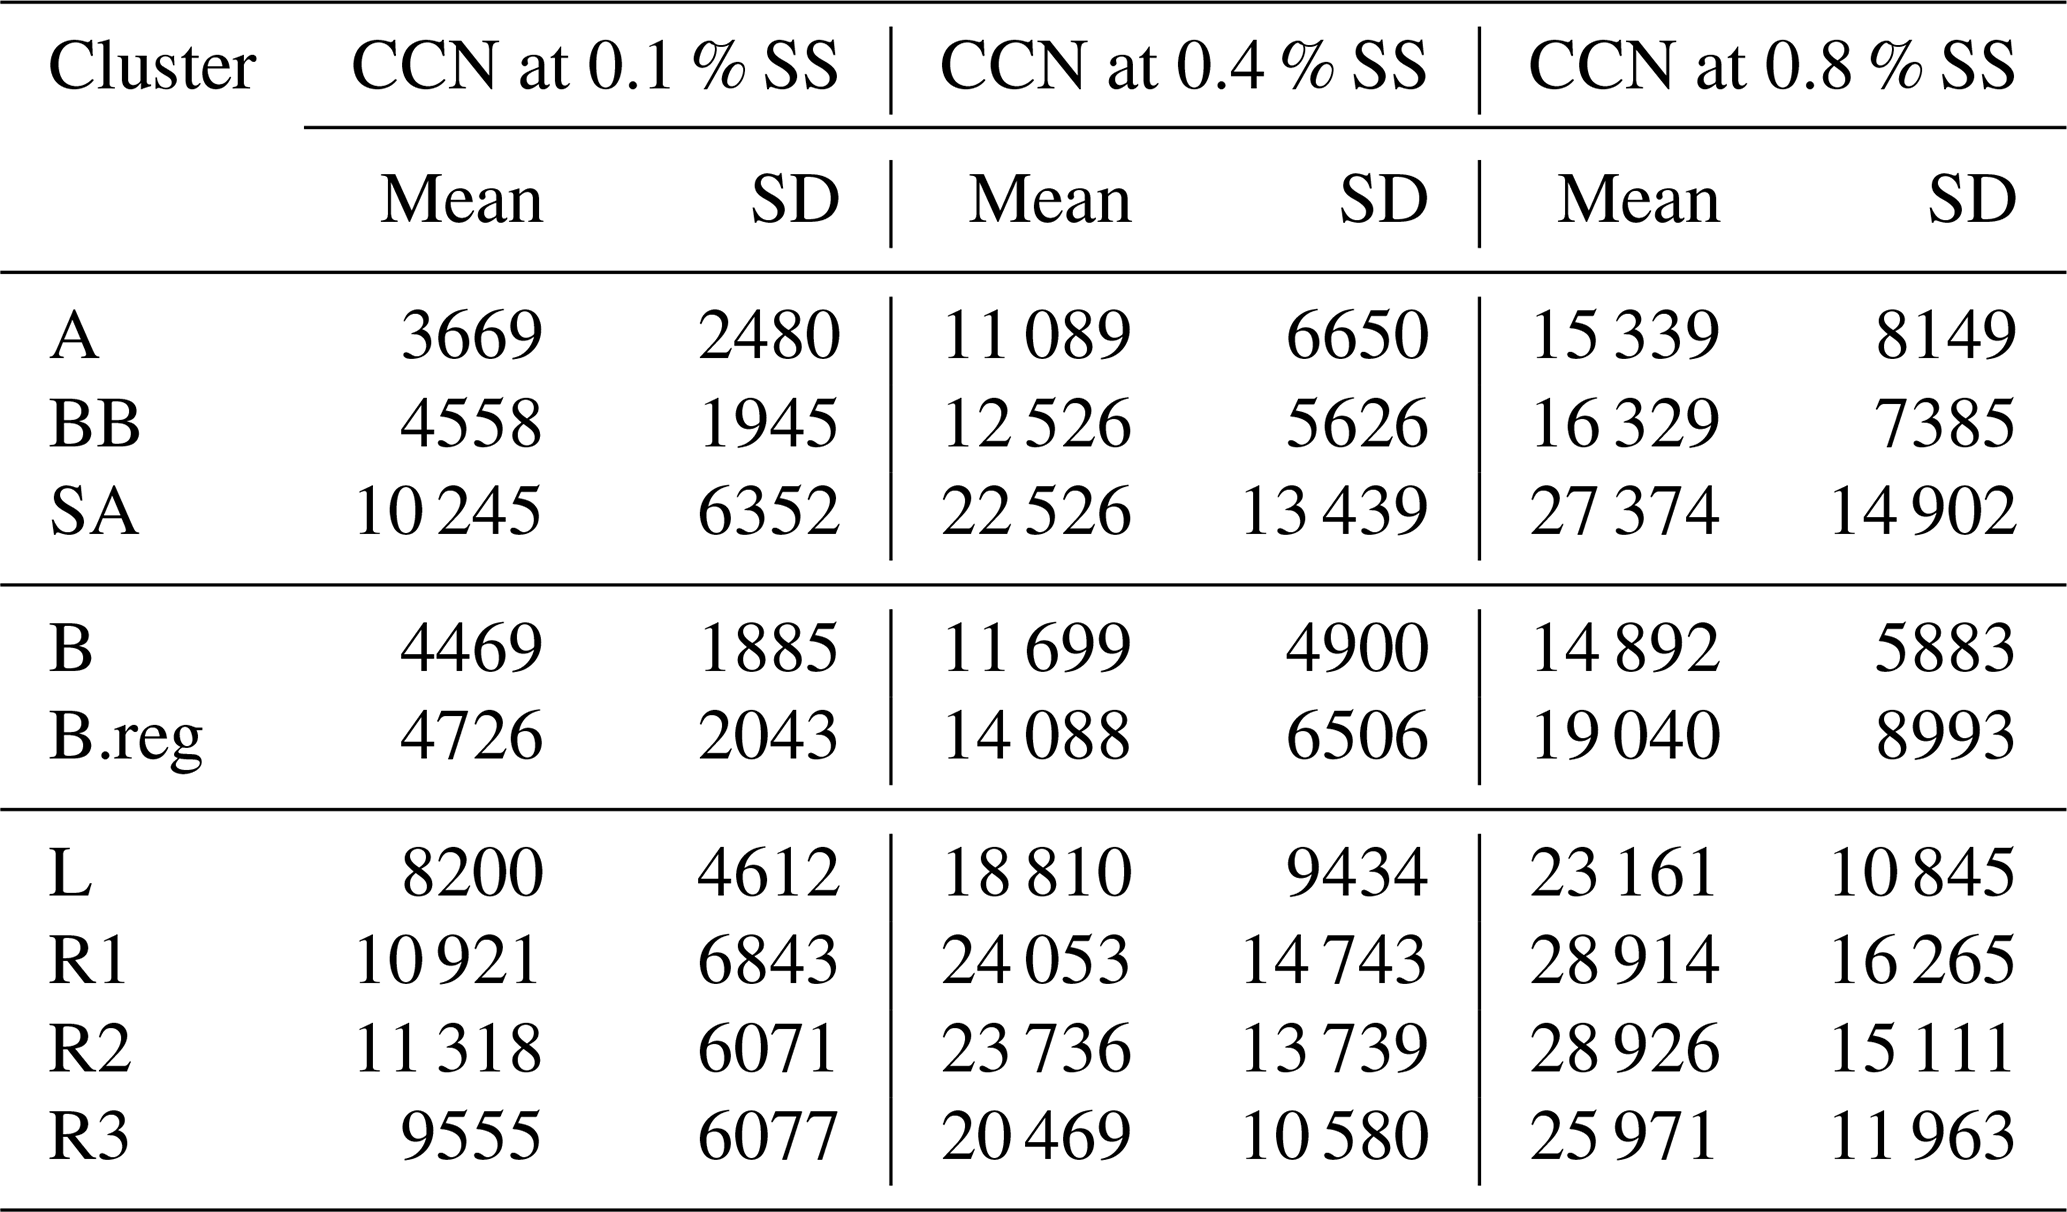
Table 4Mean activated fractions at 0.1 %, 0.4 %, and 0.8 % SS for all clusters.
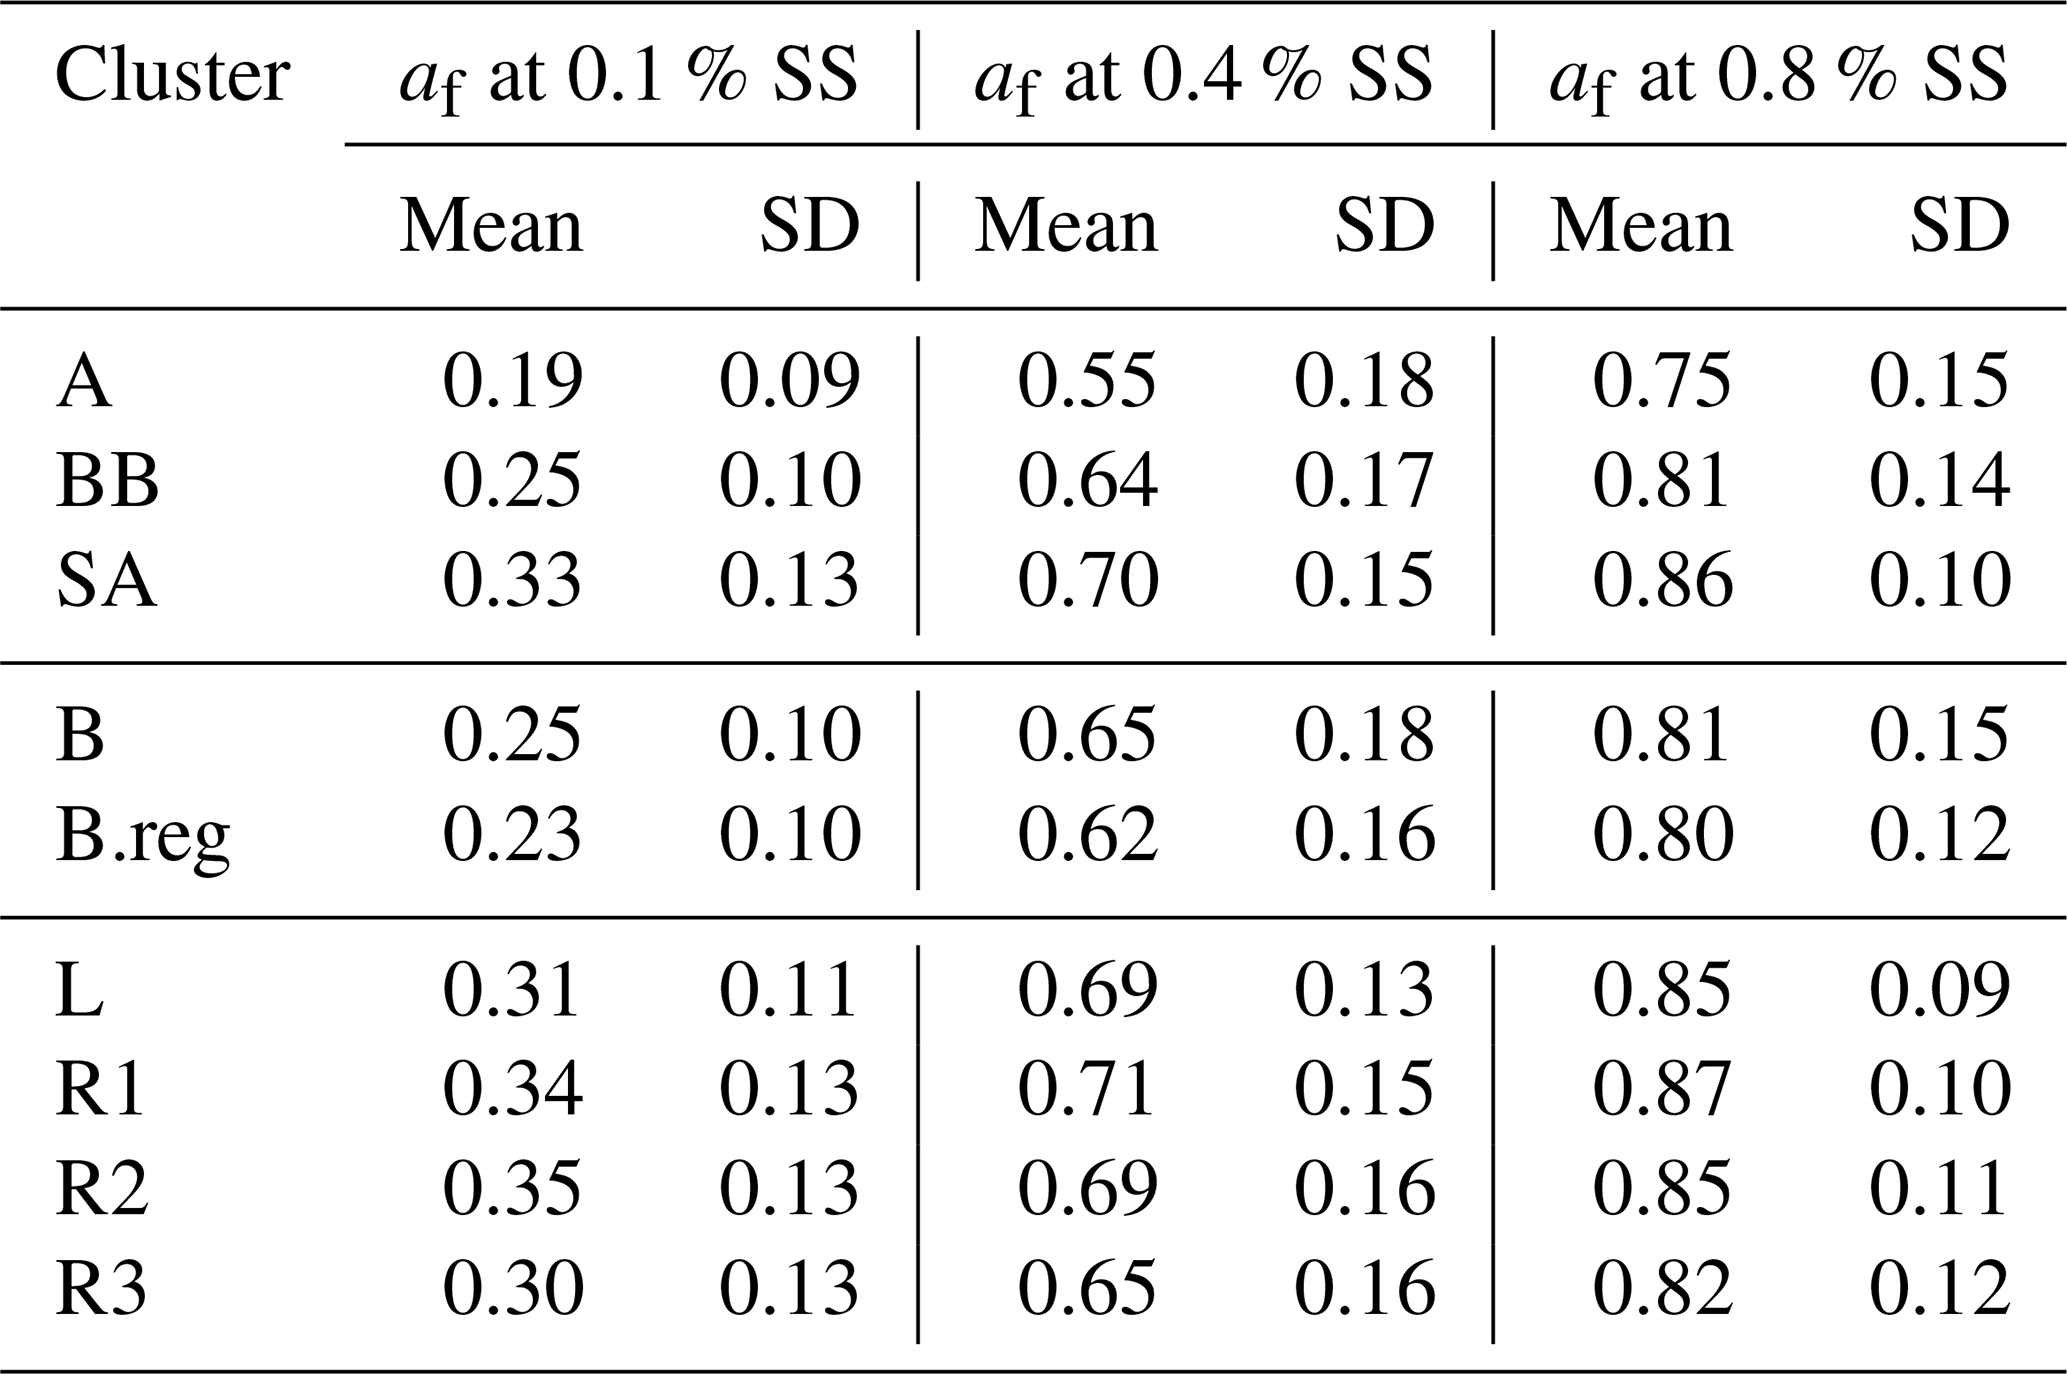
High values of NCCN for Delhi are consistent with other polluted regions in the world. The relevant statistics for two highly polluted sites, namely Beijing and Kanpur, are presented by Gunthe et al. (2011) and Bhattu and Tripathi (2015), respectively. NCCN was 7660±3460 and 900–27 000 (in cm−3) at 0.46 % SS and in the range 0.18 %–0.6 % SS, respectively. The high NCCN is consistent with the high NCN. Correspondingly, NCN was 16 800 ± 9100 and ∼ 50 000 (cm−3). Even though high number concentrations of CCN and condensation nuclei (CN) have been reported, the af was not seen to be so high. The af in Beijing was 0.54±0.23 and 0.66±0.23 at 0.46 % SS and 0.86 % SS, respectively. For Kanpur, af was reported as ∼ 0.018–0.54 for 0.18 %–0.60 % SS. However for Delhi, the af ranged from 0.19 for AS, at 0.1 % SS, to 0.86 for R1, at 0.8 % SS, implying that even at low SS, a considerably large number of particles were activated, and at high SS, almost all particles reached the activated state. It should be noted here that the statistics for Beijing and Kanpur correspond to the range (3–900 nm) and (14.6–680 nm), while the estimates for Delhi are given in the (10–560 nm) range. This finding is also consistent with Wang and Chen (2019), which states that for Delhi, activation of a 0.1 µm particle requires SS %, compared with ∼0.3 % for Beijing; 0.28 %–0.31 % for Asia, Africa, and South America; and ∼0.22 % for Europe and North America. The high activated fractions of aerosol can impact the precipitation patterns in Delhi and may be responsible for the short, intense precipitation events and decrease in overall rainfall. However, no study to date has validated this growing trend with CCN measurements or estimates, and this needs to be investigated in the future.
The af and NCCN for all air masses increased as expected with an increase in supersaturation. The variation in CCN and the activated fraction with SS are shown in Figs. 5 and S3. The figures clearly show that even though NCCN for SA was far greater compared to BB and AS, the activated fractions were fairly close. B.reg had higher NCCN but a close af compared to B. Similarly, L had the lowest NCCN among all SA branches but the highest af. These features elucidate that many factors are at play and impact NCCN and af differently. To determine the governing parameters impacting both NCCN and af, the diurnal patterns of NCCN, af, and Dc at 0.1 %, 0.4 %, and 0.8 % SS; NCN, NAitken, and NAccumulation; κ; and geometric mean diameter (GMD) are shown in Figs. 6, S4, and S5.
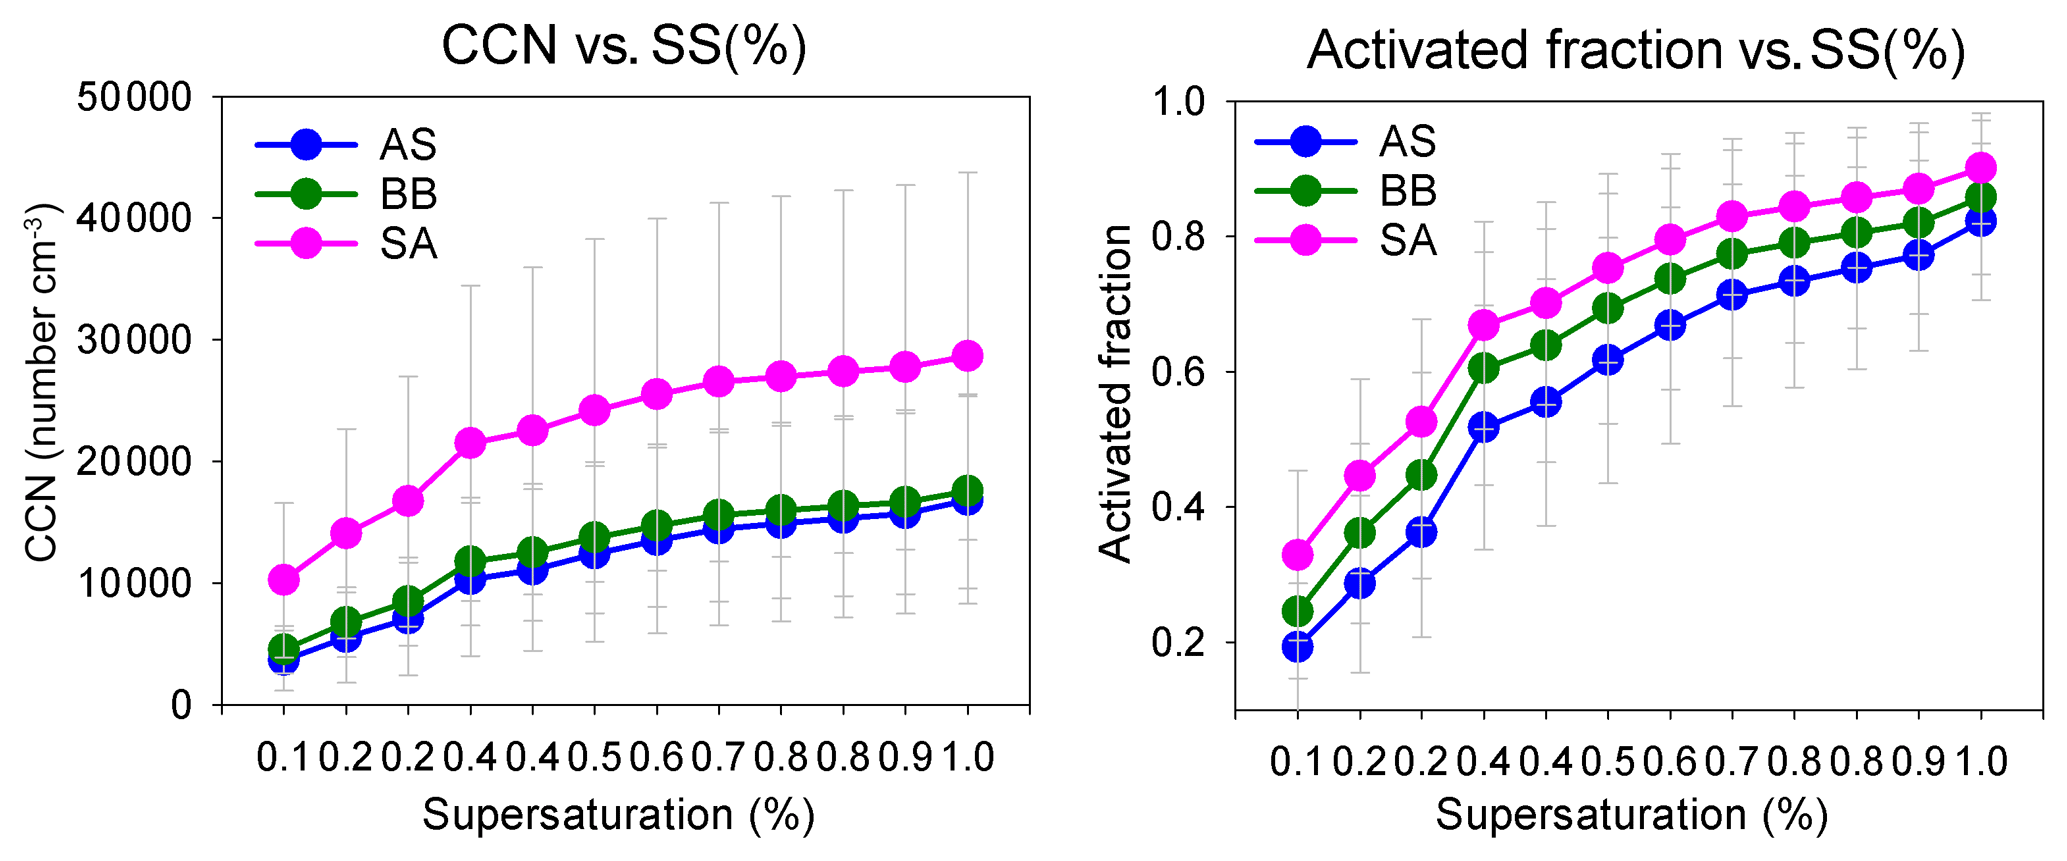
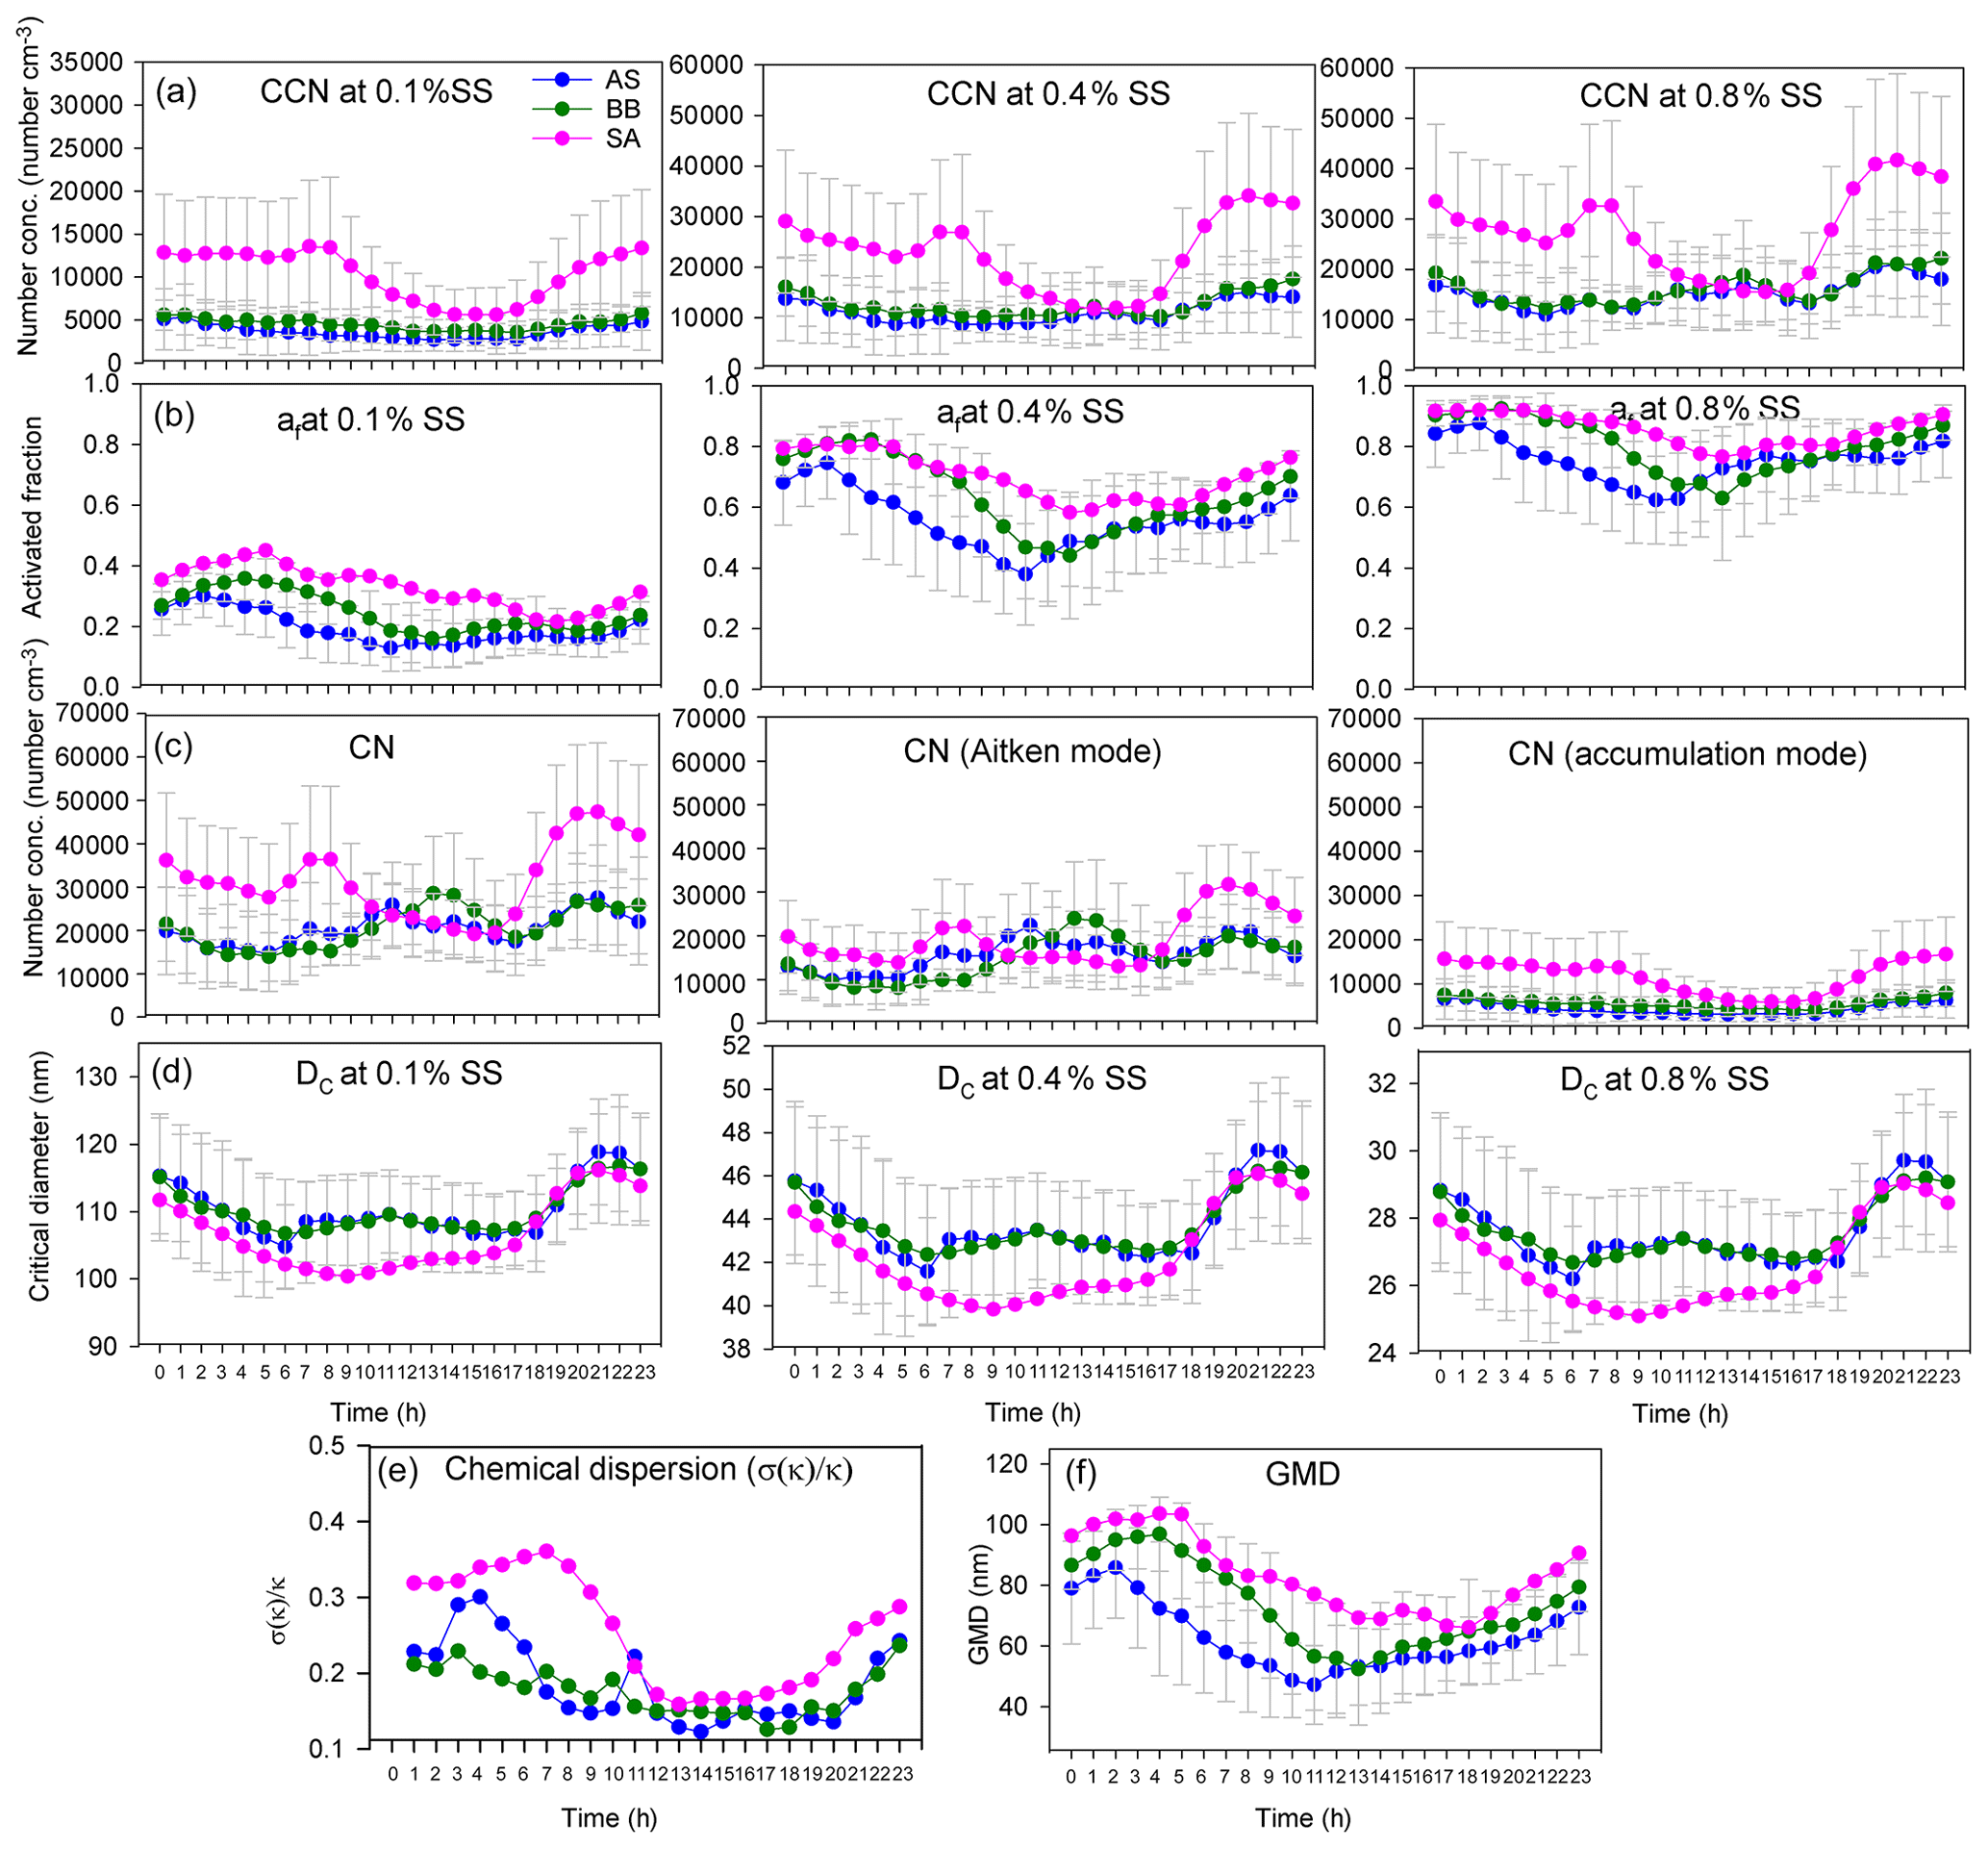
Figure 6Diurnal variation in (a) NCCN at 0.1 %, 0.4 %, and 0.8 % SS; (b) af at 0.1 %, 0.4 %, and 0.8 % SS; (c) NCN, NAitken, and NAccumulation; (d) Dc at 0.1 %, 0.4 %, and 0.8 % SS; (e) chemical dispersion; and (f) GMD for AS, BB, and SA air masses.
The NCCN curve for SA showed a sharp diurnal feature which was not as prominent for the other two. However, at noon, at 0.4 % and 0.8 % SS, while NCCN dipped for SA, it rose for AS and BB (Fig. 6). Furthermore, with the increase in supersaturation, the dip in CCN of SA increased such that (a) at 0.1 % SS, SACCN>ASCCN, BBCCN; (b) at 0.4 % SS, SACCN≅ASCCN, BBCCN; and (c) at 0.8 % SS, SACCN<BBCCN and ≅ASCCN. The explanation for this observation is that at 0.1 % SS, the CCN was governed by the accumulation mode, but at 0.4 % and 0.8 % SS, it was governed more by the Aitken mode. It is the Aitken mode that dominantly governs the total number concentration, and hence it can be said that CCN is governed by CN at a higher SS and by the accumulation mode at low SS. This is because as supersaturation increases, Dc increases. At low SS, Dc is high (Dc>100 nm), almost always at a 0.1 % SS, for all branches, as shown in Fig. 6d; hence the size distribution that is integrated to get the CCN involves the accumulation mode only. At 0.4 % SS, the Dc was around 40–47 nm; therefore a considerable fraction of the Aitken mode and accumulation mode was available for activation. At 0.8 % SS, the Dc was ∼ 25–30 nm; therefore, the contribution of the Aitken mode further increases and the accumulation mode is also available as usual. These findings are also true for BB branches (B and B.reg) and SA branches (L, R1, R2, and R3), as shown in Fig. S4. It is the low value of Dc relative to other places that is responsible for high CCN. As explained in Sect. 3.4, Dc is largely associated with κ. The Dc at other places such as Kanpur varied from 50 to 200 nm, for SS ranging from 0.18 to 0.60 (Bhattu and Tripathi, 2015), compared to which Dc for Delhi is lower (17–142 nm, for SS ranging from 0.1 % to 0.8 %), implying that a larger regime is available for activation. It is pertinent to mention here that the dip in CCN for SA at midday and the peak at the same time for AS and BB can be attributed to the following. (a) The dip in NAccumulation for SA at midday was much more prominent compared to AS and BB. (b) At midday, the NAitken for SA also decreased, while it increased for AS and BB. Thus, the dip in NCCN was strengthened by the simultaneous dip of both the Aitken and accumulation modes, while the peak in NCCN for AS and BB was a manifestation of the dominant peak in Aitken modes. Similar features were also exhibited for sub-branches of BB and SA. A deeper insight reveals that the dip in number concentration at midday for SA was most aptly seen in the diurnal pattern of POA (which is the most dominant NRPM1 species) and, to quite a good extent, in other NRPM1 species barring the ion. Similarly, the peak in the Aitken mode for AS and BB can be attributed to , , and OOA concentrations (the dominating species in the respective branches). Thus, the source activities and trajectory pathways impact CCN concentration at the receptor site.
The diurnal pattern for af showed a dip in the midday hours for all the air masses even though NCCN at midday for AS and BB peaked during midday hours. The time of dip in af (more prominent at 0.4 % and 0.8 % SS) occurred earlier for AS compared to that for BB and SA (Fig. 6). This was governed by the time of dip in the GMD of the three branches. The GMD diurnal variation was very similar to af, and the r2 values between GMD and af listed in Table S3 also point to the same result. Thus, even though a dip in Dc should correspond with an increase in af and vice versa, this does not usually happen, as the change in Dc is less compared to the shift in size distribution such that not only the highest number concentration values but also the diameter at which this occurs change, thereby changing the number available for activation. For example, in Fig. 7 two different size distributions for the AS air mass at 02:00 and 11:00 are compared. At 02:00 and 11:00, the following characteristics were noted: (a) GMD02:00: 83.78±16.58 nm (GSD – geometric standard deviation), which is considerably higher than GMD11:00: 47.18±13.01 nm; (b) GSD02:00: 1.69±0.13 nm, which is nearly the same as GSD11:00: 1.62±0.14 nm; (c) Dc02:00: 44.45±3.83 nm, which is slightly higher than Dc11:00: 43.48±2.28 nm (at 0.4 % SS); (d) CN02:00: 15 849 ± 9269 cm−3, which is lower than CN11:00: 25 873 ± 9840 cm−3; (e) CN_Aitken02:00: 9819±5945 cm−3, which is lower than CN_Aitken11:00: 22 376 ± 9693 cm−3; (f) CN_Accumulation02:00: 5729±3684 cm−3, which is higher than CN_Accumulation11:00: 3311±1569 cm−3; (g) af02:00: 0.75±0.12, which is considerably higher than af11:00: 0.38±0.17 at 0.4 % SS; and (h) CCN02:00: 11 595 ± 6710 cm−3, which is higher than CCN11:00: 8946±3899 cm−3 at 0.4 % SS. The af at 02:00 is higher than that at 11:00. A Dc decrease should correspond to a CCN increase, but the magnitude of ΔDc=0.97 nm is very small. The decrease in GMD (ΔGMD=36.6 nm), on the other hand, is very high, with negligible changes in GSD. At 02:00, since Dc was considerably less than GSD, most of the particles are counted for activation. At 11:00, since Dc and GMD were very close, nearly 50 % of particles are not available for activation. The very high Aitken mode concentration at 11:00 (higher than that at 02:00) was not available for activation at both the times. Thus, NCCN here is governed by the accumulation mode, which was higher at 02:00, thus making NCCN higher. In this scenario, NCCN and af go hand in hand. However, there also exists a second possibility; e.g. for the SA branch, NCCN, at 0.4 % SS, at 08:00 is higher than that at 05:00, while the af at 08:00 is lower than that at 05:00 (Fig. 6). NCCN was governed at these times by the Aitken mode, which was higher at 08:00, while af is governed by the GMD, which was lower at 08:00. Therefore, it is established that CCN is governed by CN (dominantly by either the Aitken or accumulation mode as the case may be), while the af is governed by GMD.

Figure 7Comparison of two size distribution profiles at different times of day for AS branch at 02:00 and 11:00.
At this junction, it is also pertinent to mention how chemical dispersion and parameters governing CCN are interconnected. The standard deviation of κ (σ(κ)) around κ is often used as an estimate of the degree of heterogeneity (chemical dispersion) of particles (Psichoudaki et al., 2018; Lance et al., 2013). The chemical dispersion for all air masses and their sub-branches is shown in Figs. 6, S4, and S5. The chemical dispersion for the SA air mass during the early hours (06:00–08:00) coincided with chloride emissions, and late at night, after 20:00, it coincided with POA and OOA emissions. During the time of high chloride emissions, κ also peaked, since inorganics are associated with high hygroscopicity, while during the late hours, κ dropped due to an increase in organics associated with low hygroscopicity. The diurnal patterns of the activated fraction, GMD, and chemical dispersion were also similar. This implies that higher heterogeneity shifts GMD towards a high value, thereby increasing the available regime for activation, and vice versa. There was no discernible pattern noted for the other air masses.
It is hereby established that aerosol physical and chemical properties, and their time evolution, are tightly linked with each other. The indirect impact of chemical composition on CCN and af is manifested in two ways: (a) NRPM1 species impact the diurnal patterns of Aitken and accumulation modes, which in turn impact CCN, and (b) NRPM1 species impact κ, hence subsequently CCN, by impacting the size regime available for activation.
Long-term measurements of NRPM1 species and size distribution data were carried out in New Delhi. The air masses originated from SA (L, R1, R2, and R3), BB (B and B.reg), and AS. κ was estimated using the mixing rule, and the bulk κ was assumed for the entire size distribution. Using κ and size distribution data, CCN estimates were obtained. The SA air mass was the most contaminated air mass, followed by BB and then AS. This resulted in higher NRPM1, NCN (both Aitken and accumulation modes), NCCN, and af for SA, followed by those in BB and then those in AS. The most dominant salts turned out to be (NH4)2SO4 for AS, (NH4)2SO4 and NH4NO3 for BB, and NH4Cl for SA. The AS, B, and L branches were completely neutralized, while B.reg, R1, R2, and R3 were partially neutralized. The diurnal variations in NRPM1 species were governed by source activities' aerosol precursors, like SOx, NOx, NH3, O3, and Ox. The high PM1 concentration for Delhi, which exceeds the National Ambient Air Quality Standards, can be mitigated only by controlling both the primary emissions and precursors. To address the situation justly, the following is lacking: (a) data listing measurements of PM1 emissions from various industries in India and Asia, (b) a description of the chemical constituents of aerosol that are emitted, both qualitatively and quantitatively, and (c) a definition of emission limits and compliance with them.
The mean κ∼0.3 was the same for all air masses, with the diurnal variation in κ governed by chemical species and, thus, source activities. The κ diurnal trends impacted the Dc diurnal trend, which in turn affected the available regime for activation. The NCCN diurnal patterns were driven by the accumulation mode at a lower SS and Aitken mode with an increase in SS, depending upon Dc, which decreases with an increase in SS. The Dc obtained for Delhi was lower than that seen at other places in the IGP, for example, Kanpur. The activated fraction for Delhi was very high (0.71±0.15 at 0.4 % SS for R1), with the means of activated fractions varying between 0.19 and 0.87, for SS varying from 0.1 % to 0.8 %, whereby their diurnal patterns were governed by GMD. A CCN measurement study with a CCN counter in the future can help verify the estimates, and a closure ratio may be determined. However, in the absence of long-term cloud condensation nuclei counter (CCNC) measurements, the importance of these findings cannot be neglected. These results can serve as valuable inputs to GCMs to better quantify precipitation. The high NRPM1 loading and activated fractions are bound to significantly impact precipitation over Delhi, impact the aerosol radiation budget, and have indirect effects and need to be investigated thoroughly in the future. These investigations may answer the short intense precipitation events occurring over Delhi and the decrease in the overall rainfall over the past half-century.
All data pertaining to this study can be downloaded from http://web.iitd.ac.in/~gazala/rawdata_arubetal2020.xlsx (Arub et al., 2020).
The supplement related to this article is available online at: https://doi.org/10.5194/acp-20-6953-2020-supplement.
LHR, JSP, GH, and ZA designed the study. ZA, SG, and SB carried out the data collection. ZA carried out data processing and analysis. ZA and GH carried out the interpretation of the results. ZA wrote the paper and was assisted by SB, LHR, and GH in reviewing the paper.
The authors declare that they have no conflict of interest.
We are thankful to the Indian Institute of Technology Delhi (IITD) for institutional support. We are grateful to all students and staff members of the Aerosol Research and Characterization Laboratory at IITD for their constant support. We are thankful to Philip Croteau (Aerodyne Research) for always providing timely technical support for the ACSM.
This paper was edited by Veli-Matti Kerminen and reviewed by two anonymous referees.
Andreae, M. O. and Rosenfeld, D.: Aerosol–cloud–precipitation interactions. Part 1. The nature and sources of cloud-active aerosols, Earth-Sci. Rev., 89, 13–41, https://doi.org/10.1016/j.earscirev.2008.03.001, 2008.
Arub, Z., Bhandari, S., Gani, S., Apte, J. S., Hildebrandt Ruiz, L., and Habib, G.: rawdata_arubetal2020.xlsx, available at: http://web.iitd.ac.in/~gazala/rawdata_arubetal2020.xlsx, last access: 6 June 2020.
Asa-Awuku, A., Moore, R. H., Nenes, A., Bahreini, R., Holloway, J. S., Brock, C. A., Middlebrook, A. M., Ryerson, T. B., Jimenez, J. L., Decarlo, P. F., Hecobian, A., Weber, R. J., Stickel, R., Tanner, D. J., and Huey, L. G.: Airborne cloud condensation nuclei measurements during the 2006 Texas Air Quality Study, J. Geophys. Res.-Atmos., 116, 1–18, https://doi.org/10.1029/2010JD014874, 2011.
Atkinson, R., Baulch, D. L., Cox, R. A., Crowley, J. N., Hampson, R. F., Hynes, R. G., Jenkin, M. E., Rossi, M. J., Troe, J., and IUPAC Subcommittee: Evaluated kinetic and photochemical data for atmospheric chemistry: Volume II – gas phase reactions of organic species, Atmos. Chem. Phys., 6, 3625–4055, https://doi.org/10.5194/acp-6-3625-2006, 2006.
Bhandari, S., Gani, S., Patel, K., Wang, D. S., Soni, P., Arub, Z., Habib, G., Apte, J. S., and Hildebrandt Ruiz, L.: Sources and atmospheric dynamics of organic aerosol in New Delhi, India: insights from receptor modeling, Atmos. Chem. Phys., 20, 735–752, https://doi.org/10.5194/acp-20-735-2020, 2020.
Bhattu, D. and Tripathi, S. N.: Inter-seasonal variability in size-resolved CCN properties at Kanpur, India, Atmos. Environ., 85, 161–168, https://doi.org/10.1016/j.atmosenv.2013.12.016, 2014.
Bhattu, D. and Tripathi, S. N.: CCN closure study: Effects of aerosol chemical composition and mixing state, J. Geophys Res.-Atmos., 120, 766–783, https://doi.org/10.1002/2014JD021978, 2015.
Bi, X., Zhang, G., Li, L., Wang, X., Li, M., Sheng, G., Fu, J., and Zhou, Z.: Mixing state of biomass burning particles by single particle aerosol mass spectrometer in the urban area of PRD, China, Atmos. Environ., 45, 3447–3453, https://doi.org/10.1016/j.atmosenv.2011.03.034, 2011.
Boucher, O., Randall, D., Artaxo, P., Bretherton, C., Feingold, G., Forster, P., Kerminen, V.-M., Kondo, Y., Liao, H., Lohmann, U., Rasch, P., Satheesh, S. K., Sherwood, S., Stevens, B., and Zhang, X. Y.: Clouds and Aerosols, in: Climate Change 2013: The Physical Science Basis. Contribution of Working Group I to the Fifth Assessment Report of the Intergovernmental Panel on Climate Change, edited by: Stocker, T. F., Qin, D., Plattner, G.-K., Tignor, M., Allen, S. K., Boschung, J., Nauels, A., Xia, Y., Bex, V., and Midgley, P. M., Cambridge University Press, Cambridge, UK and New York, NY, USA, 2013.
Bougiatioti, A., Fountoukis, C., Kalivitis, N., Pandis, S. N., Nenes, A., and Mihalopoulos, N.: Cloud condensation nuclei measurements in the marine boundary layer of the Eastern Mediterranean: CCN closure and droplet growth kinetics, Atmos. Chem. Phys., 9, 7053–7066, https://doi.org/10.5194/acp-9-7053-2009, 2009.
Bougiatioti, A., Nenes, A., Fountoukis, C., Kalivitis, N., Pandis, S. N., and Mihalopoulos, N.: Size-resolved CCN distributions and activation kinetics of aged continental and marine aerosol, Atmos. Chem. Phys., 11, 8791–8808, https://doi.org/10.5194/acp-11-8791-2011, 2011.
Braga, R. C., Rosenfeld, D., Weigel, R., Jurkat, T., Andreae, M. O., Wendisch, M., Pöschl, U., Voigt, C., Mahnke, C., Borrmann, S., Albrecht, R. I., Molleker, S., Vila, D. A., Machado, L. A. T., and Grulich, L.: Further evidence for CCN aerosol concentrations determining the height of warm rain and ice initiation in convective clouds over the Amazon basin, Atmos. Chem. Phys., 17, 14433–14456, https://doi.org/10.5194/acp-17-14433-2017, 2017.
Brock, C. A., Wagner, N. L., Anderson, B. E., Beyersdorf, A., Campuzano-Jost, P., Day, D. A., Diskin, G. S., Gordon, T. D., Jimenez, J. L., Lack, D. A., Liao, J., Markovic, M. Z., Middlebrook, A. M., Perring, A. E., Richardson, M. S., Schwarz, J. P., Welti, A., Ziemba, L. D., and Murphy, D. M.: Aerosol optical properties in the southeastern United States in summer – Part 2: Sensitivity of aerosol optical depth to relative humidity and aerosol parameters, Atmos. Chem. Phys., 16, 5009–5019, https://doi.org/10.5194/acp-16-5009-2016, 2016.
Chakraborty, A., Bhattu, D., Gupta, T., Tripathi, S. N., and Canagaratna, M. R.: Real-time measurements of ambient aerosols in a polluted Indian city: Sources, characteristics, and processing of organic aerosols during foggy and nonfoggy periods, J. Geophys. Res.-Atmos., 120, 9006–9019, https://doi.org/10.1002/2015JD023419, 2015.
Chakraborty, A., Gupta, T., and Tripathi, S. N.: Chemical composition and characteristics of ambient aerosols and rainwater residues during Indian summer monsoon: Insight from aerosol mass spectrometry, Atmos. Environ., 136, 144–155, https://doi.org/10.1016/j.atmosenv.2016.04.024, 2016.
Chen, Y., Wild, O., Wang, Y., Ran, L., Teich, M., Größ, J., Wang, L., Spindler, G., Herrmann, H., van Pinxteren, D., McFiggans, G., and Wiedensohler, A.: The influence of impactor size cut-off shift caused by hygroscopic growth on particulate matter loading and composition measurements, Atmos. Environ., 195, 141–148, https://doi.org/10.1016/j.atmosenv.2018.09.049, 2018.
Cheney, J. L., Conner, W. D., Bennett, R. L., Duke, D. L., and Walters, C. L.: Formation of a detached plume from a cement plant, NTIS, Springfield, VA, USA, 1983.
Derwent, R. G., Ryall, D. B., Jennings, S. G., Spain, T. G., and Simmonds, P. G.: Black carbon aerosol and carbon monoxide in European regionally polluted air masses at Mace Head, Ireland during 1995–1998, Atmos. Environ., 35, 6371–6378, https://doi.org/10.1016/S1352-2310(01)00394-6, 2001.
Draxler, R. R. and Rolph, G. D.: HYSPLIT (HYbrid Single-Particle Lagrangian Integrated Trajectory) model access via NOAA ARL READY website, NOAA Air Resources Laboratory, Silver Spring, MD, 25, available at: http://ready.arl.noaa.gov/HYSPLIT.php (last access: 18 May 2020), 2003.
Du, H. H., Kong, L. D., Cheng, T., Chen, J., Yang, X., Zhang, R., Han, Z., Yan, Z., and Ma, Y.: Insights into ammonium particle-to-gas conversion: non-sulfate ammonium coupling with nitrate and chloride, Aerosol Air Qual. Res., 10, 589–595, https://doi.org/10.4209/aaqr.2010.04.0034, 2010.
Dusek, U., Frank, G. P., Curtius, J., Drewnick, F., Schneider, J., Kürten, A., Rose, D., Andreae, M. O., Borrmann, S., and Pöschl, U.: Enhanced organic mass fraction and decreased hygroscopicity of cloud condensation nuclei (CCN) during new particle formation events, Geophys. Res. Lett., 37, https://doi.org/10.1029/2009GL040930, 2010.
Engelhart, G. J., Hennigan, C. J., Miracolo, M. A., Robinson, A. L., and Pandis, S. N.: Cloud condensation nuclei activity of fresh primary and aged biomass burning aerosol, Atmos. Chem. Phys., 12, 7285–7293, https://doi.org/10.5194/acp-12-7285-2012, 2012.
Erickson, R. E., Yates, L. M., Clark, R. L., and McEwen, D.: The reaction of sulfur dioxide with ozone in water and its possible atmospheric significance, Atmos. Environ., 11, 813–817, https://doi.org/10.1016/0004-6981(77)90043-9, 1977.
Ervens, B., Turpin, B. J., and Weber, R. J.: Secondary organic aerosol formation in cloud droplets and aqueous particles (aqSOA): a review of laboratory, field and model studies, Atmos. Chem. Phys., 11, 11069–11102, https://doi.org/10.5194/acp-11-11069-2011, 2011.
Esri, Garmin International: World Countries (Generalized), available at: https://www.arcgis.com/home/item.html?id=170b5e6529064b8d9275168687880359 (last access: 17 May 2020), 2010.
Fuzzi, S., Decesari, S., Facchini, M. C., Cavalli, F., Emblico, L., Mircea, M., Andreae, M. O., Trebs, I., Hoffer, A., Guyon, P., Artaxo, P., Rizzo, L. V., Lara, L. L., Pauliquevis, T., Maenhaut, W., Raes, N., Chi, X., Mayol-Bracero, O. L., Soto-García, L. L., Claeys, M., Kourtchev, I., Rissler, J., Swietlicki, E., Tagliavini, E., Schkolnik, G., Falkovich, A. H., Rudich, Y., Fisch, G., and Gatti, L. V.: Overview of the inorganic and organic composition of size-segregated aerosol in Rondonia, Brazil, from the biomass-burning period to the onset of the wet season, J. Geophys. Res.-Atmos., 112, https://doi.org/10.1029/2005JD006741, 2007.
Gandhi, H. S. and Shelef, M.: Effects of sulphur on noble metal automotive catalysts, Appl. Catal., 77, 175–186, https://doi.org/10.1016/0166-9834(91)80063-3, 1991.
Gani, S., Bhandari, S., Seraj, S., Wang, D. S., Patel, K., Soni, P., Arub, Z., Habib, G., Hildebrandt Ruiz, L., and Apte, J. S.: Submicron aerosol composition in the world's most polluted megacity: the Delhi Aerosol Supersite study, Atmos. Chem. Phys., 19, 6843–6859, https://doi.org/10.5194/acp-19-6843-2019, 2019.
Gaur, A., Tripathi, S. N., Kanawade, V. P., Tare, V., and Shukla, S. P.: Four-year measurements of trace gases (SO2, NOx, CO, and O3) at an urban location, Kanpur, in Northern India, J. Atmos. Chem., 71, 283–301, https://doi.org/10.1007/s10874-014-9295-8, 2014.
Guhathakurta, P., Rajeevan, M., Sikka, D. R., and Tyagi, A.: Observed changes in southwest monsoon rainfall over India during 1901–2011, Int. J. Climatol., 35, 1881–1898, https://doi.org/10.1002/joc.4095, 2015.
Gunn, R. and Phillips, B. B.: An experimental investigation of the effect of air pollution on the initiation of rain, J. Meteorol., 14, 272–280, https://doi.org/10.1175/1520-0469(1957)014<0272:AEIOTE>2.0.CO;2, 1957.
Gunthe, S. S., King, S. M., Rose, D., Chen, Q., Roldin, P., Farmer, D. K., Jimenez, J. L., Artaxo, P., Andreae, M. O., Martin, S. T., and Pöschl, U.: Cloud condensation nuclei in pristine tropical rainforest air of Amazonia: size-resolved measurements and modeling of atmospheric aerosol composition and CCN activity, Atmos. Chem. Phys., 9, 7551–7575, https://doi.org/10.5194/acp-9-7551-2009, 2009.
Gunthe, S. S., Rose, D., Su, H., Garland, R. M., Achtert, P., Nowak, A., Wiedensohler, A., Kuwata, M., Takegawa, N., Kondo, Y., Hu, M., Shao, M., Zhu, T., Andreae, M. O., and Pöschl, U.: Cloud condensation nuclei (CCN) from fresh and aged air pollution in the megacity region of Beijing, Atmos. Chem. Phys., 11, 11023–11039, https://doi.org/10.5194/acp-11-11023-2011, 2011.
Habib, G., Venkataraman, C., Chiapello, I., Ramachandran, S., Boucher, O., and Reddy, M. S.: Seasonal and interannual variability in absorbing aerosols over India derived from TOMS: Relationship to regional meteorology and emissions, Atmos. Environ., 40, 1909–1921, https://doi.org/10.1016/j.atmosenv.2005.07.077, 2006.
Harrison, R. M. and Pio, C. A.: Major ion composition and chemical associations of inorganic atmospheric aerosols, Environ. Sci. Technol., 17, 169–174, https://doi.org/10.1021/es00109a009, 1983.
Haynes, W. M., Lide, D. R., and Bruno, T. J. (Eds.): CRC Handbook of Chemistry and Physics, 95th Edn., CRC press, Florida, USA, 2014.
Ho, K. F., Lee, S. C., Guo, H., and Tsai, W. Y.: Seasonal and diurnal variations of volatile organic compounds (VOCs) in the atmosphere of Hong Kong, Sci. Total Environ., 322, 155–166, https://doi.org/10.1016/j.scitotenv.2003.10.004, 2004.
Hong, J., Häkkinen, S. A. K., Paramonov, M., Äijälä, M., Hakala, J., Nieminen, T., Mikkilä, J., Prisle, N. L., Kulmala, M., Riipinen, I., Bilde, M., Kerminen, V.-M., and Petäjä, T.: Hygroscopicity, CCN and volatility properties of submicron atmospheric aerosol in a boreal forest environment during the summer of 2010, Atmos. Chem. Phys., 14, 4733–4748, https://doi.org/10.5194/acp-14-4733-2014, 2014.
Jaiprakash, Singhai, A., Habib, G., Raman, R. S., and Gupta, T.: Chemical characterization of PM1.0 aerosol in Delhi and source apportionment using positive matrix factorization, Environ. Sci. Pollut. R., 24, 445–462, https://doi.org/10.1007/s11356-016-7708-8, 2017.
Kalapureddy, M. C. R., Kaskaoutis, D. G., Ernest Raj, P., Devara, P. C. S., Kambezidis, H. D., Kosmopoulos, P. G., and Nastos, P. T.: Identification of aerosol type over the Arabian Sea in the premonsoon season during the Integrated Campaign for Aerosols, Gases and Radiation Budget (ICARB), J. Geophys. Res.-Atmos., 114, D17203, https://doi.org/10.1029/2009JD011826, 2009.
Kaneyasu, N., Yoshikado, H., Mizuno, T., Sakamoto, K., and Soufuku, M.: Chemical forms and sources of extremely high nitrate and chloride in winter aerosol pollution in the Kanto Plain of Japan, Atmos. Environ., 33, 1745–1756, https://doi.org/10.1016/S1352-2310(98)00396-3, 1999.
Lance, S., Raatikainen, T., Onasch, T. B., Worsnop, D. R., Yu, X.-Y., Alexander, M. L., Stolzenburg, M. R., McMurry, P. H., Smith, J. N., and Nenes, A.: Aerosol mixing state, hygroscopic growth and cloud activation efficiency during MIRAGE 2006, Atmos. Chem. Phys., 13, 5049–5062, https://doi.org/10.5194/acp-13-5049-2013, 2013.
Lee, S. Y., Gan, C., and Chew, B. N.: Visibility deterioration and hygroscopic growth of biomass burning aerosols over a tropical coastal city: a case study over Singapore's airport, Atmos. Sci. Lett., 17, 624–629, https://doi.org/10.1002/asl.712, 2016.
Leena, P. P., Pandithurai, G., Anilkumar, V., Murugavel, P., Sonbawne, S. M., and Dani, K. K.: Seasonal variability in aerosol, CCN and their relationship observed at a high altitude site in Western Ghats, Meteorol. Atmos. Phys., 128, 143–153, https://doi.org/10.1007/s00703-015-0406-0, 2016.
Leng, C., Zhang, Q., Zhang, D., Xu, C., Cheng, T., Zhang, R., Tao, J., Chen, J., Zha, S., Zhang, Y., Li, X., Kong, L., and Gao, W.: Variations of cloud condensation nuclei (CCN) and aerosol activity during fog–haze episode: a case study from Shanghai, Atmos. Chem. Phys., 14, 12499–12512, https://doi.org/10.5194/acp-14-12499-2014, 2014.
Liu, X., Zhang, Y., Cheng, Y., Hu, M., and Han, T.: Aerosol hygroscopicity and its impact on atmospheric visibility and radiative forcing in Guangzhou during the 2006 PRIDE-PRD campaign, Atmos. Environ., 60, 59–67, https://doi.org/10.1016/j.atmosenv.2012.06.016, 2012.
Moorthy, K. K., Satheesh, S. K., Babu, S. S., and Dutt, C. B. S.: Integrated campaign for aerosols, gases and radiation budget (ICARB): an overview, J. Earth Syst. Sci., 117, 243–262, https://doi.org/10.1007/s12040-008-0029-7, 2008.
Nair, V. S., Moorthy, K. K., Babu, S. S., Narasimhulu, K., Reddy, L. S. S., Reddy, R. R., Gopal, K. R., Sreekanth, V., Madhavan, B. L., and Niranjan, K.: Size segregated aerosol mass concentration measurements over the Arabian Sea during ICARB, J. Earth Syst. Sci., 117, 315–323, https://doi.org/10.1007/s12040-008-0034-x, 2008a.
Nair, V. S., Babu, S. S., and Moorthy, K. K.: Aerosol characteristics in the marine atmospheric boundary layer over the Bay of Bengal and Arabian Sea during ICARB: Spatial distribution and latitudinal and longitudinal gradients, J. Geophys. Res.-Atmos., 113, D15208, https://doi.org/10.1029/2008JD009823, 2008b.
Nault, B. A., Campuzano-Jost, P., Day, D. A., Schroder, J. C., Anderson, B., Beyersdorf, A. J., Blake, D. R., Brune, W. H., Choi, Y., Corr, C. A., de Gouw, J. A., Dibb, J., DiGangi, J. P., Diskin, G. S., Fried, A., Huey, L. G., Kim, M. J., Knote, C. J., Lamb, K. D., Lee, T., Park, T., Pusede, S. E., Scheuer, E., Thornhill, K. L., Woo, J.-H., and Jimenez, J. L.: Secondary organic aerosol production from local emissions dominates the organic aerosol budget over Seoul, South Korea, during KORUS-AQ, Atmos. Chem. Phys., 18, 17769–17800, https://doi.org/10.5194/acp-18-17769-2018, 2018.
Nenes, A., Pandis, S. N., and Pilinis, C.: ISORROPIA: A new thermodynamic equilibrium model for multiphase multicomponent inorganic aerosols, Aquat. Geochem., 4, 123–152, https://doi.org/10.1023/A:1009604003981, 1998.
Ng, N. L., Canagaratna, M. R., Jimenez, J. L., Zhang, Q., Ulbrich, I. M., and Worsnop, D. R.: Real-time methods for estimating organic component mass concentrations from aerosol mass spectrometer data, Environ. Sci. Technol., 45, 910–916, https://doi.org/10.1021/es102951k, 2010.
Padró, L. T., Moore, R. H., Zhang, X., Rastogi, N., Weber, R. J., and Nenes, A.: Mixing state and compositional effects on CCN activity and droplet growth kinetics of size-resolved CCN in an urban environment, Atmos. Chem. Phys., 12, 10239–10255, https://doi.org/10.5194/acp-12-10239-2012, 2012.
Pan, Y., Tian, S., Liu, D., Fang, Y., Zhu, X., Zhang, Q., Zheng, B., Michalski, G., and Wang, Y.: Fossil fuel combustion-related emissions dominate atmospheric ammonia sources during severe haze episodes: Evidence from 15N-stable isotope in size-resolved aerosol ammonium, Environ. Sci. Technol., 50, 8049–8056, https://doi.org/10.1021/acs.est.6b00634, 2016.
Petters, M. D. and Kreidenweis, S. M.: A single parameter representation of hygroscopic growth and cloud condensation nucleus activity, Atmos. Chem. Phys., 7, 1961–1971, https://doi.org/10.5194/acp-7-1961-2007, 2007.
Petters, M. D., Carrico, C. M., Kreidenweis, S. M., Prenni, A. J., DeMott, P. J., Collett Jr., J. L., and Moosmüller, H.: Cloud condensation nucleation activity of biomass burning aerosol, J. Geophys. Res.-Atmos., 114, D22205, https://doi.org/10.1029/2009JD012353, 2009.
Pöschl, U., Rose, D., and Andreae, M. O.: Climatologies of Cloud-Related Aerosols – Part 2: Particle Hygroscopicity and Cloud Condensation Nucleus Activity, in: Clouds in the Perturbed Climate System: Their Relationship to Energy Balance, Atmospheric Dynamics, and Precipitation, 58–72, MIT Press, Cambridge, 2009.
Pringle, K. J., Tost, H., Pozzer, A., Pöschl, U., and Lelieveld, J.: Global distribution of the effective aerosol hygroscopicity parameter for CCN activation, Atmos. Chem. Phys., 10, 5241–5255, https://doi.org/10.5194/acp-10-5241-2010, 2010.
Psichoudaki, M., Nenes, A., Florou, K., Kaltsonoudis, C., and Pandis, S. N.: Hygroscopic properties of atmospheric particles emitted during wintertime biomass burning episodes in Athens, Atmos. Environ., 178, 66–72, https://doi.org/10.1016/j.atmosenv.2018.01.004, 2018.
Rajput, P., Mandaria, A., Kachawa, L., Singh, D. K., Singh, A. K., and Gupta, T.: Wintertime source-apportionment of PM1 from Kanpur in the Indo-Gangetic plain, Climatic Change, 1, 503–507, 2015.
Ram, K., Tripathi, S. N., Sarin, M. M., and Bhattu, D.: Primary and secondary aerosols from an urban site (Kanpur) in the Indo-Gangetic Plain: impact on CCN, CN concentrations and optical properties, Atmos. Environ., 89, 655–663, https://doi.org/10.1016/j.atmosenv.2014.02.009, 2014.
Reddy, M. S. and Venkataraman, C.: Inventory of aerosol and sulphur dioxide emissions from India: I – Fossil fuel combustion, Atmos. Environ., 36, 677–697, https://doi.org/10.1016/S1352-2310(01)00463-0, 2002.
Rissler, J., Swietlicki, E., Zhou, J., Roberts, G., Andreae, M. O., Gatti, L. V., and Artaxo, P.: Physical properties of the sub-micrometer aerosol over the Amazon rain forest during the wet-to-dry season transition – comparison of modeled and measured CCN concentrations, Atmos. Chem. Phys., 4, 2119–2143, https://doi.org/10.5194/acp-4-2119-2004, 2004.
Rose, D., Nowak, A., Achtert, P., Wiedensohler, A., Hu, M., Shao, M., Zhang, Y., Andreae, M. O., and Pöschl, U.: Cloud condensation nuclei in polluted air and biomass burning smoke near the mega-city Guangzhou, China – Part 1: Size-resolved measurements and implications for the modeling of aerosol particle hygroscopicity and CCN activity, Atmos. Chem. Phys., 10, 3365–3383, https://doi.org/10.5194/acp-10-3365-2010, 2010.
Rose, D., Gunthe, S. S., Su, H., Garland, R. M., Yang, H., Berghof, M., Cheng, Y. F., Wehner, B., Achtert, P., Nowak, A., Wiedensohler, A., Takegawa, N., Kondo, Y., Hu, M., Zhang, Y., Andreae, M. O., and Pöschl, U.: Cloud condensation nuclei in polluted air and biomass burning smoke near the mega-city Guangzhou, China – Part 2: Size-resolved aerosol chemical composition, diurnal cycles, and externally mixed weakly CCN-active soot particles, Atmos. Chem. Phys., 11, 2817–2836, https://doi.org/10.5194/acp-11-2817-2011, 2011.
Rosenfeld, D.: TRMM observed first direct evidence of smoke from forest fires inhibiting rainfall, Geophys. Res. Lett., 26, 3105–3108, https://doi.org/10.1029/1999GL006066, 1999.
Rosenfeld, D.: Suppression of rain and snow by urban and industrial air pollution, Science, 287, 1793–1796, https://doi.org/10.1126/science.287.5459.1793, 2000.
Rosenfeld, D., Lahav, R., Khain, A., and Pinsky, M.: The role of sea spray in cleansing air pollution over ocean via cloud processes, Science, 297, 1667–1670, https://doi.org/10.1126/science.1073869, 2002.
Rosenfeld, D., Lohmann, U., Raga, G. B., O'Dowd, C. D., Kulmala, M., Fuzzi, S., Reissell, A., and Andreae, M. O.: Flood or drought: how do aerosols affect precipitation?, Science, 321, 1309–1313, https://doi.org/10.1126/science.1160606, 2008.
Roy, A., Chatterjee, A., Sarkar, C., Das, S. K., Ghosh, S. K., and Raha, S.: A study on aerosol-cloud condensation nuclei (CCN) activation over eastern Himalaya in India, Atmos. Res., 189, 69–81, https://doi.org/10.1016/j.atmosres.2017.01.015, 2017.
Rudich, Y., Khersonsky, O., and Rosenfeld, D.: Treating clouds with a grain of salt, Geophys. Res. Lett., 29, 2060, https://doi.org/10.1029/2002GL016055, 2002.
Sandradewi, J., Prévôt, A. S. H., Szidat, S., Perron, N., Alfarra, M. R., Lanz, V. A., Weingartner, E., and Baltensperger, U.: Using Aerosol Light Absorption Measurements for the Quantitative Determination of Wood Burning and Traffic Emission Contributions to Particulate Matter, Environ. Sci. Technol., 42, 3316–3323, https://doi.org/10.1021/es702253m, 2008.
Seinfeld, J. H.: Atmospheric Chemistry and Physics of Air Pollution, Environ. Sci. Technol., 20, 863–863, https://doi.org/10.1021/es00151a602, 1986.
Sharma, S. K., Kumar, M., Gupta, N. C., Saxena, M., and Mandal, T. K.: Characteristics of ambient ammonia over Delhi, India, Meteorol. Atmos. Phys., 124, 67–82, https://doi.org/10.1007/s00703-013-0299-8, 2014.
Squires, P.: The microstructure and colloidal stability of warm clouds: Part II – The causes of the variations in microstructure, Tellus, 10, 262–271, https://doi.org/10.1111/j.2153-3490.1958.tb02012.x, 1958.
Stelson, A. W. and Seinfeld, J. H.: Relative humidity and pH dependence of the vapor pressure of ammonium nitrate-nitric acid solutions at 25 ∘C, Atmos. Environ., 16, 993–1000, https://doi.org/10.1016/0004-6981(82)90185-8, 1982.
Sullivan, R. C., Moore, M. J. K., Petters, M. D., Kreidenweis, S. M., Roberts, G. C., and Prather, K. A.: Effect of chemical mixing state on the hygroscopicity and cloud nucleation properties of calcium mineral dust particles, Atmos. Chem. Phys., 9, 3303–3316, https://doi.org/10.5194/acp-9-3303-2009, 2009.
Tao, W. K., Chen, J. P., Li, Z., Wang, C., and Zhang, C.: Impact of aerosols on convective clouds and precipitation, Rev. Geophys., 50, RG2001, https://doi.org/10.1029/2011RG000369, 2012.
Tiwari, S., Dahiya, A., and Kumar, N.: Investigation into relationships among NO, NO2, NOx, O3, and CO at an urban background site in Delhi, India, Atmos. Res., 157, 119–126, https://doi.org/10.1016/j.atmosres.2015.01.008, 2015.
Turšič, J., Podkrajšek, B., Grgić, I., Ctyroky, P., Berner, A., Dusek, U., and Hitzenberger, R.: Chemical composition and hygroscopic properties of size-segregated aerosol particles collected at the Adriatic coast of Slovenia, Chemosphere, 63, 1193–1202, https://doi.org/10.1016/j.chemosphere.2005.08.040, 2006.
Wang, J., Cubison, M. J., Aiken, A. C., Jimenez, J. L., and Collins, D. R.: The importance of aerosol mixing state and size-resolved composition on CCN concentration and the variation of the importance with atmospheric aging of aerosols, Atmos. Chem. Phys., 10, 7267–7283, https://doi.org/10.5194/acp-10-7267-2010, 2010.
Wang, J. and Martin, S. T.: Satellite characterization of urban aerosols: Importance of including hygroscopicity and mixing state in the retrieval algorithms, J. Geophys. Res.-Atmos., 112, D17203, https://doi.org/10.1029/2006JD008078, 2007.
Wang, S., Nan, J., Shi, C., Fu, Q., Gao, S., Wang, D., Cui, H., Saiz-Lopez, A., and Zhou, B.: Atmospheric ammonia and its impacts on regional air quality over the megacity of Shanghai, China, Sci. Rep.-UK, 5, 15842, https://doi.org/10.1038/srep15842, 2015.
Wang, Y. and Chen, Y.: Significant Climate Impact of Highly Hygroscopic Atmospheric Aerosols in Delhi, India, Geophys. Res. Lett., 46, 5535–5545, https://doi.org/10.1029/2019GL082339, 2019.
Wu, Z. J., Poulain, L., Henning, S., Dieckmann, K., Birmili, W., Merkel, M., van Pinxteren, D., Spindler, G., Müller, K., Stratmann, F., Herrmann, H., and Wiedensohler, A.: Relating particle hygroscopicity and CCN activity to chemical composition during the HCCT-2010 field campaign, Atmos. Chem. Phys., 13, 7983–7996, https://doi.org/10.5194/acp-13-7983-2013, 2013.
Zhang, Q., Jimenez, J. L., Worsnop, D. R., and Canagaratna, M.: A case study of urban particle acidity and its influence on secondary organic aerosol, Environ. Sci. Technol., 41, 3213–3219, https://doi.org/10.1021/es061812j, 2007.